

Page 1

Gel Doc™ EZ Imaging
System with Image Lab
Software
Version 5.1
™
Page 2

Notice
No part of this publication may be reproduced or transmitted in any form or by
any means, electronic or mechanical, including photocopy, recording, or any
information storage or retrieval system, without permission in writing from
Bio-Rad.
Bio-Rad reserves the right to modify its products and services at any time. This
user guide is subject to change without notice. Although prepared to ensure
accuracy, Bio-Rad assumes no liability for errors or omissions, or for any
damage resulting from the application or use of this information.
Precision Plus Protein standards are sold under license from Life Technologies
Corporation, Carlsbad, CA, for use only by the buyer of the product. The buyer
is not authorized to sell or resell this product or its components.
Coomassie is a trademark of BASF Aktiengesellschaft. Coomassie Fluor is a
trademark of Invitrogen Corp. Excel, PowerPoint, and Windows are trademarks
of Microsoft Corporation. GelGreen and GelRed are trademarks of Biotium,
Inc. Krypton is a trademark of Thermo Fisher Scientific Inc. Mac, Mac OS, and
Numbers are trademarks of Apple Inc. SYPRO is a trademark of Invitrogen
Corporation. Intel and Intel Core are trademarks of Intel Corporation.
Mitsubishi is a trademark of Mitsubishi Companies. PulseNet International is a
trademark of the Centers for Disease Control and Prevention.
SYBR is a trademark of Life Technologies, Inc. Bio-Rad Laboratories, Inc. is
licensed by Life Technologies, Inc. to sell reagents containing SYBR Green I for
use in real-time PCR, for research purposes only.
Criterion Stain Free gels are covered by U.S. Pat. No. 7,569,130. Bio-Rad
Laboratories, Inc. is licensed by Invitrogen Corporation to sell SYPRO products
for research use only under U.S. Patent Number 5,616,502.
Copyright © 2014 Bio-Rad Laboratories, Inc. All rights reserved.
Page 3

Table of Contents
Safety and Regulatory Compliance. . . . . . . . . . . . . . . . . . . . . . . . . . .9
Safety Use Specifications and Compliance . . . . . . . . . . . . . . . . . . . . . . . . . . . . . . 9
Instrument Safety Warnings . . . . . . . . . . . . . . . . . . . . . . . . . . . . . . . . . . . . . . . . . 10
Notice . . . . . . . . . . . . . . . . . . . . . . . . . . . . . . . . . . . . . . . . . . . . . . . . . . . . . . . . 11
Warranty . . . . . . . . . . . . . . . . . . . . . . . . . . . . . . . . . . . . . . . . . . . . . . . . . . . . . . 12
Chapter 1 System Overview . . . . . . . . . . . . . . . . . . . . . . . . . . . . . . . . .13
Gel Doc EZ Imaging System. . . . . . . . . . . . . . . . . . . . . . . . . . . . . . . . . . . . . . . . . 15
Technical Specifications . . . . . . . . . . . . . . . . . . . . . . . . . . . . . . . . . . . . . . . . . . . . 17
Image Lab Software Capabilities . . . . . . . . . . . . . . . . . . . . . . . . . . . . . . . . . . . . . 18
Gel Documentation . . . . . . . . . . . . . . . . . . . . . . . . . . . . . . . . . . . . . . . . . . . . . . 18
Molecular Weight Assessment . . . . . . . . . . . . . . . . . . . . . . . . . . . . . . . . . . . . . 18
Quantification . . . . . . . . . . . . . . . . . . . . . . . . . . . . . . . . . . . . . . . . . . . . . . . . . . 18
Chapter 2 Setting Up the Instrument with Image Lab Software . . . .19
System Requirements. . . . . . . . . . . . . . . . . . . . . . . . . . . . . . . . . . . . . . . . . . . . . . 19
Image Lab Security Edition . . . . . . . . . . . . . . . . . . . . . . . . . . . . . . . . . . . . . . . . 19
Computer Specifications. . . . . . . . . . . . . . . . . . . . . . . . . . . . . . . . . . . . . . . . . . 19
Installing Image Lab Software. . . . . . . . . . . . . . . . . . . . . . . . . . . . . . . . . . . . . . . . 20
Connecting the Imager to the Computer . . . . . . . . . . . . . . . . . . . . . . . . . . . . . . . 26
Installing the Drivers on a Windows XP Computer . . . . . . . . . . . . . . . . . . . . . . . . 27
Installing the Drivers on a Windows 7 Computer . . . . . . . . . . . . . . . . . . . . . . . . . 30
Configuring the Imager . . . . . . . . . . . . . . . . . . . . . . . . . . . . . . . . . . . . . . . . . . . . . 31
Initializing an Additional Tray . . . . . . . . . . . . . . . . . . . . . . . . . . . . . . . . . . . . . . . . 37
Setting Up Image Lab Security Edition. . . . . . . . . . . . . . . . . . . . . . . . . . . . . . . . . 38
Activating and Deactivating Security Edition . . . . . . . . . . . . . . . . . . . . . . . . . . 38
User Guide | iii
Page 4

Table of Contents
Enabling and Disabling Image Lab Secure Mode . . . . . . . . . . . . . . . . . . . . . . .45
Setting Security Preferences . . . . . . . . . . . . . . . . . . . . . . . . . . . . . . . . . . . . . . . 49
Renaming Security Groups . . . . . . . . . . . . . . . . . . . . . . . . . . . . . . . . . . . . . . . . 52
Using Groups on a Local Domain . . . . . . . . . . . . . . . . . . . . . . . . . . . . . . . . . . . 52
Changing Security Preferences. . . . . . . . . . . . . . . . . . . . . . . . . . . . . . . . . . . . . 53
Chapter 3 Image Lab Software Overview. . . . . . . . . . . . . . . . . . . . . . 55
Interface Overview . . . . . . . . . . . . . . . . . . . . . . . . . . . . . . . . . . . . . . . . . . . . . . . . 57
Main Window. . . . . . . . . . . . . . . . . . . . . . . . . . . . . . . . . . . . . . . . . . . . . . . . . . . 57
Main Toolbar . . . . . . . . . . . . . . . . . . . . . . . . . . . . . . . . . . . . . . . . . . . . . . . . . . . 58
Results Data . . . . . . . . . . . . . . . . . . . . . . . . . . . . . . . . . . . . . . . . . . . . . . . . . . .58
Display Toolbox. . . . . . . . . . . . . . . . . . . . . . . . . . . . . . . . . . . . . . . . . . . . . . . . . 58
Start Page . . . . . . . . . . . . . . . . . . . . . . . . . . . . . . . . . . . . . . . . . . . . . . . . . . . . . 59
Analysis Tool Box . . . . . . . . . . . . . . . . . . . . . . . . . . . . . . . . . . . . . . . . . . . . . . . 59
Status Bar . . . . . . . . . . . . . . . . . . . . . . . . . . . . . . . . . . . . . . . . . . . . . . . . . . . . . 61
Menu Commands . . . . . . . . . . . . . . . . . . . . . . . . . . . . . . . . . . . . . . . . . . . . . . . 62
Chapter 4 Acquiring Images . . . . . . . . . . . . . . . . . . . . . . . . . . . . . . . . 69
Selecting a Sample Tray . . . . . . . . . . . . . . . . . . . . . . . . . . . . . . . . . . . . . . . . . . . . 70
Setting Up a Default Protocol . . . . . . . . . . . . . . . . . . . . . . . . . . . . . . . . . . . . . . . . 71
Acquisition Settings. . . . . . . . . . . . . . . . . . . . . . . . . . . . . . . . . . . . . . . . . . . . . . 74
Analyze Image . . . . . . . . . . . . . . . . . . . . . . . . . . . . . . . . . . . . . . . . . . . . . . . . . .76
Regression Methods . . . . . . . . . . . . . . . . . . . . . . . . . . . . . . . . . . . . . . . . . . . . . 79
Output Settings . . . . . . . . . . . . . . . . . . . . . . . . . . . . . . . . . . . . . . . . . . . . . . . . . 80
Review Protocol Settings . . . . . . . . . . . . . . . . . . . . . . . . . . . . . . . . . . . . . . . . . . . 82
Running a Default Protocol . . . . . . . . . . . . . . . . . . . . . . . . . . . . . . . . . . . . . . . . . .82
Creating a Multichannel Image from Single Images . . . . . . . . . . . . . . . . . . . . . . . 83
Setting Up a Custom Protocol . . . . . . . . . . . . . . . . . . . . . . . . . . . . . . . . . . . . . . .84
Selecting a Custom Protocol. . . . . . . . . . . . . . . . . . . . . . . . . . . . . . . . . . . . . . . . . 86
Running a Custom Protocol . . . . . . . . . . . . . . . . . . . . . . . . . . . . . . . . . . . . . . . . . 86
Editing Protocols . . . . . . . . . . . . . . . . . . . . . . . . . . . . . . . . . . . . . . . . . . . . . . . . . . 87
iv | Gel Doc EZ Imaging System with Image Lab Software
Page 5

Table of Contents
Chapter 5 Viewing Images . . . . . . . . . . . . . . . . . . . . . . . . . . . . . . . . . . 89
Displaying Gel Images . . . . . . . . . . . . . . . . . . . . . . . . . . . . . . . . . . . . . . . . . . . . . 90
Display Gel Options . . . . . . . . . . . . . . . . . . . . . . . . . . . . . . . . . . . . . . . . . . . . . 90
Zoom Tools . . . . . . . . . . . . . . . . . . . . . . . . . . . . . . . . . . . . . . . . . . . . . . . . . . . . 91
Fit in Window . . . . . . . . . . . . . . . . . . . . . . . . . . . . . . . . . . . . . . . . . . . . . . . . . . 92
Image Transform . . . . . . . . . . . . . . . . . . . . . . . . . . . . . . . . . . . . . . . . . . . . . . . 92
Image Colors . . . . . . . . . . . . . . . . . . . . . . . . . . . . . . . . . . . . . . . . . . . . . . . . . .94
3-D Projection . . . . . . . . . . . . . . . . . . . . . . . . . . . . . . . . . . . . . . . . . . . . . . . . . . 95
Image Info . . . . . . . . . . . . . . . . . . . . . . . . . . . . . . . . . . . . . . . . . . . . . . . . . . . . . 96
Displaying Data . . . . . . . . . . . . . . . . . . . . . . . . . . . . . . . . . . . . . . . . . . . . . . . . . . . 96
Analysis Table Options . . . . . . . . . . . . . . . . . . . . . . . . . . . . . . . . . . . . . . . . . . . 97
Lane and Band Table Measurement Definitions . . . . . . . . . . . . . . . . . . . . . . . . 99
Volume Measurement Definitions . . . . . . . . . . . . . . . . . . . . . . . . . . . . . . . . . . 100
Lane Profile . . . . . . . . . . . . . . . . . . . . . . . . . . . . . . . . . . . . . . . . . . . . . . . . . . . 101
Standard Curve . . . . . . . . . . . . . . . . . . . . . . . . . . . . . . . . . . . . . . . . . . . . . . . 104
Report . . . . . . . . . . . . . . . . . . . . . . . . . . . . . . . . . . . . . . . . . . . . . . . . . . . . . . . 105
Chapter 6 Analyzing Images . . . . . . . . . . . . . . . . . . . . . . . . . . . . . . . 107
Using Auto Analysis. . . . . . . . . . . . . . . . . . . . . . . . . . . . . . . . . . . . . . . . . . . . . . . 107
Analysis Tool Box Tools . . . . . . . . . . . . . . . . . . . . . . . . . . . . . . . . . . . . . . . . . . . 109
Image Tools . . . . . . . . . . . . . . . . . . . . . . . . . . . . . . . . . . . . . . . . . . . . . . . . . . . . 110
Correcting a Slanted Gel . . . . . . . . . . . . . . . . . . . . . . . . . . . . . . . . . . . . . . . . . 111
Cropping a Gel Image . . . . . . . . . . . . . . . . . . . . . . . . . . . . . . . . . . . . . . . . . . . 111
Inverting Data . . . . . . . . . . . . . . . . . . . . . . . . . . . . . . . . . . . . . . . . . . . . . . . . .112
Merging Images. . . . . . . . . . . . . . . . . . . . . . . . . . . . . . . . . . . . . . . . . . . . . . . . 112
Lane and Bands Tools . . . . . . . . . . . . . . . . . . . . . . . . . . . . . . . . . . . . . . . . . . . . 113
Detecting Lanes. . . . . . . . . . . . . . . . . . . . . . . . . . . . . . . . . . . . . . . . . . . . . . . . 114
Using the All Lanes and Single Lane Tools . . . . . . . . . . . . . . . . . . . . . . . . . . . 114
Copying Lanes. . . . . . . . . . . . . . . . . . . . . . . . . . . . . . . . . . . . . . . . . . . . . . . . . 117
Detecting Bands . . . . . . . . . . . . . . . . . . . . . . . . . . . . . . . . . . . . . . . . . . . . . . . 118
Editing the Detected Bands. . . . . . . . . . . . . . . . . . . . . . . . . . . . . . . . . . . . . . . 121
Molecular Weight (MW) Analysis Tools . . . . . . . . . . . . . . . . . . . . . . . . . . . . . . . 123
Quantity Tools . . . . . . . . . . . . . . . . . . . . . . . . . . . . . . . . . . . . . . . . . . . . . . . . . .127
Annotation Tools . . . . . . . . . . . . . . . . . . . . . . . . . . . . . . . . . . . . . . . . . . . . . . . .133
Add Annotations . . . . . . . . . . . . . . . . . . . . . . . . . . . . . . . . . . . . . . . . . . . . . . . 134
User Guide | v
Page 6

Table of Contents
Alignment. . . . . . . . . . . . . . . . . . . . . . . . . . . . . . . . . . . . . . . . . . . . . . . . . . . . . 134
Text Properties . . . . . . . . . . . . . . . . . . . . . . . . . . . . . . . . . . . . . . . . . . . . . . . . 135
Color . . . . . . . . . . . . . . . . . . . . . . . . . . . . . . . . . . . . . . . . . . . . . . . . . . . . . . . . 135
Rotate . . . . . . . . . . . . . . . . . . . . . . . . . . . . . . . . . . . . . . . . . . . . . . . . . . . . . . . 135
Volume Tools . . . . . . . . . . . . . . . . . . . . . . . . . . . . . . . . . . . . . . . . . . . . . . . . . . . 136
Chapter 7 Generating Reports. . . . . . . . . . . . . . . . . . . . . . . . . . . . . . 143
Report . . . . . . . . . . . . . . . . . . . . . . . . . . . . . . . . . . . . . . . . . . . . . . . . . . . . . . . . . 143
Report Settings . . . . . . . . . . . . . . . . . . . . . . . . . . . . . . . . . . . . . . . . . . . . . . . . 144
Print Report . . . . . . . . . . . . . . . . . . . . . . . . . . . . . . . . . . . . . . . . . . . . . . . . . .147
Print Report to a PDF File . . . . . . . . . . . . . . . . . . . . . . . . . . . . . . . . . . . . . . . . 147
Adjust the Printer Settings . . . . . . . . . . . . . . . . . . . . . . . . . . . . . . . . . . . . . . . 148
Chapter 8 Exporting Results . . . . . . . . . . . . . . . . . . . . . . . . . . . . . . . 149
Exporting Gel Images . . . . . . . . . . . . . . . . . . . . . . . . . . . . . . . . . . . . . . . . . . . . . 149
Exporting Gel Images for Publication . . . . . . . . . . . . . . . . . . . . . . . . . . . . . . . 150
Exporting Gel Images for Analysis. . . . . . . . . . . . . . . . . . . . . . . . . . . . . . . . . . 152
Exporting Gel Images to PulseNet International . . . . . . . . . . . . . . . . . . . . . . . 152
Exporting Lane and Band Tables to Excel . . . . . . . . . . . . . . . . . . . . . . . . . . . 153
Exporting Volume Tables to File . . . . . . . . . . . . . . . . . . . . . . . . . . . . . . . . . . . 153
Screenshot Tool Export. . . . . . . . . . . . . . . . . . . . . . . . . . . . . . . . . . . . . . . . . . 153
Analysis Table Export . . . . . . . . . . . . . . . . . . . . . . . . . . . . . . . . . . . . . . . . . . . 153
Chapter 9 Image Lab Logs. . . . . . . . . . . . . . . . . . . . . . . . . . . . . . . . . 155
Image Lab Logs. . . . . . . . . . . . . . . . . . . . . . . . . . . . . . . . . . . . . . . . . . . . . . . . . . 155
Viewing the Instrument Log. . . . . . . . . . . . . . . . . . . . . . . . . . . . . . . . . . . . . . . 156
Viewing the System Log . . . . . . . . . . . . . . . . . . . . . . . . . . . . . . . . . . . . . . . . . 157
Viewing the Document Log . . . . . . . . . . . . . . . . . . . . . . . . . . . . . . . . . . . . . . .158
Displaying Log Data . . . . . . . . . . . . . . . . . . . . . . . . . . . . . . . . . . . . . . . . . . . . 159
Displaying Data Columns in Logs . . . . . . . . . . . . . . . . . . . . . . . . . . . . . . . . . . 159
Filtering Data in Logs . . . . . . . . . . . . . . . . . . . . . . . . . . . . . . . . . . . . . . . . . . . 160
Collapsing or Expanding Data Rows . . . . . . . . . . . . . . . . . . . . . . . . . . . . . . . 162
Exporting Logs . . . . . . . . . . . . . . . . . . . . . . . . . . . . . . . . . . . . . . . . . . . . . . . .163
Printing Logs . . . . . . . . . . . . . . . . . . . . . . . . . . . . . . . . . . . . . . . . . . . . . . . . . 164
vi | Gel Doc EZ Imaging System with Image Lab Software
Page 7

Table of Contents
Chapter 10 Using the Security Edition . . . . . . . . . . . . . . . . . . . . . . . 167
21 CFR Part 11 . . . . . . . . . . . . . . . . . . . . . . . . . . . . . . . . . . . . . . . . . . . . . . . . . . 167
Standard Mode versus Secure Mode . . . . . . . . . . . . . . . . . . . . . . . . . . . . . . . . . 168
User Names, Groups, and Roles. . . . . . . . . . . . . . . . . . . . . . . . . . . . . . . . . . . . . 168
Role Restrictions . . . . . . . . . . . . . . . . . . . . . . . . . . . . . . . . . . . . . . . . . . . . . . . 170
Starting Image Lab Security Edition . . . . . . . . . . . . . . . . . . . . . . . . . . . . . . . . . . 171
Electronic Records . . . . . . . . . . . . . . . . . . . . . . . . . . . . . . . . . . . . . . . . . . . . . . . 171
Unsecured Documents . . . . . . . . . . . . . . . . . . . . . . . . . . . . . . . . . . . . . . . . . . 172
Secure Documents . . . . . . . . . . . . . . . . . . . . . . . . . . . . . . . . . . . . . . . . . . . . . 172
Modifying Secure Documents . . . . . . . . . . . . . . . . . . . . . . . . . . . . . . . . . . . . . 173
Signing Documents . . . . . . . . . . . . . . . . . . . . . . . . . . . . . . . . . . . . . . . . . . . . . . . 174
Document Logs . . . . . . . . . . . . . . . . . . . . . . . . . . . . . . . . . . . . . . . . . . . . . . . . . . 175
Viewing the Document Log . . . . . . . . . . . . . . . . . . . . . . . . . . . . . . . . . . . . . . .176
Appendix A Maintenance and Specifications . . . . . . . . . . . . . . . 177
Cleaning the Sample Trays . . . . . . . . . . . . . . . . . . . . . . . . . . . . . . . . . . . . . . . . . 177
UV-B Fluorescent Lamp Replacement . . . . . . . . . . . . . . . . . . . . . . . . . . . . . . . . 177
Error Messages . . . . . . . . . . . . . . . . . . . . . . . . . . . . . . . . . . . . . . . . . . . . . . . . . .179
Appendix B Troubleshooting . . . . . . . . . . . . . . . . . . . . . . . . . . . . . 181
Appendix C Setting Up Users and Groups . . . . . . . . . . . . . . . . . . 183
Setting Up Image Lab Users and Groups . . . . . . . . . . . . . . . . . . . . . . . . . . . . . . 183
User Accounts . . . . . . . . . . . . . . . . . . . . . . . . . . . . . . . . . . . . . . . . . . . . . . . . . 183
User Authentication and Group Membership . . . . . . . . . . . . . . . . . . . . . . . . . 183
Finding the name of your authentication domain . . . . . . . . . . . . . . . . . . . . . . 185
Configuring Users and Groups on a Local Computer. . . . . . . . . . . . . . . . . . . 186
Configuring Users and Groups on a Network Domain . . . . . . . . . . . . . . . . . . 190
Password Security. . . . . . . . . . . . . . . . . . . . . . . . . . . . . . . . . . . . . . . . . . . . . . . . 194
Password Policy Setting Examples. . . . . . . . . . . . . . . . . . . . . . . . . . . . . . . . . 196
Account Lockout Policy Setting Examples . . . . . . . . . . . . . . . . . . . . . . . . . . . 196
Auditing Windows Event Logs. . . . . . . . . . . . . . . . . . . . . . . . . . . . . . . . . . . . . . . 196
Miscellaneous Security Measures. . . . . . . . . . . . . . . . . . . . . . . . . . . . . . . . . . . . 197
User Guide | vii
Page 8

Table of Contents
Appendix D Using Bio-Rad’s Stain-Free Technology . . . . . . . . . 199
Stain-Free Workflow . . . . . . . . . . . . . . . . . . . . . . . . . . . . . . . . . . . . . . . . . . . . 200
Electrophoresis with Stain-Free Gels . . . . . . . . . . . . . . . . . . . . . . . . . . . . . . . . . 201
Imaging Gels . . . . . . . . . . . . . . . . . . . . . . . . . . . . . . . . . . . . . . . . . . . . . . . . . . . . 201
Imaging Blots. . . . . . . . . . . . . . . . . . . . . . . . . . . . . . . . . . . . . . . . . . . . . . . . . . . . 202
Appendix E Regression Calculation Methods . . . . . . . . . . . . . . . 203
Appendix F Mitsubishi P93/P95 Thermal Printer . . . . . . . . . . . . . 205
Setting up a Thermal Printer on Windows. . . . . . . . . . . . . . . . . . . . . . . . . . . . . . 205
Setting up a Thermal Printer on a Mac . . . . . . . . . . . . . . . . . . . . . . . . . . . . . . . . 206
Glossary . . . . . . . . . . . . . . . . . . . . . . . . . . . . . . . . . . . . . . . . . . . . . . 207
viii | Gel Doc EZ Imaging System with Image Lab Software
Page 9

Safety and Regulatory Compliance
The Gel Doc™ EZ imaging system is intended for laboratory use only. To help you
make informed decisions about safety, we have provided comprehensive operating
procedures and safety information in this manual and on labels affixed to the imager.
This information will alert you to any potential hazards. It is the user’s responsibility
to read and understand the safety information and use it for safe operation of the
system.
Safety Use Specifications and Compliance
The Gel Doc EZ imager is designed and certified to meet EN61010, the
internationally accepted electrical safety standard, and EN61326 Class A EMC
regulations. Certified products are safe to use when operated in accordance with
the instruction manual.
This instrument should not be modified or altered in any way. Modification or
alteration of this instrument will:
Void the manufacturer’s warranty
Void the regulatory certifications
User Guide | 9
Page 10

Safety and Regulatory Compliance
Create a potential safety hazard
Fig. 1. Gel Doc EZ imager certification label.
For easy customer access, the serial number appears in two locations on your
instrument: on the back panel and inside the front door.
Instrument Safety Warnings
Notes, cautions, and warnings are used to highlight certain operating procedures
and recommendations. The table below describes how each is used in this
document.
Table 1. Notes, Cautions, and Warnings
Icon Meaning
Note: Note: A note indicates a special procedure, an exception to normal
operation or something else of specific interest to the reader. Notes are
preceded by the word Note.
Caution: A caution precedes an operational step that could damage the
instrument or destroy data unless the operator takes certain precautions.
Cautions located in the main text are preceded by the word Caution and are
accompanied by the Caution symbol in the left margin.
10 | Gel Doc EZ Imaging System with Image Lab Software
Page 11

Table 1. Notes, Cautions, and Warnings, continued
Icon Meaning
Caution: With the exception of cleaning or replacing light bulbs, refer all
servicing to qualified Bio-Rad personnel or their agents. If you experience
technical difficulties with the instrument, contact Bio-Rad to schedule
service. The instrument should not be modified or altered in any way.
Alteration voids the manufacturer’s warranty and might create a potential
safety hazard for the user.
Caution: If the case interlock is defeated, ther
radiation hazard due to UV-B light exposure. Exercise caution when
servicing the instrument.
Caution: Bio-Rad is not responsible for any injury or damage caused by the
use of this instrument for purposes other than that for which it is intended, or
by the modification of this instrument when not performed by qualified BioRad personnel or their agents.
Caution:
Disconnect the AC power cord before removing the instrument
cover.
Warning: A warning precedes an operating procedure that could cause
injury to the operator if not followed correctly. Warnings located in the main
text are preceded by the word Warning and are accompanied by the
Warning symbol in the left margin.
Warning: This instrument must be connected to an appr
outlet that is pr
operly grounded.
Instrument Safety Warnings
e is a possibility of UV
opriate AC voltage
-B
Notice
This system is meant for use by specialized personnel who know the health risks
associated with reagents normally used in electrophoresis. The UV light source is
computer controlled, and proper interlocks are implemented to avoid users’
accidental exposure to UV radiation. Bio-Rad Laboratories, Inc. is not responsible
for any injury or damage caused by use of this instrument for purposes other than
those for which it is intended, or for instrument modifications not performed by BioRad Laboratories, Inc. or an authorized agent.
User Guide | 1 1
Page 12

Safety and Regulatory Compliance
Warranty
Each Gel Doc EZ imager is protected by a comprehensive instrument warranty
agreement. Please read this manual thoroughly so that you fully understand the
coverage provided and are aware of your rights and responsibilities. One of the
responsibilities of system ownership is regular maintenance. Following the
maintenance instructions provided with this manual will help keep your system and
peripherals functioning optimally and will protect your investment. Bio-Rad offers a
range of comprehensive service agreements that can be tailored to meet your
specific needs. Bio-Rad Laboratories is dedicated to your total satisfaction and will
be pleased to answer any questions you might have.
12 | Gel Doc EZ Imaging System with Image Lab Software
Page 13
1 System Overview
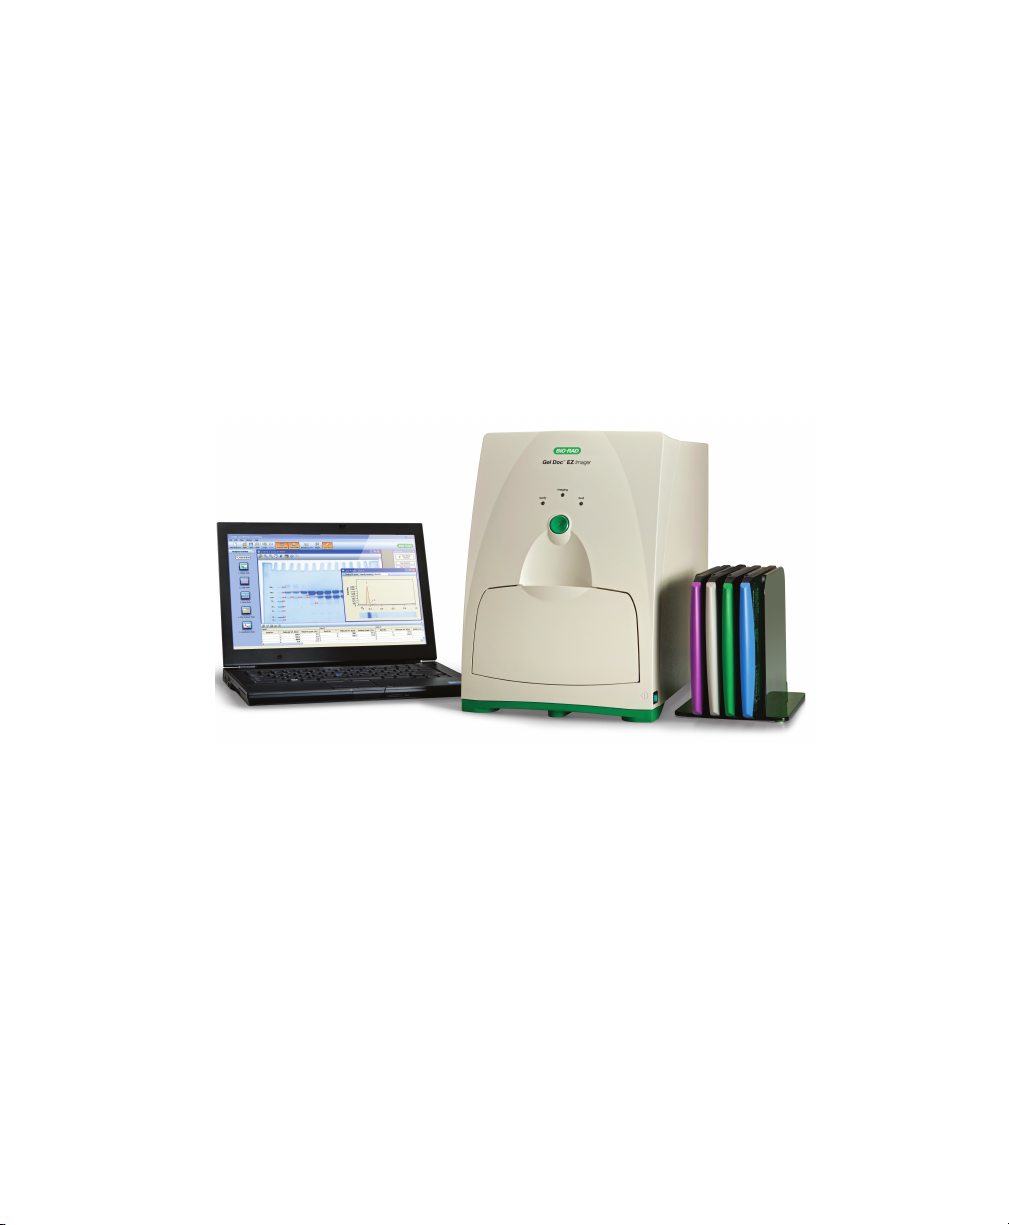
This manual describes the Gel Doc™ EZ imaging system, which consists of the Gel
Doc EZ imager and Image Lab™software.
The Gel Doc EZ imager supports multiple applications, including Coomassie and
ethidium bromide staining, blue excitation for nondestructive DNA visualization, and
stain-free gel imaging.
When coupled with the stain-free gel tray, the Gel Doc EZ imager represents the
next generation in stain-fr
results with higher image quality, and is so simple to use it requires no training, even
for users who are not familiar with image analysis systems. The Gel Doc EZ imager’s
compact size frees up benchspace for running your experiments.
ee imaging. It featur
es one-button acquisition, yields quick
User Guide | 1 3
Page 14

1 | System Overview
The Gel Doc EZ imager is a reproducible and fast label-free SDS-PAGE/native PAGE
system that eliminates time-consuming staining and destaining steps. Image Lab
image acquisition and analysis software works with the Gel Doc EZ imager to create
an automated and time-saving system to image and analyze electrophoresis gels.
Data can be viewed, modified, and reported using Image Lab software.
Image Lab protocols can automate gel image acquisition, analysis, and report
generation with the push of a single button on the imager
Researchers can run default protocols or easily design their own custom protocols.
Image Lab enables you to view analyzed data, adjust the analysis, and pr
customized reports that show precisely the settings that were applied, assuring
repeatable results.
.
oduce
14 | Gel Doc EZ Imaging System with Image Lab Software
Page 15
Gel Doc EZ Imaging System
The Gel Doc EZ imaging system is a dedicated low-noise detection camera and UV
transilluminator–based system with a small footprint. Designed for economy,
automation, and ease of use, the user interface consists of a set of four sample
trays and a one-touch button to image your gel using a protocol.
Gel Doc EZ Imaging System
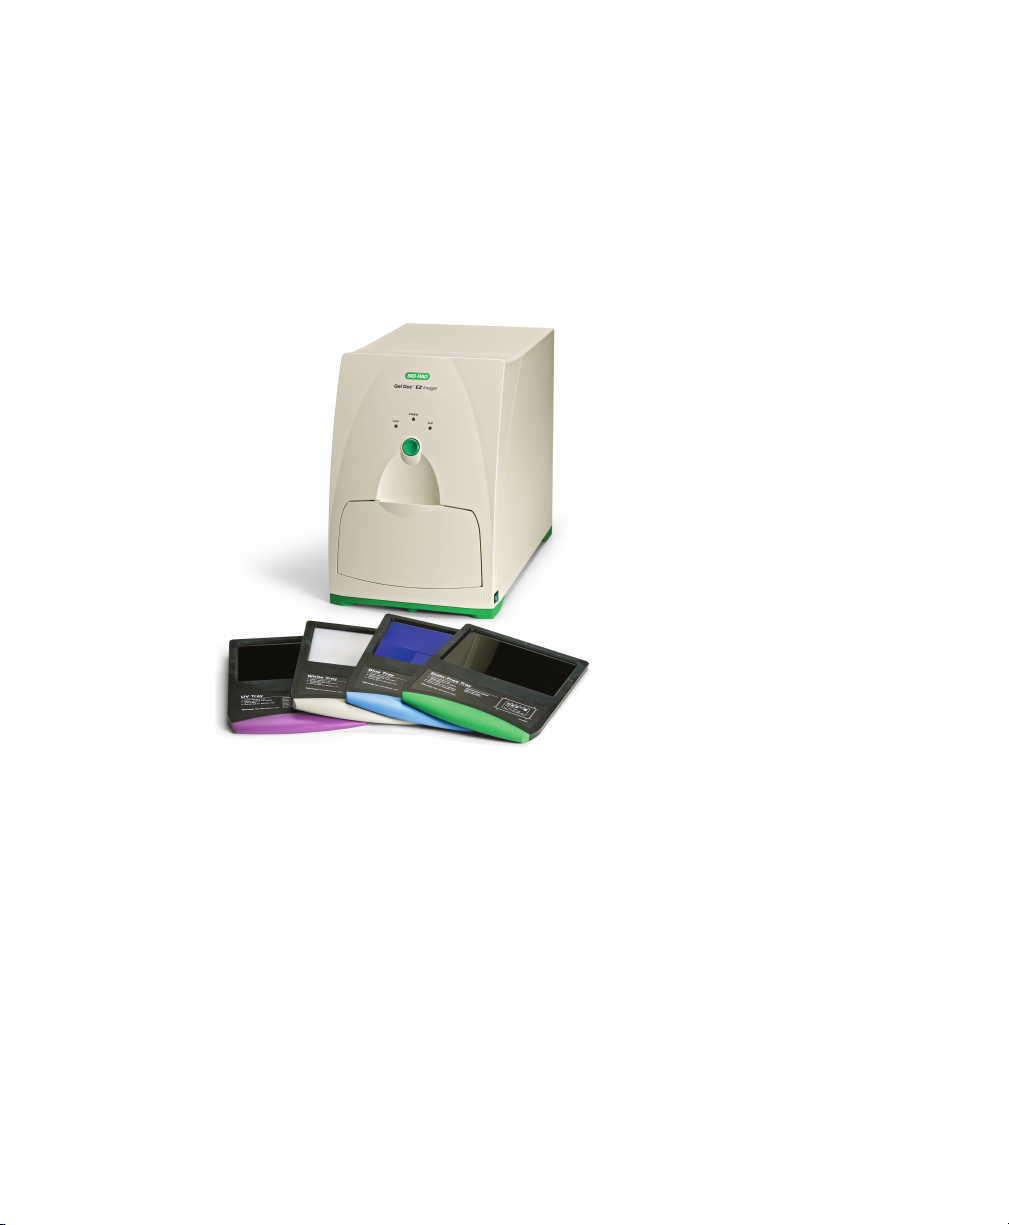
Fig. 2. Gel Doc EZ imager, catalog #170-8270.
Note: This catalog number is for the imager with the stain-free tray only. The
other trays must be purchased separately.
User Guide | 1 5
Page 16

1 | System Overview
Four sample trays are available for the Gel Doc EZ imager. Each tray supports
applications requiring a different set of stains and detection reagents, as shown in
Table 2.
Table 2. Sample Tray Types and Detection Reagents
UV Tray
Catalog #170-8271
Ethidium bromide Fast Blast™ DNA
SYBR® Green Coomassie Blue
SYBR® Safe Copper stain SYBR® Gold
SYBR® Gold Zinc stain GelGreen
GelGreen Silver stain
GelRed
Flamingo™
fluor
escent gel stain
Oriole™ fluor
gel stain
Coomassie Fluor
Orange
SYPRO Ruby
Krypton
escent
White Light Tray
Catalog
#170-8272
stain
stain
Blue Tray
Catalog
#170-8273
SYBR® Green Stain-free gels
SYBR® Safe Stain-free blots
Stain-Free Tray
Catalog
#170-8274
16 | Gel Doc EZ Imaging System with Image Lab Software
Page 17

Technical Specifications
Technical Specifications
Hardware Specifications
Image area 15 x 11.2 cm
Excitation source Trans UV B (302 nm peak)
Detector Charge-coupled device
Image pixel size 107.8 x 107.8 m (in micr
Dynamic range 3.0 or
Pixel density 4,096 gray levels
Flat fielding Yes
Instrument size 43 x 28 x 38 cm
Instrument weight 7.3 kg
Connector descriptions USB-A connector is used for communication with a PC
ders of magnitude
USB-B connector is used for the instrument interface
Operating Ranges
Operating voltage 110/115/230/240 VAC Nominal
Operating temperature 10–28
Operating humidity < 70% noncondensing
C (21C recommended)
Equipment Ratings
Input voltage range 100–240 VAC
Input frequency range 50–60 Hz
Power 40 W
The Gel Doc EZ imager is for indoor laboratory use only.
Automation Capabilities
Workflow automated
execution
Workflow reproducibility 100% repeatability via recallable protocols, from gel activation
Autoexposure 2 user-defined modes (intense or faint bands)
Controlled by a protocol via setup for gel activation, image
capture, analysis, and reporting
and image capture to quantitative analysis and r
ons)
eports
User Guide | 1 7
Page 18

1 | System Overview
Image Lab Software Capabilities
Image Lab software runs automated protocols on the Gel Doc EZ system for routine
gel imaging documentation and analysis.
Gel Documentation
Gel electrophoresis is a common way to separate, identify, and purify proteins or
nucleic acids. The Gel Doc EZ system enables you to image and print gel images for
documentation in laboratory notebooks or to export images for publication or
presentation.
Molecular Weight Assessment
Sodium dodecyl sulfate polyacrylamide gel electrophoresis (SDS-PAGE) and
agarose gel electrophoresis are used to separate proteins or nucleic acids
according to their size. Protein or nucleic acid molecular weight standards provide a
reference for estimating the molecular weight of the proteins or nucleic acids being
tested.
Quantification
The components in a sample (bands) are quantified to determine relative amounts of
each component in a sample or to compare the amount of a sample component
relative to a standard. Assessing the purity of a sample requires the quantification of
all components of a sample relative to each other. The results are expressed either
as a percentage of all bands identified (band%) or as a percentage of all signals in
the sample lane (lane%). Determining expression levels of a protein or nucleic acid
requires quantification among samples. Data can be reported as either relative
values, if the quantity is unknown, or as an absolute value, if a standard of known
quantity is present.
18 | Gel Doc EZ Imaging System with Image Lab Software
Page 19

2 Setting Up the Instrument
with Image Lab Software
System Requirements
Image Lab™ software runs on Microsoft Windows XP Professional, Microsoft
Windows 7, and Mac OS X. Images scanned at high resolution can be quite large.
The amount of memory r
the images you scan and analyze.
For this reason, we recommend that you archive images on a network file server or
on r
emovable storage media. Bio-Rad can also provide an appropriate computer to
use with this system. Contact your local Bio-Rad representative for more details.
Image Lab Security Edition
Note: The system requirements for Image Lab Security Edition are the same as
those for the Standard Edition. The software must be installed on a computer
running the Windows XP Professional or Windows 7 operating system to take
advantage of the secure mode features.
Computer Specifications
equired for using the program is determined by the size of
Specifications Minimum Recommended
Operating system Windows XP SP3
Windows 7, 32- and 64-bit
Mac OS X 10.6
Processor Pentium 4 or equivalent (Windows)
at 2.0 GHz
Windows XP SP3 Professional
Windows 7 Professional, 64-bit
Mac OS X 10.6
Intel Core 2 Duo 2.0 GHz or
higher
User Guide | 1 9
Page 20

2 | Setting Up the Instrument with Image Lab Software
Specifications Minimum Recommended
Hard disk space 20 GB >100 GB
Memory (RAM) 1,024 MB >1,024 MB
Ports for connecting
instrument
Other software
(optional)
1 free USB 2.0 port 1 free USB 2.0 port
Microsoft Excel 2003 or later
(Windows)
Office 2008 or iWork software
(Mac)
Microsoft Excel 2003 or later
(Windows)
Office 2008 or iWork software
(Mac)
Installing Image Lab Software
The process of installing Image Lab differs depending on your operating system.
This section explains how to install Image Lab software on a Windows PC and on a
Mac.
Note: During the Windows installation process, you are prompted to install
Image Lab Standar
mode, you must have Image Lab Administrator role privileges. Bio-Rad
recommends that you create the required groups and assign the Image Lab
roles to users within those groups before installing Image Lab software.
d Edition or Security Edition. In order to enable secure
See User Names, Groups, and Roles on page 168 for additional information about
the required Image Lab roles, groups, and users.
See Setting Up Users and Groups on page 183 for information about setting up
groups, user names, and passwords.
To install Image Lab on a Windows PC
1. Insert the Image Lab software CD in your CD-ROM drive.
20 | Gel Doc EZ Imaging System with Image Lab Software
Page 21

Installing Image Lab Software
The Image Lab installer automatically launches.
2. On the Welcome screen, click Next.
3. Accept the license agreement and click Next.
4. On the Edition Selection screen, choose the edition to install.
User Guide | 2 1
Page 22

2 | Setting Up the Instrument with Image Lab Software
Note the following.
If you are licensed to install the Security Edition but choose to install the
Standard Edition, you will need to uninstall the Standard Edition and install
the Security Edition before you can use it.
If you are licensed to install the Security Edition and choose to install it,
only a user assigned the Image Lab Administrator role (or group) privileges
can enable and disable secure mode.
Note: A user assigned the Image Lab Administrator role will not
necessarily also be the network or IT administrator
assigned the correct role within Image Lab to enable or disable secure
mode.
For more information, see Setting Up Image Lab Security Edition on
page 38.
If you are not licensed to install the Security Edition but choose to install it,
you will be prompted for a license key when you start Image Lab.
5. Click Next.
. You must be
22 | Gel Doc EZ Imaging System with Image Lab Software
Page 23
Installing Image Lab Software
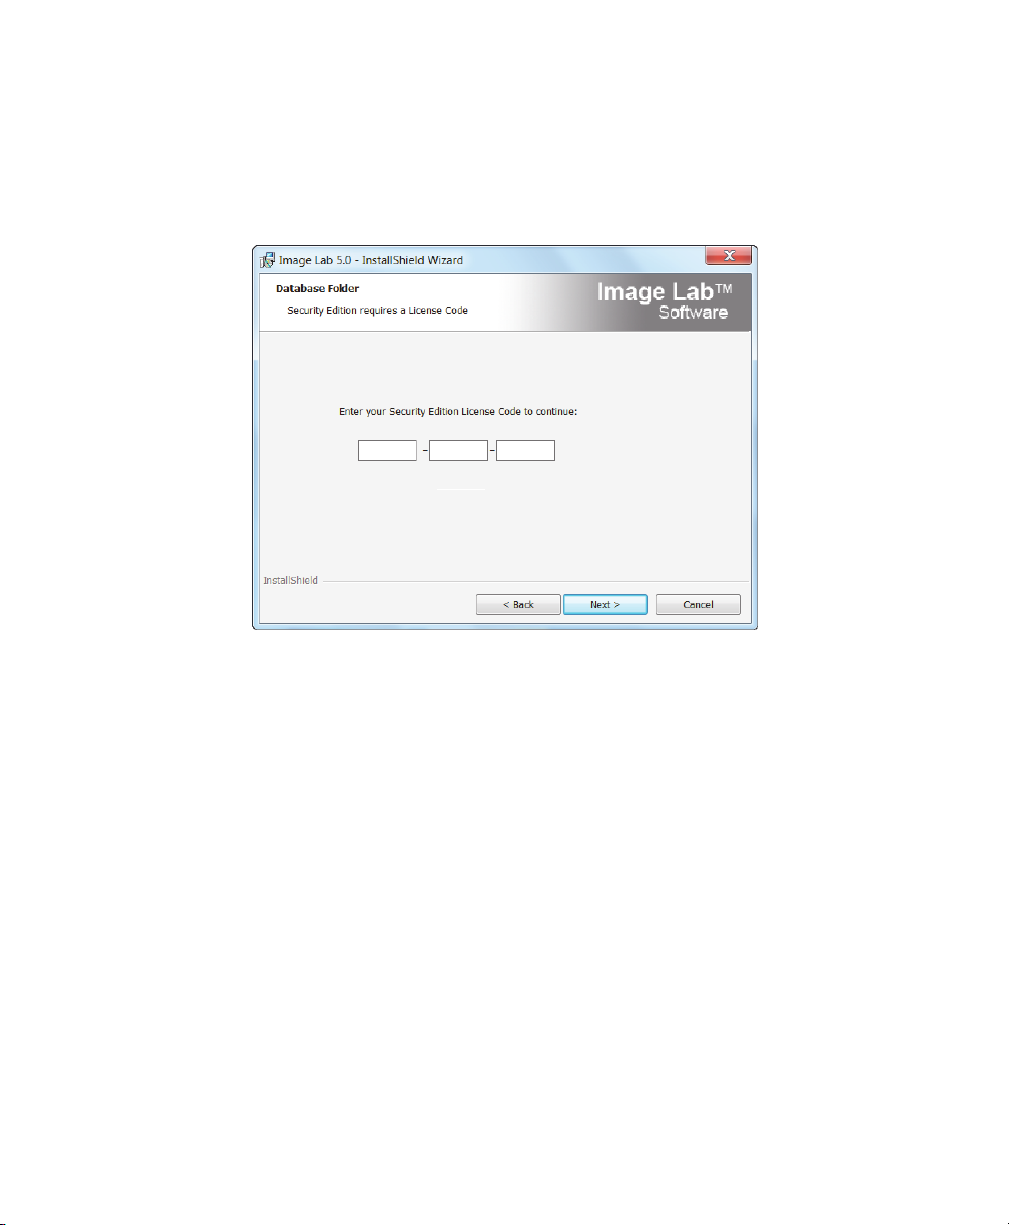
6. A screen appears requesting your license code.
Note: Your 18-digit license code can be found in the Image Lab product
folder pocket.
Enter the 18–digit code in the three text boxes. The software verifies the code.
Tip: If you do not know or do not have access to the code, contact your
Bio-Rad customer service repr
esentative.
Note: Until you provide a license code, Image Lab will function only in
standar
Click Next.
7.
8.
On the Install Location scr
d mode.
een, accept the default location or click Change and
browse to another folder.
9. Click Next.
User Guide | 2 3
Page 24

2 | Setting Up the Instrument with Image Lab Software
10. On the Ready to Install the Program screen, click Install.
The wizard installs Image Lab.
24 | Gel Doc EZ Imaging System with Image Lab Software
Page 25

Installing Image Lab Software
11. When the installation is complete, you are prompted to display the Release
Notes and/or the Windows Installer log.
The following screen shot is an example of the Windows Installer log.
12. Select or clear the checkboxes in the Install Wizard Completed dialog.
13. Click Finish to exit the wizard.
User Guide | 2 5
Page 26
2 | Setting Up the Instrument with Image Lab Software
The Image Lab icon appears on your desktop. Follow the instructions in the next
section to connect your system.
To install Image Lab on a Mac
1. Insert the Image Lab software CD in your CD-ROM drive.
2. Double-click the CD icon on your desktop to see the folder contents.
3. Double-click the file Image Lab.dmg.
4. Drag the Image Lab application icon into the Applications folder.
Follow the instructions in Connecting the Imager to the Computer to connect your
system.
Connecting the Imager to the Computer
1. Install or upgrade Image Lab before connecting the Gel Doc™ EZ imager to the
computer.
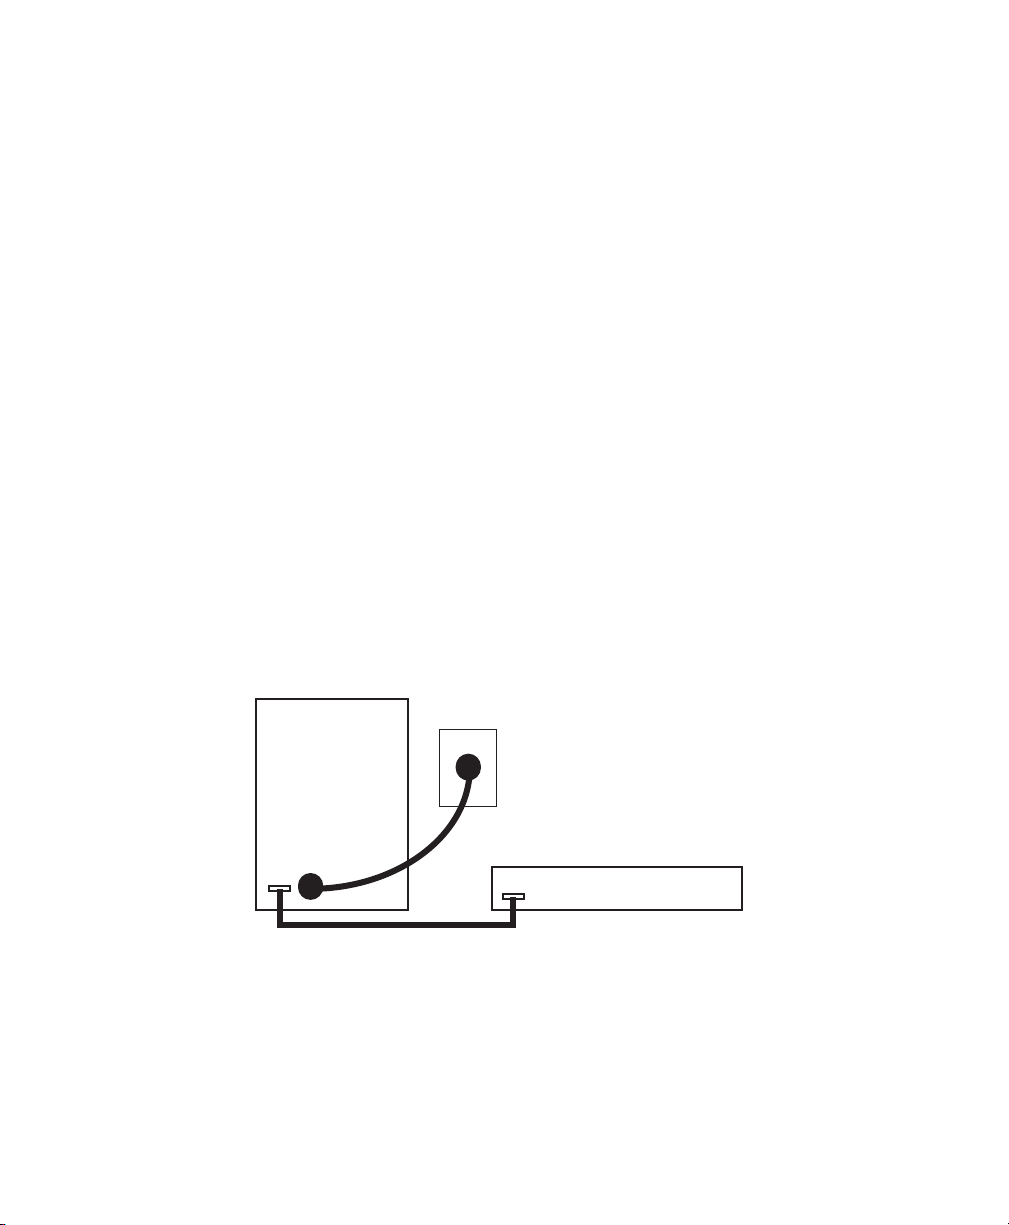
2. Connect the imager to the Image Lab computer using the USB cable provided
with the system.
3. Connect the Gel Doc EZ imager to AC power using the power cord provided.
AC
Rear of imager
Power
cord
USB cable
26 | Gel Doc EZ Imaging System with Image Lab Software
Computer
Page 27
Installing the Drivers on a Windows XP Computer
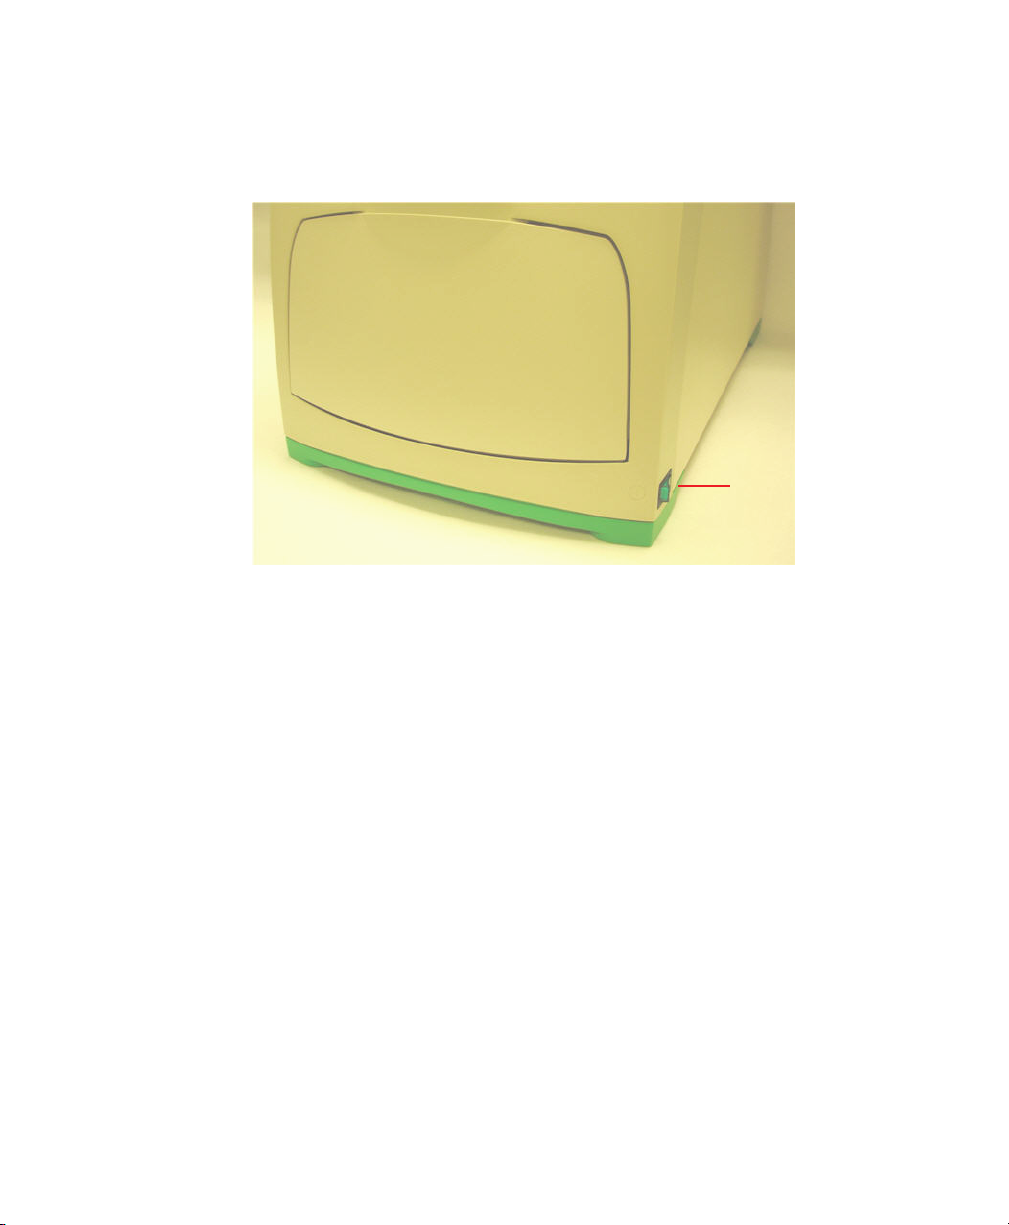
4. Press the power switch on the side of the imager to turn on power to the
instrument.
Power
switch
Installing the Drivers on a Windows XP Computer
After the instrument is connected and the power is turned on, the PC automatically
recognizes the instrument, and the hardware installation wizard starts, prompting
you to install the drivers.
User Guide | 2 7
Page 28

2 | Setting Up the Instrument with Image Lab Software
The initial Welcome dialog box appears.
Installing the drivers on a Windows XP computer
1. On the Welcome dialog box, click No, not this time, and then click Next.
The dialog box listing the driver that will be installed appears
2. By default, the radio button for Install the software automatically
(Recommended) is selected.
28 | Gel Doc EZ Imaging System with Image Lab Software
.
Page 29

Installing the Drivers on a Windows XP Computer
Keep the default selection and click Next.
The following warning dialog box appears.
3. Click Continue Anyway.
Windows installs the driver.
When the installation is complete, the following dialog box appears
.
4. Click Finish.
User Guide | 2 9
Page 30

2 | Setting Up the Instrument with Image Lab Software
A message appears briefly: Your new hardware is ready to use.
Note: Windows XP might prompt you to go through the driver installation a
second time. If this happens, repeat this section until you r
“Your new hardware is ready to use.”
eceive the message
Installing the Drivers on a Windows 7 Computer
If you are running Windows 7, the device driver is installed during the Image Lab
installation process. After successful installation, you see a message similar to the
following.
Note: During the installation process you might see a warning similar to the
following. You can ignore this warning because it appears even when the driver
has been installed correctly.
30 | Gel Doc EZ Imaging System with Image Lab Software
Page 31

Configuring the Imager
To use the imager with Image Lab software, the imager must first be configured.
Imager configuration consists of initializing the sample trays and collecting the dark
image.
The imager is configured in the setup wizard, which appears the first time the imager
is connected to a computer
To configure the imager
1. Turn on the imager and start Image Lab software. The setup wizard appears.
2. Complete the steps in the wizard.
Note: You must complete all the steps in the wizard or the imager will not be
usable.
The first page of the setup wizard
indicates that a new instrument has been
found on the system and displays the
instrument’s serial number.
Configuring the Imager
.
1. Click Next.
User Guide | 3 1
Page 32

2 | Setting Up the Instrument with Image Lab Software
The Dark Image Correction page
appears. Correcting the dark image
reduces dark current noise generated
from the charge-coupled device (CCD).
Dark current noise is typical of all CCDs
and is a result of the accumulation of
charge in the absence of light.
2. If a tray is in the imager, remove it
and close the tray door
.
3. Click Acquire Dark Image.
A progress indicator reports the
acquisition of the dark image.
When the dark image has been acquired,
the wizard prompts you to initialize the
UV tray. If you do not have a UV tray, click
Skip and go to Step 8.
4. Make sure the UV tray is clean. Then
insert the tray into the imager and close
the door
.
32 | Gel Doc EZ Imaging System with Image Lab Software
Page 33

5. Click Next to initialize the UV tray.
A progress indicator reports the
initialization of the tray.
When the tray has been initialized, the
next screen confirms that the tray has
been found and initialized.
6.
Remove the UV tray from the imager.
7. Click Next.
The wizard prompts you to initialize the
white tray. If you do not have a white tray,
click Next and go to Step 12.
8. Make sure the white tray is clean.
Then insert the tray into the imager and
close the door.
Configuring the Imager
9.
Click Next to initialize the white tray.
A progress indicator reports the
initialization of the tray.
User Guide | 3 3
Page 34

2 | Setting Up the Instrument with Image Lab Software
When the tray has been initialized, the
next dialog box confirms this and lists the
applications you can run with the tray.
10. Remove the white tray from the
imager.
11.
Click Next.
The wizard prompts you to initialize the
blue tray. If you do not have a blue tray,
click Skip and go to Step 16.
12. Make sure the blue tray is clean.
Then insert the tray into the imager and
close the door.
34 | Gel Doc EZ Imaging System with Image Lab Software
Page 35

13. Click Next to initialize the blue tray.
A progress indicator reports the
initialization of the tray.
When the tray has been initialized, the
next screen confirms that the tray has
been initialized.
14.
Remove the blue tray from the
imager.
15.
Click Next.
The wizard prompts you to initialize the
stain-free tray. If you do not have a
stain-free tray, click Skip and go to Step
19.
16. Make sure the stain-free tray is clean.
Then insert the tray into the imager and
close the door.
Configuring the Imager
17.
Click Next to initialize the stain-free
tray.
A pr
ogress indicator reports the
initialization of the tray.
User Guide | 3 5
Page 36

2 | Setting Up the Instrument with Image Lab Software
When the tray has been initialized, the
next page confirms this and lists the
applications you can run with the tray.
18. Click Next.
A tray summary page lists all the trays
and their status. Trays you initialized
appear as ready to use.
19. Click Finish to exit the wizard.
See Chapter 4, Acquiring Images, to configure the default protocols that run when
you press the green button on the imager.
36 | Gel Doc EZ Imaging System with Image Lab Software
Page 37

Initializing an Additional Tray
After you configure the imager, you can add another tray to the system when you
need it.
To initialize an additional tray
1. Insert a new type of tray in the imager. The New Tray Found wizard opens.
2. Complete the steps in the wizard.
The wizard identifies the new tray and
asks whether you want to initialize it.
1. Click Next.
The wizard begins initializing the tray.
A progress indicator reports the
initialization of the tray.
Initializing an Additional Tray
User Guide | 3 7
Page 38

2 | Setting Up the Instrument with Image Lab Software
When the tray has been initialized, the
wizard displays a list of the
applications you can run using the tray.
2. Click Next.
The wizard displays the Tray Summary,
which shows the highlighted, initialized
new trays.
3. Do one of the following:
Click Finish to leave the wizard and
display the Default Protocol Setup
window, where you can start
creating a default protocol for the
new tray.
Clear the checkbox at the bottom of
the wizard page to skip setting up a
default protocol. Then click Finish to
leave the wizard.
Setting Up Image Lab Security Edition
Activating and Deactivating Security Edition
Before you activate or deactivate Image Lab Security Edition, close any
open document files.
After you change the active status of the Security Edition, you must restart
Image Lab.
38 | Gel Doc EZ Imaging System with Image Lab Software
Page 39

Setting Up Image Lab Security Edition
To activate the Security Edition via the Internet
1. Double-click the Image Lab icon on your desktop to open Image Lab.
The License Code field is populated with the 18-digit license code that you
enter
ed when you installed Image Lab.
The Security Edition Activation dialog box appears.
2. Select Activate Via Internet.
3. Click Activate.
User Guide | 3 9
Page 40
2 | Setting Up the Instrument with Image Lab Software
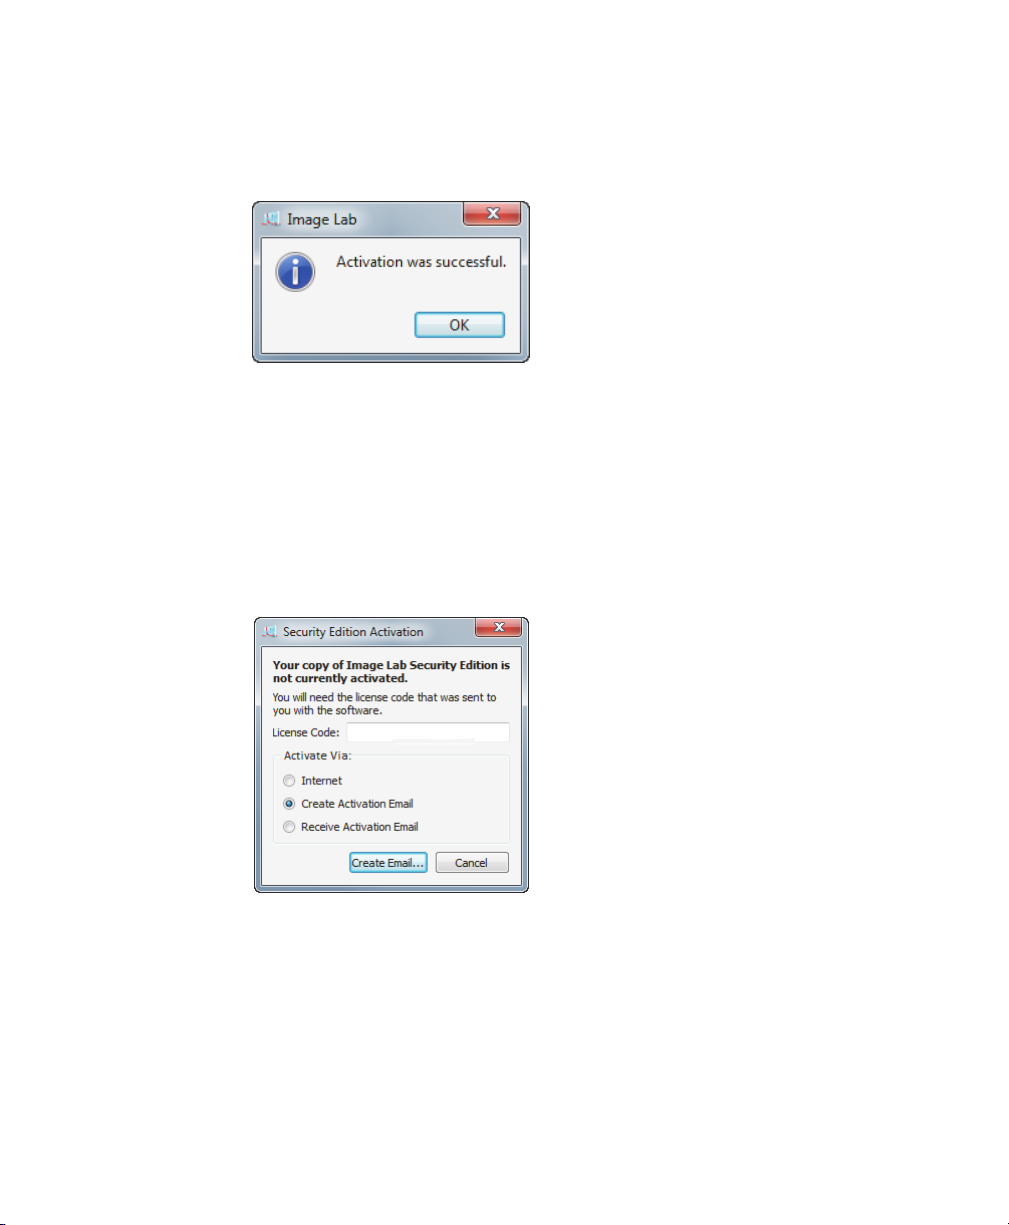
Within about 30 seconds you will receive a confirmation that your Image Lab
Security Edition has been activated.
To activate the Security Edition via email
1. Double-click the Image Lab icon on your desktop to open Image Lab.
The Security Edition Activation dialog box appears.
The License Code field is populated with the 18-digit license code that you
enter
ed when you installed Image Lab.
Select Activate Via Create Activation Email.
2.
3.
Click Cr
40 | Gel Doc EZ Imaging System with Image Lab Software
eate Email.
Page 41

Setting Up Image Lab Security Edition
A Save File window appears with the File name field already filled in. Do not
change this file name.
4. Click Browse Folders to choose a location for the file, and click Save.
5. In your email pr
ogram, create an email addressed to
LSG.TechServ.US@Bio-Rad.com, with the subject line: Request to Activate
Image Lab software Security Edition.
6. Attach the ActivationEmail.txt file to the email and click Send.
The Bio-Rad Technical Support Department will process your request and reply
with an email containing an attachment with your activation code.
7. When you receive your reply email, open it and save the attached
UnlockCode.txt file to the folder in which you saved the ActivationEmail.txt file.
8.
On the Security menu, click Activate Security Edition to display the Security
Edition Activation dialog box.
User Guide | 4 1
Page 42

2 | Setting Up the Instrument with Image Lab Software
9. Select Activate Via Receive Activation Email.
10. Click Receive Email.
An Open File window appears.
11. Navigate to the location where you saved the UnlockCode.txt file, select the
file, and click Open at the bottom of the window.
42 | Gel Doc EZ Imaging System with Image Lab Software
Page 43

Setting Up Image Lab Security Edition
The Security Edition activation complete window appears.
12. Click OK to close the window.
Deactivate Image Lab Security Edition
Image Lab can be installed on more than one computer. Bio-Rad Laboratories
recommends that you install the software on only one desktop computer and one
laptop. To load the Image Lab Security Edition on a second computer, the software
must be deactivated on the first computer before it can be activated on another. You
can deactivate the Security Edition automatically via the Internet, or you can
deactivate it manually by sending a deactivation email.
To deactivate the Security Edition automatically via the Internet
1. On the Security menu, click Deactivate Security Edition to display the
Deactivate Security Edition dialog box.
2. Select Deactivate Via Internet.
3. Click Deactivate.
User Guide | 4 3
Page 44

2 | Setting Up the Instrument with Image Lab Software
The system sends a message to the Bio-Rad Technical Support Department, a
window stating that your deactivation was successful appears, and Image Lab
Security Edition is immediately deactivated.
To deactivate the Security Edition via email
1. From the Security menu, click Deactivate Security Edition to display the
Deactivate Security Edition dialog box.
2. Select Deactivate Via Create Deactivation Email.
3. Click Deactivate.
44 | Gel Doc EZ Imaging System with Image Lab Software
Page 45

Setting Up Image Lab Security Edition
A Save File window appears.
4. Navigate to the folder in which you want to save the deactivation email and
click Save.
5. Create an email addressed to LSG.TechServ.US@Bio-Rad.com, with the
subject line: Request to Deactivate Image Lab software Security Edition.
6. Attach the DeactivationEmail.txt file to the email and click Send in your email
program.
The Bio-Rad Technical Support Department processes your request and
deactivates Image Lab Security Edition.
Enabling and Disabling Image Lab Secure Mode
You must have Image Lab Administrator role privileges to switch between
Image Lab secure mode and standard mode.
User Guide | 4 5
Page 46

2 | Setting Up the Instrument with Image Lab Software
To enable secure mode
1. From the Security menu, click Security Preferences to display the Security
Preferences dialog box.
2. Select Enable secure mode.
3. Click OK to display the Enable Secure Mode authentication dialog box.
4. Enter your Image Lab Administrator user name and password.
5. If you are set up on a Windows network server, type the name of the Windows
domain in the Domain field.
Note: The default is the domain on which the current Windows user is
located, and this name will appear in the field
6. Click OK to save your changes.
46 | Gel Doc EZ Imaging System with Image Lab Software
Page 47

Setting Up Image Lab Security Edition
A message appears stating that you must restart Image Lab for the new secure
mode enable setting to take effect.
7. Click OK.
The application exits.
Important: For full details on why and how to set your security pr
ences, see
efer
Setting Security Preferences on page 49.
To disable secure mode
1. From the Security menu, click Security Preferences to display the Security
Preferences dialog box.
2. Clear the Enable secure mode checkbox.
3. Click OK.
User Guide | 4 7
Page 48

2 | Setting Up the Instrument with Image Lab Software
The Admin Authentication dialog appears.
4. Enter your Image Lab Administrator user name and password.
5. If you are set up on a Windows network server, type the name of the Windows
domain in the Domain field.
Note: The default is the domain on which the current Windows user is
located, and this name will appear in the field.
6. Click OK to save your changes.
48 | Gel Doc EZ Imaging System with Image Lab Software
Page 49

Setting Up Image Lab Security Edition
A message appears stating that you must restart Image Lab for the new
security settings to take effect.
7. Click OK.
The application exits.
Setting Security Preferences
Here are three useful definitions used in these instructions.
Network domain — a remote domain-controlling computer or system
which ensures that only authorized users with valid credentials can access
and run Image Lab
Local domain (or local computer) — the computer on which Image Lab is
running, and which ensures that only authorized users with valid user
credentials can access and run Image Lab
Credentials — the valid user name and password that allows or prohibits
specific user actions
There are three possible combinations of settings in the Security Preferences dialog
box.
To choose settings in the Security Preferences dialog box
1. To set preferences so that only users who are set up on a network domain can
use Image Lab:
User Guide | 4 9
Page 50

2 | Setting Up the Instrument with Image Lab Software
In the Domain to be used in authentication field, enter the name of your
network domain. See To find the name of your network domain on
page 186 for instructions on how to determine this name.
Note: The default domain name that will appear in this field is the
domain on which the curr
Do not select the Use local groups for establishing user security levels
ent user is logged in.
checkbox.
2. To set preferences so that only users who are domain users and who are also
valid members of specific local groups can run Image Lab:
In the Domain to be used in authentication field, enter the name of your
network domain. See To find the name of your network domain on
page 186 for instructions on how to determine this name.
Note: The default domain name that will appear in this field is the
domain on which the curr
50 | Gel Doc EZ Imaging System with Image Lab Software
ent user is logged in.
Page 51

Setting Up Image Lab Security Edition
Select the Use local groups for establishing user security levels checkbox.
3. To set preferences so that only local users can run Image Lab:
In the Domain used in authentication field, enter your local computer name.
See To find the name of your local domain on page 185 for instructions on
how to determine this name.
Note: The default domain name that will appear in this field is the
domain on which the curr
The Use local groups for establishing user security levels checkbox is
ent user is logged in.
grayed out (not accessible).
User Guide | 5 1
Page 52

2 | Setting Up the Instrument with Image Lab Software
Renaming Security Groups
To rename any of the four default Security Groups
1. From the main menu, select Security > Rename Security Groups.
Note: This menu option is visible only if the person logged on to the local
computer is logged on as a member of the Windows Administrators group.
2. Click in any of the four Group Name fields.
3. Enter a new name.
4. Click OK to save your changes.
Note: The new user group name must comply with standard Windows Local
Users and Groups user names rules.
For mor
Groups on page 183.
e information on setting up security groups, see Setting Up Users and
Using Groups on a Local Domain
If you choose not to create or use groups on the network domain, set up local
groups. Add the authorized users to the groups on the local domain. In the Security
Preferences dialog box, select Use local groups for establishing user security levels.
52 | Gel Doc EZ Imaging System with Image Lab Software
Page 53

Setting Up Image Lab Security Edition
For information about setting up users and groups for Image Lab Security Edition,
see Appendix C, Setting Up Users and Groups on page 183.
Changing Security Preferences
Changing the domain that is used to authenticate users is a two-step process. You
first authenticate on the first domain, then authenticate on the second domain. This
change in domains can be performed in either of two ways. It can be performed by
one individual assigned the Image Lab Administrator role on both domains, or it can
be performed by two individuals, one with the administrator role on the first domain,
and the other with the administrator role on the second domain. See User
Authentication and Group Membership on page 183 for more information about
using this dialog box.
User Guide | 5 3
Page 54

2 | Setting Up the Instrument with Image Lab Software
54 | Gel Doc EZ Imaging System with Image Lab Software
Page 55

3 Image Lab Software
Overview
Image Lab™ image acquisition and analysis software works with the
Gel Doc™ EZ imager, stain-free gels, and other gels that are not stain-free to create
a r
eproducible, automated, and time-saving workflow for imaging and analyzing
gels.
In Image Lab, a protocol is any combination of imaging, analysis, and report settings
that has been saved to run as a single workflow
repeatedly or easily design a wide range of protocols.
With Image Lab you can view analyzed data, edit the analysis, and produce
customized r
repeatable results.
Image Lab generates two types of files:
Protocol files describe the parameters for imaging and analyzing your gel
images.
Image files contain the imaged gel, annotations, and analysis performed on
the gel. An imaged gel, run according to a protocol file, generates an image
file.
eports that show precisely the settings applied in order to ensure
. Researchers can run one protocol
User Guide | 5 5
Page 56

3 | Image Lab Software Overview
Table 3 lists the extensions and icons for the type of files that Image Lab generates.
Table 3. Image Lab file extensions and icons
File type File Extension Icon
Unsigned Signed Unsigned Signed
Protocols .ptl .sptl
Images .scn .sscn
56 | Gel Doc EZ Imaging System with Image Lab Software
Page 57

Interface Overview
The following illustration shows the Image Lab main window. This section explains
the main software elements.
Interface Overview
Main Window
Image Lab displays a single main window. All image and protocol dialog boxes that
present choices open in the workspace, which is the gray area of the main window.
If many screens are open in the workspace, you can make one active by clicking the
title bar at the top of the selected scr
also appears in the main window menu. Select one to make it active.
You can view complete analyses for images or protocols one at a time or compare
image r
esults by arranging scr
een. A list of open pr
eens in the workspace.
otocols and image files
User Guide | 5 7
Page 58

3 | Image Lab Software Overview
Main Toolbar
Many Image Lab tools can be selected by clicking toolbar buttons. The Screenshot
tool enables you to send a screen capture of your image to the clipboard or to save
it as a file. You can view demonstrations of various functions by clicking Tutorials.
The unlimited Undo and Redo buttons enable you to correct missteps easily. The
Default Protocols tool at the right end of the toolbar enables you to set up, view, and
edit default protocols.
File management View results data
Results Data
Results data associated with gel images can be viewed as an analysis table, a lane
profile, a standard curve, or in a report. Different tools for viewing the results data
are easily accessible from the main toolbar. These tools are described in Chapter 5,
Viewing Images. The views display the analysis for the selected image. All of the
views can be displayed at the same time. See Displaying Data on page 96 for
details.
Display Toolbox
The display toolbox at the top of every image enables you to display images in the
most useful ways. See Chapter 5, Viewing Images for a description of each option.
58 | Gel Doc EZ Imaging System with Image Lab Software
Page 59

Interface Overview
Start Page
The Start Page guides you through creating, opening, and viewing protocols and
images.
Analysis Tool Box
The Auto-Analysis button quickly analyzes images. The remaining
tools customize the analyzed data.
User Guide | 5 9
Page 60

3 | Image Lab Software Overview
An image file must be selected to make analysis tools available.
Image Tools enables you to flip, rotate, and crop images and to transform the
image files.
Lane and Bands enables you to r
esize, adjust, and bend lanes and to detect,
adjust, add, or delete bands.
Normalization enables you to normalize volume data in multichannel images, so
you can corr
ect for sample loading err
ors in your gels. For more on multichannel
images, see the System with Image Lab Software User Guide.
60 | Gel Doc EZ Imaging System with Image Lab Software
Page 61

Interface Overview
MW Analysis Tools (Molecular Weight Analysis) enables you to choose standard
samples, assign standard lanes, and choose a regression method.
Quantity Tools enables you to automatically quantify bands, using either r
absolute values.
Annotation T
gel.
Volume Tools enables you to manually quantify an object inside a boundary that
you define.
These tools are described in Analysis Tool Box Tools on page 109.
ools enables you to add formatted text and arr
ows to any ar
elative or
ea of a
Status Bar
The status bar in the lower right-hand corner of the main window shows the imager
and tray in use, and the X and Y values for the cursor position on the image file.
If the default protocol has been set up for the tray in use, its name also appears in
the status bar next to the tray name. Finally
value for the image intensity at the cursor position. The maximum data range is
0–4,095, but the range varies depending on the values contained within each image.
, the Int status bar displays the intensity
User Guide | 6 1
Page 62

3 | Image Lab Software Overview
Menu Commands
The following section describes all menu commands in the File, Edit, View, Window,
and Help menus. Many commands are also available on the toolbar or the Start
Page.
File Menu Commands
New Protocol enables you to create a new protocol that contains the necessary
steps and choices. See Chapter 4, Acquiring Images for detailed instructions.
Protocols can also be altered and stored for reuse.
Open br
owses the file system to retrieve a previously saved protocol file or image
file.
Recent Images enables you to open a r
Recent Protocols enables you to open a r
Save enables you to save a pr
otocol or image file after it is named.
Save As enables you to name and stor
ecent image file.
ecent protocol.
e a protocol or image. Protocols are stored
with a .ptl or .sptl extension. Image files are stored with an .scn or .sscn extension.
Close closes the active window
.
Close All closes all the windows.
Export enables you to export gel images or analysis tables with the following
options:
Export for Publication — exports a displayed image to a file. You can
select from .bmp, .png, .jpg, and .tif formats. The gel displays with any
lanes, bands, and annotations that appear on the screen. See Exporting
Gel Images for Publication on page 150 for more information.
Export for Analysis — creates a .tif file that retains all gel image data.
Analysis data are not included. Use this option to analyze the image in
other software such as Quantity One
®,
FPQuest™, or InfoQuest™FP. See
Exporting Gel Images for Publication on page 150 for more information.
62 | Gel Doc EZ Imaging System with Image Lab Software
Page 63

Interface Overview
Export for PulseNet — reduces the image to an 8-bit .tif file. Resolution is
limited and file size is restricted to 300 dots per inch (dpi).
Lane and Band Table to Excel — exports your lane and band table data
to an Excel (or Numbers on a Mac) spreadsheet.
Note: Excel or Numbers must be installed on your computer.
Lane and Band Table to File — exports as a comma-separated values
(CSV) file so that your lane and band table can be opened in a database
application.
Volume Table to Excel — exports your volume table data to an Excel (or
Numbers on a Mac) spreadsheet.
Note: Excel or Numbers must be installed on your computer.
Volume Table to File — exports as a CSV file so your volume table can be
opened in a database application. See Exporting Volume Tables to File on
page 153 for detailed information about exporting files.
See Chapter 8, Exporting Results for more information about exporting files.
Image Info displays information about individual gel and blot images, such as
acquisition date and data range, and image captur
e detail, such as exposure time
and illumination source used. Click the Image Details, Analysis Settings, and Notes
tabs to display these properties. See Image Info on page 96 for more information.
Page Setup contains print contr
ols such as orientation (landscape or portrait),
margins, printer used, and paper size.
Print displays a print pr
eview of the gel and the header information, which includes
the filename of the image, the user’s name, and the date and time it was printed.
The usual Windows Print screen is available as well, enabling you to select a printer
and the number of copies to print.
Exit closes Image Lab (after pr
ompting you to save changes to your protocols or
images).
User Guide | 6 3
Page 64

3 | Image Lab Software Overview
Edit Menu Commands
Undo undoes the last action.
Redo r
estores the last action after an Undo.
Screenshot enables you to take a scr
een shot of the Lane Profile Window, the
Standard Curve Window, or the default choice, Current Image View. The screen shot
can include the name of the image, and it can be placed on the clipboard or saved
in a file.
Default Imager enables users who own two or mor
e imagers to switch between
them.
Instrument Setup displays information about the instrument, including the
instrument name and serial number
, camera serial number, firmware version, and
the flat field version. The available sample trays are shown with the names of
associated default protocols. The dark image time and date are displayed. From this
dialog box, you can reset the dark image and the flat field for the white sample tray.
Report Settings enables you to configur
e reports. This dialog box has three tabs.
All of the checkboxes are selected by default. Clear the boxes to exclude
information from reports. Your selections apply to all reports until you change them.
The General tab has options for excluding or reporting information about
your gel image.
The Lane and Band Table tab enables the researcher to choose whether to
include all lanes or selected lanes, with appropriate identifiers. Lane
profiles can also be included.
The Volume Table tab enables the researcher to choose appropriate
identifiers for the volume table and provides the option of excluding the
table from reports.
Preferences enables you to set naming and color pr
This dialog box has two tabs.
64 | Gel Doc EZ Imaging System with Image Lab Software
eferences for your image files.
Page 65

Interface Overview
The Protocol tab shows presets for naming image files. You can choose to
include a designated Prefix, User Name, Date, and/or Time in the name of
your image files.
The Colors tab enables you to choose colors for the graphic elements in
your gels, such as Lane Frame, Lane, Band, Band Attribute, and MW
Legend. This functionality ensures that these elements are visible,
regardless of the color of the gels.
View Menu Commands
Image Overview displays the gel image with a red rectangle outlining the area
visible in the larger main window. This is useful when you zoom in to a small section
of an image.
Image Transform displays a histogram that enables you to adjust the light and dark
values of a gel image. This adjustment does not change your data, only the way the
data display on your monitor
Operations History displays the sequence of actions performed by both the user
and the softwar
e.
.
View System Log displays events r
elated to running Image Lab software, including
enabling or disabling secure mode, and the users who log on to or log off of the
software.
View (Instrument) Log displays events r
elated to the instrument, including
calibrating the instrument and the success or failure of the calibration. This log file is
visible only if Image Lab is connected to an instrument.
View (Document) Log displays events r
elated to creating and modifying secure
protocol and image files. This log file is created only when Security Edition is
enabled.
User Guide | 6 5
Page 66

3 | Image Lab Software Overview
Security Menu Commands
Note: This menu is only visible in Image Lab Security Edition. For more
information about Security Edition, see Chapter 10, Using the Security Edition.
Security Preferences allows the Image Lab Administrator to enable and disable
secur
e mode. In this dialog box, the administrator chooses the domain to be used
for authentication and whether to use local groups for security levels.
Rename Security Groups allows a person logged on as a member the Windows
Administrators gr
names (TDS_Administrator, TDS_User, TDS_Tech, and TDS_Guest).
Note: This menu option is visible only if the person logged on to the local
computer is logged on as a member of the Windows Administrators gr
Only users who are logged on as a member of that group maintain the authority
to change any of the four default Image Lab security group names. Any
changes made to these Security Group names must match the names your
Windows system administrator has given those groups.
oup to change any of the four default Image Lab security group
oup.
Sign Document enables users to sign images and pr
name and password and provide a reason for signing. When the document is
signed, the reason is saved in the System Log file.
Window Menu Commands
The Window controls enable you to show and hide multiple open image files in your
workspace. A list of all currently open images and protocols appears in this menu.
Tile aligns all open image files so they ar
Tile Horizontal aligns all open image files fr
Tile Vertical aligns all open image files fr
Cascade stacks all open image files and pr
each one can be easily chosen for viewing.
Imitate Zoom changes the zoom setting of all open images to the same zoom
setting as the curr
66 | Gel Doc EZ Imaging System with Image Lab Software
ent image file.
otocols. Users enter their user
e visible at the same time.
om top to bottom.
om left to right.
otocols with overlapping title bars, so
Page 67

Interface Overview
Imitate Transform changes the brightness and contrast of all open images to the
same transform settings as the current image file.
Next cycles thr
Previous cycles thr
ough all open image files from oldest to newest.
ough all open image files from newest to oldest.
Help Menu Commands
Image Lab Help displays the help system.
User Guide displays the instruction manual in .pdf form.
About displays Image Lab softwar
e version and release date.
User Guide | 6 7
Page 68

3 | Image Lab Software Overview
68 | Gel Doc EZ Imaging System with Image Lab Software
Page 69

4 Acquiring Images
Acquiring an image requires a set of steps in a workflow called a protocol. In
Image Lab softwar
imaging, analyzing, and reporting that has been saved to run as a single workflow.
Users can choose a protocol to be linked to a tray type by default. Such a default
pr
otocol is associated with:
A specific type of tray
The green Run button on the front of the Gel Doc™ EZ imager
The user’s computer system login ID
The advantage of a default protocol is that it can be run with a single press of the
Run button on the imager
Image Lab software. In all other respects, default protocols and custom protocols
are similar.
Typically, you create a default protocol for the applications you run most often with a
particular tray
sample tray) to run applications. For less frequently run applications, a custom
protocol can be created to capture the setup steps for later use.
e, a protocol can include any combination of settings for
. Custom protocols are run by clicking a software button in
. Each user can set up four default protocols (one for each type of
After it is set up in Image Lab software, a default protocol is run by placing a gel in a
sample tray
the front of the instrument. The imager automatically runs the default protocol
assigned to the type of tray inserted. If you have only one tray, it will automatically
be considered the default tray.
, inserting the sample tray in the imager, and pressing the Run button on
User Guide | 6 9
Page 70

4 | Acquiring Images
Selecting a Sample Tray
The following tables list ways of imaging gels stained with various detection agents
and which trays to use in each instance. If your stain is not listed here and you are
unsure of the appropriate tray, contact Bio-Rad Technical Support for assistance.
Stain-free gels and stain-free blots should be imaged in the stain-free tray.
Table 4.
Detection Reagent Primary Tray Alternate Tray
Ethidium bromide UV None
SYBR® Green Blue UV
SYBR® Safe Blue UV
SYBR® Gold Blue UV
GelGreen Blue UV
GelRed UV None
Fast Blast™ DNA stain White None
Applications for Nucleic Acid Gels
Table 5. Applications for Protein Gels
Detection Reagent Tray
Coomassie Blue stain White
Copper stain White
Zinc stain* White
Flamingo™ fluorescent gel stain UV
Oriole™ fluorescent gel stain UV
Silver stain White
Coomassie Fluor Orange UV
SYPRO Ruby UV
Krypton UV
* Recommended for imaging only.
70 | Gel Doc EZ Imaging System with Image Lab Software
Page 71

Setting Up a Default Protocol
Setting up a protocol involves three major processes:
Acquisition settings
Analyze image
Generate output
Each process comprises a set of steps. The appropriate options appear as each
pr
otocol step is selected.
Setting Up a Default Protocol
Important: Y
ou must configure Acquisition Settings (steps 1 through 6 in the
following procedure) to run an application. However, it is not necessary to
configure Analyze Image and Report Settings unless you want to calculate the
molecular weight automatically and generate a report.
To set up a default protocol
1. Click the Default Protocols button in the toolbar to set up a default protocol.
Caution: If the imager is not connected to your computer, a message
appears asking whether you want to run a simulation of the imager
. Click
No. Turn on the imager. Do not set up a protocol in simulation mode.
Protocols set up in simulation mode cannot be run.
User Guide | 7 1
Page 72

4 | Acquiring Images
A Default Protocol Setup window displays each sample tray type as well as
buttons that enable you to create a protocol or browse to an existing protocol.
Trays that have not been initialized are unavailable for editing or browsing. Note
that after you create a default protocol, the Create button changes to View/Edit
so you can review or change the protocol settings.
2. Click Create for the sample tray type for which you want to create a protocol.
The first Protocol Setup window appears. The title bar identifies the protocol as
a default protocol. The imager type and sample tray type are also shown.
72 | Gel Doc EZ Imaging System with Image Lab Software
Page 73

Setting Up a Default Protocol
The three major processes are listed in the left pane. Numbered major steps in
each process appear under these headings. To select options under a protocol
step, select the accompanying checkbox. Options appear in the right side of
the window. To disable any step, clear its checkbox.
User Guide | 7 3
Page 74
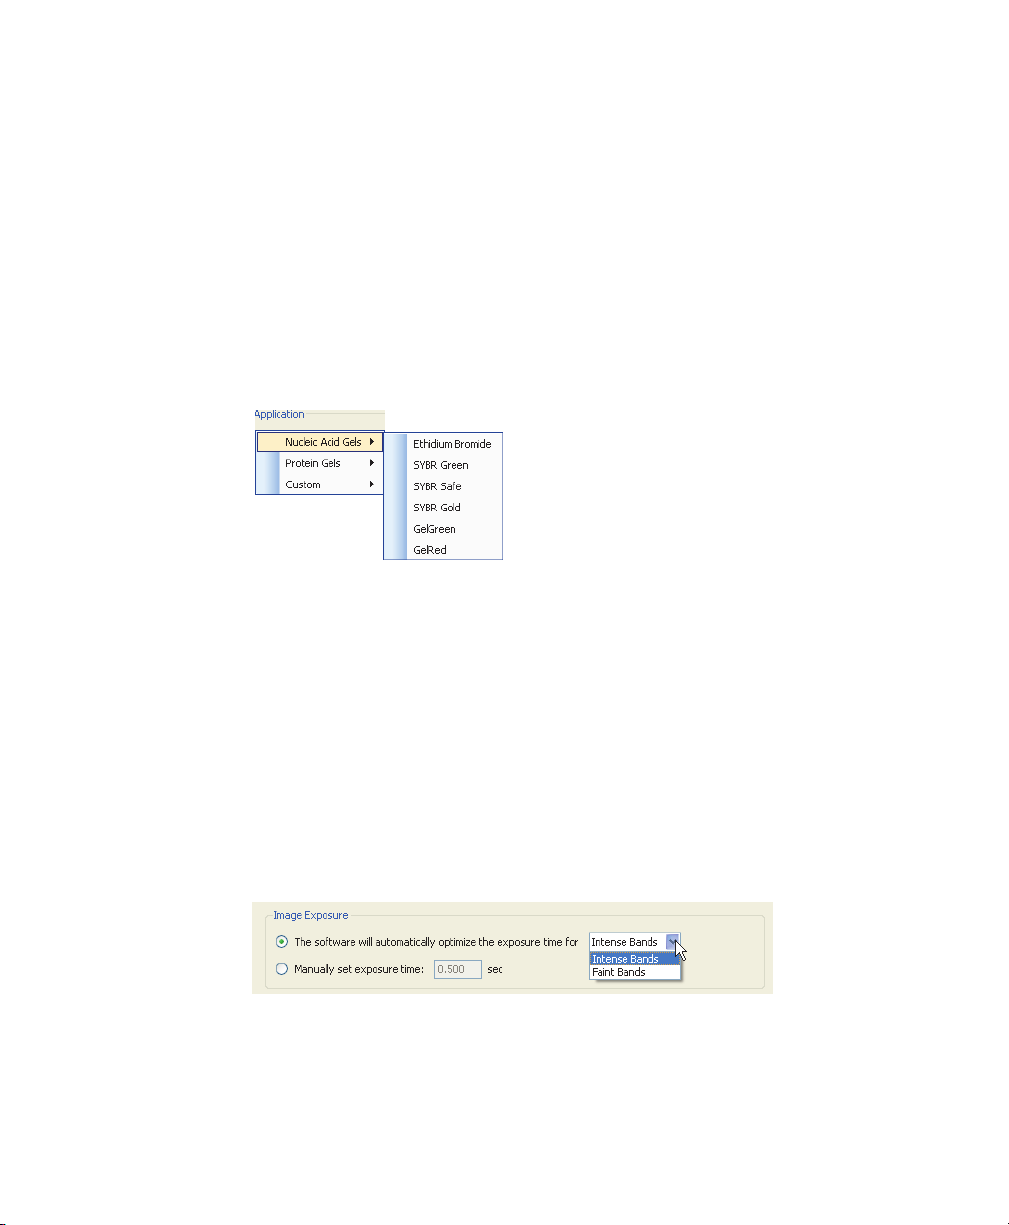
4 | Acquiring Images
Acquisition Settings
Step 1. Gel Imaging
The Gel Imaging checkbox is already selected. The right side of the Protocol Setup
window displays Gel Imaging options.
Application Options
1. Select an application
Click Select and choose an application from the dropdown menus.
The menus list only applications appropriate for the selected sample tray. When
you choose an application, any required filter or illumination source displays in
the Protocol Setup window.
Note: Custom applications are available only for custom protocols. See
Setting Up a Custom Protocol on page 84 for more information about
custom applications.
2. Set the image exposur
If you select the first image exposur
using the optimal exposure time. This option ensur
dynamic range. You can automatically optimize for intense or faint bands.
If you choose Intense Bands from the menu, exposure is optimized for all
bands.
74 | Gel Doc EZ Imaging System with Image Lab Software
e
e option, Image Lab acquires an image
es the best use of the
Page 75

Setting Up a Default Protocol
If you choose Faint Bands, exposure time is longer, making faint bands
more visible. More prominent bands might be overexposed.
Select manual exposure to override automated imaging. Exposure time
can range from 0.001 to 10 sec.
After a gel is imaged with automatic exposure optimization, the previous
exposur
e time displays in the pr
otocol as a guide so you can manually adjust
the exposure time if necessary.
You can also view the exposure time of the image later, in the Image Info
window (see Image Info on page 96 for more information).
3. Set the Display Options
Highlight saturated pixels — select the Highlight saturated pixels checkbox to
see any saturated pixels in r
ed, which shows how much of the gel image is
saturated. Saturated pixels are beyond the maximum quantifiable range of the
imaging system. This option can be changed later by selecting View > Image
Transform.
Image Color — select color choice to display the sample image. Viewing the
image with a dif
fer
ent color scheme can make it easier to see all of the
elements. See Image Colors on page 94 for the color choices.
User Guide | 7 5
Page 76

4 | Acquiring Images
Analyze Image
Step 2. Detect Lanes and Bands
To analyze the gel automatically, Image Lab must detect lanes and bands on the
image. Lanes are detected automatically, and then the background is automatically
subtracted. Refer to Lane and Bands Tools on page 113 for details. You can
customize band detection with the following options.
Select the Lane and Band Detection checkbox in the left pane of the Protocol Setup
window
.
The Protocol Setup window displays lane and band detection options:
Low Band Detection Sensitivity — this option sets detection at a low
level for images with prominent bands. Faint bands are not detected.
High Band Detection Sensitivity — this option sets detection at a higher
level for images that are faint. Extraneous bands can be removed later
using the Band Tools in the Analysis Tool Box. See Lane and Bands Tools
on page 113.
76 | Gel Doc EZ Imaging System with Image Lab Software
Page 77

Setting Up a Default Protocol
Custom — select a numerical value between 1 and 100 to choose the best
detection sensitivity for your sample.
Note: When low or high band detection sensitivity is used, these numerical
values ar
e set: low sensitivity = 25; high sensitivity = 75.
Step 3. Analyze Molecular Weight
1. To analyze molecular weight automatically, select the Analyze Molecular Weight
checkbox in the left pane of the Protocol Setup window. When this checkbox is
selected, the software calculates the molecular weight for each band based on
the specified standard.
2. To estimate the size of the molecules in the bands of your gel, enter the
standards you are using and specify the lanes in which the standards are
placed.
User Guide | 7 7
Page 78

4 | Acquiring Images
Standards
Determining molecular weight depends upon selection of the proper protein
standards. Many protein standards are available from Bio-Rad, including:
Precision Plus Protein™ standard
Prestained SDS-PAGE standards, broad range
Prestained SDS-PAGE standards, low range
Prestained SDS-PAGE standards, high range
Bio-Rad standards cannot be edited. However, these standards can be copied, and
the copies can be r
The Change button opens the Manage Standards dialog box, in which you can add
thir
d-party standard samples and edit your list.
enamed and edited.
78 | Gel Doc EZ Imaging System with Image Lab Software
Page 79

Setting Up a Default Protocol
Standard Lanes
Choose the lane that contains your standards by typing lane numbers or the words
First and Last in the Standard Lanes field. The format is xx, xx, xx, ... where xx is the
lane number. For example, if you run an 18-well gel and you want your standards in
lanes 1, 10, and 18, enter First, 10, and Last.
Note: Lane detection works best when standards are placed in the first and
last lanes.
Regression Methods
A regression method is used to calculate the molecular weight of the unknown
bands. The software uses the relative front and molecular weight values of the
standard bands to calculate the standard curve. The standard curve is then used to
calculate the values of the unknown bands. The shape of the standard curve is
based on the selected regression method. Choose one of four regression methods.
The methods and the minimum number of standard bands required for each type
ar
e shown in the following table.
T
able 6.
Regression Method Minimum Number of
Linear (semilog) 2
Point-to-point (semilog) 2
Logistic 5
Cubic spline 5
Regression methods and minimum number of bands
Standard Bands
If you do not have enough data points for the selected method, the molecular
weight of the unknown bands is not calculated.
Select the appropriate method for the gel type:
Gradient gels: The linear (semilog) regression method works well for these
gels because the mobility of the bands is linear to the log of their molecular
User Guide | 7 9
Page 80

4 | Acquiring Images
weight. As an alternative, the point-to-point (semilog) method can be used
if the R
Fixed percentage gels: These gels have a nonlinear relationship between
the mobility and the molecular weight. For these gels, choose the logistic
or cubic spline regression method.
You can check how well each regression method fits the data in the standard curve
window (for mor
(semilog) regression method provides a measurement that describes how well the
standar
data fit the standard curve.
The molecular weight of each band is displayed in the Analysis Table in the Mol. Wt.
column. Refer to Molecular Weight (MW) Analysis Tools on page 123 for more
information about molecular weight.
For information about the calculations behind the regression methods, see
Appendix E, Regression Calculation Methods.
Output Settings
2
value is not sufficient.
e information, see Standard Curve on page 104). The linear
d curve fits the data R
2
value. The closer the R2 value is to 1.0, the better the
Image Lab prints to the default printer unless you select otherwise.
You have three choices for specifying output:
You can automatically print the image. This is useful for gel documentation,
especially if a thermal printer is connected. See Appendix F, Mitsubishi
P93/P95 Thermal Printer for instructions on setting up the Mitsubishi P93/
P95D thermal printer
You can automatically print the report, including all accompanying analysis
information.
Note: You cannot print a report on a thermal printer.
You can display the image on your computer.
80 | Gel Doc EZ Imaging System with Image Lab Software
Page 81

Setting Up a Default Protocol
Step 4. Specify Output
1. Select the Specify Output checkbox in the left pane of the Protocol Setup
window to display the output options.
2. In the right pane, you can choose whether to automatically display or print an
image or a report after a protocol runs.
The report can be customized with the options in Edit > Report Settings.
For more information about reporting options, see Chapter 7, Generating Reports.
User Guide | 8 1
Page 82

4 | Acquiring Images
Review Protocol Settings
Protocol Summary
1. Click Protocol Summary in the left pane of any Protocol Setup window to see a
review of all protocol settings.
2. Click Save in the left pane to save the default protocol.
Running a Default Protocol
To run a default protocol
1. Place a gel on the appropriate sample tray and insert the tray into the imager
until the magnet grabs the tray.
2. Close the door.
3. Press the green Run button on the front of the imager. The default protocol runs
automatically.
The default protocol appears in Image Lab with a green background. After the
pr
otocol runs, the resulting image appears and the protocol window remains
open behind it. The application name appears in the status bar below the gel
preview window.
82 | Gel Doc EZ Imaging System with Image Lab Software
Page 83

Creating a Multichannel Image from Single Images
Creating a Multichannel Image from Single Images
You can create a multichannel image from existing single images or from single
channels in other multichannel images. Only images with the same aspect ratio can
be combined in a multichannel image. These images are not linked to one another.
Therefore, when you make a change to one image, it is not propagated to the other
images. For information on how to create a multichannel image from single channel
images, see the chapter on acquiring images in the ChemiDoc™ MP System with
Image Lab Software User Guide.
User Guide | 8 3
Page 84

4 | Acquiring Images
Setting Up a Custom Protocol
Creating a custom protocol is similar to creating a default protocol.
To create a custom protocol
1. Choose New in the Protocols box on the Start Page or click New Protocol in the
toolbar. The Protocol Setup window appears.
2. Select an application from the Application dropdown menus.
The menus list all predefined applications you can run on the Gel Doc EZ
imager
.
Note: If you want to image a gel using a detection reagent not listed in the
menus and do not find an equivalent r
Rad Technical Support for protocol recommendations.
Choose Custom to run an existing application with a new name or when you
have an application unlike any existing applications. Selecting Custom >
Manage Custom Applications in the Application menu displays the Manage
Custom Applications dialog box. Custom applications you save ar
dialog box. An Edit button enables you to make changes to custom
applications.
84 | Gel Doc EZ Imaging System with Image Lab Software
eagent in the menus, contact Bio-
e listed in this
Page 85

Setting Up a Custom Protocol
Note: You cannot create custom applications for the stain-free tray.
3. To create a custom application, click New. The Create Custom Applications
dialog box appears.
4. Enter a unique application name.
5.
The remainder of the setup instructions are the same for both default and
custom profiles. Go to step 2, Set the image exposure on page 74 in Setting Up
a Default Protocol and follow the instructions.
User Guide | 8 5
Page 86

4 | Acquiring Images
Selecting a Custom Protocol
Use the same protocol repeatedly by clicking Open in the Protocols box on the Start
Page or by clicking Open in the toolbar. You can also select recently used protocols
or image files from the lists on the Start Page.
Running a Custom Protocol
To run a custom protocol
1. Open a protocol or create a new one.
2. Place your gel on the appropriate sample tray and insert the tray into the imager
until the magnet grabs the tray.
3. Close the door.
4. Click Run Protocol in the left pane of the Protocol Setup window. The custom
protocol runs automatically.
After the protocol runs, the resulting image appears and the Protocol window
r
emains open behind it. The application name appears at the bottom of the gel
pr
eview window.
86 | Gel Doc EZ Imaging System with Image Lab Software
Page 87

Editing Protocols
Protocols can be changed or renamed using the many tools in Image Lab.
To edit protocols
1. Choose File > Open to open a saved protocol.
Alternatively, you can click Open in the Protocols box on the Start Page. You
see the same set of dialog boxes and choices described in the section, Setting
Up a Custom Protocol on page 84.
2. To replace an existing protocol, edit the protocol and save your changes.
3.
To create another protocol, save the edited protocol with a different name.
Editing Protocols
User Guide | 8 7
Page 88

4 | Acquiring Images
88 | Gel Doc EZ Imaging System with Image Lab Software
Page 89
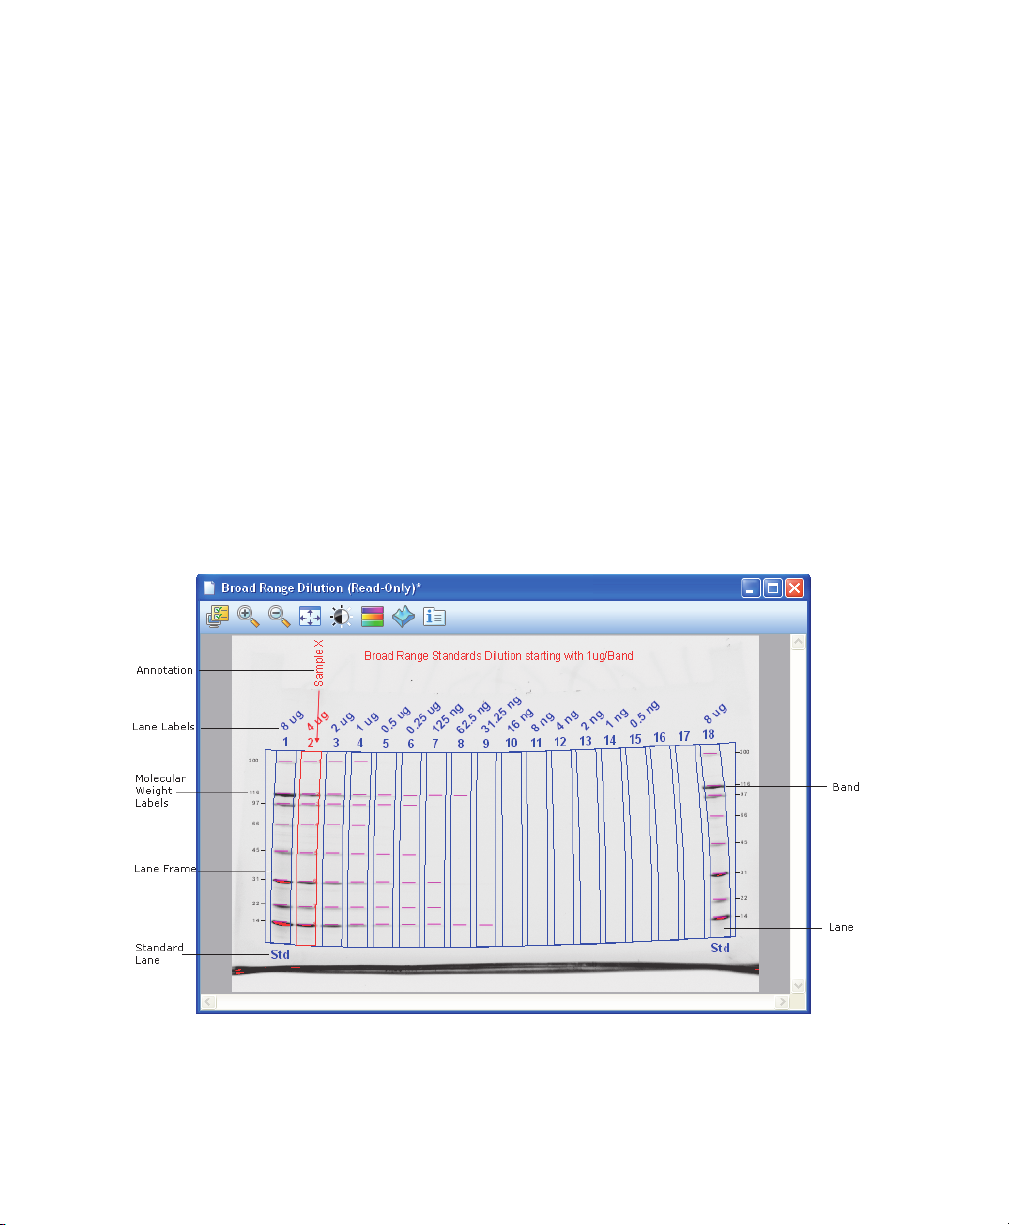
5 Viewing Images
After a gel is imaged, the image appears in the workspace. Many controls are
available to optimize viewing and to analyze the image.
The following screen shot shows a gel image with band and lane detection as well
as annotations. The labels ar
e are many ways to view the data associated with the results. You can view
Ther
data as an analysis table, a standard curve, and a r
e overlays that you can display or hide.
eport.
User Guide | 8 9
Page 90

5 | Viewing Images
Displaying Gel Images
The display toolbar is located above the gel image. Each tool is described in the
following sections.
Display Gel Options
This section describes the settings in the Display Gel Options dialog box.
Annotations
You can choose whether to show text and arrow annotations that have been drawn
on the image.
Lanes and Bands
You can turn on or off any image overlays, such as lane frames, lanes, bands, lane
labels, molecular weight legends, and band edges.
90 | Gel Doc EZ Imaging System with Image Lab Software
Page 91

Displaying Gel Images
Band Attributes
You can show the following attributes for selected lanes or for all lanes.
Band number
Band label
Molecular weight
Relative front
Volume
Absolute Quantity
Relative Quantity
Band %
Lane %
Volumes
If you drew volume boundaries on the gel, you can display the boundaries and their
volume labels.
Zoom Tools
The zoom tools resize the gel image. Click the magnifying glass with the plus sign to
make the image larger. Click the magnifying glass with the minus sign to make the
image smaller.
You can also zoom in on an area using the right mouse button. Right-click and drag
to select the ar
clicking and using the scroll wheel on your mouse.
Tip: You can return to the original view by right-clicking anywhere on the
image.
ea you want to magnify
. You can also resize the image by right-
User Guide | 9 1
Page 92

5 | Viewing Images
Fit in Window
If you zoomed in on an area of an image, this button brings the entire image back
into view.
Image Transform
The Image Transform dialog box adjusts image brightness and contrast, optimizing
the image display so faint details can be seen.
The minimum to maximum range varies depending on the light and dark values
present in the image. These adjustments do not change the data. They change only
the way the data are displayed. The human eye cannot see as great a range as the
image contains.
The frequency distribution histogram shows the total data range in the image and
the amount of data at each point in the range.
Auto Scale determines an optimal setting for the image automatically. The lightest
part of the image is set to the minimum intensity
maximum.
The High progress indicator determines which intensity value is shown at
the maximum gray scale (or other color) in the gel image.
92 | Gel Doc EZ Imaging System with Image Lab Software
, and the darkest is set to the
Page 93

Displaying Gel Images
The Low progress indicator determines which intensity value is shown at
the minimum gray scale (or other color) in the gel image.
The Gamma progress indicator changes the gray scale curve. A value of 1
is linear. A value <1 redistributes a greater proportion of the gray scale to
the first half of the intensity values. A value >1 redistributes a greater
proportion of the gray scale to the second half of the intensity values.
You can also type numerical values in the boxes next to the progress indicators.
Clicking anywher
e on the progress indicator bars moves the progress indicator
incrementally.
Options:
Invert image display — inverts dark bands on a light background to light
bands on a dark background. Light bands on a dark background are
inverted to dark bands on a light background.
Highlight saturated pixels — when this checkbox is selected, areas of the
image with saturated signal intensity (higher than a measurable range) are
highlighted in red.
Linear or logarithmic histogram — this adjustment changes the y-axis on
the histogram to display the number of pixels at each intensity value using
either a linear or a logarithmic scale.
User Guide | 9 3
Page 94

5 | Viewing Images
Image Colors
You can choose a color map for your image results file. Viewing the image with a
different color scheme can make it easier to see all of the elements in the image, but
it does not change your data.
The first eight color choices imitate the colors of stained gels. The remaining
choices supply enough color variation to highlight small dif
data. The available colors include:
fer
ences in the image
Gray
EtBr (ethidium bromide)
Coomassie
Stain-free
SYBR
SYPRO Ruby
Flamingo
Silver
94 | Gel Doc EZ Imaging System with Image Lab Software
®
Green
Page 95

False color
Spectrum
Gold-Silver
Pseudo
3-D Projection
Displaying Gel Images
The 3-D view transforms the gel image into a solid three-dimensional model
spinning in space with x, y, and z dimensions. Accentuate or diminish the relative
heights of data points by pulling the slider at the bottom of the window to the right
or left.
To view the intensity of various bands
1. Select the 3-D button in the display toolbar.
2. Click and drag the model to rotate it into your preferred view.
3. Bring the window into focus by clicking the image.
4. Press “C” to display an inverted green cone, which can be dragged around to
evaluate the intensity of various bands.
5. Press “C” again to hide the tool.
User Guide | 9 5
Page 96

5 | Viewing Images
Image Info
The Image Info dialog box provides information about the active image.
The dialog box has three tabs.
Image Details — acquisition and image information appear in this tab.
Analysis Settings — settings that were used when the gel was analyzed
are displayed here. For example, Band Detection and Molecular Weight
Analysis will appear if they were performed.
Notes — on this tab you can add notes, point out the types of samples
used, and add any other information about the results. You can create
custom labels for the lanes in your image.
Displaying Data
You can view results from analyzed data associated with a gel image using an
analysis table, a lane profile, a standard curve, or a report.
The buttons in the main toolbar turn these views on or off. You can view your data
with all views simultaneously
.
96 | Gel Doc EZ Imaging System with Image Lab Software
Page 97

Displaying Data
Analysis Table Options
Numerical data associated with an analysis can be viewed in an analysis table. Data
from the Lane and Band analysis can be viewed in the Lane and Band Table tab. If
volume analysis was performed, these data can be viewed in the Volume Table tab.
The buttons above the table provide options for displaying and exporting analysis
table data.
To change the size of the Analysis Table window
Move your cursor to the top of the window until it changes into a
double-headed arrow. Click and drag the edge of the window until you can see
all of the data.
Note: Resizing the Analysis Table window is restricted when a protocol window
is open.
Display Data Options
The Display Data Options dialog box has three tabs.
Measurements — enables you to choose the measurements to display in
the table. Use the arrows to move the columns between the Not Displayed
pane and the Displayed pane. By default, all measurements are displayed
in the Analysis table.
Note: For a description of each Lane and Band measurement type, see
Lane and Band Table Measurement Definitions on page 99. For a
description of each Volume measurement type, see Volume Measurement
User Guide | 9 7
Page 98

5 | Viewing Images
Definitions on page 100.
Display — enables you to set the display for the analysis table. The
following settings appear on the Display tab:
Default display settings — The Move selected lane to top checkbox is
Per Measurement Precision — set the precision (decimal places) for the
Example — shows an example of how measurements will display with the
Export — enables you to choose how to export the analysis data. The
following settings appear on the Export tab:
Export formatting — select checkboxes to include lane headers (Lane
Export delimiter — select a delimiter option for the exported file.
selected by default. When you click a lane on the image, the Analysis table
scrolls so that the data for the selected lane appears first in either the
vertical or horizontal view of the table.
measurements in the Lane and Band table and the Volume table.
selected measurement and precision settings.
and Band table tab only) and/or column headers in the exported file.
Comma delimited
Tab delimited
Use other delimiter (user defined)
Change Analysis Table Orientation
This button toggles between two table orientations.
Horizontal — displays the lanes/volumes beside each other, so you can scr
through the table from left to right.
Vertical — displays the lanes/volumes on top of each other
through the table from top to bottom.
Copy Analysis Table to the Clipboard
98 | Gel Doc EZ Imaging System with Image Lab Software
, so you can scr
oll
oll
Page 99

Displaying Data
Copies the table data to the clipboard so that you can paste the data into word
processing or presentation applications.
Tip: It is best to use the vertical table orientation when copying to an
8.5 x 11-inch page, to give the columns enough room to display.
Export Analysis Table to a File
Exports the table data as a CSV file so you can open it in a database application.
Export Analysis Table to Excel
Exports the table data to a spreadsheet so you can use the sorting and formula
functions to manipulate your data. If you have Excel (PC or Mac) or Numbers (Mac)
installed on your computer, the program opens with your spreadsheet displayed.
Lane and Band Table Measurement Definitions
This section defines the measurements that display in the Lane and Band tab in the
Analysis table. Use the Data display options button to choose the columns to
display.
Band Number — each band in a lane has a unique number
bottom.
Band Label — you can assign a custom label to each band by clicking the Band
Label field of the Lane and Band table.
Molecular Weight — the molecular weight of the band is calculated based on the
user
-defined standar
values. When using nucleic acid gels, the size of the band is displayed in base pairs.
Relative Front — values between 0–1 indicate the r
fr
om top to bottom.
Volume — the sum of all intensities within the band boundaries.
Abs. Quant. — absolute quantification of the band.
Rel. Quant. — r
d and regression method. Italic values indicate extrapolated
elative quantification of the band compar
, sorted fr
elative movement of the band
ed to the reference band.
om top to
User Guide | 9 9
Page 100

5 | Viewing Images
Band % — percentage of the band’s volume compared to all band volumes in the
lane.
Lane % — per
lane.
centage of the band’s volume compared to the entire volume of the
Volume Measurement Definitions
This section defines the measurements that display in the Volume tab in the Analysis
table. Use the Display Data Options button to choose the columns to display.
Volume Number — a unique number is assigned to each volume.
Volume Label — softwar
(U – unknown, B – background, S – standard). Label can be changed in Volume
Pr
operties.
Volume — the sum of all the intensities within the band boundaries.
Adjusted Volume — the backgr
Mean Background — the mean value of the backgr
Absolute Quantity Volume — the quantity of the volume based on the standar
volumes and the regression method.
Relative Quantity Volume — the ratio of the adjusted volume and the adjusted
volume of the r
eference volume.
e-generated labels for different types of volumes
ound-adjusted volume.
ound.
d
# Pixels — number of pixels inside the volume boundary
Minimum Value — intensity of the pixel with the minimum intensity inside the
volume.
Maximum Value — intensity of the pixel with the maximum intensity inside the
volume.
Mean Value — mean value of all pixels inside the volume boundary
Standard Deviation — standar
100 | Gel Doc EZ Imaging System with Image Lab Software
d deviation of all pixels inside the volume boundary.
.
.
 Loading...