

Page 1

1
2
3
4
5
6
7
8
9
10
3-10NL
1
2
3
4
5
6
7
8
9
10
1
2
3
4
5
6
7
8
9
10
11
12
Location of
Metal Grounding Strip
18002 70994625354
Sample Prep + 2-D Electrophoresis + Imaging
2-D
2-D Electrophoresis Workflow
How-To Guide
Fourth Edition
Page 2

2-D Electrophoresis Guide
Table of Contents
About This Guide
This guide describes the experimental methods and tools used in 2-D
electrophoresis and proteomics research. It provides background information
about technologies common to all proteomics studies as well as protocols and
advice you can use as a starting point for your studies. This guide also explains
how experimental conditions can be varied and interpreted to optimize your
results and provides an extensive set of references that you can consult for
more information. Since each sample, experimental approach, and objective
is different, this guide offers ideas for developing customized protocols suitable
for the analysis of your samples.
Part I: Theory and Product Selection 5
Chapter 1 Overview of
Two-Dimensional Electrophoresis
The Context of Proteomics 6
Overview of Experimental Design 6
Sample Preparation 8
First-Dimension Separation: IEF 8
Second-Dimension Separation: SDS-PAGE 8
Detection 9
Image Acquisition, Analysis, and Spot Cutting 9
Protein Digestion and Identification by Mass Spectrometry 9
Chapter 2 Sample Preparation 11
The Importance of Sample Preparation 12
General Considerations 12
Cell Lysis 12
Protein Solubilization 15
Chaotropic Agents 15
Detergents 15
Reducing Agents 16
Ampholytes, Buffers, and Other Additives 17
Removal of Interfering Substances 19
General Considerations 19
Nucleic acids (DNA and RNA) 19
Polysaccharides 20
Phenolic Compounds 20
Lipids 20
Salts and Other Small Ionic Compounds 20
Prevention of Keratin Contamination 21
Prefractionation 22
Fractionation by Subcellular Location 22
Fractionation by Solubility/Hydrophobicity 24
Fractionation by Protein Charge 24
Fractionation by pI 25
Fractionation by Size (MW) 26
Depletion and Dynamic Range Reduction 27
Depletion 27
Dynamic Range Reduction 28
ProteoMiner Technology 29
Sample Quantitation (Protein Assays) 30
Chapter 3 The First Dimension:
Isoelectric Focusing (IEF)
Protein Separation by Isoelectric Point (pI) 34
5
IEF Media: IPG Strips vs. Carrier Ampholytes 35
Selection of IPG Strips 36
Choice of pH Gradient 36
Choice of IPG Strip Length 36
Estimation of pl 37
Sample Application 38
Sample Application during Rehydration 38
Sample Application by Cup Loading 39
Setup for IEF 39
Power Conditions for IEF 40
Chapter 4 The Second Dimension:
SDS-PAGE
Protein Separation by Size 44
Selection of Polyacrylamide Gels 44
Choice of Gel Percentage (Composition) 45
Choice of Gel Size 47
Choice of Buffer System 47
Transition from First to Second Dimension 52
Power Conditions and Reagents for SDS-PAGE 52
Molecular Weight Estimation 53
Chapter 5 Detection 55
Detection of Proteins in Gels 56
Coomassie Stains 56
Silver Stains 57
Fluorescent Stains 57
Negative Stains 57
Stain-Free Technology 57
Detection of Proteins on Western Blots 61
33
43
Bio-Rad’s Proteomics Program
From sample preparation to protein analysis, Bio-Rad’s tools provide
you with choices in methodology, protocols, and products. Our informative
2-D Electrophoresis and Analysis Applications and Technologies web pages
are a valuable resource with video tutorials, protocols, troubleshooting tips,
and much more. To learn more, visit www.bio-rad.com/2DElectroAnalysis.
1
Page 3

2-D Electrophoresis Guide Table of Contents
Chapter 6 Image Acquisition, Analysis,
and Spot Cutting
Finding Protein Spots of Interest 64
Image Acquisition 64
Image Analysis 65
Image Optimization, Spot Detection, and Quantitation 66
Gel Comparison 66
Data Normalization 66
Data Analysis and Reporting 67
Spot Cutting from 2-D Gels 67
63
Chapter 7 Identification and
Characterization of 2-D Protein Spots
Beyond Excision 70
Proteolytic Digestion 70
Washing 70
Reduction and Alkylation 70
In-Gel Proteolytic Digestion 70
Identification by Mass Spectrometry 71
Peptide Mass Fingerprinting 72
Tandem Mass Spectrometry (MS/MS) 73
Establishment of 2-D Databases 73
69
Part II: Methods 75
Chapter 8 Sample Preparation 75
Tips for Sample Preparation 76
Lysis (Cell Disruption) 76
Protein Solubilization 76
Buffers and Solutions 77
Cell Lysis and Protein Extraction Procedures 78
Suspension Cultured Human Cells 78
Monolayer Cultured Human Cells 78
Mammalian Tissue 79
Microbial Cultures 79
Plant Leaves 80
Sample Cleanup 81
Buffer Exchange (Desalting) 81
Chapter 9 First-Dimension IEF
with IPG Strips
Tips for IEF 86
IPG Strip Rehydration and Sample Loading 86
Performing IEF 87
IPG Strip Rehydration in Rehydration/Equilibration Trays
Followed by IEF 87
IEF with Gel-Side Up 87
IEF with Gel-Side Down 88
Cup Loading (IEF with Gel-Side Up) 88
IPG Strip Rehydration in the Focusing Tray Followed by IEF 89
IEF Programming Recommendations 90
85
Chapter 10 Second-Dimension SDS-PAGE 95
Tips for SDS-PAGE 96
IPG Strip Equilibration 97
Sealing IPG Strips onto SDS-PAGE Gels 98
SDS-PAG E 99
Chapter 11 Protein Detection 101
Tips for Total Protein Staining 102
Long-Term Storage of Stained Gels 10 2
Total Protein Staining 10 3
Bio-Safe Coomassie Stain 103
Flamingo Fluorescent Gel Stain 103
Oriole Fluorescent Gel Stain 104
SYPRO Ruby Protein Gel Stain 104
Silver Stain Plus Kit 105
Chapter 12 In-Gel Trypsin Digestion 107
Tryptic Digestion Protocol 108
Reagents and Solutions 108
Destaining Gel Plugs from Silver-Stained Gels 108
(Pre-Treatment)
General Destaining Protocol 109
Reduction and Alkylation Protocol 109
Digestion Protocol 109
Extraction Protocol 109
Part III: Troubleshooting 111
Isoelectric Focusing 112
SDS-PAG E 113
Total Protein Staining 114
2-D Gel Evaluation 115
Part IV: Appendices 125
Appendix A 126
Glossary 126
Appendix B 130
References 130
Related Bio-Rad Literature 132
Appendix C 133
Ordering Information 133
Sample Quantitation (RC DC Protein Assay) 82
Microfuge Tube Assay Protocol (1.5 ml) 82
2 3
Page 4
2-D Electrophoresis Guide
Theor y and Product Selection
PART I
Theory and
Product Selection
CHAPTER 1
Overview of
Two-Dimensional
Electrophoresis
4 5
Page 5
2-D Electrophoresis Guide
Chapter 1: Overview of Two-Dimensional Electrophoresis
Theor y and Product Selection
The Context of Proteomics
Proteome analysis (proteomics) is the comprehensive
analysis of proteins present in a sample and
representing a particular physiological state at a
particular point in time. The aim of proteomics is to
determine the presence, relative abundance, and
posttranslational modification state of a large fraction
of the proteins in a sample (Wilkins et al. 1996).
Since proteins are directly involved in cellular structure,
regulation, and metabolism, proteomics can often yield
a more informative and accurate picture of the state of
a living cell than can analysis of the genome or mRNA.
One of the greatest challenges of proteome analysis
is the reproducible separation of complex protein
mixtures while retaining both qualitative and
quantitative relationships. Many combinations of
techniques can be used to separate and analyze
proteins, but two-dimensional (2-D) electrophoresis
is uniquely powerful in its ability to separate hundreds
to thousands of products simultaneously (Choe and
Lee 2000). This technique uses two different
electrophoretic separations, isoelectric focusing (IEF)
and SDS-PAGE, to separate proteins according to
their isoelectric point (pI) and molecular weight.
The identities of individual protein spots from the gel
can then be identified by mass spectrometry (MS)
of their tryptic peptides. Together with computerassisted image evaluation systems for comprehensive
qualitative and quantitative examination of proteomes,
proteome analysis also allows cataloguing and
comparison of data among groups of researchers.
Other common methods of proteome analysis involve
the proteolytic digestion of sample proteins and the
chromatographic separation of the resulting peptides
coupled directly to mass spectrometric analysis.
Peptides are identified by referencing a database,
and their proteins of origin are inferred. While these
methods are largely automatable and provide an
impressive depth of proteome coverage, some
information is lost when analyzing protein fragments
instead of intact proteins. The 2-D electrophoresis
approach maintains proteins in their intact states and
enables the study of isoform distribution, which is not
possible if the sample is proteolytically digested prior
to separation. Since proteins can be selected through
image analysis, mass spectrometry need be applied
only to the proteins of interest. This is an important
consideration when access to instrumentation or the
expense of mass spectrometric analysis is a limitation.
The suitability of 2-D electrophoresis to proteome
analysis is clear, but its applications also extend to
biomarker detection, development of drug and other
therapies, and optimization and development of
protein purification strategies.
Overview of Experimental Design
The general workflow in a 2-D electrophoresis
experiment (Figure 1.1) and some of the factors
affecting the way the experiment is performed
are outlined next.
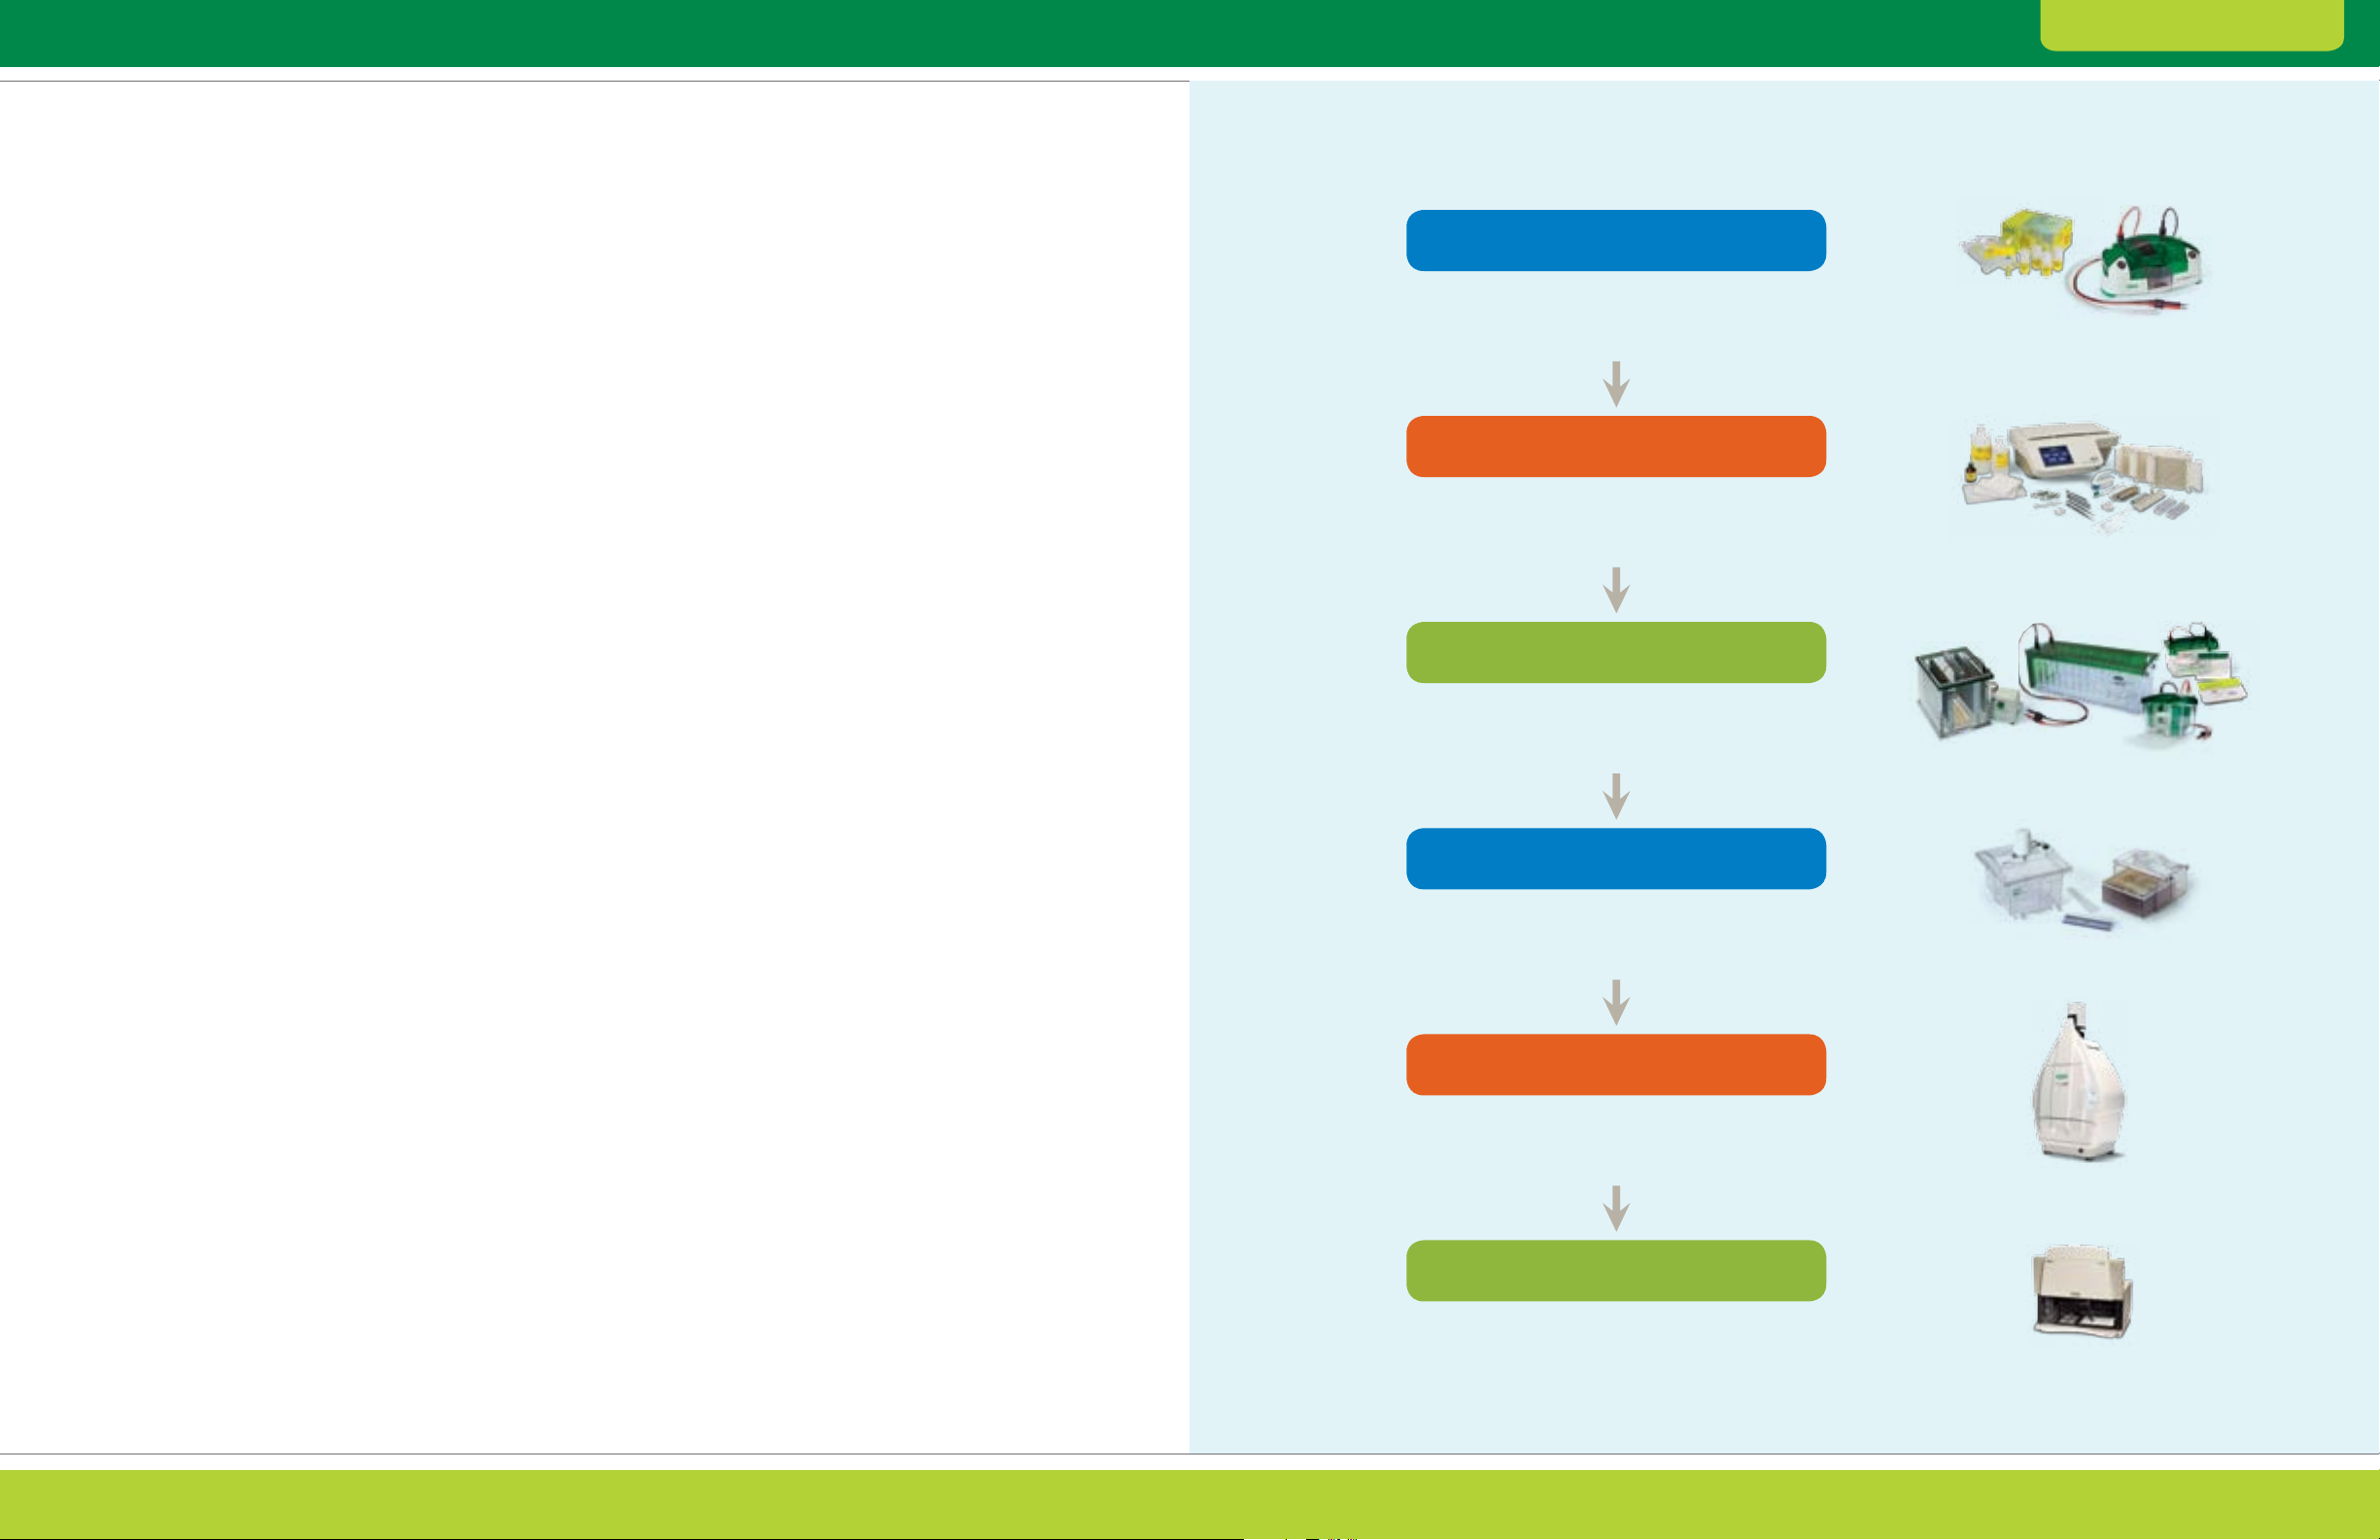
2-D Electrophoresis Workflow
Sample Preparation
Prepare the protein at a concentration and in a solution suitable
for IEF. Choose a method that maintains the native charge,
solubility, and relative abundance of proteins of interest.
First-Dimension Separation: IEF
Separate proteins according to pI by IEF. Select the appropriate IPG
strip length and pH gradient for the desired resolution and sample
load. Select appropriate sample loading and separation conditions.
Second-Dimension Separation: SDS-PAGE
Separate proteins according to size by SDS-PAGE.
Select the appropriate gel size and composition
and separation conditions.
Detection
Visualize proteins using either a total protein stain or fluorescent
protein tags. Select a staining technique that matches
sensitivity requirements and available imaging equipment.
Image Acquisition and Analysis
Capture digital images of the 2-D protein patterns
using appropriate imaging equipment and software.
Then analyze the patterns using 2-D analysis software.
Protein Excision, Digestion, and Identification
Excise protein spots of interest from the gel,
digest the proteins, and analyze the digests by MS.
Fig. 1.1. General workflow for a 2-D experiment.
6 7
Page 6
Low MW
2-D Electrophoresis Guide Theor y and Product Selection
Chapter 1: Overview of Two-Dimensional Electrophoresis
Sample Preparation
Effective sample preparation is key for the success
of the experiment. The sample dictates the type of
extraction technique used, and the solubility, charge,
and pI of the proteins of interest affect the method
of solubilization. The protein fraction used for 2-D
electrophoresis must be solubilized in a denaturing
solution of low ionic strength; this solution cannot
contain components that alter protein size or charge.
Sample preparation also involves optional steps to
deplete abundant proteins, reduce the complexity
of the protein mixture, or select a subproteome of
interest. Details and recommendations for sample
preparation can be found in Chapter 2.
First-Dimension Separation: IEF
In 2-D electrophoresis, the first-dimension separation
step is IEF. Proteins are separated electrophoretically
on the basis of their pI, the pH at which a protein
carries no net charge. For general proteome analysis,
(IPG) strip and under conditions aimed at completely
denaturing and solubilizing all the proteins in the
sample (as opposed to native IEF, which aims to
preserve native structures and activities). Chapter 3
discusses IEF.
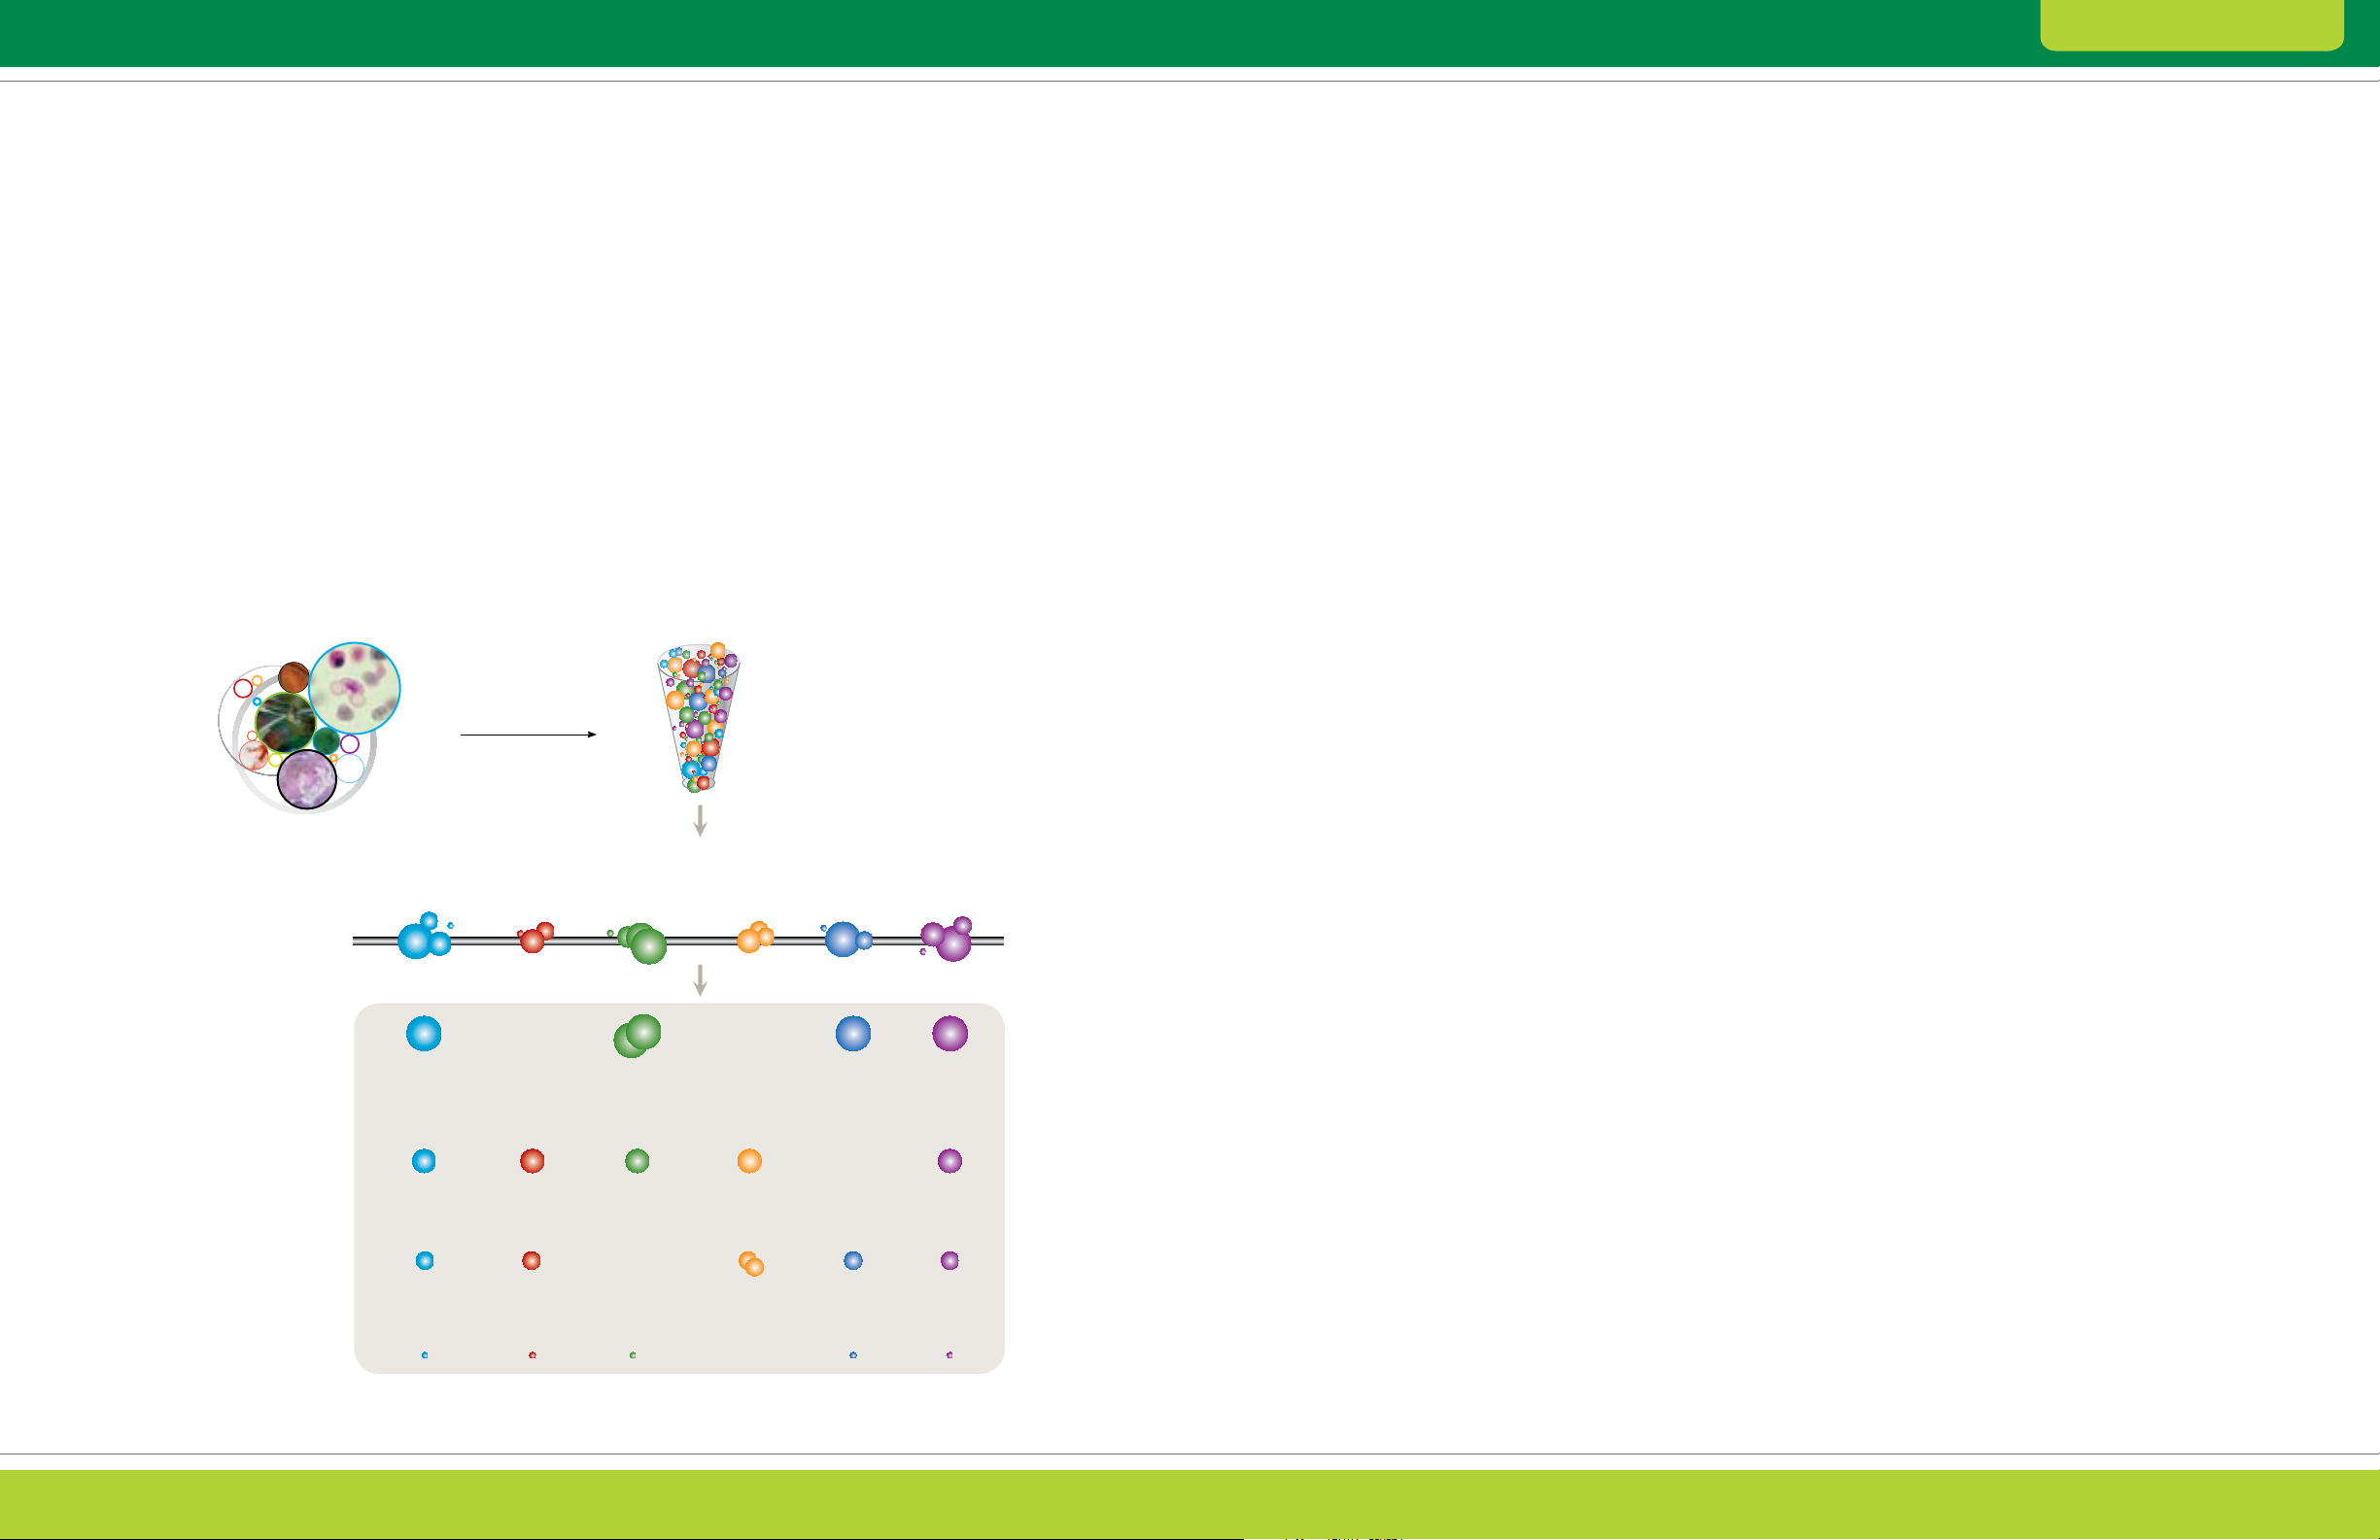
Second-Dimension Separation: SDS-PAGE
The second-dimension separation step is SDS-PAGE,
where the proteins already separated by IEF are further
separated by their size. Prior to second-dimension
separation, an equilibration step is applied to
the IPG strip containing the separated proteins.
This process reduces any disulfide bonds that may
have re-formed during the first dimension and alkylates
the resultant sulfhydryl groups. Concurrently, the
proteins are complexed with SDS for separation on
the basis of size. Following electrophoretic separation
on a slab gel, the result is a two-dimensional array
of separated protein “spots” (Figure 1.2). Seconddimension SDS-PAGE is discussed in Chapter 4.
IEF is best performed in an immobilized pH gradient
Sample Preparation
First Dimension
Isoelectric focusing (IEF), separation by pl
Low pH High pH
Second Dimension
SDS-PAGE,
separation by MW
High MW
Detection
Proteins separated in gels are usually not visible to
the naked eye and must, therefore, be either stained
or labeled for visualization. Several factors determine
the best choice of staining method, including desired
sensitivity, linear range, ease of use, expense, and the
type of imaging equipment available. There is no ideal
universal stain. Sometimes proteins are detected after
transfer to a membrane support by western blotting.
These topics are discussed in Chapters 5 and 6.
Image Acquisition, Analysis, and Spot Cutting
The ability to collect data in digital form is one of the
major factors that make 2-D gels a practical means
of collecting proteome information. It allows the
unbiased comparison of samples and gels, transfer of
information among research groups, and cataloguing
of data. Many types of imaging devices interface with
software designed specifically to collect, interpret,
and compare proteomics data.
Once interesting proteins are selected by differential
analysis or other criteria, the proteins can be excised
from gels and identified by mass spectrometry.
The ExQuest
independently or programmed to run from PDQuest
™
spot cutter, which can be operated
™
software, automatically cuts selected protein spots
from gels with precision and deposits them into the
wells of microplates.
Imaging equipment, software, and the ExQuest spot
cutter are discussed in Chapter 6.
Protein Digestion and Identification by
Mass Spectrometry
The excised gel plugs are destained and enzymatically
digested (usually with trypsin) in preparation for
identification by mass spectrometry. The use of mass
spectrometry for precise mass and partial sequence
determination, coupled with the availability of protein
sequence databases, has made high-throughput
protein identification possible. An overview of this
process is provided in Chapter 7.
Fig. 1.2. 2-D electrophoresis. Protein spots result from two separations: first by pI (IEF) and then by size (SDS-PAGE).
8 9
Page 7
2-D Electrophoresis Guide Theor y and Product Selection
CHAPTER 2
Sample Preparation
10 11
Page 8

2-D Electrophoresis Guide Theor y and Product Selection
Chapter 2: Sample Preparation
The Importance of Sample Preparation
Sample preparation contributes significantly to
the overall reproducibility and accuracy of protein
expression analysis (Link 1999, Rabilloud 1999,
Molloy 2000). Without proper sample preparation,
proteins may not separate from one another or may
not be represented in the 2-D pattern.
A successful sample preparation strategy enhances
separation quality by:
Effectively and reproducibly solubilizing proteins
of interest
Preventing protein aggregation and loss of solubility
during IEF
Preventing proteolysis or other chemical or
enzymatic protein modifications
Removing or minimizing the effect of contaminants
such as salts, detergents, nucleic acids, and other
interfering molecules
Yielding proteins of interest at detectable levels,
which may require fractionation to reduce protein
sample complexity or removal of interfering abundant
or irrelevant proteins
This chapter provides an overview of the principles and
recent developments in sample preparation strategies
prior to first-dimension IEF.
General Considerations
Since protein types and sample origins show great
diversity, there is no universal sample preparation
method. In addition, some proteins simply cannot
be solubilized under conditions compatible with IEF.
Sample preparation procedures must be optimized
empirically and tailored to each sample type and
experimental goal. The following general sample
preparation guidelines should be kept in mind:
Keep the sample preparation workflow as simple
as possible; increasing the number of sample
handling steps may increase variability and the
risk of sample loss
With cell or tissue lysates, include protease inhibitors
to minimize artifacts generated by proteolysis;
protease inhibitors are generally not required for
samples like serum or plasma
Solubilize proteins in a solution that is compatible
with IEF. Incubate proteins in 2-D lysis solution for
at least 30 min at room temperature (denaturation,
solubilization, and disaggregation are timedependent processes)
Determine the amount of total protein in each
sample using a protein assay that is compatible
with chemicals in your samples
Avoid freeze-thaw cycles; use protein extracts
immediately or aliquot them into appropriately sized
batches and store them at –70°C
Cell Lysis
The effectiveness of a cell lysis method determines
the accessibility of intracellular proteins for extraction
and solubilization. Different biological materials require
different lysis strategies, which can be divided into two
main categories: gentle methods and harsher methods
(Table 2.1).
Use gentle cell disruption protocols with cells that
lyse easily, such as blood cells and tissue culture cells
Use harsher methods, which are based mainly on
mechanical rupture (Goldberg 2008), with biological
materials that have tough cell walls (for example,
plant cells and tissues, and some microbes)
When working with a new sample, compare at least
two different cell disruption protocols with respect to
yield (by protein assay) and qualitative protein content
(by one-dimensional SDS-PAGE)
Optimize the power settings of mechanical rupture
systems and the incubation times of lysis approaches
Mechanical cell lysis usually generates heat;
use cooling where required to avoid overheating
the sample
A number of other components are often added to
disruption protocols. Sand, resin, or glass beads
facilitate the disruption of tissues and of plant and
yeast cell walls when added to manual grinding
procedures. Hypotonic buffers cause cells to burst
more readily under physical shearing, and enzymes
such as cellulase, pectinase, lyticase, and lysozyme
are added to break down plant, yeast, and bacterial
cell walls. Nucleases can be added to remove nucleic
acids, which can increase sample viscosity and
interfere with subsequent separation (see the Removal
of Interfering Substances section).
Table 2.1. Suitabilit y of ce ll disruption methods for various sample ty pes.
Yeast, Green Mammalian
Algae, Plant Soft Cell
Technique Description Bacteria Fungi Seeds Material Tissues Culture
Gentle Methods
Osmotic lysis Suspension of cells in hypotonic solution; — — — — — •
cells swe ll and burst, releasing cellular contents
Freeze-thaw lysis Freezing of cells in liquid nitrogen — — — — — •
and subsequent thawing
Detergent lysis Suspension of cells in detergent-containing — — — — — •
solution to solubilize the cell membrane;
this method is usually followed by another
disruption method, such as sonication
Enzymatic lysis Suspension of cells in iso-osmotic solutions • • — • — —
containing enzymes that digest the cell wall
(for example, cellulase and pectinase for plant
cells, lyticase for yeast cells, and lysozyme for
bacterial cells); this method is usually followed by
another disruption method, such as sonication
Harsher Methods
Sonication Disruption of a cell suspension, cooled on ice • • — — — •
to avoid heating and subjected to shor t bursts
of ultrasonic waves
French pre ss Application of shear forces by forcing a cell • • — • — •
suspension through a small orifice at high pressure
Grinding Breaking cells of solid tissues and microorganisms • • • • • —
with a mortar and pestle; usually, the mortar is
chilled with liquid nitrogen and the tissue or cells
are ground to a fine powder
Mechanical Homogenization with either a handheld device — — — • • —
homogenization (for example, Dounce and Potter-Elvehjem
homogenizers), blenders, or other motorized
devices; this approach is best suited for soft,
solid tissues
Glass-bead Application of gentle abrasion by vortexing • • — — — •
homogenization cells with glass beads
All but the most gentle cell disruption methods destroy
the compartmentalization of a cell, causing the
release of hydrolases (phosphatases, glycosidases,
and proteases). These enzymes modify proteins in
the lysate, which complicates differential analysis.
The data generated by 2-D electrophoresis are only
meaningful when the integrity of the sample proteins
reflects the state in which they are found in the living
organism. Avoid enzymatic degradation by using one
or a combination of the following techniques:
Disrupt the sample or place freshly lysed samples in
solutions containing strong denaturing agents such
as 7–9 M urea, 2 M thiourea, or 2% SDS. In this
environment, enzymatic activity is often negligible
Perform cell lysis at low temperatures to diminish
enzymatic activity
Lyse samples at pH >9 by adding a base such
as sodium carbonate or Tris(hydroxymethyl)aminomethane (Tris) to the lysis solution
(proteases are often least active at basic pH)
Add protease inhibitors to the lysis solution.
Examples include either small molecules,
such as phenylmethylsulfonyl fluoride (PMSF),
aminoethyl-benzene sulphonyl fluoride (AEBSF),
tosyl lysine chloromethyl ketone (TLCK),
tosyl phenyl chloromethyl ketone (TPCK),
ethylenediaminetetraacetic acid (EDTA), and
benzamidine, or peptide protease inhibitors such
as leupeptin, pepstatin, aprotinin, and bestatin.
For best results, use a combination of inhibitors
in a protease inhibitor cocktail
If protein phosphorylation is to be studied, include
phosphatase inhibitors such as fluoride or vanadate
Following cell disruption:
Check the efficacy of cell disruption by light
microscopy (if the sample is a cell suspension)
Centrifuge all extracts extensively (20,000 × g for
15 min at 15°C) to remove any insoluble material;
solid particles may block the pores of the IPG strip
12 13
Page 9
2-D Electrophoresis Guide Theor y and Product Selection
Chapter 2: Sample Preparation
Products for Cell Lysis and
Protein Extraction
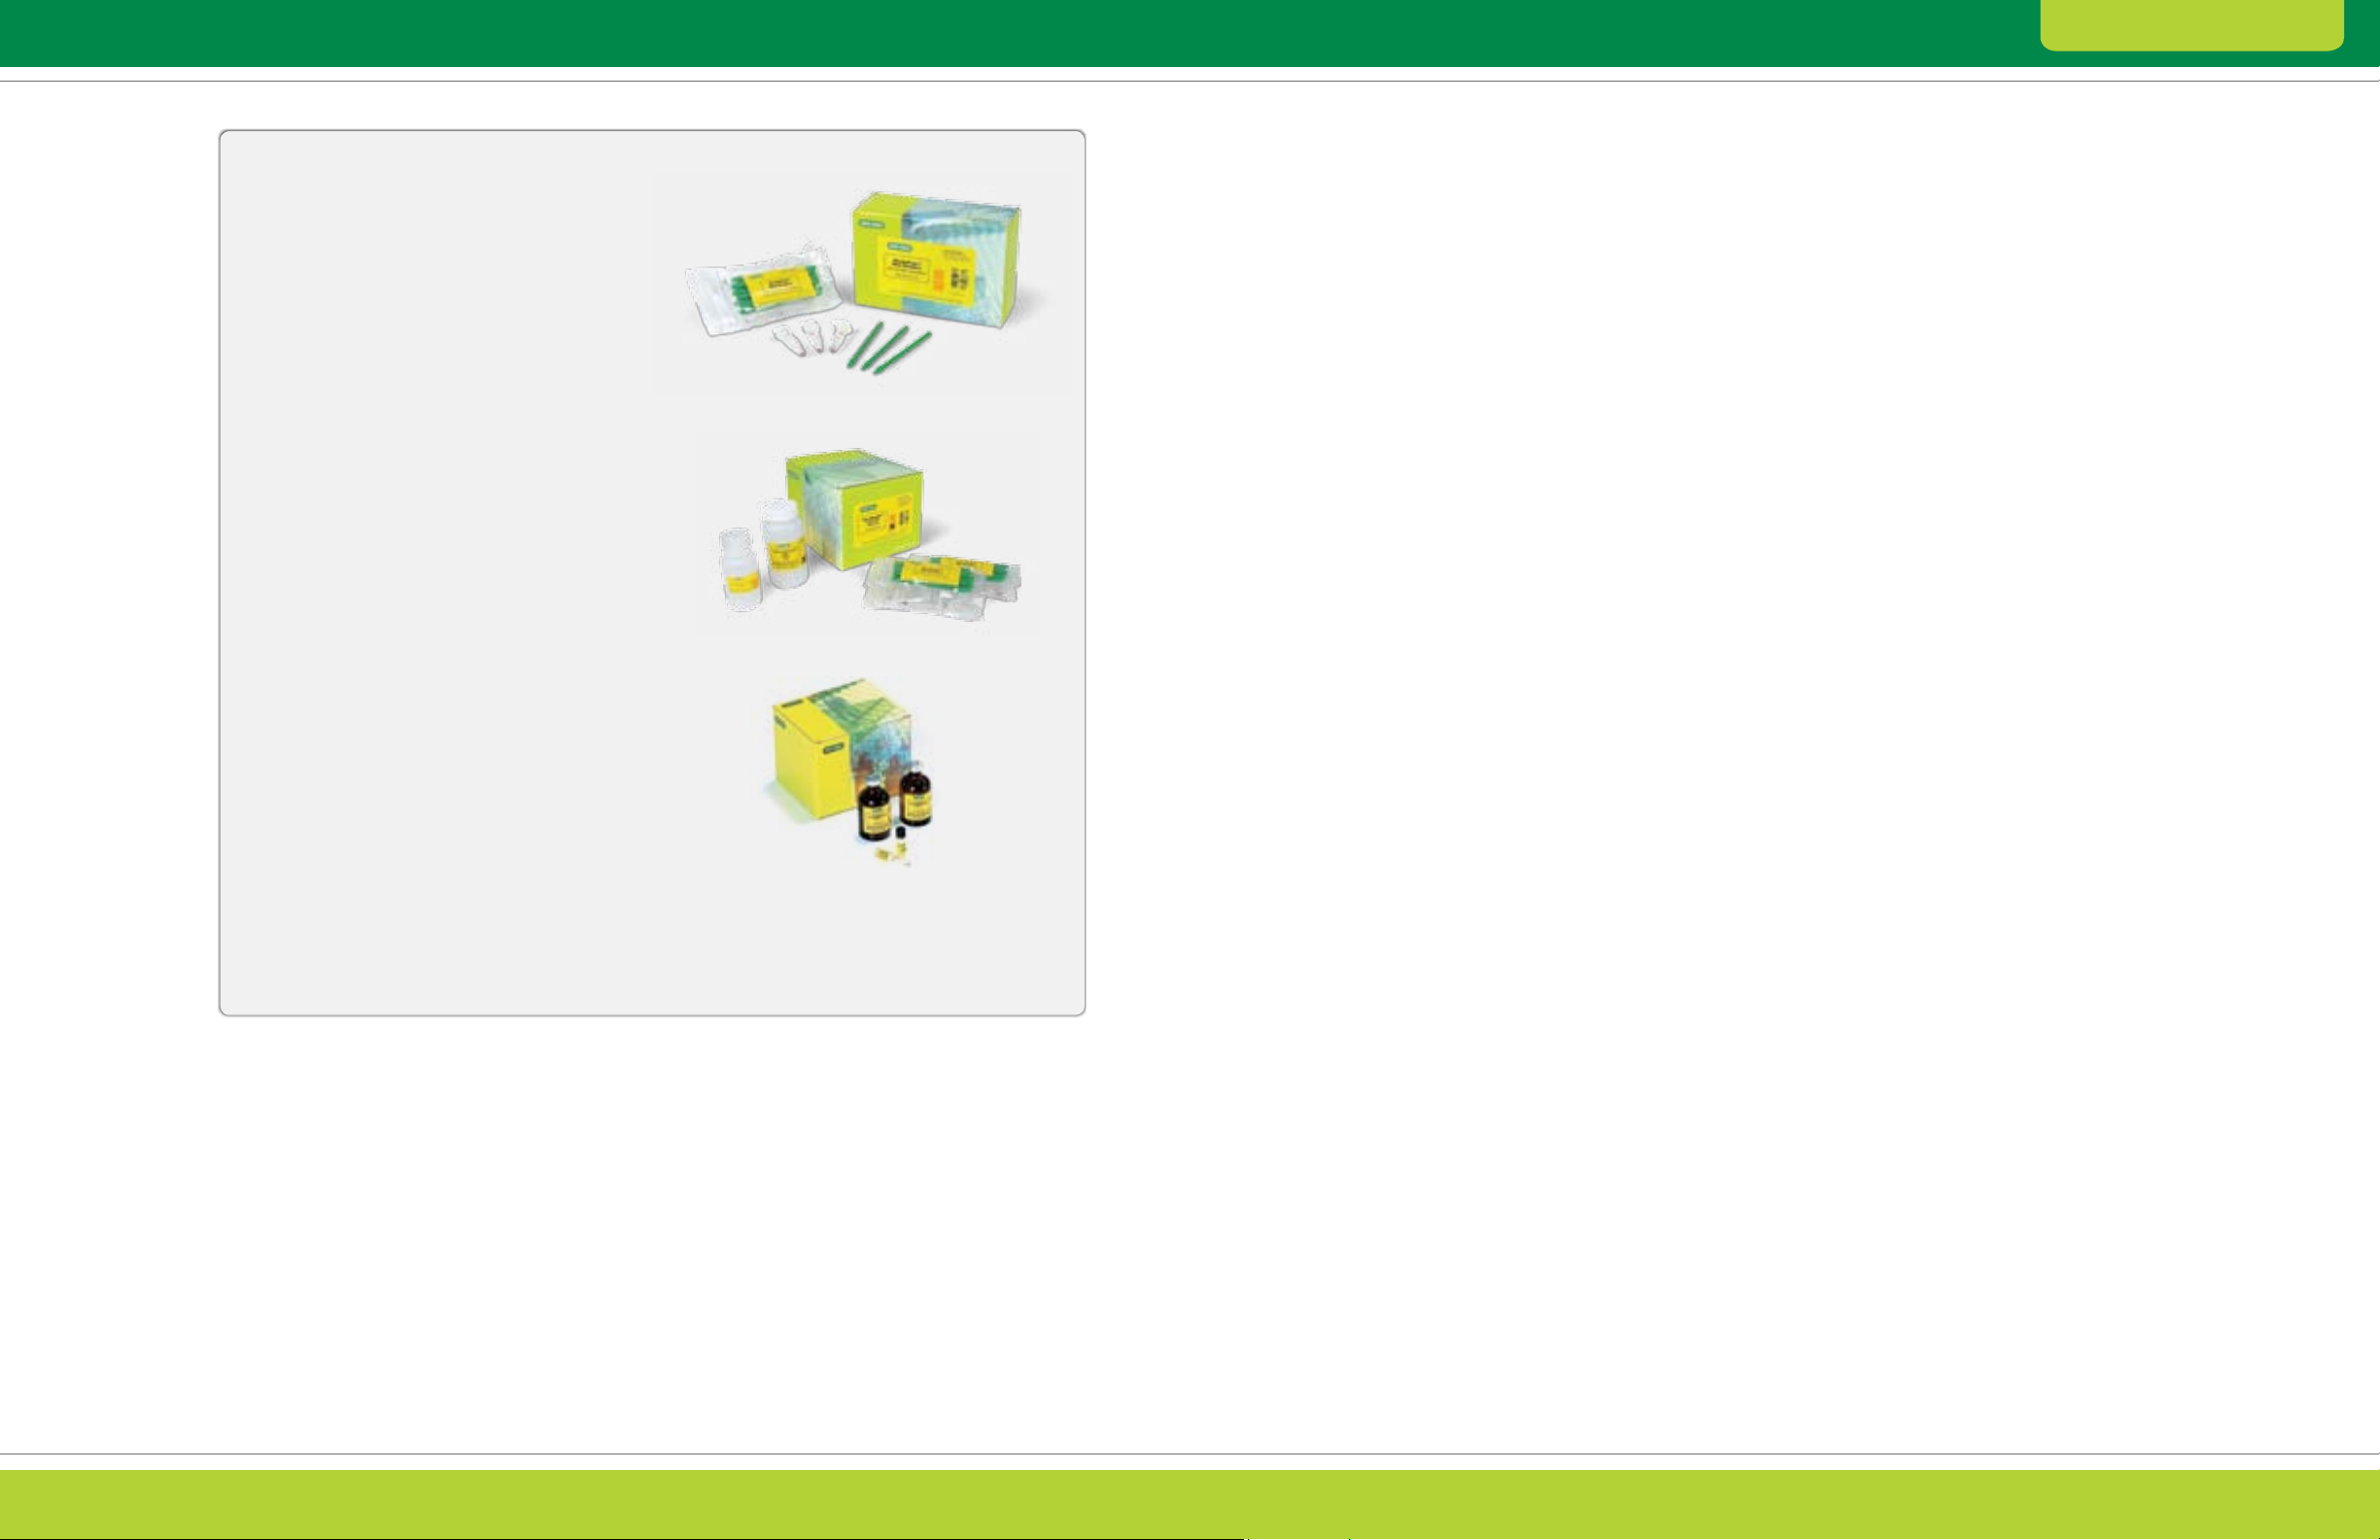
ReadyPrep™ mini grinders contain a grinding
tube, grinding resin, and fitted pestle and offer an
easy, efficient mechanism for manually grinding
small biological samples. The grinding resin is a
neutral abrasive material made of a high-tensile
microparticle that does not bind protein or nucleic
acids. The combination of the pestle and resin
effectively disrupts animal or plant tissues and cells.
ReadyPrep mini grinders are available for purchase
separately or as components of the MicroRotofor
™
cell lysis kits.
Bio-Rad also offers a range of kits for cell disruption
and protein extraction:
1
MicroRotofor lysis kits
provide convenient,
effective methods optimized for the preparation
of protein samples from mammalian, plant, yeast,
and bacterial sources. Depending on the sample
type, these kits employ tissue maceration using
ReadyPrep mini grinders and/or solubilization into
a chaotropic extraction buffer
The ReadyPrep protein extraction kit (total protein)
uses the powerful zwitterionic detergent ASB-14
in a strongly chaotropic solubilization buffer to
prepare total cellular protein extracts suitable for
2-D electrophoresis (depending on sample type,
additional cell lysis protocols may be needed when
using this kit)
Other ReadyPrep protein extraction kits facilitate
extraction of specific classes of proteins and are
discussed later in this chapter
Such standardized lysis and extraction protocols
are often useful for initial proteomic analyses and
Products for cell lysis and protein ex traction. A number of other
ReadyPrep protein extraction kits facilitate disruption and extraction
of specific classes of proteins.
for consistent sample preparation.
1
For added convenience, the extraction buffer included with these kits can also be used as the sample solution for IEF with the
MicroRotofor cell or with IPG strips.
ReadyPrep Mini Grinder
MicroRotofor Lysis Kit
ReadyPrep Protein Extraction Kit
Protein Solubilization
Proteins in a biological sample are often associated
with other proteins, integrated into membranes, or
parts of large complexes. Protein solubilization is the
process of breaking interactions involved in protein
aggregation (Rabilloud 1996), which include disulfide
and hydrogen bonds, van der Waals forces, and ionic
and hydrophobic interactions. If these interactions are
not disrupted, proteins can aggregate or precipitate,
resulting in artifacts or sample loss. For successful
2-D electrophoresis, proteins must be well solubilized.
Sample lysis solutions typically contain a number
of compounds that meet the requirements, both
electrically and chemically, for compatibility with IEF.
To allow high voltages to be applied during IEF without
producing high currents, the compounds must not
increase the ionic strength of the solution. In some
cases, it may be necessary to prepare samples using
additives that facilitate protein solubilization but that
have limited compatibility with IEF (for example, salts
and SDS). In these cases, the potentially interfering
substance must be removed prior to sample
application, or actions must be taken to mitigate its
effect (see the Removal of Interfering Substances
section). See Chapter 9 for sample preparation
procedures and solutions; for a thorough discussion
of solubilization methods, refer to Rabilloud (2000).
Chaotropic Agents
These compounds disrupt hydrogen bonds and
hydrophobic interactions both between and within
proteins. When used at high concentrations,
chaotropic agents disrupt secondary protein
structure and bring into solution proteins that are
otherwise insoluble. The neutral chaotropic agent
urea is used at 5–9 M, often with up to 2 M thiourea,
which can dramatically increase the number of
proteins solubilized (Rabilloud et al. 1997). Thiourea
is weakly soluble in water but more soluble in high
concentrations of urea; therefore, a mixture of 2 M
thiourea and 5–8 M urea is used when strongly
chaotropic conditions are required. Charged
chaotropic agents such as guanidine hydrochloride
are incompatible with IEF.
If using thiourea during sample preparation, also add it
to the first-dimension rehydration solution; otherwise,
the proteins that require thiourea for solubility will
come out of solution during IEF.
Urea and thiourea can hydrolyze to cyanate and
thiocyanate, respectively; these products modify
amino groups on proteins (carbamylation) and give
rise to artifactual charge heterogeneity. Since heat
promotes this hydrolytic reaction, never heat ureaor thiourea-containing solutions above 37°C in the
presence of protein (McCarthy et al. 2003).
Detergents
Detergents disrupt hydrophobic interactions between
and within proteins and are classified as neutral,
zwitterionic, anionic, and cationic (Luche et al. 2003).
Some proteins, especially membrane proteins, require
detergents for solubilization during isolation and for
maintaining solubility during IEF.
Sample preparation for 2-D electrophoresis commonly
uses neutral or zwitterionic (having both positive and
negative charges resulting in a neutral net charge)
detergents at concentrations of 1–4%, since these
detergents do not introduce a net charge and therefore
allow proteins to migrate at their own charges during
IEF. Examples of neutral detergents include Tween,
octylglucoside, dodecyl maltoside, Triton X-100, and
Triton X-114. Examples of zwitterionic detergents
include CHAPS, CHAPSO, ASB-14, and SB 3-10.
In practice, only a few detergents are used in IEF
(Table 2.2). With few exceptions, only a single
detergent should be used because the effects of
detergents are not additive and can be unpredictable
in combination. Anionic and cationic detergents
are generally not suitable for IEF.
SDS is unparalleled in its ability to efficiently
and rapidly solubilize proteins. Although SDS is
incompatible with IEF as an anionic detergent, it can
be used in the initial preparation of concentrated
protein samples. In these cases, another IEFcompatible detergent must be used in excess to
disrupt the binding of SDS to protein (Ames and
Nikaido 1976). Also to be considered is how the
detergent interacts with high concentrations of
urea. When using SB 3-10, for example, the urea
concentration is limited to 5 M, but ASB-14 can be
used with 9 M urea (Chevallet et al. 1998).
14 15
Page 10
2-D Electrophoresis Guide Theor y and Product Selection
Chapter 2: Sample Preparation
Reducing Agents
Reducing agents cleave disulfide bond crosslinks within and between protein subunits, thereby
promoting protein unfolding and maintaining proteins
in their fully reduced states. The compounds used
for 2-D sample preparation are either sulfhydryl or
phosphine reducing agents. Examples of sulfhydryl
reductants include dithiothreitol (DTT), dithioerythritol
(DTE), and b-mercaptoethanol (BME). DTT and
DTE can be used at lower concentrations than
b-mercaptoethanol and are more commonly used, but
high concentrations of DTT can affect the pH gradient
since its pKa is around 8. Examples of phosphine
reductants include tributylphosphine (TBP) and Triscarboxyethylphosphine (TCEP). These reducing agents
can be used at lower concentrations and over a wider
pH range than the sulfhydryl reductants; however,
their use is limited by low solubility and instability (TBP)
or a highly charged characteristic (TCEP).
HS
–S– S–
–S– S–
SH
SH
Reducing agents added during protein extraction help
to solubilize proteins; during IEF, however, reducing
agents such as DTT become depleted from the basic
end of pH gradients extending above pH 8, which can
cause proteins to aggregate and precipitate (Hoving
et al. 2002). The result is streaking and other random
spot patterns, particularly in the alkaline regions of
the IPG strip (Herbert et al. 2001). To address this
problem, proteins can be reduced with TBP and then
irreversibly alkylated with iodoacetamide (Figure 2.1).
This treatment blocks protein sulfhydryls and prevents
proteins from aggregating and precipitating due to
oxidative cross-linking, ensuring that proteins remain
soluble throughout electrophoresis (Figure 2.2).
O
S
H
N
2
O
HS
S
O
S
S
O
N
2
NH
H
2
NH
2
pH 3 pH 10
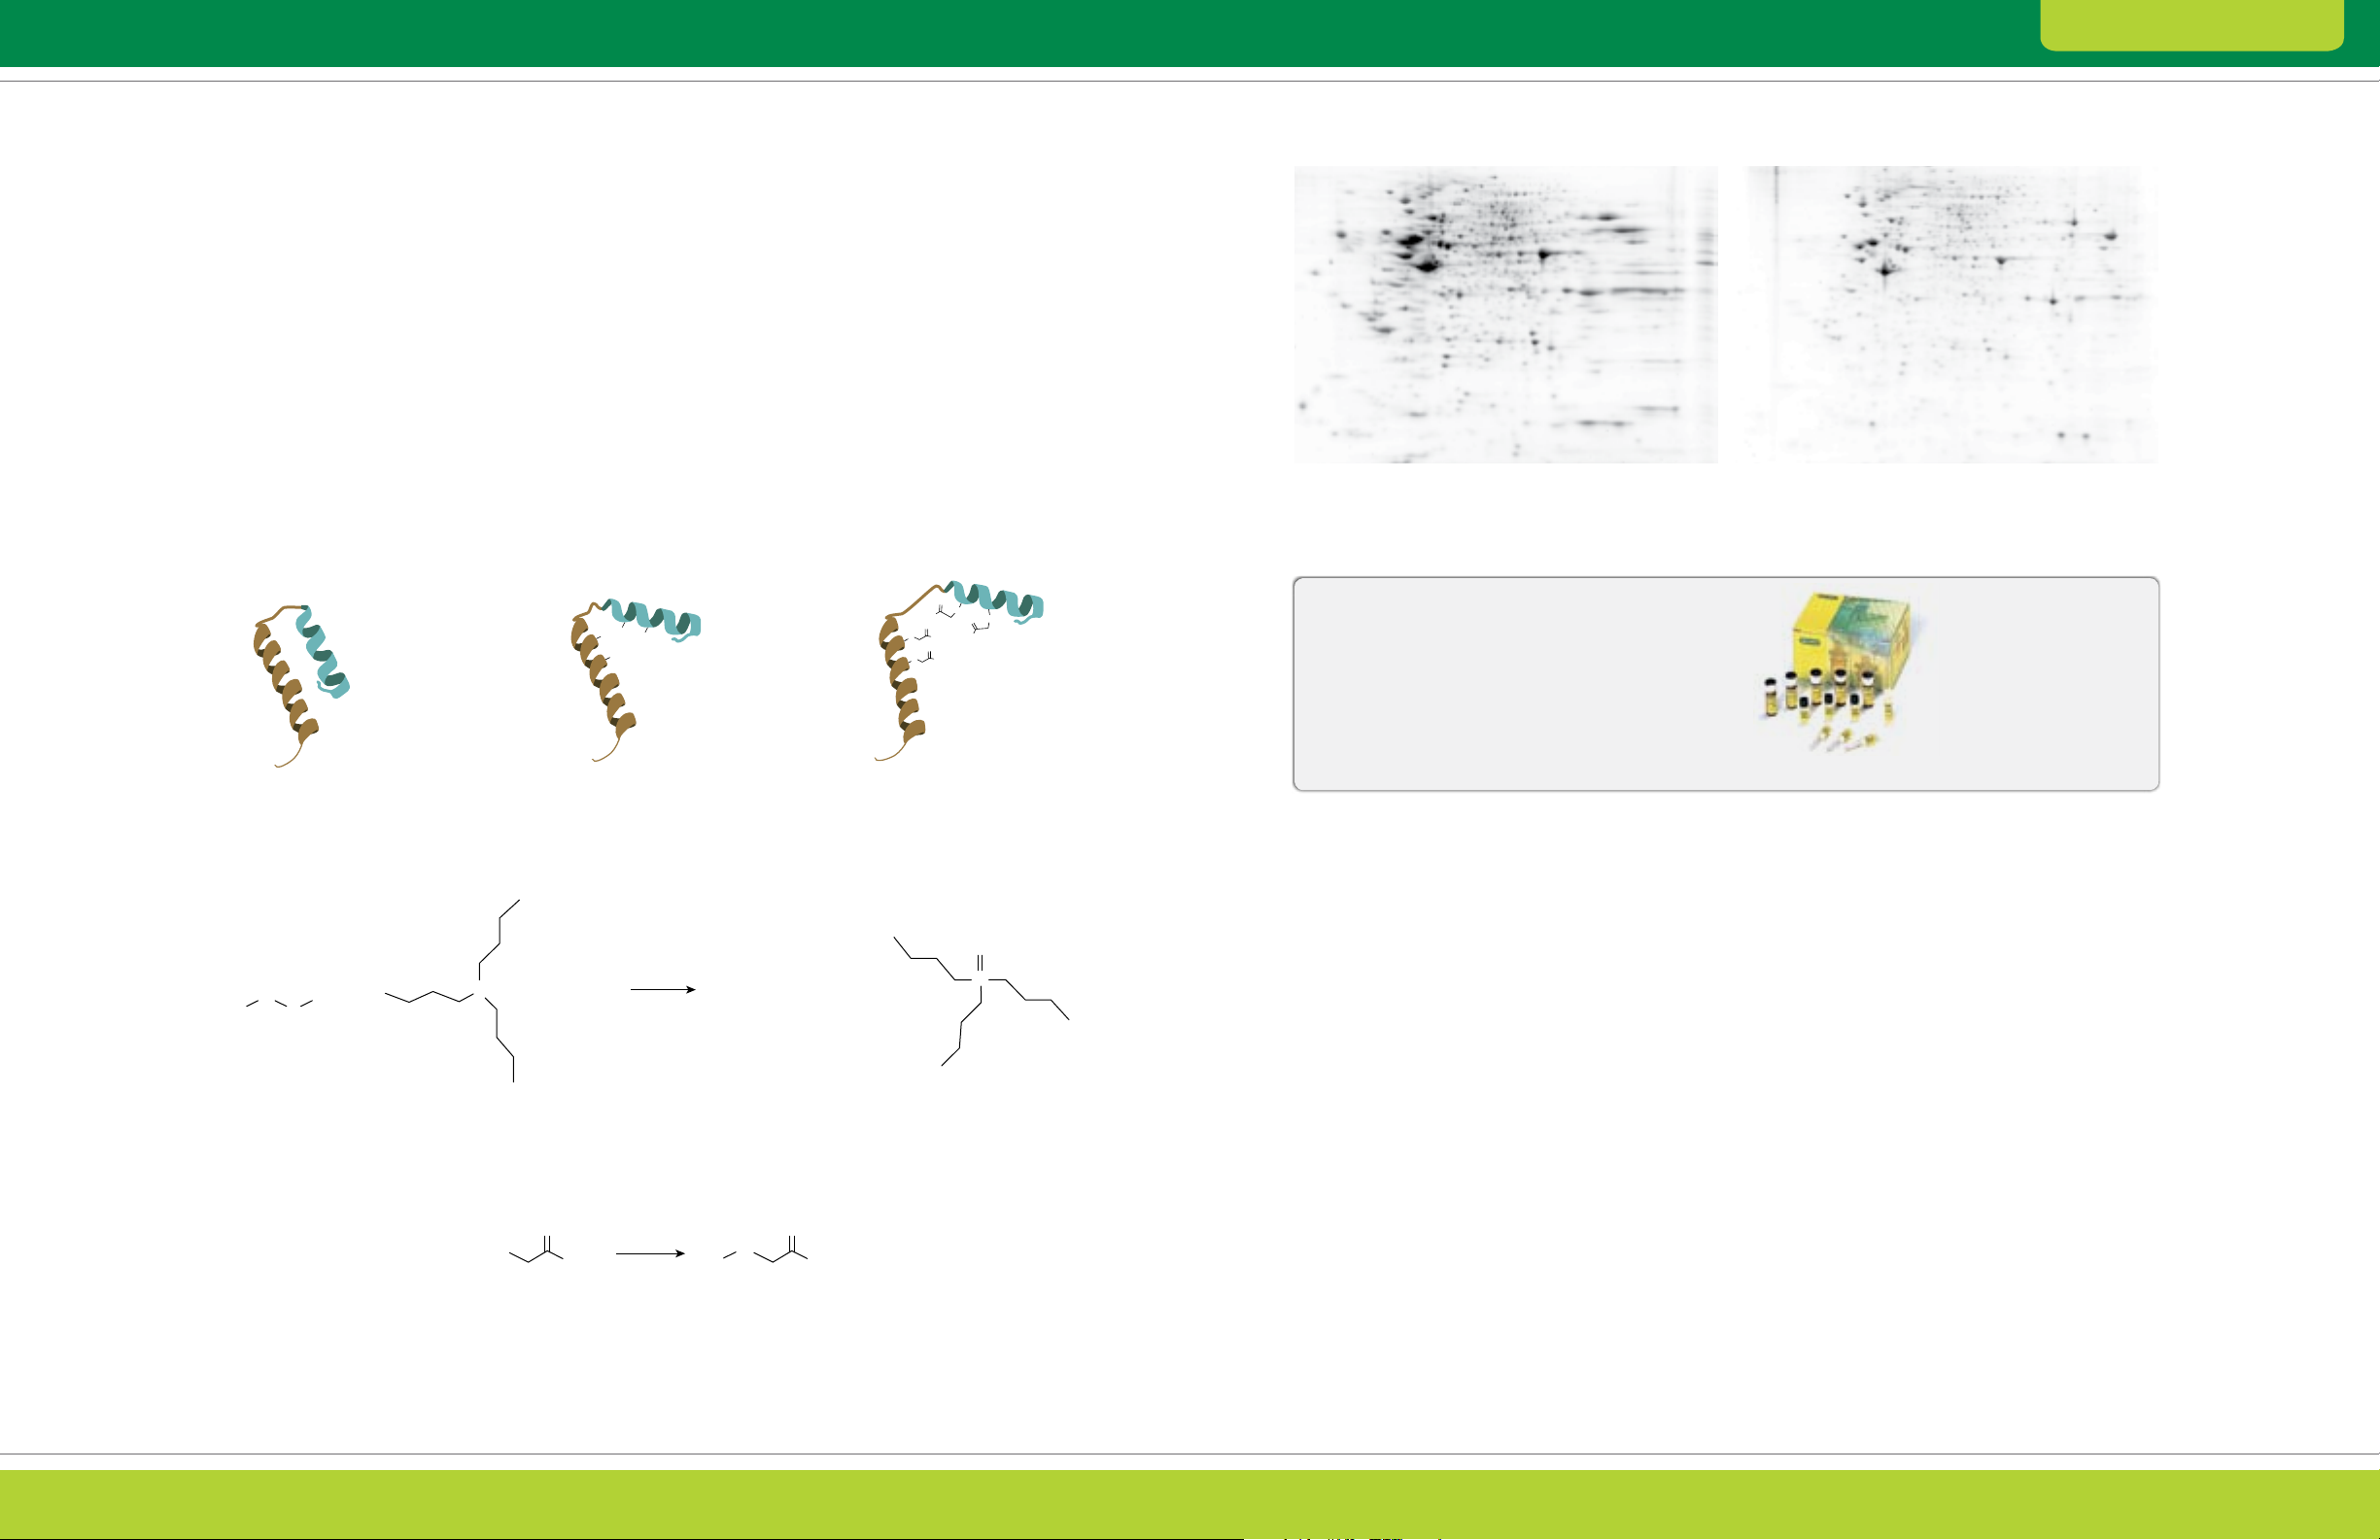
Fig. 2.2. Effect of treatment with the ReadyPrep reduction-alkylation kit. Human HeLa cell extract (100 µg) separated by 2-D
electrophoresis (first dimension on 11 cm ReadyStrip
™
Flamingo
than the untreated sample (left), especially in the basic range of the gel.
protein gel stain. The sample treated with the ReadyPrep reduction alkylation kit (right) and shows much better spot resolution
Untreated
™
IPG strips pH 3–10, second dimension using 12% Criterion™ gels) and stained with
pH 3 pH 10
ReadyPrep reduction-alkylation kit
ReadyPrep Reduction-Alkylation Kit
Bio-Rad’s ReadyPrep reduction-alkylation kit
provides the reagents for reduction and alkylation of
sample proteins prior to IEF. Its use produces a 2-D
pattern with more spots, fewer streaks, and greater
reproducibility.
Protein with disulfide bridges
S R
R
S
1
Disulfide Tributylphosphine Thiols
+ +
2
P
Reduction cleaves disulfide bridges
and allows unfolding
H2O
Reduction
R
1
O
R—SH
Thiol Iodoacetamide Alkylated thiol
I
+ + HI
NH
2
S
R
Alkylation with iodoacetamide prevents
disulfide bridges from reforming
—SH + R2—HS +
O
NH
2
O
P
Tributylphosphine oxide
Ampholytes, Buffers, and Other Additives
Sample solution components that modify pH or
impart ionic strength affect the solubilization of
proteins during sample preparation and strongly
influence 2-D electrophoresis.
Carrier ampholyte mixtures increase both buffering
power and ionic strength. Unlike non-ampholytic
ions, they do not interfere with IEF and can, in fact,
improve protein solubility by “salting in” proteins
that are otherwise insoluble under IEF conditions.
In addition, carrier ampholytes can diminish proteinmatrix interactions, which tend to occur at the basic
end of an IPG strip and lead to streaking caused
by precipitation (Righetti and Gianazza 1987).
Carrier ampholytes are routinely added to solutions
used during IEF with IPG strips and can be of value
during protein extraction as well.
ReadyPrep Reduction-Alkylation Kit
Since proteins are often more soluble and proteases
are less active at higher pH, a base such as Tris may
be included in a lysis solution to elevate pH.
Many proteins also require ions in solution for optimum
solubility. Normally, this is achieved by adding salt
to the sample solution; however, adding salt prior to
IEF increases conductivity and consequently limits
the voltage at which IEF can be performed until the
salt is eventually removed from the system. Ions also
leave the IPG strip during IEF, causing any protein
requiring ions for solubility to precipitate. Proteins also
become less soluble as they approach their pI; they
may precipitate at their pI in a phenomenon known as
isoelectric precipitation or pI fallout.
Alkylation
Fig. 2.1. Reduction and alkylation.
16 17
Page 11

2-D Electrophoresis Guide Theor y and Product Selection
Chapter 2: Sample Preparation
Table 2. 2. S ummary of compoun ds used in 2-D elec tro phoresi s sample so lutions . Refer to Ordering Information (Appendix C) for c atalog
numbers and details of options available for purchase.
Role in Concentration
Compound or product Solution Range Comments
Urea Chaotrope 5–9.5 M Present during first-dimension IEF
Thiourea Chaotrope 2 M Used with urea, usually in the combination 7 M urea, 2 M thiourea;
CHAPS Detergent 1–4% (w/v) Zwitterionic detergent that may enhance protein solubility with minimal
CHAPSO Detergent 1– 4% (w/v) Zwitterionic detergent similar to CHAPS
NP-40 Detergent 0.5–1% (w/v) Neutral detergent originally used in 2-D electrophoresis (O’Farrell 1975,
Triton X-100 Detergent 0.5–1% (w/v) Neutral detergent similar to NP-40 also used for 2-D sample
SB 3 -10 Deter ge nt 1–2% (w/v) Zwitterionic detergent shown in some cases to give better solubilization
ASB-14 Detergent 1–2% (w/v) Zwitterionic detergent developed for solubilization of membrane
ASB-C8Ø Detergent 1–2% (w/v) Zwitterionic detergent developed for solubilization of membrane
Sodium dodecy l sulfate Detergent Up to 2% (w/v) Anionic detergent widely used in sample preparation for
(SDS) during sample electrophoresis and unparalleled in its ability to solubilize protein;
preparation, no more also effective at inactivating proteases and other undesirable
than 0.2% (w/v) enz ymatic activities. It is, however, incompatible with IEF unless
during IEF diluted to 0.2% or less and used with at least an eightfold excess of
Dithiothreitol (DTT) Reductant 20–60 mM Most commonly used sulfhydryl reductant for 2-D electrophoresis
b-Mercaptoethanol Reductant 1–5% (v/v) Sulfhydryl reductant originally used for 2-D electrophoresis (O’Farrell
Tributylphosphine (TBP) Reductant 2 mM Phosphine reductant effective at low concentrations and repor ted
Tris-carboxyethylphosphine Reductant 2–40 mM Phosphine reductant that may be useful during sample preparation;
(TCEP) it is highly charged and so is not recommended as the sole reductant
Tris Base 10–40 mM (Unbuf fered) free base often added to sample preparation solutions to
®
Bio-Lyte
ampholytes Carrier 0.2–1.0% (w/v) Carrier ampholytes may be used during sample preparation to
ampholy te enhance protein solubility. Although IEF with IPG strips does not
more effective than urea alone for solubilizing hydrophobic or high
molecular weight proteins
disruptive effect on 2-D electrophoresis (Perdew et al. 1983)
Görg et al. 1988); its use has been largely superseded by CHAPS
(Görg et al. 20 04)
preparation (Kawaguchi and Kuramitsu 1995)
than CHAPS; insoluble in higher concentrations of urea and generally
used with 5 M urea, 2 M thiourea (Rabilloud et al. 1997)
proteins to be analy zed by 2-D electrophoresis (Chevallet et al. 1998)
proteins to be analyzed by 2-D electrophoresis (Chevallet et al. 1998)
an IEF-compatible detergent such as CHAPS
1975); must be used at a relatively high concentration and can cause
disturbances to IEF, so is rarely used
to enhance solubilization of recalcitrant samples (Herbert et al.
1998). It has low water solubility and is unstable and therefore not
recommended as the sole reductant for first-dimension IEF
present during first-dimension IEF
raise the pH to a range where proteolysis is minimal and proteins are
optimally soluble. Other bases (for example, potassium carbonate or
spermine) are occasionally used as well (Rabilloud 1999). If Tris is used
during sample preparation, it should be diluted to 20 mM or less for
first-dimension IEF, as it may cause disturbances in the basic pH range
require carrier ampholytes for pH gradient generation, the presence
of a relatively low (0.2% [w/v]) conce ntration of carr ier ampholy te
is essential for optimum resolution. Use pH 3–10 ampholy tes
or ampholytes appropriate to the IPG strip pH range
Removal of Interfering Substances
Impurities such as ionic detergents, lipids, nucleic
acids, salts and other ionic compounds, and
even high-abundance proteins can impact a 2-D
electrophoresis experiment by interfering with protein
separation or by obscuring proteins of interest.
These interfering substances can be endogenous
(for example, phenolics, lipids, and nucleic acids) or
exogenous (added during sample preparation; for
example, salts and detergents). Either way, removing
these impurities prior to analysis or mitigating their
effect is often essential for good results.
General Considerations
Though removal or mitigation of interfering
substances often yields clearer 2-D patterns and
improves resolution of protein spots, any treatment
of the sample can reduce yield and alter the relative
abundance of sample proteins. Procedures for
the removal of interfering substances represent
a compromise between removal of non-protein
contaminants and minimal interference with the
integrity and relative abundance of the sample
proteins. Since proteomics aims to study the
relationship among proteins in their natural state, it
is important to remove an interfering substance only
when necessary and by using techniques appropriate
for the sample.
Protein precipitation is a common general method
for contaminant removal. Conditions are chosen
under which sample proteins are selectively
precipitated while leaving soluble the major nonprotein contaminants. Following centrifugation, the
precipitated proteins are resuspended in a solution
suitable for IEF. Methods used in sample preparation
for 2-D electrophoresis include precipitation with
TCA and acetone (Damerval et al. 1986, Görg et al.
1988) and precipitation with methanol and chloroform
(Wessel and Flügge 1984). Precipitation procedures
also have the benefit of concentrating sample
protein, which is often necessary for effective
sample application.
Individual types of interfering contaminants cause
specific problems and can be removed or mitigated
in different ways. The most prevalent interfering
contaminants and their removal methods are
discussed next.
Nucleic Acids (DNA and RNA)
Nucleic acids, particularly DNA, can interfere with
IEF (for example by clogging gel pores) and increase
sample viscosity, thus limiting the effectiveness of cell
lysis and sample application. Because smaller nucleic
acids are generally tolerated better, strategies to
reduce nucleic acid interference involve either
shearing or enzymatic digestion: sonication shears
DNA and renders the sample less viscous, and
addition of nuclease digests nucleic acids to
oligo- or mononucleotides.
Nucleases are often employed during sample
preparation, particularly with bacterial lysates in
which nucleic acid:protein ratios are high. Successful
application of nuclease treatment requires attention
to three factors:
Nucleases may be inactive under the strongly
denaturing conditions often used to prepare protein
samples for 2-D electrophoresis
DNase requires magnesium ions for activity
Nucleases are proteins and can appear in the
2-D pattern as extra spots
Benzonase is a nuclease with properties that make
it particularly useful in sample preparation for 2-D
electrophoresis (Chan et al. 2002). It is active in
the presence of urea, and the amount required for
treatment is usually not visible in a 2-D gel. It is
applied in the presence of 1 mM MgSO
or MgCl2.
4
The magnesium ions are subsequently sequestered
with EDTA in order to inhibit proteases that may require
metal ions for activity.
18 19
Page 12

2-D Electrophoresis Guide Theor y and Product Selection
Chapter 2: Sample Preparation
Polysaccharides
Polysaccharides can interfere with electrophoresis by
clogging gel pores and by forming complexes with
proteins. Like nucleic acids, they can also cause a
sample to be viscous, making it difficult to work with.
Polysaccharides are a particularly prominent problem
with plant-derived samples.
Centrifugation may be used to remove high molecular
weight polysaccharides. Phenol extraction, followed
by precipitation with ammonium acetate in methanol,
is a commonly used method that is very effective
at removing polysaccharides in plant samples
(Hurkman and Tanaka 1986, Wang et al. 2008).
Phenolic Compounds
Phenolic compounds are found in all plants and
in some microorganisms and they can modify
proteins in an enzyme-catalyzed oxidative reaction.
The modification can cross-link proteins together or
render them insoluble. The reaction can be prevented
with reductants such as DTT, b-mercaptoethanol,
or ascorbic acid, and the enzyme is inactivated
by thiourea. Phenolic compounds may also be
removed from the extract using the ReadyPrep
2-D cleanup kit (see the Products for Contaminant
Removal sidebar) or by including polyvinylpyrrolidone
(PVP) or polyvinylpolypyrrolidone (PVPP) in the
extraction solution. These compounds bind phenolic
compounds, and the precipitated complex can
be removed from the extract by centrifugation
(Toth and Pavia 2001). The phenol extraction
Lipids
Lipids can form insoluble complexes with proteins,
but lipids can also complex with detergents, thereby
reducing the detergents’ effectiveness at solublilizing
protein. The effect of lipids can be minimized by
using excess detergent (for example, 4% CHAPS in
the lysis solution when preparing lipid-rich tissues
such as brain). Precipitation methods that employ
organic solvents (Damerval et al. 1986, Görg et al.
1988, Wessel and Flügge 1984) or the ReadyPrep 2-D
cleanup kit can also be used to remove lipids.
Salts and Other Small Ionic Compounds
IEF requires samples that are free of salts and other
small ionic compounds that may interfere with pH
gradient formation. Salts formed from strong acids
and strong bases (for example, NaCl) dissociate into
their component base and acid, which is eventually
drawn to either end of the IPG strip. Until this occurs,
the conductivity of the IPG strip remains high and the
voltage attained is low. The flow of ions from the IPG
strip is accompanied by water flow, and one end of
the strip may dry out, breaking electrical contact.
Weak acids and weak bases (for example, acetate,
Tris, or ammonium ions) may not completely leave the
IPG strip during focusing. These compounds interfere
with the pH gradient, resulting in streaking and loss
of resolution at one end of the pH range or the other
(Figure 2.3). Amphoteric buffers such as HEPES can
focus within the pH gradient, resulting in a portion of
the pH gradient where proteins focus poorly.
procedure described above (see Polysaccharides)
is also effective at removing phenolic contaminants
(Hurkman and Tanaka 1986, Wang et al. 2008).
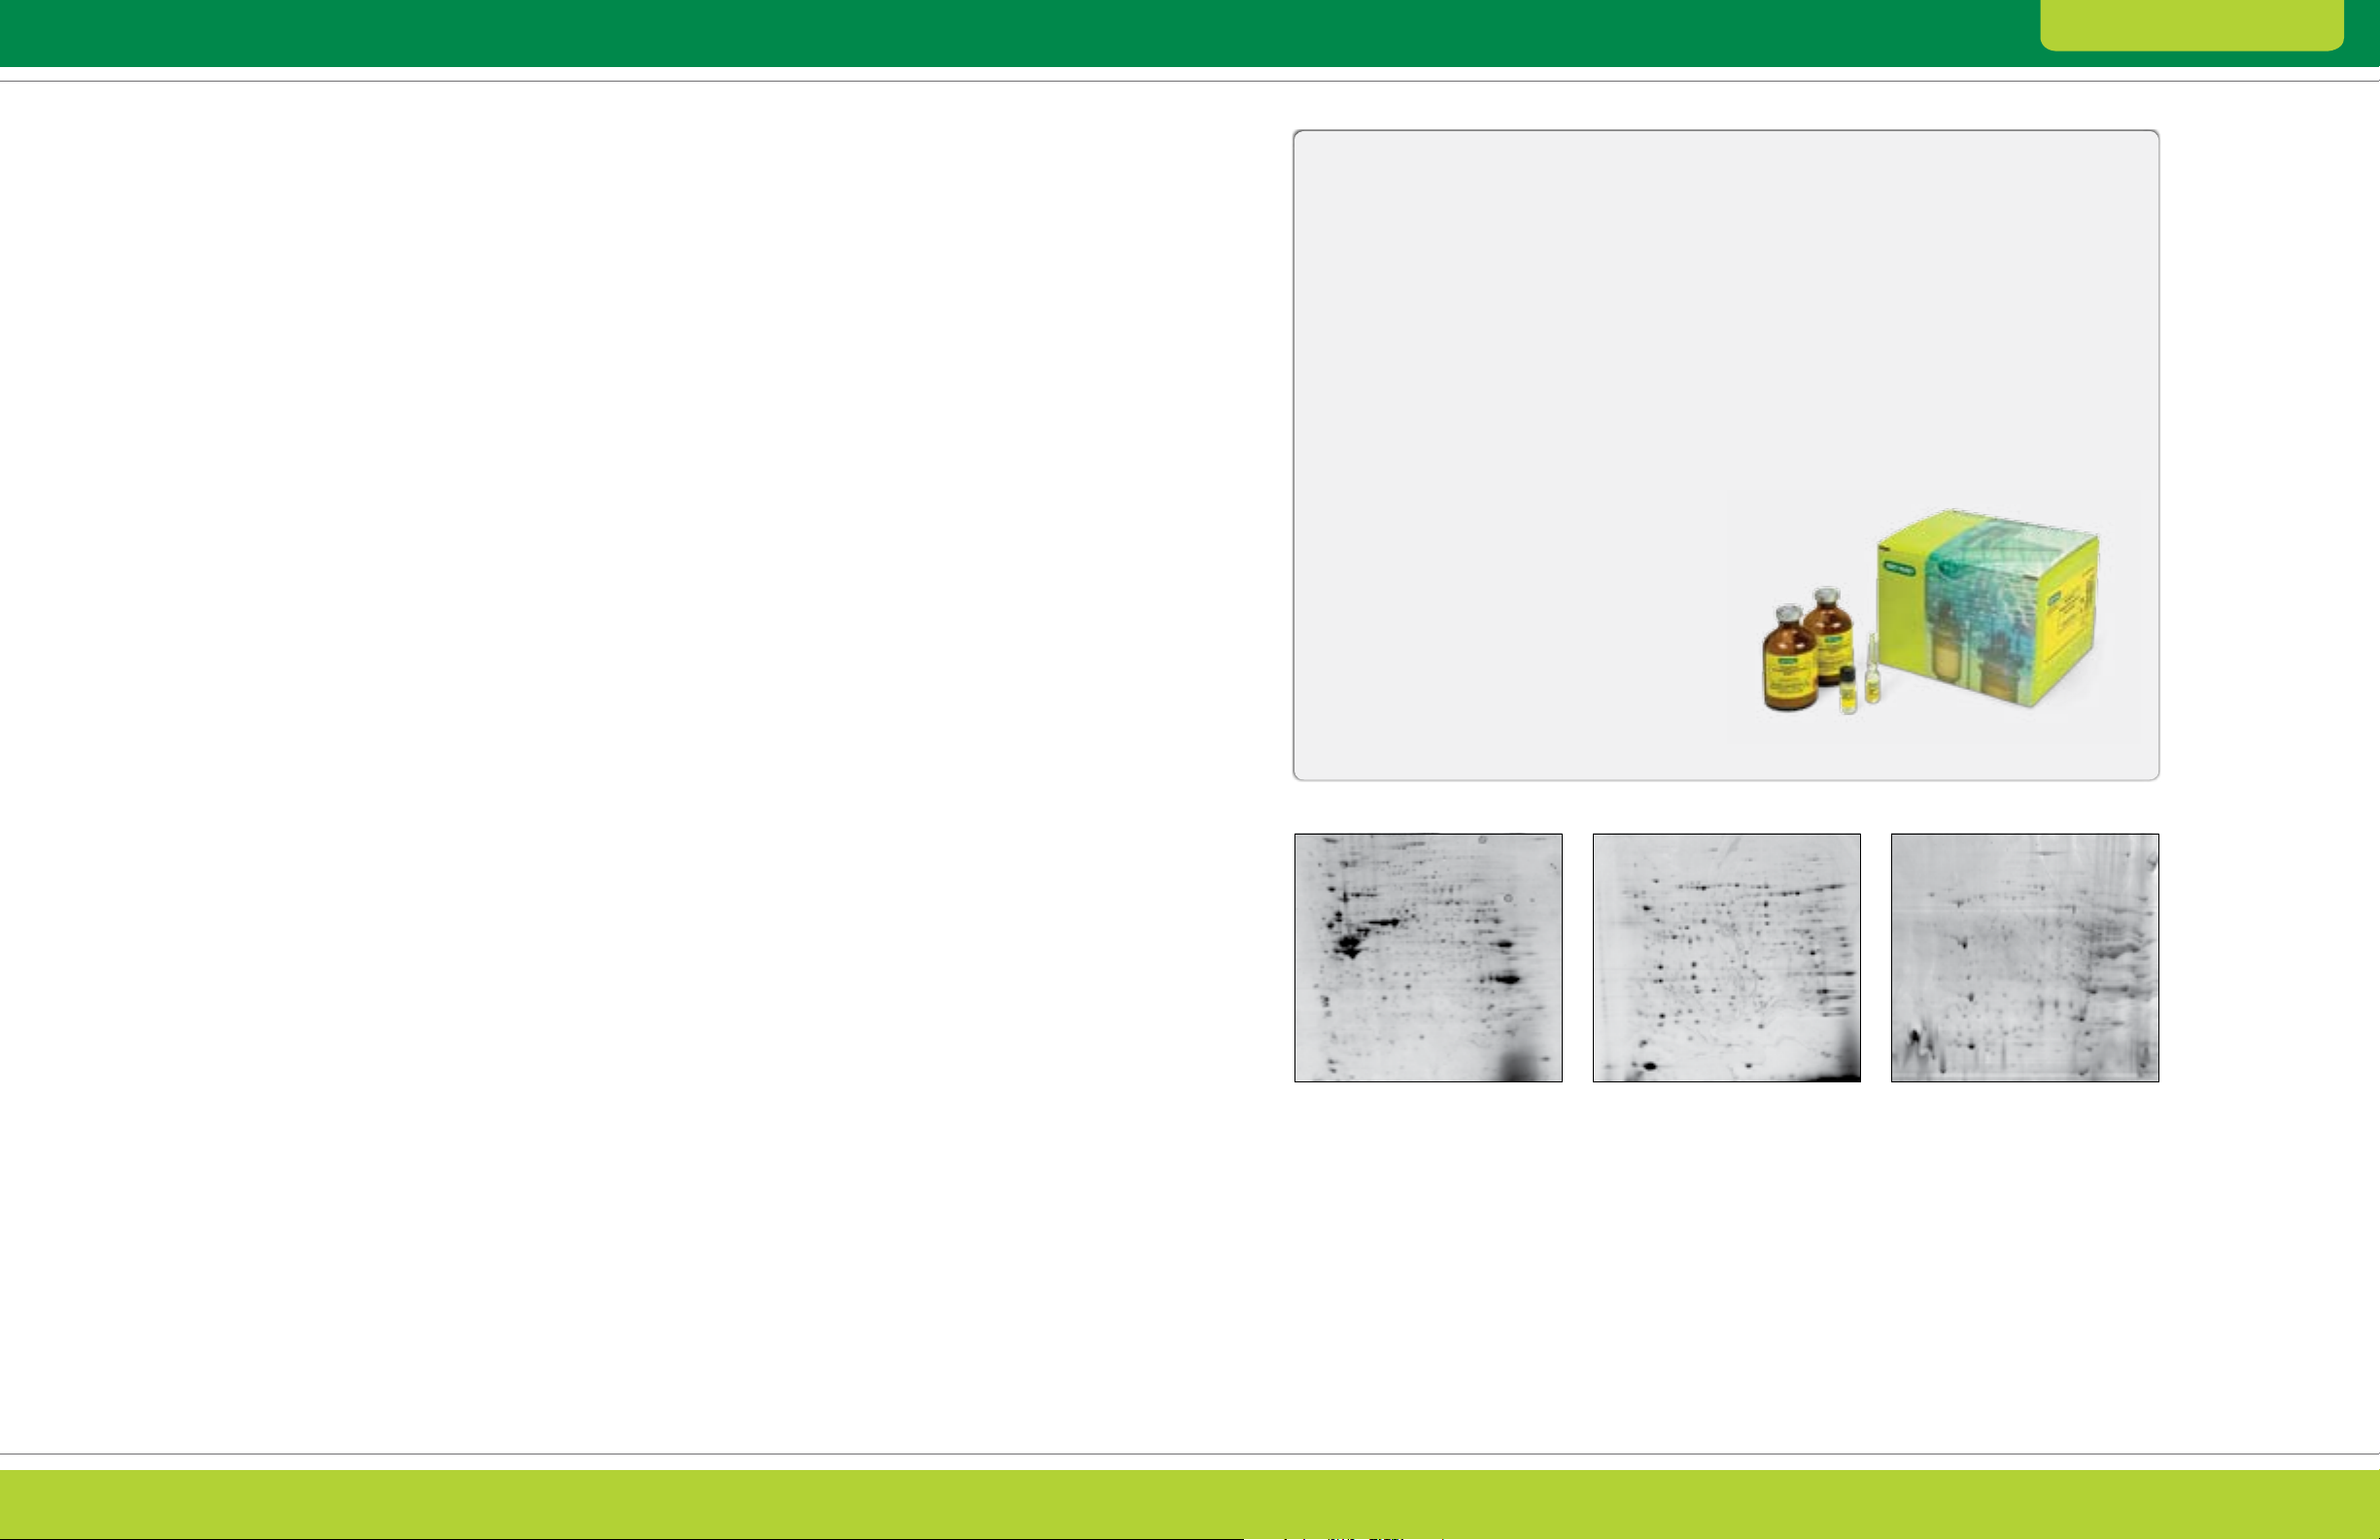
Before
Fig. 2.3. Effect of salt removal. E. coli extracts containing 1 M NaCl were separated by 2-D ele ctrophoresis before and after treatment with
the ReadyPrep 2-D cleanup kit. The sample s were focused using 11 cm ReadyStrip pH 3 –10 IPG strips and then separated on Criterion 8–16%
Tris-HCl precast gels.
After
Samples of low ionic strength are desired, yet many
samples contain salts and small ionic compounds that
are either intrinsic to the sample type or have been
introduced during sample preparation. Precipitation
and dialysis methods are very effective at removing
ionic contaminants, as is treatment with a desalting
column (Chan et al. 2002).
Prevention of Keratin Contamination
Skin keratin is a common contaminant of 2-D gels
and mass spectra. It may appear in silver-stained and
fluorescently stained 2-D gels as an artifact focusing
near pH 5 in the 50 –70 kD region, or as an irregular
but distinctive vertical streaking parallel to the
SDS-PAGE direction of migration. The best remedy
for this keratin artifact is to avoid introducing it into the
sample in the first place. Filter all monomer solutions,
stock sample buffers, gel buffers, and electrode
buffers through nitrocellulose and store them in
sealed containers; then, clean the electrophoresis
cell thoroughly with detergent. Above all, careful
sample handling is important when sensitive detection
methods are used, and gloves should be worn while
handling samples, solution, or equipment.
Products for Contaminant Removal
For quick and effective contaminant removal,
Bio-Rad offers:
ReadyPrep 2-D cleanup kit, which uses an
optimized version of a TCA-sodium deoxycholate
coprecipitation procedure (Arnold and UlbrichHoffmann 1999) to quantitatively precipitate
proteins while removing most interfering
substances. The protein precipitation process
also enables concentration of proteins from
samples that are too dilute, allowing for higher
protein loads that can improve spot detection
Bio-Spin® 6 and Micro Bio-Spin™ 6 columns
are ready to use and are filled with Bio-Gel
P-6 support for the quick desalting and buffer
exchange of protein samples
®
ReadyPrep 2-D Cleanup Kit
5 cm
Bio- Spin Column
End cap
Reservoir
3.7 cm working bed height
1.2 ml bed volu me
Porous 30 µm
polyethylene bed
support retains
fine particles
Luer end fitting
with snap-off tip
3 cm
2 cm working bed height
Micro Bio-Spin Column
End cap
Reservoir
0.8 ml bed volume
Luer end fitting
with snap-off tip
20 21
Page 13
2-D Electrophoresis Guide Theor y and Product Selection
Prefractionation
Proteomic analysis is often applied to samples that
have undergone prior fractionation (prefractionation),
and the reasons for this are varied. In cases where
only a defined subset of the proteome is under
study, prefractionation can increase the chances
of meaningful discovery by removing proteins not
likely to be of interest from the sample. For example,
in studies of mitochondrial processes, it is sensible
to perform the proteomic analysis on a subcellular
fraction enriched in mitochondria. In other cases,
specific proteins of interest may be enriched through
fractionation and analyzed by 2-D electrophoresis
in the absence of potentially interfering proteins.
Prefractionation can also be used to separate a
sample into multiple fractions of lower complexity
that can then be analyzed separately; this can
enable identification of lower-abundance proteins
that might otherwise be undetectable in the
unfractionated sample.
Prefractionation increases the depth of proteome
analysis, but it does so at the expense of a greater
workload and reduced throughput. Try to use a
fractionation method that generates minimal protein
overlap between fractions.
Proteins can be fractionated by a number of different
techniques. The choice of method depends on
the sample, experimental goals, and available
instrumentation:
Chemical and centrifugal methods —
use of selective precipitation or selective extraction
or centrifugation steps to separate proteins or
partition different subcellular compartments.
In many instances, protein extraction protocols
can incorporate fractionation steps through the
selective use of certain chemical reagents
Electrophoretic methods — application of
liquid-phase IEF or preparative SDS-PAGE with
the goal of protein enrichment. Though neither
of these techniques is orthogonal to either of the
two dimensions employed in 2-D electrophoresis
and neither offers additional resolving power to
the analysis, electrophoresis has proven useful in
allowing the enrichment of low-abundance proteins.
Chromatographic methods — use of
chromatographic separation principles to enrich
low-abundance proteins or generate fractions of
reduced complexity (Fountoulakis et al. 1997,
Badock et al. 2001, Butt et al. 2001, Smith et al.
2004, Qin et al. 2005, Yuan and Desiderio 2005).
Virtually any chromatographic procedure can be
used as a prefractionation step; examples include
size exclusion, affinity, ion exchange, and reversephase resins
Using these methods alone or in combination, proteins
can be separated upstream of 2-D electrophoresis
(prefractionated) by their physical or chemical
properties, as described below. Some of these
methods, however, may introduce ionic or other
contaminants that must be removed before IEF.
Also, increasing the number of sample handling steps
may increase variability and the risk of sample loss.
Fractionation by Subcellular Location
There are many techniques for preparing fractions
enriched in subcellular organelles or membrane
types, and there are several examples in which these
techniques have been used to prepare samples for
2-D electrophoresis and other proteomic analyses
(Huber et al. 2003). Methods for organellar
fractionation generally involve differential and density
gradient centrifugation (Stasyk et al. 2007, Fialka et
al. 1997). However, fractionation schemes involving
aqueous polymer phase separation (Tang et al.
2008) and free-flow electrophoresis (Zischka et al.
2003, Eubel et al. 2008) have been described for this
purpose as well. These methods are usually specific
for the source material (cells or tissue). In some cases,
fractions representing different subcellular sites can
be generated on the basis of solubility under different
conditions (see the Fractionation by Solubility/
Hydrophobicity section). These methods are
more general in application.
Bio-Rad offers several ReadyPrep protein extraction
kits for the isolation of fractions enriched in integral
membrane and transmembrane proteins (Figure 2.4),
as well as nuclear and cytoplasmic proteins (see the
Products for Fractionation by Subcellular Location
sidebar).
Products for Fractionation by
Subcellular Location
Each of the following kits produces a fraction
with a distinct protein composition:
ReadyPrep protein extraction kit (signal) takes
advantage of the limited solubility of plasma
membrane microdomain structures (for example,
lipid rafts and caveolae) in nonionic detergents
at 4°C to yield a protein pellet that is enriched
in membrane-associated signalling proteins,
including glycophosphatidylinositol (GPI)-anchored
proteins, caveolin and associated proteins,
acetylated tyrosine kinases, and G proteins
(Simons and Ikonen 1997)
ReadyPrep protein extraction kits (membrane I and
membrane II) use different techniques to isolate
integral membrane and membrane-associated
proteins without the need for density gradients.
The membrane I kit is based on temperaturedependent partitioning of hydrophobic proteins
into the detergent-rich phase of a Triton X-114/
water two-phase system (Bordier 1981, Prime
et al. 2000, Santoni et al. 2000). It is a quick
and effective protocol for enriching membrane
proteins without the need for ultracentrifugation.
More complex membrane proteins (those with
A
Fig. 2.4. Differences in 2-D patterns obtained using ReadyPrep protein extraction kits: signal (A), membrane I (B), and membrane II (C)
kits. Mouse liver samples were extracted using each kit, and purified proteins we re separated using 17 cm ReadyStrip pH 3 –10 NL IPG strips
and 8–16% gels. Overall spot patterns dif fer for A, B, and C even though all three kits isolate membrane proteins, indicating that e ach kit isolates
different sets of proteins.
B
Chapter 2: Sample Preparation
larger numbers of transmembrane domains) are
better isolated using the membrane II kit, which
enriches integral membrane proteins by treating
a membrane preparation with sodium carbonate
(Fujiki et al. 1982, Molloy et al. 2000); this protocol
requires ultracentrifugation
ReadyPrep protein extraction kit (cytoplasmic/
nuclear) uses a proprietary buffer and differential
centrifugation to isolate intact nuclei and a strongly
chaotropic extraction buffer to quickly prepare
highly enriched fractions of cytoplasmic and
nuclear proteins from eukaryotic samples
ReadyPrep Protein Extraction Kit
C
A protein in a size- or pI-enriched fraction can be
subjected to 2-D electrophoresis at a higher amount
relative to the unfractionated sample, allowing the
analysis of proteins present below detection levels
(Zuo and Speicher 2000, Fountoulakis and
Juranville 2003)
22 23
Page 14
2-D Electrophoresis Guide Theor y and Product Selection
Chapter 2: Sample Preparation
Products for Fractionation by
Solubility/Hydrophobicity
ReadyPrep sequential extraction kit is based on
a published method (Molloy et al. 1998) that uses
sequentially more highly solubilizing chaotrope
and detergent mixtures. Applying each extracted
fraction to a separate gel allows the resolution of
more protein spots
ReadyPrep protein extraction kit (soluble/insoluble)
uses a different set of detergents to fractionate
proteins on the basis of their solubility in detergents
The ReadyPrep sequential extraction kit and the
ReadyPrep protein extraction kit (soluble/insoluble)
can be used either independently or sequentially for
even greater depth of coverage.
Protein
sample
ReadyPrep
reagent 1
Collect supernatant 1
Reagent 2
Step 1
Insoluble pellet
from reagent 1
ReadyPrep
reagent 2
Step 2
Insoluble pellet
from reagent 2
Collect supernatant 2
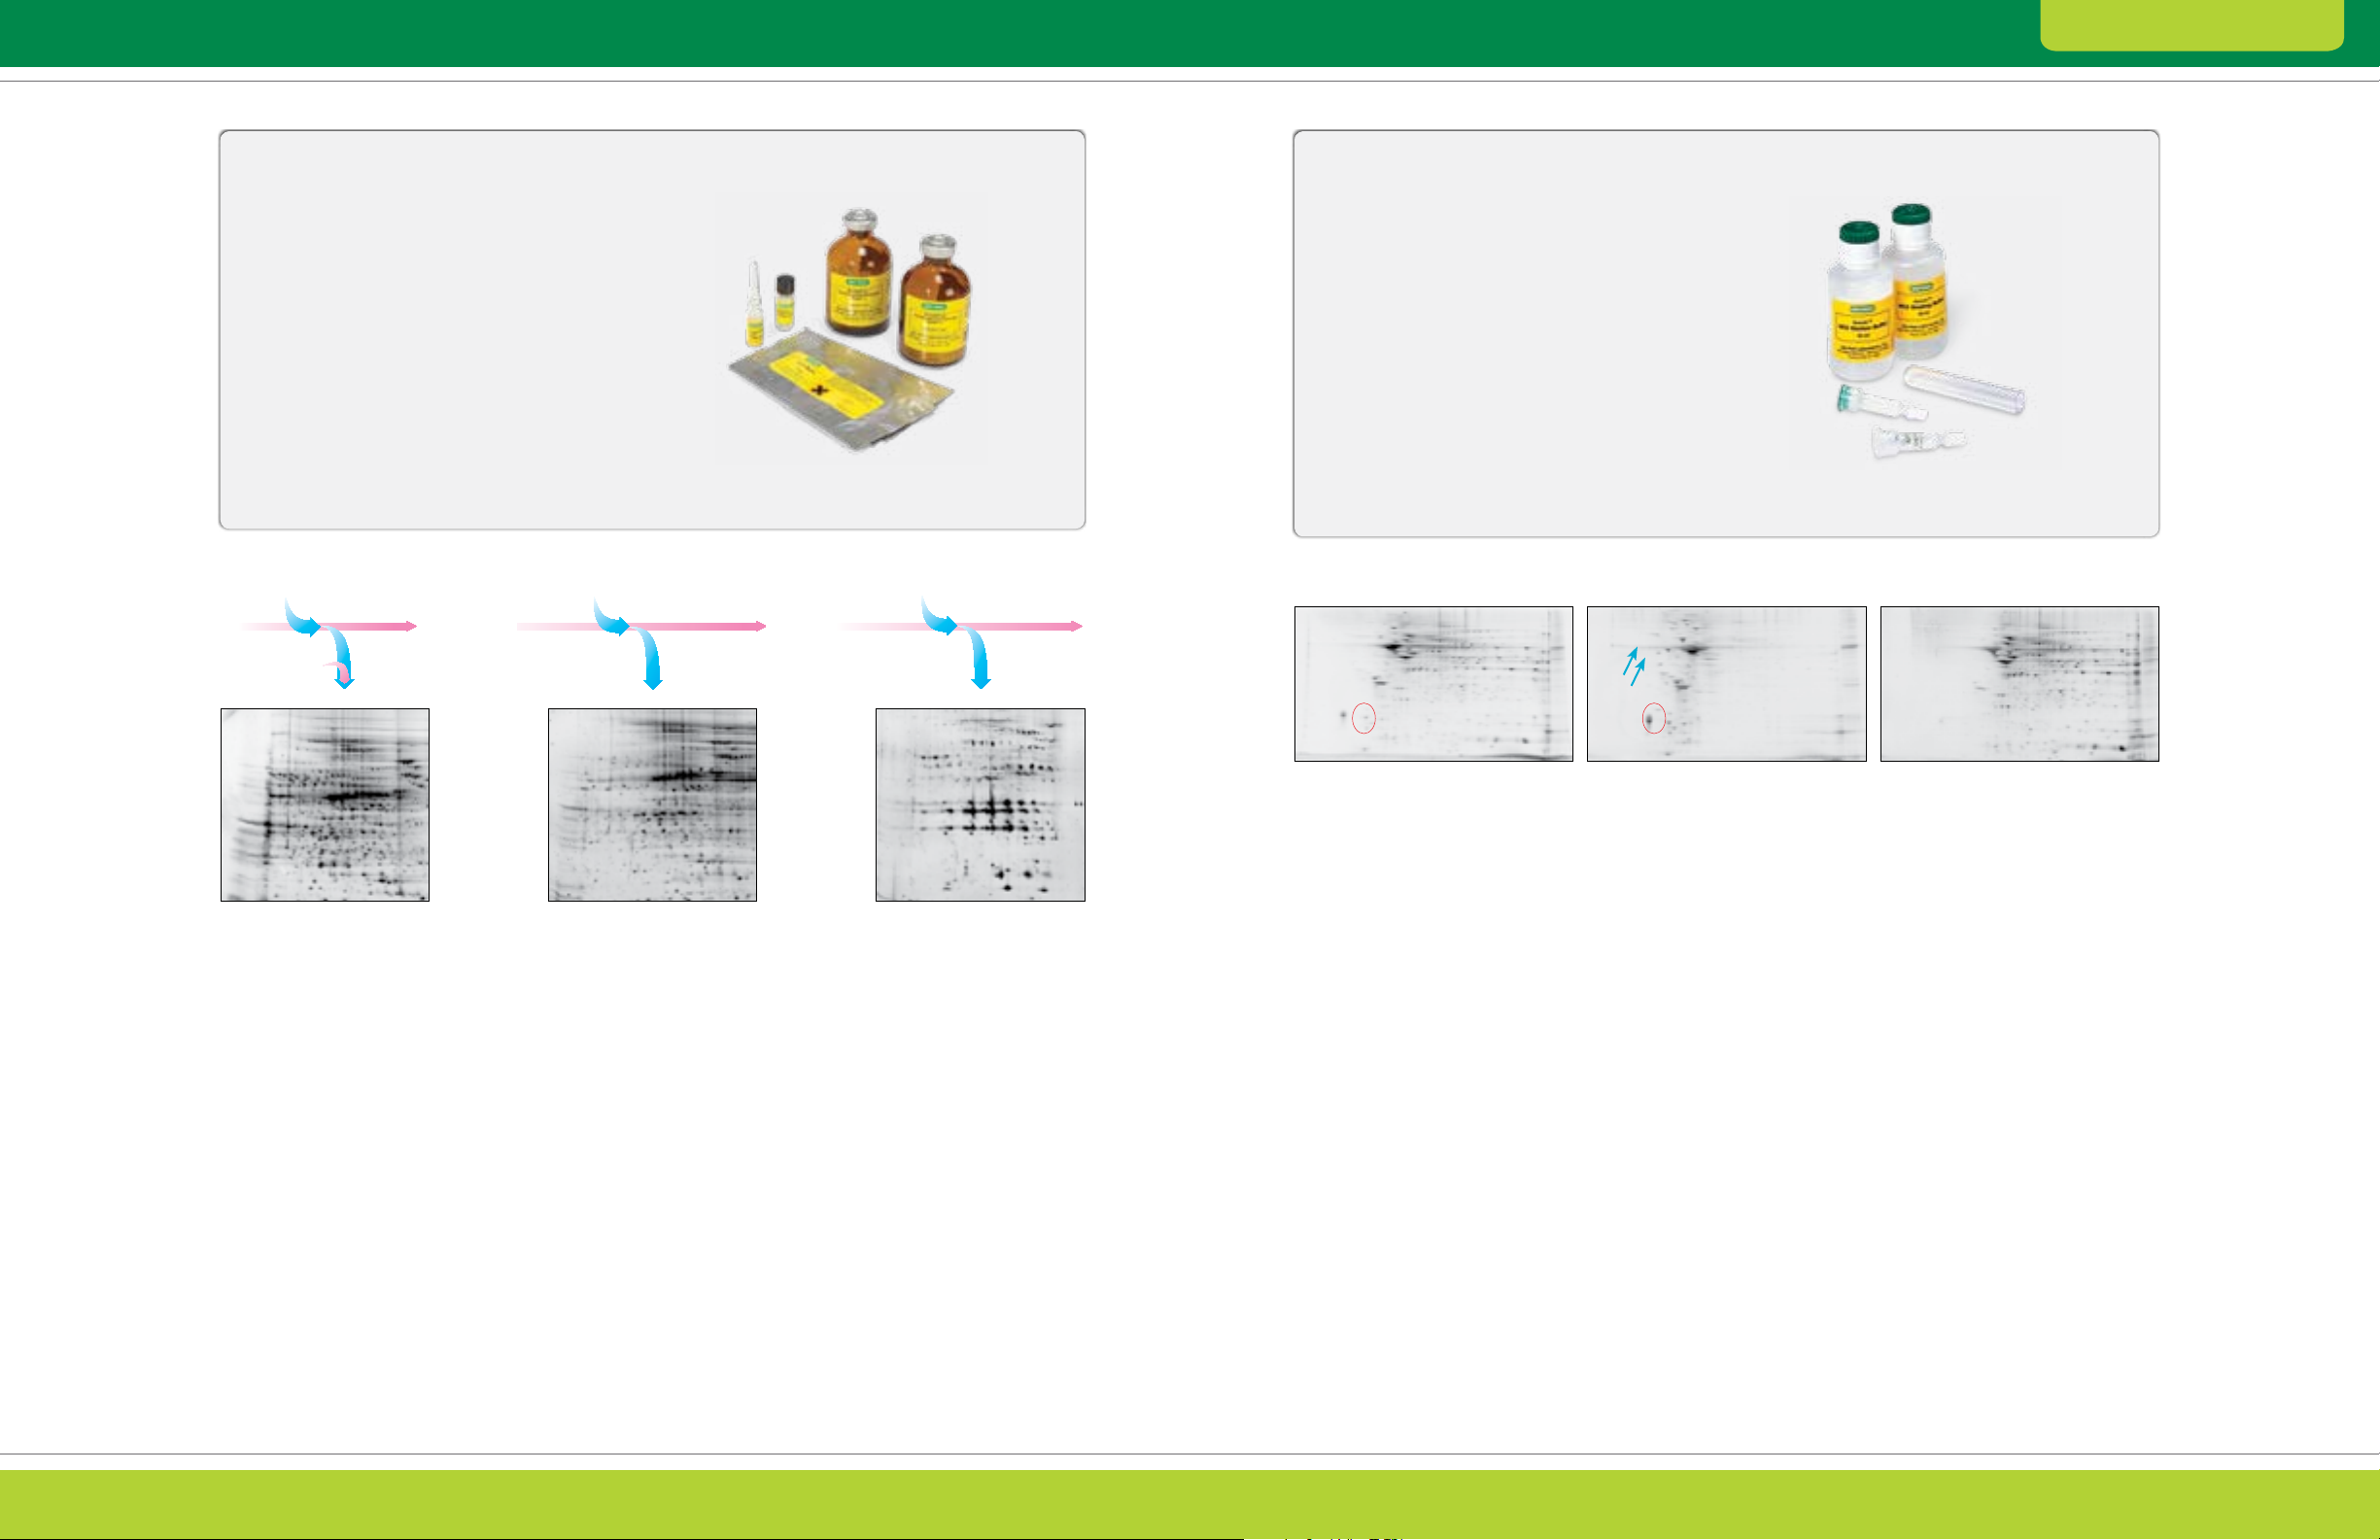
Products for Fractionation by
Protein Charge
For prefractionation in a convenient kit format,
™
Aurum
exchange) mini kits and columns employ ion
exchange chromatography in an easy-to-use spin
column format for fractionating and concentrating
acidic and basic proteins from small sample volumes
(<1 ml). Micro Bio-Spin 6 columns are included for
salt removal from the fractionated samples.
Requiring only 15–20 min operating time, Aurum
ion exchange mini spin columns provide a quick,
convenient, and reproducible sample preparation
ReadyPrep Sequential Extraction Kit Aurum I on Exch ange K it
tool for 2-D electrophoresis, and their use can
improve detection of low-abundance proteins
(Liu and Paulus 2008).
ReadyPrep
reagent 3
Collect supernatant 3
Step 3
Insoluble pellet
from reagent 3
pH 3 pH 10
AEX (anion exchange) and CEX (cation
Total Protein
pH 3 pH 10
AEX bound fraction
pH 3 pH 10
AEX unbound fraction
Fig. 2.5. Distribution of proteins based on differential solubility using the ReadyPrep sequential extraction kit. The gene ration of three
fractions provides increased resolution of proteins on 2-D gels.
Fractionation by Solubility/Hydrophobicity
Proteins can be separated according to their
solubility in different reagents using either chemical
or chromatographic methods. Sequential extraction
under different solvent conditions can be used to
fractionate a protein sample based on solubility,
and this strategy has also been used to prepare
discrete fractions for analysis by 2-D electrophoresis
(Lenstra and Bloemendal 1983, Weiss et al. 1992).
Extraction using different detergents can also
yield different protein fractions (Figure 2.5), and
chromatographic methods that can be used include
reverse-phase (Van den bergh and Arckens 2008)
and hydrophobic interaction chromatography
(McNulty and Annan 2009).
Fractionation by Protein Charge
Ion exchange chromatography has been used to
reduce proteome complexity, enrich low-abundance
proteins, and improve peptide mass fingerprints
(Butt et al. 2001). This technique separates proteins
according to their charge at various pHs. It is based
on the reversible adsorption of proteins to a solid
phase containing charged chemical groups.
Cationic (+) or anionic (-) resins (Figure 2.6) attract
molecules of opposite charge in the solvent. A variety
of systems and media are available for ion exchange
chromatography, but because elution involves gradient
elution by washing the column with buffers of gradually
increasing ionic strength or pH, a subsequent
cleanup step must be included.
Fig. 2.6. Fractionation of rat brain tissue using Aurum ion exchange mini columns. Rat brain total protein ex tracts (3 ml) were loaded onto
an Aurum AEX column and eluted. The unfractionated and fractionated samples were then treated with the ReadyPrep reduction alk ylation
and 2-D cleanup kits and separated by 2-D electrophoresis. Red circles indicate a group of protein spots with increased intensities after
fractionation. Blue arrows show t wo repre sentative spots detected only in the gels of the AEX bound fraction.
Fractionation by pI
Fractionation by pI, for example by liquid-phase IEF,
may seem counterintuitive as a fractionation technique
upstream of the first-dimension IEF separation. It can,
however, improve downstream sample loading and
separation on narrow- and micro-range IPG strips by
eliminating proteins outside the pH region of interest
(Figure 2.7). This unique separation method can also
be coupled to analytical or preparative SDS-PAGE for
a powerful, complementary first-dimension separation
and enrichment strategy for high molecular weight,
membrane, hydrophobic, or other proteins that
are often underrepresented in IPG-based 2-D gels
(Davidsson 2002, Hansson et al. 2004, Brobey
and Soong 2007)
2
.
2
Liquid IEF introduces ampholy tes that must be removed, for example
with the ReadyPrep 2-D cleanup kit, before IEF in IPG strips.
24 25
Page 15
2-D Electrophoresis Guide Theor y and Product Selection
Chapter 2: Sample Preparation
Products for Fractionation by pI
The Rotofor®, Mini Rotofor, and MicroRotofor cells
separate and concentrate proteins into discrete
fractions by liquid-phase IEF. Following ampholyte
removal and sample concentration with the
ReadyPrep 2-D cleanup kit, each of the resulting
liquid fractions can then be separated on narrow-
or micro-range IPG strips.
Rotofor Family o f Liqui d-Ph ase IEF Cells
Unfractionated
pH 3 10
Fraction 3, pH 6 .04
pH 3 10
Fractionation by Size (MW)
Size-dependent separation is a powerful fractionation
strategy in studies focused on a particular protein or
protein family and their posttranslational modifications
because these proteins tend to be of similar size
(Fountoulakis and Juranville 2003). Proteins can
be separated into size-dependent fractions by
polyacrylamide gel electrophoresis (PAGE), particularly
continuous-elution electrophoresis.
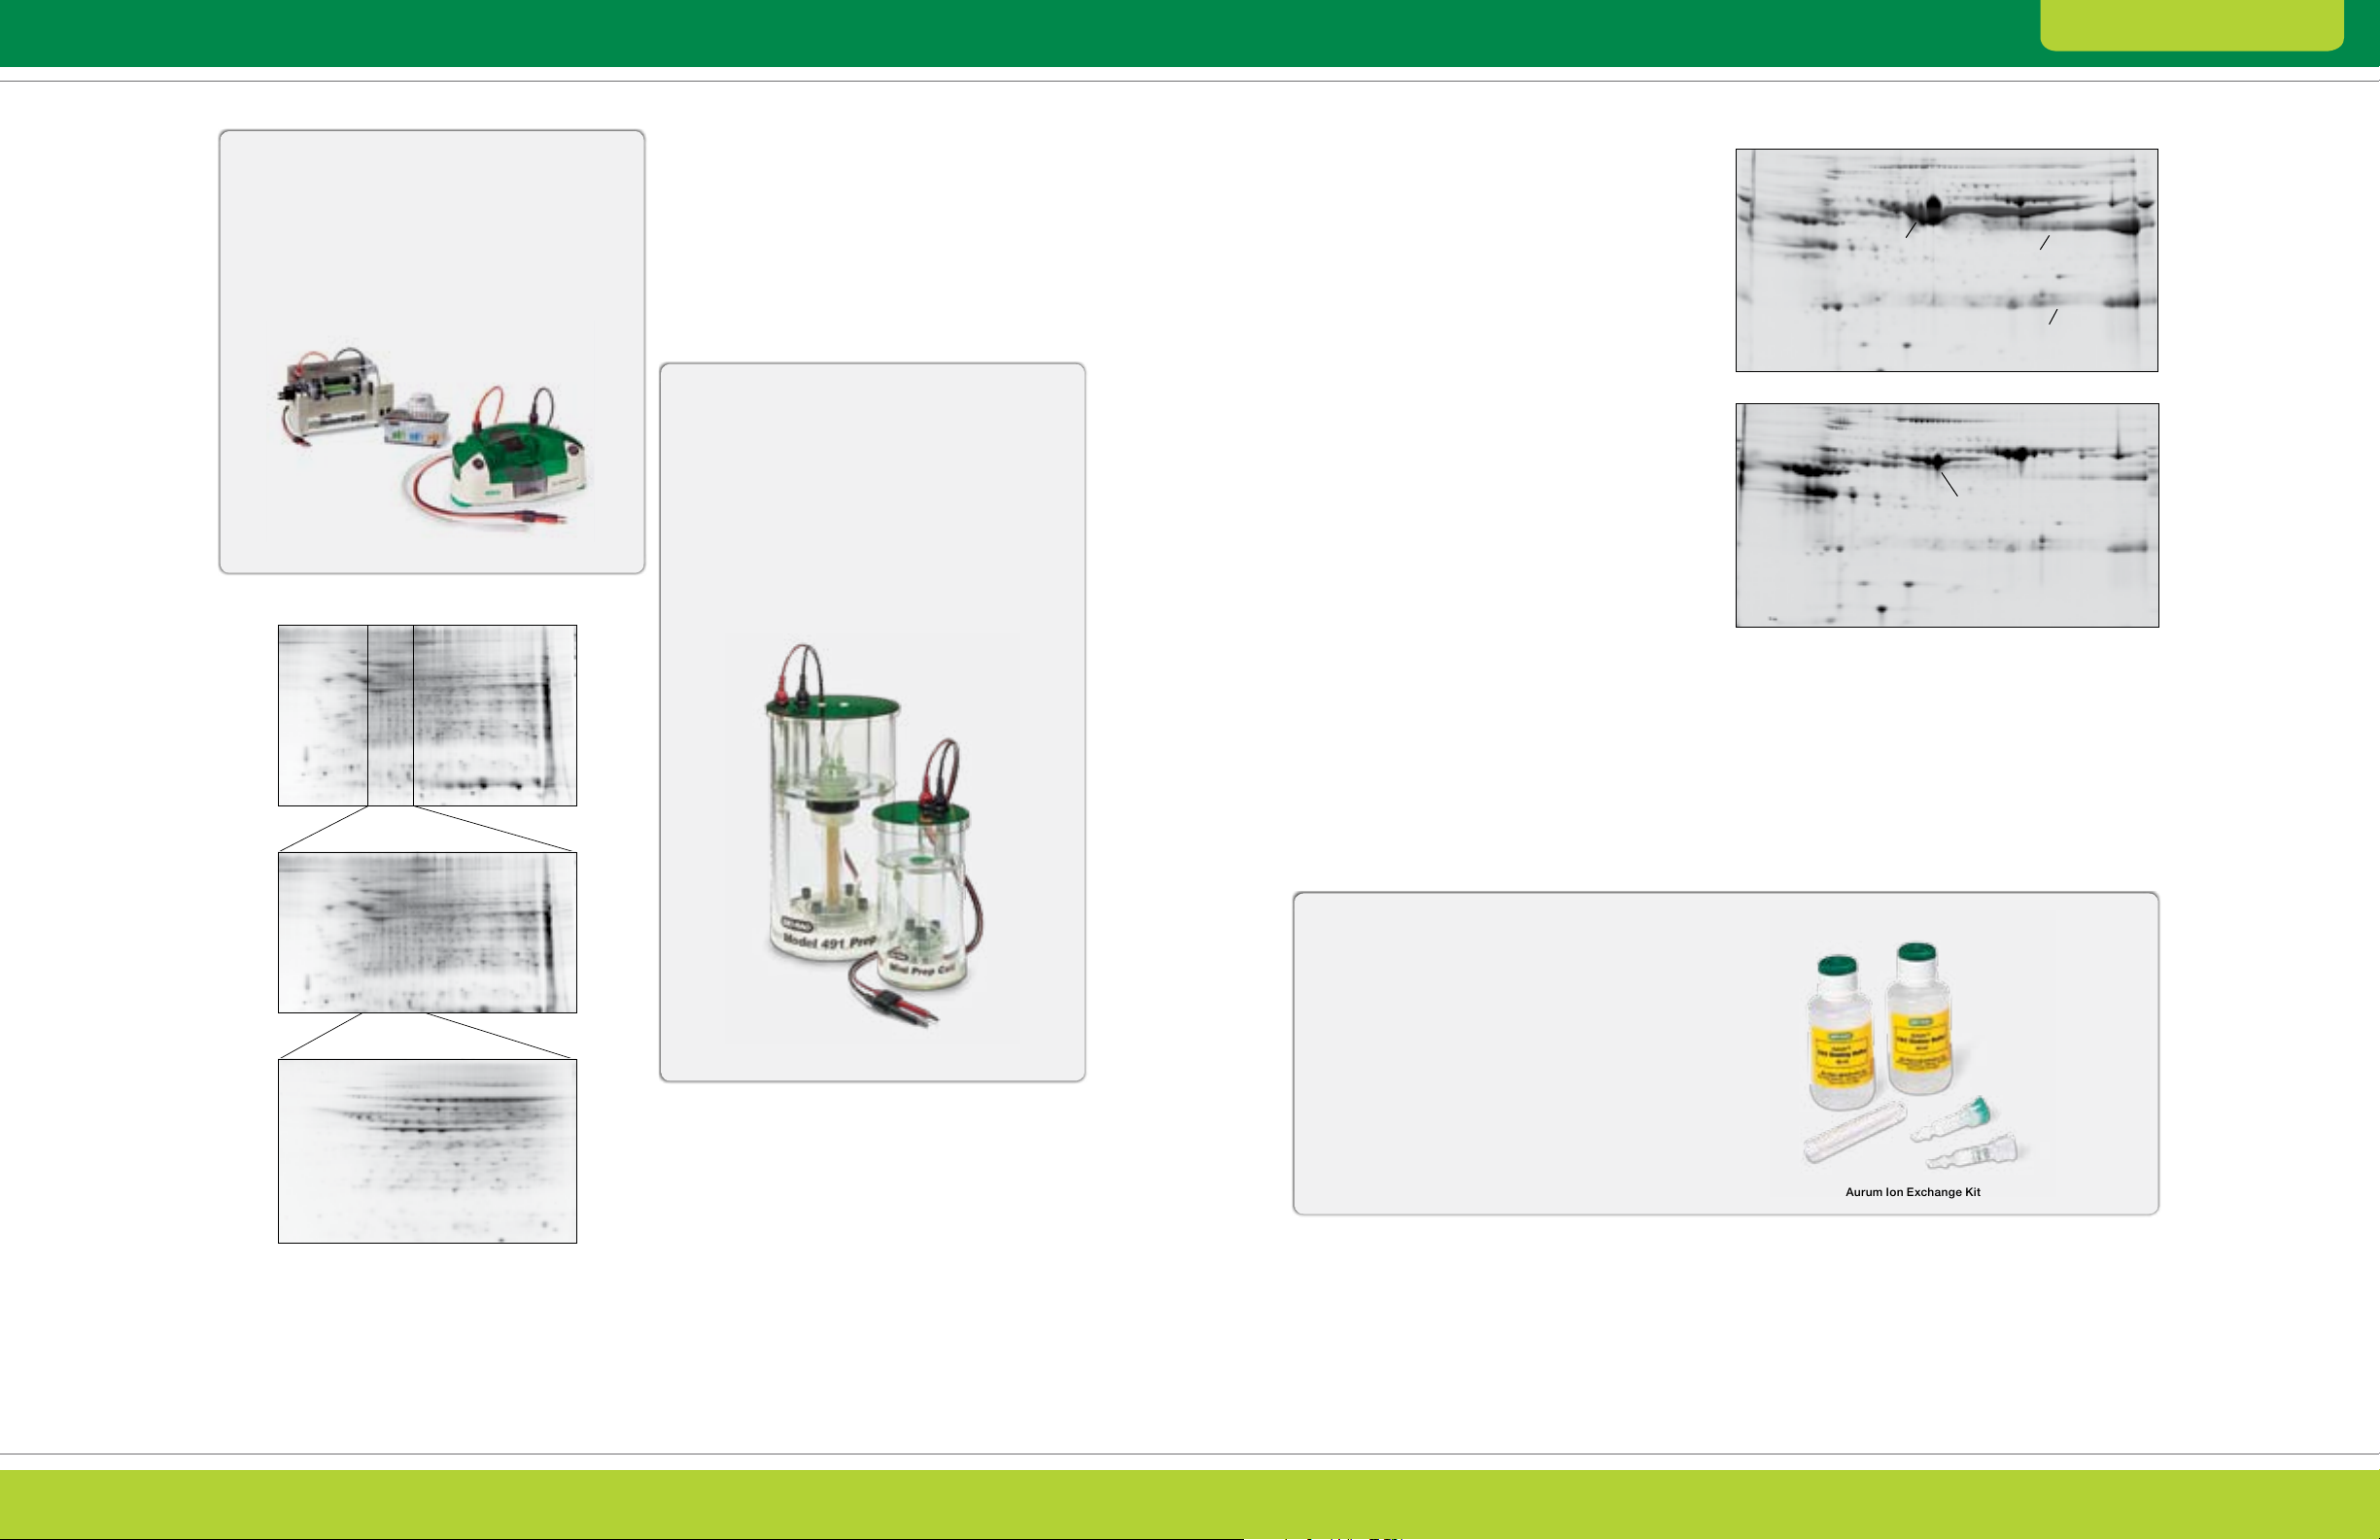
Products for Fractionation by Size (MW)
The Model 491 prep cell and mini prep cell
perform size-dependent high-resolution
fractionation of proteins by continuous-elution gel
electrophoresis (using native PAGE or SDS-PAGE).
The large sample capacity (50 µl–15 ml, and
0.5–500 mg protein) of these cells makes them
particularly effective tools for the enrichment of
low-abundance proteins (Zerefos et al. 2006,
Xixi et al. 2006, Fountoulakis et al. 2004).
Depletion and Dynamic Range Reduction
One of the major difficulties facing proteomics is the
issue of dynamic range, or the variation in abundance
among sample proteins that typically spans several
orders of magnitude. This range typically exceeds that
over which proteins can be effectively detected and
quantified. Various strategies have been developed
for the reduction of sample dynamic range, and
they have proven beneficial for the study of lowabundance proteins.
Depletion
Samples may be dominated by a few abundant
proteins whose presence can obscure less abundant
proteins and limit the capacity and resolution of the
separation technique employed. This is particularly
apparent for serum and plasma; the study of lowerabundance proteins from serum or plasma is
often complicated by the presence of albumin and
immunoglobulin G (IgG), which together contribute
up to 90% of the total protein in a serum sample.
These proteins obscure comigrating proteins and limit
the amount of total serum protein that can be loaded
on 2-D gels. To obtain meaningful results from serum
samples, these proteins must be removed (Figure 2.8).
A strategy for specific depletion of abundant proteins
by immunoaffinity chromatography has been widely
used (Pieper et al. 2003, Roche et al. 2009, Tu et al.
2010, Ichibangase et al. 2008). Though this method is
effective, the need for antibodies renders it expensive
and limits its applicability to the specific sample type
for which the antibodies were developed.
Before
Albumin
After
Albumin
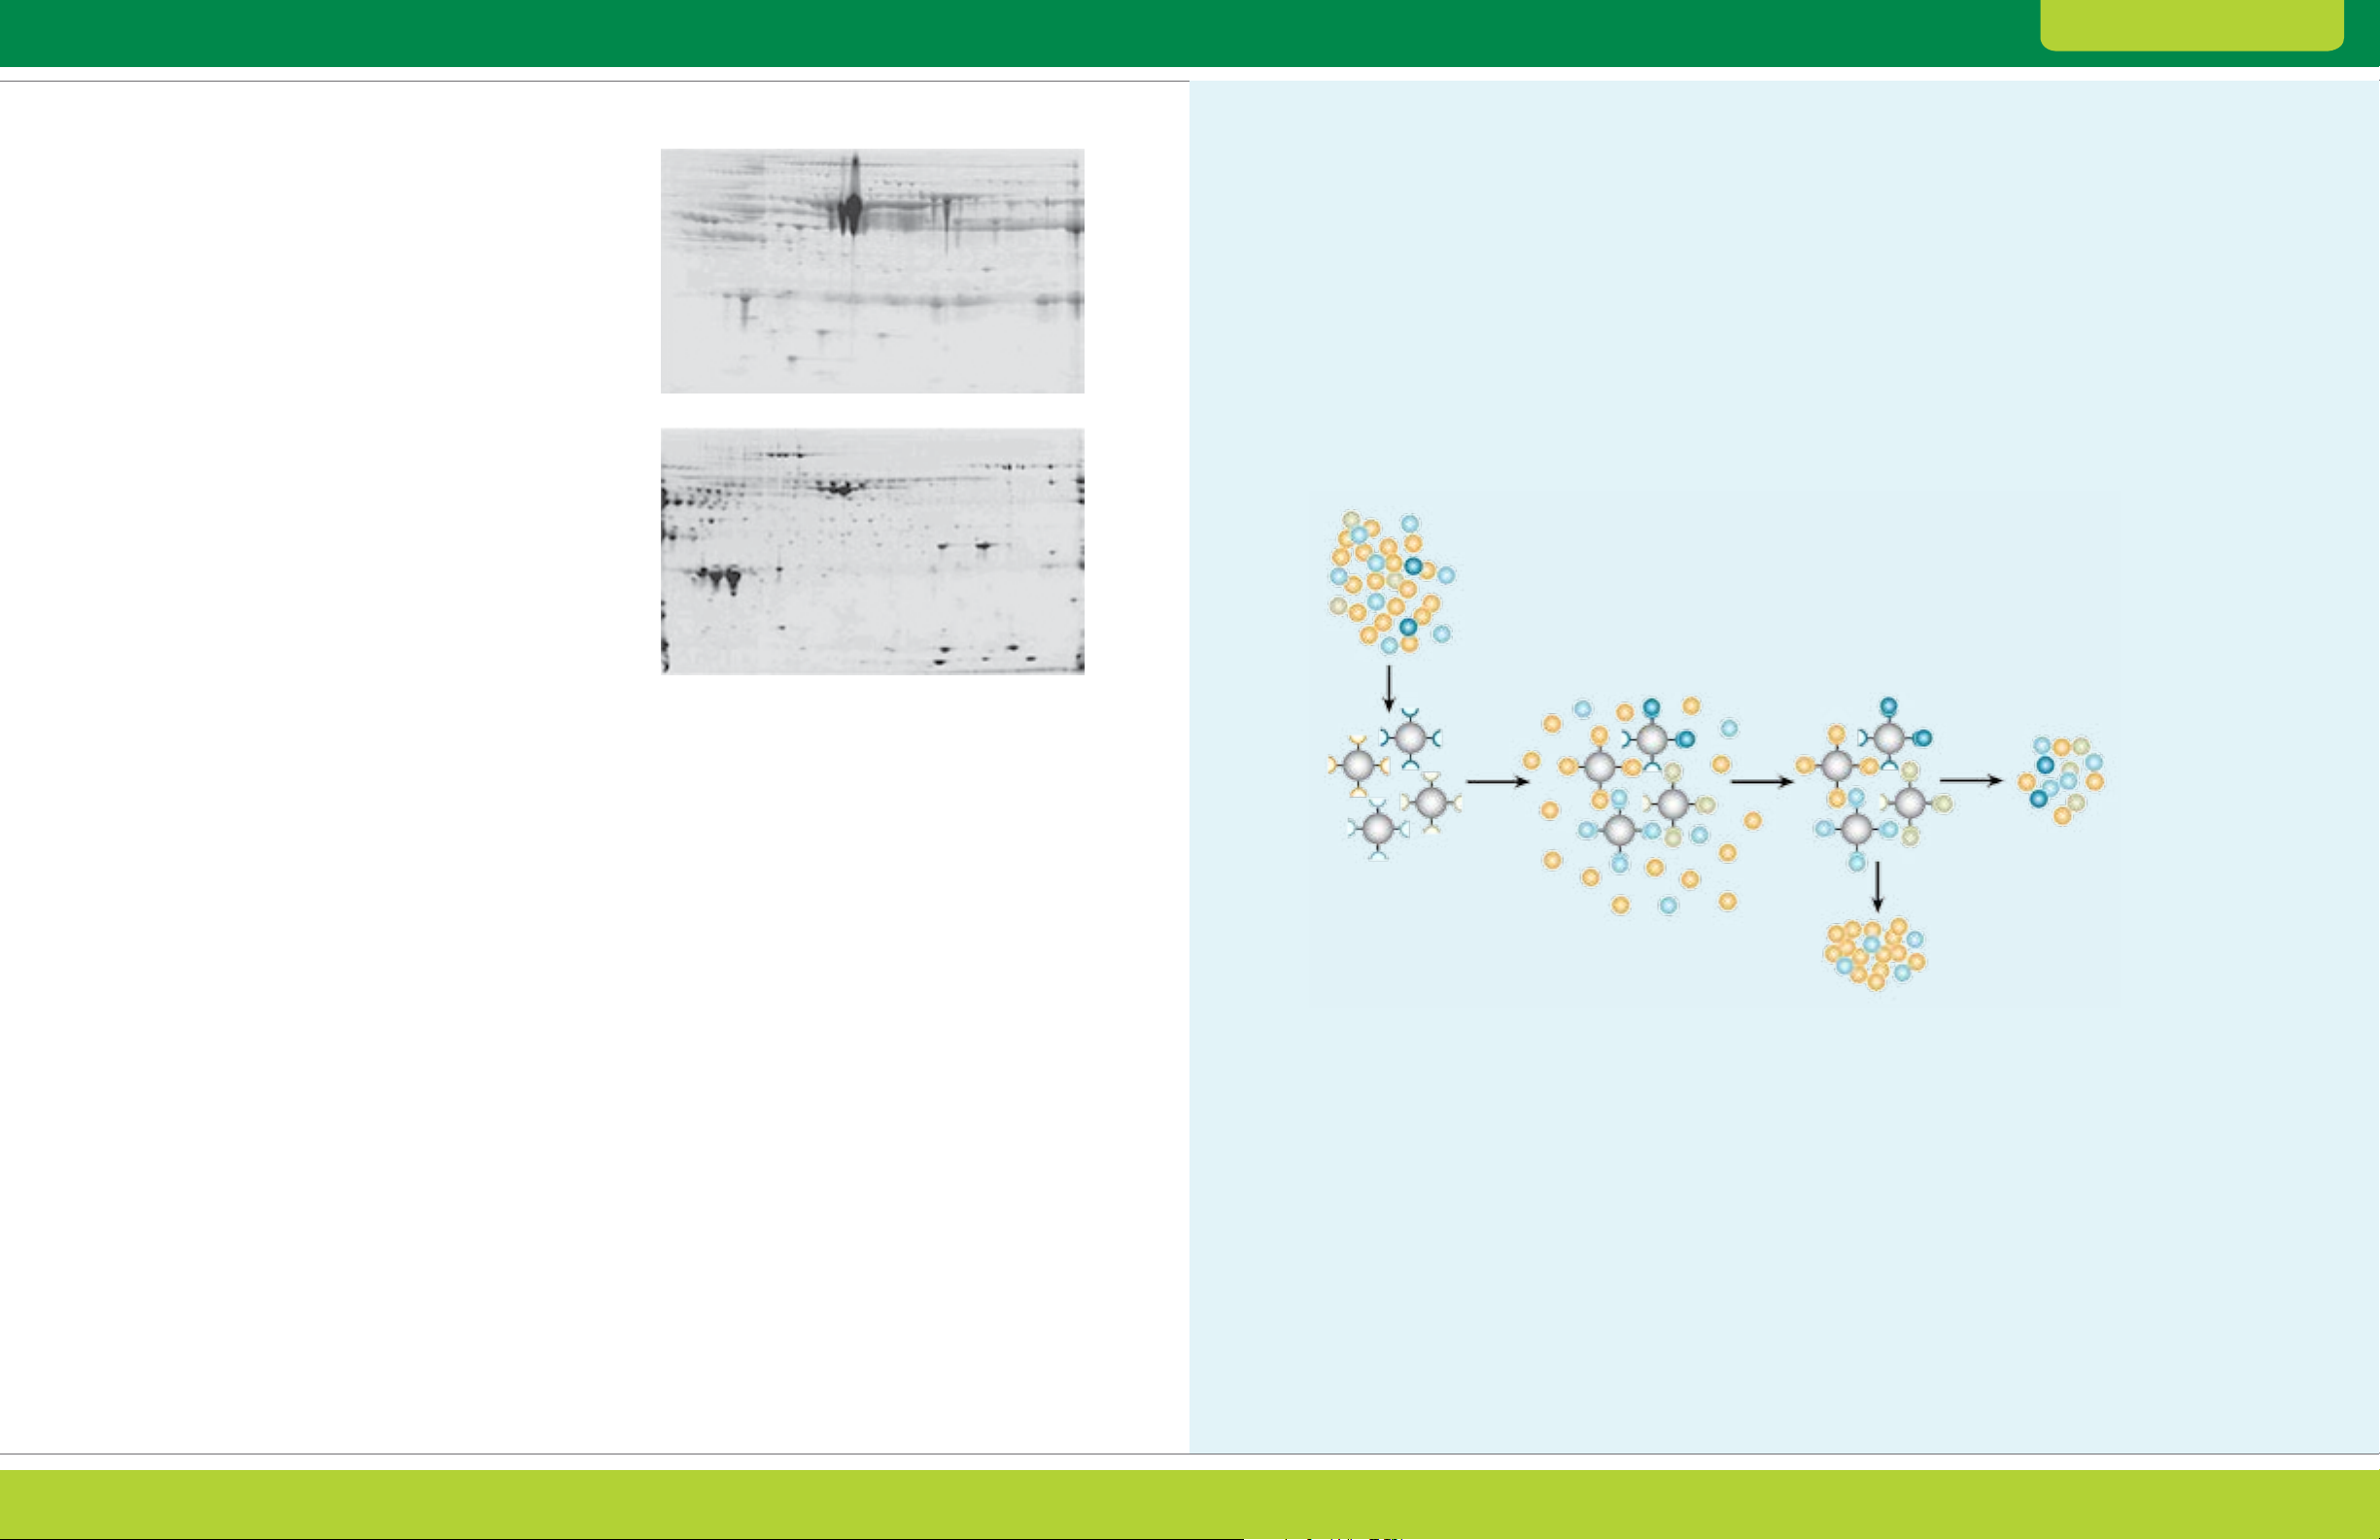
Fig. 2.8. Albumin and IgG removal from serum using the Aur um
serum protein mini kit. Serum proteins were separated by 2-D
electrophore sis before and af ter treatment with an Aurum serum
protein mini column. Albumin and IgG are removed following treatment
with the column, improving resolution of other protein species.
Samples (100 µg) were focused on 11 cm ReadyStrip pH 5–8 IPG
strips, then run on 8–16% gels.
Heavy-chain IgG
Light-chain IgG
pH 4.7 5.9
Fraction 3, pH 6 .04
Fig. 2.7. Clean fractionation by pI. Mouse liver extract was
fractionated using the MicroRotofor cell. 2-D separations of the
unfractionated sample (120 µg) and fractions (30 µg) are shown.
Prior to 2-D separation, samples were treated with the ReadyPrep
2-D cleanup kit to remove extra ampholytes. Note the cle an pH
bounda ries of f raction 3 and the enrichment of proteins in the pH
region it covers.
Model 4 91 Prep C ell and Mini Pr ep Cell
Products for Depletion
Bio-Rad’s Aurum Affi-Gel
protein mini kits represent a simple, low-cost
alternative to immunodepletion. These kits use
affinity chromatography to easily and effectively
remove albumin (Affi-Gel Blue) or albumin and IgG
(serum protein kit) in a single spin column.
®
Blue and Aurum serum
Aurum I on Exch ange K it
26 27
Page 16
2-D Electrophoresis Guide Theor y and Product Selection
Chapter 2: Sample Preparation
Dynamic Range Reduction
ProteoMiner™ protein enrichment technology uses a
bead-based library of combinatorial peptide ligands
that act as unique binders for proteins (Thalusiraman
et al. 2005, Guerrier et al. 2006). When a complex
sample is applied to the beads, abundant proteins
saturate their specific ligands while the remaining
proteins can be washed away. Low-abundance
proteins are concentrated on their specific ligands
and will be enriched relative to the abundant proteins
following elution. In contrast to immunodepletion,
ProteoMiner has no intrinsic specificity for any
particular sample type and can be used to decrease
high-abundance proteins in any sample that could
benefit from such a treatment. The technology has
been most widely applied to serum and plasma
(Sennels et al. 2007); however, several examples
of successful application of ProteoMiner to other
samples have also been reported (Castagna et al.
2005, Guerrier et al. 2007, D’Ambrosio et al. 2008,
Bandhakavi et al. 2009).
ProteoMiner protein enrichment kits:
Decrease the amount of high-abundance proteins
without immunodepletion, preventing the loss of
proteins bound to high-abundance proteins
Enrich medium- and low-abundance proteins that
cannot be detected through traditional methods
(Figure 2.9)
Do not rely on a predefined set of antibodies,
unlike immunodepletion products
Are compatible with a variety of sample types
Offer a convenient, easy-to-use format
Can be used for differential expression analysis
Untreated
Tre ate d
Fig. 2.9. The ProteoMiner protein enrichment kit improves
resolution and spot counts in 2-D gels. In an untreated sample,
albumin and other high-abundance proteins dominate the gel and
obscure signals from less abundant proteins. On a gel generated
using an equal amount of total protein from a treated serum sample,
however, resolution is dramatically improved and a greater number
of protein spots is visualized.
ProteoMiner Technology
ProteoMiner technology employs a combinatorial
library of hexapeptides bound to a chromatographic
support. Combinatorial synthesis creates a large library
of unique hexapeptides, with each hexapeptide bound
to a stationary support, or bead. Each bead, featuring
a unique ligand, is expected to bind specifically to one
or a small number of different proteins in a mixture,
and the library of all possible sequences binds proteins
up to the capacity of available beads.
Biological sample
(large dynamic range)
Bind mixture
to library
Ligand library
When a complex biological sample is applied to the
beads, high-abundance proteins saturate their ligands
and excess proteins are washed away. In contrast,
low-abundance proteins do not saturate their binding
sites. Therefore, different samples retain relative
expression levels similar to the original samples.
Moreover, low-abundance proteins are enriched if the
beads are eluted in a volume smaller than the original
sample. The overall effect of ProteoMiner technology
results in the bound and eluted material consisting of a
significantly lower amount of total protein, thus allowing
resolution of a greater diversity of species.
Wash away
unbound protein
Elute bound
sample for analysis
Depletion of plasma and serum samples by ProteoMiner technology. Each bead features a different hexapeptide ligand with affinity
for specific proteins in a sample. Samples are applied to the beads, allowing proteins to bind to their specific ligands. Proteins in excess are
washed away, and those proteins bound to the beads are eventually eluted, allowing further downstream analysis.
28 29
Page 17

2-D Electrophoresis Guide Theor y and Product Selection
Chapter 2: Sample Preparation
Additional Resources
Samples can be prepared for 2-D electrophoresis
using many other techniques. Consult Posch (2008)
for more information on:
Sample preparation basics (cell disruption, sample
solubilization, protein assays, contaminant removal)
Protein labeling techniques
Fractionation using chemical reagents
and chromatography
Fractionation using electrophoresis methods
Enrichment strategies for organelles, multiprotein
complexes, and specific protein classes
Application of sample preparation tools and
fractionation strategies to study different
biological systems
Sample Quantitation (Protein Assays)
Determine the concentration of protein in a sample
(Berkelman 2008) by protein assay to:
Ensure that the amount of protein to be
separated is appropriate for the IPG strip length
and visualization method
Facilitate comparison among similar samples;
image-based analysis is simplified when equivalent
quantities of proteins have been separated
The most commonly used protein assays are
visible assays, assays in which the presence of protein
causes a visible color change that can be measured
with a spectrophotometer (Sapan et al. 1999;
Noble and Bailey 2009; see the Protein Assay
Products and SmartSpec
sidebar). All protein assays utilize a dilution series of a
known protein (usually bovine serum albumin or bovine
g-globulin) to create a standard curve from which the
concentration of the sample is derived (for a protocol
describing protein quantitation, refer to Part II of
this guide).
™
Plus Spectrophotometer
The chemical components of the sample buffer and
the amount of protein available for assay dictate the
type of assay that may be used.
Bradford assays (Bradford 1976) — based on an
absorbance shift of Coomassie (Brilliant) Blue G-250
dye under acid conditions, when a redder form of
the dye is converted into a bluer form upon binding
to protein. The increase of absorbance at 595 nm
is proportional to the amount of bound dye and,
therefore, to the amount (concentration) of protein
present in the sample. In comparison to other protein
assays, the Bradford protein assay is less susceptible
to interference by various chemicals that may be
present in protein samples, with the exception of
elevated concentrations of detergents like SDS.
The response of the Bradford protein assay is
only slightly affected by urea, thiourea, and
CHAPS in concentrations up to 1.75 M, 0.5 M,
and 1% (w/v), respectively
Lowry (Lowry et al. 1951) — combines the
reactions of cupric ions with the peptide bonds
under alkaline conditions with the oxidation of
aromatic protein residues. The Lowry method is
based on the reaction of Cu
peptide-mediated reduction of Cu
+
, produced by the
2+
, with FolinCiocalteu reagent (a mixture of phosphotungstic acid
and phosphomolybdic acid in the Folin-Ciocalteu
reaction). The Lowry assay is intolerant of thiourea,
reductants such as DTT, and chelating agents
such as EDTA
BCA (bicinchoninic acid, Smith et al. 1985) —
BCA reacts directly with Cu
mediated reduction of Cu
+
(generated by peptide-
2+
) to produce a purple end
product. The reagent is fairly stable under alkaline
conditions and can be included in the copper
solution to allow a one-step procedure. Like the
Lowry assay, the BCA assay is intolerant of thiourea,
reductants such as DTT, and chelating agents such
as EDTA
2-D sample solutions typically contain reagents
that interfere with all of the assays described above.
The Bradford assay may be used on samples that
are concentrated enough to be diluted with water
so that urea, thiourea, and CHAPS are no longer
present at interfering levels (typically at least fourfold).
Otherwise, modified assay procedures may need to
be employed (see the Protein Assay Products sidebar).
Protein Assay Products
Protein concentration in 2-D sample solutions
is best measured using the RC DC
™
protein
assay, a modification of the Lowry assay that
incorporates a precipitation step that removes
Table 2. 3. Bio-Rad protein assay selection gui de.
Quick Start
Method
Bradford • • — —
Lowry — — • •
Description One-step determination; Standard Bradford Detergent compatible Reducing agent
not for use with assay, not to be (DC); Lowry assay and detergent
SDS-containing samples used with elevated modified to save time compatible (RC DC)
levels of detergents and to be more
(>0.1% SDS) accurate
Standard-concentration Assay
Sample volume 100 µl 100 µl 100 µl 100 µl
Linear range 0.125–1.5 mg/ml 0.125 –1.5 mg/ml 0.125–1.5 mg/ml 0.2–1.5 mg/ml
Low-concentration Assay
Sample volume 1 ml 800 µl 200 µl 200 µl
Linear range 1.25–25 µg/ml 1.25–25 µg/ml 5 –250 µg/ml 5–250 µg/ml
Microplate assay volume 5 µl 10 µl 5 µl **
Minimum incubation 5 min 5 min 15 min 15 min
Assay wavelength 595 nm 595 nm 650–750 nm 650 –750 nm
™
Bradford Bio-Rad DC™ RC DC
reducing agents and detergents. For more
information on protein quantitation using visible
assays, refer to Bio-Rad bulletin 1069.
SmartSpec Plus Spectrophotometer
The color change observed in protein assays is
measured using a spectrophotometer. Bio-Rad’s
SmartSpec Plus spectrophotometer has
preprogrammed methods for protein quantitation
and a working wavelength range of 200–800 nm.
It can be used for routine applications such as:
Quantitation of proteins via the Bradford,
Lowry, and BCA assay methods
Quantitation of DNA, RNA, and oligonucleotides
Monitoring bacterial culture growth
Simple kinetic assays
Wavelength scans with peak detection
Features built into the SmartSpec assay
methods facilitate data collection and present
a complete analysis of assay results. Bio-Rad
also offers compatible quartz and UV-transparent
plastic cuvettes.
SmartSpec Plus Spectrophotometer
30 31
Page 18
2-D Electrophoresis Guide Theor y and Product Selection
CHAPTER 3
The First Dimension:
Isoelectric Focusing
(IEF)
32 33
Page 19
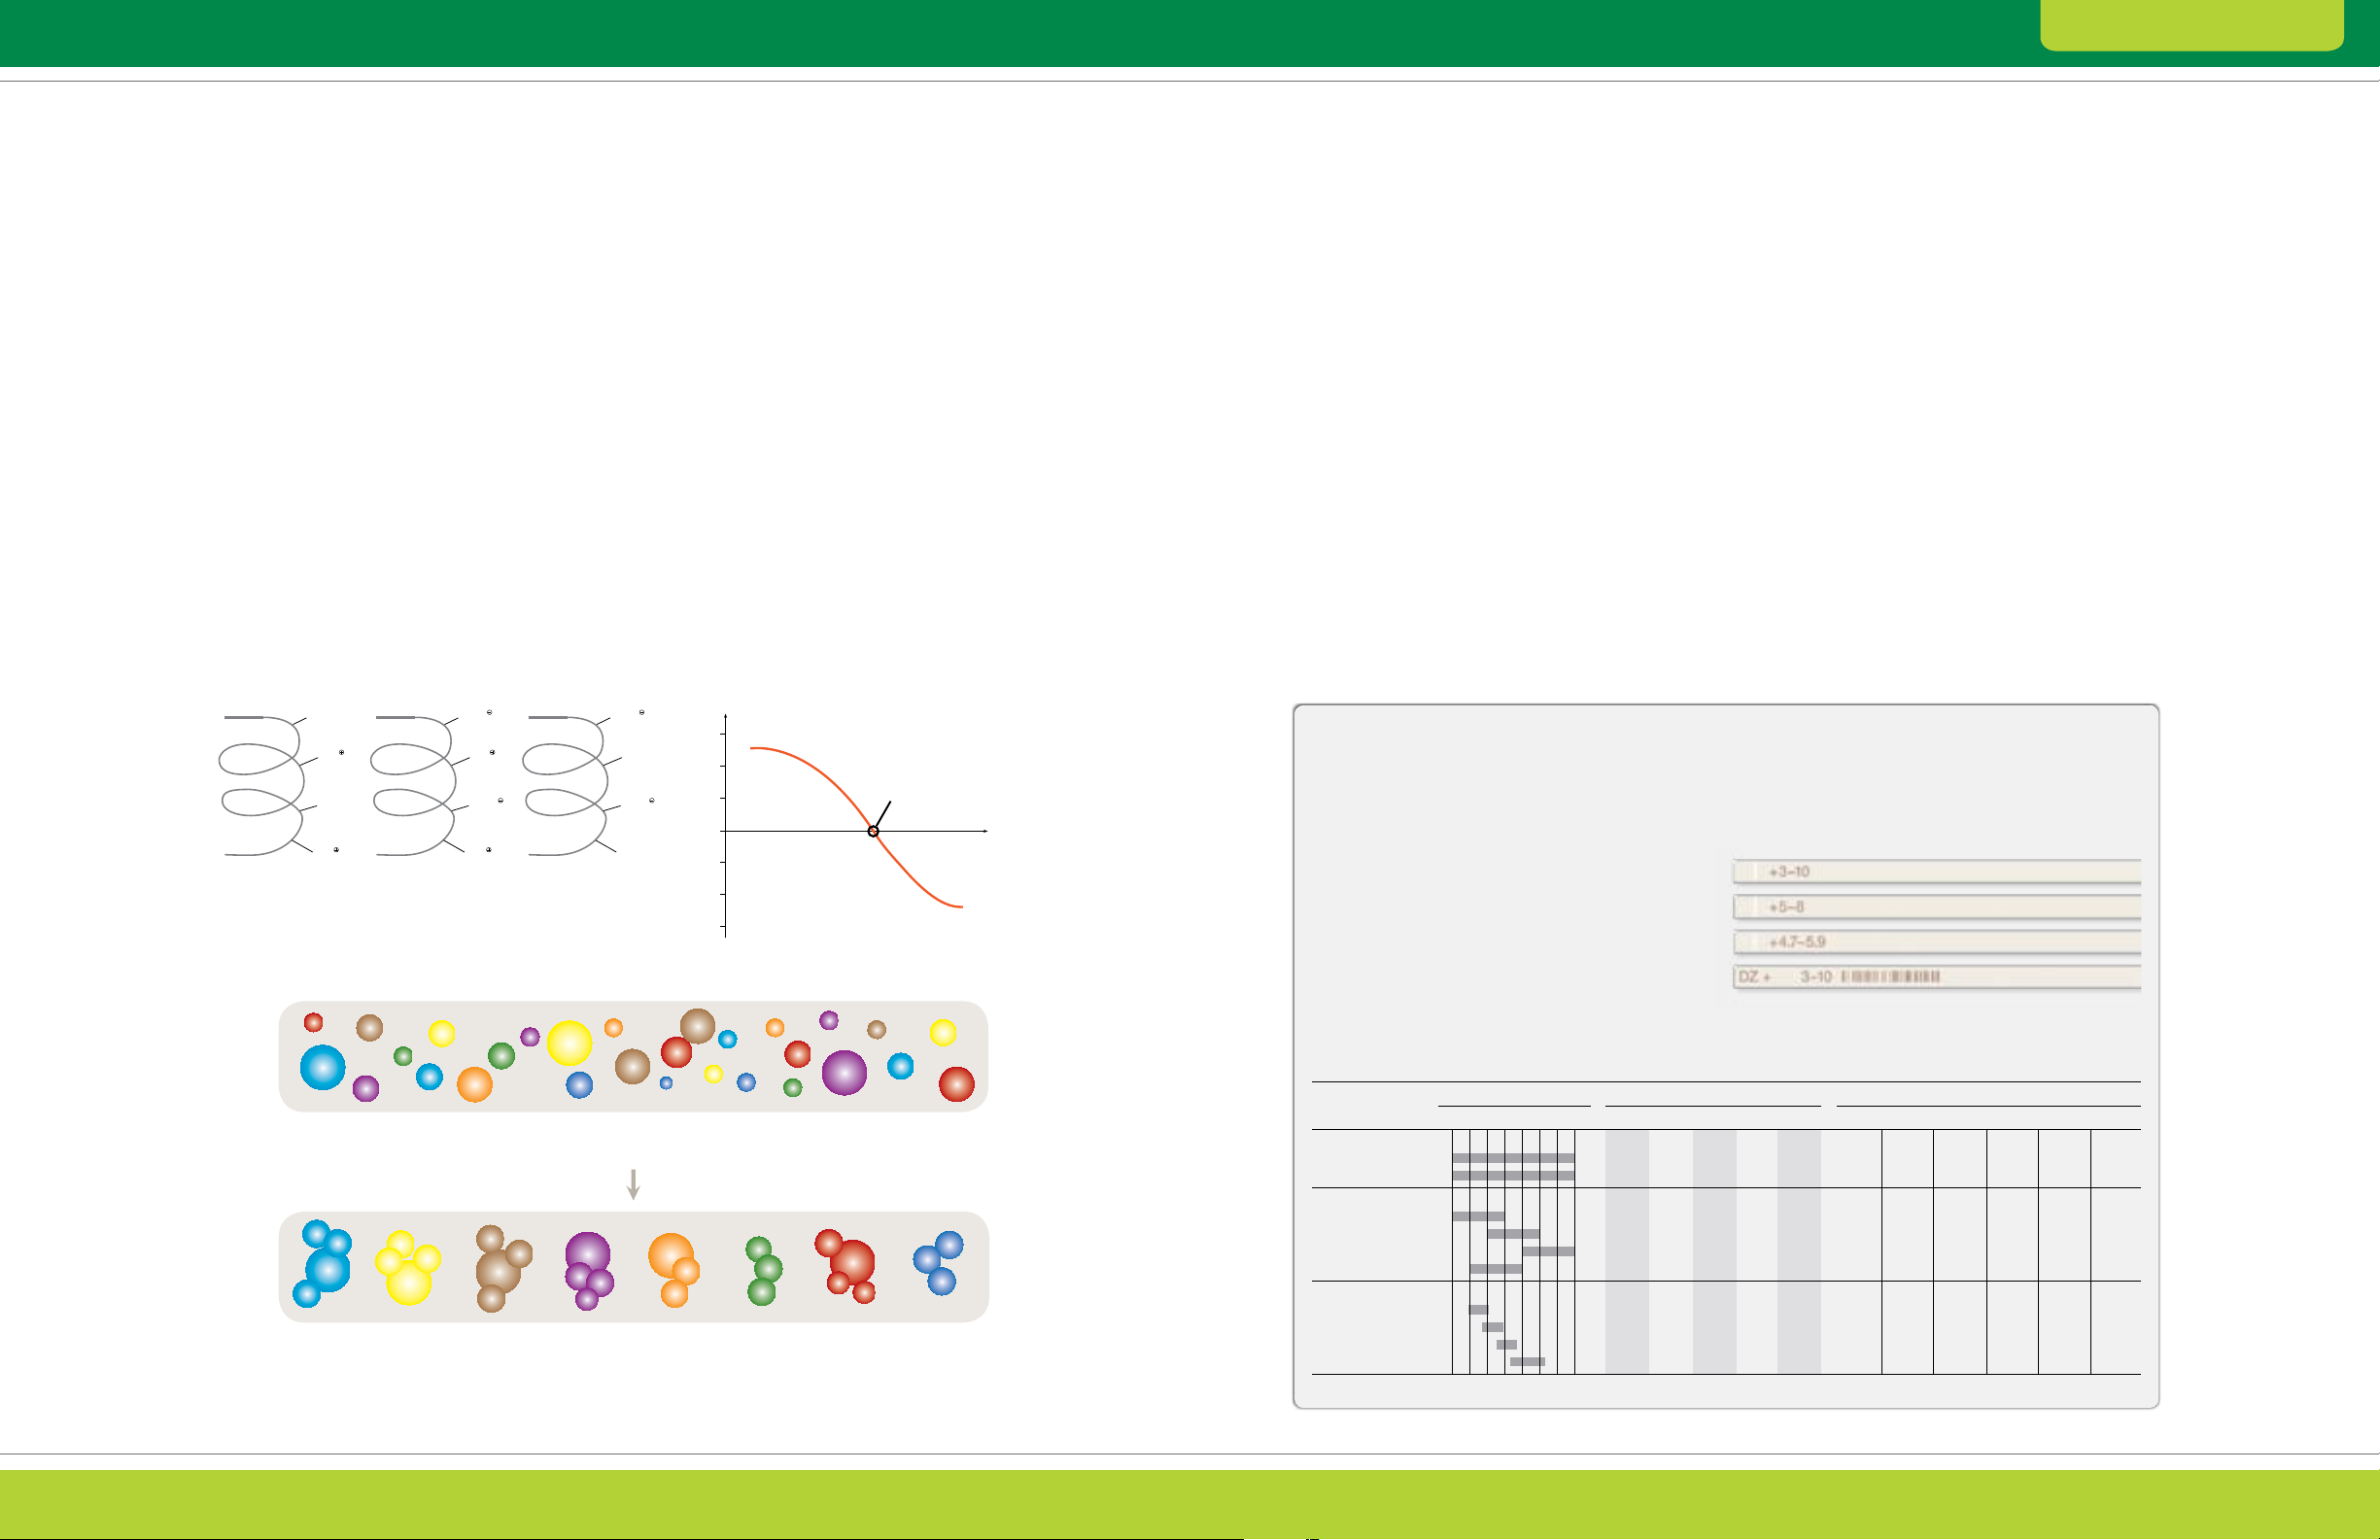
COOH
COOH
pH = pl
COO
COO
pH > pl
NH
2
NH
2
COO
COO
NH
3
NH
3
NH
3
NH
3
2-D Electrophoresis Guide Theor y and Product Selection
Chapter 3: The First Dimension: Isoelectric Focusing (IEF)
Protein Separation by Isoelectric point (pI)
The first-dimension separation of 2-D electrophoresis
is IEF, where proteins are separated on the basis of
differences in their pI. The pI of a protein is the pH at
which it carries no net charge, and it is a characteristic
that is determined by the number and types of
charged groups the protein carries.
Proteins are amphoteric molecules, which carry a
positive, negative, or zero net charge depending on
the pH of their environment. For every protein, there
is a specific pH at which its net charge is zero (its pI).
Proteins show considerable variation in pI, though pI
values usually fall in the range of pH 3–12, with the
majority falling between pH 4 and pH 8. A protein
is positively charged at pH values below its pI and
negatively charged at pH values above its pI (Figure 3.1).
For IEF, a protein is placed in a medium with a pH
gradient and subjected to an electric field. In response
to the field, the protein moves toward the electrode
with the opposite charge. Along the way, it either
picks up or loses protons. Its net charge and mobility
decrease until the protein eventually arrives at the point
in the pH gradient equal to its pI. There, the protein is
uncharged and stops migrating (Figure 3.2).
If, by diffusion, it drifts away from the point in the
gradient corresponding to its pI, it acquires charge
and is pulled back. In this way, proteins condense,
or are focused, into sharp bands in the pH gradient
at their characteristic pI values.
IEF proceeds until a steady state is reached.
Proteins approach their pI values at different rates
but remain relatively fixed at those pH values for
extended periods. This is in contrast to conventional
electrophoresis (for example, polyacrylamide gel
electrophoresis, or PAGE), where proteins continue
to move through the medium until the electric field is
removed. Moreover, in IEF, proteins migrate to their
steady-state positions from anywhere in the system.
IEF for 2-D electrophoresis is performed under
denaturing conditions so that proteins are completely
disaggregated and all charged groups are exposed
to the bulk solution. Consequently, resolution is best
under denaturing conditions. Complete denaturation
and solubilization are required to minimize aggregation
and intermolecular interactions, thus ensuring that
each protein is present in only one configuration.
IEF Media: IPG Strips vs. Carrier Ampholytes
IEF for 2-D electrophoresis is most commonly
performed using immobilized pH gradient (IPG) strips.
As their name implies, IPG strips contain buffering
groups covalently bound to a polyacrylamide gel strip
to generate an immobilized pH gradient. The pH
gradients are created with sets of acrylamido buffers,
which are derivatives of acrylamide containing
both reactive double bonds and buffering groups.
The general structure is CH
R contains either a carboxyl [–COOH] or a tertiary
amino group (for example, –N(CH
derivatives are covalently incorporated into
polyacrylamide gels at the time of casting and
can form almost any pH gradient (Righetti 1990).
IPG strips are:
Supplied commercially and ready to use
Prepared on a plastic backing to simplify handling
Highly reproducible and stable over even extended
IEF runs (Bjellqvist et al. 1982)
Available in a wide variety of pH gradients and
lengths (see the ReadyStrip
=CH–CO–NH–R, where
2
). These acrylamide
3)2
™
IPG Strips sidebar)
Historically, first-dimension IEF was performed
using carrier ampholyte–generated pH gradients
and tube gels. This type of first dimension has been
largely superseded by the use of IPG strips for the
following reasons:
Carrier ampholyte tube gels must be cast by the user
Carrier ampholyte–generated pH gradients drift
over time and are, therefore, not as reproducible
as immobilized pH gradients
Carrier ampholytes are complex chemical
mixtures, and batch-to-batch variations affect the
characteristics of the pH gradient
Narrow pH gradients and gradients encompassing
the extremes of the pH range (below pH 4 and above
pH 9) cannot be accommodated
Tube gels can be difficult to handle
COOH
NH
3
COOH
NH
3
pH < pl
Fig. 3.1. Dependence of protein net charge on the pH of its environment. The pH at which the net charge is 0 is the isoelectric point (pI).
pH = pl
COO
NH
NH
COO
3
3
pH > pl
COO
NH
NH
COO
2
2
Net Charge
+ 3
+ 2
+ 1
0
3 4 5 6 7 8 9 10 11 pH
– 1
– 2
– 3
Isoelectric point (pl)
ReadyStrip IPG Strips
IPG strips simplify first-dimension separations by
immobilizing the pH gradient on an easy-to-handle
support strip. ReadyStrip IPG strips are available
in a wide selection of pH gradients and strip
lengths (from 7 to 24 cm) to fit Bio-Rad vertical
electrophoresis cells and gels. Premade ReadyStrip
IEF buffers are also available for convenience and
maximum reproducibility.
Relative separation. Relative focusing power
is arbitrarily assigned a baseline focusing power of
1.0 to calculate the relative focusing powers of the
other strips.
expresses the enhanced resolution expected in the
9
Anode
5
+
pH
Anode
Fig. 3.2. Principle of IEF. A mixture of proteins is separated in a pH gradient and within an electric field according to each protein’s pI
and independently of its size. The proteins migrate until they reach their pI.
+
pH
3
6
3 4 5 6 7 8 9 10
3
3
3
3
3 4 5 6 7 8 9 10
4
8
3
4
4
4
4
6
8
7
5
5
5
4
5
10
Focusing
5
6
6
6
6
5
3
9
4
10
7
7
10
8
7
8
8
6
77
9
8
5
6
9
9
9
9
4
3
Cathode
–
9
10
10
10
Cathode
–
first dimension when using IPG strips of different
lengths or pH ranges. The 7 cm pH 3–10 IPG strip
ReadyStrip IPG strip pH ranges.
pH Relative Focusing Power ReadyStrip IEF Buffer
Strip Range* 3 4 5 6 7 8 9 10 7 cm 11 cm 17 cm 18 cm 24 cm 3–10 7–10 3.9–5.1 4.7–5.9 5.5–6.7 6.3–8.3
Broad Range
3–10 1× 1.6× 2.4× 2.6× 3.4× •
3–10 nonlinear (NL) 1× 1.6× 2.4× 2.6× 3.4× •
Narrow range
3–6 2.3× 3.7× 5.7× 6.0× 8.0× •
5–8 2.3× 3.7× 5.7× 6.0× 8.0× •
7–10 2.3× 3.7× 5.7× 6.0× 8.0× •
4–7 2.3× 3.7× 5.7× 6.0× 8.0× •
Micro range
3.9– 5.1 5.8× 9.2× 14.2× 15.0× 20.0× •
4.7–5.9 5.8× 9.2× 14.2× 15.0× 20.0× •
5.5– 6.7 5.8× 9.2× 14.2× 15.0× 20.0× •
6.3–8.3 3.5× 5.5× 8.5× 9.0× 12.0× •
* Strips are designed with sufficient overlap to allow spot matching while limiting the extent of redundant data.
Ready Stri p IPG str ips ar e prep rinte d to indi cate an ode (+) and p H rang e;
in addition, a bar code i s prin ted on th e 24 cm str ip.
34 35
Page 20
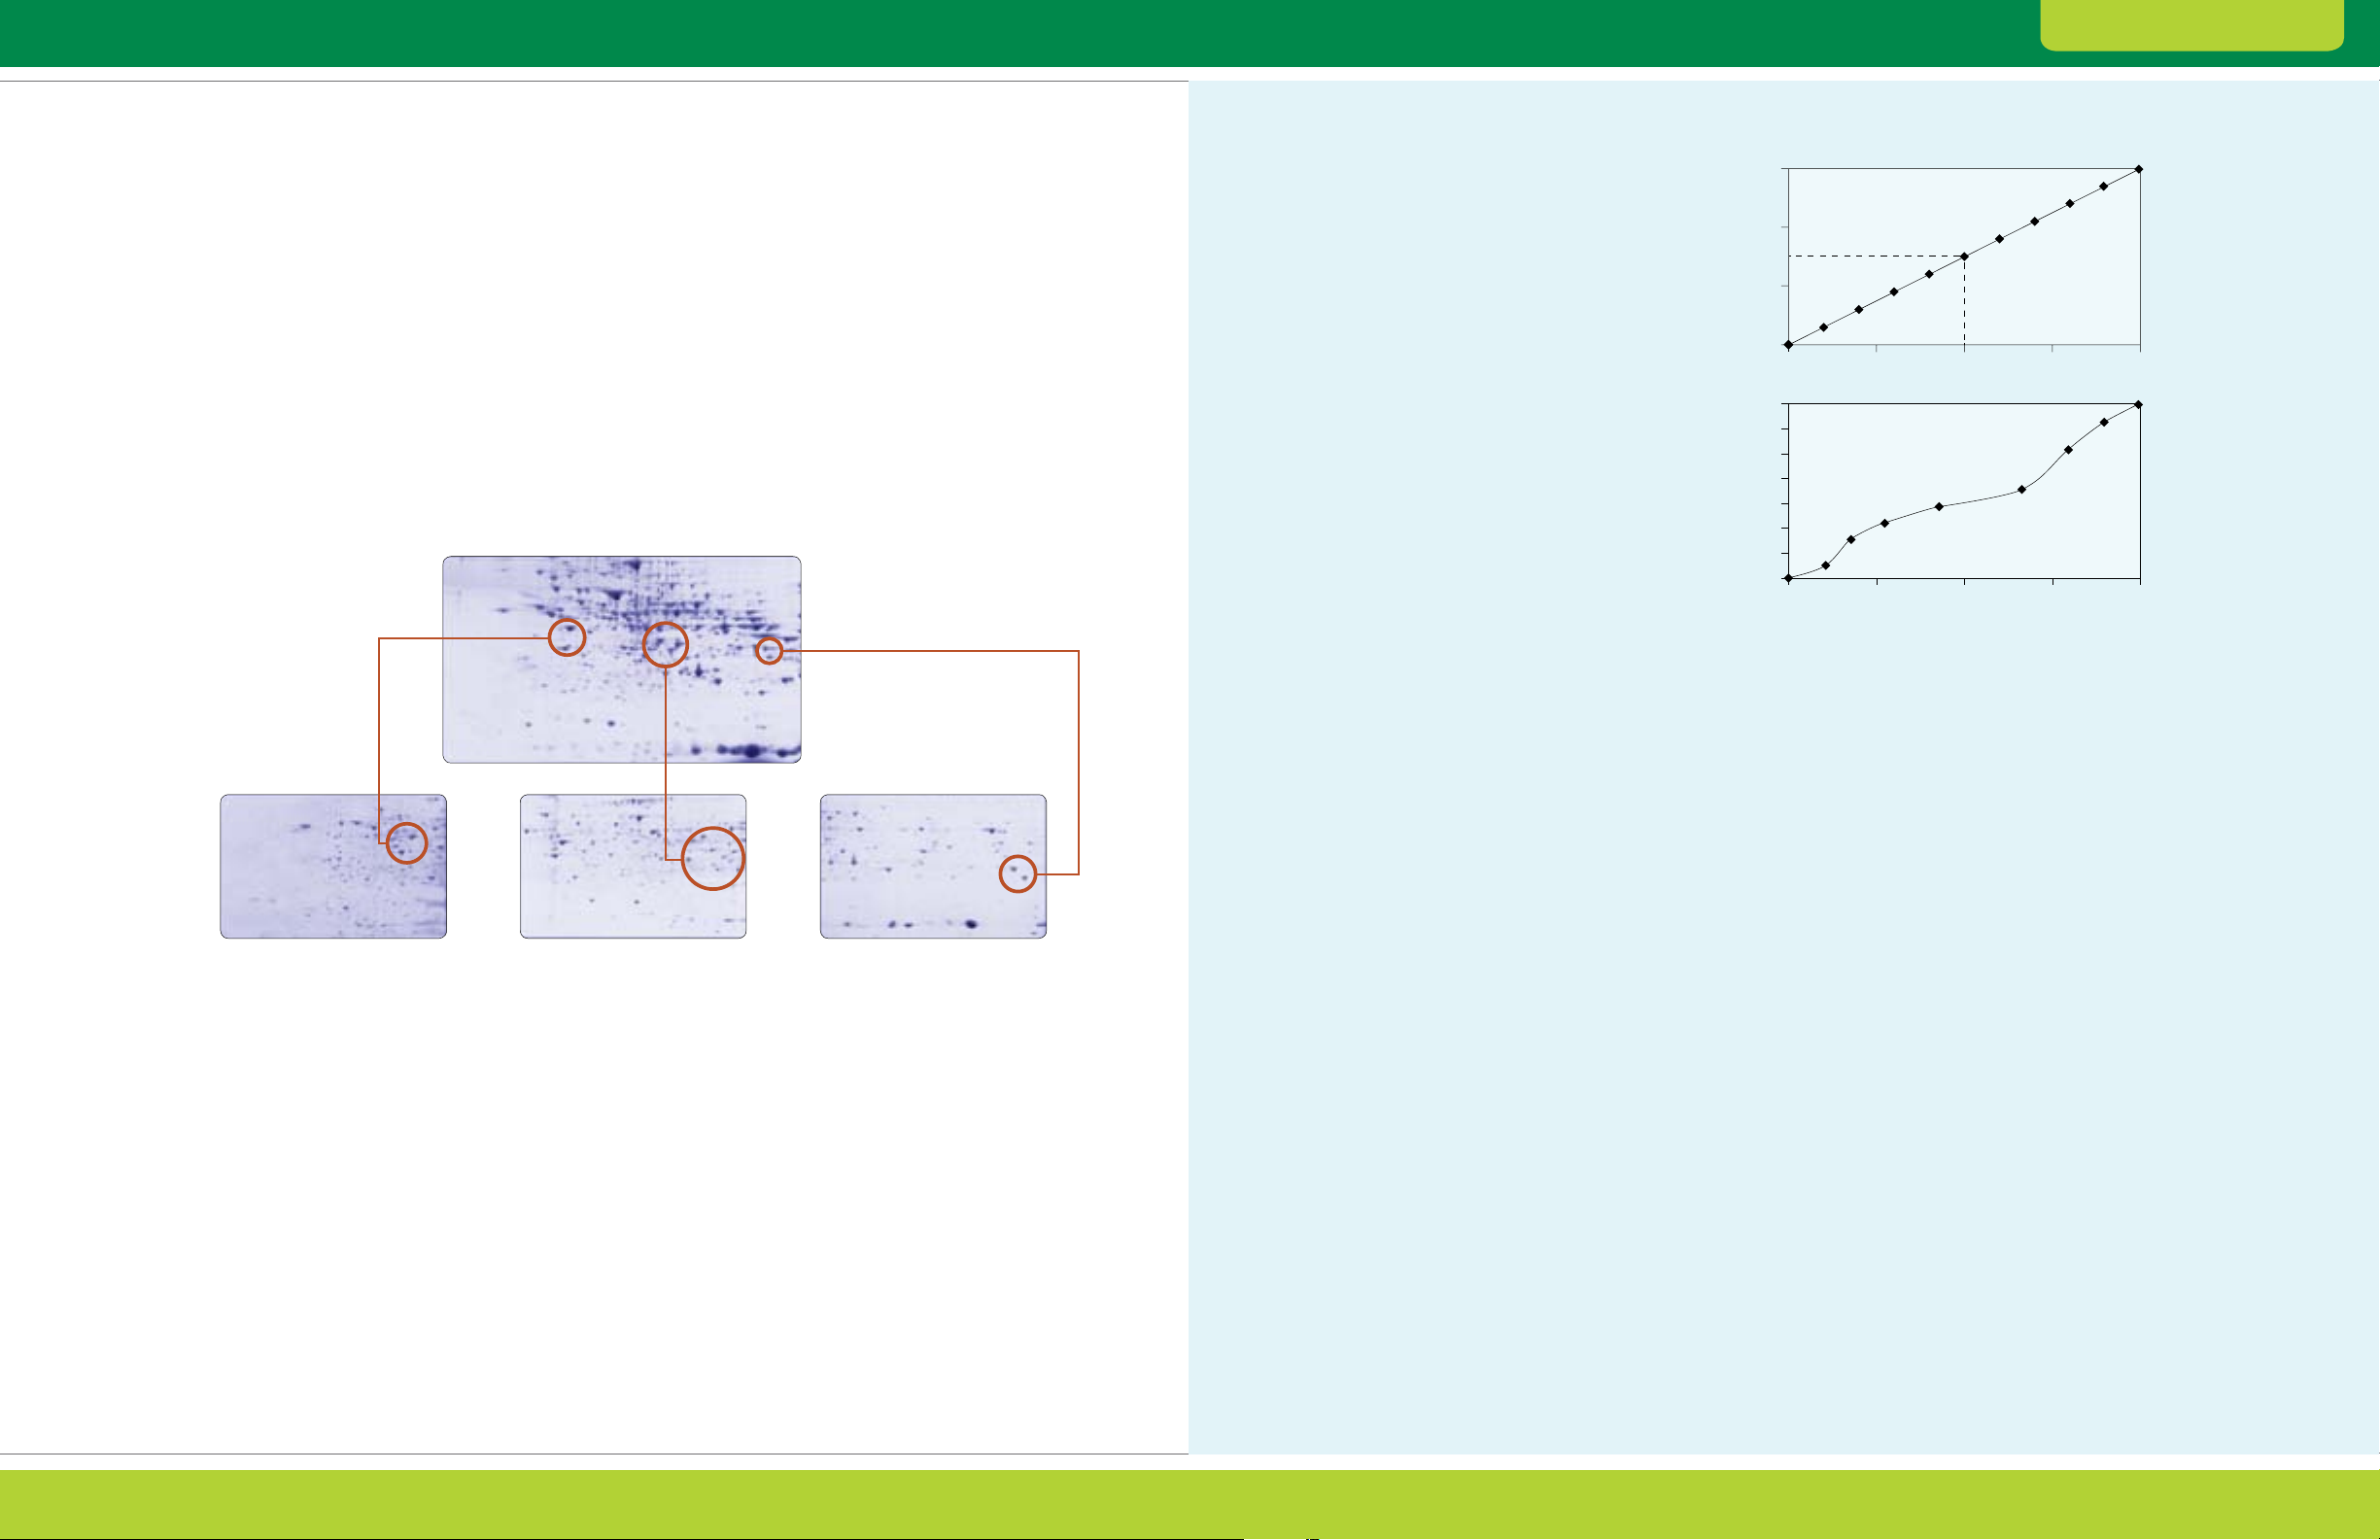
2-D Electrophoresis Guide Theor y and Product Selection
Chapter 3: The First Dimension: Isoelectric Focusing (IEF)
Selection of IPG Strips
When selecting the IPG strip, consider both the pH
gradient and strip length, as both determine the
resolution in the final 2-D gel (see the ReadyStrip IPG
strips sidebar).
Choice of pH Gradient
IPG strips are available in various pH gradients
(see the table in the ReadyStrip IPG Strips sidebar).
The pH gradients are linear (pH varies in a linear
manner with respect to length of the strip) except in
the case of nonlinear pH 3–10 gradients (NL, see the
Estimation of pI sidebar).
Use broad-range strips (for example, pH 3–10)
for an overview of the spot distribution along the
pH gradient and for comparing different sample
in the middle of the pH range 3–10, using NL
gradients can improve resolution of proteins in the
middle of that range and compress the width of the
extreme pH ranges at the ends of the gradients
Use narrow- and micro-range gradients for greater
resolution (there is a larger separation distance, more
cm of gel, per pH unit). With the exclusion of proteins
outside the pH range of the strip, more total protein
mass can be loaded per strip to also allow detection
of more proteins
Use overlapping pH ranges to increase resolution by
expanding a small pH range across the entire width
of a gel (Figure 3.3). This also allows the creation
of composite gels by matching spots from the
overlapping regions using imaging software
preparation strategies. Since many proteins focus
pH 3 –10
pH 3– 6 p H 5– 8 pH 7–10
Fig. 3.3. A mouse liver sample was extr acted in a urea-thiourea-CHAPS solution. T he extract was run in a single PROTEAN® i12™ IEF cell
run on twelve 11 cm ReadyStrip IPG strips simultaneously at each of the following pH ranges: 3–10, 3–6, 5–8, and 7–10. Each pH gradient was
run in triplicate. The second dimension for each IPG strip was run in 8 –16% gradient Cr iterion
Coomassie stain. The above figure shows a representative gel image for each pH range.
Choice of IPG Strip Length
IPG strips are available in a variety of lengths that
match the size of most commercial second-dimension
vertical electrophoresis systems. Shorter strips match
mini-format systems, and longer strips match largeformat systems. Deciding which strips to use depends
on the requirements for speed, sample volume,
resolution, and throughput (see Chapter 4 for more
details on selecting size format for 2-D electrophoresis):
Use shorter strips and mini-format gels for
fast, convenient sample screening or method
development
Use longer strips for the best separation with
higher protein loads and for maximum resolution.
The longest IPG strips and large-format gels have
a large area to resolve protein spots; however, they
take a long time to run
Combine different size formats for various benefits.
For example, use a mini-format system for rapid
optimization of sample preparation methods, then
switch to a large format for thorough assessment of
a complex sample and identification of proteins of
interest. In many cases, a mini system and narrowrange IPG strips can then be used to focus in on
proteins of interest
Use overlapping narrow- and micro-range IPG strips
to increase the effective length of pI resolution.
When three narrow-range overlapping ReadyStrip
IPG strips (pH 3–6, 5–8, 7–10) are used with the
Criterion system, for example, the resolution in the
first dimension (11 cm strip, pH 3–10 NL) is increased
from 11 to 26 cm. When four micro-range strips
are used, the resolution in the first dimension is
expanded from 11 to 44 cm
™
precast gels that were stained with Bio-Safe™
Estimation of pI
The pI of a protein is a useful parameter for protein
characterization. With purified proteins, pI can be
determined by IEF using IPG strips, usually under
denaturing conditions. Using linear IPG strips, the pH
gradient can be assumed to extend linearly between
the pH extremes. Knowing the length and pH range
of the IPG strip implies that experimental pI values can
be assigned with a high level of accuracy (see figure).
Protein pI estimations can also be made using NL
IPG strips, assuming the pH profile of the IPG strip is
available from the manufacturer; without the exact pH
profile of the strip, the pI estimate will be less accurate.
For pI estimation, stain the IPG strips after IEF,
for example with Bio-Safe Coomassie blue stain,
and then plot the migration distance along the length
of the IPG strips of each of the protein standards.
Graph A shows the pH gradient along the length
of a linear pH 4–7 IPG strip. To determine the pI of
an unknown, simply determine the band position
(as a percentage of gel length) and read the pI from
the graph. In the example, a band positioned at 50%
of the gel length will have an estimated pI of 5.5.
The same strategy can be applied for protein spots
on 2-D gels, but with less accuracy due to swelling
or shrinkage of the 2-D gel. It may also be difficult to
define the start and end positions of the IPG strip on
stained 2-D gels.
With knowledge of experimental pI and molecular
weight values (see Chapter 4 for details about
molecular weight estimation), it is possible to make
comparisons with the calculated values derived after
protein spot identification using mass spectrometry.
The calculation of theoretical pI values is possible with
software tools available on the Internet, for example
at http://web.expasy.org/compute_pi. If the values
differ significantly from each other, this may indicate
a false identification or the identification of a fragment
of the respective protein. However, differences in pI or
molecular weight can also suggest posttranslational
modifications, such as phosphorylation or glycosylation.
The detection of posttranslational modifications
is a unique strength of gel-based proteomics.
These modifications offer information about the
function, regulation, and cellular location of proteins.
A. Linear pH 4 –7 ReadyStrip IPG strip
7
6
5
4
0 25 50 75 100
B. Nonlinear pH 3–10 ReadyStrip IPG strip
10
9
8
7
pH pH
6
5
4
3
0 25 50 75 100
Estimating the pI of a protein fr om its position along an IPG
strip. A, By plot ting the pH of an IPG strip as a function of its
length, the pI of a protein may be derived from its focused position
on that strip. In the example shown, the pI of a protein that migrates
across 50% of the strip length is 5.5. B, pH profile of Bio-Rad
ReadyStrip nonlinear pH 3–10 IPG strips.
% Total IPG stri p lengt h
36 37
Page 21

2-D Electrophoresis Guide Theor y and Product Selection
Chapter 3: The First Dimension: Isoelectric Focusing (IEF)
Sample Application
Commercial IPG strips are dehydrated and must be
rehydrated to their original gel thickness (0.5 mm)
before use. The protein sample can be applied
to the IPG strip either during or after rehydration,
and rehydration can be done in either disposable
rehydration/equilibration trays or directly in the
focusing tray. Sample application during rehydration
is the easiest and, in most cases, most efficient way to
apply sample. In some instances, however, it is best
to rehydrate the IPG strips and then apply sample
through sample cups while current is applied
(cup loading) (Table 3.1). Each method is discussed
in the following sections.
The rehydration solution generally contains the
following components to maintain protein solubility and
allow tracking of the separation (see Part II, Methods
for recipes):
Chaotrope — urea (8 M or up to 9.8 M if necessary
for sample solubility), with or without 2 M thiourea
Detergent — nonionic or zwitterionic detergent such
as CHAPS, Triton X-100, or NP-40 at 0.5–4% (w/v)
Reducing agent — 20–100 mM DTT
Ampholytes — 0.2% (w/v), usually pH 3–10;
concentrations up to 1% (w/v) may be used,
though this reduces the voltage and results in
correspondingly longer runs
Tracking dye — a trace of bromophenol blue to
render the IPG strip more visible for simplified handling
The composition of the rehydration solution should
also resemble the composition of the sample solution
in terms of the additives present to aid solubility. If the
sample was prepared using thiourea, the rehydration
solution should also contain thiourea. Likewise, the
same detergent should be used. Otherwise, transition
from one solution to the other can cause precipitation
of proteins that are soluble in the sample solution but
not in the rehydration solution
Sample Application during Rehydration
In this option, the sample is prepared in, or diluted into,
rehydration solution and introduced to the IPG strip
at the time of rehydration. As the strips hydrate for
at least 12 hr, proteins in the sample are absorbed
and distributed over the entire length of the strip
(Rabilloud et al. 1994, Sanchez et al. 1997).
Sample application can be in either the absence
(passive) or presence (active) of applied voltage:
Active rehydration is performed in the IEF cell. A low
voltage (30–100 V) is applied, and proteins enter the
gel matrix under current as well as by absorption.
Active rehydration with the sample is believed to
promote the entry of large proteins into the strip by
applying an electrical “pull”
In passive rehydration, proteins enter the gel
by absorption only. This allows efficient use of
equipment, since strips can be rehydrated in sample
rehydration trays while other samples are focused in
the IEF cell
and act as a tracking dye for confirmation of focusing
Table 3.1. Advantages and disadvantages of sample loading methods.
Method Advantages Disadvantages
In-gel rehydration Simple sample application Poor resolution of basic proteins
No precipitation at the point of sample application
Accommodates dilute samples and larger protein loads
Passive Focusing can follow rehydration without manual Not all proteins, particularly large or hydrophobic
intervention if pe rformed within the IEF instrument proteins, will be taken up
Active More effe ctive with cer tain proteins, particularly those Rehydration must occur within the IEF instrument
of high molecular weight
Cup loading More effective for basic proteins Setup more complicated; the cup must form a seal
Can improve resolution at ex tremes of the pH gradient High protein loads are difficult to accommodate;
(the end opposite the point of application) concentrated samples are required.
Sample precipitation may occur at the point
with the IPG strip
of application
Whether IPG strips are rehydrated actively or passively,
they must be incubated with sample for at least 12 hr
prior to IEF. This gives high molecular weight proteins
time to enter the gel after the gel has become fully
hydrated and the pores have attained full size.
Sample application during rehydration works
because IEF is a steady-state technique; therefore,
proteins migrate to their pI independently of their initial
positions. The advantages of these approaches
over cup loading are:
Simplicity
Reduced risk of sample precipitation, which can
occur with cup loading at the sample application
point if sample concentration is too high
(Rabilloud 1999)
Shorter focusing times can be used because the
sample proteins are in the IPG strip prior to IEF
Large amounts of protein can be loaded
Sample Application by Cup Loading
To apply samples after IPG strip rehydration,
the sample is loaded into sample cups positioned
on the rehydrated strip. This technique can be more
challenging than in-gel sample loading from a technical
standpoint, but it can be beneficial in the following
cases (Cordwell et al. 1997, Görg et al. 2000):
When samples contain high levels of DNA, RNA,
or other large molecules, such as cellulose
When running acidic and basic IPG strips;
for example, pH 7–10
When running micro-range IPG strips spanning
~1 pH unit
For samples that contain large amounts
of glycoproteins
Setup for IEF
For IEF, the rehydrated IPG strips are placed into the
focusing tray. The orientation (gel-side up or gel-side
down) of the IPG strip in the focusing tray is largely
determined by the sample loading method employed:
Cup loading requires gel-side up strip placement so
that the sample cup may be placed in contact with
the gel surface
In-gel sample loading is conducted gel-side down.
If the IEF cell is programmed for an unattended start
following rehydration, IEF must be conducted gelside down as well
If in-gel sample loading is performed in the
rehydration/equilibration tray, IEF may be performed
either gel-side up or gel-side down. This is largely
a matter of user preference, though improved
resolution may be observed with the gel-side up
configuration, particularly with higher protein loads
In addition, electrode wicks may be placed between
the electrode in the focusing tray and the IPG strip in
either running configuration. Electrode wicks serve
as a sink for ionic sample contaminants and proteins
with pIs outside the pH range of the IPG strip used.
They also prevent drying of the ends of the IPG
strips during IEF. In some cases, however, the use of
electrode wicks has little effect on separation quality,
and they may be omitted for convenience in either
running configuration if satisfactory results are
obtained in their absence.
38 39
Page 22
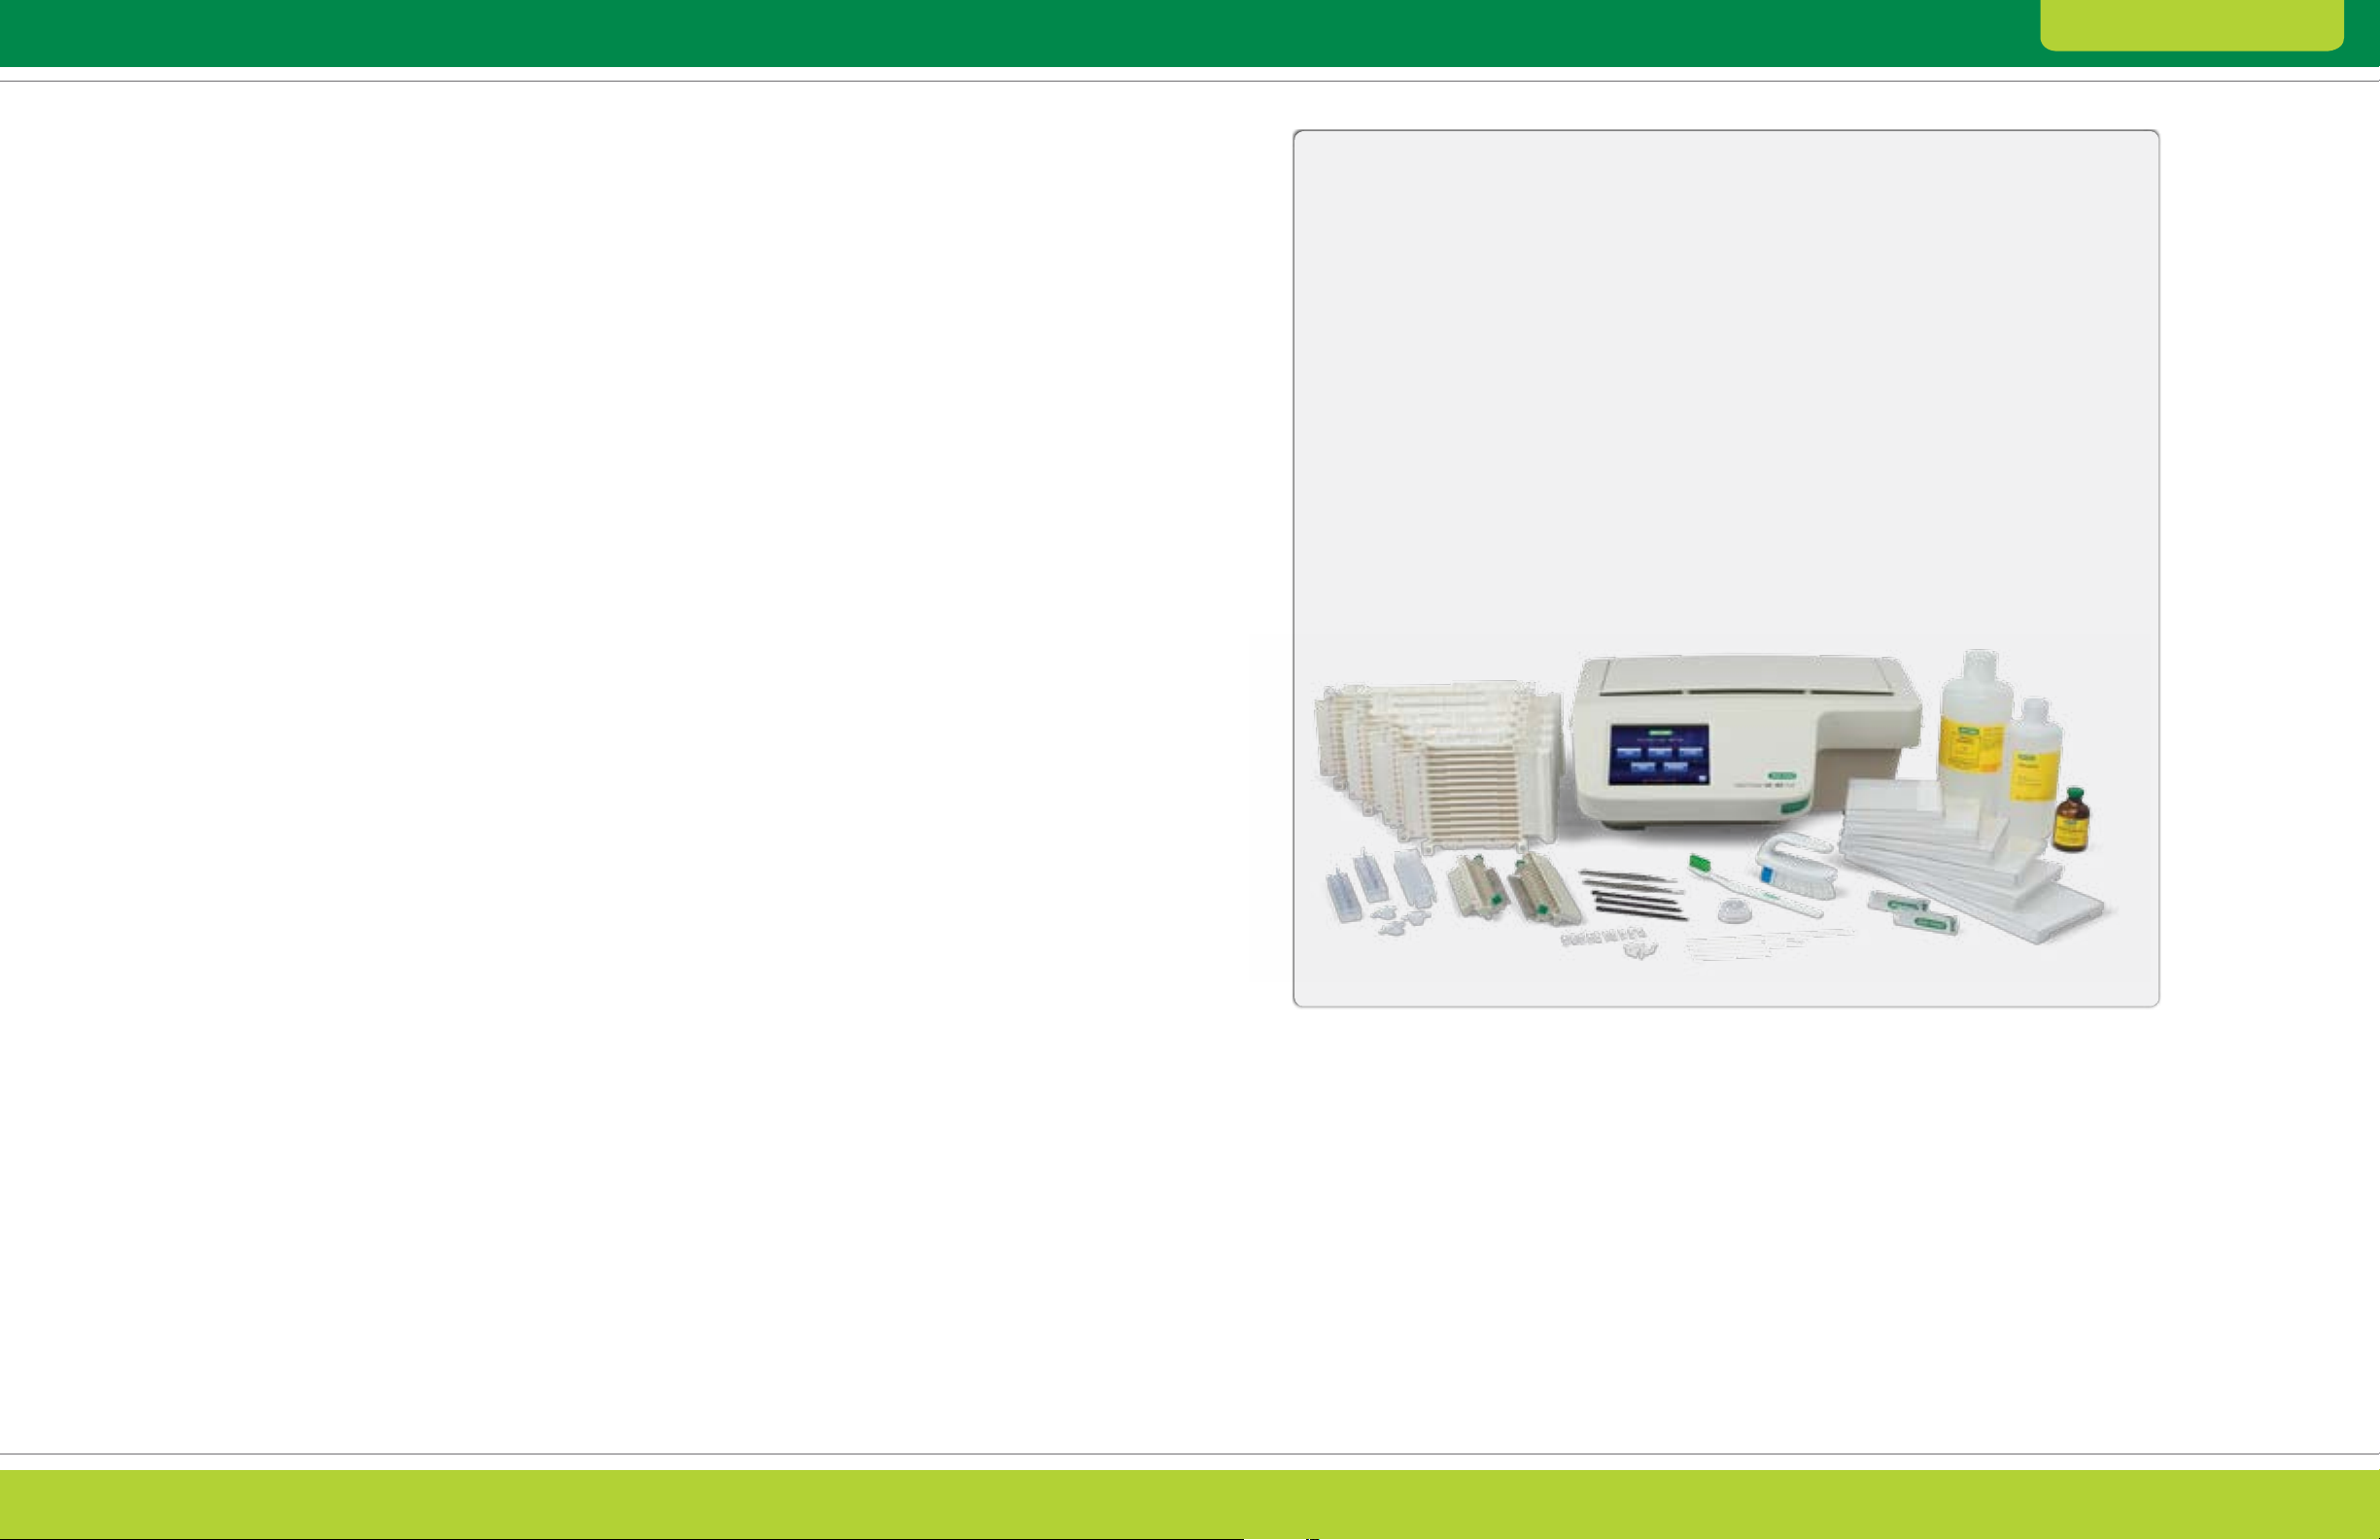
2-D Electrophoresis Guide Theor y and Product Selection
Chapter 3: The First Dimension: Isoelectric Focusing (IEF)
Power Conditions for IEF
The pH gradient and the electric field strength both
influence the time required to reach steady state and
the resolution of the separation. The electric field
strength is determined by the length of the IPG strip
and the applied electrical field. In general, narrow
pH ranges yield higher resolution and require higher
voltages and more time to reach a steady state.
Longer IPG strips can withstand higher programmed
voltages and require an increased number of volthours (Vh) for proper focusing. Vh are the product of
voltage and time. Because the actual voltage reached
is current dependent and the maximum programmed
voltage may not be reached, programming the IEF
cell with Vh can better ensure that samples receive
a consistent number of volts.
The electrical conductivity of the system changes
during an IEF run. At the beginning, the current is
relatively high because of the large number of charge
carriers present. As the proteins and ampholytes
move toward their pIs, and as ionic contaminants
move to the ends of the IPG strip, the current
gradually decreases. When the proteins reach their
final positions in the pH gradient, there is little ionic
movement in the system; the voltage reaches a
maximum, and the current reaches a minimum.
Focusing should occur with a gradual increase in
voltage followed by a prolonged focusing phase at the
maximum voltage advisable for the IPG strip length
used and until a set number of Vh have accumulated.
The optimum duration depends on the length of the
IPG strip and the pH gradient. Current is generally
limited to 50 µA per IPG strip, and a streamlined onestep protocol is adequate in most circumstances,
as the voltage will rise gradually without the need for
a phased focusing protocol with programmed voltage
ramping. A more gradual focusing protocol may be
advisable in circumstances of heavy protein load,
for some narrow- and micro-range IPG strips,
or when there are high levels of charged contaminants
present. Since the duration of the prolonged focusing
phase is specified in Vh, the actual duration may vary
depending on the average voltage during focusing.
Focusing may conclude at different times for IPG
strips run at the same time with the same protocol.
It is important, therefore, to include a hold step during
which the IPG strip is held at a relatively low voltage to
maintain focusing until the IPG strip can be removed
from the instrument.
Electrical current generates heat, which limits the
magnitude of the electric field that can be applied and
the ionic strength of the solutions that can be used.
Thin gels dissipate heat better than thick gels and thus
better withstand the high voltage that offers higher
resolution. Also, as mentioned above, the current
drops to a constant low value as focusing reaches
a steady state.
PROTEAN i12 IEF System
The PROTEAN i12 IEF system allows multistep runs
at durations set by either time or Vh. Recommended
starting electrical conditions and voltage ramping
options are provided in Part II of this guide; however,
sometimes the number of Vh required to complete a
run must be determined empirically in a time course
experiment. The optimum Vh depends on the
sample and the composition of the sample solution
as well as the pH gradient of the IPG strip. A more
complex sample or different sample buffer might
change the Vh required. The time needed to achieve
the programmed Vh depends on the pH range
of the IPG strip as well as sample and buffer
characteristics.
Other IEF cells only support running identical pH
gradients and similar samples in batches because
the programmed current and voltage are spread
across all lanes. If different pH ranges or samples
with varying conductivity are run at the same time,
the electrical conditions experienced by individual
IPG strips are different. This may expose some
strips to more or less current than desired, since
the total current limit is averaged over the tray.
The individual lane control provided by the
PROTEAN i12 IEF cell, however, ensures that
the current limit is not exceeded in any IPG strip,
even in situations where conductivity differs
significantly among samples run at the same time.
The PROTEAN i12 IEF cell also allows each lane
to be programmed individually, making it possible
to run different protocols in different lanes.
The flexibility of this system allows running different
experiments at once or varying conditions within
an experiment to allow optimization in fewer runs.
The system also results in better reproducibility
because focusing conditions are not influenced
by other samples in the run.
PROTEA N i12 IEF Cell and Acc esso ries
40 41
Page 23

2-D Electrophoresis Guide Theor y and Product Selection
CHAPTER 4
The Second Dimension:
SDS-PAGE
42 43
Page 24

Mini-PROTEAN TGX
Any kD4–20%4–15%12%10%7.5%
Precision Plus Protein Unstained
250
150
100
75
50
37
25
20
15
10
250
150
100
75
50
37
25
20
15
10
250
150
100
75
50
37
25
20
15
10
250
150
100
75
50
37
25
20
15
250
150
100
75
50
37
25
20
250
150
100
75
50
37
Mini-PROTEAN TGX
2-D Electrophoresis Guide Theor y and Product Selection
Chapter 4: The Second Dimension: SDS-PAGE
Protein Separation by Size
The second-dimension separation is by protein size
(mass) using SDS-PAGE. The proteins separated in
IPG strips by IEF in the first dimension are applied to
polyacrylamide gels and separated a second time by
SDS-PAGE (Figure 4.1).
A two-step equilibration process prepares the proteins
for SDS-PAGE. The proteins are complexed with
SDS, reduced with DTT, and then alkylated with
iodoacetamide. Treatment of the proteins with SDS
yields protein-SDS complexes with a consistent
charge-to-mass ratio. When electrophoresed through
a polyacrylamide gel, these complexes migrate with a
mobility that is related logarithmically to mass. As the
proteins migrate through the gel, the pores of the gel
sieve proteins according to size.
Selection of Polyacrylamide Gels
Polyacrylamide gels are prepared by free radical
polymerization of acylamide and a comonomer
crosslinker such as bis-acrylamide. By convention,
gels are characterized by two parameters that
determine pore size: total monomer concentration
(%T, in g/100 ml) and weight percentage of crosslinker
(%C). SDS-PAGE gels typically have a %C of 2.7%,
and the %T is varied to give separation characteristics
appropriate to the experimental needs. %T determines
the relative pore size of the resulting polyacrylamide
gel, with higher %T resulting in smaller pores and
separation characteristics more appropriate for
smaller proteins.
Gels are either purchased as commercial precast
gels or cast in the laboratory using unpolymerized
monomer and buffer components. Precast gels are
available in smaller formats to fit commercially available
electrophoresis cells. These are appropriate for the
second dimension when the first dimension is run on
7 cm or 11 cm IPG strips. Larger second dimensions
are generally run on lab-cast gels.
First Dimension
Isoelectric focusing (IEF),
separation by pl
Second Dimension
SDS-PAGE,
separation by MW
Low pH High pH
High MW
Choice of Gel Percentage (Composition)
Gels for SDS-PAGE are made with either a single,
continuous %T throughout the gel (single-percentage
gels) or a gradient of %T (gradient gels). Gradient gels
are cast with acrylamide concentrations that increase
from top to bottom so that the pore size decreases
as proteins migrate into the gels. Single percentage
gels are cast in the laboratory by simply pouring the
appropriate percentage of acrylamide, along with
bis-acrylamide, buffer, initiator, and catalyst, into a
gel cassette prepared using glass plates and spacers
clamped together. The mixture is poured into the
cassette and allowed to polymerize. A stacking layer
is not necessary for second-dimension gels. Gradient
gels may also be cast in the laboratory using solutions
of differing acrylamide percentage and a gradient
maker. Typical gel compositions are 7.5–20% for
single-percentage gels, and 4–15% to 10–20% for
gradient gels.
Use protein migration charts and tables to select
the gel type that offers optimum separation of your
sample (Figure 4.2):
Use single-percentage gels to separate bands of
similar size. Since optimum separation occurs in the
lower half of the gel, choose a percentage in which
the protein of interest migrates to the lower half of
the gel
Use gradient gels to separate a broad range of
protein sizes. Gradient gels allow resolution of
both high- and low-molecular weight bands on the
same gel. The larger pore size towards the top of
the gel permits resolution of larger molecules, and
decreasing pore sizes toward the bottom of the gel
restrict excessive separation of small molecules.
Gradient gels are often the most appropriate choice
for 2-D electrophoresis, which is most often applied
to complex samples with proteins spanning a large
size range
For new or unknown samples, use a broad gradient
gel (for example, 4–20 %T or 8–16 %T or Bio-Rad’s
™ 3
Any kD
formulation) for a global evaluation of the
sample, and then move to an appropriate single-
Precision Plus Protein Unstained
Any kD4–20%4–15%12%10%7.5%
75
50
37
25
20
15
10
200
116
250
150
100
97.4
66
45
31
21.5
14.4
6.5
250
250
150
150
100
100
75
50
37
200
116
97.4
66
45
31
Fig. 4.2. Examples of migration charts. The protein standards
were run on Mini-PROTEAN
250
150
100
75
50
37
25
20
Broad Range Unstained
200
116
97.4
21.5
97.4
66
45
31
21.5
14.4
75
50
37
25
20
15
200
116
66
45
31
250
150
100
97.4
21.5
14.4
®
TGX™ gels.
75
50
37
25
20
15
10
200
116
250
150
100
75
50
37
25
20
15
10
Any kD4–20%4–15%12%10%7.5%
200
116
97.4
66
66
45
31
6.5
45
31
21.5
14.4
6.5
percentage gel for more detailed investigation of a
particular size range of interest
Low MW
Fig. 4.1. Separation of proteins by SDS -PAGE after separation by IEF. The IPG strip containing proteins already separated by pI is applied
to the top of a polyacrylamide gel. The proteins are then separated according to size (MW) by SDS-PAGE.
3
Bio-Rad’s Any kD formulation provides separation of 10–250 kD
proteins, with the best resolution in to the 20–100 kD range.
These gels are useful for screening samples or for 2-D applications
aimed at rapid protein analysis.
44 45
Page 25

2-D Electrophoresis Guide Theor y and Product Selection
Chapter 4: The Second Dimension: SDS-PAGE
Vertical Electrophoresis Systems
for SDS-PAGE
The electrophoresis systems offered by Bio-Rad
for second-dimension electrophoresis are detailed
in the table.
The Mini-PROTEAN system includes the
Mini-PROTEAN Tetra cell (with a capacity
of up to four gels) and the high-throughput
Mini-PROTEAN
®
3 Dodeca™ cell (for running up to
12 gels). These systems accommodate 7 cm IPG
strips and are compatible with handcast or precast
Mini-PROTEAN gels (8.6 × 6.7 cm)
Bio-Rad’s vertical electrophoresis systems.
Mini-PROTE AN System Criterion System PROTEAN II System PROTE AN Plus System
Cells Mini-PROTEAN Tetra Cell Criterion Cell PROTEAN II XL Cell PROTE AN Plus Dodeca Cell
Mini-PROTEAN Dodeca Cell Criterion Dodeca Cell PROTEAN II XL Multi Cell
Number of gels 1–4 1–2 1–4* 1–12
1–12 1–12 1–6
Gel formats Mini-PROTEAN precast Criterion precast PROTE AN II ha ndcast PROTEAN Plus handcast
Mini-PROTEAN handcast Criterion empty cassettes
IPG strip length 7 cm 11 cm 17 cm 18 and 24 cm
* For 2-D applications running a maximum of 2 gels at a time is recommended.
The Criterion™ system includes the Criterion
cell (for 1–2 gels) and the high-throughput
Criterion Dodeca cell (for 1–12 gels); both cells
accommodate Criterion precast gels (13.3 × 8.7 cm)
and 11 cm IPG strips
The PROTEAN II and PROTEAN Plus Dodeca
systems accommodate 17, 18, or 24 cm IPG strips.
The PROTEAN II system provides the ability to
choose the glass plates, spacer, and sandwich
clamps to cast two gel lengths: 16 or 20 cm.
The PROTEAN Plus Dodeca cell allows maximum
throughput for 2-D electrophoresis, with the
capability to run up to 12 2-D gels at a time
PowerPac™ Power Supplies
Power supplies are required to meet the power
requirements of numerous applications. The choice
of power supply for second-dimension PAGE usually
depends on the size and number of gels being run:
Use the PowerPac Basic or PowerPac HC highcurrent power supply for mini-format vertical
PAGE applications
Use the PowerPac HV high-voltage or PowerPac
Universal power supply for large-format vertical
PAGE applications
Use the PowerPac HC power supply for
applications that require high currents, such as
PAGE with the high-throughput Dodeca cells
PowerPa c HC High -Cu rren t
Power Supply
PowerPac Univer sal
Power Supply
PowerPac Basic
Power Supply
PowerPac HV High-Voltage
Power Supply
Choice of Gel Size
The choice of gel size depends on the same factors
determining the length of IPG strip used, namely
speed, resolution, and throughput (see the Choice of
IPG Strip Length section):
Mini-format systems accommodate short IPG strips
(7 cm) and mini-format gels. The short separation
distance of the gels maximizes the electrical field
strength (V/cm) to yield rapid separations with
moderate resolution. Use mini gels and systems for
rapid analysis and method development
Midi gels and midi-format systems accommodate
11 cm IPG strips and are slightly larger (both in
width and length) gels. They still offer rapid runs,
but because of the longer separation distance,
they provide better coverage than mini-format gels
Large-format systems accommodate 17–24 cm
IPG strips and large gels and offer the maximum
resolution possible; however, large gel sizes require
longer run times
Choice of Buffer System
The pH and ionic composition of the buffer systems
used to prepare the gels and samples and to fill the
electrode reservoirs determine the power requirements
and heavily influence the separation characteristics of
a polyacrylamide gel. Different buffer systems also
vary widely in their stability.
Precast Gels for Second-Dimension
SDS-PAG E
Bio-Rad offers precast gels in two size formats and
in a variety of formulations, some of which feature
IPG wells to hold two lengths of ReadyStrip
strips (7 cm and 11 cm).
Bio-Rad’s TGX
™
(Tris-Glycine eXtended shelf life)
precast gels are Laemmli gels with a proprietary
modification that extends shelf life to 12 months
and allows gels to be run at higher voltages without
producing excess heat. The TGX formulation does
not require special, expensive buffers. Like Tris-HCl
gels, TGX gels use a discontinuous buffer system,
with glycinate as the trailing ion, and are, therefore,
™
IPG
The most common buffer system for seconddimension SDS-PAGE is the Tris-HCl system
described by Laemmli (Laemmli 1970). The reagents
are inexpensive and readily available, and the precast
gels are also readily available in a wide variety of gel
percentages. The system is robust and highly tolerant
of high sample loads. However, Tris-HCl resolving
gels are prepared at pH 8.6–8.8; at this basic pH,
polyacrylamide slowly hydrolyzes to polyacrylic acid,
which can compromise separation. For this reason,
Tris-HCl gels have a relatively short shelf life.
In addition, the gel pH can rise to pH 9.5 during a
run, causing proteins to undergo deamination
and alkylation, thereby diminishing resolution and
complicating post-electrophoresis analysis.
To alleviate these shortcomings, a number of
alternative buffer systems have been developed.
For example, bis-Tris, Tris-acetate, and other
proprietary buffer systems (see the Precast Gels for
Second-Dimension SDS-PAGE sidebar) offer extended
shelf life as well as other separation characteristics
unique to their formulations.
High-quality precast gels are preferred for highthroughput applications. They provide savings in time
and labor, and the precision-poured gradients result in
reproducibility among runs.
compatible with conventional Laemmli and
Tris/glycine/SDS buffers. These are the best
choice when long shelf life is needed and
traditional Laemmli separation patterns are desired.
TGX Stain-Free
™
gels are Laemmli-like extended
shelf life gels that allow rapid fluorescent detection
of proteins with the stain-free enabled imagers
Gel Doc
™
EZ and ChemiDoc™ MP, eliminating
staining and destaining steps. Other precast
gel formulations have also been developed to
circumvent the shelf life issues of Tris-HCl systems.
46 47
Page 26

2-D Electrophoresis Guide Theor y and Product Selection
Chapter 4: The Second Dimension: SDS-PAGE
Precast Gels for Second-Dimension SDS-PAGE (contd.)
Gel For mat
and For mulation Selection Cr iteria Compos ition Migration (%T)
Mini-PROTEAN*
(for 7 cm IPG Strips)
Mini-PROTEAN TGX Laemmli-like extended Any kD
Stain-Free shelf life gels 7.5%
7.5% 10% 12%Any kD
10%
Best choice when 12%
long shelf life is
needed and traditional
Laemmli separation
patterns are desired
Stain-Free formulation
includes an additive
for rapid fluorescence
detection without
staining
Mini-PROTEAN TGX Laemmli-like extended Any kD
shelf life gels 7. 5%
250
250
150
100
150
75
100
50
37
75
25
20
50
15
37
10
7.5% 10% 12% 4-15% 4-20%Any kD
10%
Best choice when 12%
long shelf life is 4 –15%
needed and traditional 4–20%
Laemmli separation
patterns are desired
250
250
150
100
150
75
100
50
37
75
25
20
50
15
37
10
Gel For mat
and For mulation Selection Cr iteria Compos ition Migration (%T)
Criterion*
(for 11 cm IPG Strips)
Criterion TGX Laemmli-like ex tended Any kD
shelf life gels 7.5%
4– 20%4–15%18%7. 5% 10% 12% 10– 20%Any kD 8–16%
10%
Best choice when 12%
long shelf life is 18%
250
250
150
150
100
100
75
75
50
37
50
25
37
20
25
15
20
needed and traditional 4 –15%
Laemmli separation 4–20%
patterns are desired 8 –16 %
10 – 2 0%
250
150
100
75
50
37
25
20
15
10
250
250
150
100
150
75
100
50
75
37
50
37
25
20
25
15
20
Criterion TGX Laemmli-like ex tended Any kD
Stain-Free shelf life gels 7.5%
250
250
150
150
100
100
75
75
50
37
50
37
25
20
25
15
20
10
15
10
250
250
150
150
100
75
100
75
50
37
50
37
25
20
25
15
20
10
15
10
250
250
150
150
100
100
75
75
50
37
50
37
25
20
25
15
20
10
15
10
4– 20%4–15%18%7. 5% 10% 12% 10– 20%Any kD 8–16%
10%
Best choice when 12%
long shelf life is 18%
250
250
150
150
100
100
75
75
50
37
50
25
37
20
25
15
20
250
250
150
150
100
100
75
75
50
50
37
37
25
20
25
20
15
10
15
10
needed and traditional 4 –15%
Laemmli separation 4– 20%
patterns are desired 8 –16%
10 – 2 0%
Stain-Free formulation
includes an additive
for rapid fluorescence
detection without
staining
250
150
100
75
50
37
25
20
15
10
250
250
150
100
150
75
100
50
75
37
50
37
25
20
25
15
20
250
250
150
150
100
100
75
75
50
37
50
37
25
20
25
15
20
10
15
10
250
250
150
150
100
75
100
75
50
37
50
37
25
20
25
15
20
10
15
10
250
250
150
150
100
100
75
75
50
37
50
37
25
20
25
15
20
10
15
10
Mini-PROTEAN Best choice for 16.5%
Tris-Tricine separation of low 10–20%
MW proteins
10–20%16.5%
25
20
25
20
15
15
10
5
10
2
5
2
Criterion Tris-HCl Reagents are easy to 5%
prepare, inexpensive, 7. 5%
and readily available 10%
12 . 5%
Best choice when 15%
switching between 18%
precast and handcast 4–15%
gels and need to 4–20%
compare results 8–16%
10 – 20%
10 . 5 –14%
18%15%12.5%5% 7.5% 10% 4 –20% 8 –16% 10–20% 10.5–14%4–15%
250
150
250
100
150
250
150
250
100
75
150
100
50
37
75
75
100
50
75
37
50
25
37
20
25
15
250
150
100
250
75
150
100
50
75
50
37
25
20
15
10
250
37
150
25
20
100
75
15
50
37
10
25
20
15
10
250
150
100
250
75
150
50
100
37
75
50
25
37
20
25
20
15
15
10
10
250
250
150
150
100
100
75
75
50
37
50
37
25
20
15
25
10
20
15
10
* All gel percentages listed in bold are available in IPG and /or prep-well comb format.
48 49
Page 27

2-D Electrophoresis Guide Theor y and Product Selection
Chapter 4: The Second Dimension: SDS-PAGE
Precast gels for Second-Dimension SDS-PAGE (contd.)
Gel For mat
and For mulation Selection Cr iteria Compos ition Migration (%T)
Criterion*
(for 11 cm IPG Strips)
Criterion Stain Free Reagents are easy to 10%
Tris-HCl prepare, inexpensive 4–20%
10% 4–20% 8–16%
and readily available 8 –16 %
Best choice when
switching between
precast and handcast
gels and when
comparing results
Stain-Free formulation
includes an additive
for rapid fluorescence
detection without
staining
250
150
250
100
150
75
100
75
50
50
37
37
25
20
25
15
20
10
15
Criterion XT Bis-Tris Offer long shelf life, 10%
but require dedicated 12%
sample and r unning 4–12 %
buffers
250
150
100
75
50
37
25
20
15
10
4–12%12%10% 4–12%12%10%
Gel For mat
and For mulation Selection Cr iteria Compos ition Migration (%T)
Criterion*
(for 11 cm IPG Strips)
Criterion Tris-Tricine Best choice for 16.5%
separation of 10–20%
10–20%16.5%
low MW proteins
26.6
26.6
17.0
14.0
17.0
14.0
6.5
6.5
3.5
3.5
1.4
1.4
Size, kD
(XT MOPS running buffer)
Criterion XT Offer best resolution of 7%
Tris-Acetate high molecular weight 3–8%
Size, kD
(XT MES running buffer)
3–8%7%
proteins, but require
dedicated sample and
running buffers
Size, kD
(XT Tricine running buffer)
* All gel percentages listed in bold are available in IPG and /or prep-well comb format.
50 51
Page 28

2-D Electrophoresis Guide Theor y and Product Selection
Chapter 4: The Second Dimension: SDS-PAGE
Casting SDS-PAGE Gels Using
Multi-Casting Chambers
In general, proteomics work requires running
several IPG strips and second-dimension gels
per experiment. It is important that gels have a
very similar composition. The best way to ensure
that handcast gels have the same composition is
to cast them at the same time in a multi-casting
chamber. This is especially important when casting
gradient gels. Details of the assembly and use
of multi-casting chambers are available in their
accompanying instruction manuals. Tips that
generally apply to all multi-casting systems are:
Before assembling the casting chamber, glass
plates should be carefully cleaned with Bio-Rad
cleaning concentrate and thoroughly rinsed with
deionized water
Apparatus for casting multiple gels. Multi-casting chambers for 12 PROTEAN Plus™ gels or fo r 12 Mini-PROT EAN gels allow unifo rm cast ing
of gradi ent gel s. Gradient ma kers are availab le for both size for mats.
Transition from First to Second Dimension
The transition from first- to second-dimension gel
electrophoresis involves the following:
Equilibration, which involves two steps that treat
the focused IPG strips with an SDS-containing
buffer to prepare the proteins for SDS-PAGE.
The first equilibration solution contains buffer,
urea, glycerol, reductant, SDS, and dye (optional).
The second equilibration step replaces the
reductant with iodoacetamide to alkylate the
thiol groups. Equilibration ensures the proteins
are coated with dodecyl sulfate and all cysteines
are reduced and alkylated
Embedding of the strip on the top of the seconddimension gel. The equilibrated IPG strips are placed
on top of the gel and sealed in place with molten
agarose solution to ensure good contact between
the gel and the IPG strip
Methods for equilibrating and embedding IPG strips
onto second-dimension gels are available in Part II
of this guide.
Each pair of glass plates (two per gel) should
be separated from the next by a spacer sheet;
the spacer sheet allows easier separation of the
cassettes after gel polymerization
The volume of gel solution should be determined
by measuring the volume of water needed to fill the
assembled glass plates to the desired level in the
multi-casting stand
Allow overnight polymerization to compensate for
the low concentrations of catalysts (recommended
to ensure that polymerization does not start while
the gradient gels are being cast)
Power Conditions and Reagents
for SDS-PAGE
For SDS-PAGE, use running conditions that provide
optimum separation across the size range of interest
and that maintain the temperature of the system
during operation. For a complete discussion of running
conditions and the parameters that affect them, please
refer to A Guide to Polyacrylamide Gel Electrophoresis
and Detection, Bio-Rad bulletin 6040. For seconddimension SDS-PAGE, include a short, low voltage
(50 V) step at the beginning of the run to ensure that all
of the proteins are removed from the IPG strip before
final voltages are applied.
Molecular Weight (MW) Estimation
SDS-PAGE is a reliable method for estimating the
MW of an unknown protein. The migration rate of a
protein–SDS complex is inversely proportional to the
logarithm of its MW: the larger the polypeptide, the
more slowly it migrates in a gel. The key to accurate
MW determination is selecting separation conditions
that produce a linear relationship between log (MW)
and migration within the likely MW range of the
unknown protein. These parameters are discussed
more thoroughly in Molecular Weight Determination
by SDS-PAGE (bulletin 3133), and a protocol for MW
estimation is provided in Part II of this guide.
For best results, separate the protein sample
on the same gel with a set of protein standards.
See The Little Book of Standards (bulletin 2414) and
the Protein Standards Application Guide (bulletin 2998)
for more information regarding selection of protein
standards. Mixtures of standard proteins with known
MW can be unstained, prestained, or include tags
for development with various secondary reagents
(useful when blotting). Standards can be run in a
reference well or attached to the end of a focused IPG
strip by filter paper onto the second-dimension gel.
For convenience, Bio-Rad’s Precision Plus Protein
standard plugs (catalog #161-0378), which are
embedded in agarose plugs, can also be used.
After separation, determine the relative migration
distance (R
unknown protein. R
a protein divided by the mobility of the ion front
(Figure 1). Because the ion front can be difficult to
locate, mobilities are normalized to the tracking dye
that migrates only slightly behind the ion front:
R
= (distance to band)/(distance to dye front)
f
Using the values obtained for the protein standards,
plot a graph of log (MW) vs. R
should be linear for most proteins, provided they
are fully denatured and that the gel percentage
is appropriate for the MW range of the sample.
The standard curve is sigmoid at extreme MW values,
because the sieving affect of the matrix is so large at
high MW that molecules are unable to penetrate the
gel; but at low MW, the sieving effect is negligible and
proteins migrate almost freely. To determine the MW
of the unknown protein band, interpolate the value
from this graph (Figure 2).
) of the protein standards and of the
f
is defined as the mobility of
f
(see below). The plot
f
Gradient SDS-PAGE gels can also be used to estimate
MW. In this case, log (MW) is proportional to log
(%T). With linear gradients, %T is proportional to the
distance migrated, so the data can be plotted as log
(MW) vs. log (migration distance). Standard curves are
actually sigmoid. The apparent linearity of a standard
curve may not cover the full MW range for a given
protein mixture in a particular gel. However, log (MW)
varies sufficiently slowly to allow fairly accurate MW
estimates to be made by interpolation, and even
extrapolation, over relatively wide ranges.
1 2 3 4 5 6 7 8
MW, kD
250
150
100
75
50
37
25
20
15
10
Fig. 1. Example showing MW determination of an unknown
protein. Lane 1, 10 μl of Precision Plus Protein unstained standards;
lanes 2– 8, a dilution series of an E. coli lysate containing a
hypothetical unknown protein (GFP). Proteins were separated by
SDS-PAGE in a Criterion 4–20% Tris-HCI gel and stained with
Bio-Safe Coomassie stain.
3.0
2.0
log MW
y = –1.9944x + 2 .7824
1.0
2
r
= 0.997
0
0 0.2 0.4 0.6 0.8 1.0
Fig. 2. Determining the MW of an unknown protein by SDS-PAGE.
A standard curve of the log (MW) versus R
Precision Plus Protein standards from Figure 1. The strong linear
relationship (r
distance demonstrates exceptional reliability in predicting MW.
2
> 0.99) between the proteins’ MW and migration
R
f
Top of resolving ge l
Migration
dista nce of
unknown
band
(45 mm)
was generated using the
f
Migration
distance
of dye fro nt
(67 mm)
Unknown band
Dye front
Standards
Unknown
52 53
Page 29

2-D Electrophoresis Guide Theor y and Product Selection
CHAPTER 5
Detection
54 55
Page 30

2-D Electrophoresis Guide Theor y and Product Selection
Chapter 5: Detection
Detection of Proteins in Gels
In 2-D electrophoresis, proteins in gels are most
commonly visualized using total protein stains.
Selection of the most appropriate stain involves
consideration of the stain characteristics, limitations
with regard to the sensitivity of detection and the types
of proteins it stains best, downstream applications,
and the type of imaging equipment available
(see Chapter 6). For use in proteomics applications,
stains should be compatible with high-throughput
protocols and downstream analysis, including
digestion and mass spectrometry (Patton 2000).
It is also possible to label protein samples after sample
preparation and prior to IEF with fluorescent dyes such
as the CyDye DIGE fluors (Westermeier and Scheibe
2008). At the time of writing, three dyes with spectrally
different excitation and emission wavelengths were
available, allowing labeling of up to three different
samples and their separation in a single 2-D gel.
The dyes are matched for size and charge to obtain
migration of differently labeled identical proteins to the
same spot positions. The labeled samples are mixed
together before they are applied on the gel of the first
dimension. After separation, the gels are scanned with
fluorescence imagers at the different wavelengths.
The following are general tips for staining 2-D gels:
2-D gels are clearer, sharper, and more reproducible
when less protein is loaded. When sample
preparation and IEF conditions are not optimized,
it is often beneficial to load relatively little protein and
to use a relatively sensitive staining technique
To identify low-abundance proteins, apply a high
protein load and use a high-sensitivity stain
(for example, silver or a fluorescent stain)
(Corthals et al. 2000)
To obtain enough protein for mass spectrometry,
apply a high protein load and use a compatible
staining procedure
For quantitative comparisons, use stains with broad
linear ranges of quantitation (for example, Flamingo
™
Oriole
, and SYPRO Ruby)
Since no stain is capable of staining all proteins,
™
consider staining replicate gels with two or more
different stains. Coomassie (Brilliant) Blue appears
to stain the broadest spectrum of proteins.
Therefore, it is instructive, especially with 2-D gels,
to stain a Coomassie Blue–stained gel with silver,
or to stain a fluorescently stained gel with colloidal
Coomassie Blue or silver. Often, this double staining
procedure reveals a few differences between the
protein patterns. It is possible to stain gels first with
Coomassie Blue or a fluorescent stain, then again
with silver
The sensitivity achievable in staining is determined by:
The amount of stain that binds to the proteins
The intensity of the coloration
The difference in color intensity between stained
proteins and the residual background in the body
of the gel (the signal-to-noise ratio); unbound stain
molecules can be washed out of the gels without
removing much stain from the proteins
No stain interacts with all proteins in a gel in precise
proportion to their mass, and all stains interact
differently with different proteins (Carroll et al. 2000).
The only observation that seems to apply for most
stains is that they interact best with proteins with
a high basic amino acid content.
Coomassie Stains
Coomassie (Brilliant) Blue is the most common
stain for protein detection in polyacrylamide gels.
Coomassie R-250 and G-250 are fabric dyes that have
been adapted to stain proteins in gels. The “R” and “G”
designations indicate red and green hues, respectively.
These stains generate visible protein patterns that can
be analyzed using densitometric methods.
Silver Stains
,
Silver stains offer high sensitivity but with a low
linear dynamic range (Merril et al. 1981). Often, these
protocols are time-consuming and complex. Silver
staining protocols have multiple steps with critical
timing; for this reason, they can be insufficiently
reproducible for quantitative analysis. In addition,
their compatibility with mass spectrometric protein
identification techniques is lower than Coomassie
stains and fluorescent dyes. There are many different
silver staining techniques with differing chemistries
and sensitivities.
Fluorescent Stains
Fluorescent stains fulfill almost all the requirements for
an ideal protein stain by offering high sensitivity, a wide
linear dynamic range (up to four orders of magnitude),
a simple and robust protocol, and compatibility with
mass spectrometry. These sensitive stains generate
little background and are easy to use.
Because fluorescent stains require specialized
instrumentation for imaging, the choice of stain
may be dictated by the instrumentation available.
Fluorescent dyes absorb light at one wavelength
and re-emit the light at another longer wavelength.
Imaging instruments differ in both the type of light
delivered for absorbance and the capabilities for
detecting the emitted light. The simplest and least
expensive systems use UV transillumination and a
camera for image capture; however, not all fluorescent
stains are optimally excited by UV light. Other imaging
systems use laser light to scan the gel. Laser light
is monochromatic, and the laser must be selected
according to the absorbance properties of the dye.
Fluorescent stains can be at least as sensitive as
silver stains and are, therefore, subject to some of
the same potential problems stemming from high
sensitivity. Clean technique is essential, as any dust or
dirt transferred to the surface of the gel may appear
in the fluorescence image as smudges or speckles.
Contaminant proteins such as keratin will also appear
in the gel image if care is not taken to minimize such
contamination.
All fluorescent reagents are subject to photobleaching
to varying degrees. The fluorescent stains discussed in
the Protein Stains sidebar are reasonably photostable
and do not degrade noticeably through routine
exposure to room light during a staining procedure.
However, avoid exposure of the gel or staining solution
to intense light and cover the staining tray with an
opaque lid or foil.
Negative Stains
These rapid stains require only ~15 min for highsensitivity staining and generate protein bands that
appear as clear areas in a white background. Zinc and
copper stains do not require gel fixation and proteins
are thus not altered or denatured. Negative stains
can be used as a quality check before transferring
to a western blot or analysis by mass spectrometry,
though they are not the best choice when quantitative
information is desired.
Stain-Free™ Technology
This proprietary Bio-Rad technology allows protein
detection in a gel both before and after transfer,
as well as total protein detection on a blot when
using wet PVDF membranes, without the need for
application of a stain (see sidebar).
Not all fluorescent gel stains absorb visible light at
wavelengths supplied by imaging lasers.
56 57
Page 31

2-D Electrophoresis Guide Theor y and Product Selection
Chapter 5: Detection
Protein Stains
Bio-Rad total protein stain selection guide.
Detection Sensitivity MS
Total Protein Stain Method (Lower Limit) Time Comments Compatible?
Coomassie Stains Visible
Coomassie (Brilliant) Blue 36–47 ng 2.5 hr Simple and consistent; requires destaining Yes
R-250 with methanol
™
Bio-Safe
G-250 solution; premixed
Silver Stains Visible
Silver stain 0.6 –1.2 ng 2 hr Stains glycoproteins, lipoproteins, No
(Merril et al. 1981) lipopolysaccharides, nucleic acids
Silver Stain Plus
(Gottlieb and Chavko 1987)
Dodeca
with Dodeca stainers (Sinha et al. 2001)
Fluorescent Stains Fluorescence
Oriole fluorescent 0.5–1 ng 1.5 hr Rapid protocol requires no fixing or Yes
gel stain destaining; requires UV excitation
Flamingo fluorescent 0.25–0.5 ng 5 hr Simple protocol requires no destaining; Yes
gel stain high sensitivity, broad dynamic range;
excellent for laser-based scanners
SYPRO Ruby protein 1–10 ng Overnight Simple, robust protocol; Ye s
gel stain broad dynamic range
Negative Stains Visible
Zinc stain 6–12 ng 15 min High-contrast results; simple, fast, and Yes
reversible; compatible with elution or blotting
as well (Fernandez-Patron et al. 1992)
Copper stain 6 –12 ng 10 min Single reagent; simple, fast protocol and Yes
reversible stain; compatible with elution or
blotting as well (Lee et al. 1987)
Stain-Free Technology Stain-Free 8–28 ng 5 min No separate staining steps Yes, but
fluorescence tryptophan
Coomassie 8–28 ng 1–2.5 hr Nonhazardous staining in aqueous Yes
™
kit 0.6–1.2 ng 1.5 hr Simple, robust protocol Limited
™
silver stain kit 0.25–0.5 ng 3 hr Simple, robust protocol; ideal for use Yes
Coomassie Brilliant Blue R-250 Silver St ain Kit Si lver St ain Plus Kit
residues are
modified
(contd.)
Coomassie Stains
Coomassie R-250 staining solution is prepared for
a traditional staining procedure in which gels are
stained in a methanol-water-acetic acid solution of
Coomassie R-250 dye. It requires ~40 ng protein
per spot for detection, though absolute sensitivity
and staining linearity depend on the proteins
being stained.
Bio-Safe Coomassie stain is a ready-to-use, singlereagent protein stain made with Coomassie (Brilliant)
Blue G-250. It offers sensitivity similar to colloidal
Coomassie stains (down to 8 ng) and a rapid
staining protocol. No additional reagents besides
water are required.
Fluorescent Stains
Flamingo fluorescent gel stain is prepared from
a dye that binds denatured protein. Normally
non-fluorescent in solution, it becomes strongly
fluorescent when bound to protein. There is,
therefore, no need for destaining, since unbound
dye in the gel is only minimally fluorescent.
A prolonged fixing step is necessary to wash
buffers and SDS out of the gel prior to staining,
as these substances can prevent dye binding.
Flamingo fluorescent gel stain is the most sensitive
of the listed fluorescent stains, with sensitivity to
0.25–0.5 ng, and it can be linear over three orders of
magnitude. The simple two-step staining procedure
can be completed in as little as five hours.
With a primary fluorescence excitation maximum at
512 nm and a considerably weaker excitation peak
at 271 nm, Flamingo fluorescent gel stain gives
the most sensitive results when imaged with laser
fluorescence scanning instruments equipped with
green or blue laser light sources. UV transilluminatorbased systems may also be used, but extended
exposure times may be required and sensitivity will
not be as high.
Oriole fluorescent gel stain is sensitive and, of the
stains listed, it is the easiest and most rapid to use.
The one-step staining process does not require
fixation or destaining, allowing protein samples
to be accurately visualized and quantitated in less
than two hours. Since SDS is required for optimal
staining, prior fixing or washing of the gel can impair
staining sensitivity.
The dye in Oriole stain is excited only weakly by
wavelengths longer than 400 nm and can, therefore,
only be imaged using UV-based imaging systems.
Oriole’s limit of detection is 1 ng or less in a typical
protein spot.
SYPRO Ruby was one of the original fluorescent
protein gel stains, and it has a combination of high
sensitivity and wide dynamic range that cannot be
achieved with traditional Coomassie blue or silver
stains. SYPRO Ruby has two prominent absorbance
peaks, one at ~270 nm in the UV range and the
other at ~460 nm in the visible range. This allows
imaging with both UV transilluminator and laserscanning systems. Detection sensitivity in SYPRO
Ruby–stained gels can be as low as 1 ng. SYPRO
Ruby stains most classes of proteins with little
protein-to-protein variability.
The principle advantage of SYPRO Ruby is its
versatility with respect to imaging requirements.
It is, however, time-consuming to use and does
not produce the high-quality mass spectrometric
data generated with other fluorescent stains
(Berkelman et al. 2009).
Oriole Fluorescent
Gel Stain
Flamingo Fluorescent
Gel Stain
Zinc St ain an d
Destain Kit
Copper Stain
58 59
Page 32

2-D Electrophoresis Guide Theor y and Product Selection
Chapter 5: Detection
(contd.)
Silver Stains
Three silver staining methods are recommended
for use with 2-D gels. Though they are based on
slightly different chemistries, they have similar
protein sensitivities.
The Bio-Rad silver stain kit, based on the method
of Merril et al. (1981), can be up to 100 times more
sensitive than Coomassie Blue R-250 dye staining
and allows visualization of heavily glycosylated
proteins in gels. Protein spots containing 10–100 ng
of protein can be easily seen. Proteins in gels are
fixed with alcohol and acetic acid, then oxidized
in a solution of potassium dichromate in dilute nitric
acid, washed with water, and treated with silver
nitrate solution. Silver ions bind to the oxidized
proteins and are subsequently reduced to metallic
silver by treatment with alkaline formaldehyde.
Color development is stopped with acetic acid
when the desired staining intensity has been
achieved. This method is not compatible with mass
spectroscopic analysis since the oxidative step
affects protein mass.
Silver Stain Plus stain from Bio-Rad, based on
the method developed by Gottlieb and Chavko
(1987), requires only one simultaneous staining and
development step. Proteins are fixed with a solution
containing methanol, acetic acid, and glycerol and
then washed extensively with water. The gels are
then soaked in a solution containing a silver-amine
complex bound to colloidal tungstosilicic acid.
Silver ions transfer from the tungstosilicic acid to the
proteins in the gel by means of an ion exchange or
electrophilic process. Formaldehyde in the alkaline
solution reduces the silver ions to metallic silver to
produce the images of protein spots. The reaction is
stopped with acetic acid when the desired intensity
has been achieved. Silver ions do not accumulate
within the gel, so background staining is light.
Since this method lacks an oxidizing step,
visualization of heavily glycosylated proteins and
lipoproteins can be less sensitive than with the
Merril stain.
Dodeca silver stain is based on the method
described by Sinha et al. (2001), in which proteinbound silver ions are chemically reduced to form
visible metallic silver. This stain was developed for
use with the high-throughput Dodeca stainers and
can be used with mass spectrometry.
Stain-Free Technology
A special additive in Bio-Rad’s Criterion Stain Free™,
Criterion
TGX Stain-Free
residues when activated with UV light. This
enhances the proteins’ intrinsic fluorescence and
shifts the emission into the visible range (>400 nm),
allowing protein detection (with a stain-free
compatible imager, such as the Gel Doc
ChemiDoc
after transfer, as well as total protein detection on a
blot when using wet PVDF membranes.
This system is ideal for quick sample assessment
during purification procedures and as a precursor
to blotting and profiling workflows in which
Coomassie (Brilliant) Blue staining is ordinarily
used. The sensitivity of the Stain-Free system is
comparable to that of staining with Coomassie
Blue for proteins with a tryptophan content >1.5%;
sensitivity superior to Coomassie staining is possible
for proteins with a tryptophan content >3%.
Proteins that do not contain tryptophan residues
are not detected.
™
TGX Stain-Free™, and Mini-PROTEAN®
™
gels covalently modifies tryptophan
™
™
MP systems) in a gel both before and
EZ or
Dodeca High-Throughput Stainers
Dodeca stainers are high-throughput gel staining
devices available in two sizes: the small size
accommodates up to 24 Criterion gels while the
large size can accommodate up to 12 large-format
gels. The stainers feature a shaking rack designed
to hold staining trays at an angle to allow air bubbles
to escape and ensure uniform gel staining to protect
gels from breaking. Use of the stainers ensures
high-quality, consistent results and eliminates
gel breakage from excess handling. They are
compatible with the following stains:
Bio-Safe Coomassie (Brilliant) Blue G-250 stain
Coomassie (Brilliant) Blue R-250 stain
SYPRO Ruby protein gel stain
Flamingo fluorescent protein gel stain
Oriole fluorescent gel stain
Dodeca silver stain kits
Detection of Proteins on Western Blots
Certain synthetic membranes bind proteins tightly
and can be used as supports for solid-phase
immunoassays, staining, or other analysis.
These membranes, known as western blots,
are useful for the identification of specific proteins
and protein modifications.
2-D electrophoresis can be combined with
western blotting for monitoring the posttranslational
modification of trace proteins in complex mixtures and
evaluating the specificity of antibodies and antisera.
Numerous techniques are available for the transfer of
proteins to membranes and for the probing of western
blots with antibodies, stains, and other reagents.
These techniques are described in more detail in
the Protein Blotting Guide (bulletin 2895).
High-Throughput Dodeca Stainers
60 61
Page 33

2-D Electrophoresis Guide Theor y and Product Selection
CHAPTER 6
Image Acquisition,
Analysis, and Spot Cutting
62 63
Page 34

2-D Electrophoresis Guide Theor y and Product Selection
Finding Protein Spots of Interest
After 2-D gels are stained, the protein patterns can
be digitized and analyzed with an image evaluation
system comprising an imaging device and analysis
software. Following analysis, spots of interest can
be excised from gels for further analysis, by mass
spectrometry for example (see Chapter 7).
Charge-coupled device (CCD) camera systems can
feature different light sources for greater application
flexibility. They can be used for visualization
of visible and fluorescent stains and of
chemiluminescence in some cases. Systems
offer transillumination (visible or UV light source
underneath the gel or blot) or epi-illumination
Imaging Systems
System Type and Application
Chapter 6: Image Acquisition, Analysis, and Spot Cutting
(colored or white light positioned above the sample).
Image Acquisition
In proteomic applications, selecting the image
acquisition device depends on the staining technique
used. A number of imaging systems are capable of
multiple detection modes and can be used with a
variety of applications.
Densitometers enable the visualization of gels
stained with visible light–absorbing stains such as
Coomassie, negative, or silver stains
Heat in the camera system can manifest as noise,
and this noise can prevent detection of faint
chemiluminescent signals above the background.
Supercooled CCD cameras reduce image noise,
allowing detection of faint signals
Laser-based scanners offer the highest sensitivity,
resolution, and linear dynamic range. They are
powerful image acquisition tools for electrophoresis
gels and blots stained with fluorescent dyes.
Lasers can be matched to the excitation wavelengths
of a multitude of fluorophores
™
GS-900
Densitometer ChemiDoc
Type of imager Densitometer CCD camera-based CCD camera-based Laser-based
Light source options Epi- and Transillumination of UV Transillumination of UV 488 nm external laser
transillumination of and white light* and white light 532 nm internal laser
white light 635 nm external laser
Epi-illumination by LEDs
(red, green, blue, and white)
Optimized applications
Visible stains • • • —
UV light– excited — • • —
fluorescent stains
Visible light– excited — • — •
fluorescent stains and labels
Fluorescent multiplexing — • — •
Chemilumine scence — • — —
Stain-Free
* White light conversion screen is required.
™
— • • —
PharosFX™ and
™
MP Gel Doc™ EZ PharosFX Plus
Bio-Rad’s GS-900 calibrated imaging densitometer
has transmittance and true reflectance capabilities
that allow accurate scans of samples that are
either transparent (gels and film) or opaque (blots).
It provides high-quality imaging to resolve close
spots and a variable resolution feature to preview
and crop images.
Bio-Rad’s ChemiDoc MP supercooled CCD
system provides maximum flexibility. It offers
transillumination of both UV light (for imaging UV
fluorescent stains) and white light (for imaging visible
stains). It also offers optional LED epi-illumination
in red, green, and blue for single fluorescent stains
or fluorescent multiplexing. In addition, it can also
image stain-free gels, which require no staining or
destaining and are ready for imaging in a matter of
minutes after completing the SDS-PAGE run.
Image Analysis
Following image acquisition, a robust software
package is required to analyze and present the
data and to draw conclusions from 2-D gel images.
The software should provide a variety of tools to
enhance the user’s ability to evaluate the acquired
data. For example, the software should be able to
adjust contrast and brightness and magnify, rotate,
resize, and crop gel images. It should measure total
and average quantities and determine relative amounts
of protein. It should also be capable of determining
The PharosFX systems use multiple lasers, which
enhance application flexibility and allow optimum
excitation of single- or multicolor fluorescent
samples to enable detection of most fluorescent
dyes and labels. Computer-controlled, useraccessible filter wheels have eight filter slots,
supporting multiplex or multicolor fluorescence
imaging applications in gels and blots, such as
Qdot multiplex blotting, DIGE, and gel staining with
Pro-Q stains. The Molecular Imager
®
PharosFX
system has all the features of the PharosFX Plus
imager for fluorescence and visible detection,
but it lacks the storage phosphor option for
imaging radioisotopes.
the presence/absence and up- or downregulation of
proteins, their molecular weight, pI, and other values.
Following this initial analysis, computer-assisted
image analysis software should allow:
Storage and structuring of large amounts
of collected experimental image data
Rapid and sophisticated analysis of
experimental information
Supplementation and distribution of data among labs
Establishment of 2-D-protein data banks
64 65
Page 35

2-D Electrophoresis Guide Theor y and Product Selection
Data Analysis and Reporting
PDQuest™ 2-D Analysis Software EXQuest Spot Cutter
Bio-Rad’s PDQuest 2-D analysis software is used
for analyzing and creating databases for 2-D
electrophoresis gels. It provides a series of “wizards”
for the analysis of digitized gel images and for spot
detection and quantitation, gel comparison, and
statistical analysis. The Experiment Wizard guides
selection of gels for analysis, detection of spots
of interest, creation of an experiment, and matching
of gels. The Spot Detection Wizard then guides the
identification and quantitation of the
spots in gel images.
After detection, gels in the same series are placed
in an experiment for comparison, statistical
analysis, and databasing. Histograms allow quick
comparisons of the quantities of the same spot
in all the gels in an experiment. Spots can also
be compared qualitatively, organized into userdefined sets for further analysis, and annotated
and databased for easy identification. Spots from
Image Optimization, Spot Detection, and Quantitation
Before any software can detect the protein spots of a
2-D gel, raw image data must be optimized and the
gel background subtracted.
PDQuest software models protein spots
mathematically as 3-D Gaussian distributions and
uses the models to determine protein maxima.
A 3-D Gaussian spot is a precise representation of an
original scanned spot. Gaussian curves are fitted to
the scanned spot in the X and Y dimensions, and then
additional modeling is performed to create the final
Gaussian spot. Using Gaussian modeling, it is possible
to accurately quantitate overlapping spots, spots in
gel streaks, and multiple spots in dense clusters.
The accuracy of automatic spot detection depends
on the quality of the 2-D gels and their images.
Correction capabilities of PDQuest software can be
used to add undetected spots to the list of spots or
to delete spots that arise from gel artifacts.
Gel Comparison
The next step in 2-D gel evaluation is identification
of proteins that are present in all gels of a series.
Since inherent problems with gel-to-gel reproducibility
affect the positions of spots within a gel series,
gel analysis software must be able to detect minor
shifts in individual spot position within the gel series.
different experimental series can be organized and
compared in higher-level experiments. PDQuest can
be used to simultaneously analyze thousands of
spots on hundreds of gels. Data can be exported
to other applications, such as spreadsheets, for
further analysis.
PDQuest software has the further advantage of
integration with Bio-Rad’s EXQuest
™
spot cut t e r,
which accurately locates and excises protein
spots from 2-D gels or blots at high speed
(up to 600 spots per hour) and then loads them
into 96- or 384-well microplates or 96-tube
racks for downstream processing and analysis.
PDQuest has no imaging functions besides driving
the camera system in the ExQuest spot cutter, but it
can read and import multiple file formats from other
gel imaging software packages like Quantity One
®
.
Many software packages for automatic gel comparison
are created with the assumption that the relative
positions of spots are altered only slightly relative to
each other, and they allocate the spots on this basis.
Prior to automatic gel comparison, PDQuest software
selects the best 2-D gel of a gel series as a reference,
or standard gel, and compares all other 2-D gels to
this gel. Proteins in a gel series that are not present in
the reference gel can be added automatically so that
the reference gel includes all proteins of a gel series.
PDQuest includes the ability to match spots with no
manual assistance, and it is possible to display up
to 100 enlarged details of 2-D gels on the screen
simultaneously, enabling rapid and error-free
determination of the matching quality.
Data Normalization
When comparing gels in an experiment, there is
often some variation in spot size and intensity among
gels that is not due to differential protein expression.
Multiple normalization methods can be used to
compensate for gel-to-gel variations in spot intensity
caused by inconsistencies in sample loading, gel
staining, and imaging. To accurately compare spot
quantities among gels, compensation for these
variations in spot intensity, which are not related to
expression levels, is required.
With PDQuest software, all gels in a single experiment
are viewed as a unit. To compare gels from different
experiments, the reference images are compared.
In such comparisons, each spot is automatically
assigned a number such that identical spots have
identical numbers. In an experiment, the molecular
weight and pI values for known protein spots can
also be entered. With these data, PDQuest can
estimate molecular weight and pI values for all the
spots in the experiment.
Analysis sets allow the study of sets of proteins that
are statistically and scientifically significant and to
identify spots to cut using the ExQuest spot cutter.
There are six different kinds of analysis sets:
Qualitative analysis sets — spots that are present
in one gel but not in another
Quantitative analysis sets — spots whose intensity
(amount) has increased or decreased by a certain
degree, or whose intensity has changed above,
below, or within the fold change factor that you specify
Statistical analysis sets — spots that are significant
according to the statistical test that you apply
Arbitrary analysis sets — manually selected spots
Boolean analysis sets — created by comparing
two or more analysis sets (for example, set C could
be made up of those spots present in both sets
A and B)
Matching analysis sets — spots that are either
unique to one member or present in all members
Once proteins of interest are determined, the
corresponding analysis sets are uploaded to the spot
cutter. The spots of interest are then excised from the
gels and digested to release peptides for analysis by
various mass spectrometry methods.
Spot Cutting from 2-D Gels
Spots of interest can be excised from gels either
manually (for example, with a scalpel, razor blade,
or modified pipet tip) or with an automated spot
cutting system. The advantages of automated systems
are numerous and include improved precision and
reproducibility, tracking of gel spots, and decreased
risk of contamination. The excised gel plugs are
then transferred to microplates or other vessels for
digestion and further analysis.
Chapter 6: Image Acquisition, Analysis, and Spot Cutting
Bio-Rad’s EXQuest spot cutter accurately locates
and excises protein bands or spots from gels
or blots and loads them into 96- or 384-well
microplates or 96-tube racks for downstream
processing and analysis. Its camera works with
PDQuest 2-D analysis software to visualize gels
and blots that are either visibly or fluorescently
stained. In 2-D electrophoresis applications,
PDQuest software tracks the protein bands
or spots through spot cutting and protein
identification, which is usually accomplished
using mass spectrometry.
The EXQuest spot cutter allows use of any common
proteome separation and staining methods:
Freestanding or plastic- or glass-backed 2-D
and 1-D SDS-PAGE gels
PVDF and nitrocellulose membrane blots
Gels or membranes stained for proteins with
visible stains (such as silver and Coomassie blue
stains) or fluorescent stains (such as Flamingo
™
Oriole
, and SYPRO Ruby protein stains)
ExQuest Spot Cutter
™
,
66 67
Page 36

2-D Electrophoresis Guide Theor y and Product Selection
CHAPTER 7
Identification and
Characterization of
2-D Protein Spots
68 69
Page 37

2-D Electrophoresis Guide Theor y and Product Selection
Chapter 7: Identication and Characterization of 2-D Protein Spots
Beyond Excision
2-D electrophoresis has the unique capability of
simultaneously displaying several hundred proteins.
When coupled with the ability of mass spectrometry
to identify and characterize small quantities of protein,
2-D electrophoresis is a very powerful and effective
analytical method.
Several mass spectrometric techniques can be
used for protein identification at the end of a 2-D
electrophoresis workflow. Most of these methods first
require proteolytic digestion of the protein into discrete
fragments that can be eluted from the excised gel
plug. The most basic mass spectrometric method,
peptide mass fingerprinting, simply determines
accurate masses of the peptides generated.
These masses are then compared to a database,
and the protein of origin can often be uniquely
identified. Another technique, tandem mass
spectrometry (MS/MS) further fragments selected
peptides along the peptide backbone, allowing the
generation of limited sequence information that can
be used to refine the protein identification step.
Proteolytic Digestion
In-gel digestion (Rosenfeld 1992) of selected proteins
is part of the sample preparation process for mass
spectrometry, and it comprises four basic steps:
destaining (washing) the gel pieces, reduction and
alkylation, proteolytic cleavage of the protein,
and extraction of the resultant peptides.
Washing
After excision of the protein spot of interest from the
gel, most protocols require destaining of the proteins
before proceeding. The destaining or wash protocol
depends on the stain used for visualization.
Commonly used protocols for various stains are
described in Part II of this guide.
Reduction and Alkylation
Reduction and alkylation together reduce and
irreversibly block the formation of inter- and
intramolecular disulfide bridges, which can significantly
improve the efficacy of proteolytic cleavage and
subsequent mass spectrometry.
Proteins excised from 2-D gels have usually been
reduced and alkylated either during sample
preparation or equilibration prior to the second
dimension and may not require this step. This step
is mandatory if upstream processing did not
incorporate reduction and alkylation. Any reduction
or reduction plus alkylation step must be followed
by a cleanup step prior to mass spectrometry.
In-Gel Proteolytic Digestion
Proteolytic digestion can be performed directly on
processed gel pieces. Because proteases are also
subject to autolysis, always include a blank piece as a
control. Proteases used for this purpose are selected
for their efficiency in in-gel digestion and for their
defined cleavage specificity, which allows prediction of
the generated peptide masses. The most commonly
used protease is trypsin, but other proteases used
include LysC, GluC, ArgC, AspN, and LysN, which
cleave to either the C- or N-terminal side of a single
amino acid, as signified by their nomenclature.
These enzymes are all commercially available as
preparations that have been specifically modified for
use prior to mass spectrometry. Enzymes specifically
recommended for mass spectrometry should always
be used for in-gel digestion.
Use trypsin (modified porcine pancreatic trypsin,
mass spectrometry grade) for initial protein digestion.
Trypsin is one of the most specific proteases and
cleaves at the C-terminal side of Arg and Lys
Use GluC, AspN, or LysC with proteins of smaller
mass. These enzymes generate fewer peptides
of larger mass than trypsin, which may generate
fragments too small for definitive identification
Use acid hydrolysis, cyanogen bromide cleavage,
or other chemical methods if alternatives to
enzymatic digestion are required
Some proteins are processed forms of larger
proteins; therefore, once the protein is identified
based on a trypsin digestion, other methods can be
used to define the N- and C-termini of the fragment
The resulting peptides can be extracted with
acetonitrile, dried under vacuum, and dissolved in a
small amount of water. Prior to mass spectrometry,
the samples should be further purified by solid phase
extraction, for example using ZipTip pipet tips.
A protocol is provided in Part II of this guide.
Identification by Mass Spectrometry
Identification of the peptides derived from digestion
can be achieved using several mass spectrometry
techniques. Only a brief overview of mass
spectrometry theory and techniques is presented here.
Refer to the literature from mass spectrometer vendors
for more information about systems and methods.
Mass spectrometry systems contain the following
components (Figure 7.1):
Ionization source — converts the sample into
gas-phase ions, which are then injected into a mass
analyzer. The two ionization sources most commonly
used for peptide mass spectrometry are matrixassisted laser desorption ionization (MALDI) and
electrospray ionization (ESI)
– MALDI — the protein is mixed with an organic
molecule (the “matrix”), deposited onto a planar
substrate, allowed to dry, and illuminated with a
pulsed UV laser. The matrix compound absorbs
the laser energy and promotes peptide ionization,
typically generating singly-charged molecular ions.
MALDI is useful for high-throughput applications
but is limited by ion suppression (particularly in
complex peptide mixtures) and chemical noise
from the matrix in the low mass range
Sample
Introduction
Ionization
Source
Fig. 7.1. Components of a mass spectrometer.
Mass
Analyzer
– ESI — a flowing liquid is passed through a
charged orifice to produce charged droplets,
which are then desolvated to yield gas-phase
peptide ions. ESI can be coupled directly to liquidphase separations such as chromatography
(LC-MS) and generates multiply-charged
molecular ions that bring mass-to-charge ratio
(m/z) values within the mass range of mass
spectrometry instruments most commonly
used with ESI
Mass analyzer — sorts the ions according the m/z.
A number of different types of mass analyzers are
available, including time-of-flight (TOF), quadrupole,
and ion trap systems as well as combinations of
these (hydrid mass spectrometers)
Ion detector — records the ion current, amplifies it,
and sends it to the data analysis system where it is
presented in the form of a mass spectrum. The m/z
values of the ions are plotted against their intensities
to show the number of components in the sample,
the molecular mass of each component, and the
relative abundance of the various components in
the sample
The data from the mass analyzer(s) are used for protein
identification, and two options are most common
in the 2-D electrophoresis workflow: peptide mass
fingerprinting and tandem mass spectrometry.
Detector
Data
Handling
70 71
Page 38

C
2-D Electrophoresis Guide Theor y and Product Selection
Chapter 7: Identication and Characterization of 2-D Protein Spots
Peptide Mass Fingerprinting
In this method, the peptides resulting from digestion
of the protein of interest are analyzed by mass
spectrometry and compared to a database of
calculated peptide masses generated by “in silico”
cleavage of protein sequences using the same
specificity as the enzyme that was employed in the
experiment. Identifications (“hits”) are scored in terms
of confidence of match (Figure 7.2).
This approach requires simple mixtures of proteins or
pure proteins and is, therefore, suitable for analysis of
proteins isolated from 2-D electrophoresis. Limitations
of peptide mass fingerprinting, however, include the
following: (i) the protein sequence has to be present
in the database of interest, and (ii) several peptides
are required to uniquely identify a protein. Additionally,
most algorithms assume that the peptides come from
a single protein, which is why resolution in the 2-D
separation is so critical. If this information does not
allow unequivocal identification of the protein, peptides
can then be analyzed by tandem mass spectrometry.
N
C
Digestion
Tandem Mass Spectrometry (MS/MS)
In MS/MS, a peptide ion is isolated in the mass
analyzer and subjected to dissociation to product ion
fragments. Peptides dissociate according to certain
rules. For example, fragmentation typically occurs
along the peptide backbone; each residue of the
peptide chain is successively cut off, both in the N->C
(a-, b-, c- ions) and C->N (x-, y-, z- ions) directions.
The product ions resulting from the fragmentation
are analyzed in a second stage of mass analysis,
which enables sequence derivation (Figure 7.3).
Tandem MS can allow identification of proteins
from a single peptide (Lovric 2011).
Establishment of 2-D Databases
After the spots are cut, analyzed, and identified, by
MS for example, the information can be imported
back into the experiment as annotations. Annotations
are organized in categories, for example by protein
name, protein family amino acid composition,
protein function, cellular location, binding properties,
and translational regulation. A single spot may be
annotated in multiple categories, depending on the
amount and type of information available about it.
Most categories contain simple text annotations.
Specialized categories can be used to link spots
to Internet protein databases or to open files in
other applications.
C
N
Fig. 7.2. Peptide mass fingerprinting. Peptides resulting from digestion are analyzed by mass spe ctrometry, and the resulting m/z values
and mass spectrum are compared to theoretical values derived from “in silico” digestion of known proteins in a database.
N
Abundance
C
N
Analysis
m/z
C
N
N
C
Ion currentIon current
VQVSR
AWGI
SPVR
Fig. 7.3. MS/MS analysis. The first mass analyzer selects ions of a particular m/z for fragmentation. The second mass analyzer produces the
mass spectrum for those fragments.
AWGISPVR
AWGIS
ISPVR
m/ z
m/ z
AWGISP
QGLWIVDMSSGAVK
NQNEYQVSWDTEK
AWGISPV
WGISPVR
ENIYPEDQQESPSIGLK
MS
MS/MS
72 73
Page 39

2-D Electrophoresis Guide Methods
2-D Electrophoresis Guide
TABLE OF CONTENTS
PART II
Methods
CHAPTER 8
Sample Preparation
74 75
Page 40

2-D Electrophoresis Guide MethodsChapter 8: Sample Preparation
Tips for Sample Preparation
Keep the sample preparation workflow simple
(increasing the number of sample handling steps
may increase variability).
Lysis (Cell Disruption)
For each 10 mg (fresh weight) pelleted cells or
animal tissue, use about 1 ml of 2-D sample
solution for a protein concentration of 1–3 mg/ml.
When disrupted in liquid nitrogen, samples such
as liver biopsies and plant leaves contain 10–30%
and 1–2% extractable protein, respectively
To diminish endogenous enzymatic activity:
— Disrupt the sample or place freshly disrupted
samples in solutions containing strong
denaturing agents such as 7–9 M urea,
2 M thiourea, or 2% SDS. In this environment,
enzymatic activity is often negligible
— Perform cell disruption at low temperatures
to diminish enzymatic activity
— Lyse samples at pH >9 using either sodium
carbonate or Tris as a base in the lysis solution
(proteases are often least active at basic pH)
— Add a chemical protease inhibitor
to the lysis buffer. Examples include
phenylmethylsulfonyl fluoride (PMSF),
aminoethyl-benzene sulfonyl fluoride (AEBSF),
tosyl lysine chloromethylketone (TLCK),
tosyl phenyl chloromethyletone (TPCK),
ethylenediaminetetraacetic acid (EDTA),
benzamidine, and peptide protease inhibitors
(for example, leupeptin, pepstatin, aprotinin,
bestatin). For best results, use a combination
of inhibitors in a protease inhibitor cocktail
— If protein phosphorylation is to be studied,
include phosphatase inhibitors such as fluoride
and vanadate
When working with a new sample, use at least two
different cell disruption protocols and compare
the protein yield (by protein assay) and qualitative
protein content (by SDS-PAGE)
Optimize the power settings of mechanical
rupture systems and incubation times for all
lysis approaches. Mechanical cell lysis usually
generates heat, so employ cooling where required
to avoid overheating of the sample
Following cell disruption, check the efficacy of
cell wall disruption by light microscopy and
centrifuge all extracts extensively (20,000 × g
for 15 min at 15°C) to remove any insoluble
material; solid particles may block the pores
of the electrophoresis gel
Direct application of clarified lysate to IPG strips
is appropriate only for samples with high protein
content and minimal interfering substances.
Preparation of many sample types (for example,
plant tissues and dilute bodily fluids) should
incorporate a precipitation step to remove
interfering substances and allow application
of a more concentrated sample
Protein Solubilization
Prepare fresh sample solubilization solutions
daily or store them frozen in aliquots, preferably
at –80°C; always use high-quality reagents and
proteomics-grade water. Use urea stock solutions
soon after they are made, or treat them with a
mixed-bed ion exchange resin to avoid protein
carbamylation by cyanate, which forms in old urea.
If solutions are prepared in advance and stored,
it is best to prepare them without reductant (DTT)
and add the reductant directly before use
Dissolve pelleted protein samples in 1×
2-D sample solution
Perform a protein quantitation assay to determine
the amount of total protein in each sample. Use a
protein assay that is tolerant to chemicals in your
samples. For samples in 2-D sample solution,
for example, use the RC DC
™
protein assay,
which can tolerate up to 2% detergent
Dilute or concentrate samples as needed to
yield a final protein concentration of 1–5 mg/ml.
Make dilutions in 2-D sample solution and
concentrate the sample using the ReadyPrep
2-D cleanup kit
Use protein extracts immediately or aliquot them
into appropriately sized batches and store them
at –80°C to avoid freeze-thaw cycles
Highly viscous samples likely have a very high
DNA or carbohydrate content. Fragment DNA
with ultrasound during protein solubilization or by
adding endonucleases like benzonase. Use protein
precipitation (for example, with the ReadyPrep 2-D
cleanup kit) to diminish carbohydrate content
Do not heat samples containing urea and thiourea
above 35°C as this can lead to protein modification
Buffers and Solutions
2-D sample solution (50 ml)
7 M urea, 2 M thiourea, 4% (w/v) CHAPS, 40 mM DTT,
0.2% (w/v) ampholytes (pH 3–10)
Urea/thiourea stock solution 48 ml
CHAPS 2.0 g
Bio-Lyte
®
ampholytes, pH 3–10 250 µl
DTT 0.31 g
Bromophenol blue (1%) 10 µl
Distilled or deionized H
2-D sample solution is used for sample application
O to 50 ml
2
and IPG strip rehydration. Bio-Rad offers various
types of 2-D sample buffers, which differ in
solubilizing power (see Ordering Information)
For pH control, Tris base may be added to the
2-D sample solution at 10–40 mM. Addition of
Tris increases the conductivity of the sample solution
and extends the time required to focus the IPG strips
Ampholytes are added to all IPG rehydration
and sample solubilization solutions to maintain
solubility of the proteins. The choice of ampholytes
depends on the pH range of the IPG strip.
Higher concentrations (up to 1% (w/v)) may be
used, but they result in lower IEF voltage and
correspondingly longer focusing times
Urea/thiourea stock solution (50 ml)
Urea 22 g
Thiourea 8 g
Distilled or deionized H
O to 50 ml
2
Filter through Whatman No. 1 paper
™
using a Buchner funnel
Store at –80°C
1% Bromophenol blue (10 ml)
Bromophenol blue will not dissolve in unbuffered
water. Prepare 10 ml of 50 mM Tris base by dissolving
60.6 mg of Tris in 10 ml of water. Add 100 mg of
bromophenol blue and vortex until dissolved.
Store at 25°C.
Cell washing buf fer (1 L)
10 mM Tris-HCl, pH 7.0, 250 mM sucrose
Tris base 1.21 g
Sucrose 85.58 g
Distilled or deionized H
O 800 ml
2
Dissolve
Adjust pH to 7.0 with HCl
Distilled or deionized H
O to 1 L
2
Store at 4°C
Protein precipitation solution (100 ml)
20% (w/v) trichloroacetic acid (TCA), 0.2% DTT (w/v)
in ice-cold acetone (–20°C)
Trichloroacetic acid 20 g
DTT 0.2 g
Acetone 80 ml
Dissolve
Acetone to 100 ml
Store at –20°C
Wash solution (100 ml)
0.2% DTT in ice-cold acetone (–20°C)
DTT 0.2 g
Acetone 80 ml
Dissolve
Acetone to 100 ml
Store at –20°C
SDS sample solubilization buffer (50 ml)
1% (w/v) SDS, 100 mM Tris-HCl (pH 9.5)
SDS 0.5 g
Tris base 0.6 g
Distilled or deionized H
O 40 ml
2
Titrate to pH 9.5 with diluted HCl
Distilled or deionized H
O to 50 ml
2
Store at 25°C
76 77
Page 41

2-D Electrophoresis Guide MethodsChapter 8: Sample Preparation
Cell Lysis and Protein Extraction Procedures
Suspension Cultured Human Cells
Use the MicroRotofor™ cell lysis kit (mammalian) or the
protocol below, which uses 2-D sample solution and a
sonicator for cell lysis and protein extraction. Use 0.5 ml
of 2-D sample solution with 3 × 10
Reagents
2-D sample solution
Cell washing buffer
Protocol
1
2
3
4
5
6
Pellet the cells by centrifugation at
2,000 × g for 5 min at 4°C.
Discard the supernatant and wash
pelleted cells in cold cell washing buffer.
Repeat steps 1 and 2 two times.
Add 2-D sample solution to the
pelleted cells and suspend the pellet
with a pipet.
Place the cell suspension on ice,
incubate 5 min, and sonicate at
appropriate intervals. Check lysis
efficacy by light microscopy.
Centrifuge cell debris at 14,000 × g
for 15 min and transfer supernatant
to a new vial.
Perform a protein assay of the
supernatant. A protein concentration
of 3–5 mg/ml is best for
2-D electrophoresis.
7
cells.
Monolayer Cultured Human Cells
Use the MicroRotofor cell lysis kit (mammalian) or
the protocol below, which uses 2-D sample solution
and a sonicator for cell lysis and protein extraction.
Use 0.5 ml of 2-D sample solution with 3 × 10
Reagents
2-D sample solution
Cell washing buffer
Protocol
1
2
3
4
5
6
Carefully remove (decant) culture
medium from cells. Wash cells twice
with cell washing buffer.
Add 2-D sample solution to the cells
and keep on ice for 5 min. Swirl the
plate occasionally to spread the buffer
around the plate.
Use a cell scraper to collect the lysate
and transfer to a microcentrifuge tube.
Place the cell suspension on ice,
incubate 5 min, and sonicate at
appropriate intervals. Check lysis
efficacy by light microscopy.
Centrifuge the cell debris at 14,000 × g
for 15 min and transfer the supernatant
to a new vial.
Perform a protein assay of the
supernatant. A protein concentration
of 3–5 mg/ml is best for
2-D electrophoresis.
7
cells.
Mammalian Tissue
Use the MicroRotofor cell lysis kit (mammalian) or the
protocol below, which involves freezing tissue samples
(for example, biopsy samples) in liquid nitrogen.
Use liquid nitrogen and a mortar and pestle to grind
the samples while they are still frozen. Break up any
larger pieces beforehand (for example, wrap the
frozen tissue sample in aluminum foil and crush
with a hammer).
Reagents
2-D sample solution
Protocol
1
2
3
4
5
6
7
Chill a mortar with liquid nitrogen,
then grind small tissue pieces in
the presence of liquid nitrogen to
a fine powder.
Immediately after grinding, transfer
60 mg tissue powder to a
microcentrifuge tube containing
1.0 ml of 2-D sample solution.
Optional: sonicate the sample on
ice 5 times, for 2 sec each time.
Pause between sonication steps
to avoid overheating.
Incubate the sample at room
temperature for 30 min. Vortex from
time to time.
Centrifuge at 35,000 × g for 30 min
at room temperature.
Perform a protein assay to determine
the protein concentration of the
supernatant, which should be
5–10 mg/ml.
Dilute the supernatant with 2-D
sample solution and incubate for
20 min at room temperature.
Microbial Cultures
Reproducible sample preparation from bacteria and
yeast is challenging because the cells may release
proteases and other enzymes into the growth medium
(Harder et al. 1999, Drews et al. 2004, Poetsch and
Wolters 2008). Wash the cultures thoroughly with isotonic
buffers and take precautions to inactivate the proteolytic
activity after cell lysis. Extensive disruption of microbial
cells is required and is usually performed with the help of
a French press, bead impact instruments, or sonicator.
Use the MicroRotofor cell lysis kit (bacteria),
the MicroRotofor cell lysis kit (yeast), or the protocol
below. This protocol relies on cell lysis with ultrasonic
waves in combination with a solubilization in SDS
under elevated temperature to ensure deactivation
and denaturation of proteases.
Reagents
SDS sample solubilization buffer
2-D sample solution
Cell washing buffer
Protocol
1
2
3
Centrifuge cells (~5 × 10
for 3 min and resuspend the pellet in an
equal volume of 2-D cell washing buffer
heated at 37°C and centrifuge again.
Repeat two more times to remove
all interfering material (extracellular
proteases and growth media).
Add ~150 µl hot (95°C) SDS sample
solubilization buffer to the pellet and
vortex thoroughly.
Sonicate the sample solution 10 times
for 1 sec each at ~60 W and ~20 kHz.
Incubate the sample at 95°C for 5 min.
7
) at 5,000 × g
4
5
Cool the sample to 20°C and dilute
with ~500 µl of 2-D sample solution.
Incubate for another 20 min at room
temperature. The final SDS concentration
should not exceed 0.25% in the extract
to be applied onto the IPG strip; therefore,
be sure that the total volume is
maintained during the SDS boiling step.
6
7
Centrifuge the sample solution at 20°C
for 30 min at 14,000 × g and harvest
the supernatant.
Perform the protein assay. The protein
concentration should be ~5 µg/µl.
78 79
Page 42

2-D Electrophoresis Guide MethodsChapter 8: Sample Preparation
Cell Lysis and Protein Extraction Procedures (c on td.)
Plant Leaves
Plant leaf cells contain reactive compounds (such as proteases, phenol oxidases, organic acids, phenols,
and terpenes). To minimize the deleterious effects of these compounds on protein integrity, use the MicroRotofor
cell lysis kit (plant) or follow this protocol, which involves grinding the tissue in a mortar and pestle with liquid
nitrogen. Precipitate the proteins with 20% trichloroacetic acid (TCA) in prechilled acetone (–20°C). To remove
the plant phenols, rinse the pellet at least twice with cold acetone (–20°C) and air-dry samples in a vacuum
(Damerval 1986).
Reagents
Protein precipitation solution
Wash solution
2-D sample solution
Protocol
1
2
3
4
5
6
Cool protein precipitation and wash
solutions to –20°C and chill a mortar
with liquid nitrogen.
Place leaves in the mortar, add liquid
nitrogen, and grind the leaves
in the liquid nitrogen to a fine powder.
Transfer leaf powder into 20 ml protein
precipitation solution and incubate for
1 hr at –20°C. Stir solution occasionally.
Centrifuge the solution at –20°C for
15 min at 35,000 × g.
Discard the supernatant, add wash
solution, and suspend the pellet.
Incubate for 15 min at –20°C and stir
the solution occasionally.
Repeat steps 4 and 5 until the wash
solution turns from dark to light green.
7
8
9
10
11
12
13
Centrifuge the solution at –20°C for
15 min at 35,000 × g and discard
the supernatant.
Add 2 ml of wash solution and suspend
the pellet.
Transfer the suspension into a shallow
ceramic shell and cover with perforated
Parafilm wrap.
Put the shell into a dessicator and
apply a vacuum until the pellet
(acetone powder) is dry.
Mix 5 mg of sample powder with
~0.5 ml of 2-D sample solution
and incubate for 30 min at room
temperature. Vortex from time to time.
Centrifuge the solution at room
temperature for 15 min at >16,000 × g.
Collect the supernatant and perform
the protein assay.
Sample Cleanup
Prior to IEF, remove contaminating salts, buffers, and other chemicals from samples by dialysis, precipitation,
or buffer exchange. A protocol for buffer exchange using Bio-Rad’s Micro Bio-Spin
here. Another alternative is the use of the ReadyPrep 2-D cleanup kit to effectively precipitate sample protein
and remove contaminants. It has the additional benefit of concentrating the sample to a desired volume.
™
P-6 columns is provided
Buffer Exchange (Desalting)
Bio-Rad’s Micro Bio-Spin columns are suitable for use with 1.5 or 2.0 ml microcentrifuge tubes and are
completely autoclavable. They accommodate volumes of 20–75 µl; volumes less than 20 µl may affect
recovery. The gel in the Micro Bio-Spin columns is suspended in either SSC buffer, pH 7.0, or Tris-HCl buffer,
pH 7.4. For 2-D electrophoresis, it is best to exchange the sample into the 2-D sample solution (7 M urea,
2 M thiourea, 4% CHAPS) using the following protocol. DTT and ampholytes are added after the buffer
exchange procedure.
Protocol
1
2
3
Invert the column sharply several
times to resuspend the settled gel
and remove any bubbles. Snap off
the tip and place the column in a
2.0 ml microcentrifuge tube (included).
Remove the top cap. If the column does
not begin to flow, push the cap back on
the column and then remove it again to
start the flow. Allow the excess packing
buffer to drain by gravity to the top of
the gel bed (about 2 min). Discard the
drained buffer, then place the column
back into the 2.0 ml tube.
Centrifuge for 2 min in a microcentrifuge
at 1,000 × g to remove the remaining
packing buffer. Discard the buffer.
Apply the new buffer in 500 μl aliquots.
After each application, let the buffer
drain out by gravity, then centrifuge
the column at 1,000 × g for 1 min
to remove the buffer. Discard the
buffer from the collection tube.
Repeat as required. Three washes
result in >99% of the buffer exchanged.
Four washes result in >99.9% of the
buffer exchanged.
4
5
Place the column in a clean 1.5 or 2.0 ml
microcentrifuge tube. Carefully apply
the sample (20–75 μl) directly to the
center of the column. Application of
more or less than the recommended
sample volume may decrease
column performance.
Centrifuge the column for 2–4 min at
1,000 × g. Following centrifugation,
the purified sample is in the new
buffer. Molecules smaller than the
column’s exclusion limit are retained
by the column.
80 81
Page 43

2-D Electrophoresis Guide MethodsChapter 8: Sample Preparation
Sample Quantitation (RC DC Protein Assay)
The RC DC protein assay is based on a modification of the Lowry protocol (Lowry et al. 1951) and is both
reducing agent compatible (RC) and detergent compatible (DC). Protein quantitation can be performed in
complex mixtures including 2-D sample solution. It involves addition of detection reagents to a protein solution
and subsequent measurement of absorbance at 750 nm with a spectrophotometer. Comparison to a standard
curve provides a relative measurement of protein concentration.
Microfuge Tube Assay Protocol (1.5 ml)
1
2
3
4
Add 5 μl of DC Reagent S to each
250 μl of DC Reagent A needed.
This solution is referred to as
Reagent A
assayed requires 127 μl Reagent A
Prepare 3–5 dilutions of a protein
standard (0.2–1.5 mg/ml protein).
Use distilled or deionized water as
the diluent.
Pipet 25 µl of protein standard
or sample into clean 1.5 ml
microcentrifuge tubes. Add 125 µl
of RC Reagent I into each tube and
vortex. Incubate the tubes for 1 min
at room temperature.
Add 125 µl of RC Reagent II into
each tube and vortex. Centrifuge
the tubes at 15,000 x g for 5 min.
Position the tubes with the cap
hinge facing outward.
. Each standard or sample
´
´
6
.
7
8
9
10
Add 127 µl of Reagent A
and vortex. Incubate tubes at room
temperature for 5 min, or until the
precipitate is dissolved. Vortex.
Add 1 ml of DC Reagent B to each tube
and vortex immediately. Incubate at
room temperature for at least 15 min,
but no longer than 1 hr.
Read absorbance of each sample at
750 nm. The absorbances are stable
for at least 1 hr.
Plot absorbance measurements as
a function of concentration for the
standards.
Interpolate the concentration of the
protein samples from the plot and
sample absorbance measurements.
to each tube
´
5
Remove the tubes as soon as
centrifugation is complete. A small
pellet should be visible on the
hinge side of the tube. Decant the
supernatant. Reposition the tubes as
before. Briefly centrifuge again to bring
any remaining liquid to the bottom of
the tube. Use a micropipet to remove
the remaining liquid.
82 83
Page 44

2-D Electrophoresis Guide Methods
TABLE OF CONTENTSTABLE OF CONTENTS
CHAPTER 9
First-Dimension IEF
with IPG Strips
84 85
Page 45

2-D Electrophoresis Guide MethodsChapter 9: First-Dimension IEF with IPG Strips
Tips for IEF
Master 2-D separation techniques using the
ReadyPrep
before using your own samples. The kit contains
premixed reagents, a standard sample, and a
detailed and optimized protocol, which allows
you to become familiar with the 2-D workflow and
techniques while validating the performance of
your 2-D system
When preparing solutions, use clean and dust-free
vessels to avoid keratin contamination
Use highly purified laboratory water
(conductivity <2 µS)
Use deionized urea prepared with a mixed-bed ion
exchange resin to avoid protein carbamylation by
cyanate, which forms in old urea
Do not heat urea-containing buffers to >37°C to
™
2-D starter kit (catalog #163-2105)
IPG Strip Rehydration and Sample Loading
Prior to their use in IEF, IPG strips must be
rehydrated (with or without sample) to their original
thickness with rehydration solution (Table 9.1),
which is often the 2-D sample solution
(see Chapter 8).
Tips for Rehydration and Sample Loading
Rehydrate IPG strips for 12 hr–overnight at 20°C
(or room temperature)
After rehydration in a rehydration/equilibration tray,
rinse and blot the IPG gel strips to remove excess
rehydration solution before transferring to the
focusing tray; otherwise, urea may crystallize
on the surface of the IPG strips
Moisten electrode wicks with deionized water.
They should be moist, not wet
avoid protein carbamylation
Table 9.1. Rehydration volumes a nd sample loads. Protein load recommendations are intended as a starting point, and the optimum amount
for the sample must be determined empirically. For narrow-range IPG strips, use more protein (proteins outside the range will not remain on the strip).
For single-pH-unit IPG strips, use up to 4– 5 times more protein to improve the detection of low-abundance proteins.
IPG Strip Length, cm
7 11 17 18 24
Rehydration solution 125 µl 200 µl 300 µl 315 µl 450 µl
Protein load
Coomassie (Brilliant) Blue 50–100 µg 100–200 µg 200–400 µg 200– 400 µg 400 –80 0 µg
Fluorescent stains 5–100 µg 20 –200 µg 50– 400 µg 50– 400 µg 80–800 µg
Silver stains 5–20 µg 20–50 µg 50 –80 µg 50–80 µg 80–150 µg
Mineral oil 4 ml 5 ml 7 ml 7 ml 9 ml
Performing IEF
IPG Strip Rehydration in Rehydration/
Equilibration Trays Followed by IEF
The instructions in this chapter pertain to the use of
the PROTEAN
details about the components of this system and their
assembly and use, please refer to the PROTEAN i12
cell instruction manual (bulletin 10022069).
Protocol
1
2
3
4
®
i12™ cell and accessories. For more
Pipet the rehydration solution
(with or without sample, see Table 9.1
for volumes and protein loads) along
the center of the channel(s) of the
i12 rehydration/equilibration tray.
Take care not to introduce air
bubbles when expelling the solution.
Using forceps, remove the cover sheet
from the IPG strip, then gently place
the IPG strip gel-side down onto the
solution in the channel. Move the IPG
strip back and forth slightly to ensure
that the solution is distributed along its
length and that the strip is not sticking
to the bottom of the tray. Take care to
avoid trapping air bubbles beneath the
IPG strip.
Overlay each IPG strip with mineral oil
to prevent evaporation and precipitation
of urea during rehydration (see Table 9.1
for recommended volumes). Apply the
mineral oil to both ends of the channel
and allow it to flow toward the middle.
Cover the tray and leave it on a
level bench overnight (12–18 hr) for
complete rehydration.
IEF with Gel-Side Up
The following protocol is for IPG strips that have
been rehydrated in the presence of sample
(in-gel sample loading).
Protocol
1
2
3
4
5
Using forceps, remove the IPG strips
from the rehydration tray, remove
excess mineral oil, and place the
rehydrated IPG strips gel-side up
in the channels of the focusing tray.
Position the positive (+) ends of the
IPG strips against the positioning
stops in each channel.
Recommended: Wet the gel-side
up wicks (notched) with distilled or
deionized water and blot off excess
water. Use two wicks per IPG strip:
place a wick at each end of each
IPG strip.
Position the electrode assemblies
in the focusing tray and press
down on the green tabs to snap
the electrode assemblies into place.
Place the focusing tray with the
rehydrated IPG strips on the Peltier
platform and connect the electrodes
to the instrument.
Overlay each IPG strip with
mineral oil (see Table 9.1 for
recommended volumes).
Select or program the protocol(s)
and start the run.
5
Rehydration
With sample
(in-gel sample loading)
Without sample
Fig. 9.1. Sample loading.
the focusing tray for IEF (see below).
Transfer IPG str ips
to focusing tray
Transfer IPG str ips
to focus ing tr ay
IEF
With gel-side up
With gel-side down
With gel-side up
(cup loading)
86 87
Transfer the rehydrated IPG strips to
Page 46

2-D Electrophoresis Guide MethodsChapter 9: First-Dimension IEF with IPG Strips
Performing IEF (contd.)
IEF with Gel-Side Down
The following protocol is for IPG strips that have
been rehydrated in the presence of sample
(in-gel sample loading).
Protocol
1
2
3
4
5
6
7
Position the electrode assemblies in
the channels of the focusing tray and
press down on the green tabs to snap
the electrode assemblies into place.
Recommended: Wet the rectangular
(gel-side down) wicks with distilled or
deionized water and blot off excess
water. Use two wicks per IPG strip:
place a wick on top of each electrode.
Using forceps, place the rehydrated
IPG strips gel-side down in the
channels of the focusing tray.
Position the positive (+) ends of the
IPG strips against the positioning
stops in each channel.
Place the focusing tray on the Peltier
platform and connect the electrodes
to the instrument.
Overlay each IPG strip with
mineral oil (see Table 9.1 for
recommended volumes).
Place the IPG strip retainers on top of
the IPG strips at both the positive and
the negative ends. Without IPG strip
retainers in place, gases formed
during electrolysis may lift IPG
strips off the electrodes, interrupting
electrical contact.
Select or program the protocol(s)
and start the run.
Cup Loading (IEF with Gel-Side Up)
This protocol is for IPG strips that have been
rehydrated in the absence of sample. Sample cups
offer an alternative method of sample loading, and
their use can often improve resolution, especially at
extreme pH ranges. The PROTEAN i12 sample cup
assembly consists of a sample cup holder that holds
1–12 disposable sample cups.
Protocol
1
2
3
4
5
6
Using forceps, place the rehydrated IPG
strips gel-side up in the channels of
the focusing tray. Position the positive (+)
end of the IPG strips against the
positioning stops in each channel.
Recommended: Wet the gel-side
up electrode wicks (notched) with
deionized water and blot off excess
water. Use two wicks per IPG strip:
place a wick at each end of each
IPG strip.
Position the electrode assemblies in
the focusing tray and press down on
the green tabs to snap the electrode
assemblies into place. Place the
focusing tray with the rehydrated IPG
strips on the Peltier platform, and
connect the electrodes to
the instrument.
Prepare the sample cup assembly by
placing the sample cups into the slots
of the sample cup holder corresponding
to the channel with the rehydrated
IPG strip.
Clamp the sample cup assembly onto
the edges of the focusing tray, on top
of the IPG strips and next to either
electrode. Placement depends on the
pH gradient and the sample. In general,
focusing is most effective towards
the end of the IPG strip opposite the
site of the sample cup placement.
Use anodic sample cup placement
when using basic pH ranges or when
resolution of basic proteins is desired.
Load 25–250 μl of sample into the
sample cups (larger volumes of dilute
samples of up to 400 μl may be loaded).
Overlay both the sample in the sample
cup and the IPG strip with mineral oil.
IPG Strip Rehydration in the Focusing Tray Followed by IEF
For rehydration and IEF in the focusing tray, place the IPG strip gel-side down on top of the rehydration solution
in the focusing tray. Rehydration can be programmed as a part of the IEF run, and the protocols can be
programmed next. Alternatively, the strips can be rehydrated independently and the protocol(s) started
when most convenient.
Protocol
1
2
3
4
5
Rehydration
Fig. 9.2. Rehydration in the focusing tray.
Position the electrode assemblies
in the focusing tray.
Pipet the rehydration solution containing
the protein sample along the center of
the channel(s) of the focusing tray
(see Table 9.1 for recommended volumes
and protein loads). Do not introduce air
bubbles when expelling the solution.
Using forceps, remove the cover sheet
from the IPG strip, then gently place
the IPG strip gel-side down onto the
sample in the channel of the tray.
To ensure even rehydration, move the
IPG strip back and forth slightly to
distribute the solution along its length.
Check that no bubbles are trapped
beneath the strips and that some
rehydration solution extends beyond
the electrode contacts.
Place the focusing tray with the IPG
strips on the Peltier platform and
connect the electrodes to
the instrument.
Immediately overlay each IPG strip with
mineral oil to prevent evaporation and
precipitation of urea during rehydration.
Apply the mineral oil to both ends
of the channel and allow it to flow
toward the middle. See Table 9.1 for
recommended volumes of mineral oil.
With sample
(passive or active)
IPG str ips remain
in focusing tray
6
7
8
Position the IPG strip retainers on top
of the IPG strips at both the anode
and the cathode to maintain electrical
contact with the IPG strips. Without the
IPG strip retainers, gases formed during
electrolysis may lift the IPG strips
off the electrodes, interrupting
electrical contact.
Rehydration in the focusing tray with in-gel
sample application can be programmed
as a part of the IEF
run or be performed separately.
To program rehydration as part
of the run:
a. Select or program the protocol(s)
for the lanes containing IPG strips
b. Program the global rehydration
conditions. If electrode wicks are
used, include a post-rehydration
pause to insert electrode wicks
when the rehydration step is
completed
c. Start the run
For rehydration not programmed as part
of the run, leave the tray on the Peltier
platform or on a level bench overnight
(11–16 hr) for complete rehydration.
Start the run (perform IEF).
IEF
With gel-side down
7
Select or program the protocol(s)
and start the run.
88 89
Page 47

2-D Electrophoresis Guide MethodsChapter 9: First-Dimension IEF with IPG Strips
IEF Programming Recommendations
The protocols and settings described are for IEF using
the PROTEAN i12 IEF cell. Preprogrammed protocols
serve as convenient starting points for optimization of
IEF conditions (Tables 9.2 to 9.5).
The recommended focusing temperature for most
samples is 20°C
For better sample entry, start IEF with a low voltage
gradient (200 V for 30–180 min) and limit current to
50 µA per IPG strip for the whole run
™
Table 9.2. Preprogrammed protocols for 7 cm ReadyStrip
Protocol Name
7 cm pH 3–10 R
7 cm pH 3–10 NL R
7 cm pH 4–7 R
7 cm pH 5–8 R
7 cm pH 3–10 G
7 cm pH 3–10 NL G
7 cm pH 4–7 G
7 cm pH 5–8 G
7 cm pH 3–6 R
7 cm pH 3–6 G
7 cm pH 3.9 – 5.1
7 cm pH 4.7–5.9
7 cm pH 5.5 – 6.7
7 cm pH 6.3 – 8.3
7 cm pH 7–10 R
7 cm pH 7–10 G
R = rapid, G = gradual
Step Voltage, V Ramp Time Units
1 4,00 0 Rapid 15,000 Vh
2 500 Hold
1 250 Rapid 0:20 HH:MMr
2 4,000 Gradual 1:00 HH:MM
3 4,000 Rapid 15,000 Vh
4 500 Hold
1 4,00 0 Rapid 10,000 Vh
2 500 Hold
1 250 Rapid 0:15 HH:MMr
2 4,000 Gradual 1:00 HH:MM
3 4,000 Rapid 20,000 Vh
4 500 Hold
1 250 Rapid 0:15 HH:MMr
2 4,000 Gradual 1:00 HH:MM
3 4,000 Rapid 20,000 Vh
4 500 Hold
1 250 Rapid 0:15 HH:MMr
2 4,000 Gradual 1:00 HH:MM
3 4,000 Rapid 25,000 Vh
4 500 Hold
1 4,00 0 Rapid 16,000 Vh
2 500 Hold
1 250 Rapid 0:15 HH:MMr
2 4,000 Gradual 1:00 HH:MM
3 4,000 Rapid 16,000 Vh
4 500 Hold
IPG strips.
Focusing time depends on gel length, pH gradient,
gel additives, and protein amount loaded.
Vertical streaking is often caused by overfocusing —
isoelectric precipitation (pI fallout) increases with
focusing time. For this reason, do not conduct firstdimension IEF for any longer than is necessary
After completion of the IEF run, IPG strips should
be stored frozen at –80°C in rehydration trays
or immediately applied to a second-dimension
SDS-gel. Frozen IPG strips can be stored for
about 3–6 months
Table 9.3. Preprogrammed protocols for 11 cm ReadyStrip IPG strips.
Protocol Name
11 cm pH 3–10 R
11 cm pH 3–10 NL R
11 cm pH 4–7 R
11 cm pH 5–8 R
11 cm pH 3–10 G
11 cm pH 3–10 NL G
11 cm pH 4–7 G
11 cm pH 5–8 G
11 cm pH 3–6 R
11 cm pH 3–6 G
11 cm pH 3.9– 5.1
11 cm pH 4.7–5.9
11 cm pH 5.5– 6.7
11 cm pH 6.3– 8.3
11 cm pH 7–10 R
11 cm pH 7–10 G
R = rapid, G = gradual
Step Voltage, V Ramp Time Units
1 8,00 0 Rapid 26,000 Vh
2 750 Hold
1 250 Rapid 0:20 HH:MMr
2 8,000 Gradual 1:00 HH:MM
3 8,000 Rapid 26,000 Vh
4 1,500 Hold
1 8,00 0 Rapid 20,000 Vh
2 750 Hold
1 250 Rapid 0:20 HH:MMr
2 8,000 Gradual 1:00 HH:MM
3 8,000 Rapid 20,000 Vh
4 750 Hold
1 250 Rapid 0:20 HH:MMr
2 8,000 Gradual 1:00 HH:MM
3 8,000 Rapid 32,000 Vh
4 750 Hold
1 250 Rapid 0:20 HH:MMr
2 8,000 Gradual 1:00 HH:MM
3 8,000 Rapid 40,000 Vh
4 750 Hold
1 8,00 0 Rapid 29,000 Vh
2 750 Hold
1 250 Rapid 0:20 HH:MMr
2 8,000 Gradual 1:00 HH:MM
3 8,000 Rapid 29,000 Vh
4 750 Hold
90 91
Page 48

2-D Electrophoresis Guide MethodsChapter 9: First-Dimension IEF with IPG Strips
IEF Programming Recommendations (contd.)
Table 9.4. Preprogrammed protocols for 17 and 18 cm ReadyStrip IPG strips.
Protocol Name
17 cm pH 3–10 R
17 cm pH 3–10 NL R
17 cm pH 4–7 R
17 cm pH 5– 8 R
17 cm pH 3–10 G
17 cm pH 3–10 NL G
17 cm pH 4–7 G
17 cm pH 5– 8 G
17 cm pH 3– 6 R 18 cm pH 3–6 R
17 cm pH 3– 6 G 18 cm pH 3 –6 G
17 cm pH 3.9–5.1
17 cm pH 4.7–5.9
17 cm pH 5.5–6.7
17 cm pH 6.3–8.3
17 cm pH 7–10 R 18 cm pH 7–10 R
17 cm pH 7–10 G 18 cm pH 7–10 G
R = rapid, G = gradual
18 cm pH 3–10 R
18 cm pH 3–10 NL R
18 cm pH 4–7 R
18 cm pH5–8 R
18 cm pH 3–10 G
18 cm pH 3–10 NL G
18 cm pH 4–7 G
18 cm pH 5– 8 G
18 cm pH 3.9 –5.1
18 cm pH 4.7–5.9
18 cm pH 5.5 –6.7
18 cm pH 6.3–8.3
Step Voltage, V Ramp Time Units
1 10,000 Rapid 43,000 Vh
2 1,000 Hold
1 250 Rapid 0:30 HH:MMr
2 10,000 Gradual 2:00 HH:MM
3 10,000 Rapid 43,000 Vh
4 1,000 Hold
1 10,000 Rapid 32,000 Vh
2 1,000 Hold
1 250 Rapid 0:30 HH:MMr
2 10,000 Gradual 2:00 HH:MM
3 10,000 Rapid 32,000 Vh
4 1,000 Hold
1 250 Rapid 0:30 HH:MMr
2 10,000 Gradual 2:00 HH:MM
3 10,000 Rapid 50,000 Vh
4 1,000 Hold
1 250 Rapid 0:30 HH:MMr
2 10,000 Gradual 2:00 HH:MM
3 10,000 Rapid 63,000 Vh
4 1,000 Hold
1 10,000 Rapid 46,000 Vh
2 1,000 Hold
1 250 Rapid 0:30 HH:MMr
2 10,000 Gradual 2:00 HH:MM
3 10,000 Rapid 46,00 0 Vh
4 1,000 Hold
Table 9.5. Preprogrammed protocols for 24 cm ReadyStrip IPG strips.
Protocol Name
24 cm pH 3–10 R
24 cm pH 3–10 NL R
24 cm pH 4–7 R
24 cm pH 5–8 R
24 cm pH 3–10 G
24 cm pH 3–10 NL G
24 cm pH 4–7 G
24 cm pH 5–8 G
24 cm pH 3–6 R
24 cm pH 3–6 G
24 cm pH 3.9 – 5.1
24 cm pH 4.7–5.9
24 cm pH 5.5 – 6.7
24 cm pH 6.3 – 8.3
24 cm pH 7–10 R
24 cm pH 7–10 G
R = rapid, G = gradual
Step Voltage, V Ramp Time Units
1 10,000 R apid 60,000 Vh
2 1,500 Hold
1 250 Rapid 0:30 HH:MMr
2 10,000 Gradual 2:00 HH:MM
3 10,000 R apid 60,000 Vh
4 1,500 Hold
1 10,000 Rapid 44,000 Vh
2 1,500 Hold
1 250 Rapid 0:30 HH:MMr
2 10,000 Gradual 2:00 HH:MM
3 10,000 Rapid 44,000 Vh
4 1,500 Hold
1 250 Rapid 0:30 HH:MMr
2 10,000 Gradual 2:00 HH:MM
3 10,000 R apid 70,000 Vh
4 1,500 Hold
1 250 Rapid 0:30 HH:MMr
2 10,000 Gradual 2:00 HH:MM
3 10,000 R apid 70,000 Vh
4 1,500 Hold
1 10,000 Rapid 63,000 Vh
2 1,500 Hold
1 250 Rapid 0:30 HH:MMr
2 10,000 Gradual 2:00 HH:MM
3 10,000 Rapid 63,000 Vh
4 1,500 Hold
92 93
Page 49

2-D Electrophoresis Guide Methods
TABLE OF CONTENTSTABLE OF CONTENTS
CHAPTER 10
Second-Dimension
SDS-PAGE
94 95
Page 50

2-D Electrophoresis Guide MethodsChapter 10: Second-Dimension SDS-PAGE
Tips for SDS-PAGE
Ensure that gels have the same composition by
either using precast gels, which are manufactured
in lots and so are virtually identical, or hand
casting the gels at the same time in a multicasting chamber
Save time by preparing the overlay solution
and running buffers during the 10 min
equilibration incubations
Vertical streaking on second-dimension gels is
often caused by gaps between the IPG strips and
the gels. Ensure that the second-dimension gel
has a straight and level top edge, and that the
IPG strip is in direct contact with the gel along its
entire length
When preparing running buffers, make the solution
as specified in the protocol and do not titrate to a
pH. The ion balance is set by the concentration of
reagents; adjusting the pH alters this balance and
leads to undesirable results
Do not reuse running buffers
Use 5–10 V per cm of gel for 10 to 30 min during
sample entry (until the sample has concentrated
at the starting point of the separation gel).
Then continue with the voltage setting
recommended in the instruction manual for
the electrophoresis system you are using
Use the voltage setting recommended in the
instruction manual for the electrophoresis system
you are using; excessive voltage leads
to decreased resolution and distortions
When running multiple cells, use the same
voltage for multiple cells as you would for one cell.
Be aware that the current drawn from the power
supply will double with two — compared to one —
cells. Use a power supply that can accommodate
this additive current and set the current limit high
enough to permit this additive function
To maximize reproducibility, maintain the
temperature of the electrophoresis buffer at
about 20°C with the help of a recirculating cooler
IPG Strip Equilibration
Equilibrate the IPG strips twice, each time for 10 min,
in two different equilibration buffers. Use disposable
rehydration/equilibration trays for this purpose.
Reagents
Tris-HCl buffer (25 ml)
1.5 M Tris-HCl (pH 8.8)
Dissolve 4.55 g of Tris base in ~20 ml of deionized
or distilled H
diluted HCl and adjust the volume to 25 ml with
distilled or deionized H
Equilibration stock buffer (500 ml)
6 M urea, 30% (w/v) glycerol, 2% (w/v) SDS in 0.05 M
Tris-HCl buffer, (pH 8.8). Pre-prepared equilibration
buffers can also be purchased.
Combine 180 g of urea, 150 g of glycerol, 10 g of SDS,
and 16.7 ml of Tris-HCl buffer. Dissolve in deionized
distilled H
Store frozen.
Equilibration buffer 1 (10 ml)
Add 100 mg of DTT to 10 ml of equilibration
stock buffer.
O. Adjust the pH of the solution with
2
O.
2
O and adjust the volume to 500 ml.
2
Protocol
1
2
3
4
Place one IPG strip gel-side up in each
channel of a rehydration/equilibration
tray, and fill the channels with
the recommended volume of
equilibration buffer.
Incubate with gentle agitation for
10 min, then decant.
Fill the channels with the recommended
volume of equilibration buffer 2,
and incubate again for 10 min.
After equilibration, remove the IPG
strips and briefly rinse with the
SDS-PAGE running buffer you will be
using. This step rids the IPG strip of
excess iodoacetamide and serves to
lubricate the IPG strip for placement
on the second dimension.
Equilibration buffer 2 (10 ml)
Add 400 mg of iodoacetamide to 10 ml of
equilibration stock buffer.
Table 10.1. Recommended equilibration volumes.
IPG Str ip Length 7 cm 11 cm 17 cm 18 cm 24 cm
Equilibration buffer 1 2.5 ml 4 ml 6 ml 6 ml 8 ml
Equilibration buffer 2 2.5 ml 4 ml 6 ml 6 ml 8 ml
10 min is recommended for each equilibration step.
96 97
Page 51

2-D Electrophoresis Guide MethodsChapter 10: Second-Dimension SDS-PAGE
Sealing IPG Strips onto SDS-PAGE Gels SDS-PAG E
In this stage, the equilibrated IPG strips are placed
on the top of polyacrylamide gels. This enables
smooth movement of the focused proteins into the
gel for separation by SDS-PAGE.
Reagents
Agarose solution (0.5% [w/v]): Suspend 0.5 g of
low-melting agarose (low electroendosmosis, EEO)
in 100 ml of SDS-PAGE running buffer, and dissolve
it in a boiling water bath or in a microwave oven.
Add a few crystals of bromophenol blue (or 100 µl of
1% bromophenol blue) to color the solution slightly.
The agarose solution can be aliquoted into sealed
1.5 ml or 2.0 ml plastic tubes, which can then be
melted individually in a 100°C heat block when needed.
Caution: Wear protective gloves, goggles, and a
lab coat when handling molten agarose. SDS in the
molten agarose can cause the solution to bubble
over. Molten agarose and the vessel containing it
can cause severe burns if not handled carefully.
Molecular weight standards: SDS-PAGE standards
can be applied to gels that have no reference lane.
Trim a thin filter paper to ~4 × 5 mm and pipet 10 μl of
SDS-PAGE standards onto the wick. Remove excess
solution with filter paper. Alternatively, use Precision
Plus Protein
vertical 2-D gels with or without a reference well.
™
standard plugs, which can be used on
Protocol
1
2
3
4
5
6
Position the second-dimension gel
cassette so that it is leaning slightly
backwards (approximately 30°
from vertical). Use AnyGel
if available.
Place the equilibrated IPG strip (anodic
side on the left) onto the long plate with
the plastic backing against the plate.
Slide the strip between the plates using
a spatula to push against the plastic
backing. Ensure that the plastic backing
remains fully in contact with the long
plate and be careful not to damage the
gel with the spatula. Make sure the IPG
strip is positioned directly on top of
the second-dimension gel without any
bubbles in the interface between the
two gel surfaces.
Optional: Slip a wick soaked with
molecular weight standards or use a
Precision Plus Protein standard plug in
the slot in the gel sandwich next to or
overlapping an end of the IPG strip.
To secure the strip in place, overlay it
with molten agarose solution. Use warm
molten agarose, as hot agarose may
accelerate decomposition of the urea in
the equilibration buffer. Avoid trapping
air bubbles between the IPG strip and
second-dimension gel. Dislodge any
bubbles by tapping the plastic backing
on top of the strip.
Stand the gel upright and allow
the agarose to set for 5–10 min
before loading the gel into the
electrophoresis cell.
™
stands,
Buffers and Solutions
This step requires the use of running buffer appropriate
for the gel chemistry you are using.
SDS-PAGE Running Buffer
(Tris-HCl and TGX™ formulations)
Prepare sufficient 1× Tris/glycine/SDS running buffer
to run the number of gels in the system selected:
1 L of 1× Tris/glycine/SDS (25 mM Tris, 192 mM
glycine, 0.1% SDS)
Tris base 3.03 g
Glycine 14.4 g
SDS 1.0 g
Distilled or deionized H
Alternatively, dilute 10× stock solution
(catalog #161-0732) to the desired volume.
Protocol
Perform SDS-PAGE according to the running
conditions specified for the electrophoresis system
you are using. In general:
1
2
3
4
Insert the gel cassettes in the
electrophoresis apparatus and fill the
buffer chamber(s) with SDS running
buffer. SDS running buffer temperature
should be kept constant at 20°C
if the chamber design allows for
external cooling.
Connect the electrophoresis cell
to a power supply and perform
electrophoresis at 5–10 V per cm of gel
until the sample has concentrated at
the starting point of the separation gel.
Then continue with the voltage settings
recommended by the instruction
manual for the electrophoresis
system you are using.
After electrophoresis, carefully open the
cassettes and use a spatula to separate
the agarose overlay, including the IPG
strip, from the polyacrylamide gel.
Carefully peel the gel from the
cassette and place it in a container
with fixative or staining solution,
depending on the staining procedure
used (see Chapter 11).
O to 1 L
2
98 99
Page 52

2-D Electrophoresis Guide MethodsMethods
TABLE OF CONTENTSTABLE OF CONTENTS
CHA P TER 11
Protein Detection
100 101
Page 53

2-D Electrophoresis Guide MethodsChapter 11: Protein Detection
Tips for Total Protein Staining
Stain gels at room temperature with gentle
agitation (for example, on an orbital shaker),
making sure the gel is completely covered
with stain solution at all times
Use any convenient glass or plastic container
that is appropriate to the method chosen. Use
glass containers with silver staining methods
or with Flamingo
™
stain. Use plastic trays with
SYPRO Ruby stain
Use Bio-Rad’s Dodeca™ stainers for
high-throughput staining
Wear gloves during the staining process, and
handle gels only by the edges and corners.
Wet gloves with water or buffer before handling
the gel to keep the gel from sticking and tearing
Use clean and dust-free containers for gel
staining. Place a lid on the container to avoid
contamination of the staining solution
Use pure chemicals and highly purified water
(conductivity <2 μS)
When performing gel staining with
fluorescent dyes, cover the staining tray
with foil during incubations
Long-Term Storage of Stained Gels
Gels stained with a visible stain can serve as a
permanent record of the SDS-PAGE separation.
Stained gels may be stored indefinitely when dried
between cellophane sheets. To dry stained gels,
the gel is placed on a sheet of wet cellophane.
A second sheet of wet cellophane is carefully laid
over the gel with care taken not to introduce bubbles
or wrinkles. The gel, sandwiched between two
sheets of wet cellophane, is clamped into a frame
and allowed to dry.
The most common problem associated with drying
gels is cracking. Cracking is best prevented by
soaking the gel for at least 30 min in a 2% (w/v)
solution of glycerol in water prior to drying.
Alternatively, a commercially available gel-drying
solution may be used.
Fluorescent dyes like Flamingo and Oriole™
fluorescent gel stains have a higher dynamic range
than Coomassie (Brilliant) Blue or silver staining
techniques and are, therefore, recommended for
quantitative protein analysis
Gels stained with fluorescent dyes can be
counterstained with Bio-Safe
™
Coomassie stain
for further reference and to enhance sensitivity of
the Coomassie stain
Silver staining is not generally recommended
when protein spots will be identified by mass
spectrometry, though some formulations are
compatible with mass spectrometry at the
expense of promised sensitivity. Use Bio-Safe
Coomassie or fluorescent dyes like Flamingo
or Oriole instead
As an alternative to drying gels, seal them in
zip-top plastic bags in either water or, for long-term
storage, water with 0.005% sodium azide. Fill the
bag with water, insert the gel, expel the water,
and seal the bag
Total Protein Staining
For more detailed instructions, refer to the
respective instruction manuals.
Bio-Safe Coomassie Stain
Instruction manual: bulletin 4307051.
Protocol
1
2
3
Fig. 11.1. 2-D gel stained with Bio-Safe Coomassie stain.
Wash gels three times for 5 min each
in distilled or deionized H
O.
2
Remove water from staining container
and add Bio-Safe Coomassie stain to
completely cover the gel. Agitate for
at least 1 hr.
Rinse in distilled or deionized H
at least 30 min. Stained gels can be
stored in water.
O for
2
Flamingo Fluorescent Gel Stain
Instruction manual: bulletin 10003321. Refer to
Table 11.1 for solution volumes.
Protocol
1
2
3
4
Table 11.1. Flamingo fluorescent gel stain.
Volume of fixing Volume of staining
Gel size solution per gel solution per gel
Mini (8.6 × 6.8 cm) 100 ml 50 ml
Midi (13.3 × 8.7 cm) 200 ml 100 ml
Large 500 ml 250 ml
(16 × 16 cm or 16 × 20 cm)
Larger (25.6 × 23 cm) 1,000 ml 500 ml
Fig. 11.2. 2-D gel stained with Flamingo stain.
Place gel in a staining tray with fixing
solution (40% ethanol, 10% acetic acid).
Cover the tray and agitate gently for
at least 2 hr.
Pour off the fixing solution and add
1× stain solution (dilute 1 part Flamingo
fluorescent gel stain with 9 parts
deionized or distilled H
O). Cover the
2
tray and agitate gently. Stain for at
least 3 hr.
Optional background reduction:
Carefully pour off the stain solution
and replace with an equal volume of
0.1% (w/v) Tween 20. Cover the tray and
agitate gently for 10 min.
Rinse gel with deionized or distilled
H
O prior to imaging.
2
102 103
Page 54

2-D Electrophoresis Guide MethodsChapter 11: Protein Detection
Total Protein Staining (con td.)
Oriole Fluorescent Gel Stain
Instruction manual: bulletin 10017295. Refer to
Table 11.2 for solution volumes.
Protocol
1
Note: Do not fix or wash gel prior to staining. This will
make staining less sensitive.
2
3
Table 11.2. Oriole fluorescent gel stain.
Gel size Volume of staining solution per gel
Mini (8.6 × 6.8 cm) 50 ml
Midi (13.3 × 8.7 cm) 100 ml
Large (16 × 16 cm or 16 × 20 cm) 250 ml
Larger (25.6 × 23 cm) 500 ml
Fig. 11.3. 2-D gel stained with Oriole stain.
If using the 5 L configuration, prepare
the Oriole stain solution by adding
400 ml of methanol to the 1 L bottle
of diluent. Then add 10 ml of Oriole
fluorescent gel stain concentrate
and mix well by shaking.
Place gel in a staining tray with Oriole
fluorescent gel stain. Cover the tray and
agitate for ~1.5 hr. For best results, do
not leave gel in stain for more than 2 hr.
Rinse the gel in deionized distilled
H
O prior to imaging. Destaining is
2
not necessary.
SYPRO Ruby Protein Gel Stain
Instruction manual: bulletin 4006173. Refer to
Table 11.3 for solution volumes.
Protocol
1
2
3
4
Table 11.3. SYPRO Ruby fluorescent gel st ain.
Gel size Volume of staining solution per gel
8 × 108 cm 50 ml
16 × 20 cm 330 ml
20 × 20 cm 50 0 ml
Fig. 11.4. 2-D gel stained with SYPRO Ruby stain.
Wash the gel in one of the following
gel fixing solutions for 30 min:
10% methanol, 7% acetic acid
25% ethanol, 12.5% trichloroacetic acid
10% ethanol, 7% acetic acid
50% ethanol, 3% acetic acid
40% ethanol, 10% acetic acid
Remove the wash solution and cover
the gel with SYPRO Ruby protein gel
stain. In general, use ~10 times the
volume of the gel. Using too little
stain will reduce sensitivity.
Stain the gel with continuous gentle
agitation for at least 3 hr for best
sensitivity. Specific staining can be
seen in 30–90 min. For convenience,
gels can be left in the stain solution
overnight (16–18 hr).
Rinse the gel in 10% methanol
(or ethanol), 7% acetic acid for
30–60 min to decrease background
fluorescence. Rinse the gel in water
before imaging.
Silver Stain Plus™ Kit
Instruction manual: bulletin LIT-442. Refer to
Table 11.4 for solution volumes and incubation times.
Components:
Fixative enhancer concentrate
Silver complex solution
Reduction moderator solution
Image development reagent
Development accelerator reagent
Empty 1L bottle for development accelerator reagent
Protocol
1
2
3
4
5
Prepare the development accelerator
reagent solution. Add the entire
contents (50 g) of development
accelerator reagent to deionized
distilled H
O and bring volume up to 1 L.
2
Store at 4°C and use within 3 months.
Fixative step. Make fixative enhancer
solution by mixing 50% (v/v) reagentgrade methanol, 10% (v/v) reagent-grade
acetic acid, 10% (v/v) fixative enhancer
concentrate, and 30% (v/v) deionized
distilled H
O. After gel electrophoresis,
2
place gels in the fixative enhancer
solution with gentle agitation.
Water wash steps. Decant the fixative
enhancer solution from the staining
vessel. Rinse gels in deionized or
distilled H
O with gentle agitation.
2
Decant water and replace with fresh
rinse water and rinse. Decant rinse water.
Staining step. To prepare staining
solution, add 35 ml of deionized or
distilled H
O to a beaker or flask with
2
a Teflon-coated stir bar. Add in the
following order: 5.0 ml of silver complex
solution, 5.0 ml of reduction moderator
solution, and 5.0 ml of image
development reagent. Immediately
before use, quickly add 50 ml of
development accelerator solution.
Stir well. Stain gels with gentle agitation.
Stop step. After the desired staining
is reached, place the gels in 5% acetic
acid solution to stop the staining
reaction. After stopping the reaction,
rinse the gels in high purity water for
5 min. Then the gels are ready to be
dried or photographed.
Table 11.4. Silver Stain Plus.
Gel Thickness
0.75 –1. 0 m m
Step Time Mini Gel Large G el
Fixative* 20 min 400 ml 800 ml
Water washes 10 min 400 ml 800 ml
Stain** 20 min 100 ml 300 ml
Stop 15 min 400 ml 400 ml
Gel Thickness
1.5 –3. 0 m m
Step Time Mini Gel Large G el
Fixative* 30 min 400 ml 800 ml
Water washes 20 min 400 ml 800 ml
Stain** 20 min 100 ml 300 ml
Stop 15 min 400 ml 400 ml
* Gels may be lef t in this solution indefinitely prior to staining;
therefore, it is not ne cessary to carry out the entire procedure
directly following electrophoresis.
** Stain until the desired intensity is reached. It may take at least
15 min before the first bands or spots become visible. Staining time
is dependent on the sample and quantit y loaded.
Fig. 11.5. 2-D gel st ained with Silver stain.
104 105
Page 55

2-D Electrophoresis Guide Methods
TABLE OF CONTENTS
CHAPTER 12
In-Gel
Trypsin Digestion
106 107
Page 56

2-D Electrophoresis Guide MethodsChapter 12: In-Gel Trypsin Digestion2-D Electrophoresis Guide
Tryptic Digestion Protocol
This protocol for tryptic digestion of gel pieces (plugs)
excised from SDS-PAGE gels is derived from the
protocol described by Speicher et al. (2000). It can
be used in conjunction with any of the non-silver
stains described in this guide.
Reagents and Solutions
Ammonium bicarbonate, NH4HCO
Acetonitrile
Iodoacetamide
HPLC-grade water (for example, Burdick and
Jackson AH365)
Trifluoracetic acid (TFA) (for example,
Thermo Scientific 28904)
Octyl b-D-glucopyranoside (for example,
Sigma Aldrich 08001)
Sequencing-grade modified trypsin, porcine
(for example, Promega V5111)
Destaining buffer (50:50 ACN:0.2 M NH4HCO3)
Dissolve 158 mg of NH4HCO3 in 5 ml HPLC-grade
water and add 5 ml acetonitrile.
50 mM NH4HCO3
Dissolve 79 mg of NH4HCO3 in 20 ml of water.
Reducing solution
Dissolve 555 mg of DTT in 3 ml of 50 mM NH4HCO3.
Alkylating solution
Dissolve 54 mg of iodoacetamide in 3 ml of 50 mM
NH
HCO3.
4
Trypsin solution (20 μg/ml)
Dissolve 20 μg of trypsin in 1 ml of 50 mM NH4HCO3.
Extraction solvent
Combine 950 µl of 1% TFA with 50 µl of 1% octyl
D-glucopyranoside.
3
Destaining Gel Plugs from Silver-Stained
Gels (Pre-Treatment)
Gels that have been stained with a mass
spectrometry–compatible silver stain benefit
from an additional treatment to remove silver
metal by oxidation.
All materials used should be ACS reagent grade
or better.
Solution A (30 mM potassium ferricyanide)
To prepare 50 ml, dissolve 494 mg of potassium
ferricyanide [K
may be stored indefinitely at room temperature.
Solution B (100 mM sodium thiosulfate)
To prepare 50 ml, dissolve 791 mg of anhydrous sodium
thiosulfate [Na
be stored for one year in a sealed bottle.
Protocol
Prepare the silver destain solution just prior to use.
It is good for only one use. Discard any excess.
1
2
3
4
5
Fe(CN)6] in 50 ml of water. This solution
3
] in 50 ml of water. This solution may
2S2O3
Mix Solutions A and B in a 1:1 ratio.
This is the silver destain solution.
Place each gel plug in a 0.5 ml or
1.5 ml plastic tube.
Add 50 µl of silver destain solution.
Incubate 20 min at room temperature.
Using a laboratory pipet, remove the
silver destain solution and add 50 µl
of fresh solution.
Repeat steps 2 and 3 for a total
of three treatments. Following the
last incubation, remove the silver
destain solution.
General Destaining Protocol
1
Add 100 μl of destaining buffer to
the gel plug and incubate for 30 min.
Remove and discard the solution.
Repeat step 1 two more times.
2
3
Reduction and Alkylation Protocol
This step is not necessary for 2-D gel plugs if they
have already been reduced and alkylated during the
sample preparation or equilibration steps.
1
2
3
4
Add 400 μl of destaining buffer to
the gel plug and incubate overnight
at room temperature.
Remove destaining buffer and
dehydrate the gel by adding 50 μl
of acetonitrile. Incubate 10 min
at room temperature and remove
excess solution (for example,
by aspiration).
Dry the gel piece for 30 min in a
laminar flow hood.
Add 100 μl of reducing solution to the
gel plug and incubate 30 min at room
temperature. Remove excess liquid.
Add 100 μl of alkylating solution to
the gel plug and incubate 30 min
at room temperature in the dark.
Remove excess liquid.
Digestion Protocol
1
2
3
4
Add 50 μl of acetonitrile to the gel
plug and incubate for 10 min at room
temperature. Remove excess liquid
and proceed to digestion.
To the dried gel plug, add a volume
of trypsin solution equivalent to the
volume of the original hydrated plug
(1.5 mm plug = 3.4 μl).
Incubate at room temperature for
10 min (center of gel will change from
opaque to clear). If gel plugs aren’t
swollen, add a few more μl of trypsin
solution and incubate for an additional
10 min.
Add enough 50 mM NH
to cover the gel plug (~10 μl).
Incubate at 37°C for at least 3 hr.
5
Extraction Protocol
1
2
Remove trypsin solution from the
gel plug, and store it in another vial.
To the gel plug, add 2–8 µl of extraction
solvent. For MALDI-MS analysis,
keep this volume as small as possible
(2–3 µl). For LC-MS analysis, add 8 µl.
Incubate 30 min at room temperature.
3
4
Combine extraction solvent with
trypsin solution.
HCO3
4
6
Proceed with the procedure
described below.
108 109
Page 57

2-D Electrophoresis Guide Troubleshooting
2-D Electrophoresis Guide
TABLE OF CONTENTS
PART III
Troubleshooting
110 111
Page 58

2-D Electrophoresis Guide Troubleshooting
Isoelectric Focusing
Problem Cause Solution
Initial low or zero current Poor contact between IPG strips Make sure that the gel side of the IPG strip
and electrodes is in contact with the electrode
For the gel-side down configuration with
®
the PROTEAN
i12™ cell, use the IPG
strip retainers
Incomplete wetting of Wet the electrode wicks with distilled or
electrode wicks deionized H
O until they are damp, but not
2
soaking wet
Incomplete IPG strip rehydration Check the rehydration volumes and times
for the lengths of IPG strips used
No current in any lane No contact between the Make sure that:
electrode assembly and
The electrode assembly is properly
IPG strips seated in the focusing tray
The IPG strips are positioned correctly,
(for example, that the gel is in direct
contact with the electrode)
No contact between the Make sure that:
electrode assembly
The gold contact pin of the negative (–)
and instrument assembly is in direct contact with the
cathode bar on the instrument
The positive (+) assembly is completely
inserted into the anode of the instrument
Voltage does not High levels of ionic contaminants Keep salt concentrations under 40 mM;
increase beyond initial in sample solution (optimum salt if necessary, desalt the sample
™
low voltage steps concentration is ~10 mM, though (for example with Micro Bio-Spin
up to 40 mM can be tolerated) columns or the ReadyPrep
™
6
2-D cleanup kit)
Salt collects in electrode wicks, so
replace electrode wicks from time to time
(every 2 hr) during the initial low-voltage
steps. Several hours may be needed for
ionic contaminants to leave IPG strips
Voltage does not reach Programmed voltage is too Lower the voltage maximum set for the
programmed value, high for the pH range and focusing step; the conductivity and the
or maximum voltage is length of IPG strip length and type of IPG strip determine the
reached very slowly. voltage maximum that can be reached
Note: good focusing
may be obtained even
if programmed voltage
is never reached
Ampholyte concentration is Lower the ampholyte concentration
too high. Up to 1% (v/v)
®
Bio-Lyte
ampholytes may
be used, but ampholytes
increase conductivity;
therefore, voltage will be lower
with increasing concentrations
Isoelectric Focusing (con td.)
Problem Cause Solution
Excess sample during rehydration Use correct rehydration volumes for
did not enter gel, or IPG gels are the lengths of the IPG strips used
overswelled with excess sample
Voltage is too high for the IPG Program Vh for the IEF step to ensure
strip size and pH gradient complete focusing of the sample
Large fluctuations in IPG strips contain poorly Check rehydration volumes and times
voltage and current rehydrated regions, or IPG strips
have dried out during the run Make sure that the rehydration solution is
evenly distributed during rehydration and
that the IPG strips are completely covered
with mineral oil
Burning of strips Current limit is too high Use a current limit of 50 µA/IPG strip
IPG strips have dried out Make sure that the IPG strips are covered
with mineral oil or equivalent
Electrode wicks are too wet or Wet the electrode wicks with distilled
contain incorrect electrode solution or deionized H
O until they are damp,
2
not soaking wet
Incorrect rehydration Check the composition of the
solution composition rehydration solution
Sample is leaking from Cup positioning is incorrect When positioning the cup holder, make
the sample cups sure that it clicks into place at the edges
of the focusing tray
The cup is positioned in an Make sure that the IPG strips are
area of the IPG strip that is rehydrated evenly and thoroughly
not completely rehydrated
The cup is malfunctioning Replace cup
SDS-PAGE
Problem Cause Solution
Low or zero current, With a precast gel, the tape Remove the tape
and samples do not at the bottom of the gel cassette
migrate into the gel was not removed
Insufficient buffer in the inner Fill the inner and outer buffer chambers
or outer buffer chamber to ensure that the IPG well is
completely covered
Electrical disconnection Check the electrodes and connections
Running time slower or Incorrect running buffer Check the buffer composition and type
faster than expected concentration or type
Leaking from inner Incomplete gasket seal Wet the gasket with running buffer
buffer chamber before use
Improper assembly of the gel
Ensure that the top edge of the short
into the electrode/ companion plate fits under the notch at the top
assembly of the gasket
Ensure that the top of the short plate
touches the green gasket
112 113
Page 59

2-D Electrophoresis Guide Troubleshooting
Total Protein Staining
Problem Cause Solution
Spots not visible (see 2-D No protein in the gel Use another staining method to confirm
Gel Evaluation, below) that there is protein in the gel
Malfunctioning imaging Check the instrument manual for
system or incorrect troubleshooting information, or contact
imaging parameters the imaging instrument manufacturer
Poor staining Insufficient protein in the gel Repeat the experiment with a
load sensitivity higher protein quantity
Dirty staining trays (for example, Clean the staining trays and other
with silver staining) equipment thoroughly with laboratory
glassware cleaner
Insufficient stain volume Follow the recommendations for stain
volume appropriate to the gel size
Insufficient staining time Increase staining time
Reuse of staining solution To ensure quantitative reproducibility
of a 2-D experiment, never reuse
staining solution
High or uneven Dir ty equipment or staining trays Clean the staining trays and other equipment
background staining thoroughly with laboratory glassware cleaner
Too much time in staining solution Restrict the time in staining solution
as recommended
Wash the gel in water or respective
destaining solution for >30 min
Reagent impurities Make sure that the water and reagents
used for staining are of the highest
possible quality
Total Protein Staining (contd.)
Problem Cause Solution
Speckles or blotches in Particulate material from reagents, Clean the staining trays and other
the gel image staining tray, dust, or gloves equipment thoroughly with laboratory
glassware cleaner
Limit exposure of gels and staining
solution to open air
Use dust-free gloves, and handle gels
only by the edges
Uneven staining Insufficient shaking during staining Agitate the gel during staining
Gel shrinkage Some gel shrinkage occurs Transfer the gel to water
during staining
2-D Gel Evaluation*
Problem Cause Solution
No Spots or Fewer Spots
than Expected
Across the gel Insufficient sample was loaded Check the sample concentration by
protein assay
Check that the protein assay is functioning
properly and that it is not responding to
interfering substances in your sample
Insufficient sample entered Start IEF at a low field strength
the IPG strip
Make sure that the IPG strips are in the
correct orientation in the focusing tray
Diffuse, uneven Insufficient washing Perform more washing steps. Use purified
background in laboratory water and clean staining trays
silver-stained gel
Do not place too many gels in one tray.
Fully immerse the gels in the staining
solution; they should not stick to the
staining tray
Insufficient fixative (some uneven Apply a longer fixing procedure
background stain is normal when
using a silver stain. Due to migration
of different chemicals and ions
into the gels, some regions can
be stained with different colors
or intensities)
Contaminant(s) in the agarose Prepare fresh overlay solution
overlay solution
Check that the orientation of
electrical connections
Increase the solubility strength of the
2-D sample solution; insoluble proteins
will not enter the IPG strip
Failure of detection reagents Run a lane of unstained standards adjacent
to the second-dimension separation. If the
standards are not detected, check the
expiration dates and the formulations of
all detection reagents
Staining method not See Chapter 3 for sample loading
sensitive enough recommendations dependent on the
staining technique used
Poor protein transfer from Perform the first stage of SDS-PAGE at
IPG strip to SDS-gel low voltage (50 V) for >20 min until the
bromophenol blue front enters the
separation gel (time depends on gel size)
* Also refe r to Berkelman et al. (2004) and Bio-Rad Laboratories (2005).
114 115
Page 60

2-D Electrophoresis Guide Troubleshooting
2-D Gel Evaluation (co ntd .)
Problem Cause Solution
No Spots or Fewer Spots
than Expected
In high molecular Sample may have undergone Include appropriate protease inhibitors
weight regions proteolysis prior to IEF and keep the sample on ice or in a cold
room during sample preparation
Insufficient equilibration Incubate IPG strips in sufficient volumes
of each equilibration buffer for up to
15 min with mild agitation
Poor entry of high molecular Use active sample loading in the focusing
weight proteins during rehydration tray or cup loading
(the pore size of the acrylamide in
the IPG strip is very small during
the early stages of rehydration)
Poor entry of high molecular Increase equilibration time (2 × 15 min)
weight proteins into the
second-dimension gel
Horizontal Streaking
Across the entire gel Protein overloading Use less sample
Horizontal Streaking (contd.)
Problem Cause Solution
Across the entire gel DNA contamination Treat the sample with a nuclease
Make sure that the nuclease is active and
that digestion is adequate; a very viscous
sample implies that nuclease treatment
has failed
Incomplete focusing Optimize the sample focusing time by
or overfocusing running a time course. For example,
run the sample on 6 IPG strips and
remove an IPG strip at each time point
(20 kV-hr, 30 kV-hr, 40 kV-hr, etc.)
Incomplete IPG strip rehydration Check the rehydration volumes and times
for the lengths of IPG strips used
Partial Incomplete IPG strip rehydration Check the rehydration volumes and
times for the lengths of IPG strips used
If the sample appears unevenly distributed,
or if areas of the IPG strip are not wetted
with sample, slide the IPG strip back and
forth several times along the length of the
channel in the focusing tray
Perform prefractionation to enrich the
protein of interest and lower the amounts
of other abundant proteins
Use a longer IPG strip and larger gel size
to allow for a greater protein load
Proteins are not properly and Solubilize proteins completely using a
stably solubilized strong chaotropic extraction reagent.
The concentrations of urea, thiourea,
detergents, carrier ampholytes, and DTT
are also critical. Every sample type typically
requires a new sample preparation method
Allow sufficient time for full denaturation
and solubilization; for example, incubate
the sample in the solubilization solution at
room temperature for 1 hr before applying
it to the IPG strip
Regional Protein overloading Use less sample
Perform prefractionation to enrich the
protein of interest and lower the relative
amounts of other abundant proteins
Use a longer IPG strip and larger gel size
to allow for a greater protein load
In the basic range Depletion of DTT in the basic Treat the sample with the ReadyPrep
of the gel range of the IPG strip reduction-alkylation kit prior to IEF
116 117
Page 61

2-D Electrophoresis Guide Troubleshooting
Horizontal Streaking (contd.)
Problem Cause Solution
Spots Incomplete IEF Optimize the sample focusing time by
running a time course. For example,
run the sample on 6 IPG strips and
remove an IPG strip at each time point
(20 kV-hr, 30 kV-hr, 40 kV-hr, etc.)
Intermittent Contaminants such as salts, Use appropriate contaminant removal
ionic detergents (for example, techniques, such as treatment with
SDS), peptides, nucleic acids, the ReadyPrep 2-D cleanup kit
lipids, polysaccharides,
phenolic compounds
Vertical Streaking (contd.)
Problem Cause Solution
At one end of the gel Protein aggregation or Dilute the sample to 3–5 µg/µl for
(cup loading) precipitation caused by cup loading
too much protein or sample
loading problems Perform a protein assay prior to IEF to
ensure correct protein load. The total
amount of protein that should be loaded
onto an IPG strip depends on the length
of the strip and the stain that will be used
to visualize the results
Load the sample using in-gel sample loading
Prolong the time on the initial low-voltage
steps and increase the voltage gradually
Field strength used for sample Reduce the field strength to ~10 V/cm
loading is too high IPG strip length
Poor protein solubility Increase the solubilizing strength of
2-D sample solution
Isolated streaking Improper rehydration of IPG strip Check the rehydration volumes and times
for the lengths of IPG strips used
If the sample appears unevenly distributed,
or if areas of the IPG strip are not wetted
with sample, slide the IPG strip back and
forth several times along the length of the
channel in the focusing tray
Vertical Streaking
Across the entire gel Leaking of the upper buffer Prior to inserting the gel(s) into the vertical
reservoir (cathode) of the vertical electrophoresis cell, wet the gaskets of the
electrophoresis unit electrophoresis chamber with water or
use a small amount of vacuum grease
Incomplete equilibration Increase equilibration time to 15 min
Old DTT and iodoacetamide Use fresh reagents for the equilibration step
preparations used in equilibration
Point streaking Dust or other particles in the Filter gel solutions through a 0.45 μm
(handcast gels) gel solutions membrane and into a dust-free container
Vertical streaks Insufficient binding of SDS Check the SDS concentration (>1%) in the
connected to a spot to protein equilibration solution
Increase equilibration time:
equilibrate IPG strips for 2 × 15 min
Incorrect pH in resolving gel buffer; Ensure that the pH of the Tris buffer used
incorrect pH decreases mobility for gel casting is 8.8
of protein-SDS complexes and
causes vertical streaks
Buffer leakage Ensure that the upper buffer reservoir
is not leaking
118 119
Page 62

2-D Electrophoresis Guide Troubleshooting
Vertical Streaking (contd.)
Problem Cause Solution
Twin vertical spots Improper placement of the IPG Make sure that the focused IPG strip is
or vertical doublets strip onto the gel in full contact with the gel
Temperature gradient in the gel Lower the power settings for the second-
dimension SDS-PAGE run, especially when
using cells that provide only one-sided
cooling of the gel
Use a better circulation system to improve
heat dissipation during a run
Blank vertical stripes Air bubble trapped in the agarose Ensure that the 2-D gel has a straight,
that joins the IPG strip to the top level top edge and that the IPG strip is
of the gel in direct contact with the 2-D gel along its
entire length. Squeeze out air bubbles
by pressing on the plastic backing of
the IPG strip
Use a 0.5% agarose overlay solution to
prevent the IPG strip from coming loose
or moving. To minimize the number of
bubbles in the overlay, melt the agarose
overlay solution completely prior to loading
Vertical Streaking (contd.)
Problem Cause Solution
Blank stripes near pH 7 Excessive DTT (>50 mM) in the Lower the amount of DTT in the
IPG sample solution rehydration solution
Blank stripes at the Salt buildup Remove ionic contaminants from the
electrodes, especially samples with Bio-Rad´s ReadyPrep 2-D
at the cathode cleanup kit or by desalting
Blank vertical regions Interfering substances; impurities Remove contaminants from the samples
in the rehydration/sample solution with the ReadyPrep 2-D cleanup kit or
by desalting
Use high-quality reagents and chemicals
for electrophoresis to minimize the risk
of impurities. Replace chemicals of
questionable or unknown shelf life, origin,
or quality, as these products can also
contribute to poor 2-D results
Air bubble trapped in the agarose Ensure that the 2-D gel has a straight,
that joins the IPG strip to the top level top edge and that the IPG strip is
of the gel in direct contact with the 2-D gel along
its entire length. Squeeze out air bubbles
by pressing on the plastic backing of
the IPG strip
Use a 0.5% agarose overlay solution to
prevent the IPG strip from coming loose or
moving. To minimize the number of bubbles
in the overlay, melt the agarose overlay
solution completely prior to loading
Insufficient rehydration of a region Make sure that the IPG strip is not sticking
of the IPG strip, or tears resulting to the bottom of the rehydration tray
from improper handling, resulting
in the absence of focused protein Check the integrity of rehydrated IPG
in that region strips prior IEF
Focusing of an amphoteric Apply sample cleanup
nonprotein contaminant
(for example, phospholipid or
HEPES) prevents protein focusing
around the pI of the contaminant
120 121
Page 63

2-D Electrophoresis Guide Troubleshooting
Problem Cause Solution
Other Problems
Wavy spots Insufficient overlay solution used Overlay the gel with water-saturated
in gel casting butanol (n-butanol, l-butanol, or t-butanol)
or t-amyl alcohol immediately after gel
casting. These ensure that the gel has a
clean, straight top edge
Use precast gels
Use the overlay recommended by the
manufacturer of the electrophoresis cell
Localized wavy Problems with casting second- Optimize the APS and TEMED
disturbance of spots dimension acrylamide gel: concentrations
not evenly polymerized,
gel cassette leaking, etc. Degas solutions prior to the addition
of APS/TEMED
Perform casting at room temperature,
warming the glass plates if necessary.
Be aware that the polymerization process
is temperature dependent. If the
temperature is too low, polymerization
may be compromised
Use precast gels
Known proteins appearing Protein carbamylation Do not prepare samples too far ahead
as multiple spots or at the of time in urea
wrong position
Do not expose urea-containing samples to
high pH or temperatures that exceed 30°C
Protein oxidation Increase DTT concentration
Protein proteolysis Add protease inhibitors, perform
(during sample preparation) manipulations as quickly as possible,
and keep solutions as cold as possible
For fur ther he lp or adv ice, please contact the Bio-Rad Technical Support department. In the United States, the Technical Support department
is open Monday– Friday, 5:00 AM–5:00 PM, Pacific time.
Phone: 1-800 -424-6723
Fa x: 1-510-741-58 02
Email: LSG_TechServ_US@bio-rad.com (for U.S. and international customers)
Online technical support and worldwide contact information are available at www.consult.bio-rad.com.
122 123
Page 64

2-D Electrophoresis Guide Appendices
2-D Electrophoresis Guide
TABLE OF CONTENTS
PART IV
Appendices
124 125
Page 65

2-D Electrophoresis Guide Appendices
Appendix A
Glossary
%C Cross-linker concentration; weight percentage of cross-linker in a polyacrylamide
gel. Effective pore size of a gel is a biphasic function of %C
%T Monomer concentration (acrylamide + cross-linker) in a gel (in g/100 ml).
Effective pore size of a gel is an inverse function of %T, and gels can be made
with a single, continuous %T throughout the gel (single-percentage gels), or they
can be cast with a gradient of %T through the gel (gradient gels)
2-D electrophoresis Two-dimensional electrophoresis. Proteins are separated first according to
isoelectric point (pI) by isoelectric focusing (IEF) and then according to size by
SDS-PAGE, yielding a two-dimensional protein map of spots
2-Mercaptoethanol Reducing agent used for cleavage of intra- and intermolecular disulfide bonds to
achieve complete protein unfolding and to maintain all proteins in a fully reduced
state. Also known as b-mercaptoethanol or BME
Acrylamide Monomer used with a cross-linker to form the matrix used for separating proteins
or small DNA molecules
Ammonium persulfate Initiator used with TEMED (catalyst) to initiate the polymerization of acrylamide and
(APS) bisacrylamide in making a polyacrylamide gel; (NH
Ampholyte Amphoteric molecule that exists mostly as a zwitterion in a certain pH range.
Ampholytes are used to establish a stable pH gradient for use in isoelectric focusing
Amphoteric Containing both acidic and basic groups
Anode Positively charged electrode. Negatively charged molecules (anions) move towards
the anode, which is usually indicated by the color red
Anionic dye Negatively charged compound used as a stain; used in blotting to stain proteins
immobilized on membranes such as nitrocellulose or PVDF
4)2S2O8
CHAPS Zwitterionic detergent (having both positively and negatively charged groups
with a net charge of zero) that is widely used for protein solubilization for IEF and
2-D electrophoresis; 3-[(3-cholamidopropyl)dimethylammonio]-1-propanesulfonate
Comb Object used to cast wells in an agarose or acrylamide gel. In PAGE applications,
square-bottom combs are inserted into the gel sandwich before polymerization
to form square-bottomed wells
Coomassie (Brilliant) Anionic dye used in the total protein staining of gels and blots and that comes in
Blue two forms: Coomassie (Brilliant) Blue G-250 differs from Coomassie (Brilliant) Blue
R-250 by the addition of two methyl groups
Criterion
blotters, and gels includes the Criterion and Criterion
™
cells, Family of Bio-Rad products used for midi-format vertical electrophoresis;
™
Dodeca™ cells, Criterion blotter, and
Criterion precast gels
Cross-linker Molecule (for example, bis-acrylamide) used to link polymerizing monomer
molecules together to form a netlike structure within the gel. The holes in the nets
are called the pores, and the pore size is determined in part by the cross-linker
concentration. The pores may or may not sieve the macromolecules
Cup loading Application of protein sample onto IPG strips through sample cups applied to the
strips; can improve resolution at extremes of a pH gradient and improve uptake of
basic proteins
™
DC
assay kit Bio-Rad’s detergent-compatible protein assay kit
Depletion Reduction in the amount of high-abundance proteins relative to
low-abundance proteins
Discontinuous Electrophoresis gel system that uses different buffers and sometimes
buffer system different buffer compositions to focus and separate components of a sample.
Discontinuous systems typically focus the proteins into tighter bands than
continuous gel systems, allowing larger protein loads
Antibody Immunoglobulin (Ig); protein produced in response to an antigen, which specifically
binds the portion of the antigen that initiated its production
Assay Analysis of the quantity or characteristics of a substance
Background Nonspecific signal or noise that can interfere with the interpretation of valid signals
Bio-Spin
®
columns Family of Bio-Rad sample preparation products that includes the Bio-Spin® 6 and
Micro Bio-Spin
™
6 columns; used for buffer exchange and desalting applications
Bis or bis-acrylamide A common cross-linker used with acrylamide to form a support matrix;
N,N'-methylene-bis-acrylamide
Blot Immobilization of proteins or other molecules onto a membrane, or a membrane
that has the molecules adsorbed onto its surface
Bromophenol blue Common tracking dye used to monitor the progress of electrophoresis
Carrier ampholytes Heterogeneous mixture of small (300–1,000 Da) polyamino-polycarboxylate
buffering compounds that have closely spaced pI values and high conductivity.
Within an electric field, they align according to pI to establish the pH gradient
Cathode Negatively charged electrode. Positively charged molecules (cations) move toward
the cathode, which is usually indicated by the color black
Chaotropic agent Chemical that disrupts inter- and intramolecular interactions (for example, urea
and thiourea)
Disulfide bond Chemical bond joining two sulfur atoms; commonly found in proteins,
contributing to their secondary and tertiary structures
Dithiotheithol (DTT) Reducing agent used for cleavage of intra- and intermolecular disulfide
bonds to achieve complete protein unfolding and to maintain all proteins in a fully
reduced state
Electrophoresis Movement of charged molecules in a uniform electric field
Equilibration Preparation of protein separated in an IPG strip for second-dimension SDS-PAGE;
reduces and alkylates sulfhydryl groups and saturates proteins with SDS
EXQuest
™
spot cutter Bio-Rad’s brand of spot cutter
Fractionation Separation of a sample into discrete parts for separate analysis; may improve
detection of low-abundance proteins and reduce sample complexity
Glycine Amino acid used as the trailing or slow ion in SDS-PAGE according to Laemmli
(L a e mmli, 1970)
Gradient gel Gel with gradually changing monomer concentration (%T) in the direction of
migration. In SDS-PAGE, gradients are used to separate wider molecular weight
ranges of molecules than can be separated with single-percentage gels
Immobilized pH Strips in which buffering groups are covalently bound to an acrylamide gel
gradient (IPG) strips matrix, resulting in stable pH gradients. This eliminates problems of gradient
instability and poor sample loading capacity associated with carrier
ampholyte–generated pH gradients
126 127
Page 66

2-D Electrophoresis Guide Appendices
Immunoblotting Blot detection by antibody binding
Immunodetection Detection of a molecule by its binding to an antibody
In-gel sample application Sample application to the IPG strip during IPG strip rehydration; may be passive
(In-gel rehydration) or active (in the presence of a low applied voltage)
Ionic strength Measure of the ionic concentration of a solution that affects its resistance
Isoelectric Electrophoresis technique that separates proteins according to their
focusing (IEF) isoelectric point (pI)
Isoelectric point (pI) pH value at which a molecule carries no net electrical charge, or at which the
negative and positive charges are equal
–
Leading ion Ion in a discontinous buffer system with a greater mobility, typically Cl
™
MicroRotofor
cells Family of Bio-Rad sample preparation products, including the MicroRotofor
(chloride ion)
and kits liquid-phase IEF cell and MicroRotofor cell lysis kits
Monomer Unit that makes up a polymer (acrylamide is a monomer that is polymerized
into polyacrylamide)
®
Mini-PROTEAN
and gels includes the Mini-PROTEAN Tetra and Mini-PROTEAN
cells Family of Bio-Rad products used for mini-format vertical electrophoresis;
®
3 Dodeca™ cells
and Mini-PROTEAN precast gels
Molecular weight Mixtures of well-characterized or recombinant proteins used to help monitor
markers separation as well as estimate the size of the proteins separated in a gel
Ohm’s Law Describes the mutual dependence of three electrical parameters
(V, voltage; I, current; R, resistance): V = I × R
PAGE Polyacrylamide gel electrophoresis, a common method of separating proteins
based on molecular weight
™
PDQuest
software Bio-Rad’s 2-D gel analysis software
Polyacrylamide Anticonvective, sieving matrix used in gel electrophoresis. Polyacylamide gels
are cast using mixtures of acrylamide monomers with a cross-linking reagent,
usually N,N'-methylenebisacrylamide (bis), both dissolved in buffer
Polyacrylamide gel Electrophoresis technique that uses polyacrylamide as the separation medium
electrophoresis (PAGE)
™
PowerPac
Family of Bio-Rad power supplies
power supplies
Power supply Instrument that provides the electric power to drive electrophoresis
and electrophoretic blotting experiments
™
Precision Plus Protein
Bio-Rad’s family of recombinant molecular weight markers
standards
®
PROTEAN
cells Family of Bio-Rad products used for large-format vertical electrophoresis
and isoelectric focusing; includes PROTEAN II xi, PROTEAN II XL,
®
Plus Dodeca™ cells, and the PROTEAN® i12™ IEF cell
ProteoMiner
PROTEAN
™
beads, Protein enrichment technology that operates on the principle of dynamic range
reagents, and kits reduction; uses a bead-based library of combinatorial peptide ligands to enrich the
amounts of medium- and low-abundance proteins relative to high-abundance proteins
Prestained standards Mixture of molecular weight marker proteins that have covalently attached dye
molecules, which render the bands visible during electrophoresis and transfer
™
RC DC
ReadyStrip
ReadyPrep
assay kit Bio-Rad’s reductant- and detergent-compatible protein assay kit
™
IPG strips Bio-Rad’s brand of IPG strips
™
kits Bio-Rad’s brand of sample preparation and 2-D electrophoresis kits and reagents
Rf value Relative distance a protein has traveled compared to the distance traveled by
the ion front. The R
value is used to compare proteins in different lanes and
f
even in different gels. It can be used with standards to generate standard curves,
from which the molecular weight or pI of an unknown may be estimated
Running buffer Buffer that provides the ions for the electrical current in an electrophoresis run.
It may also contain denaturing agents. The running buffer provides the trailing ions
in discontinuous electrophoresis
Sample solution Solution in which a sample is prepared or suspended prior to loading onto
an IPG strip
Sodium dodecyl sulfate Separation of molecules by molecular weight in a polyacrylamide gel matrix in
polyacrylamide gel the presence of a denaturing detergent, such as sodium dodecyl sulfate (SDS).
electrophoresis SDS denatures polypeptides and binds to proteins at a constant charge-to-mass-ratio.
(SDS-PAGE) In a sieving polyacrylamide gel, the rate at which the resulting SDS-coated proteins
migrate in the gel is relative only to their size and not their charge or shape
Sodium dodecyl Anionic detergent that denatures proteins and binds to polypeptides in a constant
sulfate (SDS) weight ratio of 1.4 g/g of polypeptide (SDS:polypeptide)
Stain-free technology Protein detection technology involving UV-induced additive that modifies protein
tryptophan residues. Continued exposure to UV light causes fluorescence of the
modified proteins, which are then detected by a CCD imager. Sensitivity of this
technique is generally equal to or better than Coomassie staining
Stained standards Mixture of molecular weight marker proteins that have covalently attached dye
molecules; the bands are visible during electrophoresis and transfer
Standard Collection of molecules with known properties, such as molecular weight,
isoelectric point, or concentration. Often used to create standard curves,
from which the properties of an unknown may be determined
™
TGX
Bio-Rad’s Tris-glycine extended shelf life precast gels
Total protein stain Reagent that binds nonspecifically to proteins; used to detect the entire protein
pattern on a blot or gel
Trailing ion Ion in a discontinous buffer system with a lower mobility, typically glycinate
Tri s Organic component of buffer solutions that has an effective buffering range of
pH 7.0–9.2; tris(hydroxymethyl)aminomethane
Trit o n X-10 0 Nonionic detergent widely used for protein solubilization
(for IEF and 2-D electrophoresis)
Twe en 20 Nonionic detergent; used in blot detection procedures as a blocking reagent
or added to wash buffers to minimize nonspecific binding and background
Unstained standards Mixture of molecular weight marker proteins that do not have covalently attached
dye molecules; the bands are invisible during electrophoresis and transfer,
but are useful for molecular weight determination in stained gels
Urea Chaotrope usually included at rather high concentrations (9.5 M) in sample
solubilization buffers for denaturing IEF and 2-D PAGE
Volt-hour (Vh) Voltage multiplied by time is used as a unit for the duration of an IEF run
Western blotting Immobilization of proteins onto a membrane and subsequent detection by
protein-specific binding and detection reagents
Zwitterion Neutral molecule with positive and negative charges at different locations
128 129
Page 67

2-D Electrophoresis Guide Appendices
Appendix B
References
Ames GF and Nikaido K (1976). Two-dimensional gel electrophoresis
of membrane proteins. Biochemistry 15, 616–623.
Arnold U and Ulbrich-Hofmann R (1999). Quantitative protein
precipitation from guanidine hydrochloride-containing solutions
by sodium deoxycholate/trichloroacetic acid. Anal Biochem 271,
197–199.
Badock V et al. (2001). Prefractionation of protein samples for
proteome analysis using reversed-phase high-performance liquid
chromatography. Electrophoresis 22, 2856–2864.
Bandhakavi S et al. (2009). A dynamic ra nge compression and threedimensional peptide fractionation analysis platform expands proteome
coverage and the diagnostic potential of whole saliva. J Proteome
Res 8, 5590–5600.
Berkelman T et al. (20 04). Tips to prevent streaking on 2-D gels.
Bio-Rad Bulletin 3110.
Berkelman T (2008). Quantitation of protein in samples prepared for
2-D electrophoresis. Methods Mol Biol 424, 43– 49.
Berkelman T et al. (20 09). Comparison of SYPRO Ruby and Flamingo
fluorescent gels stains with respect to compatibilit y with mass
spectrometry. Bio-Rad Bulletin 5754.
Bio-Rad Laboratories, Inc. (2005) 2-D gel electrophoresis
troubleshooting. BioRadiations 116, 29–29.
Bjellqvist B et al. (1982). Isoelectric focusing in immobilized pH
gradients: principle, methodology and some applications.
J Biochem Biophys Methods 6, 317–339.
Bordier C (1981). Phase separation of integral membrane proteins in
Triton x-114 solution. J Biol Chem 256, 1604 –1607.
Bradford MM (1976). A rapid and sensitive method for the quantitation
of microgram quantities of protein utilizing the principle of protein-dye
binding. Anal Biochem 72, 248–254.
Brobey RK and Soong L (2007). Establishing a liquid-phase IEF in
combination with 2-DE for the analysis of Leishmania proteins.
Proteomics 7, 116–120.
Butt A et al. (2001). Chromatographic separations as a prelude
to two-dimensional electrophoresis in proteomics analysis.
Proteomics 1, 42–53.
Carroll K et al. (2000). Two-dimensional electrophoresis reveals
differential protein expression in high- and low-secreting var iants of
the rat basophilic leukaemia cell line. Electrophoresis 21, 2476–2486.
Castagna A et al. (2005). Exploring the hidden human urinary
proteome via ligand library beads. J Proteome Res 4, 1917–1930.
Chan LL et al. (2002). Proteomic study of a model causative agent of
harmful red tide, Prorocentrum triestinum I: Optimization of sample
preparation methodologies for analyzing with two-dimensional
electrophoresis. Proteomics 2, 1169-1186.
Chevallet M et al. (1998). New zwitterionic detergents improve the
analysis of membrane proteins by two-dimensional electrophoresis.
Electrophoresis 19, 1901–1909.
Choe LH and Lee KH (20 00). A comparison of three commercially
available isoelectric focusing units for proteome analysis: the
multiphor, the IPGphor and the PROTEAN IEF cell. Electrophoresis 21,
993–1000.
Cordwell SJ et al. (1997). Characterisation of basic proteins from
Spiroplasma melliferum using novel immobilised pH gradients.
Electrophoresis 18, 1393–1398.
Corthals GL et al. (2000). The dynamic range of protein expression:
a challenge for proteomic research. Electrophoresis 21, 1104–1115.
D’Ambrosio C et al. (20 08). Exploring the chicken egg white proteome
with combinatorial peptide ligand libraries. J Proteome Res 7,
3461–3474.
Damer val C et al. (1986). Technical improvements in two-dimensional
electrophore sis increase the level of genetic variation detected in
wheat-seedling proteins. Electrophoresis 7, 52–54.
Davidsson P et al. (2002). Identification of proteins in human
cerebrospinal fluid using liquid-phase isoelectric focusing as a
prefractionation step followed by two-dimensional gel electrophoresis
and matrix-assisted laser desorption/ionisation mass spectrometry.
Rapid Commun Mass Spectrom 16, 2083–2088.
Drews O et al. (20 04). Setting up standards and a reference map for
the alkaline proteome of the gram-positive bacterium Lactococcus
lactis. Proteomics 4, 1293–1304.
Eubel H et al. (2008). Novel proteins, putative membrane transporters,
and an integrated metabolic network are revealed by quantitative
proteomic analysis of Arabidopsis cell culture peroxisomes. Plant
Phys iol 148, 18 09–182 9.
Fernandez-Patron C et al. (1992). Reverse staining of sodium dodecyl
sulfate polyacr ylamide gels by imidazole-zinc salts: sensitive detection
of unmodified proteins. Biotechniques 12, 564–573.
Fialka I et al. (1997). Subcellular fractionation of polarized epithelial
cells and identification of organelle-specific proteins by twodimensional gel electrophoresis. Electrophoresis 18, 2582–2590.
Fountoulakis M and Juranville JF (2003). Enrichment of lowabundance brain proteins by preparative electrophoresis.
Anal Biochem 313, 267–282.
™
Fountoulakis M et al. (2004). Fractionation of liver proteins by
preparative electrophoresis. Amino Acids 26, 27–36.
Fountoulakis M et al. (1997). Two-dimensional map of Haemophilus
influenzae following protein enrichment by heparin chromatography.
Electrophoresis 18, 1193–1202.
Fujiki Y et al. (1982). Isolation of intracellular membranes by means of
sodium carbonate treatment: application to endoplasmic reticulum.
J Cell Biol 93, 97–102.
Goldberg S (2008). Mechanical/physical methods of cell disruption
and tissue homogenization. Methods Mol Biol 424, 3–22.
Görg A et al. (20 00). The current state of two-dimensional
electrophoresis with immobilized pH gradients. Electrophoresis 21,
1037–10 53 .
Görg A et al. (1988). The current state of two-dimensional
electrophoresis with immobilized pH gradients. Electrophoresis 9,
531–546.
Görg A et al. (20 04). Current two-dimensional e lectrophoresis
technology for proteomics. Proteomics 4, 3665–3685.
Gottlieb M and Chavko M (1987). Silver staining of native and
denatured eucaryotic DNA in agarose gels. Anal Biochem 165, 33– 37.
Guerrier L et al. (20 07). Exploring the platelet proteome via
combinatorial, hexapeptide ligand libraries. J Proteome Res 6,
4290 –4 303.
Guerrier L et al. (20 06). Reducing protein concentration range of
biological samples using solid-phase ligand libraries.
J Chromatogr B Analyt Technol Biomed Life Sci 833, 33–40.
Hansson SF et al. (2004). Validation of a prefractionation method
followed by two-dimensional electrophoresis — applied to
cerebrospinal fluid proteins from frontotemporal dementia patients.
Proteome Sci 2, 7.
Harder A et al. (1999). Comparison of yeast cell protein solubilization
procedures for two-dimensional electrophoresis.
Electrophoresis 20, 826–829.
Herbert B et al. (2001). Reduction and alk ylation of proteins in
preparation of two-dimensional map analysis: why, when, and how?
Electrophoresis 22, 2046–2057.
Herbert BR et al. (1998). Improved protein solubilit y in two-dimensional
electrophoresis using tributyl phosphine as reducing agent.
Electrophoresis 19, 845–851.
Hoving S et al. (2002). Preparative two-dimensional gel
electrophore sis at alkaline pH using narrow range immobilized pH
gradients. Proteomics 2, 127–134.
Huber L A et al. (2003). Organelle proteomics: implications for
subcellular fractionation in proteomics. Circ Res 92, 962–968.
Hurkman WJ and Tanaka CK (1986). Solubilization of plant membrane
proteins for analysis by two-dimensional gel electrophoresis.
Plant Physiol 81, 802–806.
Ichibangase T et al. (2009). Limitation of immunoaffinity column for
the removal of abundant proteins from plasma in quantitative plasma
proteomics. Biomed Chromatogr 23, 480–487.
Kawaguchi S and Kuramitsu S (1995). Separation of heat-stable
proteins from Thermus thermophilus hb8 by two-dimensional
electrophoresis. Electrophoresis 16, 1060–1066.
Laemmli UK (1970). Cleavage of structural proteins during the
assembly of the head of bacteriophage T4. Nature 227, 680–685.
Lee C et al. (1987). Copper staining: a five-minute protein stain for
sodium dodecyl sulfate-polyacrylamide gels. Anal Biochem 166,
30 8 – 312 .
Lenstra JA a nd Bloemendal H (1983). Topography of the total protein
population from cultured cells upon fractionation by chemical
extractions. Eur J Biochem 135, 413–423.
Link AJ ed. (1999). 2-D Proteome Analysis Protocols (New Jersey:
Humana Press).
Liu N and Paulus A (200 8). Enriching basic and acidic rat brain
proteins with ion exchange mini spin columns before t wo-dimensional
gel electrophoresis. Methods Mol Biol 424, 157–166.
Lovric J (2011). Introducing Proteomics: From Concepts to Sample
Separation, Mass Spectrometr y and Data Analysis (Oxford: Wiley).
Lowry OH et al. (1951). Protein measurement with the Folin phenol
reagent. J Biol Chem 193, 265–275.
Luche S et al. (2003). Evaluation of nonionic and zwitter ionic
detergents as membrane protein solubilizers in two-dimensional
electrophoresis. Proteomics 3, 249–253.
McCar thy J et al. (2003). Carbamylation of proteins in 2-D
electrophore sis—myth or reality? J Proteome Res 2, 239–242.
McNulty DE and Annan RS (2009). Hydrophilic interaction
chromatography for fractionation and enrichment of the
phosphoproteome. Methods Mol Biol 527, 93–105.
Merril CR et al. (1981). Ultrasensitive stain for proteins in
polyacrylamide gels shows regional variation in cerebrospinal
fluid proteins. Science 211, 1437–1438.
Molloy MP (2000). Two-dimensional electrophoresis of membrane
proteins using immobilized pH gradients. Anal Biochem 280, 1–10.
Molloy MP et al. (2000). Proteomic analysis of the Escherichia coli
outer membrane. Eur J Biochem 267, 2871–2881.
Molloy MP et al. (1998). Extraction of membrane proteins by
differential solubilization for separation using two-dimensional gel
electrophoresis. Electrophoresis 19, 837–844.
Noble JE and Bailey MJ (2009). Quantitation of protein.
Methods Enzymol 463, 73–95.
O’Farrell PH (1975). High resolution two-dimensional electrophoresis
of proteins. J Biol Chem 250, 4007–4021.
Patton WF (2000). A thousand points of light: the application
of fluorescence detection technologies to two-dimensional gel
electrophoresis and proteomics. Electrophoresis 21, 1123–1144.
Perdew GH et al. (1983). The use of a zwitterionic detergent in
two-dimensional gel electrophoresis of trout liver microsomes.
Anal Biochem 135, 453–455.
Pieper R et al. (2003). Multi-compone nt immunoaffinity subtraction
chromatography: an innovative step towards a comprehensive survey
of the human plasma proteome. Proteomics 3, 422–432.
Poetsch A and Wolters D (2008). Bacterial membrane proteomics.
Pr ote o m ics 8 , 410 0 – 412 2.
Posch A ed. (2008). 2D PAGE: Sample Preparation and Fractionation,
Volumes 1 and 2 (Methods in Molecular Biology) (New Jersey:
Humana Press).
Prime TA et al. (2000). A proteomic analysis of organelles from
Arabidopsis thaliana. Electrophoresis 21, 3488–3499.
Qin S et al. (2005). Chromatofocusing fractionation and twodimensional difference gel electrophoresis for low abundance serum
proteins. Proteomics 5, 3183–3192.
Rabilloud T (1996). Solubilization of proteins for electrophoretic
analyses. Electrophoresis 17, 813–829.
Rabilloud T (1999). Solubilization of proteins in 2-D electrophoresis.
An outline. Methods Mol Biol 112, 9–19.
Rabilloud T ed. (2000). Proteome Research: Two Dimensional Gel
Electrophoresis and Identification Tools (Berlin: Springer).
Rabilloud T et al. (1994). Sample application by in-gel rehydration
improves the resolution of two-dimensional electrophoresis with
immobilized pH gradients in the first dimension. Electrophoresis 15,
1552–15 58 .
Rabilloud T et al. (1997). Improvement of the solubilization of proteins
in two-dimensional electrophoresis with immobilized pH gradients.
Electrophoresis 18, 307–316.
Righetti PG (1990). Recent developments in electrophoretic methods.
J Chromatogr 516, 3–22.
Righet ti PG and Giana zza E (1987). Isoelectric focusing in immobilized
pH gradients: theory and newer methodology.
Methods Biochem Anal 32, 215–278.
Roche S et al. (2009). Depletion of one, six, twelve or twent y major
blood proteins before proteomic analysis: the more the better?
J Proteomics 72, 945– 951.
Rosenfeld J et al. (1992). In-gel digestion of proteins for internal
sequence analysis after one- or two-dimensional gel electrophoresis.
Anal Biochem 203, 173–179.
Sanchez JC et al. (1997). Improved and simplified in-gel sample
applic ation using reswelling of dry immobilized pH gradients.
Electrophoresis 18, 324–327.
Santoni V et al. (2000). Membrane proteomics: use of additive
main effects with multiplicative interaction model to classify plasma
membrane proteins according to their solubility and electrophoretic
properties. Electrophoresis 21, 3329–3344.
Sapan CV et al. (1999). Colorimetric protein assay techniques.
Biotechnol Appl Biochem 29 (Pt 2), 99–108.
Sennels L et al. (2007). Proteomic analysis of human blood serum
using pe ptide librar y beads. J Proteome Res 6, 4055 –4062.
Simons K and Ikonen E (1997). Functional rafts in cell membranes.
Nature 387, 569–572.
Sinha P et al. (2001). A new silver staining apparatus and procedure
for matrix-assisted laser desorption/ionization-time of flight analysis
of proteins after two-dimensional electrophoresis. Proteomics 1,
835– 840.
Smith PK et al. (1985). Measurement of protein using bicinchoninic
acid. Anal Biochem 150, 76–85.
Smith SD et al. (2004). Using immobilized metal affinity
chromatography, two-dimensional electrophoresis and mass
spectrometry to identify hepatocellular proteins with copper-binding
abilit y. J Proteome Res 3, 834– 840.
Speicher KD et al. (2000). Systematic analysis of peptide recoveries
from in-gel digestions for protein identifications in proteome studies.
J Biomol Tech 11, 74–86.
Stasyk T et al. (2007). Identification of endosomal epidermal growth
factor receptor signaling targets by functional organelle proteomics.
Mol Cell Proteomics 6, 908 –922.
Tang W et al. (2008). Proteomics studies of brassinosteroid signal
transduction using prefractionation and two-dimensional DIGE.
Mol Cell Proteomics 7, 728–738.
Thulasiraman V et al. (2005). Reduction of the concentration difference
of proteins in biological liquids using a library of combinatorial ligands.
Electrophoresis 26, 3561–3571.
130 131
Page 68

2-D Electrophoresis Guide Appendices
Toth GB and Pavia H (2001). Removal of dissolved brown algal
phlorotannins using insoluble polyvinylpolypyrrolidone (PVPP).
J Chem Ecol 27, 1899–1910.
Tu C et al. (2010). Depletion of abundant plasma proteins and
limitations of plasma proteomics. J Proteome Res 9, 4982–4991.
Van den Bergh G and Arckens L (2008). Reducing sample complexity
by RP-HPLC: beyond the tip of the protein expression iceberg.
Methods Mol Biol 424, 147–156.
Wang W et al. (2008). Optimizing protein extraction from plant tissues
for enhanced proteomics analysis. J Sep Sci 31, 2032–2039.
Weiss W et al. (1992). Application of sequential ex traction procedures
and glycoprotein blotting for the characterization of the 2-D
polypeptide patterns of barley seed proteins. Electrophoresis 13,
770–773.
Wessel D and Flugge UI (1984). A method for the quantitative recover y
of protein in dilute solution in the presence of detergents and lipids.
Anal Biochem 138, 141–143.
Westermeier R and Scheibe B (2008). Difference gel electrophoresis
based on lys/cys tagging. Methods Mol Biol 424, 73–85.
Wilkins MR et al. (1996). Progress with proteome projects: why all
proteins expressed by a genome should be identifie d and how to do it.
Biotechnol Genet Eng Rev 13, 19–50.
Xixi E et al. (2006). Proteomic analysis of the mouse brain
following protein enrichment by preparative electrophoresis.
Electrophoresis 27, 1424–1431.
Yuan X and Desiderio DM (2005). Proteomic s analysis of
prefractionated human lumbar cerebrospinal fluid. Proteomics 5,
541 – 550 .
Zerefos PG et al. (2006). Characterization of the human urine
proteome by preparative electrophoresis in combination with 2-DE.
Proteomics 6, 4346–4355.
Zischka H et al. (2003). Improved proteome analysis of
Saccharomyces cerevisiae mitochondria by free-flow electrophoresis.
Proteomics 3, 906 –916.
Zuo X and Speiche r DW (2000). A method for global analysis of
complex proteomes using sample prefractionation by solution
isoelectrofocusing prior to two-dimensional electrophoresis.
Anal Biochem 284, 266–278.
Related Bio-Rad Literature
Bio-Rad Laboratories, Inc. (2005) 2-D gel electrophoresis
troubleshooting. BioRadiations 116, 29–29.
Bulletin 1069 Colorimetric Protein Assays
Bulletin 2414 The Little Book of Standards
Bulletin 2587 High-Performance 2-D Gel Electrophoresis Using
Narrow pH-Range ReadyStrip IPG Strips
Bulletin 2895 Protein Blotting Guide
Bulletin 2998 Protein Standards Application Guide
Bulletin 3103 Removal of Abundant Myofilament Proteins from Rabbit
Myocardium Using the ReadyPrep Protein Extraction Kit (Membrane I)
Bulletin 3110 Tips to Prevent Streaking on 2-D Gels
Bulletin 3131 The Rotofor System As a Prefractionation Device Used
Prior to Electrophoresis
Bulletin 3133 Molecular Weight Determination by SDS-PAGE
Bulletin 3144 Using Precision Plus Protein Standards to Determine
Molecular Weight
Bulletin 3145 Strategies for Protein Sample Preparation
Bulletin 5241 Important Factors Influencing Protein Solubility for
2-D Electrophoresis
Bulletin 5344 Fractionation by Liquid-Phase Isoelectric Focusing in
the MicroRotofor Cell: Improved Detection of Low-Abundance Proteins
Bulletin 5398 Enriching Basic and Acidic Rodent Brain Proteins with
Ion Exchange Spin Columns for Two-Dimensional Gel Electrophoresis
Bulletin 5754 Compar ison of SYPRO Ruby and Flamingo Fluoresce nt
Gel Stains with Respect to Compatibility with Mass Spectrometry
Bulletin 5782 In-Gel Protein Quantitation Using the Criterion Stain Fre e
Gel Imaging System
Bulletin 5841 Quantitation of Serum and Plasma Proteins after
Enrichment of Low-Abundance Proteins with the ProteoMiner Protein
Enrichment System
Bulletin 5911 Mini-PROTEAN TGX Precast Gel: A Versatile and
Robust L aemmli-Like Precast Gel for SDS-PAGE
Bulletin 5939 Overcoming the Coomassie Blues
Bulletin 6040 A Guide to Polyacrylamide Gel Electrophoresis
and Detection
Bulletin 6138 PROTEAN i12 IEF System: Independent Voltage
and Current Control Enables Optimization of First-Dimension
IEF Conditions
Bulletin 6139 Versatile Se paration Capabilities of the
PROTEAN i12 IEF System
Bulletin 6140 Use of the PROTEAN i12 IEF System for In-Gel
Peptide Fractionation Prior to LC-MS and Comparison with
Off-Gel Fractionation
Bulletin 4006173 Instruction Manual, SYPRO Ruby Protein Stains
Bulletin 4307051 Instruction Manual, Bio-Safe Coomassie Stain
Bulletin 10003321 Instruction Manual, Flamingo Fluorescent Gel Stain
Bulletin 10017295 Instruction Manual, Oriole Fluorescent Gel Stain
Bulletin 10022069 Instruction Manual, PROTE AN i12 IEF System
Bulletin LIT-442 Instruction Manual, Silver-Stain Plus.
Appendix C
Ordering Information
Catalog # Description
Protein Sample Preparat ion Kits and Reagents
Protein Extraction
163- 2141 MicroRotofor
includes 50 ml protein solubilization buffer (PSB),
ReadyPrep
163- 214 2 MicroRotofor Cell Lysis Kit (Plant), 10 preps,
includes 50 ml protein solubilization buffer (PSB),
ReadyPrep 2-D cleanup kit (50 reaction size)
163-2143 MicroRotofor Cell Lysis Kit (Yeast), 15 preps,
includes 50 ml protein solubilization buffer (PSB),
15 ml yeast suspension buffer, 2 × 0.5 ml lyticase
(1.5 U/µ l)
163- 214 4 MicroRotofor Cell Lysis Kit (Bacteria), 15 preps,
includes 50 ml protein solubilization buffer (PSB),
25 ml bacteria suspension buffer, 1 ml lysozyme
(1,5 0 0 U/ µl)
163 -208 6 ReadyPrep
Protein), 20 preps, general purpose protein
preparation kit, includes strong detergent ASB-14
163- 214 6 ReadyPrep Mini Grinders, pkg of 20, 1.5 ml
grinding tube, contains grinding resin and matching
pestle, sufficient for twent y 100 mg extractions
163 -208 3 ReadyPrep 2-D Rehydration/Sample Buffer 1,
10 ml, protein solubilization reagent, includes 7 M
urea, 2 M thiourea, 1% ASB-14, 40 mM Tris, 0.001%
bromophenol blue
163 -210 6 ReadyPrep 2-D Starter Kit Rehydration/Sample
Buffer, 10 ml, protein sample buffer, includes 8
M urea, 2% CHAPS, 50 mM DTT, 0.2% Bio-Lyte
ampholyte, 0.001% bromophenol blue
163- 214 5 Protein Solubilization Buffer (PSB), pkg of 1,
strongly chaotropic protein solubilization buffer,
contains NDSB 201, urea, thiourea, and CHAPS,
makes 50 ml solution
163 -2091 ReadyPrep Proteomics Grade Water, 500 ml
161-0730 Urea, 250 g
161-0 719 Tr is, 1 kg
161-04 60 CHAPS, 1g
161-0611 Dithiothreitol (DTT), 5 g
163 -2101 Tributylphosphine (TBP), 0.6 ml, 200 mM
163 -210 9 Iodoacetamide, 30 g
161-0404 Bromophenol Blue, 10 g
Protein Sample Cleanup
163 -213 0 ReadyPrep 2-D Cleanup Kit, 50 preps
163- 214 0 ReadyPrep 2-D Cleanup Kit, 5 preps
732-6 221 Micro Bio-Spin
in Tris buffe r, 50 collection tubes
732-6 227 Bio-Spin
Tris buffer, 50 collection tubes
732-6 228 Bio-Spin 6 Columns, includes 100 columns in
Tris buffer, 200 collection tubes
163 -209 0 ReadyPrep Reduction-Alkylation Kit, 100 preps
™
Cell Lysis K it (Mammal), 15 preps,
™
mini grinders (2 packs of 10 each)
™
Protein Extraction Kit ( Total
™
6 Columns, includes 25 columns
®
6 Columns, includes 25 columns in
®
Catalog # Description
Protein Fractionation
163 -210 0 ReadyPrep Sequential Extraction Kit, 5–15 preps
163 -208 5 ReadyPrep Protein Extraction Kit
(Soluble/Insoluble), 20 preps
163-2089 ReadyPrep Protein Extraction Kit
(Cytoplasmic/Nuclear), 50 preps
163 -208 8 ReadyPrep Protein Extraction Kit (Membrane I),
50 preps
163 -208 4 ReadyPrep Protein Extraction Kit (Membrane II),
10 preps
163 -2087 ReadyPrep Protein Extraction Kit (Signal),
50 preps
™
73 2 - 6 711 Aurum
CEX Mini Kit, 2 preps
732- 6710 Aurum A EX Mini Kit, 2 preps
™
170-2800 MicroRotofor
Cell Kit, 100/120 V
170 -28 0 1 MicroRotofor Cell Kit, 220/240 V
®
170-2986 Rotofor
Purification System, 100/120 V
170 -298 7 Rotofor Purification System, 220/240 V
170 -292 6 Model 491 Prep Cell, 100/120 V
170-2927 Model 491 Prep Cell, 220/240 V
170 -2908 Mini Prep Cell without Reagent Star ter Kit
Protein Sample Depletion
732-6701 Aurum Serum Protein Mini Kit, 10 preps
™
732-6712 Aurum
163 -3 0 06 ProteoMiner
Affi-Gel® Blue Mini Kit, 2 preps
™
Protein Enrichment Small-
Capacity Kit, 10 preps for 10 mg total protein
163 -3 0 07 ProteoMiner Protein Enrichment Large-
Capacity Kit, 10 preps for 50 mg total protein
Protein Assay Kits and Instruments
500-0001 Bio -Rad Protein Assay Kit I, includes 450 ml dye
reagent concentrate, bovine g-globulin standard;
sufficient for 440 standard assays or 2,200
microplate assays
500-0002 Bio-Rad Protein Assay Kit II, includes 450 ml
dye reagent concentrate, bovine se rum albumin
standard; sufficient for 440 standard assays or
2,200 microplate assays
™
50 0 - 0111 DC
Protein Assay K it I, includes 250 ml alkaline
copper tartrate solution, 2 L dilute Folin reagent,
5 ml surfactant solution, bovine g -globulin standard;
sufficient for 450 standard assays
500-0112 DC Protein Assay Kit II, includes 250 ml alkaline
copper tartrate solution, 2 L dilute Folin reagent, 5 ml
surfactant solution, bovine serum albumin standard;
sufficient for 450 standard assays
™
500-0120 RC D C
Protein Assay Reagents Package,
includes RC reagents package and DC reagents
package, and suf ficient for 450 standard assays
500-0121 RC DC Protein Assay Kit I, includes RC reagents
package, DC reagents package, bovine g-globulin
standard; sufficient for 450 sta ndard assays
500-0122 RC DC Protein Assay Kit II, includes RC reagents
package, DC reagents package, bovine serum
albumin standard; suf ficient for 450 standard assays
™
500-0201 Quick Start
Bradford Protein Assay Kit 1,
includes 1× dye reagent (1 L), bovine serum albumin
standard (5 × 2 mg/ml); sufficient for 200 standard
assays or 4,000 microplate assays
132 133
Page 69

2-D Electrophoresis Guide Appendices
Catalog # DescriptionCatalog # Description Catalog # DescriptionCatalog # Description
®
500-0202 Quick Start Bradford Protein As say Kit 2,
includes 1× dye reagent (1 L), bovine ser um albumin
standard set (2 sets of 7 concentration standards,
0.125 –2.0 mg/ml, 2 ml)
500-0203 Quick Star t Bradford Protein Assay K it 3,
includes 1× dye reagent (1 L), bovine g -globulin
standard (5 × 2 mg/ml)
500-0204 Quick S tar t Bradford Protein Assay K it 4,
includes 1× dye reagent (1 L), bovine g -globulin
standard set (2 sets of 7 concentration standards,
0.125 –2.0 mg/ml, 2 ml)
™
170-2525 SmartSpec
Plus Spectrophotometer
170 -25 0 2 Standard Cuvette, 1–3.5 ml, quartz
™
170 -2511 trUView
Cuvettes, pack of 100, individually
packaged, disposable DNase- and
RNase-free cuvettes
Protein Standards
™
161-0378 Precision Plus Protein
Standard Plugs,
pkg of 24, 1 mm thick aga rose plugs containing
10 Strep-tagged recombinant proteins (10–250 kD),
including three reference bands
161-03 63 Precision Plus Protein Unstained Standards,
100 applications
161-03 9 6 Precision Plus Protein Unstained Standards
Value Pack, 500 applications
161-0373 Precision Plus Protein All Blue Standards,
50 applications
161-03 93 Precision Plus Protein All Blue St andards Value
Pack, 500 applications
16 1- 0374 Precision Plus Protein Dual Color Standards,
50 applications
161-03 94 Precision Plus Protein Dual Color S tandards
Value Pack, 250 applications
™
161-0375 Precision Plus Protein
Kaleidoscope™
Standards, 50 applications
161-03 95 Precision Plus Protein Kaleidoscope Standards
Value Pack, 250 applications
161-0377 Precision Plus Protein Dual Xtra Standards,
50 applications
161-03 97 Precision Plus Protein Dual Xtra Standards
Value Pack, 250 applications
™
161-0385 Precision Plus Protein
WesternC™ Pack,
50 applications
161-03 98 Precision Plus Protein WesternC Standards Pack
Value Pack, 250 applications
161-03 99 Precision Plus Protein WesternC Standards
Value Pack, 250 applications
™
161-03 24 Kaleidoscope
Prestained Standards,
broad range, 500 μl
161-03 25 Kaleidoscope Polypeptide Standards, 500 μl
161-03 0 9 Prestained SDS-PAGE Standards, high range,
500 μl
161-03 0 5 Prestained SDS-PAGE Standards, low range,
500 μl
161-0318 Prestained SDS-PAGE Standards, broad range,
500 μl
161-0303 SDS-PAGE Standards, high range, 200 μl
161-0304 SDS-PAGE Standards, low range, 200 μl
161-0317 SDS-PAGE Standards, broad range, 20 0 μl
™
163 -209 3 ReadyStrip
100× pH 7–10 Buffer, includes only
ampholytes, 1 ml
163 -209 8 ReadyStrip 100× pH 3.9 – 5.1 Buffer, includes only
ampholytes, 1 ml
163 -2097 ReadyStrip 100× pH 4.7–5.9 Buf fer, includes only
ampholytes, 1 ml
163 -209 6 ReadyStrip 100× pH 5.5 – 6.7 Buf fer, includes only
ampholytes, 1 ml
163-2095 ReadyStrip 100× pH 6.3–8.3 Buffer, includes only
ampholytes, 1 ml
Bio-Lyte® Ampholyte
pH Range
3/10 3/5 4/6 6/8 5/7 5/8 7/9 8/10
1 ml 163-2094 — — — — — — —
10 m l 16 3 -1112 1 6 3 -1132 1 6 3 -11 42 16 3 -116 2 163-115 2 16 3-1192 1 6 3 -117 2 1 6 3 -11 8 2
25 ml 163-1113 — 163-1143 163-1163 163-1153 163-1193 — —
IPG Strips and Buffers
ReadyStrip IPG strips, 12 per package.
7 cm 11 cm 17 cm 18 cm 24 cm
pH 3–10 163-2000 163-2014 163-2007 163-2032 163-2042
pH 3–10 NL 163-2002 163-2016 163-2009 163-2033 163-2043
pH 3– 6 163-2003 163-2017 163-2010 163-2035 163-2045
pH 4–7 163-2001 163-2015 163-2008 163-2034 163-2044
pH 5–8 163-2004 163-2018 163-2011 163-2036 163-2046
pH 7–10 163-2005 163-2019 163-2012 163-2037 163-2047
pH 3.9– 5.1 163-2028 163-2024 163-2020 163-2038 163-2048
pH 4.7–5.9 163-2029 163-2025 163-2021 163-2039 163-2049
pH 5.5– 6.7 163-2030 163-2026 163-2022 163-2040 163-2050
pH 6.3– 8.3 163-2031 163-2027 163-2023 163-2041 163-2051
Electrophoresis Instrumentation
®
PROTEAN
i12™ IEF System
164-6000 PROTE AN i12 IEF System, 90 –240 VAC, includes
basic unit, positive and negative electrode
assemblies, 7 cm, 11 cm, and 17 cm focusing trays
with IPG strip retainers, 1 pack each of 7 cm, 11 cm,
and 17 cm rehydration/equilibration trays, 2 pairs of
forceps, 2 packs electrode wicks for gel-side down
and gel-side up applications, mineral oil, 2 cleaning
brushes, cleaning concentrate, 2 USB flash drives,
3 styluses, pH 3 –10 ReadyStrip
™
IPG strips in 7 cm,
11 cm, and 17 cm lengths, rehydration sample
buffer, and instruction manual. 13 cm, 18 cm,
and 24 cm trays and cup loading accessories
can be purchased separately
164-6 0 01 PROTE AN i12 IEF Cell, 90–240 VAC basic
unit includes cell, positive and negative
electrode assemblies
™
164-6107 7 cm i12
Focusing Tray, includes 2 IPG strip retainers
16 4 - 6111 11 cm i12 Focusing Tray, includes 2 IPG strip retainers
16 4 - 6113 13 cm i12 Focusing Tray, includes 2 IPG strip retainers
16 4 - 6117 17 cm i12 Focusing Tray, includes 2 IPG strip retainers
16 4 - 6118 18 cm i12 Focusing Tray, includes 2 IPG strip retainers
164 - 6124 24 cm i12 Focusing Tray, includes 2 IPG strip retainers
165-4035 7 cm i12 Rehydration/Equilibration Tray,
with lids, pkg of 25
165 -4 025 11 cm i12 Rehydration/Equilibration Tray,
with lids, pkg of 25
164-6313 13 cm i12 Rehydration/Equilibration Tray,
with lids, pkg of 25
165 -4015 17 cm i12 Rehydration/Equilibration Tray,
with lids, pkg of 25
165-4041 18 cm i12 Rehydration/Equilibration Tray,
with lids, pkg of 25
165-4043 24 cm i12 Rehydration/Equilibration Tray,
with lids, pkg of 25
164-6 0 40 IPG Strip Retainers, pkg of 2
164-6 020 i12 Sample Cup Holder, pkg of 1, 12-position
sample cup holder, includes 25 disposable
sample cups
164-6 021 i12 Sample Cups, pkg of 25
164-6 0 30 Gel-Side Up Electrode Wicks, pkg of 100
164-6 0 31 Gel-Side Down Electrode Wicks, pkg of 500
164 - 6 012 Negative Electrode Assembly, pkg of 1
16 4 - 6011 Positive Electrode Assembly, pkg of 1
164-6 010 Electrode Assembly Pair, pkg of 1 pair, positive
and one negative electrode assemblies
165-4 072 Cleaning Brushes, pkg of 2
161-0722 Cleaning Concentrate
164-6060 USB Flash Drive, pkg of 2
164-6050 Stylus, pkg of 3
165 -4 070 Forceps, pkg of 1
163 -2129 Mineral Oil
163-2105 ReadyPrep 2-D S tar ter Kit
Mini-PROTEAN
165-8000 Mini-PROTEAN Tetra Cell, 10-well, 0.75 mm
165-8001 Mini-PROTEAN Tetra Cell, 10-well, 1.0 mm
165-8002 Mini-PROTEAN Tetra Cell, 10-well, 0.75 mm
165-8003 Mini-PROTEAN Tetra Cell, 10-well, 1.0 mm
165-8004 Mini-PROTEAN Tetra Cell for Mini Precast G els,
165-8005 Mini-PROTE AN Tetra Cell for Mini Precast Gels,
165-8006 Mini-PROTEAN Tetra Cell, 10-well, 1.5 mm
165-8007 Mini-PROTEAN Tetra Cell, 10-well, 1.5 mm
165-8025 Mini-PROTEAN Tetra Cell and PowerPac
165-8026 Mini-PROTEAN Tetra Cell and PowerPac
165-8027 Mini-PROTEAN Tetra Cell and PowerPac
165-8028 Mini-PROTEAN Tetra Cell and PowerPac
165-8029 Mini-PROTEAN Tetra Cell and Mini Trans-Blot®
165-8030 Mini-PROTEAN Tetra Cell for Ready Gel Precast
165-8033 Mini-PROTEAN Tetra Cell, Mini Trans-Blot
Tetra Cells a nd Systems
thickness; 4-gel system includes 5 combs, 5 sets
of glass plates, 2 casting stands, 4 casting frames,
sample loading guide, electrode assembly,
companion running module, tank, lid with power
cables, mini cell buf fer dam
thickness; 4-gel system includes 5 combs, 5 sets
of glass plates, 2 casting stands, 4 casting frames,
sample loading guide, electrode assembly,
companion running module, tank, lid with power
cables, mini cell buf fer dam
thickness; 2-gel system includes 5 combs, 5 sets of
glass plates, casting stand, 2 casting frames, sample
loading guide, electrode assembly, tank, lid with
power cables, mini cell buffe r dam
thickness; 2-gel system includes 5 combs, 5 sets of
glass plates, casting stand, 2 casting frames, sample
loading guide, electrode assembly, tank, lid with
power cables, mini cell buffe r dam
4-gel system includes electrode assembly, clamping
frame, companion module, tank, lid with power
cables, mini cell buf fer dam
2-gel system includes electrode assembly,
clamping frame, tank, lid with power cables,
mini cell buffer dam
thickness; 4-gel system includes 5 combs, 5 sets
of glass plates, 2 casting stands, 4 casting frames,
sample loading guide, electrode assembly,
companion running module, tank, lid with power
cables, mini cell buf fer dam
thickness; 2-gel system includes 5 combs, 5 sets of
glass plates, casting stand, 2 casting frames, sample
loading guide, electrode asse mbly, tank, lid with
power cables, mini cell buffe r dam
™
Basic
Power Supply, includes 165-8 001 and 164-5050
™
Universal Power Supply, includes 165-8001
and 164-5070
™
HC
Power Supply, includes 165-8 001 and 164-5052
™
HV
Power Supply, includes 165-8 001 and 164-5056
Module, includes 165-8001 and 170-3935
Gels and Mini Trans -Blot Module, includes
165-8004 and 170-3935
Module, and PowerPac Basic Power Supply,
includes 165-8001, 170-3935, and 164-5050
134 135
Page 70

2-D Electrophoresis Guide Appendices
Catalog # DescriptionCatalog # Description Catalog # DescriptionCatalog # Description
Mini-PROTEAN® Tetra Cells a nd Systems ( con td.)
165-8034 Mini-PROTEAN Tetra Cell for Ready Gel Precast
Gels, Mini Trans- Blot Module, and PowerPac
Basic Power Supply, includes 165-8004, 170-3935,
and 164-5050
165-8035 Mini-PROTEAN Tetra Cell, Mini Trans-Blot
Module, and PowerPac HC Power Supply,
includes 165-8001, 170-3935, and 164-5052
165-8036 Mini-PROTEAN Tetra Cell for Ready Gel Precast
Gels, Mini Trans- Blot Module, and PowerPac HC
Power Supply, includes 165-8 004, 170-3935,
and 164-5052
Mini-PROTEAN Dodeca Cells and Systems
165- 410 0 Mini-PROTEAN
®
3 Dodeca™ Cell, includes
electrophoresis tank with built-in cooling coil, lid with
power cables, 6 electrophoresis clamping frames,
2 buffer dams, drain line, 2 gel releasers
165- 410 1 Mini-PROTEAN 3 Dodeca Cell with Multi-Casting
Chamber, same as 165-4100 with multi-casting
chamber, 15 separation sheets, 8 acrylic blocks,
tapered luer connector, stopcock valve
™
Criterion
Cells and Systems
165 -60 01 Criterion Cell, includes buffer tank, lid with power
cables, 3 sample loading guides (12 + 2-well,
18-well, 26-well)
165 -6019 Criterion Cell and PowerPac Basic Power Supply,
100–120/220–240 V, includes 165- 6001 and
164-5050
™
Criterion
Dodeca™ Cells and Systems
165-4130 Criterion Dodeca Cell, includes electrophoresis
buffer tank with built-in cooling coil, lid with
power cables
165- 413 8 Criterion Dodeca Cell and PowerPac HC Power
Supply, includes 165-4130 and 164-5052
165- 413 9 Criterion Dodeca Cell and PowerPac Universal
Power Supply, includes 165-4130 and 164-5070
™
165 - 513 3 Criter ion Dodeca Cell and 6 -Row A nyGel
Stand,
includes 165-4130 and 165-5131
®
PROTEAN
II xi Cells
165-1801 PROTEAN II xi Cell, 16 cm, without spacers
and combs
165-1802 PROTEAN II xi Cell, 16 cm, 1.5 mm spacers (4),
15-well combs (2)
165-1803 PROTEAN II xi Cell, 16 cm, 1.0 mm spacers (4),
15-well combs (2)
165-1804 PROTEAN II xi Cell, 16 cm, 0.75 mm spacers (4),
15-well combs (2)
16 5 -1811 PROTEAN II xi Cell, 20 cm, without spacers
and combs
16 5 -1812 PROTEAN II xi Cell, 20 cm, 1.5 mm spacers (4),
15-well combs (2)
16 5 -1813 PROTEAN II xi Cell, 20 cm, 1.0 mm spacers (4),
15-well combs (2)
16 5 -1814 PROTEAN II xi Cell, 20 cm, 0.75 mm spacers (4),
15-well combs (2)
PROTEAN II XL Cells
165-3188 PROTEAN II XL Cell, wide format 1-D vertical
electrophore sis cell, 1.0 mm, includes PROTEAN II
xi basic unit (#165-1834) and 1.0 mm IPG conversion
kit (#165-3183)
165 -3189 PROTEAN II XL Cell, wide format 1-D vertical
electrophore sis cell, 1.5 mm, includes PROTEAN II
xi basic unit (#165-1834) and 1.5 mm IPG conversion
kit (#165-3186)
165 -3190 PROTEAN II XL Cell, wide format 1-D vertical
electrophore sis cell, 2.0 mm, includes PROTE AN II
xi basic unit (#165-1834) and 2.0 mm IPG conversion
kit (#165-3184)
16 5 -1815 PROTEAN II xi Cell 2-D Conversion Kit,
conver ts PROTEAN II xi cell into a tube gel IEF
2-D system; includes 2 tube gel adaptors, 24
glass tubes (1.5 mm ID, 180 mm length), gaskets,
grommets, stoppers
165-3183 PROTEAN II xi Cell IPG Conversion Kit, 1.0 mm,
18.5 × 20 cm, for conversion to IPG PROTEAN II
XL system; includes IPG clamps, 20 × 20 cm glass
plates (2), IPG spacers, 2-D combs, and central
cooling core gaskets
165 -3186 PROTEAN II xi Cell IPG Conversion Kit, 1.5 mm,
18.5 × 20 cm, for conversion to IPG PROTEAN II
XL system; includes IPG clamps, 20 × 20 cm glass
plates (2), IPG spacers, 2-D combs, and central
cooling core gaskets
165 -3184 PROTEAN II xi Cell IPG Conversion Kit, 2.0 mm,
18.5 × 20 cm, for conversion to IPG PROTEAN II
XL system; includes IPG clamps, 20 × 20 cm glass
plates (2), IPG spacers, 2-D combs, and central
cooling core gaskets
165-1834 PROTEAN II xi Basic Unit With Casting
Stand, vertical electrophoresis system, includes
electrophore sis cell with ce ntral cooling core, gel
casting stand
16 5 -19 51 PROTEAN II xi Multi- Cell, multi-cell electrophoresis
system, includes 3 central cooling cores, buffer
tank, PROTEAN II xi multi-casting chamber
with accessories
16 5 -19 5 6 PROTE AN II xi Multi-Cell 2-D Conversion Kit,
for proper cooling in 2-D electrophoresis
applications; includes 2 cooling coils and manifold
16 5-3176 PROTEAN II XL Multi-Cell, wide format vertical
electrophoresis multi-cell, 1.0 mm, compatible with
ReadyStrip IPG strips; includes catalog #165-1951,
#165-1956, and 3 PROTEAN II xi cell IPG conversion
kits of desired thickness
16 5-317 7 PROTE AN II XL Multi-Cell, wide format ver tical
electrophoresis multi-cell, 1.5 mm, compatible with
ReadyStrip IPG strips; includes catalog #165-1951,
#165-1956, and 3 PROTEAN II xi cell IPG conversion
kits of desired thickness
16 5-3178 PROTEAN II XL Multi-Cell, wide format vertical
electrophoresis multi-cell, 2.0 mm, compatible with
ReadyStrip IPG strips; includes catalog #165-1951,
#165-1956, and 3 PROTEAN II xi cell IPG conversion
kits of desired thickness
®
PROTEAN
Plus Dodeca™ Cells and Systems
165- 415 0 PROTEAN Plus Dodeca Cell, 100/120 V, includes
electrophoresis buffer tank with built-in ceramic
cooling core, lid, buffer recirculation pump with
tubing, 2 gel releasers
165- 414 0 PROTEAN Plus Dodeca Cell (100/120 V) and
PowerPac HC Power Supply, includes 165-4150
and 164-5052
165- 414 2 PROTEAN Plus Dodeca Cell (100/120 V) and
PowerPac Universal Power Supply, includes
165 -415 0 a nd 164- 5070
165-4144 PROTEAN Plus Dodeca Cell (100/120 V),
Trans-Blot Plus Cell, and PowerPac Univer sal
Power Supply, includes 165-4150, 170-3990,
and 164-5070
PROTEAN
®
Plus Dodeca™ Cells and Systems (c on td.)
165 - 513 4 PROTEAN Plus Dodeca Cell (100/120 V) and
Two 6-Row AnyGel Stands, includes 165-4150
and two 165-5131
165- 4151 PROTEAN Plus Dodeca Cell, 220/240 V, includes
electrophoresis buffer tank with built-in ceramic
cooling core, lid, buffer recirculation pump with
tubing, 2 gel releasers
165- 4141 PROTEAN Plus Dodeca Cell (220/240 V) and
PowerPac HC Power Supply, includes 165-4151
and 164-5052
165- 414 3 PROTEAN Plus Dodeca Cell (220/240 V ) and
PowerPac Universal Power Supply, includes
165 -4151 a n d 16 4- 5070
165- 414 5 PROTEAN Plus Dodeca Cell (220/240 V )
Trans-Blot Plus Cell, and PowerPac Univer sal
Power Supply, includes 165-4151, 170-3990,
and 164-5070
165 - 513 5 PROTE AN Plus Dodeca Cell (220/240 V ) and
Two 6-Row AnyGel Stands, includes 165-4151
and two 165-5131
Power Supplies
164-5050 PowerPac
™
Basic Power Supply,
100–120/220–240 V
164-5052 PowerPac HC Power Supply, 100–120/220–240 V
164-5056 PowerPac HV Power Supply, 100–120/220–240 V
164-5070 PowerPac Universal Power Supply,
100–120/220–240 V
IEF and SDS-PAGE Buffers and Reagents
16 3 - 2 111 ReadyPrep Overlay Agarose, 1 bottle, 50 ml
161-0732 10× Tris/Glycine/SDS, 1 L
161-0734 10× Tris/Glycine, 1 L
161-0744 10× Tris/Tricine/SDS, 1 L
161-0788 XT MOPS Running Buffer, 20×, 500 ml
161-0789 XT MES Running Buf fer, 20×, 500 ml
161-0790 XT Tricine Running Buffer, 20×, 500 ml
161-0793 XT MOPS Buffer Kit, includes 500 ml 20× XT
MOPS running buffer, 10 ml 4× XT sample buf fer,
1 ml 20× XT reducing agent
161-0796 XT MES Buffer Kit, includes 500 ml 20× X T MES
running buffer, 10 ml 4× XT sample buffer, 1 ml
20× XT reducing agent
161-0797 XT Tricine Buffer Kit, includes 500 ml 20× XT
Tricine running buf fer, 10 ml 4× XT sample buffer,
1 ml 20× XT reducing agent
161-0729 EDTA , 500 g
161-0 718 Glycine, 1 kg
161-0713 Tricine, 500 g
161-0 719 Tr is, 1 kg
161-0404 Bromophenol Blue, 10 g
Precast Gels*
Mini-PROTEAN
®
TGX™ Precast Gels
(for 7 cm IPG Strips)
IPG well, 10 gels per box
45 6 -1021 7.5% Mini-PROTEAN TGX Precast Gel
45 6 -1031 10% Mini-PROTEAN TGX Preca st Gel
45 6 -1041 12% Mini-PROTE AN TGX Precast Gel
45 6 -1081 4 –15% Mini-PROTEAN TGX Precast Gel
45 6 -1091 4 –20% Mini-PROTEAN TGX Precast Gel
™
456-9031 Any kD
Mini-PROTEAN TGX Precast Gel
Mini-PROTEAN
(for 7 cm IPG Strips)
456 -8021 7.5% Mini-PROTEAN TGX Stain-Free Precast Gel
456 -8 031 10% Mini-PROTEAN TGX Stain-Fre e Precast Gel
45 6 - 8041 12% Mini-PROTEAN TGX Stain-Free Precast Gel
45 6 -8121 Any kD Mini-PROTEAN TGX Stain-Free
Criterion Precast Gels
(for 11 cm IPG Strips)
IPG +1 well, package of 1
345-0101 10% Criterion Tris-HCl Precast Gel
345- 010 2 12.5% Criter ion Tris-HCl Pre cast Gel
345- 010 3 4–15% Criter ion Tris-HCl Pre cast Gel
345- 010 4 4–20% Criterion Tris-HCl Precast Gel
345- 010 5 8–16% Criterion Tris-HCl Pr ecast Gel
345- 010 6 10.5–14% Criterion Tris-HCl Precast Gel
345-0107 10–20% Criterion Tris-HCl Precast Gel
34 5 - 0 115 10% Criterion XT Bis-Tris Precast Gel
34 5 -0121 12% Criterion XT B is-Tris Precast Gel
34 5 -0127 4–12% Criterion XT Bis-Tris Precast Gel
345-0133 3–8% Criterion XT Tris-Acet ate Precast Gel
34 5- 8161 8–16% Criterion Stain-Free Precast Gel
Criterion
(for 11 cm IPG Strips)
56 7-1071 18% Criterion TGX Precast Gel
56 7-1081 4–15% Criterion TGX Preca st Gel
56 7-1091 4–20% Criterion TG X Precast Gel
567-110 1 8–16% Criterion TG X Precast Gel
567-1111 10–20% Criterion TGX Precast Gel
567-112 1 Any kD Criterion TGX Precast Gel
Criterion
(for 11 cm IPG Strips)
56 7- 8 0 71 18% Criterion TGX Stain-Free Precas t Gel
567-8081 4–15% Criterion TG X Stain-Free Precast Gel
56 7- 8 0 9 1 4–20% Criterion TGX Stain-Free Precast Gel
56 7- 8 10 1 8–16% Criterion TGX Stain-Free Precast Gel
567-8111 10–20% Criter ion TGX Stain-Free Precast Gel
56 7- 8 121 Any kD Cr iterion TGX Stain-Free Precas t Gel
* For a complete selection of precast gels, visit www.bio-rad.com
Gel Casting Buffers and Reagents
161- 510 0 SDS-PAGE Reagent Starter Kit, includes
161-0100 Acrylamide, 99.9%, 100 g
161-0120 Acrylamide/Bis Powder, 19:1, 30 g
161-0122 Acrylamide/Bis Powder, 37.5:1, 30 g
161-0140 40% Acrylamide Solution, 500 ml
161-0144 40% Acrylamide/Bis Solution, 19:1, 500 ml
161-0146 40% Acrylamide/Bis Solution, 29:1, 500 ml
161-0148 40% Acrylamide/Bis Solution, 37.5:1, 500 ml
161-0154 30% Acrylamide/Bis Solution, 19:1, 500 ml
161-0156 30% Acrylamide/Bis Solution, 29:1, 500 ml
161-0158 30% Acrylamide/Bis Solution, 37.5:1, 500 ml
161-02 00 Bis Crosslinker, 5 g
®
TGX Stain-Free™ Precast Gels
Precast Gel
™
TGX™ Precast Gels
™
TGX Stain-Free™ Precast Gels
100 g acrylamide, 5 g bis, 5 ml TEMED,
10 g ammonium persulfate
136 137
Page 71

2-D Electrophoresis Guide
Appendices
Catalog # Description Catalog # Description
Gel Casting Buffers and Reagents (c on td.)
161-0800 TEMED, 5 ml
161-0798 Resolving Gel Buffer, 1.5 M Tris-HCl, pH 8.8, 1 L
161-0700 Ammonium Persulfate (APS), 10 g
161-0799 Stacking Gel Buffer, 0.5 M Tris-HCl, pH 6.8, 1 L
Gel Casting Accessories
See catalog or www.bio-rad.com for a complete listing of
accessories, including available empty gel cassettes and glass
plates, spacers, combs, etc.
™
165 - 5131 AnyGel
Stand, 6-row, holds 6 PROTE AN gels,
12 Criterion gels, or 18 Ready Gel mini gels
165- 413 1 AnyGel Stand, single-row, holds 1 PROTEAN gel,
2 Criterion gels, or 3 Ready Gel mini gels
165- 412 2 Model 485 Gradient Former and Mini-PROTEA N
3 Multi-Casting Chamber, includes 165-4120
and 165-4110
165-4123 Model 495 Gradient Former and PROTEAN Plus
Multi-Casting Chamber, includes 165-4121
an d 16 5-4160
Total Protein Gel Stains
™
161-0786 Bio-Safe
Coomassie Stain, 1 L
161-0787 Bio-Safe Coomassie Stain, 5 L
™
TABLE OF CONTENTS
161-0449 Silver Stain Plus
concentrate, silver complex solution, reduction
Kit, includes fixative enhancer
moderator solution, image development reagent,
development accelerator reagent, stains 13 full size
or 40 mini gels
™
161-04 96 Oriole
161-04 92 Flamingo
Fluorescent Gel Stain, 1× solution, 1 L
™
Fluorescent Gel Stain, 10× solution,
500 ml
170 - 3125 SYPRO Ruby Protein Gel Stain, 1× solution, 1 L
161-0440 Zinc Stain and Destain Kit, includes 125 ml of 10×
zinc stain solution A, 125 ml of 10× zinc stain solution
B, 125 ml of 10× zinc destain solution
161-0470 Copper Stain and Destain Kit, includes 125 ml
of 10× copper stain, 125 ml of 10× copper
destain solution
High-Throughput Stainers
165-3400 Dodeca Stainer, large, 100–240 V, includes
13 trays (12 clear, 1 white), 12 tray attachments,
shaking rack, solution tank, lid with shaker motor,
shaker control unit, gel clip
165-3401 Dodeca Stainer, small, 100–240 V, includes
13 trays (12 clear, 1 white), 12 Criterion tray
attachments, shaking rack, solution tank, lid with
shaker motor, shaker control unit, gel clip
Imaging Systems and Spot Cutter
™
170 -7 9 91 GS-900
Calibrated Densitometry System, gel
densitometry system, PC compatible, scanner,
cables, Image L ab sof tware, optional 21 CFR Part 11
and Instrument Qualification/Operations Qualification
™
170 - 8 280 ChemiDoc
MP System, gel imaging system,
PC or Mac, includes darkroom, UV transilluminator,
epi-white illumination, camera, power supply, cables,
Image Lab
™
software
170-8270 Gel Doc EZ Sys tem, gel imaging system, PC
or Mac, includes dark room, camera, cables, Image
Lab software; samples trays (#170-8271, 170-8272,
170-8273, or 170-8274) are sold separately; sample
trays are required to use the system
®
170-9460 Molecular Imager
PC or Mac, 110–240 V, includes Quantity One
PharosFX™ Plus System,
®
software, sample tray set, fluorescence filters
(170-7866, 170-7896) and phosphor imaging filters,
USB2 cable
170-9450 Molecular Imager PharosFX System, PC or Mac,
110–240 V, includes Q uantity One software, sample
tray set, fluorescence filters (170-7866, 170-7896),
USB2 cable
™
165 -7200 EXQuest
Spot Cutter, gel excision instrument,
includes enclosure, imaging system, fluidics system,
robotics, sensors, cutting head, gel tray, microplate
rack, wash station
165-7201 E XQuest Spot Cutter with PC, gel excision
instrument, includes PC, enclosure, imaging system,
fluidics system, robotics, sensors, cutting head,
gel tray, microplate rack, wash station
Benzonase is a trademark of Merck KGaA Corporation.
Coomassie is a trademark of BASF Aktiengesellschaft.
Cy is a trademark of GE Healthcare Group Companies.
Parafilm is a trademark of American National Can Company.
Pro-Q, Qdot, and SYPRO are trademarks of
Invitrogen Corporation.
Triton is a trademark of Dow Chemical Company.
Tween is a trademark of ICI Americas Inc.
Tygon is a trademark of Norton Company.
Whatman is a trademark of Whatman Limited Corporation.
ZipTip is a trademark of Millipore Corporation.
Bio-Rad Laboratorie s, Inc. is license d by Invitrogen
Corporation to sell SYPRO products for research use only
under U.S. Patent Number 5,616,502.
Precision Plus Protein standards are sold under license from
Life Technologies Corporation, Carlsbad, CA, for use only by
the buyer of the product. The buyer is not authorized to sell
or resell this product or its components.
Purchase of Criterion X T Bis-Tris gels, XT MOPS running
buffer, XT MES running buffer, XT MOPS buffer kit, and
XT MES buffer kit is accompanied by a limited license
under U.S. Patent Numbers 6,143,154; 6,096,182; 6,059,948;
5,578,180; 5,922,185; 6,162,338; and 6,783,651, and
corresponding foreign patents.
StrepTactin is covered by German patent application
P 19641876.3. Bio-Rad L aboratories, Inc. is licensed by
Institut fur Bioanalytik GmbH to sell these products for
research use only.
Analysis Software
170 - 9 6 9 0 Image Lab Software
170-9600 Quantity O ne 1-D Analysis Soft ware, PC or Mac
™
170 - 9 6 3 0 PDQuest
Advanced 2-D Analysis Software
Gel Drying Supplies
™
165 -1771 GelAir
Drying System, 115 V, 60 Hz, includes
165-1777, 2 drying frame s, 16 clamps, assembly
table, 50 precut sheets of cellophane support,
gel drying solution
165-1777 GelAir Dryer, 115 V, 60 Hz, gel drying oven only
138
139
Page 72

Bio-Rad
Laboratories, Inc.
Life Science
Group
Web site ww w.bio-rad.com USA 800 424 6723 Australia 61 2 9914 2800 Austria 01 877 89 01 Belgium 09 385 55 11 Brazil 5 5 11 5044 5699
Canada 905 364 3435 China 86 21 6169 8500 Cze ch Repu blic 420 241 430 5 32 Denm ark 44 52 10 00 Finland 09 804 2 2 00
France 01 47 95 69 65 Germany 089 31 884 0 Greec e 30 210 9532 220 Hong Ko ng 852 2789 3300 Hungary 36 1 459 6100 India 91 124 4029300
Israel 03 963 6050 Italy 39 02 216091 Japan 03 6361 7000 Korea 82 2 3473 4460 Mexico 52 555 488 7670 The Netherlands 0318 540666
New Zealand 64 9 415 2280 Nor way 23 38 41 30 Poland 48 22 331 99 99 Portugal 351 21 472 7700 Russia 7 495 721 14 04
Singapore 65 6415 3188 South Africa 27 861 246 723 Spain 34 91 590 52 00 Swed en 08 555 12700 Switzerland 026 674 55 05
Taiwan 886 2 2578 7189 Thailand 800 88 22 88 United Kingdom 020 8328 200 0
13-0893 0413 Sig 1212Bulletin 2651 Rev F US/EG
 Loading...