ZyXEL NWA5123-ACHD Users Manual

PART II
Technical Reference
53

4.1 Overview
Use the Dashboard screens to check status information about the NWA/WAC.
4.1.1 What You Can Do in this Chapter
• The main Dashboard screen (Section 4.2 on page 54) displays the NWA/WAC’s general device
information, system status, system resource usage, and interface status. You can also display other
status screens for more information.
4.2 Dashboard
CHAPTER 4
Dashboard
This screen is the first thing you see when you log into the NWA/WAC. It also appears every time you click
the Dashboard icon in the navigation panel. The Dashboard displays general device information, system
status, system resource usage, and interface status in widgets that you can re-arrange to suit your
needs. You can also collapse, refresh, and close individual widgets.
NWA / WAC Series User’s Guide
54
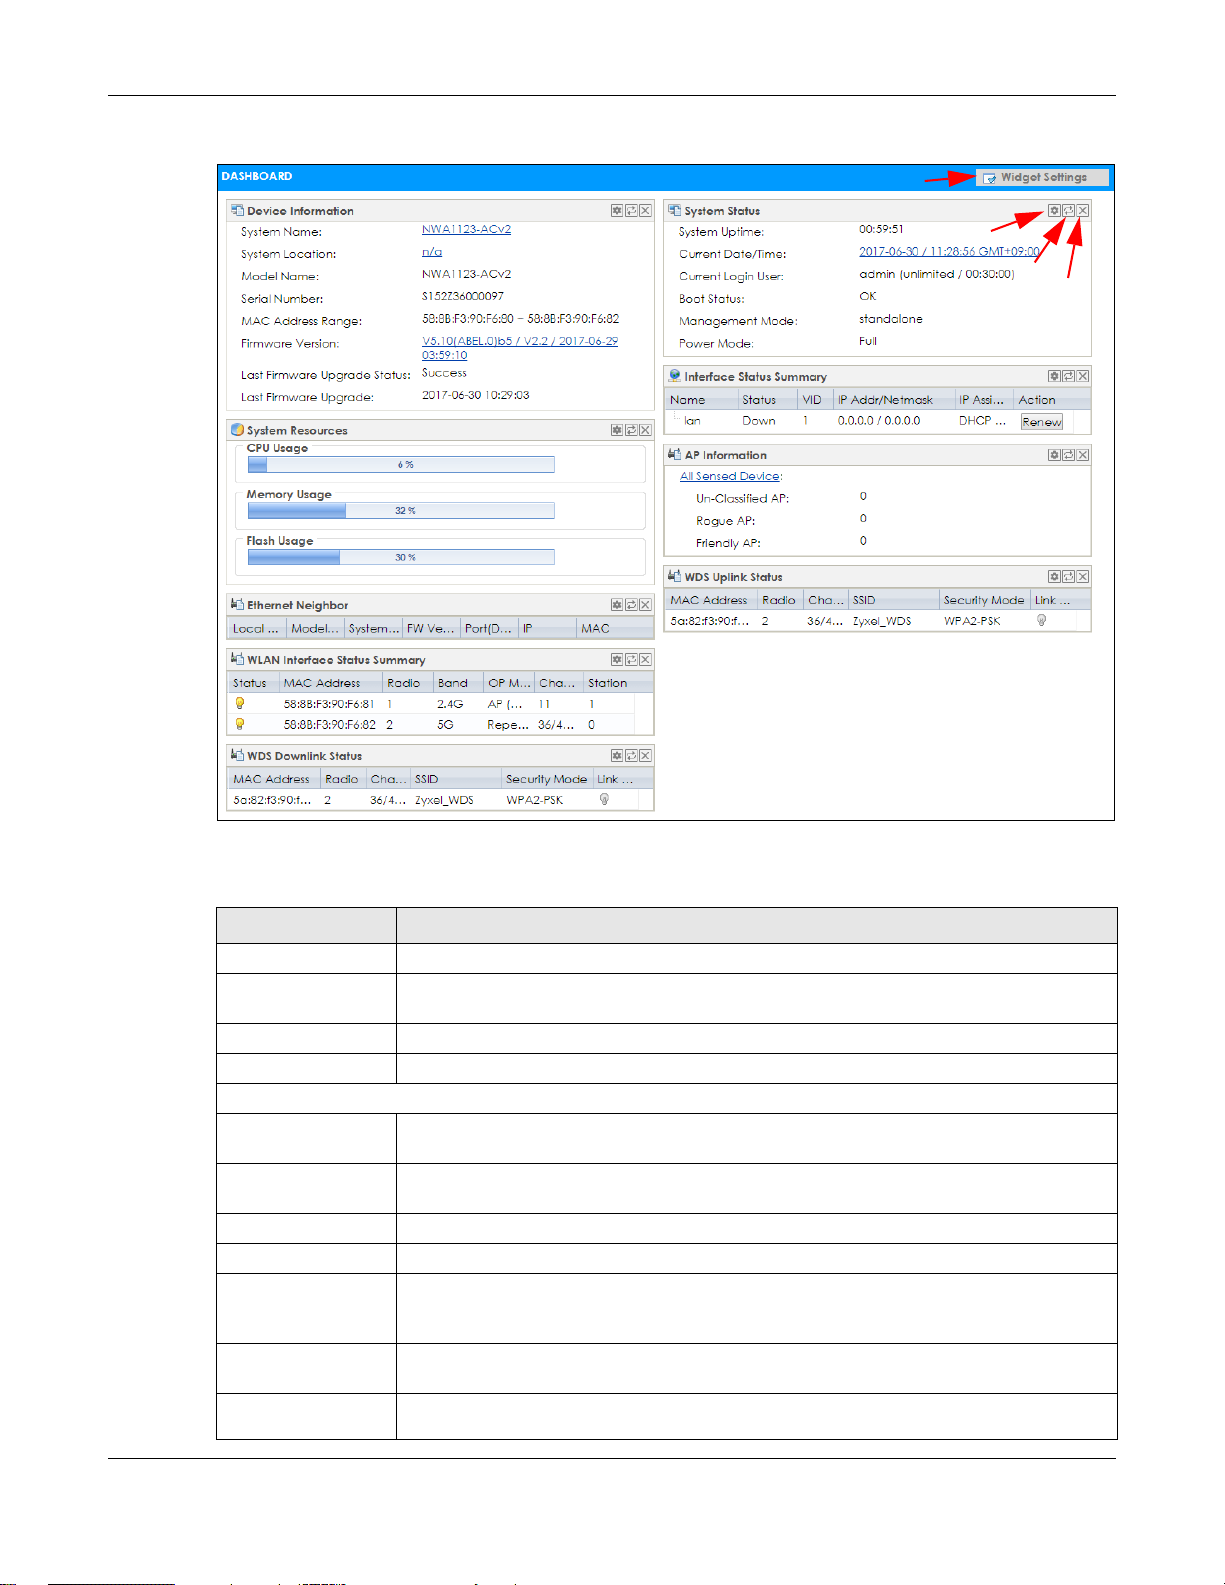
Figure 27 Dashboard
B
C
D
A
Chapter 4 Dashboard
The following table describes the labels in this screen.
Table 23 Dashboard
LABEL DESCRIPTION
Widget Settings (A) Use this link to re-open closed widgets. Widgets that are already open appear grayed out.
Refresh Time Setting
(B)
Refresh Now (C) Click this to update the widget’s information immediately.
Close Widget (D) Click this to close the widget. Use Widget Settings to re-open it.
Device Information
System Name This field displays the name used to identify the NWA/WAC on any network. Click the icon to
System Location This field displays the location of the NWA/WAC. Click the icon to open the screen where
Model Name This field displays the model name of this NWA/WAC.
Serial Number This field displays the serial number of this NWA/WAC.
MAC Address
Range
Firmware Version This field displays the version number and date of the firmware the NWA/WAC is currently
Last Firmware
Upgrade Status
Set the interval for refreshing the information displayed in the widget.
open the screen where you can change it.
you can change it.
This field displays the MAC addresses used by the NWA/WAC. Each physical port or wireless
radio has one MAC address. The first MAC address is assigned to the Ethernet LAN port, the
second MAC address is assigned to the first radio, and so on.
running. Click the icon to open the screen where you can upload firmware.
This field displays whether the latest firmware update was successfully completed.
NWA / WAC Series User’s Guide
55

Chapter 4 Dashboard
Table 23 Dashboard (continued)
LABEL DESCRIPTION
Last Firmware
Upgrade
System Resources
CPU Usage This field displays what percentage of the NWA/WAC’s processing capability is currently
Memory Usage This field displays what percentage of the NWA/WAC’s RAM is currently being used. Hover
Flash Usage This field displays what percentage of the NWA/WAC’s onboard flash memory is currently
Ethernet Neighbor
Local Port
(Description)
Model Name This field displays the model name of the discovered device.
System Name This field displays the system name of the discovered device.
FW Version This field displays the firmware version of the discovered device.
Port (Description) This field displays the discovered device’s port which is connected to the NWA/WAC.
IP This field displays the IP address of the discovered device. Click the IP address to access
MAC This field displays the MAC address of the discovered device.
WDS (Wireless Distribution System) Uplink/Downlink Status
MAC Address This field displays the MAC address of the root AP or repeater to which the NWA/WAC is
Radio This field displays the radio number on the root AP or repeater to which the NWA/WAC is
Channel This field displays the channel number on the root AP or repeater to which the NWA/WAC is
SSID This field displays the name of the wireless network to which the NWA/WAC is connected
Security Mode This field displays which secure encryption methods is being used by the NWA/WAC to
Link Status This field displays the RSSI (Received Signal Strength Indicator) and transmission/reception
System Status
System Uptime This field displays how long the NWA/WAC has been running since it last restarted or was
Current Date/
Time
Current Login
User
This field displays the date and time when the last firmware update was made.
being used. Hover your cursor over this field to display the Show CPU Usage icon that takes
you to a chart of the NWA/WAC’s recent CPU usage.
your cursor over this field to display the Show Memory Usage icon that takes you to a chart
of the NWA/WAC’s recent memory usage.
being used.
This field displays the port of the NWA/WAC, on which the neighboring device is discovered.
and manage the discovered device using its web configurator.
connected using WDS.
connected using WDS.
connected using WDS.
using WDS.
connect to the root AP or repeater using WDS.
rate of the wireless connection in WDS.
turned on.
This field displays the current date and time in the NWA/WAC. The format is yyyy-mm-dd
hh:mm:ss.
This field displays the user name used to log in to the current session, the amount of
reauthentication time remaining, and the amount of lease time remaining.
NWA / WAC Series User’s Guide
56

Chapter 4 Dashboard
Table 23 Dashboard (continued)
LABEL DESCRIPTION
Boot Status This field displays details about the NWA/WAC’s startup state.
OK - The NWA/WAC started up successfully.
Firmware update OK - A firmware update was successful.
Problematic configuration after firmware update - The application of the configuration
failed after a firmware upgrade.
System default configuration - The NWA/WAC successfully applied the system default
configuration. This occurs when the NWA/WAC starts for the first time or you intentionally
reset the NWA/WAC to the system default settings.
Fallback to lastgood configuration - The NWA/WAC was unable to apply the startupconfig.conf configuration file and fell back to the lastgood.conf configuration file.
Fallback to system default configuration - The NWA/WAC was unable to apply the
lastgood.conf configuration file and fell back to the system default configuration file
(system-default.conf).
Booting in progress - The NWA/WAC is still applying the system configuration.
Management
Mode
Power Mode This displays the NWA/WAC’s power status.
This shows whether the NWA/WAC is set to work as a stand alone AP.
Full - the NWA/WAC receives power using a power adaptor and/or through a PoE switch/
injector using IEEE 802.3at PoE plus.
Limited - the NWA/WAC receives power through a PoE switch/injector using IEEE 802.3af PoE
even when it is also connected to a power source using a power adaptor.
When the NWA/WAC is in limited power mode, the NWA/WAC throughput decreases and
has just one transmitting radio chain.
It always shows Full if the NWA/WAC does not support power detection. At the time of
writing, only the WAC6500 series APs support the power detection feature.
Interface Status
Summary
Name This field displays the name of each interface.
Status This field displays the current status of each interface. The possible values depend on what
VID This field displays the VLAN ID to which the interface belongs.
IP Addr/Netmask This field displays the current IP address and subnet mask assigned to the interface. If the IP
IP Assignment This field displays how the interface gets its IP address.
If an Ethernet interface does not have any physical ports associated with it, its entry is
displayed in light gray text. Click the Detail icon to go to a (more detailed) summary screen
of interface statistics.
type of interface it is.
Inactive - The Ethernet interface is disabled.
Down - The Ethernet interface is enabled but not connected.
Speed / Duplex - The Ethernet interface is enabled and connected. This field displays the
port speed and duplex setting (Full or Half).
address is 0.0.0.0, the interface is disabled or did not receive an IP address and subnet mask
via DHCP.
Static - This interface has a static IP address.
DHCP Client - This interface gets its IP address from a DHCP server.
Action If the interface has a static IP address, this shows n/a.
If the interface has a dynamic IP address, use this field to get or to update the IP address for
the interface. Click Renew to send a new DHCP request to a DHCP server.
NWA / WAC Series User’s Guide
57
Chapter 4 Dashboard
Table 23 Dashboard (continued)
LABEL DESCRIPTION
WLAN Interface
Status Summary
Status This displays whether or not the WLAN interface is activated.
MAC Address This displays the MAC address of the radio.
Radio This indicates the radio number on the NWA/WAC.
Band This indicates the wireless frequency band currently being used by the radio.
OP Mode This indicates the radio’s operating mode. Operating modes are AP (MBSSID), MON
Channel This indicates the channel number the radio is using.
Antenna This indicates the antenna orientation for the radio (Wall or Ceiling).
Station This displays the number of wireless clients connected to the NWA/WAC.
AP Information This shows a summary of connected wireless Access Points (APs).
All Sensed Device This sections displays a summary of all wireless devices detected by the network. Click the
Un-Classified AP This displays the number of detected unclassified APs.
Rogue AP This displays the number of detected rogue APs.
Friendly AP This displays the number of detected friendly APs.
This displays status information for the WLAN interface.
This shows - when the radio is in monitor mode.
(monitor), Root AP or Repeater.
This field is not available if the NWA/WAC does not allow you to adjust antenna orientation
for each radio using the web configurator or a physical switch. Refer to Table 1 on page 13
and Table 3 on page 15 to see if your NWA/WAC has an antenna switch.
link to go to the Monitor > Wireless > Detected Device screen.
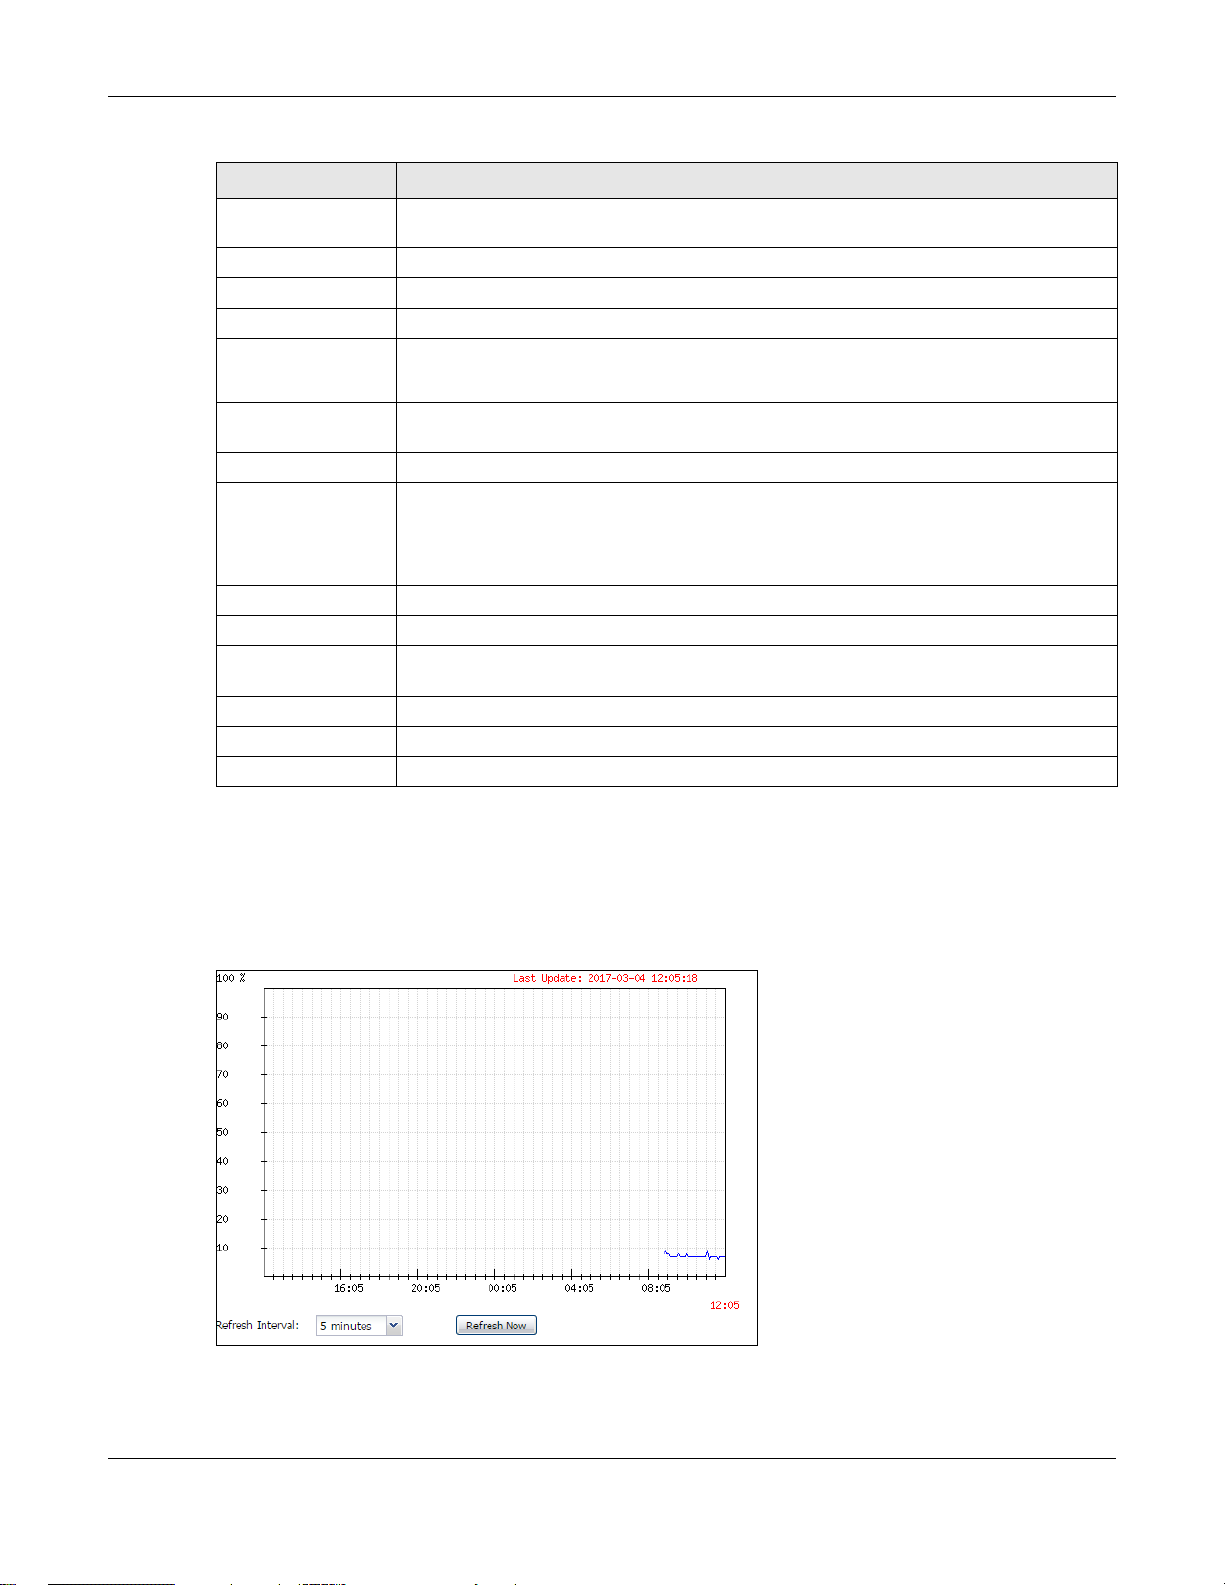
4.2.1 CPU Usage
Use this screen to look at a chart of the NWA/WAC’s recent CPU usage. To access this screen, click CPU
Usage in the dashboard.
Figure 28 Dashboard > CPU Usage
NWA / WAC Series User’s Guide
58

The following table describes the labels in this screen.
Table 24 Dashboard > CPU Usage
LABEL DESCRIPTION
% The y-axis represents the percentage of CPU usage.
time The x-axis shows the time period over which the CPU usage occurred
Refresh Interval Enter how often you want this window to be automatically updated.
Refresh Now Click this to update the information in the window right away.
4.2.2 Memory Usage
Use this screen to look at a chart of the NWA/WAC’s recent memory (RAM) usage. To access this screen,
click Memory Usage in the dashboard.
Figure 29 Dashboard > Memory Usage
Chapter 4 Dashboard
The following table describes the labels in this screen.
Table 25 Dashboard > Memory Usage
LABEL DESCRIPTION
% The y-axis represents the percentage of RAM usage.
time The x-axis shows the time period over which the RAM usage occurred
Refresh Interval Enter how often you want this window to be automatically updated.
Refresh Now Click this to update the information in the window right away.
NWA / WAC Series User’s Guide
59

5.1 Overview
Use the Monitor screens to check status and statistics information.
5.1.1 What You Can Do in this Chapter
• The Network Status screen (Section 5.3 on page 61) displays general LAN interface information and
packet statistics.
• The AP Information > Radio List screen (Section 5.4 on page 64) displays statistics about the wireless
radio transmitters in the NWA/WAC.
• The Station Info screen (Section 5.5 on page 67) displays statistics pertaining to the associated
stations.
• The WDS Link Info screen (Section 5.6 on page 68) displays statistics about the NWA/WAC’s WDS
(Wireless Distribution System) connections.
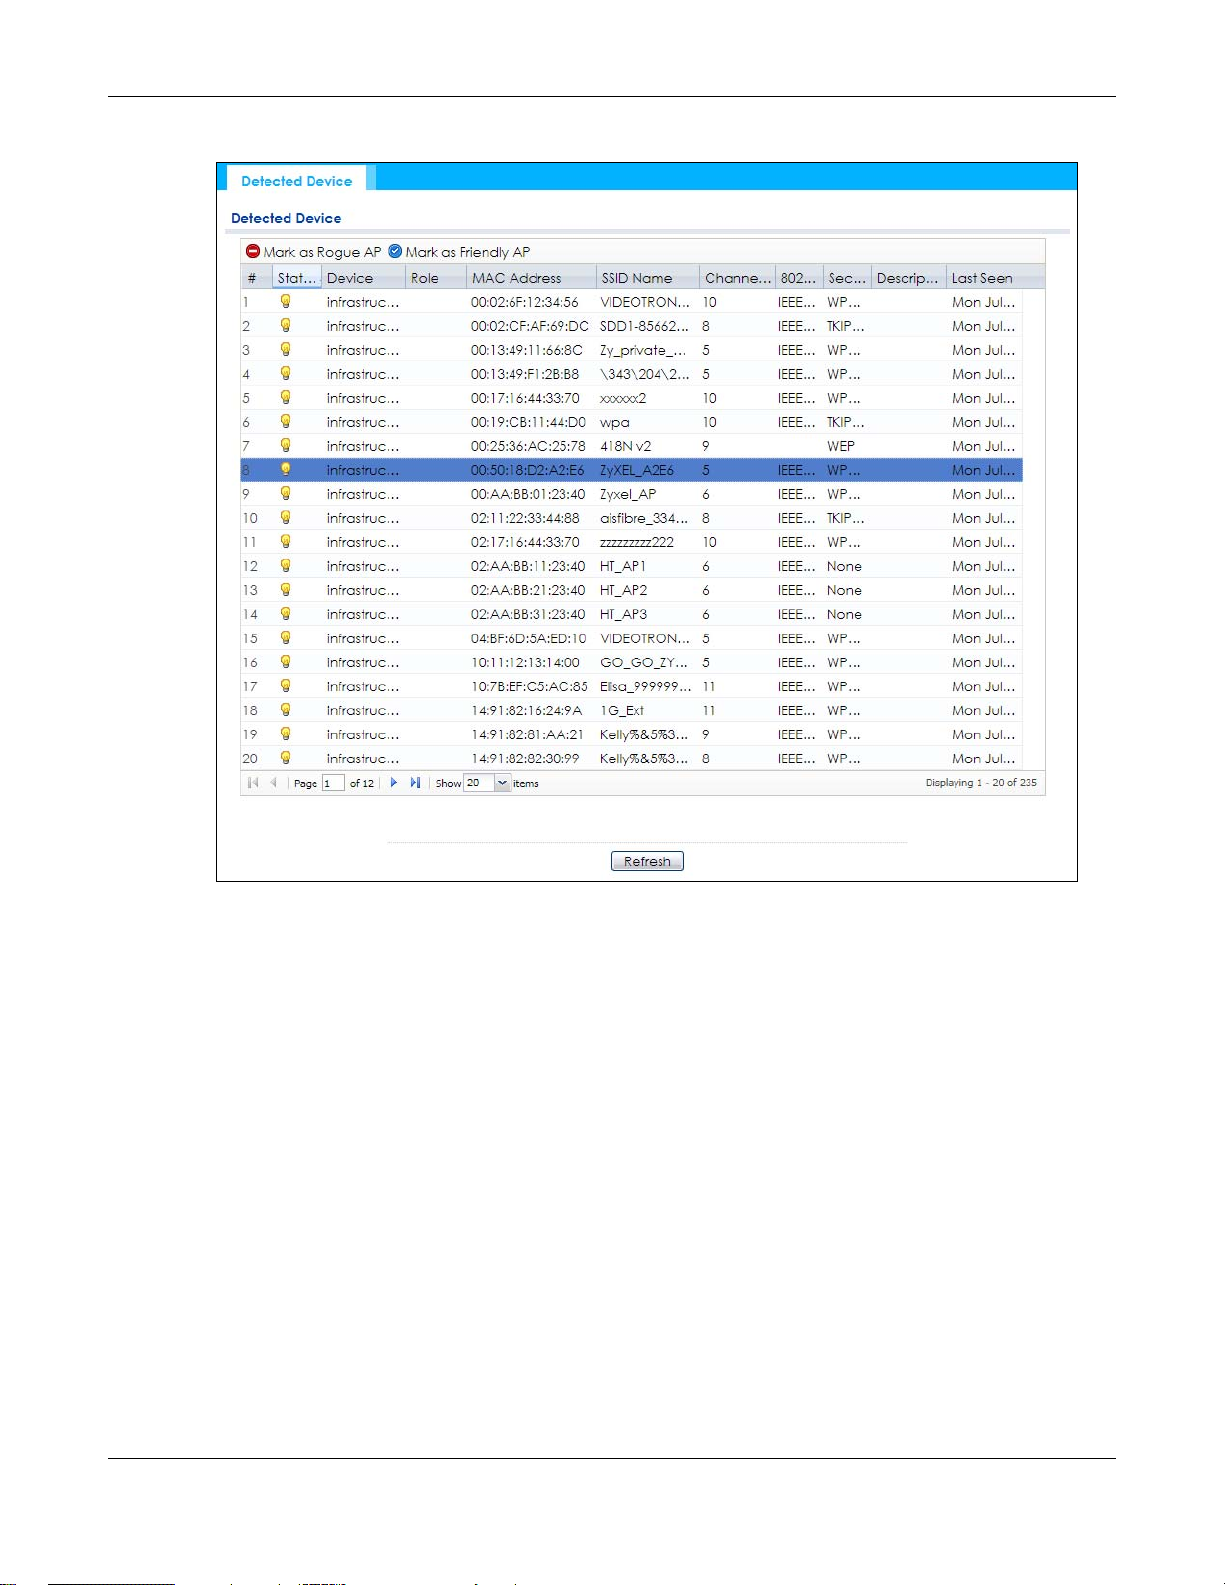
• The Detected Device screen (Section 5.7 on page 69) displays information about suspected rogue
APs.
• The View Log screen (Section 5.8 on page 72) displays the NWA/WAC’s current log messages. You
can change the way the log is displayed, you can e-mail the log, and you can also clear the log in
this screen.
CHAPTER 5
Monitor
5.2 What You Need to Know
The following terms and concepts may help as you read through the chapter.
Rogue AP
Rogue APs are wireless access points operating in a network’s coverage area that are not under the
control of the network’s administrators, and can open up holes in a network’s security. See Chapter 11
on page 126 for details.
Friendly AP
Friendly APs are other wireless access points that are detected in your network, as well as any others that
you know are not a threat (those from neighboring networks, for example). See Chapter 11 on page 126
for details.
NWA / WAC Series User’s Guide
60
5.3 Network Status
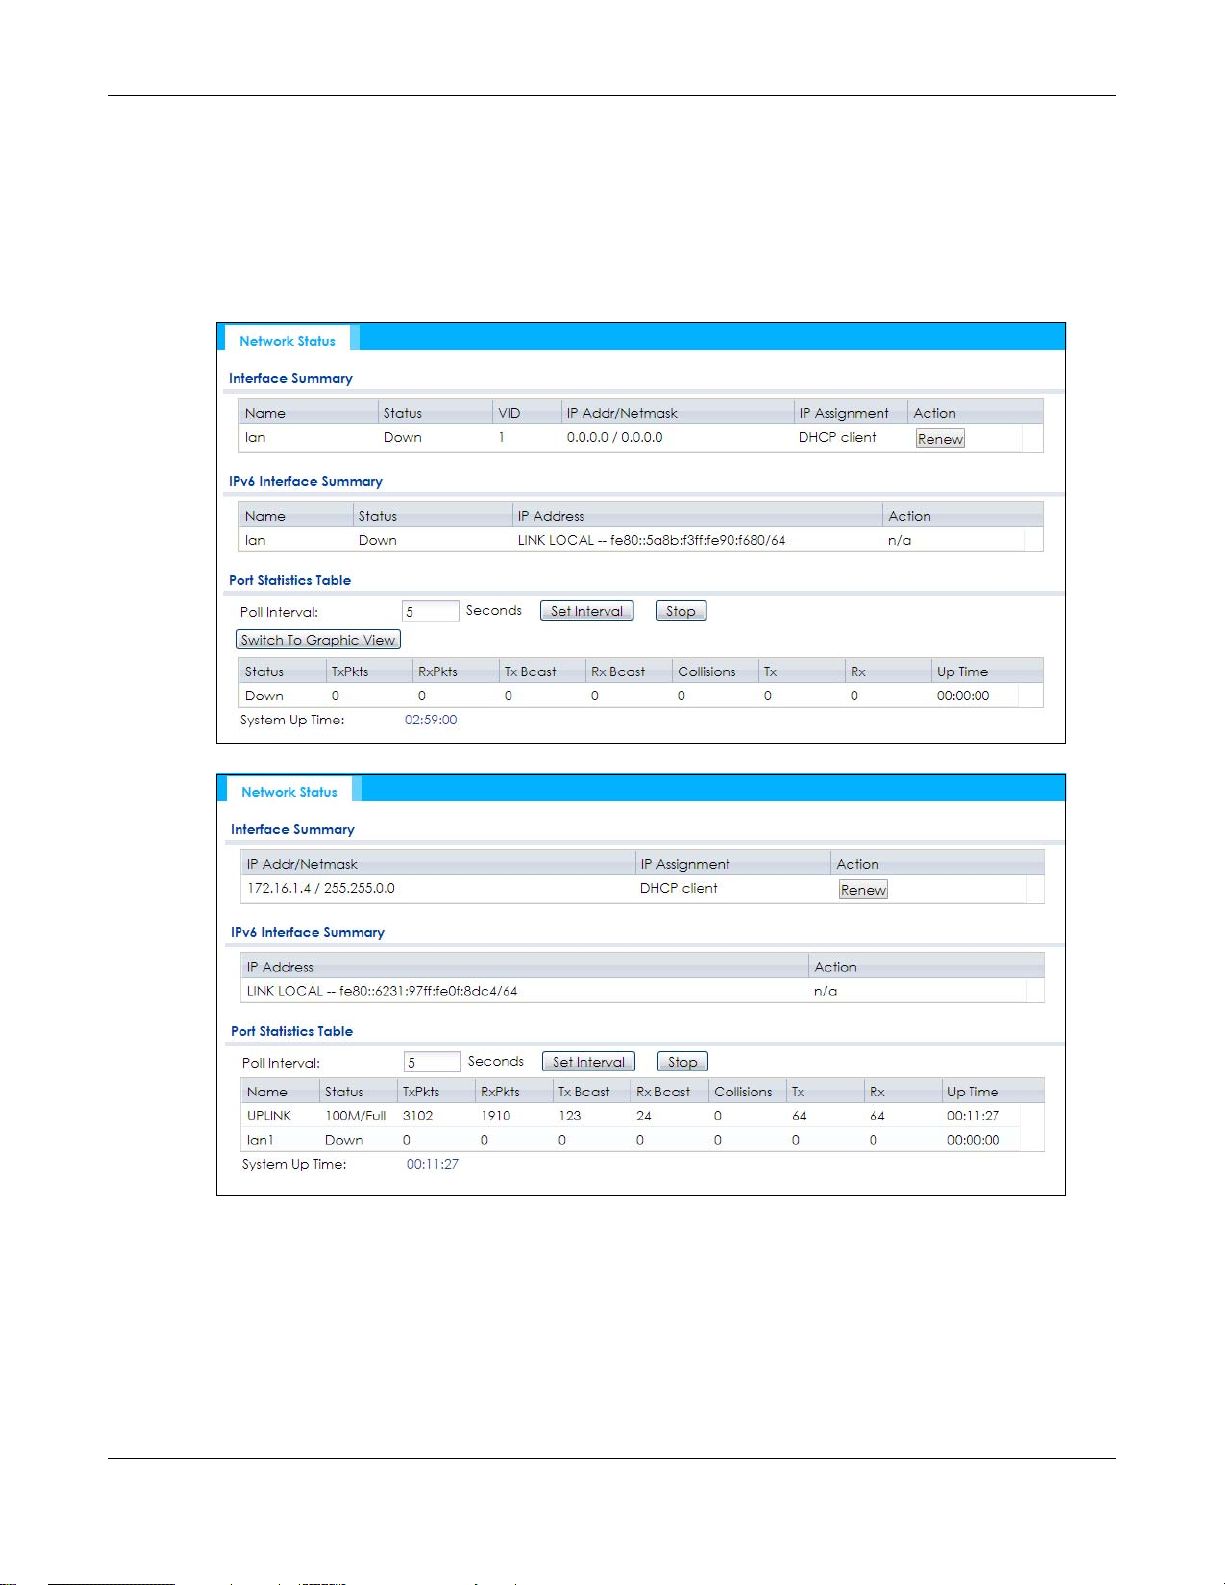
Use this screen to look at general Ethernet interface information and packet statistics. To access this
screen, click Monitor > Network Status. The screen varies depending on whether the NWA/WAC has an
extra Ethernet port (except the uplink port).
Figure 30 Monitor > Network Status (for NWA/WAC with one Ethernet port)
Chapter 5 Monitor
Figure 31 Monitor > Network Status (for NWA/WAC with multiple Ethernet ports)
NWA / WAC Series User’s Guide
61

Chapter 5 Monitor
The following table describes the labels in this screen.
Table 26 Monitor > Network Status
LABEL DESCRIPTION
Interface
Summary
IPv6 Interface
Summary
Name This field displays the name of the physical Ethernet port on the NWA/WAC.
Status This field displays the current status of each physical port on the NWA/WAC.
VID This field displays the VLAN ID to which the port belongs.
IP Addr/Netmask
IP Address
IP Assignment This field displays how the interface gets its IPv4 address.
Use the Interface Summary section for IPv4 network settings. Use the IPv6 Interface Summary
section for IPv6 network settings if you connect your NWA/WAC to an IPv6 network. Both
sections have similar fields as described below.
Down - The port is not connected.
Speed / Duplex - The port is connected. This field displays the port speed and duplex setting
(Full or Half).
This field displays the current IP address (and subnet mask) of the interface. If the IP address is
0.0.0.0 (in the IPv4 network) or :: (in the IPv6 network), the interface does not have an IP address
yet.
Static - This interface has a static IPv4 address.
DHCP Client - This interface gets its IPv4 address from a DHCP server.
Action Use this field to get or to update the IP address for the interface. Click Renew to send a new
DHCP request to a DHCP server. If the interface cannot use one of these ways to get or to
update its IP address, this field displays n/a.
Port Statistics
Table
Poll Interval Enter how often you want this window to be updated automatically, and click Set Interval.
Set Interval Click this to set the Poll Interval the screen uses.
Stop Click this to stop the window from updating automatically. You can start it again by setting the
Poll Interval and clicking Set Interval.
Switch to Graphic
View
Name This field displays the name of the interface.
Status This field displays the current status of the physical port.
TxPkts This field displays the number of packets transmitted from the NWA/WAC on the physical port
RxPkts This field displays the number of packets received by the NWA/WAC on the physical port since
Tx Bcast This field displays the number of broadcast packets transmitted from the NWA/WAC on the
Rx Bcast This field displays the number of broadcast packets received by the NWA/WAC on the physical
Collisions This field displays the number of collisions on the physical port since it was last connected.
Tx This field displays the transmission speed, in bytes per second, on the physical port in the one-
Click this to display the port statistics as a line graph.
Down - The physical port is not connected.
Speed / Duplex - The physical port is connected. This field displays the port speed and duplex
setting (Full or Half).
since it was last connected.
it was last connected.
physical port since it was last connected.
port since it was last connected.
second interval before the screen updated.
NWA / WAC Series User’s Guide
62
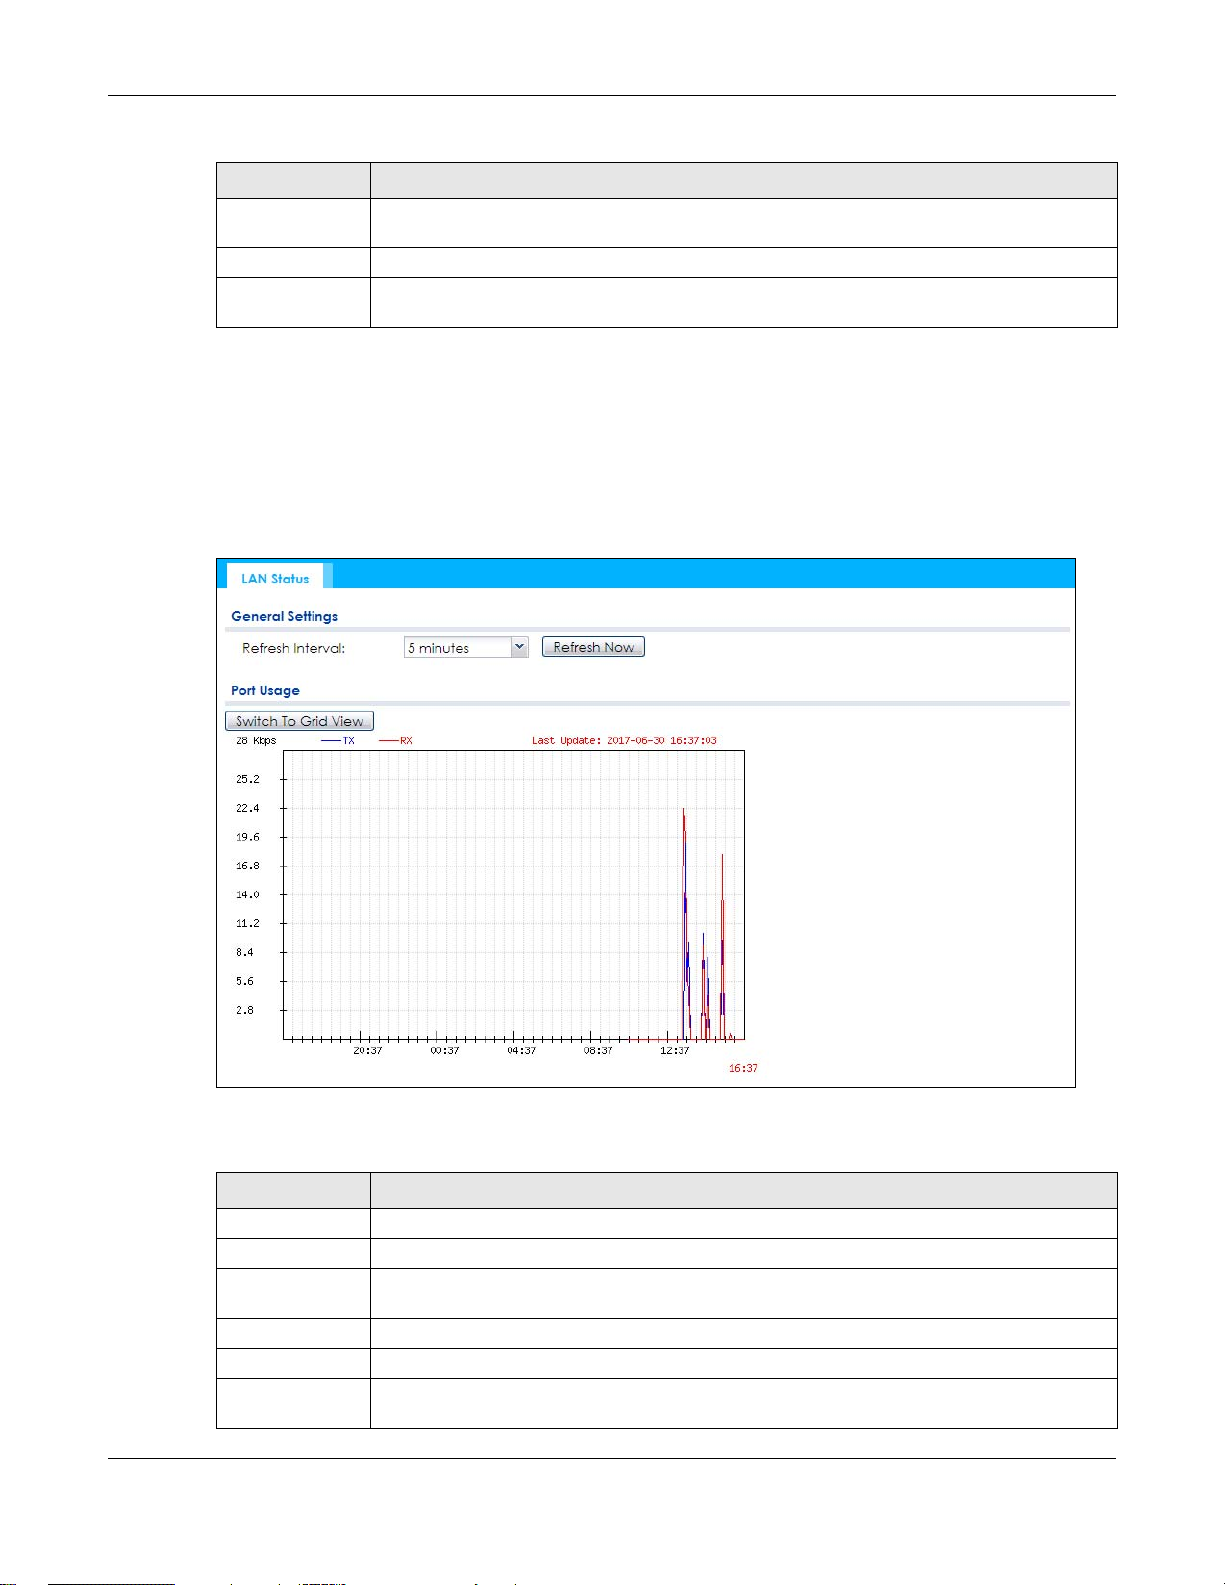
Table 26 Monitor > Network Status (continued)
LABEL DESCRIPTION
Rx This field displays the reception speed, in bytes per second, on the physical port in the one-
second interval before the screen updated.
Up Time This field displays how long the physical port has been connected.
System Up Time This field displays how long the NWA/WAC has been running since it last restarted or was turned
on.
5.3.1 Port Statistics Graph
Use the port statistics graph to look at a line graph of packet statistics for the Ethernet port. To view, click
Monitor > Network Status and then the Switch to Graphic View button.
This screen is NOT available on the NWA/WAC that has an extra Ethernet port (except the uplink port).
Figure 32 Monitor > Network Status > Switch to Graphic View
Chapter 5 Monitor
The following table describes the labels in this screen.
Table 27 Monitor > Network Status > Switch to Graphic View
LABEL DESCRIPTION
Refresh Interval Enter how often you want this window to be automatically updated.
Refresh Now Click this to update the information in the window right away.
Switch to Grid
View
Kbps/Mbps The y-axis represents the speed of transmission or reception.
Time The x-axis shows the time period over which the transmission or reception occurred.
TX This line represents traffic transmitted from the NWA/WAC on the physical port since it was last
Click this to display the port statistics as a table.
connected.
NWA / WAC Series User’s Guide
63
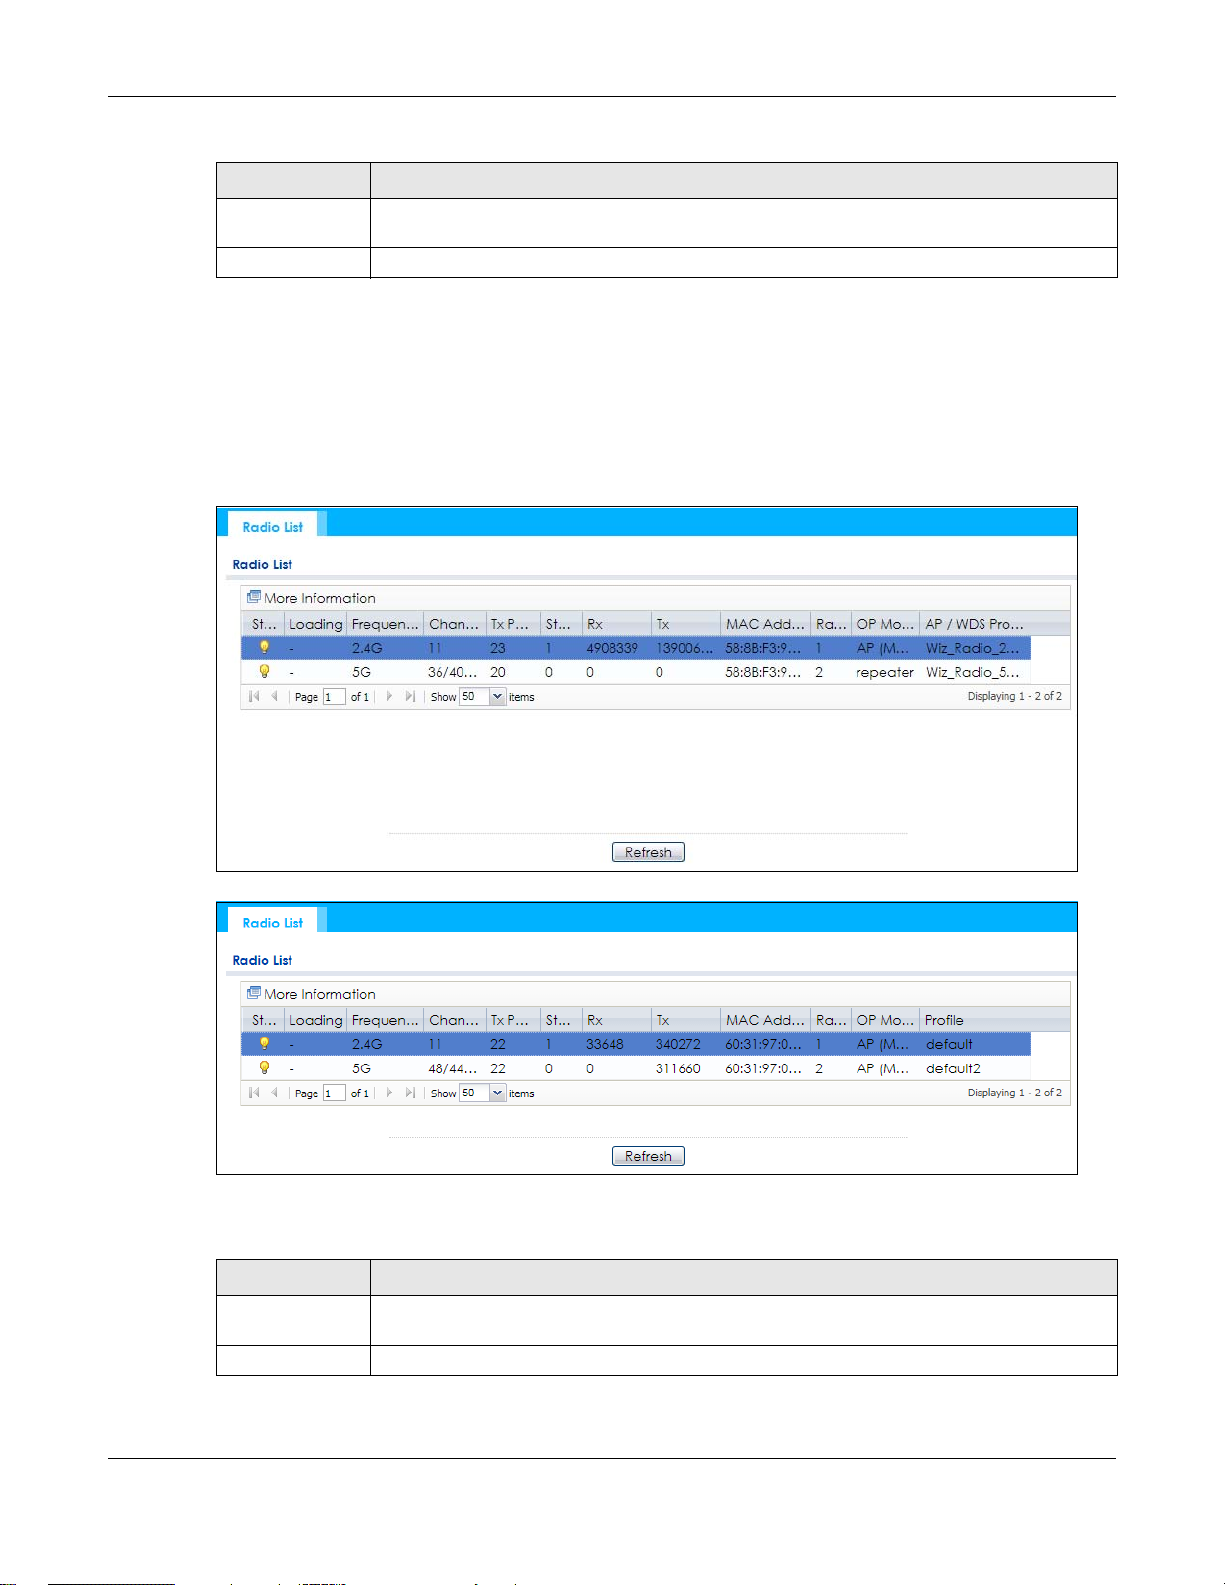
Table 27 Monitor > Network Status > Switch to Graphic View (continued)
LABEL DESCRIPTION
RX This line represents the traffic received by the NWA/WAC on the physical port since it was last
Last Update This field displays the date and time the information in the window was last updated.
5.4 Radio List
Use this screen to view statistics for the NWA/WAC’s wireless radio transmitters. To access this screen,
click Monitor > Wireless > AP Information > Radio List.
Figure 33 Monitor > Wireless > AP Information > Radio List (for NWA/WAC that supports WDS)
Chapter 5 Monitor
connected.
Figure 34 Monitor > Wireless > AP Information > Radio List (for NWA/WAC that doesn’t support WDS)
The following table describes the labels in this screen.
Table 28 Monitor > Wireless > AP Information > Radio List
LABEL DESCRIPTION
More Information Click this to view additional information about the selected radio’s wireless traffic and station
Status This displays whether or not the radio is enabled.
count. Information spans a 24 hour period.
NWA / WAC Series User’s Guide
64

Chapter 5 Monitor
Table 28 Monitor > Wireless > AP Information > Radio List (continued)
LABEL DESCRIPTION
Loading This indicates the AP’s load balance status (UnderLoad or OverLoad) when load balancing is
enabled on the NWA/WAC. Otherwise, it shows - when load balancing is disabled or the radio
is in monitor mode.
MAC Address This displays the MAC address of the radio.
Radio This indicates the radio number on the NWA/WAC to which it belongs.
OP Mode This indicates the radio’s operating mode. Operating modes are AP (MBSSID), MONITOR, Root
AP/WDS Profile This indicates the AP profile name and WDS profile name to which the radio belongs.
Profile This indicates the AP profile name to which the radio belongs.
Frequency Band This indicates the wireless frequency band currently being used by the radio.
Channel This indicates the radio’s channel ID.
Tx Power This displays the output power of the radio.
Station This displays the number of wireless clients connected to this radio on the NWA/WAC.
Rx This displays the total number of packets received by the radio.
Tx This displays the total number of packets transmitted by the radio.
AP or Repeater
This field is available only on the NWA/WAC that supports WDS.
This field is available only on the NWA/WAC that doesn’t support WDS.
This shows - when the radio is in monitor mode.
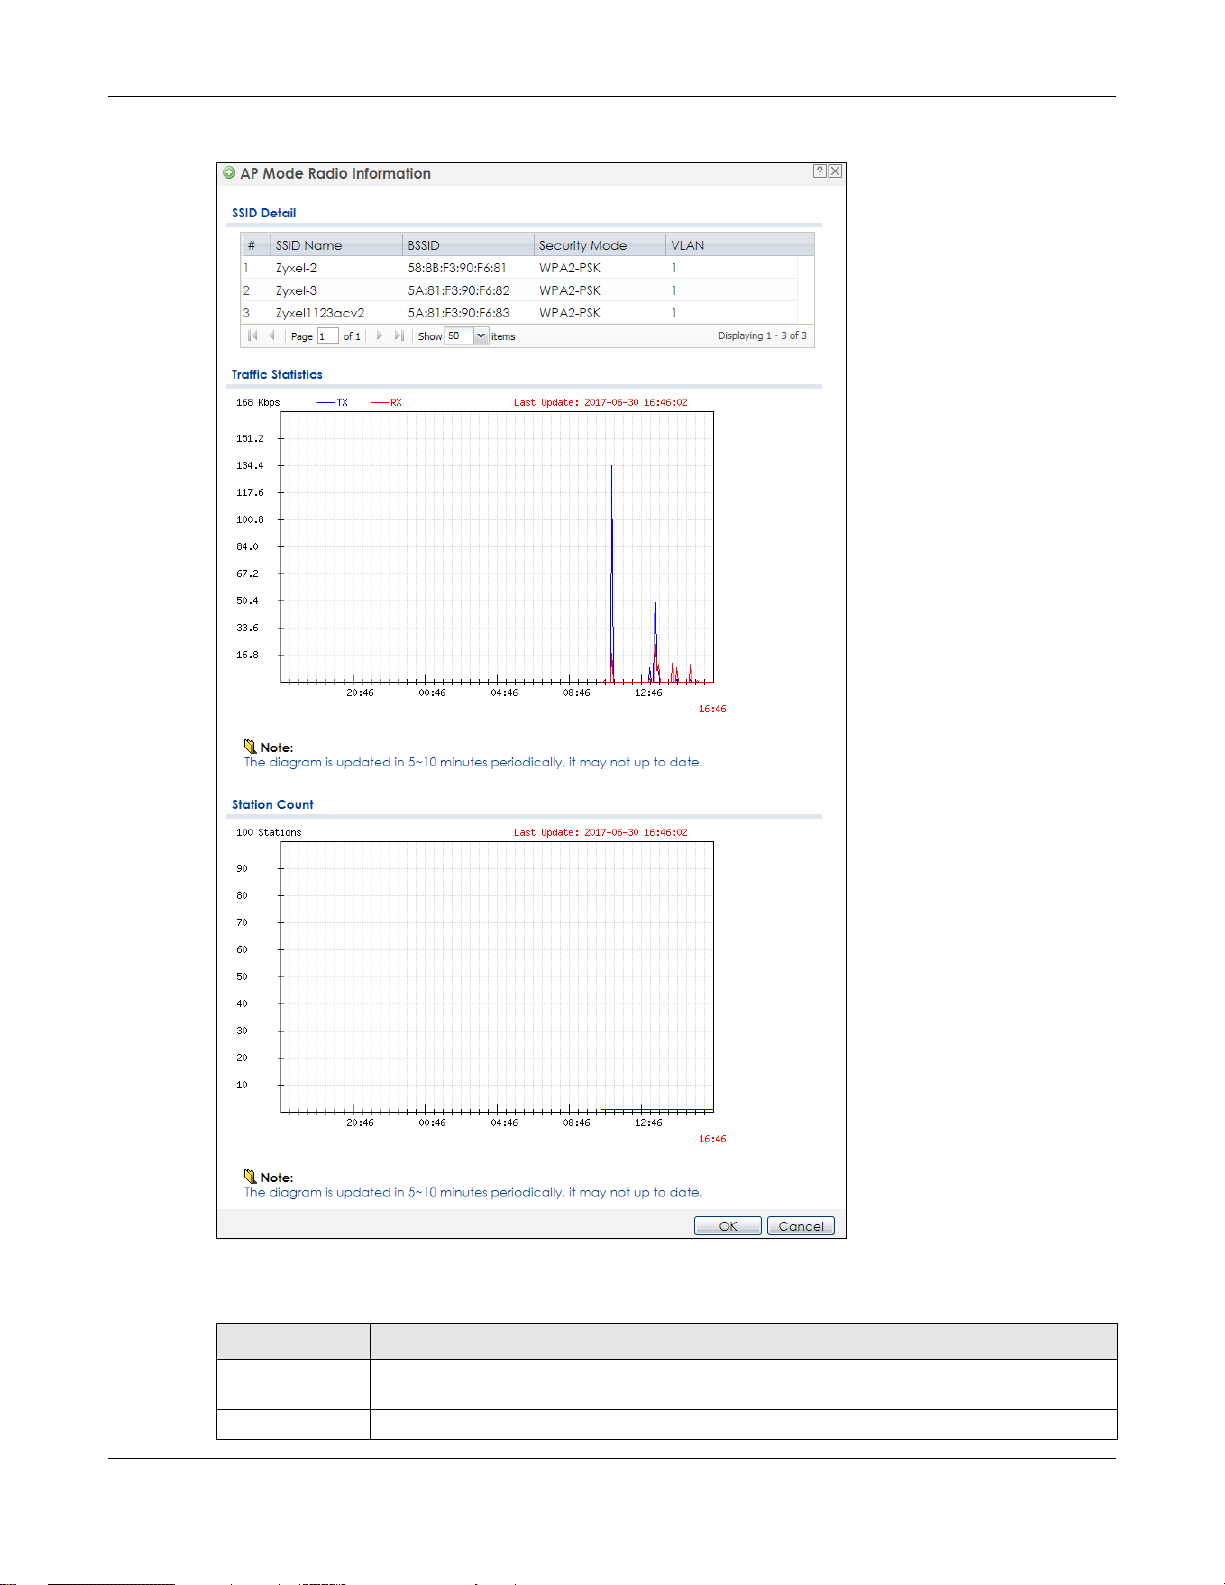
5.4.1 AP Mode Radio Information
This screen allows you to view a selected radio’s SSID details, wireless traffic statistics and station count
for the preceding 24 hours. To access this window, select a radio and click the More Information button
in the Radio List screen.
NWA / WAC Series User’s Guide
65
Chapter 5 Monitor
Figure 35 Monitor > Wireless > AP Information > Radio List > More Information
The following table describes the labels in this screen.
Table 29 Monitor > Wireless > AP Information > Radio List > More Information
LABEL DESCRIPTION
SSID Detail This list shows information about all the wireless clients that have connected to the specified
# This is the items sequential number in the list. It has no bearing on the actual data in this list.
radio over the preceding 24 hours.
NWA / WAC Series User’s Guide
66
Chapter 5 Monitor
Table 29 Monitor > Wireless > AP Information > Radio List > More Information (continued)
LABEL DESCRIPTION
SSID Name This displays an SSID associated with this radio. There can be up to eight maximum.
BSSID This displays a BSSID associated with this radio. The BSSID is tied to the SSID.
Security
Mode
VLAN This displays the VLAN ID associated with the SSID.
Traffic Statistics This graph displays the overall traffic information of the radio over the preceding 24 hours.
Kbps/Mbps This y-axis represents the amount of data moved across this radio in megabytes per second.
Time This x-axis represents the amount of time over which the data moved across this radio.
Station Count This graph displays the connected station information of the radio over the preceding 24 hours
Stations The y-axis represents the number of connected stations.
Time The x-axis shows the time period over which a station was connected.
Last Update This field displays the date and time the information in the window was last updated.
OK Click this to close this window.
Cancel Click this to close this window.
This displays the security mode in which the SSID is operating.
5.5 Station List
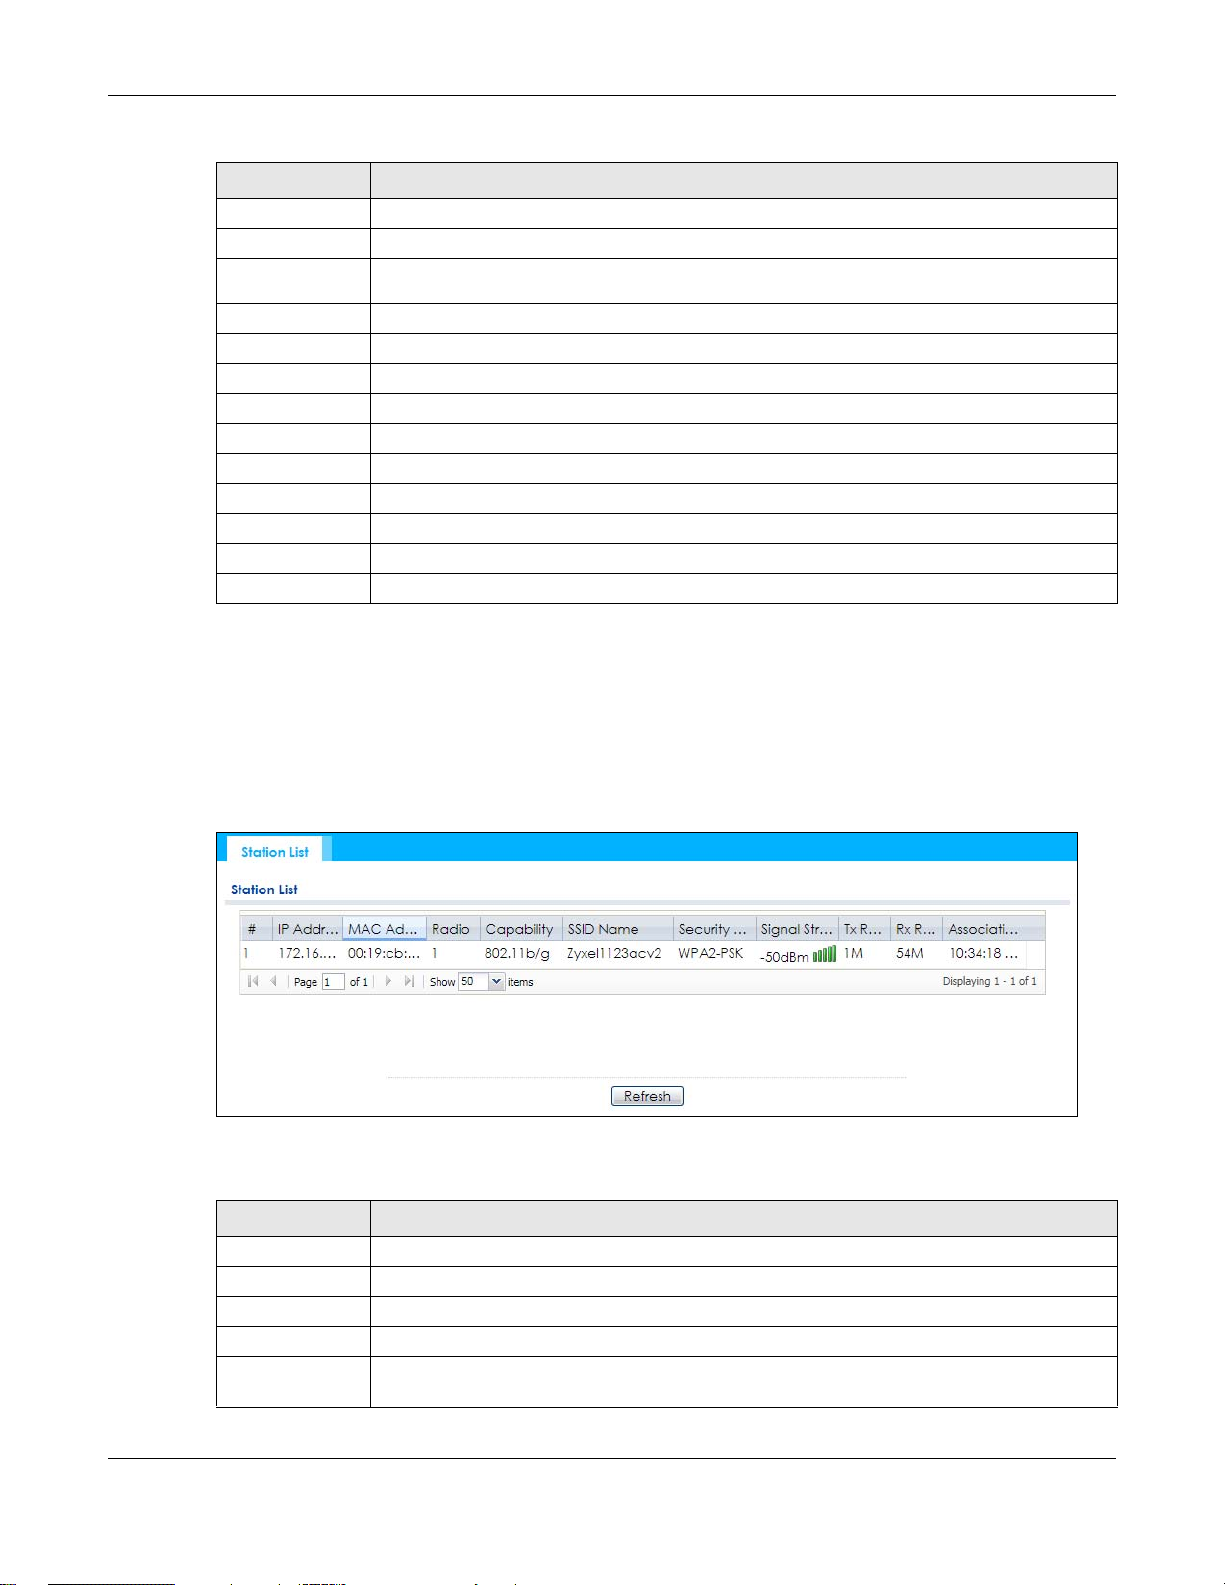
Use this screen to view statistics pertaining to the associated stations (or “wireless clients”). Click Monitor
> Wireless > Station Info to access this screen.
Figure 36 Monitor > Wireless > Station Info
The following table describes the labels in this screen.
Table 30 Monitor > Wireless > Station Info
LABEL DESCRIPTION
# This is the station’s index number in this list.
IP Address This is the station’s IP address.
MAC Address This is the station’s MAC address.
Radio This is the radio number on the NWA/WAC to which the station is connected.
Capability This displays the supported standard currently being used by the station or the standards
supported by the station.
NWA / WAC Series User’s Guide
67
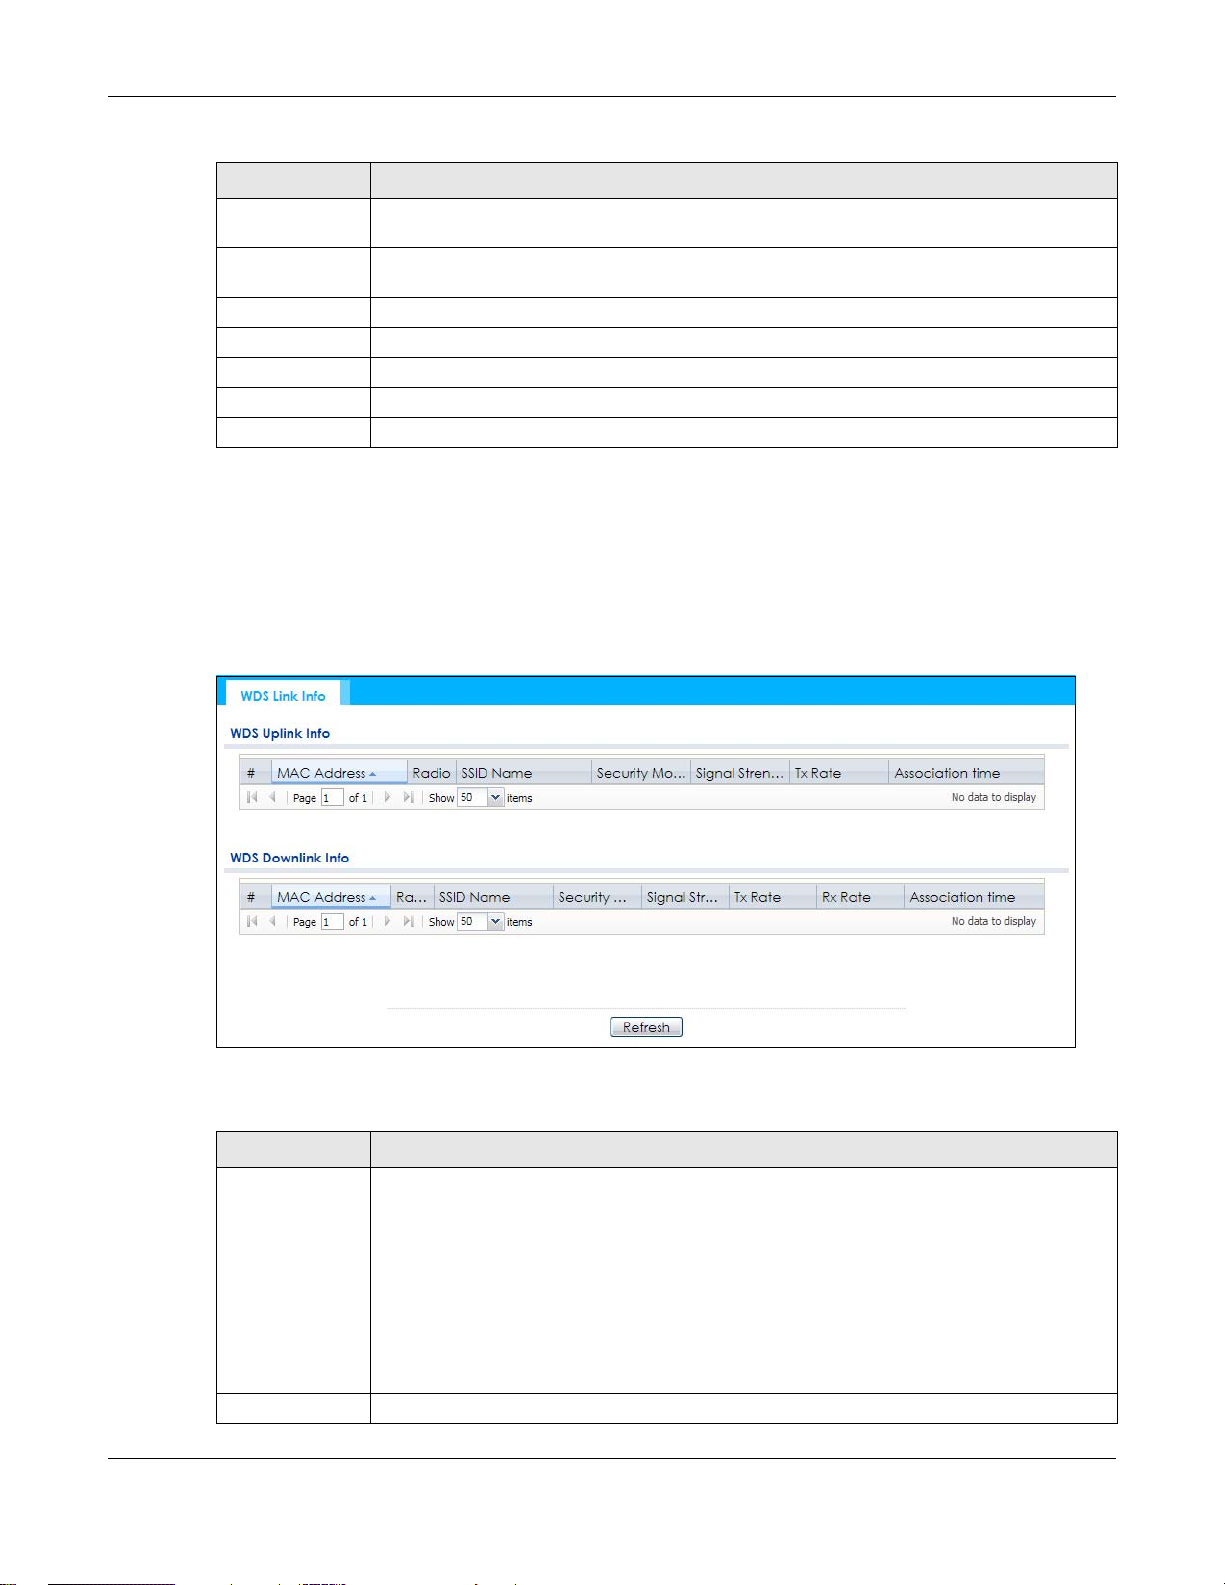
Table 30 Monitor > Wireless > Station Info (continued)
LABEL DESCRIPTION
SSID Name This indicates the name of the wireless network to which the station is connected. A single AP
can have multiple SSIDs or networks.
Security Mode This indicates which secure encryption methods is being used by the station to connect to the
network.
Signal Strength This is the RSSI (Received Signal Strength Indicator) of the station’s wireless connection.
Tx Rate This is the maximum transmission rate of the station.
Rx Rate This is the maximum reception rate of the station.
Association Time This displays the time the station first associated with the NWA/WAC’s wireless network.
Refresh Click this to refresh the items displayed on this page.
5.6 WDS Link Info
Use this screen to view the WDS traffic statistics between the NWA/WAC and a root AP or repeaters.
Click Monitor > Wireless > WDS Link Info to access this screen.
Chapter 5 Monitor
Figure 37 Monitor > Wireless > WDS Link Info
The following table describes the labels in this screen.
Table 31 Monitor > Wireless > WDS Link Info
LABEL DESCRIPTION
WDS Uplink Info
WDS Downlink
Info
# This is the index number of the root AP or repeater in this list.
Uplink refers to the WDS link from the repeaters to the root AP.
Downlink refers to the WDS link from the root AP to the repeaters.
When the NWA/WAC is in root AP mode and connected to a repeater, only the downlink
information is displayed.
When the NWA/WAC is in repeater mode and connected to a root AP directly or via another
repeater, the uplink information is displayed.
When the NWA/WAC is in repeater mode and connected to a root AP and other repeater(s),
both the uplink and downlink information would be displayed.
NWA / WAC Series User’s Guide
68

Chapter 5 Monitor
Table 31 Monitor > Wireless > WDS Link Info (continued)
LABEL DESCRIPTION
MAC Address This is the MAC address of the root AP or repeater to which the NWA/WAC is connected using
WDS.
Radio This is the radio number on the root AP or repeater to which the NWA/WAC is connected using
WDS.
SSID Name This indicates the name of the wireless network to which the NWA/WAC is connected using
Security Mode This indicates which secure encryption methods is being used by the NWA/WAC to connect to
Signal Strength This is the RSSI (Received Signal Strength Indicator) of the wireless connection in WDS.
Tx Rate This is the maximum transmission rate of the root AP or repeater to which the NWA/WAC is
Rx Rate This is the maximum reception rate of the root AP or repeater to which the NWA/WAC is
Association Time This displays the time the NWA/WAC first associated with the wireless network using WDS.
Refresh Click this to refresh the items displayed on this page.
WDS.
the root AP or repeater using WDS.
connected using WDS.
connected using WDS.
5.7 Detected Device
Use this screen to view information about suspected rogue APs. Click Monitor > Wireless > Detected
Device to access this screen. Not all NWA/WACs support monitor mode.
Note: If the NWA/WAC supports monitor mode, the radio or at least one of the NWA/WAC’s
radio must be set to monitor mode (in the Wireless > AP Management screen) in order
to detect other wireless devices in its vicinity.
If the NWA/WAC doesn’t support monitor mode, turn on rogue AP detection in the
Configuration > Wireless > Rogue AP screen to detect rogue APs.
NWA / WAC Series User’s Guide
69
Chapter 5 Monitor
Figure 38 Monitor > Wireless > Detected Device (for NWA/WAC that supports Monitor mode)
NWA / WAC Series User’s Guide
70
Chapter 5 Monitor
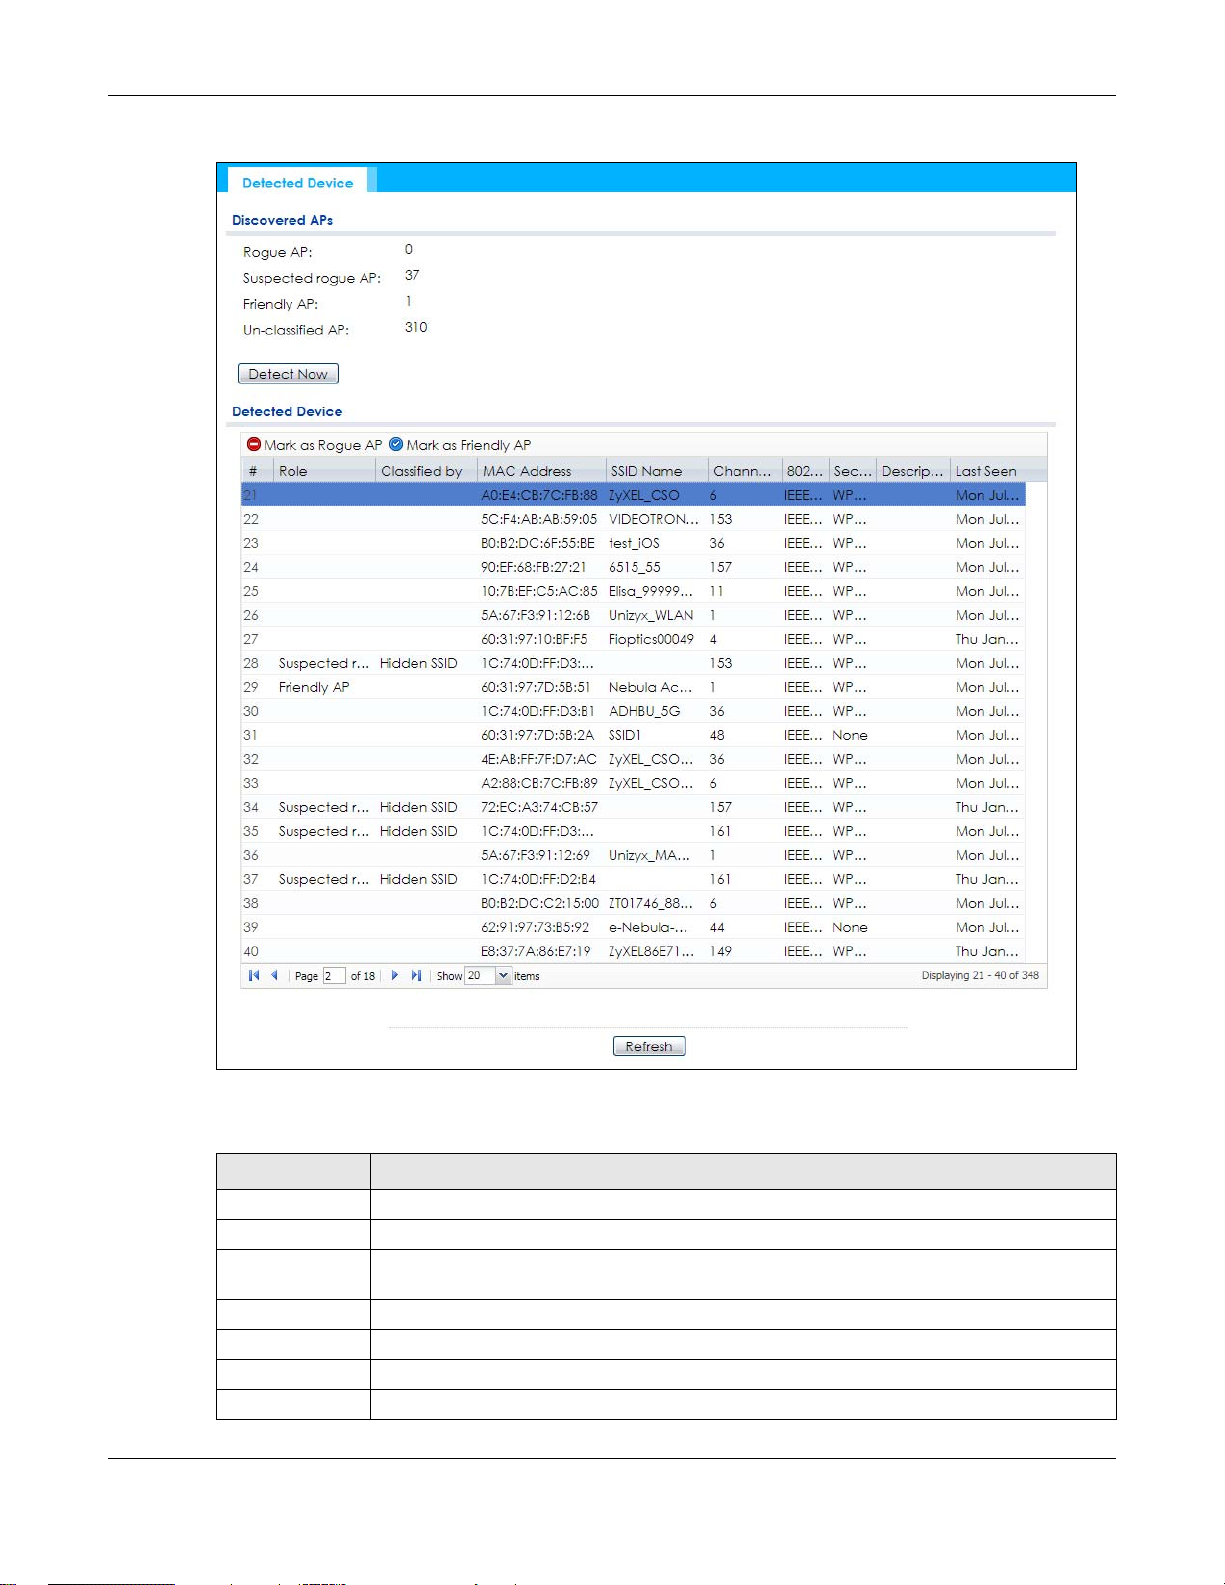
Figure 39 Monitor > Wireless > Detected Device (for NWA/WAC that doesn’t support Monitor mode)
The following table describes the labels in this screen.
Table 32 Monitor > Wireless > Detected Device
LABEL DESCRIPTION
Discovered APs
Rogue AP This shows how many devices are detected as rogue APs.
Suspected rogue APThis shows how many devices are detected as possible rogue APs by classification rule.
Friendly AP This shows how many devices are detected as friendly APs.
Un-classified AP This shows how many devices are detected, but have not been classified by the NWA/WAC.
Detect Now Click this button for the NWA/WAC to scan for APs in the network.
Detected Device
NWA / WAC Series User’s Guide
71

Chapter 5 Monitor
Table 32 Monitor > Wireless > Detected Device (continued)
LABEL DESCRIPTION
Mark as Rogue APClick this button to mark the selected AP as a rogue AP. A rogue AP can be contained in the
Configuration > Wireless > Rogue AP screen (Section 7.3 on page 88).
Mark as Friendly APClick this button to mark the selected AP as a friendly AP. For more on managing friendly APs,
see the Configuration > Wireless > Rogue AP screen (Section 7.3 on page 88).
# This is the detected device’s index number in this list.
Status This indicates the detected device’s status.
Device This indicates the type of device detected.
Role This indicates the detected device’s role (such as friendly or rogue).
Classified by This indicates the detected device’s classification rule.
MAC Address This indicates the detected device’s MAC address.
SSID Name This indicates the detected device’s SSID.
Channel ID This indicates the detected device’s channel ID.
802.11 Mode This indicates the 802.11 mode (a/b/g/n) transmitted by the detected device.
Security This indicates the encryption method (if any) used by the detected device.
Description This displays the detected device’s description. For more on managing friendly and rogue APs,
Last Seen This indicates the last time the device was detected by the NWA/WAC.
Refresh Click this to refresh the items displayed on this page.
see the Configuration > Wireless > Rogue AP screen (Section 7.3 on page 88).
5.8 View Log
Log messages are stored in two separate logs, one for regular log messages and one for debugging
messages. In the regular log, you can look at all the log messages by selecting All Logs, or you can
select a specific category of log messages (for example, user). You can also look at the debugging log
by selecting Debug Log. All debugging messages have the same priority.
To access this screen, click Monitor > Log. The log is displayed in the following screen.
Note: When a log reaches the maximum number of log messages, new log messages
automatically overwrite existing log messages, starting with the oldest existing log
message first.
Events that generate an alert (as well as a log message) display in red. Regular logs display in black.
Click a column’s heading cell to sort the table entries by that column’s criteria. Click the heading cell
again to reverse the sort order.
NWA / WAC Series User’s Guide
72
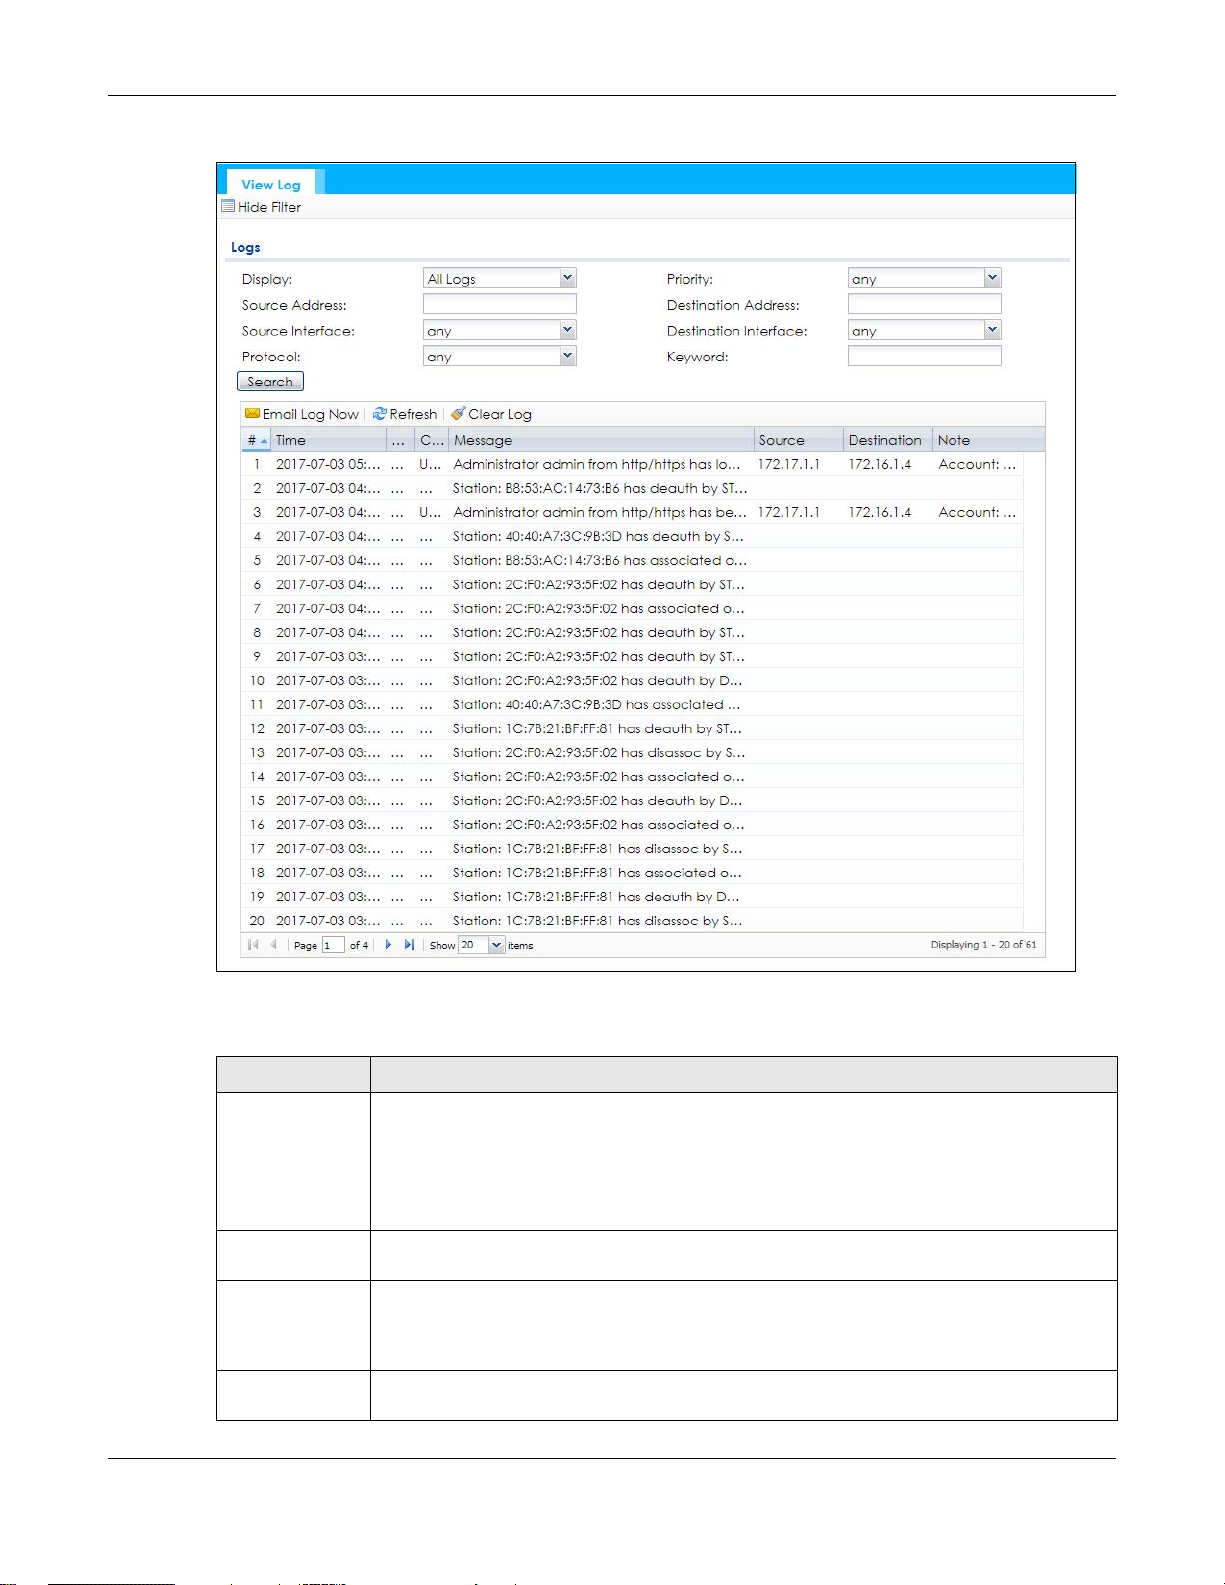
Figure 40 Monitor > Log > View Log
Chapter 5 Monitor
The following table describes the labels in this screen.
Table 33 Monitor > Log > View Log
LABEL DESCRIPTION
Show Filter / Hide
Filter
Display Select the category of log message(s) you want to view. You can also view All Logs at one
Priority This displays when you show the filter. Select the priority of log messages to display. The log
Source Address This displays when you show the filter. Type the source IP address of the incoming packet that
Click this button to show or hide the filter settings.
If the filter settings are hidden, the Display, Email Log Now, Refresh, and Clear Log fields are
available.
If the filter settings are shown, the Display, Priority, Source Address, Destination Address, Source
Interface, Destination Interface, Protocol, Keyword, and Search fields are available.
time, or you can view the Debug Log.
displays the log messages with this priority or higher. Choices are: any, emerg, alert, crit, error,
warn, notice, and info, from highest priority to lowest priority. This field is read-only if the
Category is Debug Log.
generated the log message. Do not include the port in this filter.
NWA / WAC Series User’s Guide
73

Chapter 5 Monitor
Table 33 Monitor > Log > View Log (continued)
LABEL DESCRIPTION
Destination
Address
Source Interface This displays when you show the filter. Select the source interface of the packet that generated
Destination
Interface
Protocol This displays when you show the filter. Select a service protocol whose log messages you would
Keyword This displays when you show the filter. Type a keyword to look for in the Message, Source,
Search This displays when you show the filter. Click this button to update the log using the current filter
Email Log Now Click this button to send log messages to the Active e-mail addresses specified in the Send Log
Refresh Click this to update the list of logs.
Clear Log Click this button to clear the whole log, regardless of what is currently displayed on the screen.
# This field is a sequential value, and it is not associated with a specific log message.
Time This field displays the time the log message was recorded.
Priority This field displays the priority of the log message. It has the same range of values as the Priority
Category This field displays the log that generated the log message. It is the same value used in the
Message This field displays the reason the log message was generated. The text “[count=x]”, where x is a
Source This field displays the source IP address and the port number in the event that generated the
Source Interface This field displays the source interface of the packet that generated the log message.
Destination This field displays the destination IP address and the port number of the event that generated
Destination
Interface
Protocol This field displays the service protocol in the event that generated the log message.
Note This field displays any additional information about the log message.
This displays when you show the filter. Type the IP address of the destination of the incoming
packet when the log message was generated. Do not include the port in this filter.
the log message.
This displays when you show the filter. Select the destination interface of the packet that
generated the log message.
like to see.
Destination and Note fields. If a match is found in any field, the log message is displayed. You
can use up to 63 alphanumeric characters and the underscore, as well as punctuation marks
()’ ,:;?! +-*/= #$% @ ; the period, double quotes, and brackets are not allowed.
settings.
To field on the Configuration > Log & Report > Log Settings screen.
field above.
Display and (other) Category fields.
number, appears at the end of the Message field if log consolidation is turned on and multiple
entries were aggregated to generate into this one.
log message.
the log message.
This field displays the destination interface of the packet that generated the log message.
The Web Configurator saves the filter settings if you leave the View Log screen and return to it later.
NWA / WAC Series User’s Guide
74
6.1 Overview
This chapter describes how you can configure the management IP address and VLAN settings of your
NWA/WAC.
The Internet Protocol (IP) address identifies a device on a network. Every networking device (including
computers, servers, routers, printers, etc.) needs an IP address to communicate across the network.
These networking devices are also known as hosts.
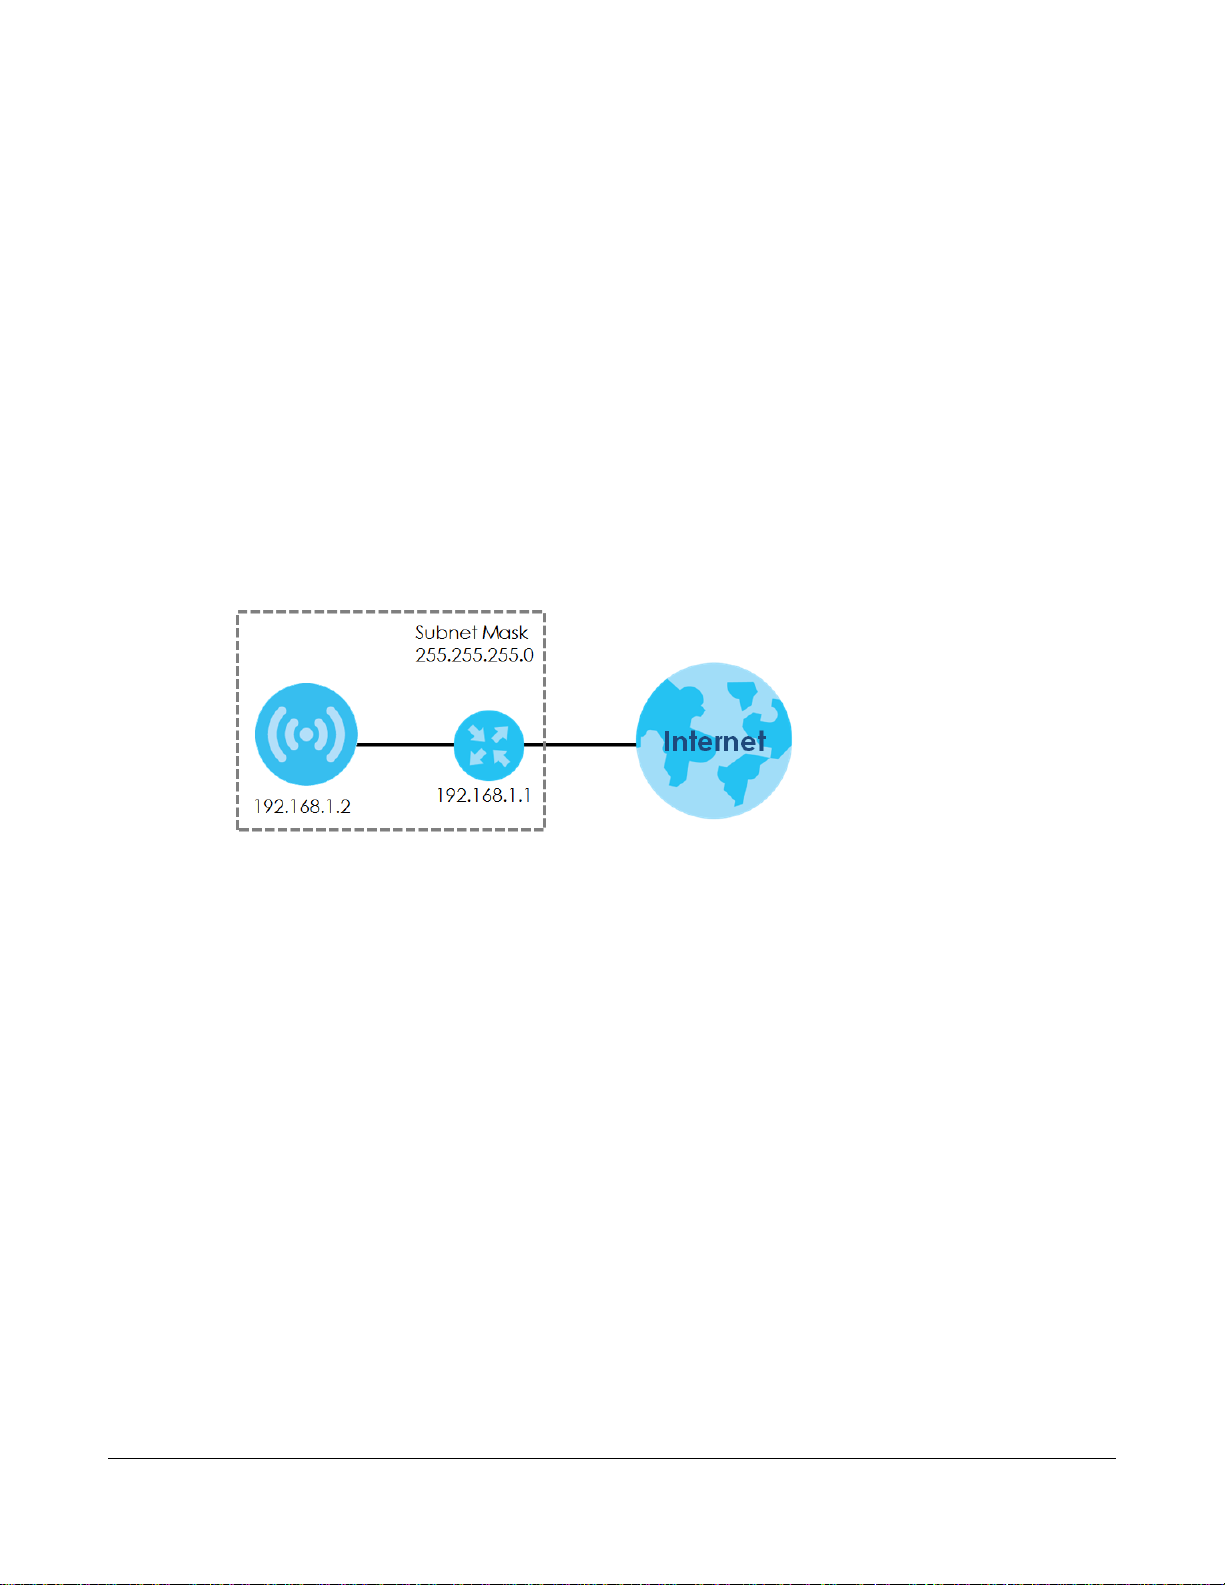
Figure 41 IP Setup
CHAPTER 6
Network
The figure above illustrates one possible setup of your NWA/WAC. The gateway IP address is 192.168.1.1
and the managed IP address of the NWA/WAC is 192.168.1.2 (default), but if the NWA/WAC is assigned
an IP address by a DHCP server, the default (192.168.1.2) will not be used. The gateway and the NWA/
WAC must belong in the same IP subnet to be able to communicate with each other.
6.1.1 Management Mode
This discusses using the NWA/WAC in management mode, which determines whether the NWA/WAC is
used in its standalone mode, or as part of a Control And Provisioning of Wireless Access Points (CAPWAP)
network.
About CAPWAP
The NWA/WAC supports CAPWAP. This is Zyxel’s implementation of the CAPWAP protocol (RFC 5415).
The CAPWAP data flow is protected by Datagram Transport Layer Security (DTLS).
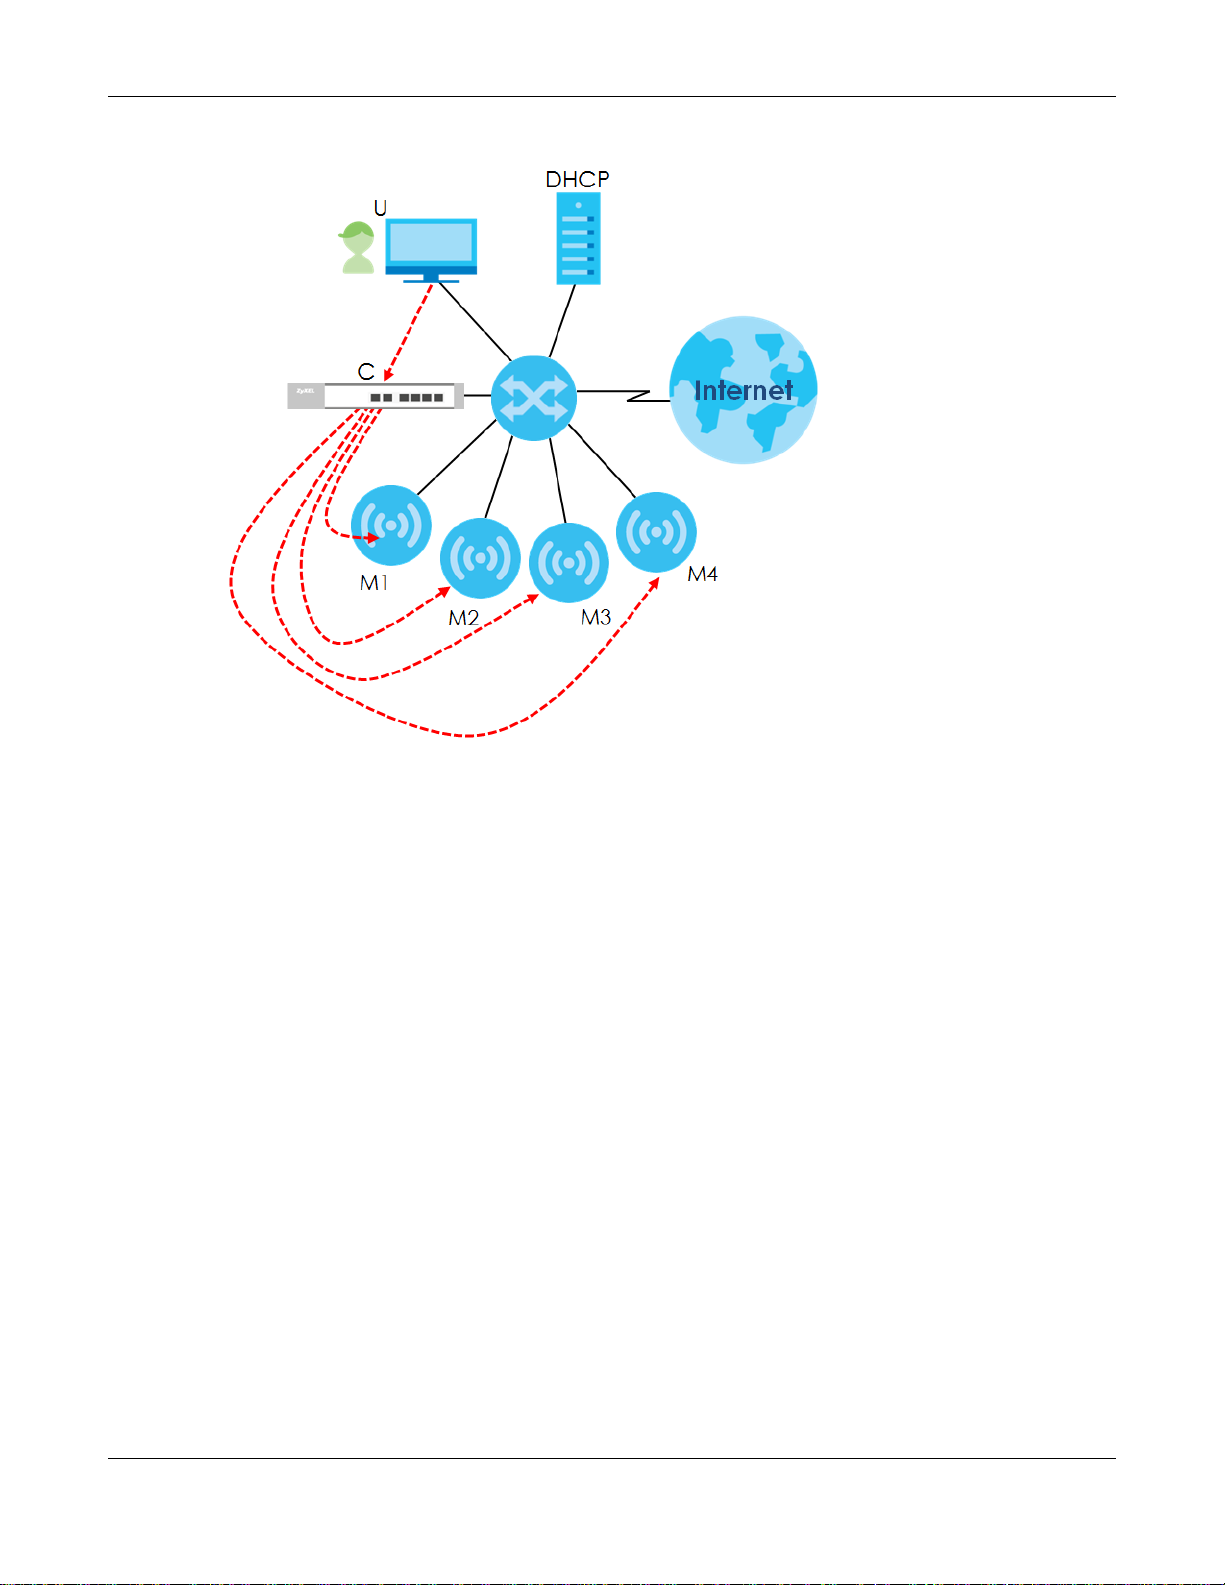
The following figure illustrates a CAPWAP wireless network. You (U) configure the AP controller (C), which
then automatically updates the configurations of the managed APs (M1 ~ M4).
NWA / WAC Series User’s Guide
75
Chapter 6 Network
Figure 42 CAPWAP Network Example
Note: The NWA/WAC can be a standalone AP (default), or a CAPWAP managed AP.
CAPWAP Discovery and Management
The link between CAPWAP-enabled access points proceeds as follows:
1 An AP in managed AP mode joins a wired network (receives a dynamic IP address).
2 The AP sends out a discovery request, looking for a CAPWAP AP controller.
3 If there is an AP controller on the network, it receives the discovery request. If the AP controller is in
Manual mode it adds the details of the AP to its Unmanaged Access Points list, and you decide which
available APs to manage. If the AP controller is in Always Accept mode, it automatically adds the AP to
its Managed Access Points list and provides the managed AP with default configuration information, as
well as securely transmitting the DTLS pre-shared key. The managed AP is ready for association with
wireless clients.
Managed AP Finds the Controller
A managed NWA/WAC can find the controller in one of the following ways:
• Manually specify the controller’s IP address in the Web Configurator’s AC (AP Controller) Discovery
screen.
• Get the controller’s IP address from a DHCP server with the controller’s IP address configured as
option 138.
• Get the controller’s IP address from a DNS server SRV (Service) record.
NWA / WAC Series User’s Guide
76
Chapter 6 Network
• Broadcasting to discover the controller within the broadcast domain.
Note: The AP controller needs to have a static IP address. If it is a DHCP client, set the DHCP
server to reserve an IP address for the AP controller.
CAPWAP and IP Subnets
By default, CAPWAP works only between devices with IP addresses in the same subnet.
However, you can configure CAPWAP to operate between devices with IP addresses in different
subnets by doing the following.
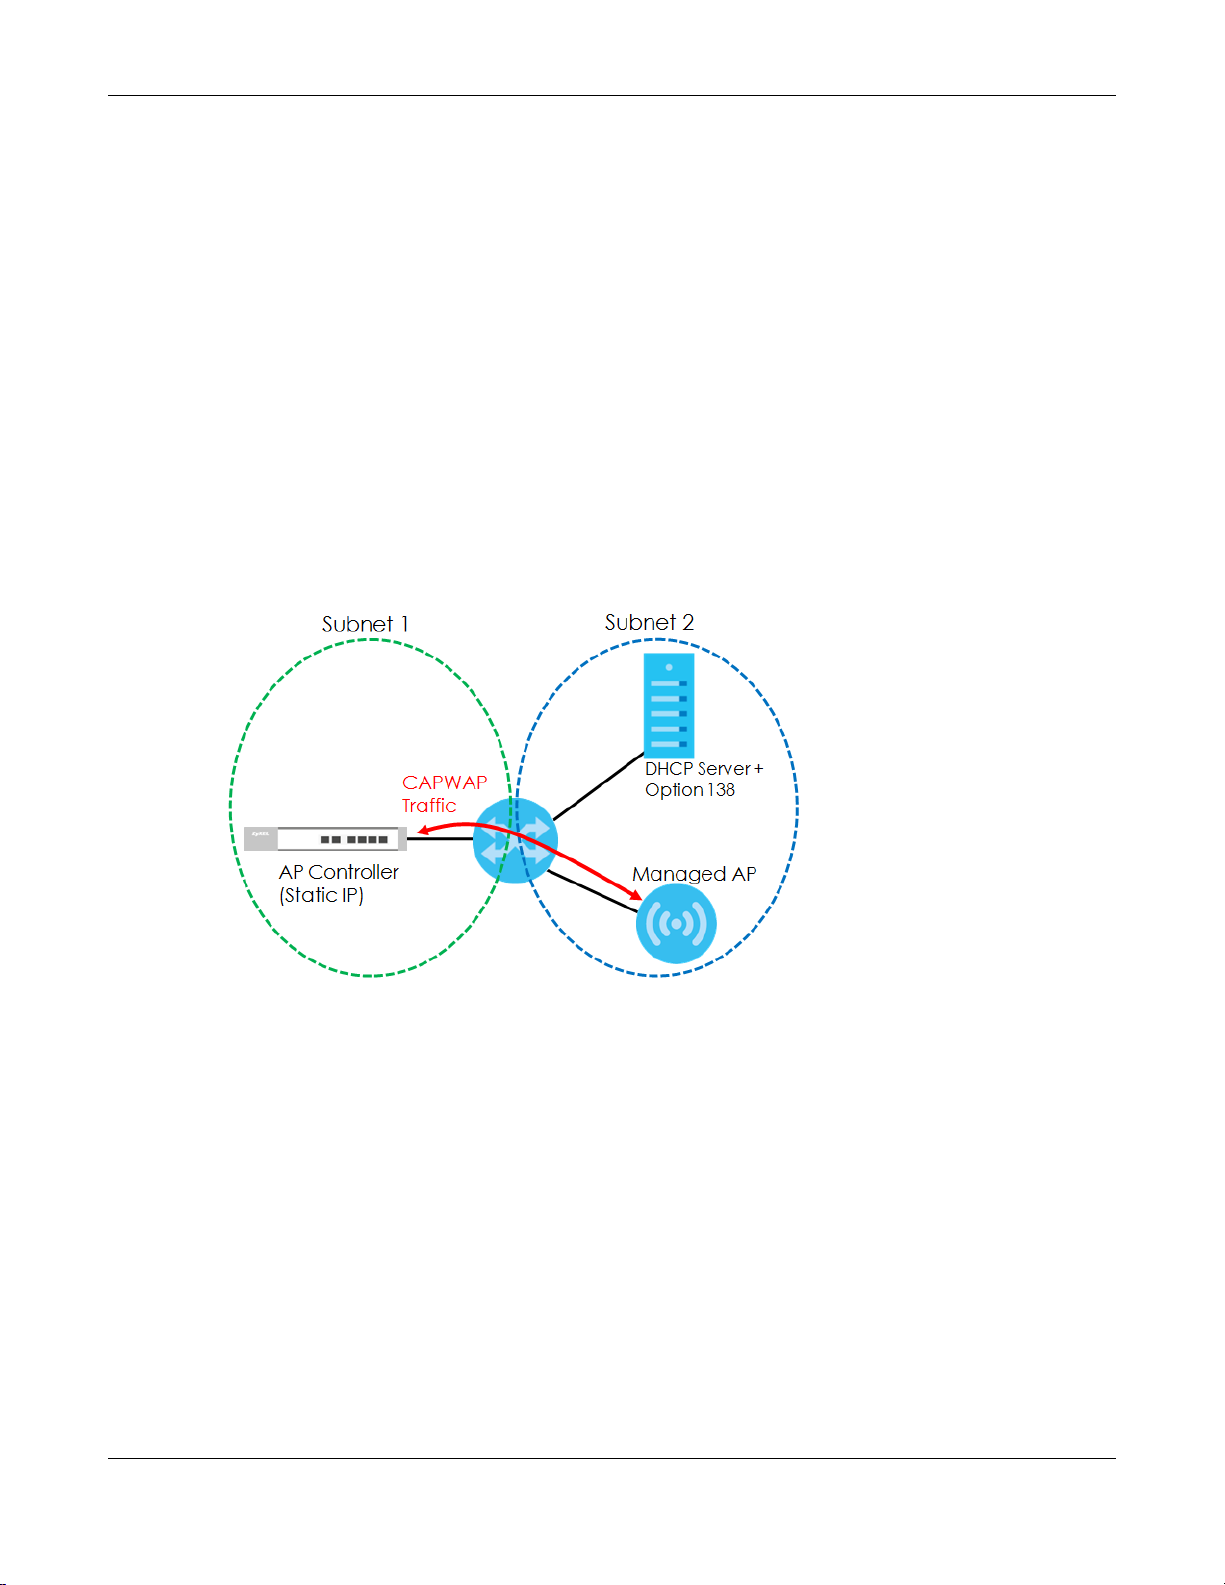
• Activate DHCP. Your network’s DHCP server must support option 138 defined in RFC 5415.
• Configure DHCP option 138 with the IP address of the CAPWAP AP controller on your network.
DHCP Option 138 allows the CAPWAP management request (from the AP in managed AP mode) to
reach the AP controller in a different subnet, as shown in the following figure.
Figure 43 CAPWAP and DHCP Option 138
Notes on CAPWAP
This section lists some additional features of Zyxel’s implementation of the CAPWAP protocol.
• When the AP controller uses its internal Remote Authentication Dial In User Service (RADIUS) server,
managed APs also use the AP controller’s authentication server to authenticate wireless clients.
• If a managed AP’s link to the AP controller is broken, the managed AP continues to use the wireless
settings with which it was last provided.
6.1.2 What You Can Do in this Chapter
• The IP Setting screen (Section 6.2 on page 78) configures the NWA/WAC’s LAN IP address.
• The VLAN screen (Section 6.3 on page 79) configures the NWA/WAC’s VLAN settings.
• The AC (AP Controller) Discovery screen (Section 6.3 on page 79) configures the NWA/WAC’s AP
Controller settings.
NWA / WAC Series User’s Guide
77
6.2 IP Setting
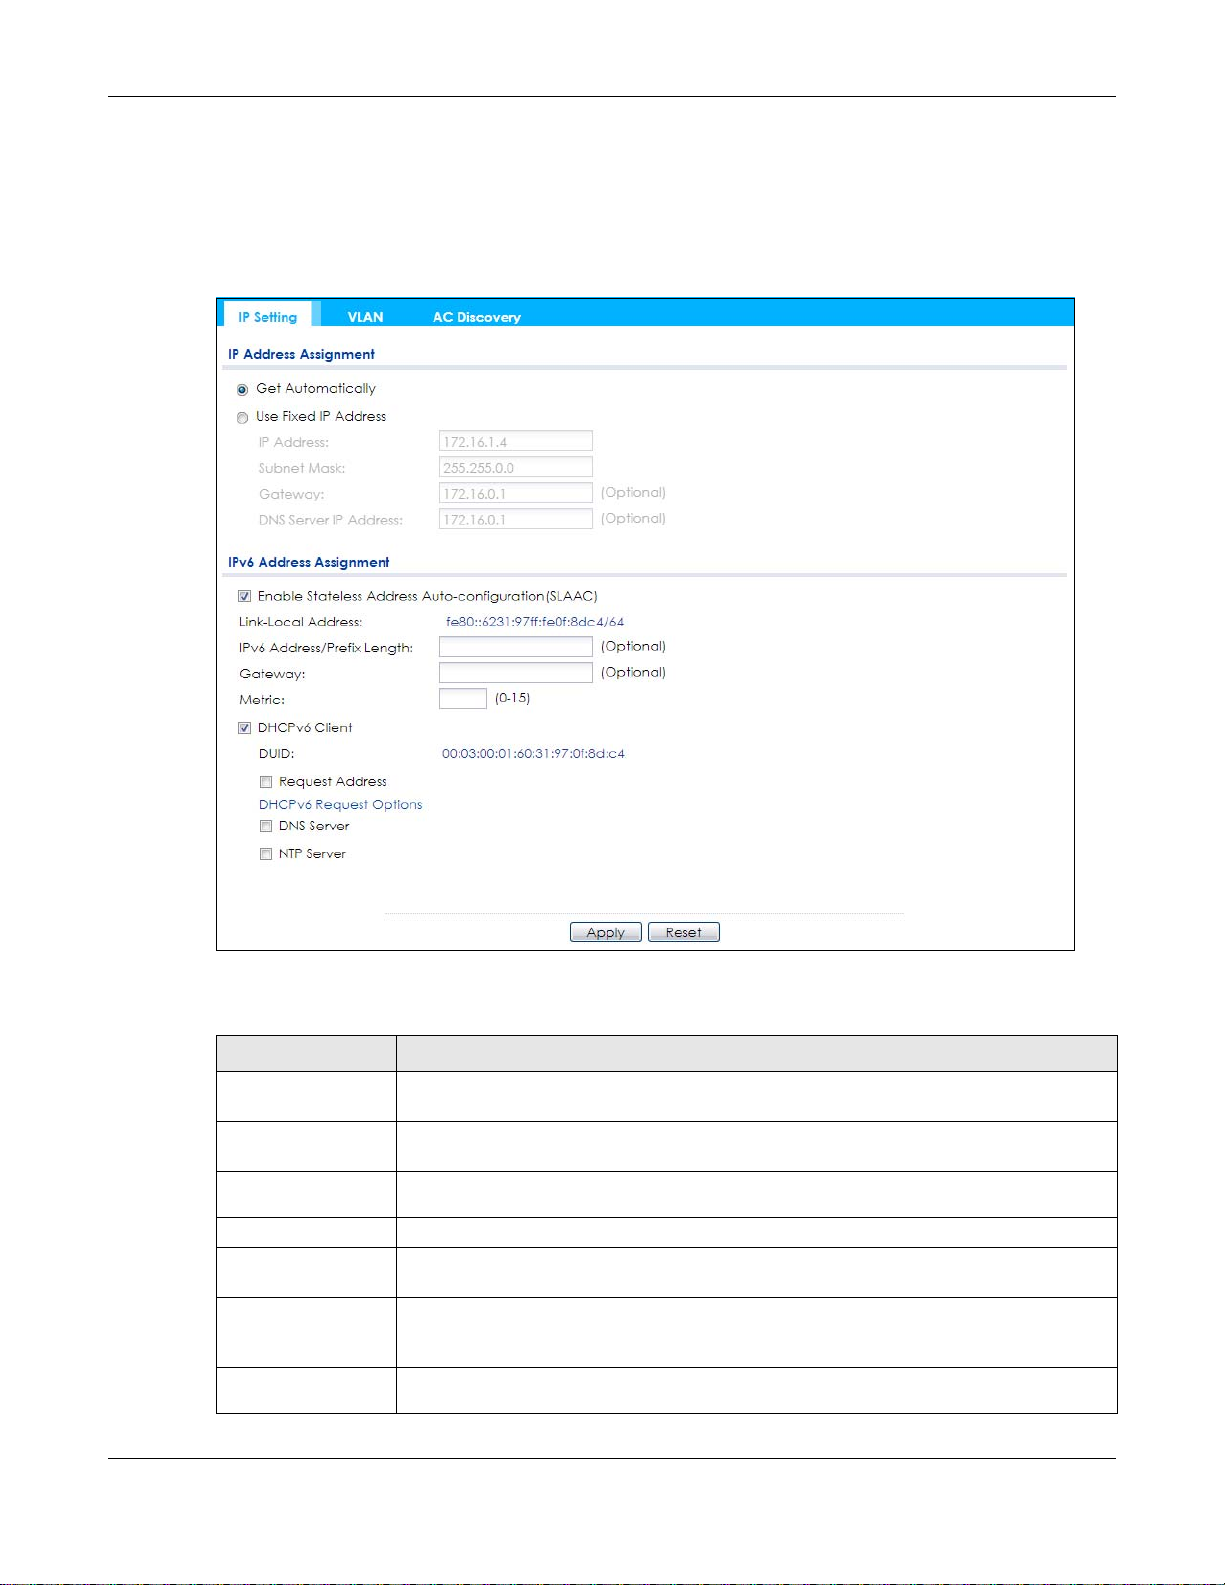
Use this screen to configure the IP address for your NWA/WAC. To access this screen, click Configuration
> Network > IP Setting.
Figure 44 Configuration > Network > IP Setting
Chapter 6 Network
Each field is described in the following table.
Table 34 Configuration > Network > IP Setting
LABEL DESCRIPTION
IP Address
Assignment
Get
Automatically
Use Fixed IP
Address
IP Address Enter the IP address for this interface.
Subnet Mask Enter the subnet mask of this interface in dot decimal notation. The subnet mask indicates
Gateway Enter the IP address of the gateway. The NWA/WAC sends packets to the gateway when it
DNS Server IP
Address
Select this to make the interface a DHCP client and automatically get the IP address,
subnet mask, and gateway address from a DHCP server.
Select this if you want to specify the IP address, subnet mask, and gateway manually.
what part of the IP address is the same for all computers in the network.
does not know how to route the packet to its destination. The gateway should be on the
same network as the interface.
Enter the IP address of the DNS server.
NWA / WAC Series User’s Guide
78

Chapter 6 Network
Table 34 Configuration > Network > IP Setting (continued)
LABEL DESCRIPTION
IPv6 Address
Assignment
Enable Stateless
Address Autoconfiguration
(SLAAC)
Link-Local
Address
IPv6 Address/
Prefix Length
Gateway Enter the IPv6 address of the default outgoing gateway using colon (:) hexadecimal
Metric Enter the priority of the gateway (if any) on the LAN interface. The NWA/WAC decides
DHCPv6 Client Select this option to set the NWA/WAC to act as a DHCPv6 client.
DUID This field displays the DHCP Unique IDentifier (DUID) of the NWA/WAC, which is unique and
Request Address Select this option to get an IPv6 address from the DHCPv6 server.
DHCPv6 Request
Options
DNS Server Select this option to obtain the IP address of the DNS server.
NTP Server Select this option to obtain the IP address of the NTP server.
Apply Click Apply to save your changes back to the NWA/WAC.
Reset Click Reset to return the screen to its last-saved settings.
Select this to enable IPv6 stateless auto-configuration on the NWA/WAC. The NWA/WAC will
generate an IPv6 address itself from a prefix obtained from an IPv6 router in the network.
This displays the IPv6 link-local address and the network prefix that the NWA/WAC
generates itself for the LAN interface.
Enter the IPv6 address and the prefix length for the LAN interface if you want to use a static
IP address. This field is optional.
The prefix length indicates what the left-most part of the IP address is the same for all
computers in the network, that is, the network address.
notation.
which gateway to use based on this priority. The lower the number, the higher the priority. If
two or more gateways have the same priority, the NWA/WAC uses the one that was
configured first. Enter zero to set the metric to 1024 for IPv6.
used for identification purposes when the NWA/WAC is exchanging DHCPv6 messages with
others. See Appendix B on page 227 for more information.
Select this option to determine what additional information to get from the DHCPv6 server.
6.3 VLAN
This section discusses how to configure the NWA/WAC’s VLAN settings.
NWA / WAC Series User’s Guide
79
Chapter 6 Network
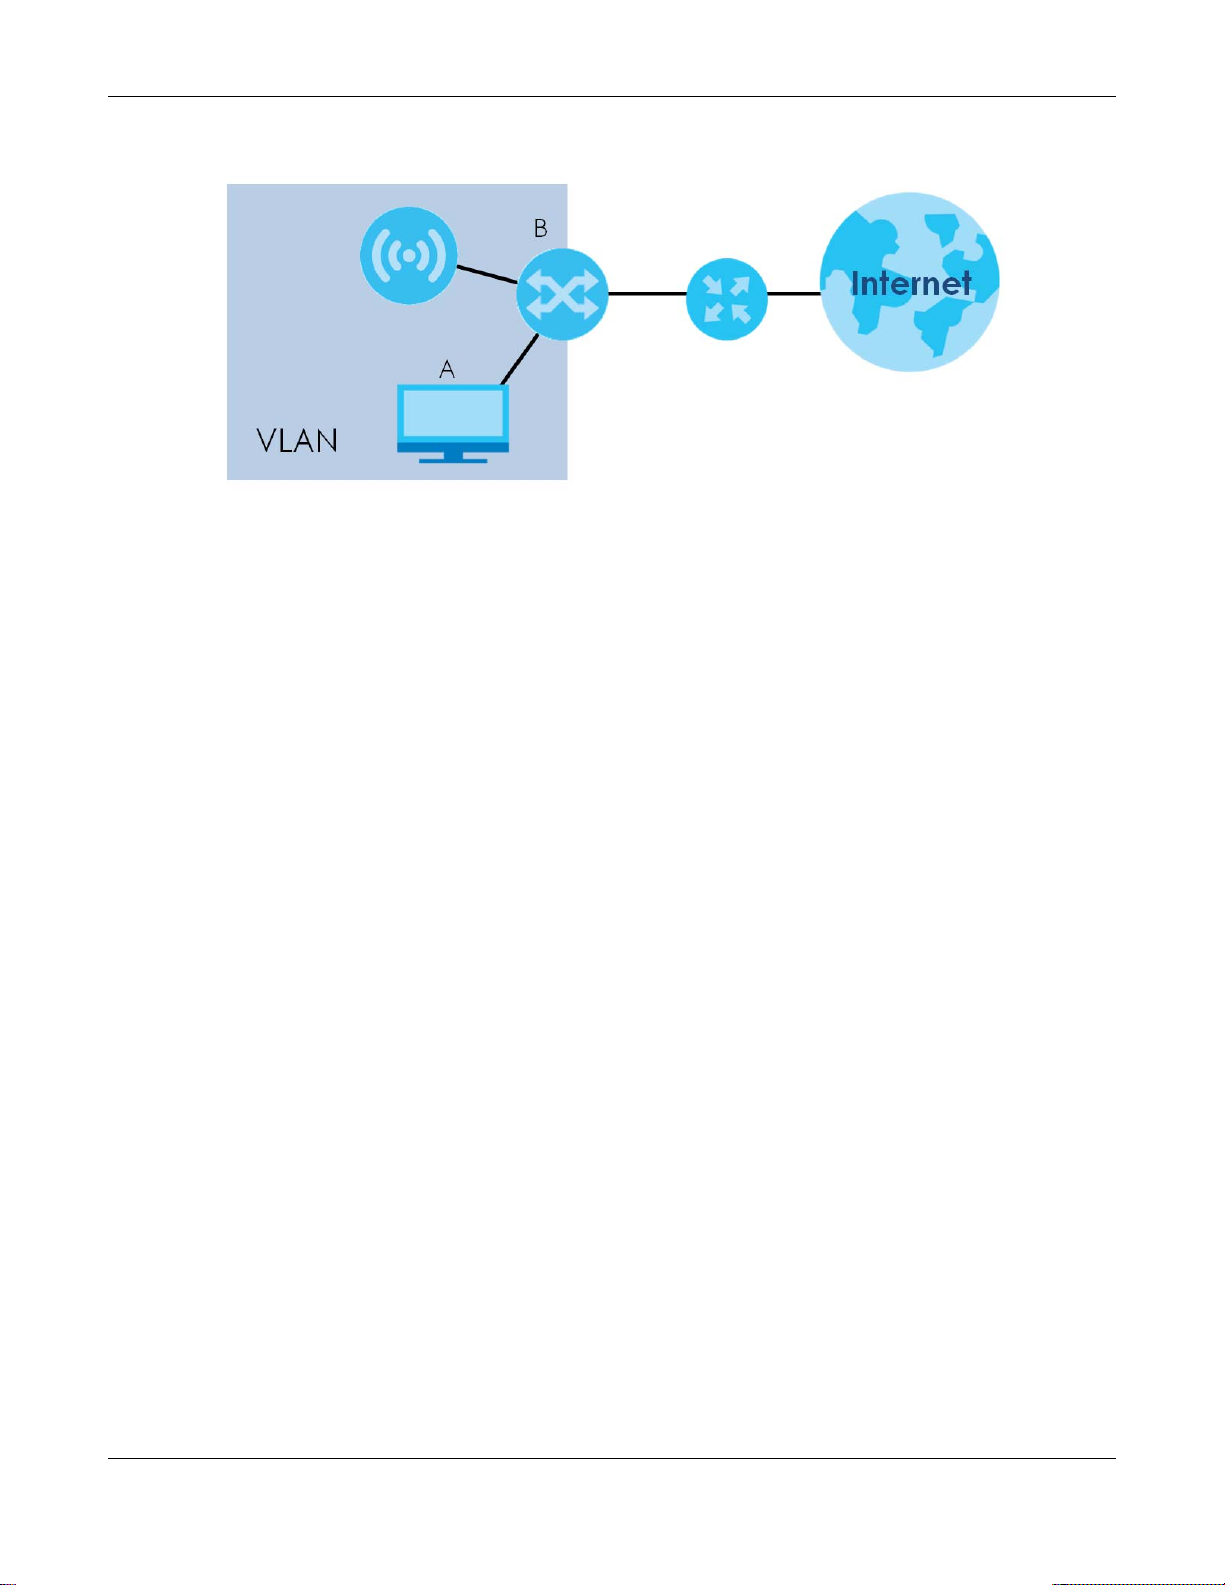
Figure 45 Management VLAN Setup
In the figure above, to access and manage the NWA/WAC from computer A, the NWA/WAC and
switch B’s ports to which computer A and the NWA/WAC are connected should be in the same VLAN.
A Virtual Local Area Network (VLAN) allows a physical network to be partitioned into multiple logical
networks. Devices on a logical network belong to one group. A device can belong to more than one
group. With VLAN, a device cannot directly talk to or hear from devices that are not in the same
group(s); the traffic must first go through a router.
VLAN also increases network performance by limiting broadcasts to a smaller and more manageable
logical broadcast domain. In traditional switched environments, all broadcast packets go to each and
every individual port. With VLAN, all broadcasts are confined to a specific broadcast domain.
IEEE 802.1Q Tag
The IEEE 802.1Q standard defines an explicit VLAN tag in the MAC header to identify the VLAN
membership of a frame across bridges. A VLAN tag includes the 12-bit VLAN ID and 3-bit user priority.
The VLAN ID associates a frame with a specific VLAN and provides the information that devices need to
process the frame across the network.
Use this screen to configure the VLAN settings for your NWA/WAC. To access this screen, click
Configuration > Network > VLAN.
The screen varies depending on whether the NWA/WAC has an extra Ethernet port (except the uplink
port).
NWA / WAC Series User’s Guide
80
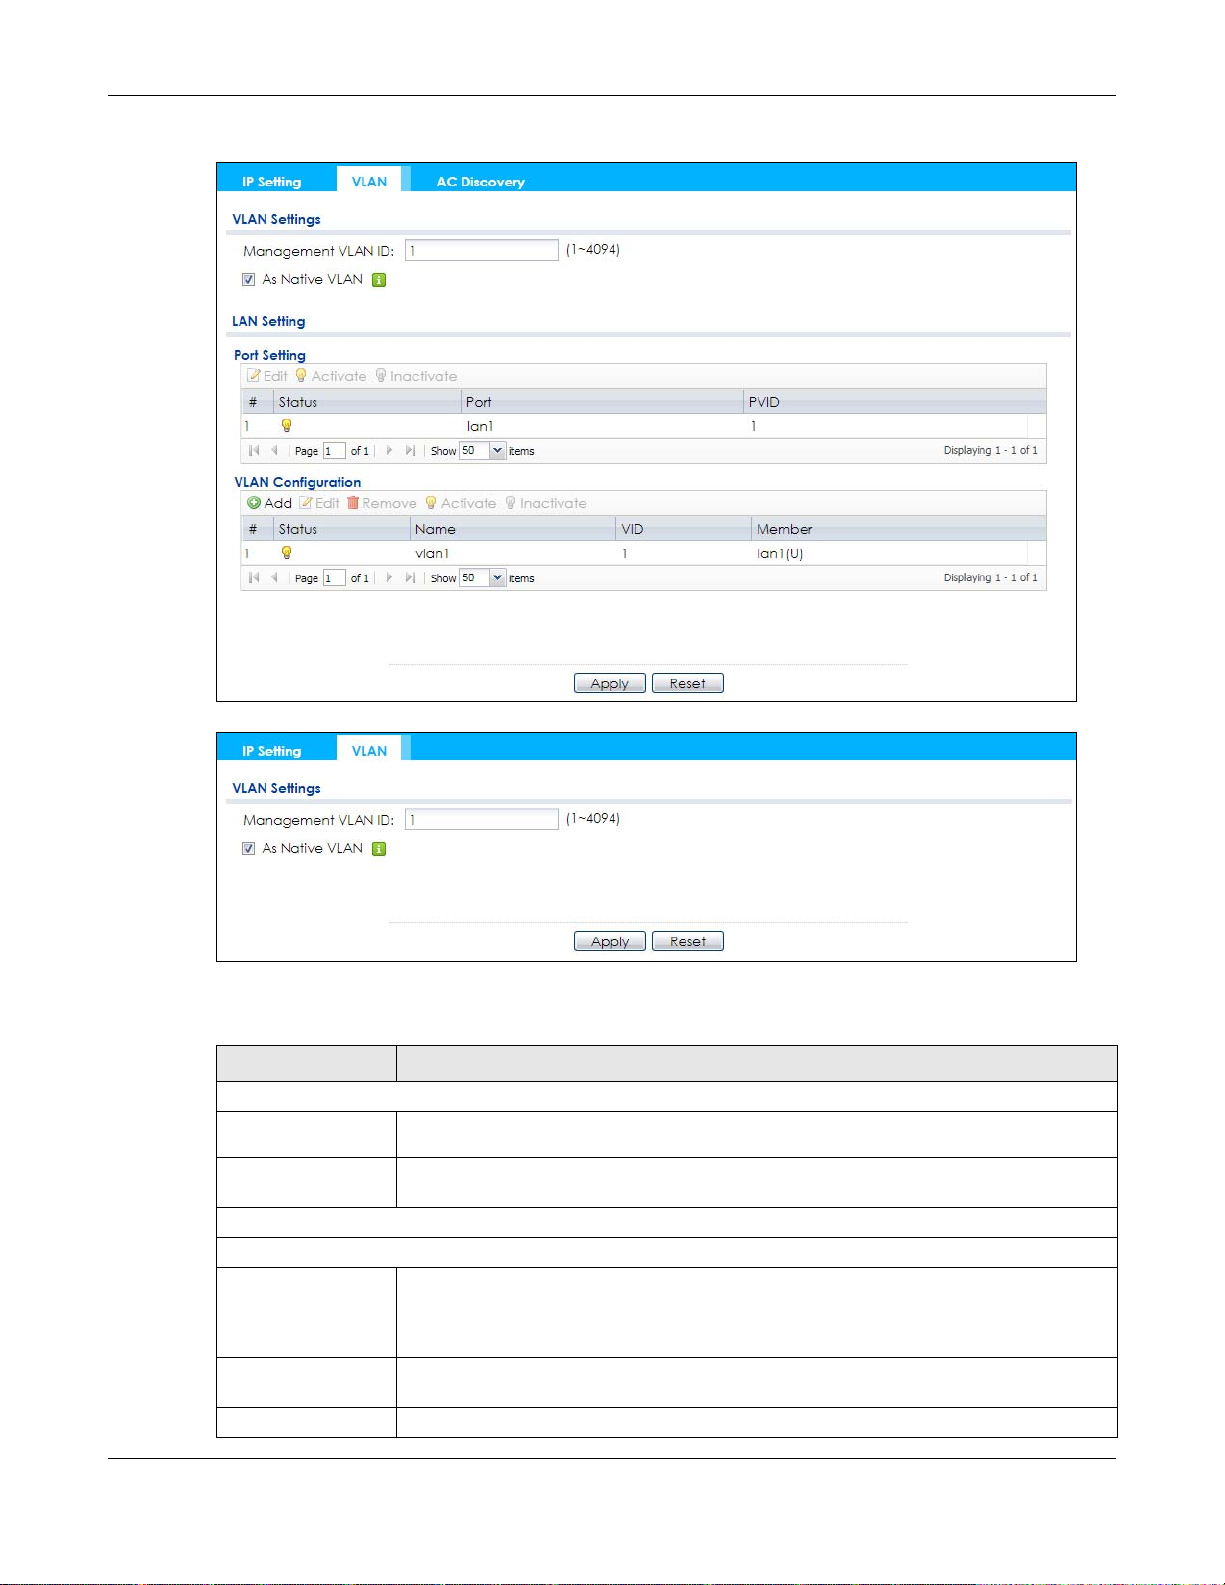
Chapter 6 Network
Figure 46 Configuration > Network > VLAN (for NWA/WAC with multiple Ethernet ports)
Figure 47 Configuration > Network > VLAN (for NWA/WAC with one Ethernet port)
Each field is described in the following table.
Table 35 Configuration > Network > VLAN
LABEL DESCRIPTION
VLAN Settings
Management
VLAN ID
As Native VLAN Select this option to treat this VLAN ID as a VLAN created on the NWA/WAC and not one
LAN Setting
Port Setting
Edit Double-click an entry or select it and click Edit to open a screen where you can modify the
Activate/
Inactivate
# This is the index number of the port.
Enter a VLAN ID for the NWA/WAC.
assigned to it from outside the network.
entry’s settings. In some tables you can just click a table entry and edit it directly in the
table. For those types of tables small red triangles display for table entries with changes that
you have not yet applied.
To turn on an entry, select it and click Activate. To turn off an entry, select it and click
Inactivate.
NWA / WAC Series User’s Guide
81

Chapter 6 Network
Table 35 Configuration > Network > VLAN (continued)
LABEL DESCRIPTION
Status This field indicates whether the port is enabled (a yellow bulb) or not (a gray bulb).
Port This field displays the name of the port.
PVID This field displays the port number of the VLAN ID.
VLAN Configuration
Add Click this to create a new entry. For features where the entry’s position in the numbered list is
important (features where the NWA/WAC applies the table’s entries in order like the SSID for
example), you can select an entry and click Add to create a new entry after the selected
entry.
Edit Double-click an entry or select it and click Edit to open a screen where you can modify the
entry’s settings. In some tables you can just click a table entry and edit it directly in the
table. For those types of tables small red triangles display for table entries with changes that
you have not yet applied.
Remove To remove an entry, select it and click Remove. The NWA/WAC confirms you want to
remove it before doing so.
Activate/
Inactivate
# This is the index number of the VLAN ID
Status This field indicates whether the VLAN is enabled (a yellow bulb) or not (a gray bulb).
Name This field displays the name of each VLAN.
VID This field displays the VLAN ID.
Member This field displays the VLAN membership to which the port belongs.
Apply Click Apply to save your changes back to the NWA/WAC.
Reset Click Reset to return the screen to its last-saved settings.
To turn on an entry, select it and click Activate. To turn off an entry, select it and click
Inactivate.
6.4 AC (AP Controller) Discovery
This section discusses how to configure the NWA/WAC’s AC (AP Controller) Discovery settings. You can
have the NWA/WAC managed by an AP controller on your network. When you do this, the NWA/WAC
can be configured ONLY by the AP controller. See Section 6.1.1 on page 75 for more information on
management mode and AP Controller.
Note: The AC (AP Controller) Discovery settings are not available in all NWA/WACs. See
Section 1.1 on page 13 for more information.
If you want to return the NWA/WAC to standalone AP mode, you can do one of the two following
options:
• Press the Reset button.
• Check the AP controller for the NWA/WAC’s IP address and use FTP to upload the default
configuration file to the NWA/WAC. You can get the configuration file at conf/system-default.conf.
You must reboot the device after uploading the configuration file.
To access the Controller Discover screen, click Configuration > Network > AC Discovery.
NWA / WAC Series User’s Guide
82
 Loading...