

Page 1
Global Water
800-876-1172 • globalw.com
Global DO Monitor Software Manual
For Use With WQ-FDO Sensor and
GL500-7-2 Data Logger
Global Water
Instrumentation, Inc.
151 Graham Road
P.O. Box 9010
College Station, TX 77842-9010
T: 800-876-1172
Int’l: (979) 690-5560, Fax: (979) 690-0440
E-mail : globalw@globalw.com
02-095
Publication Number 39360712
- 1 -
Page 2

Global Water
800-876-1172 • globalw.com
Congratulations on your purchase of a Global Water WQ-FDO Dissolved
Oxygen Sensor and GL500 Data Logger. These instruments have been
quality tested and approved for providing accurate and reliable
measurements. We are confident t hat you will find the logger to be a
valuable asset to your applications. Should you require assistance, our
technical staff will be happy to help.
Table of Contents
I. Overview ▫ ▫ ▫ ▫ ▫ 3
II. System Requirements ▫ ▫ ▫ 3
III. Software and Driver Installation ▫ ▫ 4
IV. Direct Connection ▫ ▫ ▫ ▫ 7
V. Modem Connection ▫ ▫ ▫ ▫ 9
VI. Main Screen ▫ ▫ ▫ ▫ ▫ 11
VII. On-Line Help Files ▫ ▫ ▫ ▫ 15
VIII. Get History ▫ ▫ ▫ ▫ ▫ 16
IX. Setup Menus ▫ ▫ ▫ ▫ ▫ 17
X. General Setup ▫ ▫ ▫ ▫ ▫ 18
XI. Analog Setup ▫ ▫ ▫ ▫ ▫ 21
XII. Digital Setup ▫ ▫ ▫ ▫ ▫ 24
XIII. DO Setup ▫ ▫ ▫ ▫ ▫ 26
XIV. Programming ▫ ▫ ▫ ▫ ▫ 29
XV. Connections ▫ ▫ ▫ ▫ ▫ 30
XVI. Modem C able Diagrams ▫ ▫ ▫ 31
XVII. Maintenance ▫ ▫ ▫ ▫ ▫ 32
XVIII. Troubleshooting ▫ ▫ ▫ ▫ 32
XIX. Cust om er Support ▫ ▫ ▫ ▫ 34
Copyright Global Water Instrumentation, Inc. 2012
- 2 -
Page 3

Global Water
800-876-1172 • globalw.com
I. Overview
The Global DO Monitor software is an enhanced vers ion of the Global Logger II data
logger interface; and used to conver t dissolved oxygen partial pressure and
temperature, along with conduct iv ity and atmospheric pressure, into DO
concentration and saturation. Calc ulating dissolved oxygen concentration and
saturation can be complicated; t hes e v alues are dependant on the partial pressure of
oxygen, temperature, conductivity or salinity, and atmospheric pressure or altitude.
All of these parameters are required to acc ur ately determine concentration and
saturation levels under all conditions.
This software is intended for use wit h the G lobal Water WQ-FDO sensor and the
GL500-7-2 Data Logger. The WQ-FDO sensor provides two 4-20mA outputs whic h
are proportional to oxygen partial pressur e and water temperature. Optionally the
WQ-COND Conductivity Sensor and the WE100 Barometric P ressure Sensor can be
connected to the logger to provide all the nec es s ar y data needed to calculate the
concentration and saturation levels. If conductivity and atmospheric pressure ar e
constant, and these values are known, pr ov is ion is m ade to manually enter these
values instead of connecting the optional s ens or s . Any or all of these 4 sensor
parameters can be displayed and downloaded to a spreadsheet. The software uses
these parameters to calculate concent r ation, saturation, and salinity; and these
calculated values can also be displayed and dow nloaded as needed. All other
features of the Global Logger II soft war e are also supported.
II. System Requirements:
Desktop or Lapto p c o m put e r wit h:
1) W indows 98, ME, 2000, XP, Vista or Windows 7 Operating Systems
2) CDROM Dr ive
3) RS-232 or U S B P ort
Note that this software is for r unning on des k top and laptop computers only.
- 3 -
Page 4
Global Water
800-876-1172 • globalw.com
III. Software and Driver Installation:
Global DO Monitor S o f twa r e Installation: This software is for use on Windows
based desktop and laptop computers only . Insert the software installation CD and
run the Setup program. This will install t he Global Logger application in the Program
Files folder and automatically put the Global Logger icon on the desktop.
Serial communication: If you are using the RS-232 serial port to access the data
logger, no further action is needed. Y ou c an s tart using the logger by opening the
Global Logger application program. If you plan to use the USB port, you must install
the driver. You may consider installing the driver now, even if you plan to use the
serial port.
USB Driver Installation: With the installation CD in the CDROM drive and DC
power applied to the logger, plug the USB c able into the data logger to open the
ADD New Hardware Wizard. The menus that follow will look dif ferent for different
operation systems but the procedure is the sam e. Do not allow the H a r dwa r e
Wizard to automatically search for the driver. Instead, specify the location
(CDROM). If a generic driver gets, or has been previously ins talled, it must be
uninstalled before proceeding by using the Add or R em ov e P r ogr ams section of the
Control Panel. Instead, click the S ear c h Ext er nal Media box or S pec ify a Location
box and install the driver from the CDROM. Running the Setup progr am that installs
the Global Logger software also installs a folder with the driver in it. This location
can also be specified if the CDROM is not available; alt hough, it is recommended
that the driver be installed at the same tim e the Global Logger is installed.
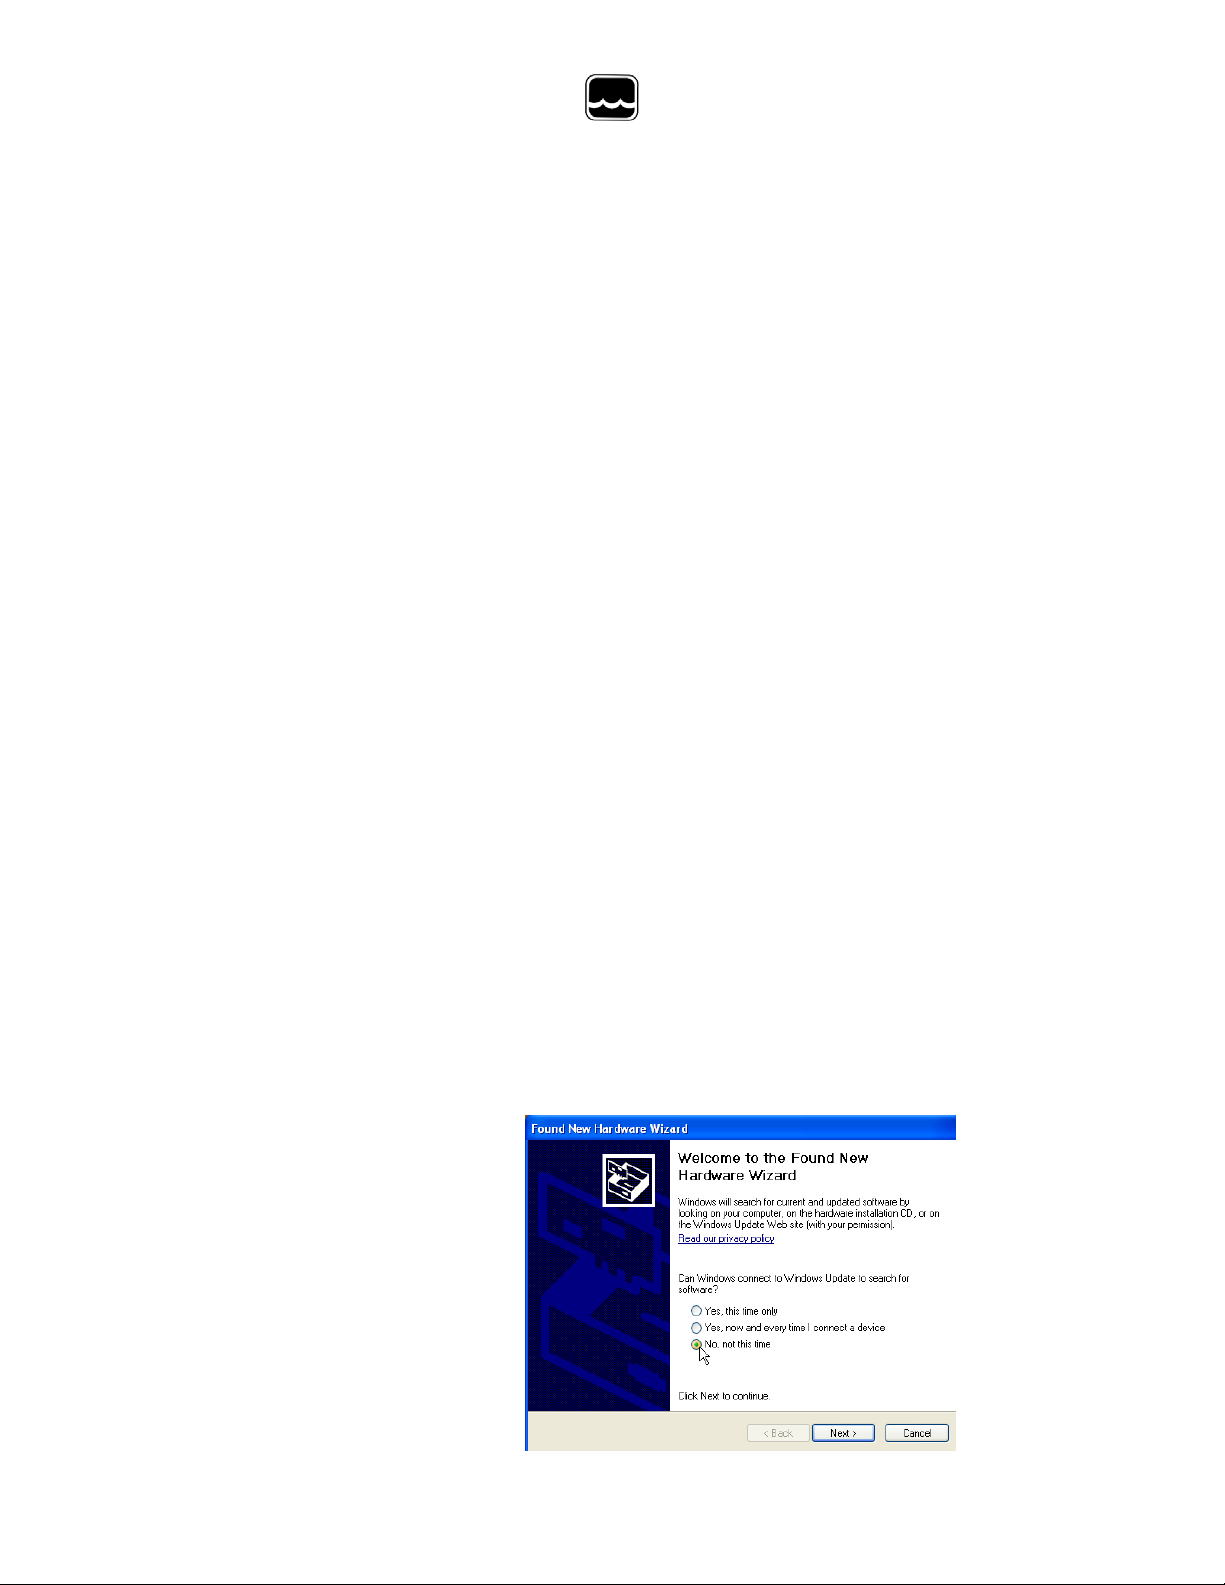
The following menus apply to the Windows X P operating s y s tem.
1) Do not let Windows search
for software. Click “No, not
at this time” when asked if
Windows Update can search
for software.
Click Next.
- 4 -
Page 5
Global Water
800-876-1172 • globalw.com
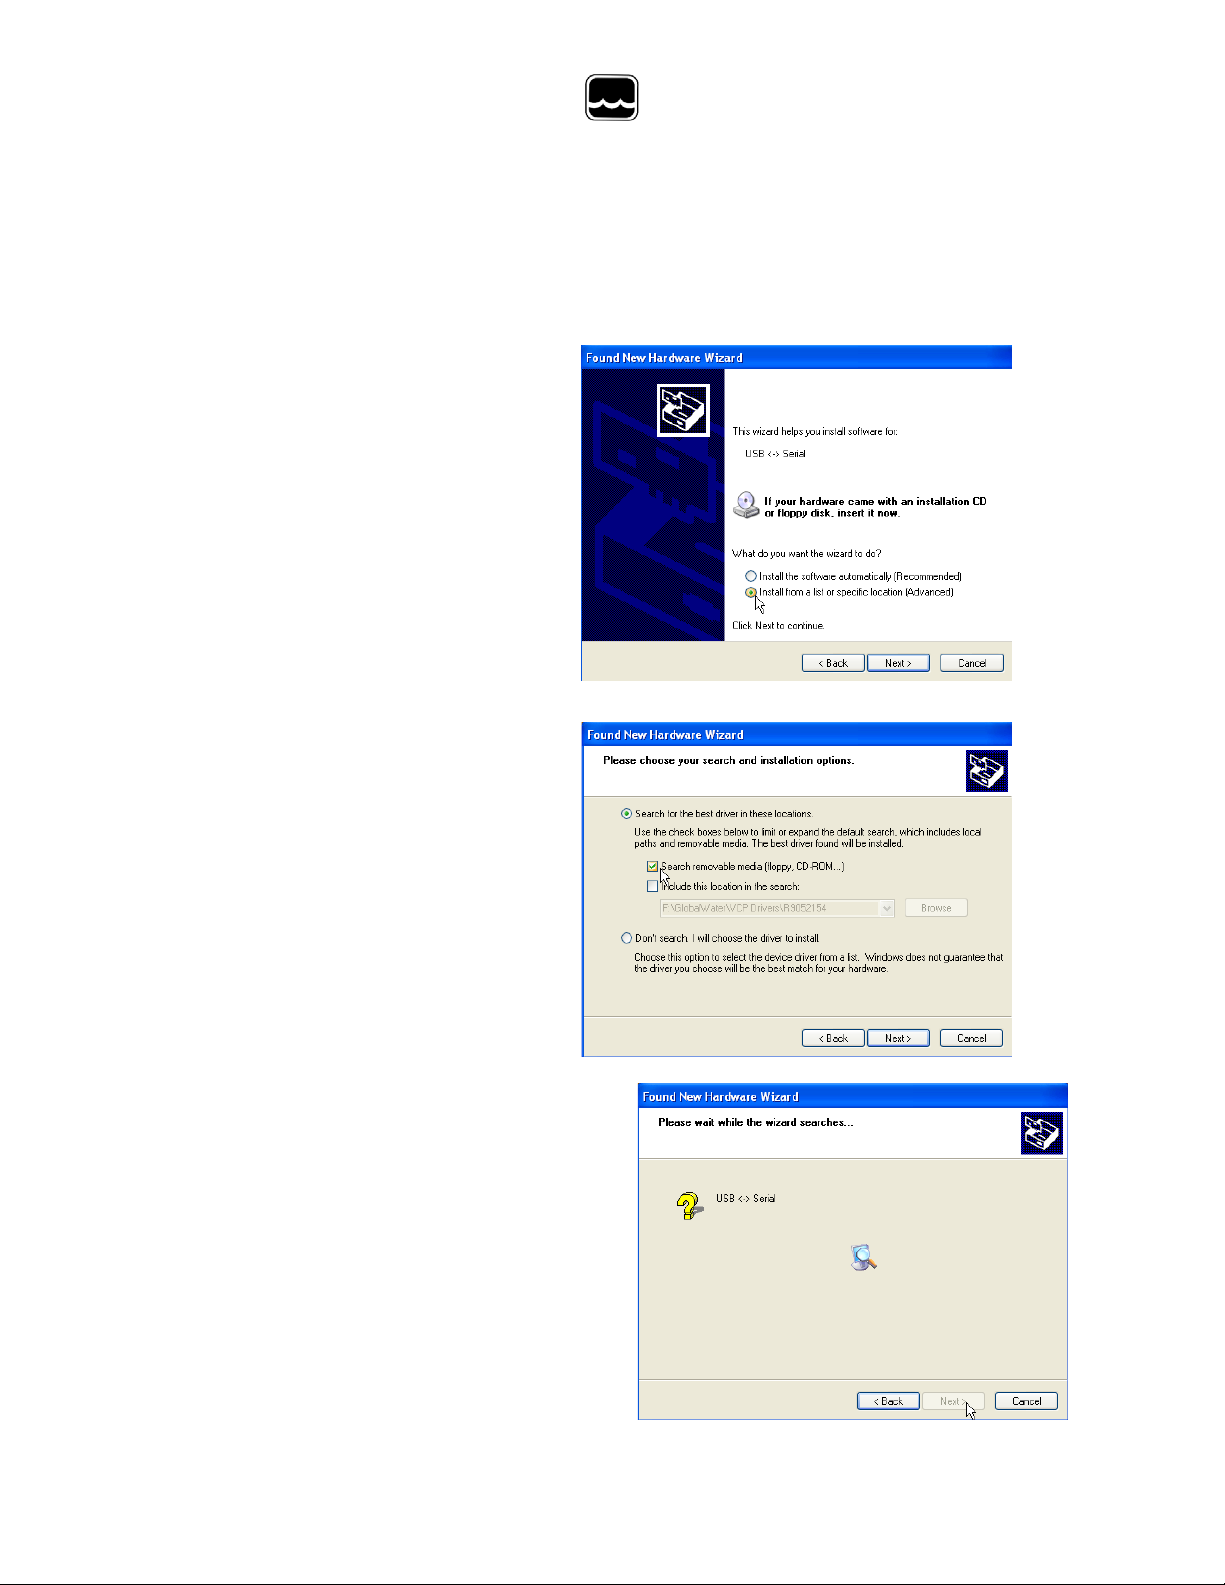
2) Do not let Windows automatically
install the software. Click “Inst all
from a specific location”.
Click Next.
3) Specify the location of the driver.
Make sure the Global Logger CDROM
is in the CD drive and click “Search
removable media” only.
Click Next.
4) The Hardware Wizard searches
for the driver.
If Windows advises that the software
is not certified, click:
“Continue Anyway”.
- 5 -
Page 6
Global Water
800-876-1172 • globalw.com
This only means that Microsoft has not
licensed the software. Second party
software is allowed and no harm will
come to your computer.
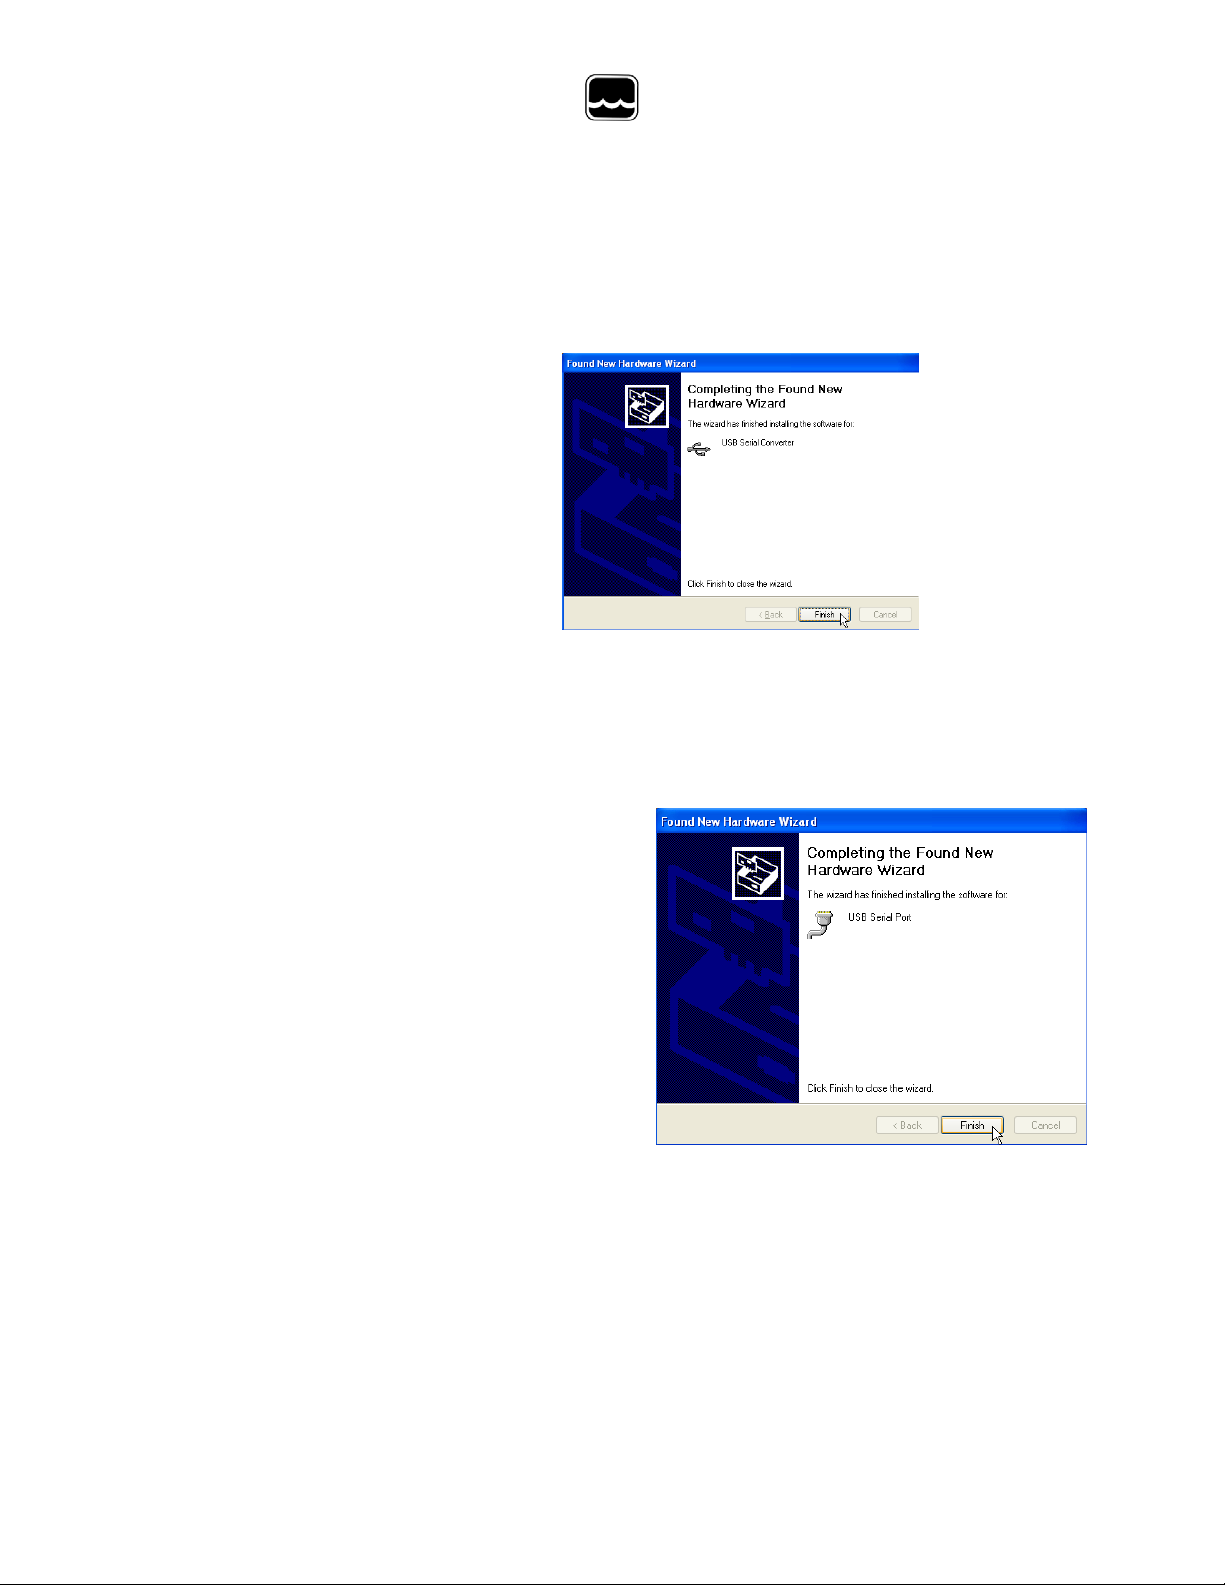
5) The first half of the installation is
complete. The Hardware Wizard
may need to make two passes.
Click Finish.
6) Two drivers are sometimes required so t he Hardware Wizard may repeat the
exact same process again. As before; a: do not let the W indow s Update do a
search, b: tell Windows to search from a specific location instead of automatically
installing software, c: tell W indows to search from removable media (CDROM).
7) The installation is complete.
Click Finish.
- 6 -
Page 7
Global Water
800-876-1172 • globalw.com
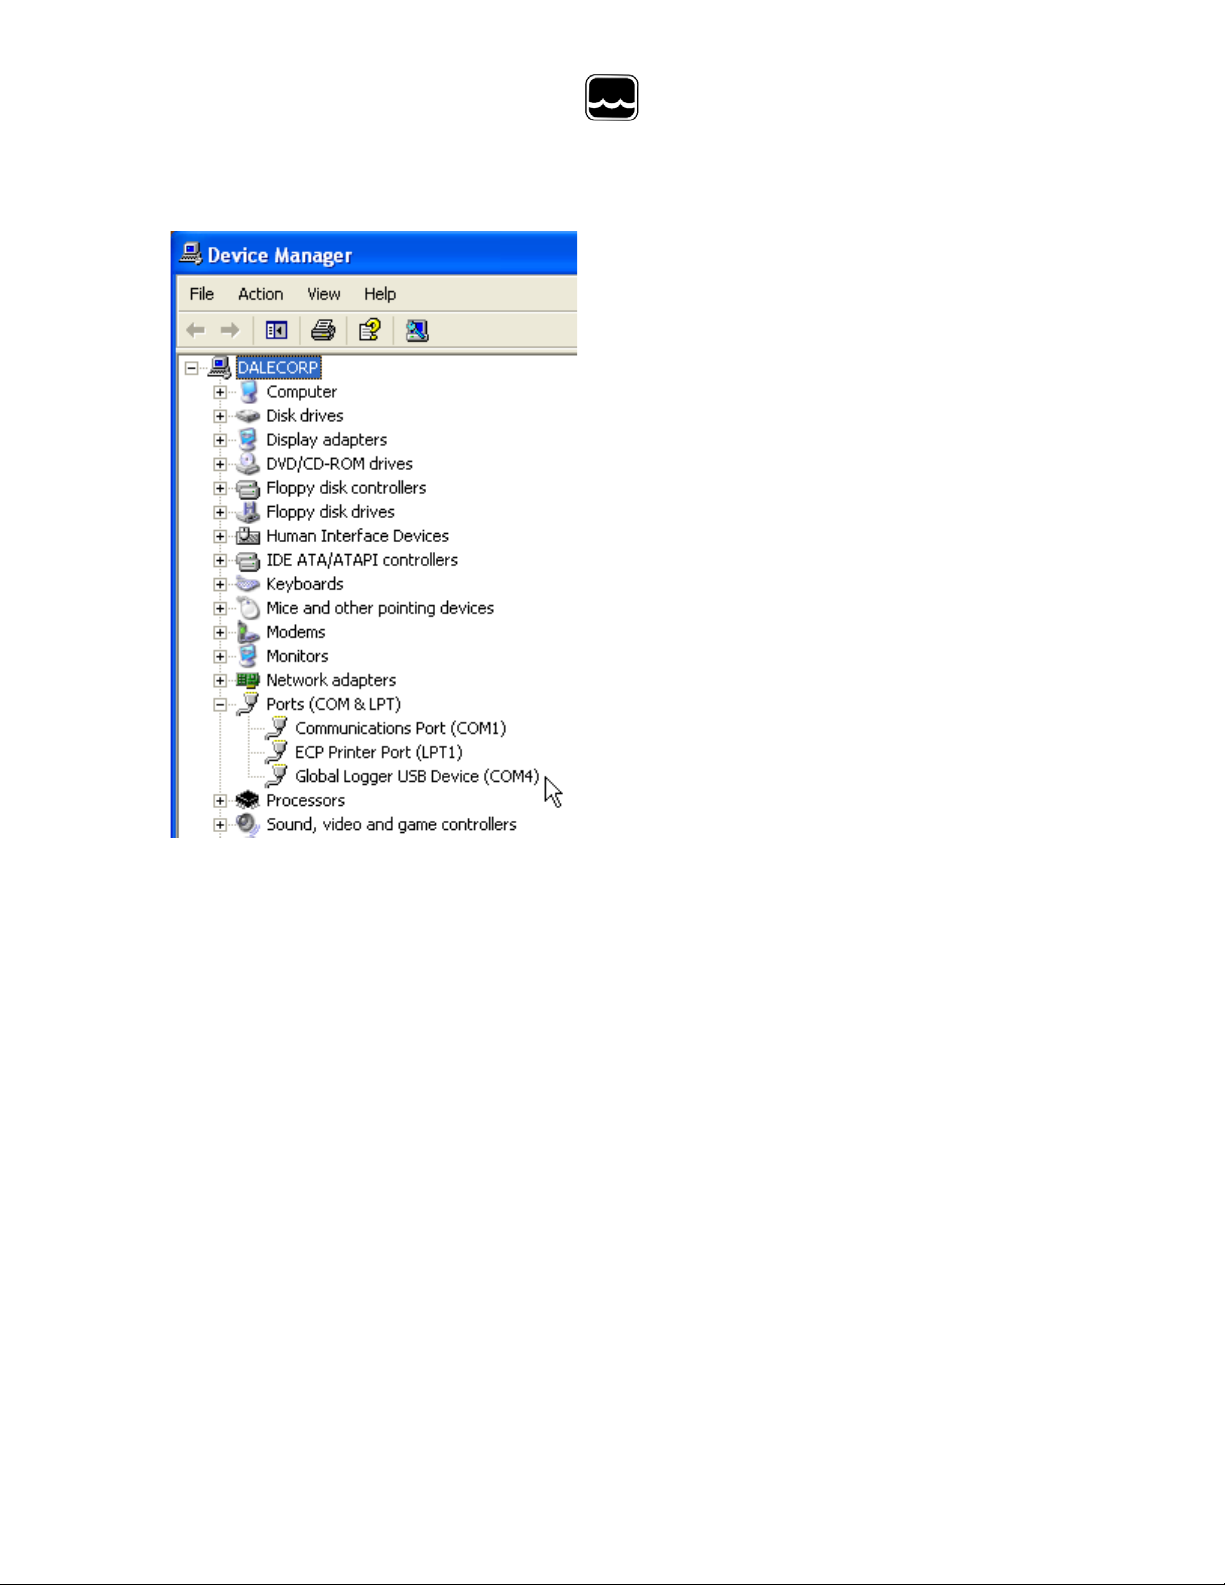
8) To confirm the installation, look in the
Device Manager and find the USB Ser ial
Port. The COM setting following that will
show the virtual COM port that has been
automatically assigned to the driver . As
you will see in the following section, this
COM port will be automatically detect ed
by the Global Logger software so it is not
necessary to note which port is being
used by the driver.
IV. Direct Connection:
Important: This data logger supports an Auto Baud Rate Mode which automatically
detects the connecion speed. However; this communication software also
supports loggers which may be programmed in a Fixed Baud Rate Mode.
This is useful in telemetry applications, particularly when using Global Water
data loggers with our Global Access radio m odem software. The upcoming
discussion assumes that the logger is pr ogr ammed in auto detect mode. If
you cannot connect to the logger and suspect that the logger may be using a
fixed rate mode; try each connection speed separately, especially 38400
which is required when using the Global Acces s s oftware.
- 7 -
Page 8
Global Water
800-876-1172 • globalw.com
There are 3 ways to connect to the GL500 data Logger, direc t connection through
the RS-232 serial port or USB port and dial out through an installe d m odem.
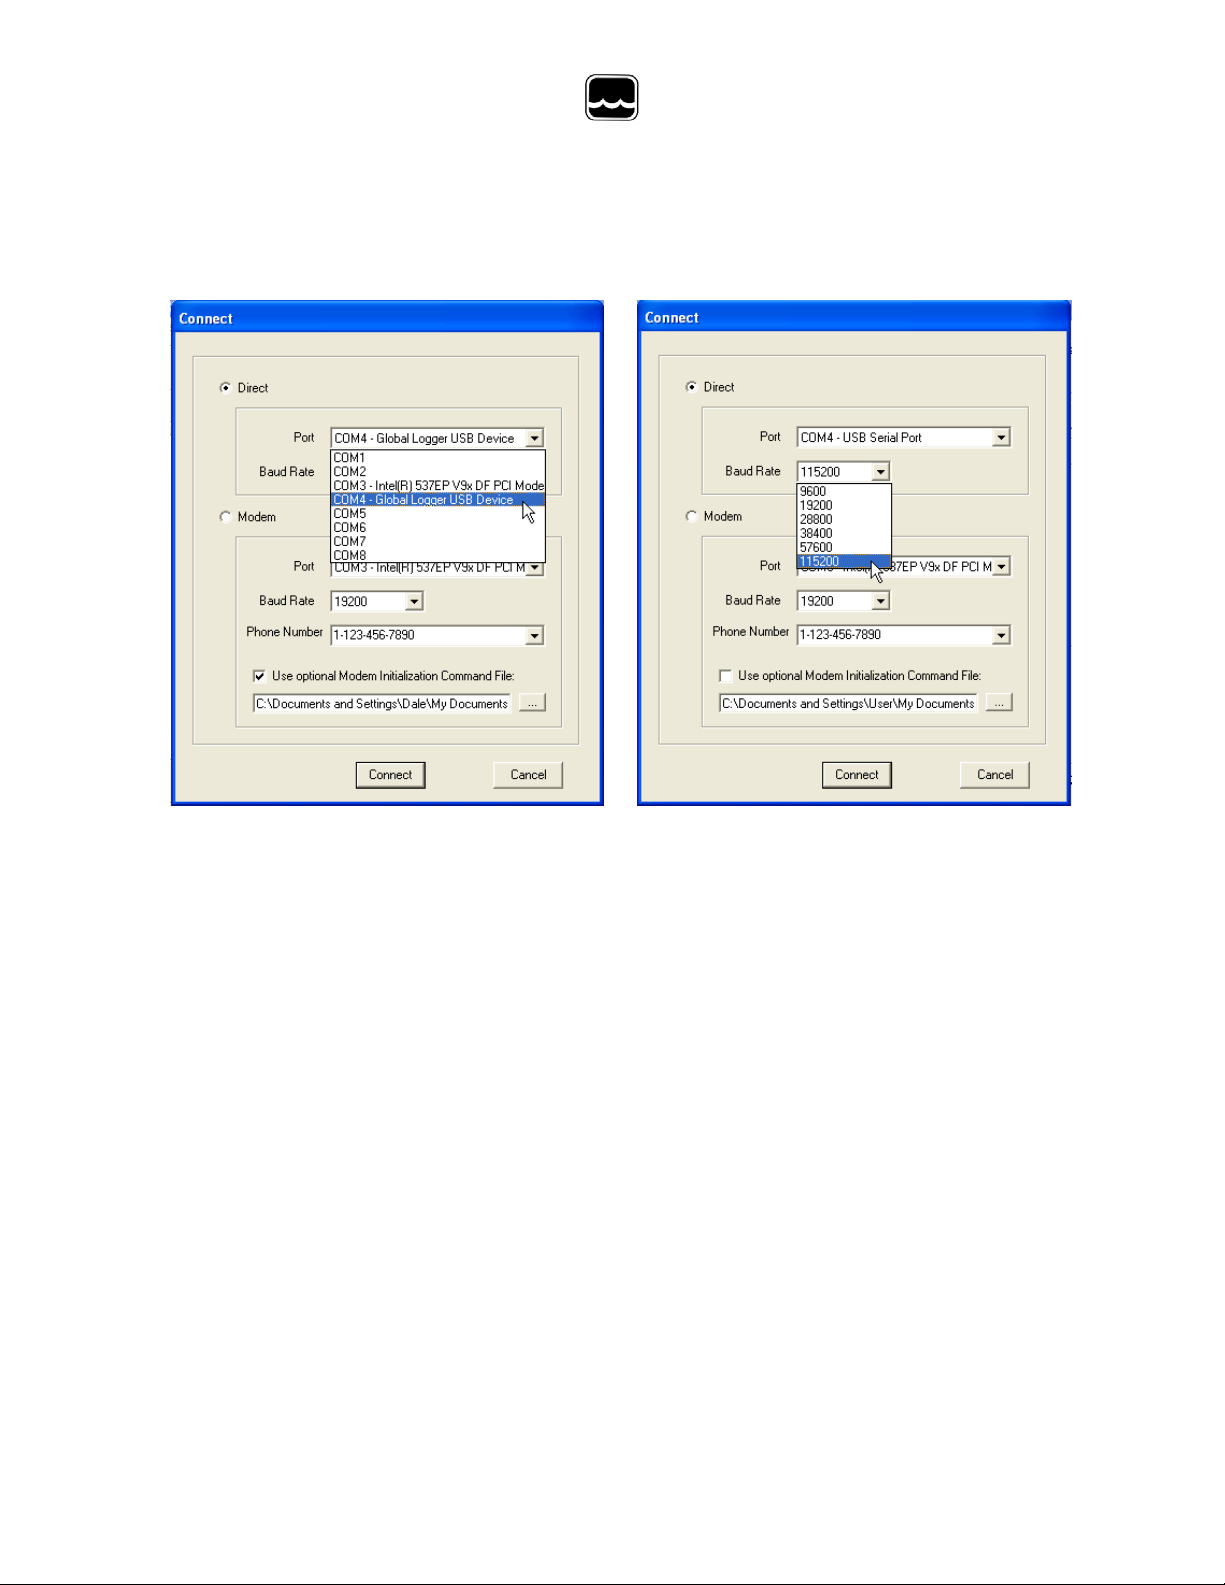
To make a direct connection to the logger, c lic k t he “Direct” option and from the
“Port” menu, select the port you wish to use. For USB access select the USB serial
port at the COM port the driver was assigned, whic h is automatically shown in the
list. Serial connection is generally done t hr ough the 9-pin COM1 connector although
COM2 can also be used. When an external modem or other device is assigned t o
COM1, the port can still be used for access ing the logger, but the external device
must be disconnected. Both the serial and US B port s c an be c onnec ted to the
logger at the same time but you must select which of them is to be used. No
difference will be noticed by the us er ex c ept while downloading historical data.
Because of the excessive handshaking done by the USB port, the serial port will run
about 50% faster at the same baud rate. Next, select the desired baud rate from the
“Baud Rate” menu. Generally, the fast es t rate of 115,200 is used although; long
cables or other factors may require a slower setting. Click “Connect” to make the
connection. If a connection is not made, a message will appear. Check the power
connection, communication cable, dr iv er ins tallation and COM port settings.
- 8 -
Page 9
Browse
Global Water
800-876-1172 • globalw.com
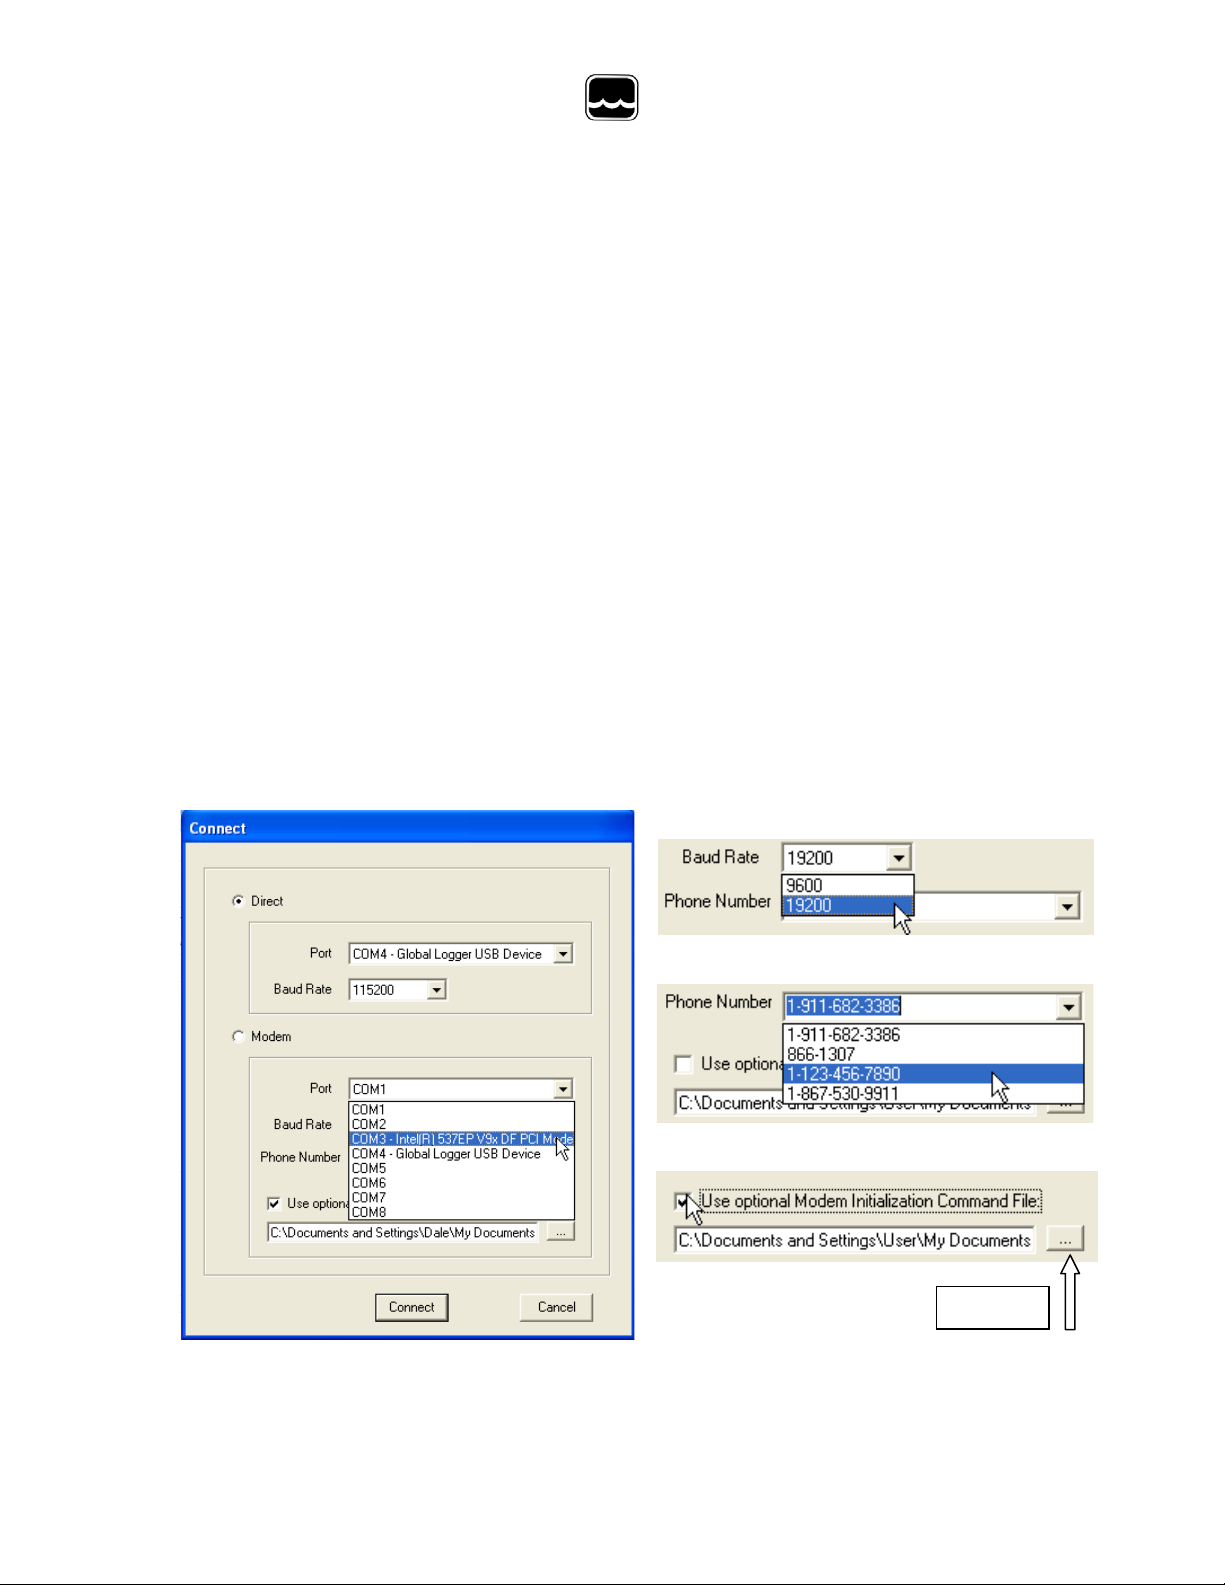
V. Modem Connection:
Access to the GL500 can be made through dial-out to a remote modem by clicking
the “Modem” option. The connection from modem to logger requires an RS-232
serial modem, USB modems are not support ed as an interface to the logger. Also,
some switch settings must be made to the remote m odem and an initialization string
may be required to properly configure the hos t modem.
Two baud rates are supported 9600 and 19200. Should you ex per ienc e difficulty
establishing a reliable connection at 19200, use the slower connection speed. N ote
that due to the slower baud rates and the additional hands haking performed during
modem communication, The Global Logger s oftware will operate significantly slower
than during a direct connection.
The Global Logger software will remember the las t 4 numbers dialed and has a
provision for using a stored text file (.txt extension) for initialization of the hos t
modem using standard AT commands. Some experience may be r equir ed to
configure your modem but a sample comm and file and some useful tips follow.
Select the baud rate
Ty pe in or find the phone number
Use init ializ ation file
Select the modem’s COM port
- 9 -
Page 10
Global Water
800-876-1172 • globalw.com
Sample initialization text file:
This is for reference and applies to
an external US Robotics modem only.
ATM1 ; speaker off when connects
AT&B1 ; fixed serial port rate
AT&D2 ; normal DTR
AT&H1&R2 ; h/w flow control
Connect 19200
AT&I0 ; disable s/w flow control
AT&K0 ; disable compression
AT&M4 ; normal error control
Select the COM port for your modem
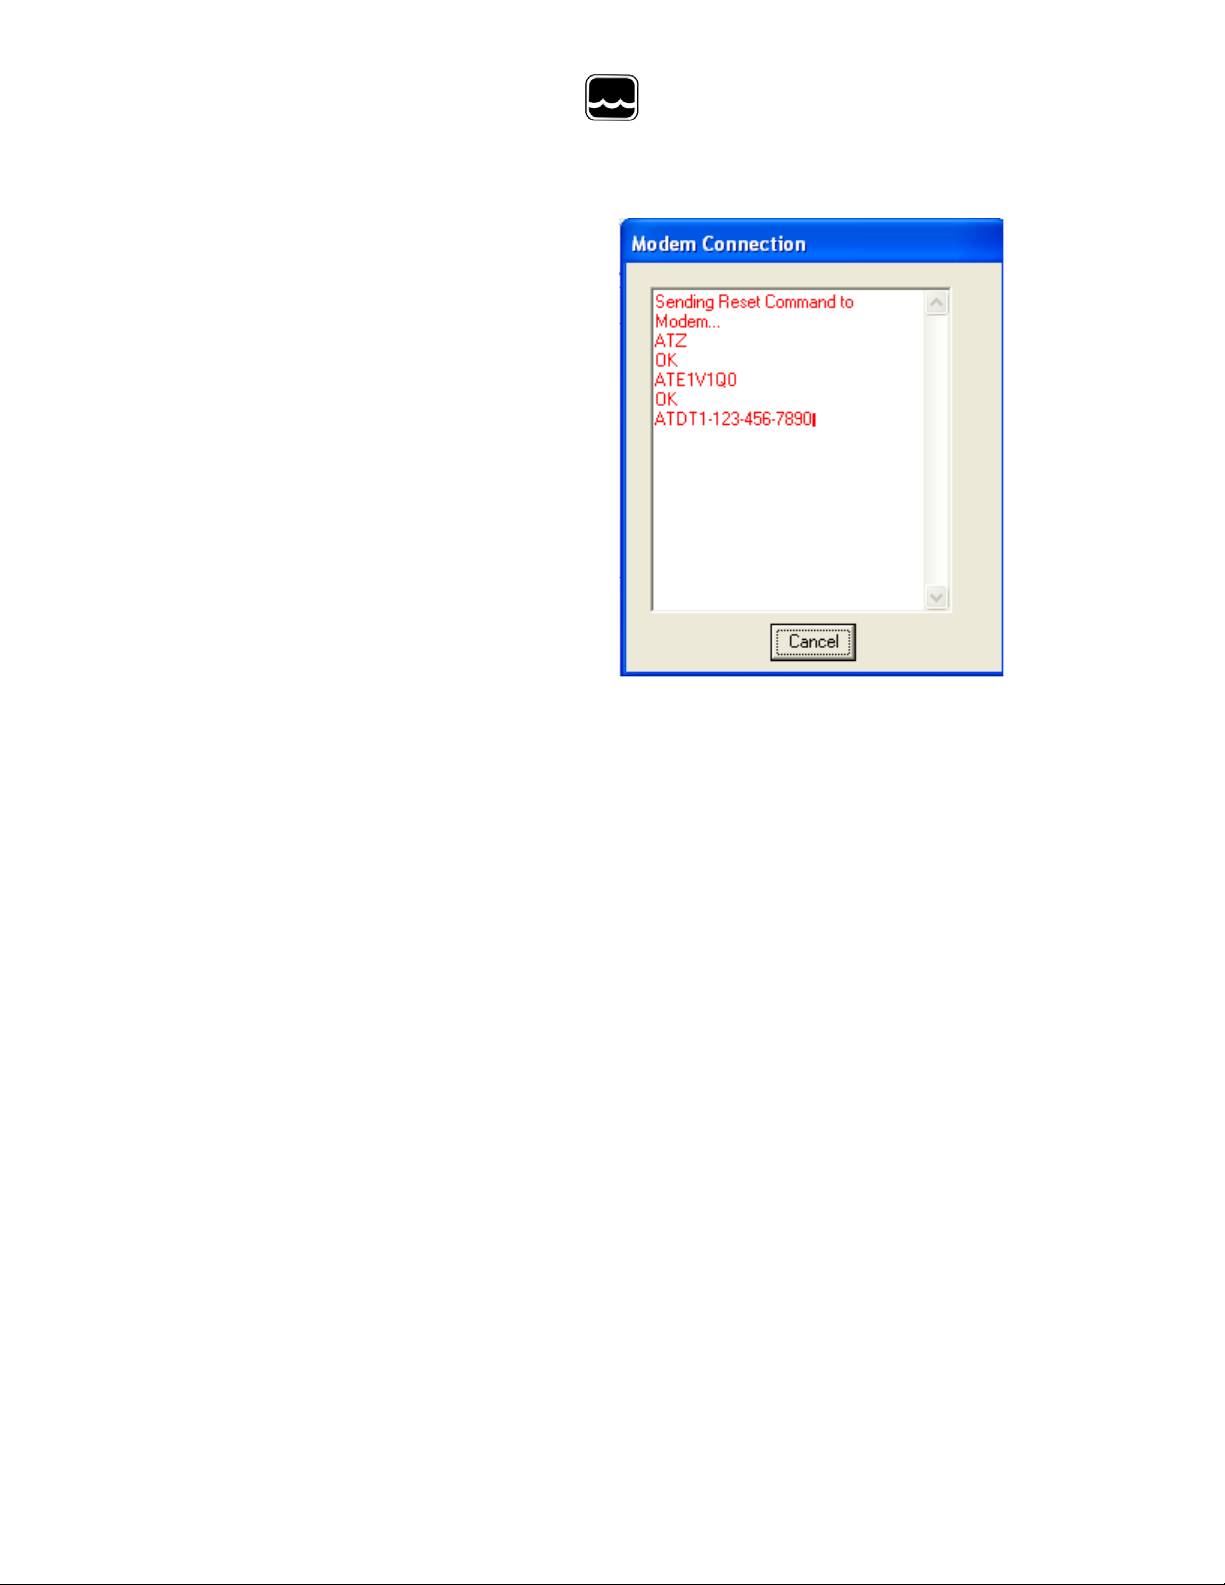
and the baud rate. Type in the phone
number or select it from the list of prestored numbers. If necessary, clic k the “Use I nitialization File” box and use
the browse button to search for t he initialization text file for your modem. Click
“Connect” and the software will dial out, s how ing the status screen shown above.
Once a connection is established, “Connect ” wil l appear for a few seconds along with
the baud rate of the connection. After c onnec ting, the normal Global Logger screen
will appear and operate exactly as if a direct c onnection was m ade. All options and
features work the same but at a reduced communicat ion s peed.
When connecting the GL500 Data Logger to an external modem, a special cable is
required. Wiring diagrams are provided at the end of this manual and pre-wired
cables are available from Global W ater. The remote modem is configured by setting
DIP switches. They should be set to auto-answer on, DTR Normal, carrier detect
normal and smart mode. Global Water can provide ext er nal m odems and interface
cables at an additional cost if requested. Contact our sales department for more
information.
It may not be necessary to use an initializat ion s tring to configure the host modem
but if problems arise the modem should be set with software handshaking off (Xoff),
DTR normal, fixed baud rate, compression of f and error correction on. This
configuration is done by building an init ializ ation file using the standard AT
commands and loading it into the connection screen. Global Water suggests that
you test the modems operation before installing in the field.
- 10 -
Page 11

Global Water
800-876-1172 • globalw.com
VI. Main Screen:
The main screen is where the status and option menus ar e ac c es s ed. The GL500
data logger will continue to log at norm al intervals while connected to the Global
Logger software. While connected, t he logger will draw an addition current from the
power supply of 5-10mA so it is advised that, if you are operating on battery power
and plan not to access the logger for extended periods of time, you disconnect from
the logger to increase battery lif e. I nterface cables may remain connected. To
disconnect, click on the “Disconnect” button. The label on this button will change to
“Connect” and clicking on it will return y ou to the connection screen as previously
discussed.
The functions and information in this sc r een are disc us s ed in the following sections.
- 11 -
Page 12

Global Water
800-876-1172 • globalw.com
Tool Bar: The tool bar at the top of the screen has 3 options; File, Action and Help.
In this screen, the File option is used to exit the program only. Action allows a menu
driven interface to the various functions and displays the hot-keys, which can be
used for faster access. In the Help menu; Help allows you t o v iew the on-line help
files (see section X, Page 16), About s hows c ontact information and Revision
information for the Global Logger soft war e and Firmware Version displays the GL500
Data Logger revision number.
COM Status: This reads “Connected” in green or “Not Connected” in red,
depending on the current connection st atus.
Logger Name: The logger name is a us er defined name associated with a particular
logger to identify one from another. It is progr am m ed in the Setup menu as
described later and is limited to 32 c har ac ters.
Logger Time: The time and date displayed is that of the real-time clock in the
logger. It is only updated upon initial connection and certain functions that cause
data to be read from the logger. These include Sample C ontinuously, Get Sample,
Sync Time and Setup whose functions are to be described later .
Interval: This field displays the logging mode. “Fast” indicates high-speed mode
and “Logarithmic” is shown in logarithmic m ode. If the logger is in the normal fixed
interval sampling mode, the time between samples will be displayed. These modes
are to be described later.
Warmup: This displays the sensor warm -up time.
- 12 -
Page 13

Global Water
800-876-1172 • globalw.com
Records: This field indicates the number of data recordings in memory.
Logging State: This shows whether the GL500 is currently logging wait ing to be
started or stopped by the alarm timers. These featur es ar e des c r ibed in detail later.
Sample Continuously: Clicking this check box causes the Global Logger software
to take and display a real-time reading once per s ec ond until stopped by clicking it
again, as well as update the rest of the fields on the s c r een. These data readings
are not stored in the historical record and do not affect the normal recording of the
logger. The initial reading has a sensor war m-up time of 50mS and the sensor is left
powered up until this feature is turned off.
Get Sample: Clicking this button causes the Global Logger software to take and
display a single reading as well as update t he rest of the fields on the screen. This
data reading is not stored in the historical rec or d and does not affect the normal
recording of the logger. The sensor war m-up time is fixed at 50mS.
Get History: This button starts the download of all the historical data stored in the
logger memory. Oldest data is collected fir s t and Clicking “Stop” halts the process.
This function is described in detail later.
Clear History: This resets the number of r ec ordings in memory to zero. The user is
warned first and must confirm the act ion before the memory is cleared.
Sync Time: This button causes the data logger’s internal clock to be set to the
system time of the computer it is connected to. The user is warned first and must
confirm the action before the tim e is set.
Setup: Clicking this button enters the setup screen where the user can change and
program all parameters into the data logger. This function is described in detail later.
- 13 -
Page 14

Global Water
800-876-1172 • globalw.com
Bar Graphs: The bar graphs show a vis ual r epr es entation of the most recent data
reading taken by using the Sample Continuousl y or Get Sample functions. The
upper and lower limits of the display are defined by the user as discussed in detail
later.
Numerical Reading: The numerical reading at the bottom of the bar graph shows
the actual data reading and is updated at the s am e time as the bar graph.
Successive numerical readings taken by us ing S am ple C ontinuously or Get Sample
are shown in a list below the bar, up to 5.
Pulse channels: The GL500-7-2 Data Logger has two independent pulse c hannels ,
each with a maximum count of 65,535. At the time of the logger’s normal sampling
interval, the counts are stored in mem or y along w ith the other sensor data and time
stamp, and then the counters are set to zer o to start the counting sequence over
again. The Pulse Channel 1 and Pulse Channel 2 fields show how m any puls es
have been counted since the last logger r ec or ding for each of the 2 pulse channels.
For example: If the logger is set to record onc e per minut e and it is put into Sample
Continuously mode, the display will be updated onc e per s ec ond and as puls es ar e
applied to the pulse inputs, the Pulse Channel f ields will update the count. At the
end of the normal one minute sampling interv al, the total number of pulses will be
stored in memory and the Pulse Channel fields will s how z er o until more pulses are
applied. Note that the pulse channels can be scaled to s how r ainfall, water flow etc.
by multiplying the count by a user definable num ber as described in detail later.
Alarm 1: This field shows the time that the logger is s et to start logging. The start
alarm is a 24-hour timer which will initiate logging, when enabled, at the next
occurrence of that time.
Alarm 2: This field shows the time that the logger is s et to stop logging. The stop
alarm is a 24-hour timer which will halt logging, when enabled, at the next
occurrence of that time after the logger has started recording. If the Alarm 1 timer is
set to initiate logging, the Alarm 2 t imer will halt logging at the next occurrence of the
Alarm 2 time after the logger has been started by A lar m 1. If the Alarm 1 timer is not
enabled, the Alarm 2 timer will halt logger on the next occurrence of that time.
Note: Use care when programming the alarm times. If left enabled, changing
and reprogramming any of the setup parameters will restart the alarm timers.
- 14 -
Page 15

Global Water
800-876-1172 • globalw.com
VII. On-Line Help Files:
Clicking on Help displays the on-line help files whic h giv e eas y ac c es s to the
information contained in this m anual. There are 3 ways to access the information.
The first tab is Contents which accesses the table of contents for the manual.
Clicking on any of the topics opens up the
body of text on that
subject. Within each
body of text is a
discussion of that
subject and links to
related topics
underlined in blue.
Clicking on the link
will bring up a new
window with specific
information on that
topic. In this case,
Sensor Warm-up time
in the General Setup
menu.
Click the Index tab to find a listing of topics. Type lett er s into the keyword field and
the program automatically sorts the topics alphabetically. To find relevant topic s
based on a keyword, click the Search tab. Information on the DO Monitor operation
is contained in a separate section. From the Help pulldown menu, select Dissolved
Oxygen Sensor Help to access informat ion r elated t o the DO Monitor section.
- 15 -
Page 16

Global Water
800-876-1172 • globalw.com
VIII. Get History:
Clicking the Get History button begins the downloading of the historical data into an
information screen. This screen allows the viewing of the recorded data and also
provides a path to export the data to an Excel compat ible file. Note that the logger
continues to log as data is downloaded. Thus, more data points may be downloaded
than originally indicated.
At the top of the screen is shown the name assigned to t he logger and the number of
recordings that have been retrieved. A t t he bottom of the screen are four buttons,
Pack, Save to File, Options and OK.
Pack: The Pack function removes recordings that are identical to the previous ones.
All the channels must be the same as the row above for it to be rem ov ed. If ev en a
single channel has data that differs from the previous sample, the row will not be
removed. This function works best when a single c hannel is being r ec orded and
allows only the data showing changing conditions to be viewed.
- 16 -
Page 17

Global Water
800-876-1172 • globalw.com
Save to File: Clicking this but ton
allows the data to be exported to an
Excel compatible .CSV file.
Specify the path and the file name
and click the Save button
Options: This opens a menu which
Allows you to select if you want the
Time and date in the time stamp to
Be in one column or two in the saved .CSV file. Click Close to r eturn.
OK: Clicking the OK button
returns you to the main screen.
IX. Setup Menus:
Clicking the Setup button enters the setup menu which is composed of four sections,
Analog, Digital, General, and DO. The first screen to appear is General Setup. At
the top of the setup screen is a toolbar with t hree opt ions , File, Action and Help.
File: The File option allows you to exit the setup screen but most important ly , it
allows all of the configuration information for the logger to be saved to a file or
restored from a file. Select “Load Setup File” to r es tore a configuration from a file
that has been previously saved or “Save Setup File” to sav e the current setup and
calibration information. The last 4 files are shown for convenience. Setup files have
a .SET extension. It is advised that after y ou calibrate and conf igur e the logger, you
save the configuration to a file as a backup precaution before exiting the setup
menu.
- 17 -
Page 18

Global Water
800-876-1172 • globalw.com
Action: The Action menu has two options, “Program Settings” and “Initialize to
Default Values”. Program sett ings w ill r epr ogr am the data logger with all the setup
and calibration information and works the same as the Program Settings Button at
the bottom of the screen. Initialize
will restore all of the analog, digital
and general setup information fields
to default values. Only the setup
menus are changed, the data logger
must still be programmed with the
new default values. A warning message will appear before this action is taken.
Help: The Help menu provides access to the on-line help files and Global Water
contact information as described prev iously.
X. General Setup:
In the General Setup menu, the logger name, sensor warm -up time, logging mode,
logging interval and alarm times ar e entered.
- 18 -
Page 19

Global Water
800-876-1172 • globalw.com
Name: The logger is a user definable name to identify the logger. Up to 32
characters are allowed however, a cont inuous s tring of characters of more than 16
with no spaces may not be displayed correctly . Click on the field to enter
information.
Sensor Warm-up Time: To conserve battery life, the
sensors do not normally have power applied to them.
Before taking a reading, the logger powers up the
sensors for the sensor warm-up time, and then removes
power from them again. The allowable times are zero
(50mS) to 60 seconds. The sensor warm-up t ime f or the
WQ-FDO sensor is 15 seconds. Click on the field to enter or
select the time in seconds from the pull-down menu.
Baud Rate: Leave this set to Auto Baud Rate.
Only change this to a fixed baud rate if planning t o
use this logger in a telemetry application, such as
using Global Water’s Global Access radio m odem
software. Once programmed in a fixed rat e mode,
you must set the baud rate in the opening connect ion menu of the Global Logger II
software to this speed, or the logger will not communicate.
Sample Periodically: Sampling at regular intervals is the most common recording
mode. Click the Sample Periodically option, s elect the units from the pull-down
menu and click the numerical field to enter the number of those units up to 65,535.
Fast Sampling Mode : In Fast mode, the sample rate is fixed at 10 times per
second. The time stamp will not read fractions of a second so there will be 10
samples per time stamp. Click the Fast m ode option t o s elec t this feature.
- 19 -
Page 20

Global Water
800-876-1172 • globalw.com
Logarithmic Timing: Typically used in groundwater pump studies, this mode
speeds up the sample rate over time. Click the “Logarithmic” option to select this
mode. This a logarithmic approximation t hat steps up the sample rate:
a. 10 times per second for 20 seconds, 200 samples
b. 1 second interval for 100 seconds, 100 sam ples
c. 10 second interval for 10 minutes, 60 samples
d. 1 minute interval for 60 minutes, 60 sam ples
e. 10 minute interval for 10 hours, 60 samples
f. 1 hour interval for 48 hour s , 48 samples
g. 1 day interval until memory s full
Log Upon Deviation: Clicking the “Log only if Channel 1 change exceeds +/-“ box
causes the logger to record the current r eading in m emory only if it exceeds the
previously reading by the preset am ount entered in the numeric field. This logging
exception applies to channel 1 only and the deviation is measured in Raw Data units
where the approximate raw data range is f r om 0-65535, cor responding to 0-20mA.
To find the actual number of raw data unit s per engineering unit, use the calibration
numbers in the Analog Setup screen for c hannel 1 as follow s : Raw Data Units per
Engineering Unit = (High Raw – Low Raw) / (High EU – Low EU) . For example:
Assume a 15 foot water level sensor has a High EU of 15, a Low EU of zero, a High
Raw of 62256 and a Low Raw of 13104. (62256-13104) / (15-0) = 3277 unit s /foot.
Thus, if you want to log only when a reading exceeds t he pr ev ious on by 0.5 feet, set
the deviation to about 1638. Click the num er ic field t o enter the desired range.
Wrap records: If the “Wrap records
at End of Storage” box is checked,
once the memory is full, the oldest data points will be replaced with the newest.
Thus, the memory block represents only the newest. If this feature is not checked,
the logger will halt recording once the memory is full.
Sample-On-Demand: When this box is checked, applying a pulse to t he S am pleOn-Demand input will cause the logger to take a data reading and stor e it in
memory. This feature works in all sampling modes and will not interrupt normal data
recording. If the sample interval is one hour, the historical record will show data
- 20 -
Page 21

Global Water
800-876-1172 • globalw.com
once per hour as well as the time that the sample-on-demand was triggered. This
feature is used to record the time that s pec ial ev ents occurred such as when water
sampler was triggered, a door was opened, etc.
Alarm Times: Check the box
associated with each alarm to
enable that feature and enter
the desired start or stop time.
The logger will start at the next
occurrence of the Alarm 1 time and stop at the next occurrence of the Alarm 2 time
after the Alarm 1 timer has expired. Either or both alarm s c an be enabled.
Note: The alarm start and stop cycle is a one time occurrence. Once stop ped
by the Alarm 2 timer, the logger will not resume logging again until the logger
is reprogrammed. Reprogramming the logger with the timers enabled will
restart the alarm cycle. Reprogramming t he logger with the timers disabled
will return the logger to a normal logging state
Use care when programming the alarm times. If l ef t enabled, changing and
reprogramming any of the setup parameters will restart the alarm timers and
could cause the logger to stop recording.
XI. Analog Setup:
The Analog Setup screen sets the engineering units and c alibr ation numbers for
each of the analog channels, the endpoints of the bar graphs in the main screen and
which of the analog channels are enabled. These channels ar e c alibr ated in the
same way so only a single channel will be discuss ed.
It is important to note here that the infor mation
stored in the data logger’s memory is just the
sensors output level before it is adjus ted by the
following calibration paramet er s. These
parameters are used to adjust the stor ed
data for display and storage purposes only, at
the time the data is downloaded. If they ar e
changed, the same stored data can be
downloaded again and the data will be scaled
differently according to the new settings.
- 21 -
Page 22

Global Water
800-876-1172 • globalw.com
The calibration of channel one to the DO partial pressure output sensor is discussed
in the following example:
Enable: If the “Enable” box at the top of a column is checked,
data for that channel will be shown in the hist or ic al r ec or d and
be available for export to a spreadsheet. The data for all of the
analog channels is always being recorded w hether the channel
is enabled or not. A channel can be re-enabled at any time to
view recorded data.
Units: This field shows the units that will
appear at the top of the data column for
that channel in the historical record as well
as the display of data in the main screen.
Click on the field to enter the unit or select
from a predefined list.
High EU: The High EU field is the engineering unit where the
highest output from the sensor is achieved during the calibration process, in this
case a oxygen partial pressure of 400mbar c or responding to a 20.00mA output.
Low EU: The Low EU field is the engineering unit where the lowest output from the
sensor is achieved during the calibrat ion pr oc ess, in this case zero mbar
corresponding to 4.00mA
High Raw: This is the raw data value as measured by the GL500 Data Logger that
corresponds to the High EU value and is automatic ally s et by the calibration process.
In this case, the raw data value returned by t he logger at a pr es s ur e of 400 mbar.
Low Raw: This is the raw data value as measured by the logger that corresponds to
the Low EU value and is automatically set by the calibrat ion pr oc es s . In this case,
the raw data value returned by the logger for a partial pr es s ur e of zero.
Disp High: This field sets the upper limit of the bar graph displayed in the main
screen and provides a way of scaling the graph beyond the upper limit used to
calibrate the logger. In this example, the upper display value is 400mbar.
- 22 -
Page 23

Global Water
800-876-1172 • globalw.com
Disp Low: This field sets the lower limit of the bar graph displayed in the main
screen and provides a way of scaling the gr aph bey ond the lower limit used to
calibrate the logger. In this case the lower c alibr ation was zero.
Decimal Places: From the pull-down menu, select the
number of decimal places to the right of the decim al
point that should appear in the histor ic al data and in the
numerical data field at the bottom of the bar gr aph.
Calibrate: The “Calibra te” button provides a simple 4-step process for calibr ating
the GL500 Data Logger to a particular sens or . Click t he Calibr ate button and follow
the menu instructions.
Click on the High EU field and enter the
high engineering unit that will be used
to calibrate the sensor, not the highest
reading the sensor can output. In the
example of pH, enter 10 which is the
highest calibration solution to be us ed.
Click Next.
Place the sensor in the condition that will
cause it to output the level corresponding
to the high EU entered in the previous menu.
Wait for the data reading to stabilize.
Click Next.
- 23 -
Page 24

Global Water
800-876-1172 • globalw.com
Click on the Low EU field and enter the
low engineering unit that will be used
to calibrate the sensor, not the lowest
reading the sensor can output. In the
example of pH, enter 4 which is the
lowest calibration solution to be us ed.
Click Next.
Place the sensor in the condition that will
cause it to output the level corresponding
to the low EU entered in the previous menu.
Wait for the data reading to stabilize.
Click Next to complete the calibration.
XII. Digital Setup:
The Digital Setup screen is used for s ett ing up the t w o digital pulse channels.
- 24 -
Page 25

Global Water
800-876-1172 • globalw.com
Enable: Checking the Enable box allows the display of the data for that channel in
the historical record. The pulse channels are alway s being monitored and the counts
between sampling intervals stor ed w hether they are enabled or not.
Units: To enter a Sensor Name or Units, click on
the field and enter it or select from a list of unit s
predefined in the pull-down menu
Value for a Single Pulse: The number of pulses
is multiplied by this number to scale it to rainfall,
water flow, etc. If a pulse channel is connected to
a rain gauge that puts out a pulse every 1/ 100” of
rain, click on the field and enter 0.01 to display rainfall in Inches.
Decimal Places: This field determines how many plac es to the right of the decimal
point the data will be displayed in the main screen and historical data record. Select
the desired number of decimal places fr om the pull-down menu.
- 25 -
Page 26

Global Water
800-876-1172 • globalw.com
XIII. DO Setup
To calculate dissolved oxygen concentr ation and saturation levels, several
environmental factors must be known. In a state if equilibrium; the partial pressure
of oxygen in the air and in the water are equal, as stated by Henr y ’s Law. The partial
pressure of oxygen in air is 20.1% of the t otal atmospheric pressure. The WQ-FDO
sensor, as do most or all dissolved oxygen sensors, measure the dissolved oxygen
in water by measuring the partial pressure of ox y gen pr es ent. At sea level the
average atmospheric pressure is about 1013 m bar , and the partial pressure of
oxygen in the air is 20.1% of that or about 204 mbar. In a state of equilibrium
between water and air, this partial pressur e would be the 100% saturation level of
oxygen in water. Since atmospheric pressur e dec reases with increasing altitude, the
partial pressure of oxygen in water required to reach a 100% saturation level also
decreases. Even weather activity c an cause c hanges in bar om etric pressure and
effect the concentration and saturation levels in water. Besides atmospheric
pressure, temperature also changes the ox y gen concentration levels. At higher
temperatures, less oxygen can be dissolved in water. Therefore; the concentration
of oxygen in water required to achieve 100% sat uration decreases with increasing
temperature. Conductivity, or salinity , also decreases the ability of oxygen to
dissolve in water. So to accurat ely determine the oxygen concentration and
saturation levels, the oxygen partial pr es s ur e in the water, temperature, atmospheric
pressure, and conductivity mus t all be known. Since other biological factors als o
affect oxygen levels, such as fis h depleting oxygen and algae enriching it, oxy gen
saturation is a dynamic and constantly changing measurement. Due to these factors
and the delay time required to reach equilibrium, the saturation levels can fall well
below 100%, and can increase well above 100% as well.
Certain assumptions can be made in cases wher e the salinity and atmospheric
pressure are not changing excessively. Changes in atmospheric pressure due to
storm activity does not usually m ak e s ignificant changes in calculations and can
sometimes be ignored. In many cases, changes in s alinity can also be ignored,
especially when making measurements in fresh water. In other situations where
salinity is changing dramatically due to tidal activity, a conductivity sensor c an be
added to the WQ-FDO sensor and data logger system to provide a real-time salinity
compensation. The WQ-FDO software also provides f or the connection of a
barometric pressure sensor that will give r eal-time compensation for pressure
changes as well. This software allows the ability to either connect the optional
conductivity and barometric sens or s , or enter values for these parameters manually.
- 26 -
Page 27

Global Water
800-876-1172 • globalw.com
The Dissolved Oxygen Setup Tab shown above is m ade up of two sections, Inputs
and Outputs. The Inputs section t ells the software which input channel is used for
each sensor, and what the engineering units are. In the case of the optional
conductivity and barometric pres s ur e s ens ors; there is a checkbox for indicating
manual entry, and a numerical field for inputting manual conductivity and pressure
settings should a sensor not be used. The Outputs section controls the display of
the calculated values of dissolved oxygen c onc entration, percent saturation and
salinity. These values are calculated based on the sensor inputs, or manual entry.
There is a checkbox to enable the display and download of eac h par am eter, which
channel it will be displayed on, and the dis play units for concentration. The units of
saturation are fixed as percent, salinity is fixed at PSS (Practical Salinity Scale).
The Inputs Section in the screen above shows the W Q-FDO O
2 Sensor connected to
the logger input channel 1, with units in mbar. The water temperature sensor is
connected to channel 2, and is the temper ature output of the WQ-FDO sensor
calibrated in degrees Centigrade. F or the conductiv ity input, channel 3 is selected
in units of uS/cm. Manual entry is selected f or the barometric pressure sensor in
units of feet, zero feet is entered in t he data field (sea level).
The Outputs section shows the calculated ox y gen c onc entration displayed and
downloaded to channel 5 in units of mg/L, O
2 Saturation in percent displayed on
channel 6, and salinity calculated from c onduc tivity displayed on channel 7.
- 27 -
Page 28

Global Water
800-876-1172 • globalw.com
In the DO Setup tab the input channel number and units are defined; however, this is
only for the purpose of telling the software whic h c hannel data to use for
calculations. It is in the Analog setup tab t hat the calibration of each sensor is
performed, see section XI. If the DO sens or is physically connec ted to channel 1 of
the data logger; it must be defined in the DO t ab as channel 1, be pr oper ly c alibr ated
on channel 1 in the analog setup tab, and the units in eac h tab must match. A
warning message will appear when the units bet ween these two tabs do not match.
This is an example of a message warning
that the units for the WQ-FDO sensor on
channel 1 do not match in the Analog and
DO tabs. The units must match and be
spelled the same.
Below is an example of the Analog Setup screen for the FDO sensor system. Note
that the display channels for each s ens or and calculat ed r es ults match between this
screen and the DO Setup tab previously shown. Also that the Enable checkboxes
are checked to allow the display and download of the data. The WQ-FDO sensor is
required for this software to operate, both the partial pressure and temperatur e
outputs of the sensor must be connected to the logger. They need not be enabled
for display, but they must be connect ed. If the optional conductivity and barometric
pressure sensors are not connected and a m anual entry is used, the unused analog
channels can be connected to any other sensor . If any of the calculated output
values of saturation, concentration and salinity are not wanted for display and
download, they do not need to be enabled and the sens or c hannel c an be us ed for
any other type of sensor. If they are displayed, the analog channel they are
assigned to is unavailable, even
though there is no sensor
connected to it.
Calibration is required on all channels
that have a sensor connected.
Calculated channels of concentration,
saturation and salinity do not require
calibration values of Low and High
EU and Raw Data. Low and High
Display values for these calculated
numbers scale the display only.
- 28 -
Page 29

Global Water
800-876-1172 • globalw.com
XIV. Programming
Program Settings: The Program S ett ings button at the bottom of the setup menus
will cause all the setup and calibration inform ation to be programmed into the data
logger. A warning will
appear requiring the
use to confirm the
action. Click Yes to
program the logger
and No to cancel the
operation.
Back to Main Window: The Back to Main Menu button exits bac k to t he main
screen. If no settings have
changed, Exit will occur
immediately. If settings have
changed but not saved yet,
a message will appear that
asks the user if they would
like to save them now. If the
settings have changed but
not yet programmed into the
logger, another message will
be shown asking if the logger should be reprogr am m ed. These layers of protection
are designed to prevent the user from unintentionally changing settings or forgetting
to save the configuration file. Should t he s ett ings ac c identally be changed, a saved
configuration file can be loaded and used to r es tore the original settings.
- 29 -
Page 30

Global Water
800-876-1172 • globalw.com
XV. Connections:
Left Connector:
P2+ Pulse channel 2 +, connected to VBAT
P2 IN Pulse channel 2 pulse input
P1+ Pulse channel 1 +, connected to VBAT
P1 IN Pulse channel 2 pulse input
SMP+ Sample-On-Demand +, VBAT
SMPL Sample-On-Demand pulse input
GND Spare Ground
GND Spare Ground
VBAT Spare positive battery connection
VBAT Spare positive battery connection
GND Negat iv e battery connection
VBAT Positive battery connection
Right Connector:
V+ Switched sensor power
CH1 Analog channel 1 input
GND Sensor ground
V+ Switched sensor power
CH2 Analog channel 2 input
GND Sensor ground
V+ Switched sensor power
CH3 Analog channel 3 input
GND Sensor ground
V+ Switched sensor power
CH4 Analog channel 4 input
GND Sensor ground
V+ Switched sensor power
CH5 Analog channel 5 input
GND Sensor ground
V+ Switched sensor power
CH6 Analog channel 6 input
GND Sensor ground
V+ Switched sensor power
CH7 Analog channel 7 input
GND Sensor ground
GND Spare gr ound c onnec tion
- 30 -
Page 31

Global Water
800-876-1172 • globalw.com
XVI. Modem Cab le Diagram s:
Use the following wiring diagrams to m ak e a cable to c onnec t the GL500 Data
Logger to an external modem. Pre-wired c ables ar e av ailable from Global Water.
- 31 -
Page 32

XVII. Maintenance:
a. There are no user-serviceable parts inside the Dat a Logger .
b. Global Water recommends checking the battery on a regular basis, the
period depending on the number of sensors, sample interval,
temperature and the type of batter y used.
c. Consult the WQ-FDO Sensor manual for information on the dissolved
oxygen sensor maintenance.
XVIII. Troubleshooting:
Issue: Logger is reading incorrectly .
a. Verify the power source is supplying enough voltage. The data logger
requires about 5 volts to operate. Consult the power requirements for
the individual sensors. The Global Wat er WQ-FDO sensor requires a
minimum of 10 volts between the red and black leads.
b. The WQ-FDO sensor cap has a limited lifespan of approxim ately one
year, depending on use. If the sensor is not operating pr oper ly ,
replace the membrane cap. Calibration of the WQ-FDO sensor should
not be necessary when replacing the cap. All calibrat ion information
for each sensor cap is stored in a memory c hip inside the c ap itself.
This information is used to recalibrate the sensor each time the cap is
replaced.
c. The WQ -FDO sensor partial pressure output has been fact or y
calibrated for an output of 4.00-20.00mA ov er the range of 0-400mbar;
and for the temperature output 4.00-20.00mA over 0-50ºC. Because
dissolved oxygen levels vary wit h tem per ature, atmospheric pressure
and salinity; an exact calibration can be diff ic ult using the sensor
alone. A current loop meter is the best way to recalibrate the DO
sensor to the logger.
d. An approximate check of the WQ-FDO sensor perform anc e c an be
done using this method. Place a clean glass of fres h water with the
surface exposed to the open air for at least 24 hours. Maintaining a
fairly constant temperature will im pr ov e the accuracy of this test. The
percentage of oxygen in air is 20.1% and in 100% saturated water the
partial pressure of the oxygen in water will be the s ame as in the air.
Multiple the atmospheric pressure in y our ar ea by 20.1% to find out the
Global Water
800-876-1172 • globalw.com
- 32 -
Page 33

Global Water
800-876-1172 • globalw.com
partial pressure of the oxygen in the water. The sensor should read
about this pressure. For example, at sea level the average
atmospheric pressure is 1013mbar. The partial pressure of oxygen in
water exposed to air for a period of time will be about 0. 21 x 1013mbar
or 212mbar. Because factors like atmospheric pressure and
temperature are constantly changing, this is not a recommended way
of calibration. This should be done for perfor m anc e c hec k s only .
e. Besides oxygen partial pressure, temperature is also important in
calculating oxygen levels. The WQ-FDO sensor has a temperature
output than can be checked. Compare the temperatur e r eading of the
sensor in water to that of another measurem ent device. A stable
temperature can also be made with ice wat er . A mixture of water with
lots of ice being stirred constantly can achieve a stable ice water
temperature of 32ºF (or 0º C) +.2F.
f. Check the logger and other sensor calibrations and recalibrate if
necessary, saving the setup file first as described in section IX.
Because dissolved oxygen is dependent on t em per ature, pressure and
conductivity; it is important to have accurate data for the software to
make these calculations. Save the new set up file under a different
name each time the logger is recalibrated.
Issue: Cannot communicate with t he logger .
a. Verify that sufficient power is applied and wired correctly.
b. Check the communication cable.
c. If the connection is through the USB port, use the Windows Device
Manager to confirm that the driver is loaded and the correct virtual
COM port is selected in the connection menu of the G lobal Logger
software, as described in sections I II and IV.
d. Check the Device Manager in your operating sy s tem and confirm that
the USB COM port is not being used by another device.
e. Try reducing the baud rate in the connection screen of the Global
Logger software.
f. Try switching fr om R S -232 to USB or USB to RS-232.
- 33 -
Page 34

XIX. Customer Support:
Call Global Water for tech support: 800-876-1172 or 979-690-5560 (many
problems can be solved over the phone). Fax: 979-690-0440 or E-mail:
globalw@globalw.com.
When calling for tech support, have the following information ready:
1. Model #.
2. Unit serial number.
3. P.O.# the equipment was purchased on.
4. Our sales number or the invoice number.
5. Repair instructions and/or specific problems relating to the
product.
Be prepared to describe the problem you are experiencing including
specific details of the application, installation, and any additional pertinent
information.
In the event that the equipment needs to be returned t o the factory for any
reason, please call to obtain an RMA# (Ret ur n Material Authorization). Do
not return items without an RMA# displayed on the outside of the
package. Include a written statement desc ribing the problems.
Global Water
800-876-1172 • globalw.com
Send the package with shipping prepaid to our factory address. Insure
your shipment; Global Water’s warr anty does not cover damage incurred
during transit.
- 34 -
 Loading...