

Page 1
Question ID: b1b5300b
Assessment Test Domain Skill Difficulty
SAT Math Problem-Solving and
Data Analysis
Probability and
conditional probability
Medium
Question
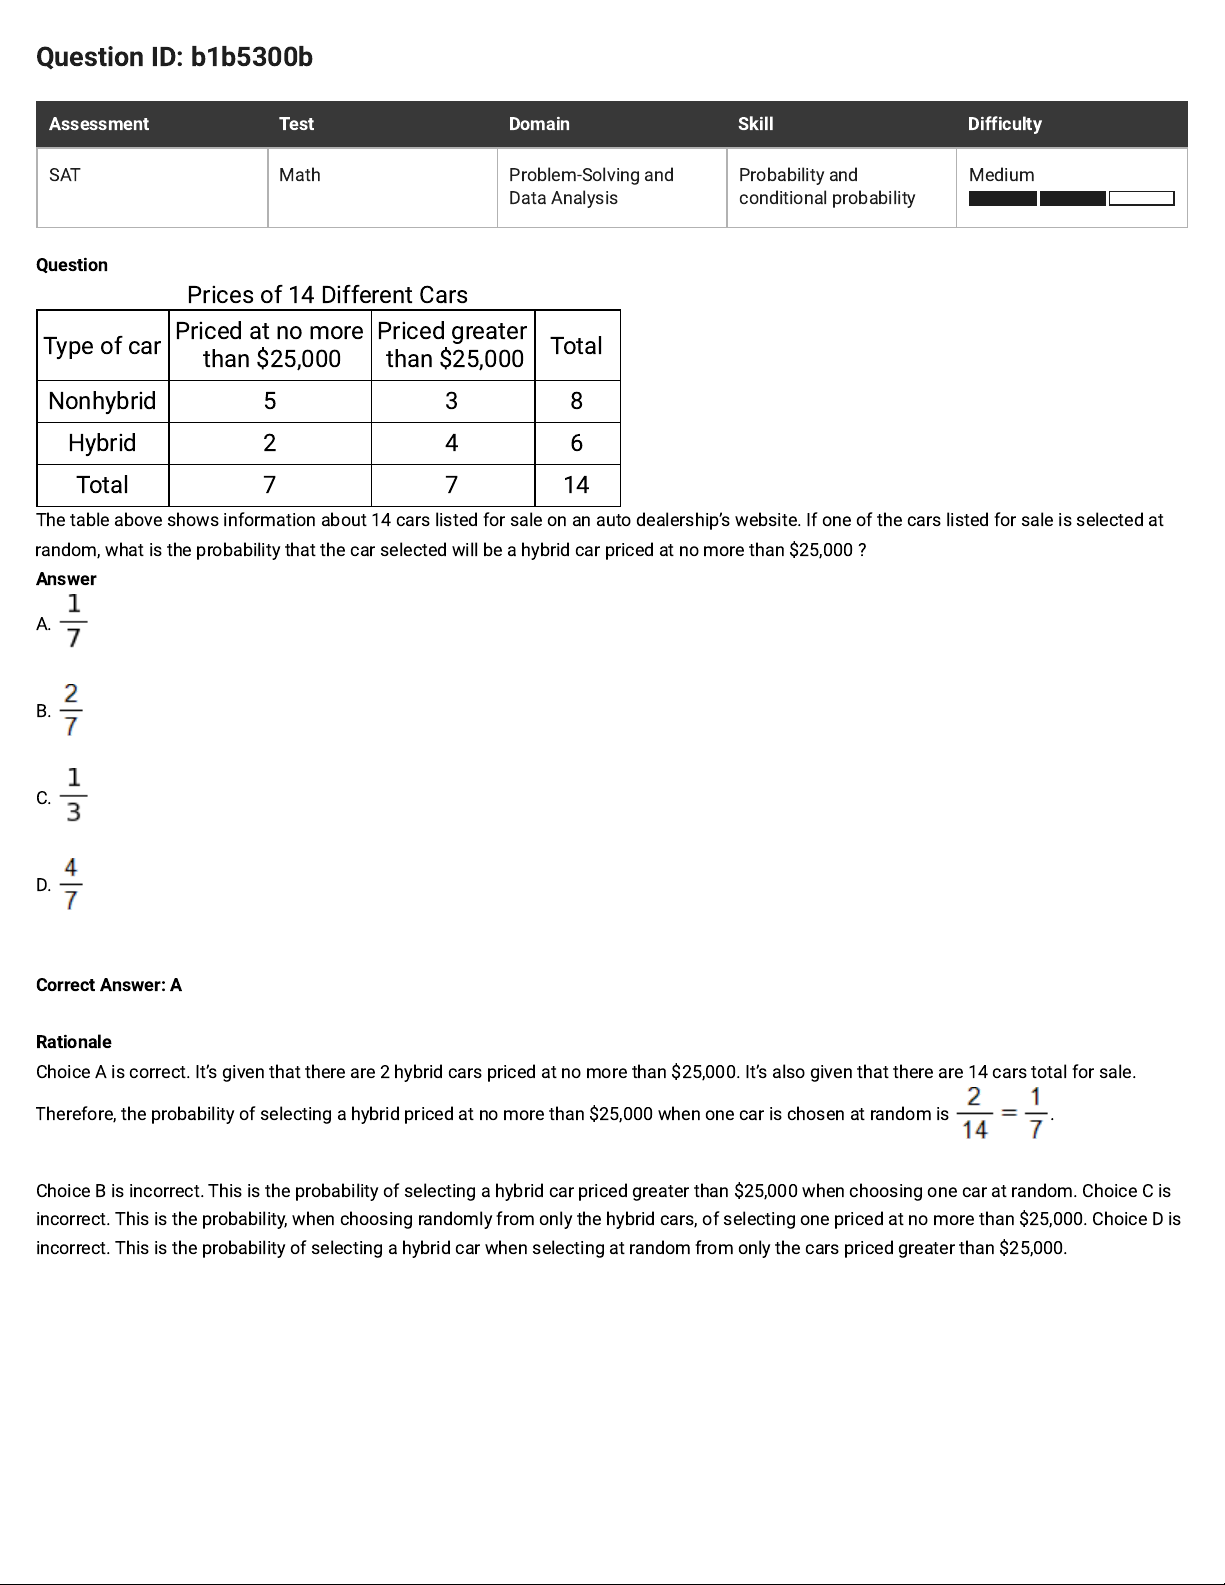
Prices of 14 Different Cars
Type of car
Priced at no more
than $25,000
Priced greater
than $25,000
Total
Nonhybrid 5 3 8
Hybrid 2 4 6
Total 7 7 14
The table above shows information about 14 cars listed for sale on an auto dealership’s website. If one of the cars listed for sale is selected at
random, what is the probability that the car selected will be a hybrid car priced at no more than $25,000 ?
Answer
A.
B.
C.
D.
Correct Answer: A
Rationale
Choice A is correct. It’s given that there are 2 hybrid cars priced at no more than $25,000. It’s also given that there are 14 cars total for sale.
Therefore, the probability of selecting a hybrid priced at no more than $25,000 when one car is chosen at random is .
Choice B is incorrect. This is the probability of selecting a hybrid car priced greater than $25,000 when choosing one car at random. Choice C is
incorrect. This is the probability, when choosing randomly from only the hybrid cars, of selecting one priced at no more than $25,000. Choice D is
incorrect. This is the probability of selecting a hybrid car when selecting at random from only the cars priced greater than $25,000.
Page 2
Question ID: 1353b86e
Assessment Test Domain Skill Difficulty
SAT Math Problem-Solving and
Data Analysis
Probability and
conditional probability
Easy
Question
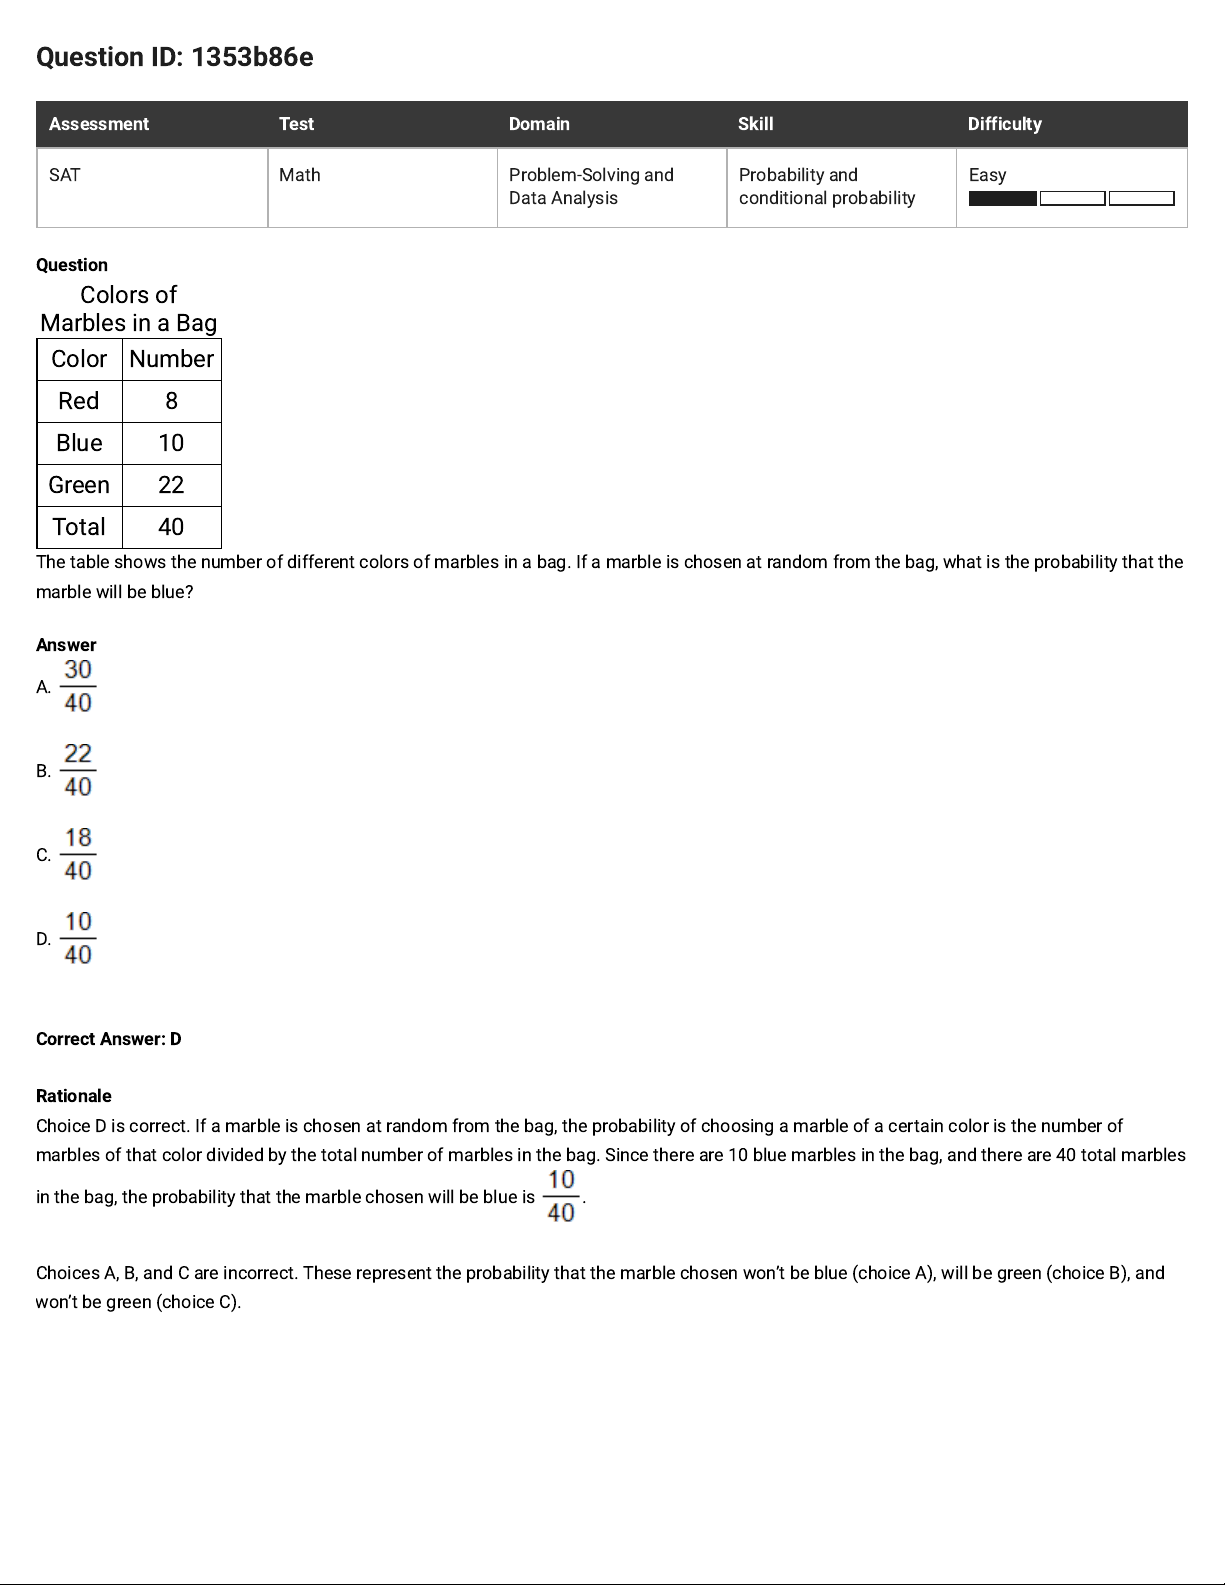
Colors of
Marbles in a Bag
Color Number
Red 8
Blue 10
Green 22
Total 40
The table shows the number of different colors of marbles in a bag. If a marble is chosen at random from the bag, what is the probability that the
marble will be blue?
Answer
A.
B.
C.
D.
Correct Answer: D
Rationale
Choice D is correct. If a marble is chosen at random from the bag, the probability of choosing a marble of a certain color is the number of
marbles of that color divided by the total number of marbles in the bag. Since there are 10 blue marbles in the bag, and there are 40 total marbles
in the bag, the probability that the marble chosen will be blue is .
Choices A, B, and C are incorrect. These represent the probability that the marble chosen won’t be blue (choice A), will be green (choice B), and
won’t be green (choice C).
Page 3
Question ID: d89c1513
Assessment Test Domain Skill Difficulty
SAT Math Problem-Solving and
Data Analysis
Probability and
conditional probability
Easy
Question
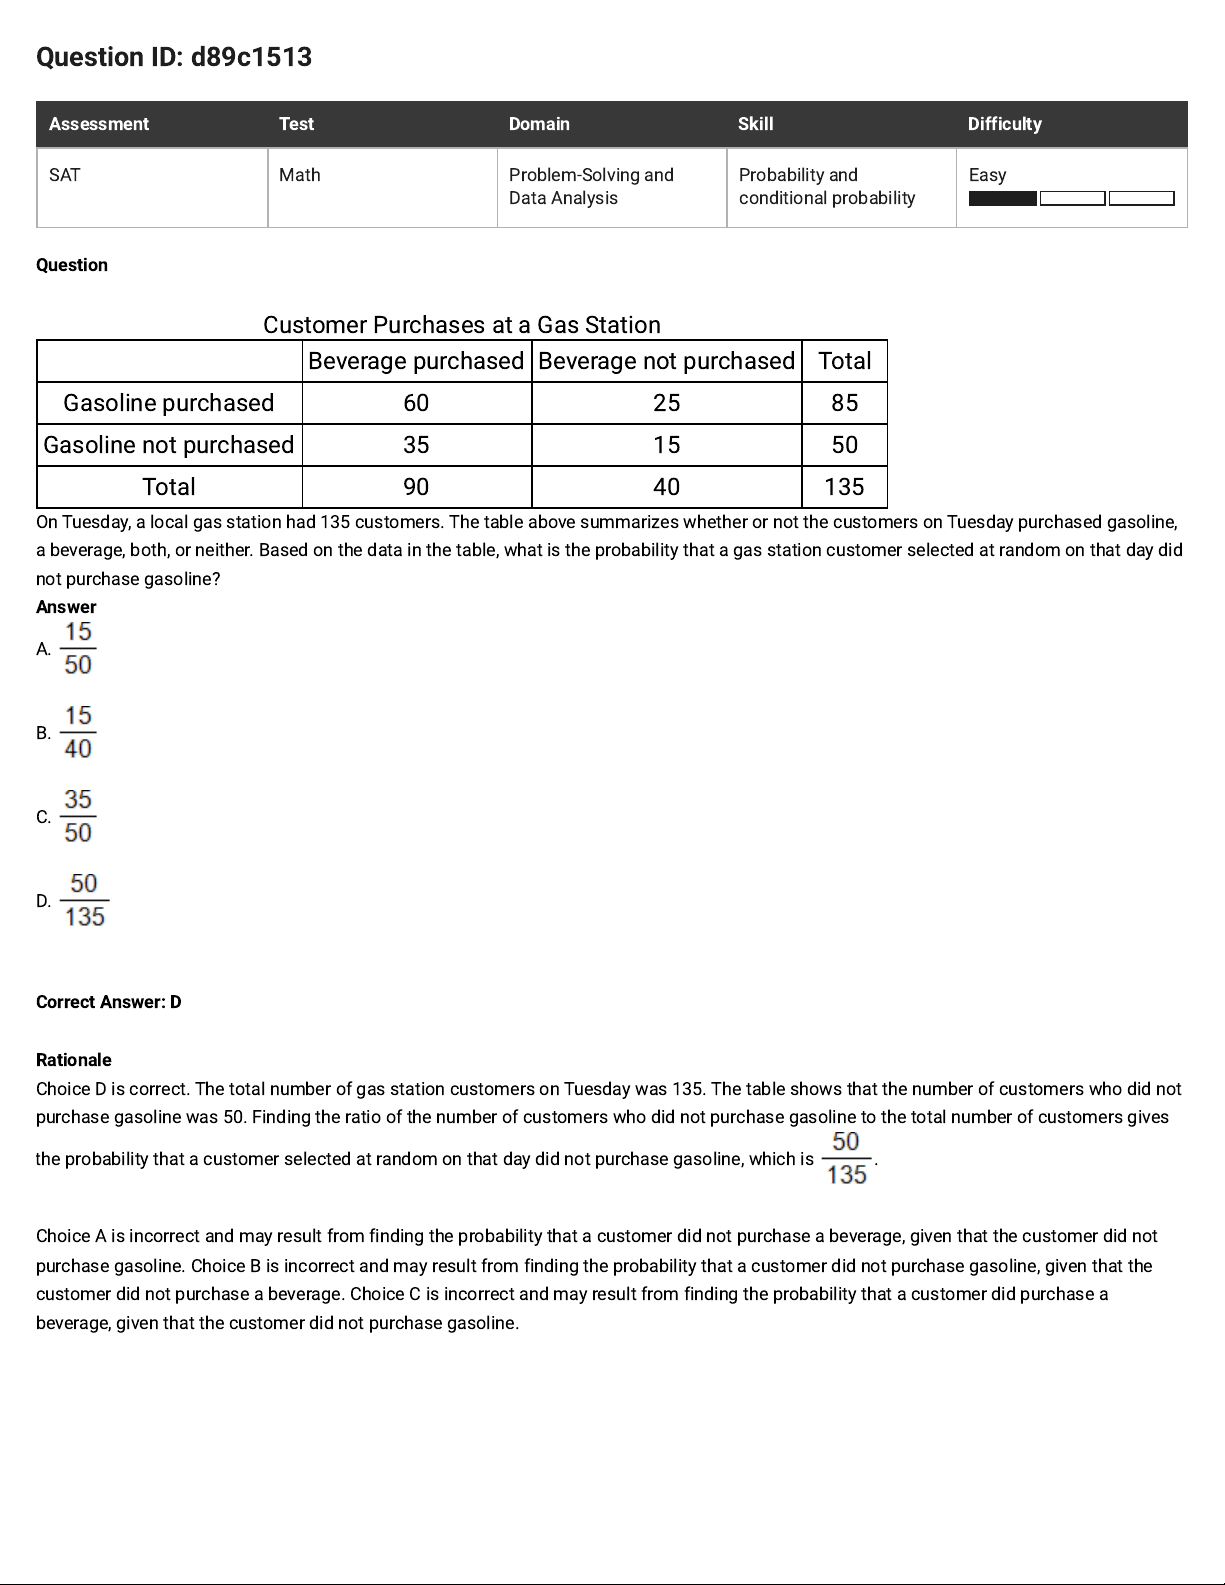
Customer Purchases at a Gas Station
Beverage purchased Beverage not purchased Total
Gasoline purchased 60 25 85
Gasoline not purchased 35 15 50
Total 90 40 135
On Tuesday, a local gas station had 135 customers. The table above summarizes whether or not the customers on Tuesday purchased gasoline,
a beverage, both, or neither. Based on the data in the table, what is the probability that a gas station customer selected at random on that day did
not purchase gasoline?
Answer
A.
B.
C.
D.
Correct Answer: D
Rationale
Choice D is correct. The total number of gas station customers on Tuesday was 135. The table shows that the number of customers who did not
purchase gasoline was 50. Finding the ratio of the number of customers who did not purchase gasoline to the total number of customers gives
the probability that a customer selected at random on that day did not purchase gasoline, which is .
Choice A is incorrect and may result from finding the probability that a customer did not purchase a beverage, given that the customer did not
purchase gasoline. Choice B is incorrect and may result from finding the probability that a customer did not purchase gasoline, given that the
customer did not purchase a beverage. Choice C is incorrect and may result from finding the probability that a customer did purchase a
beverage, given that the customer did not purchase gasoline.
Page 4
Question ID: e1ad3d41
Assessment Test Domain Skill Difficulty
SAT Math Problem-Solving and
Data Analysis
Probability and
conditional probability
Medium
Question
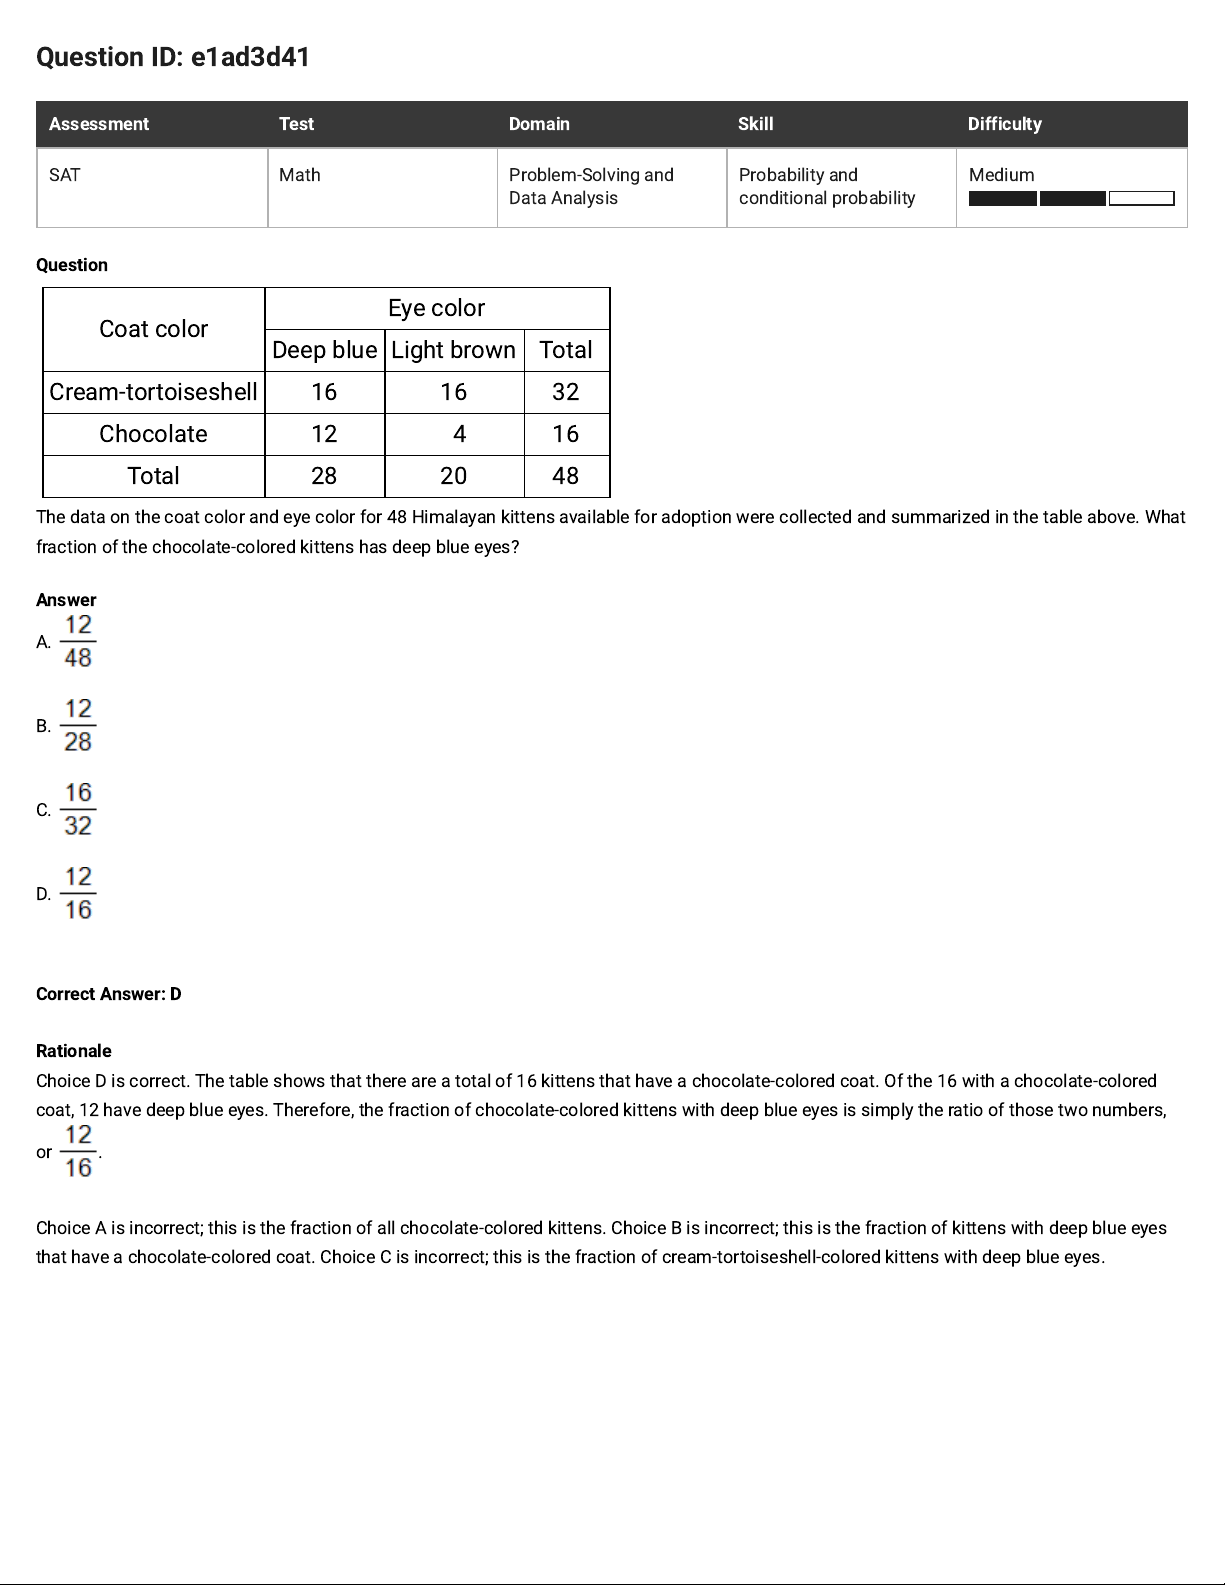
Coat color
Eye color
Deep blue Light brown Total
Cream-tortoiseshell 16 16 32
Chocolate 12
4 16
Total 28 20 48
The data on the coat color and eye color for 48Himalayankittens available for adoption were collected and summarized in the table above. What
fraction of the chocolate-colored kittens has deep blue eyes?
Answer
A.
B.
C.
D.
Correct Answer: D
Rationale
Choice D is correct. The table shows that there are a total of 16 kittens that have a chocolate-colored coat. Of the 16 with a chocolate-colored
coat, 12 have deep blue eyes. Therefore, the fraction of chocolate-colored kittens with deep blue eyes is simply the ratio of those two numbers,
or
.
Choice A is incorrect; this is the fraction of all chocolate-colored kittens. Choice B is incorrect; this is the fraction of kittens with deep blue eyes
that have a chocolate-colored coat. Choice C is incorrect; this is the fraction of cream-tortoiseshell-colored kittens with deep blue eyes.
Page 5
Question ID: 46545dd6
Assessment Test Domain Skill Difficulty
SAT Math Problem-Solving and
Data Analysis
Probability and
conditional probability
Easy
Question
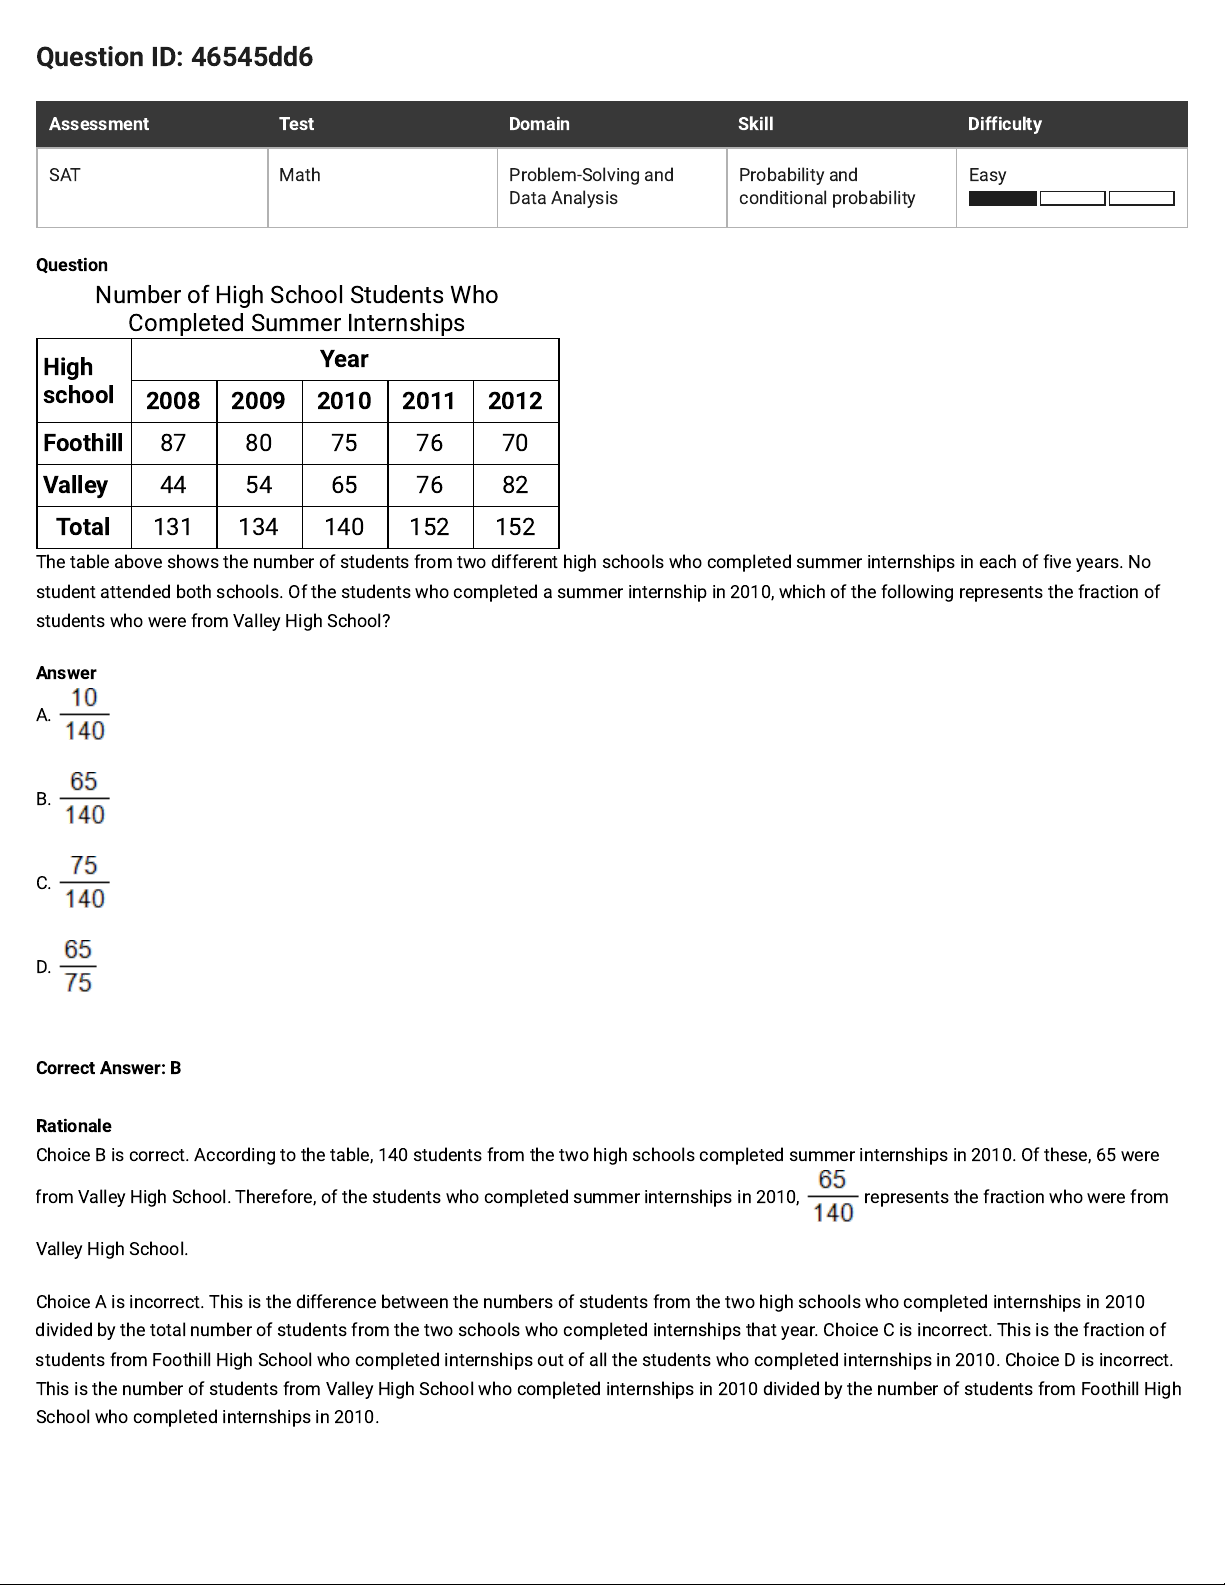
Number of High School Students Who
Completed Summer Internships
High
school
Year
2008 2009 2010 2011 2012
Foothill
87 80 75 76 70
Valley
44 54 65 76 82
Total
131 134 140 152 152
The table above shows the number of students from two different high schools who completed summer internships in each of five years. No
student attended both schools. Of the students who completed a summer internship in 2010, which of the following represents the fraction of
students who were from Valley High School?
Answer
A.
B.
C.
D.
Correct Answer: B
Rationale
Choice B is correct. According to the table, 140 students from the two high schools completed summer internships in 2010. Of these, 65 were
from Valley High School. Therefore, of the students who completed summer internships in 2010, represents the fraction who were from
Valley High School.
Choice A is incorrect. This is the difference between the numbers of students from the two high schools who completed internships in 2010
divided by the total number of students from the two schools who completed internships that year. Choice C is incorrect. This is the fraction of
students from Foothill High School who completed internships out of all the students who completed internships in 2010. Choice D is incorrect.
This is the number of students from Valley High School who completed internships in 2010 divided by the number of students from Foothill High
School who completed internships in 2010.
Page 6
Question ID: 16cea46c
Assessment Test Domain Skill Difficulty
SAT Math Problem-Solving and
Data Analysis
Probability and
conditional probability
Easy
Question
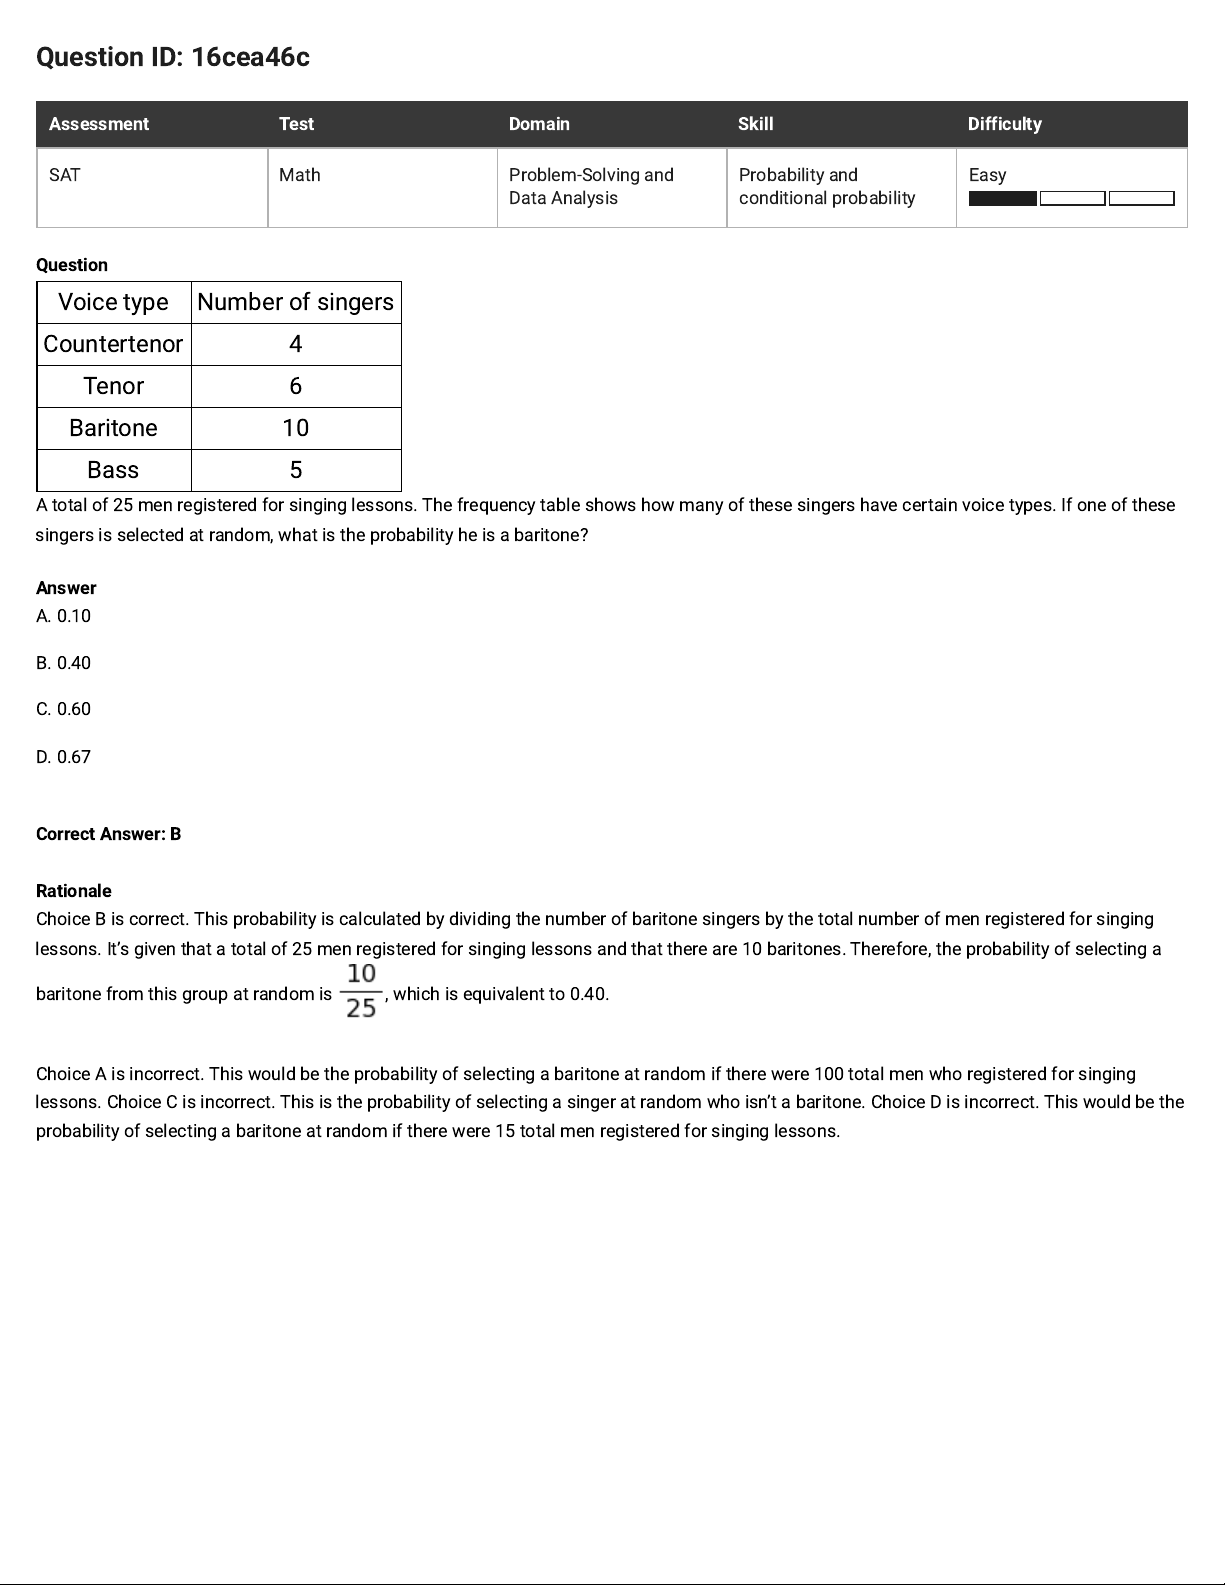
Voice type Number of singers
Countertenor 4
Tenor 6
Baritone 10
Bass 5
A total of 25 men registered for singing lessons. The frequency table shows how many of these singers have certain voice types. If one of these
singers is selected at random, what is the probability he is a baritone?
Answer
A. 0.10
B. 0.40
C. 0.60
D. 0.67
Correct Answer: B
Rationale
Choice B is correct. This probability is calculated by dividing the number of baritone singers by the total number of men registered for singing
lessons. It’s given that a total of 25 men registered for singing lessons and that there are 10 baritones. Therefore, the probability of selecting a
baritone from this group at random is , which is equivalent to 0.40.
Choice A is incorrect. This would be the probability of selecting a baritone at random if there were 100 total men who registered for singing
lessons. Choice C is incorrect. This is the probability of selecting a singer at random who isn’t a baritone. Choice D is incorrect. This would be the
probability of selecting a baritone at random if there were 15 total men registered for singing lessons.
Page 7
Question ID: b680e76d
Assessment Test Domain Skill Difficulty
SAT Math Problem-Solving and
Data Analysis
Probability and
conditional probability
Easy
Question
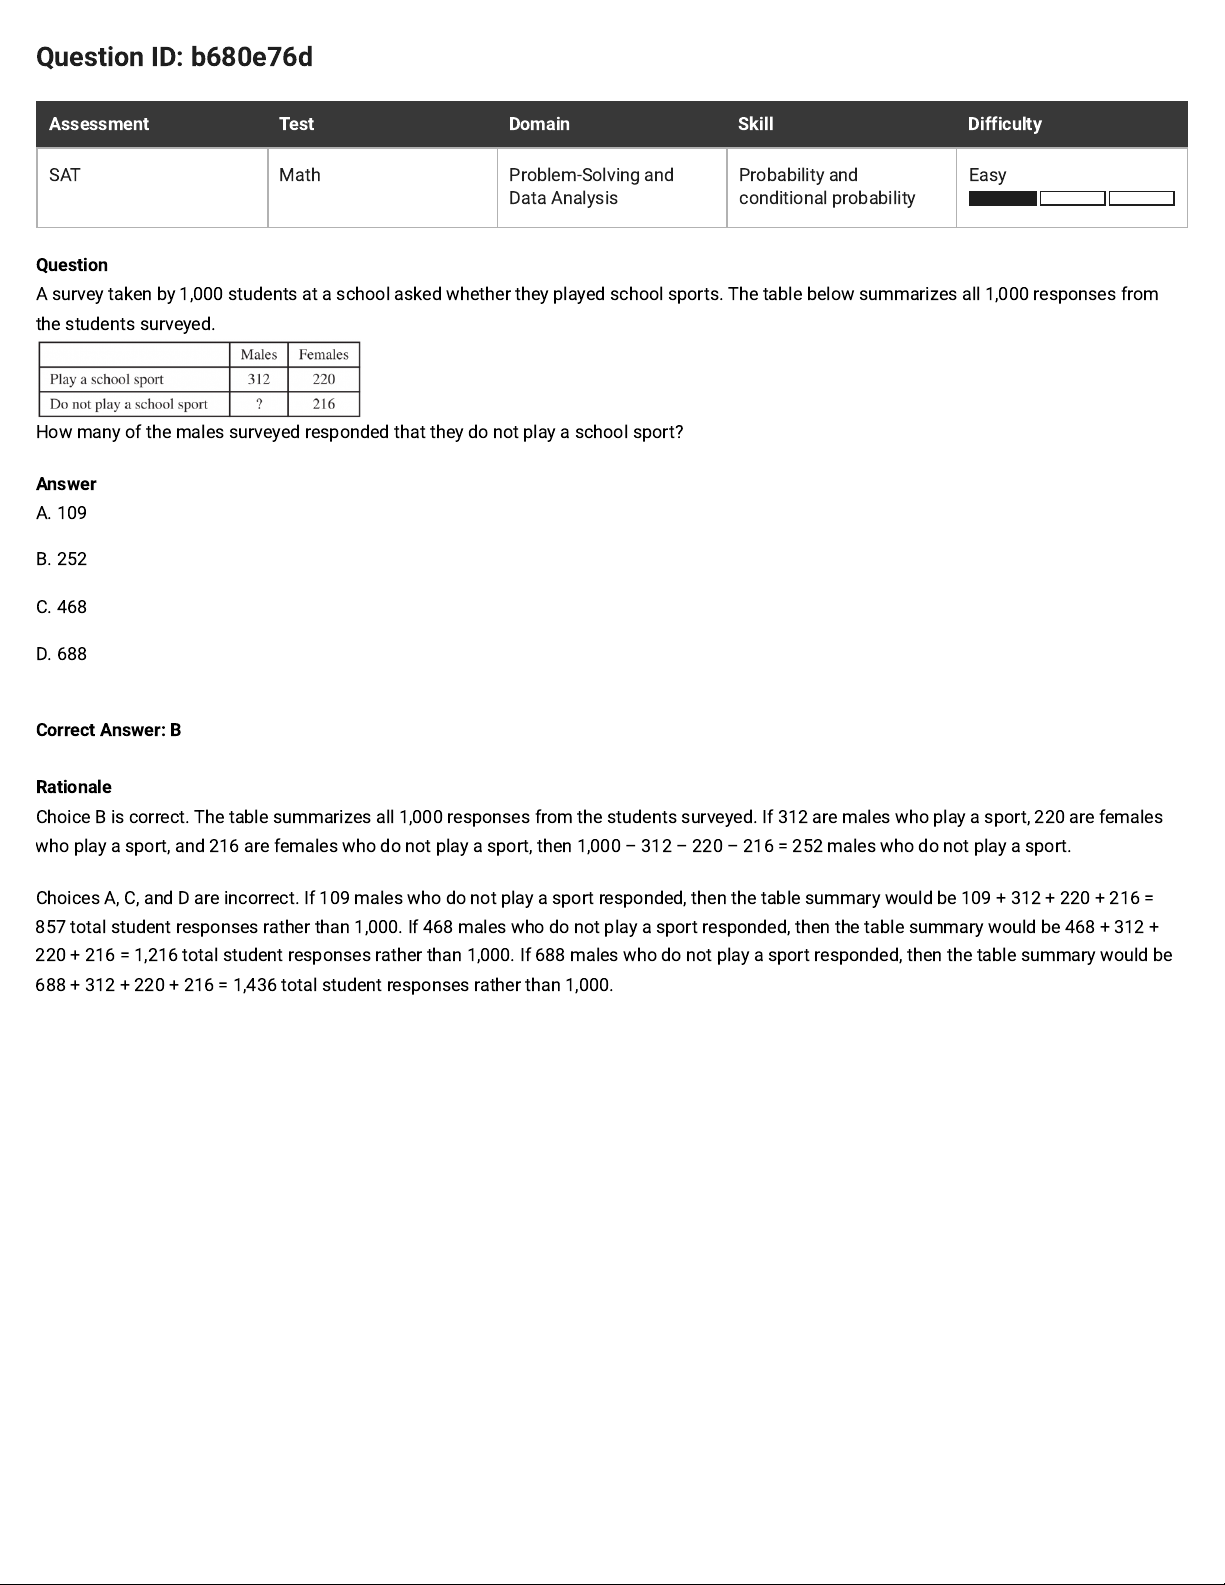
A survey taken by 1,000students at a school asked whether they played school sports. The table below summarizes all 1,000 responses from
the students surveyed.
How many of the males surveyed responded that they do not play a school sport?
Answer
A. 109
B. 252
C. 468
D. 688
Correct Answer: B
Rationale
Choice B is correct. The table summarizes all 1,000 responses from the students surveyed. If 312 are males who play a sport, 220 are females
who play a sport, and 216 are females who do not play a sport, then 1,000 – 312 – 220 – 216 = 252 males who do not play a sport.
Choices A, C, and D are incorrect. If 109 males who do not play a sport responded, then the table summary would be 109 + 312 + 220 + 216 =
857 total student responses rather than 1,000. If 468 males who do not play a sport responded, then the table summary would be 468 + 312 +
220 + 216 = 1,216 total student responses rather than 1,000. If 688 males who do not play a sport responded, then the table summary would be
688 + 312 + 220 + 216 = 1,436 total student responses rather than 1,000.
Page 8
Question ID: d4413871
Assessment Test Domain Skill Difficulty
SAT Math Problem-Solving and
Data Analysis
Probability and
conditional probability
Hard
Question
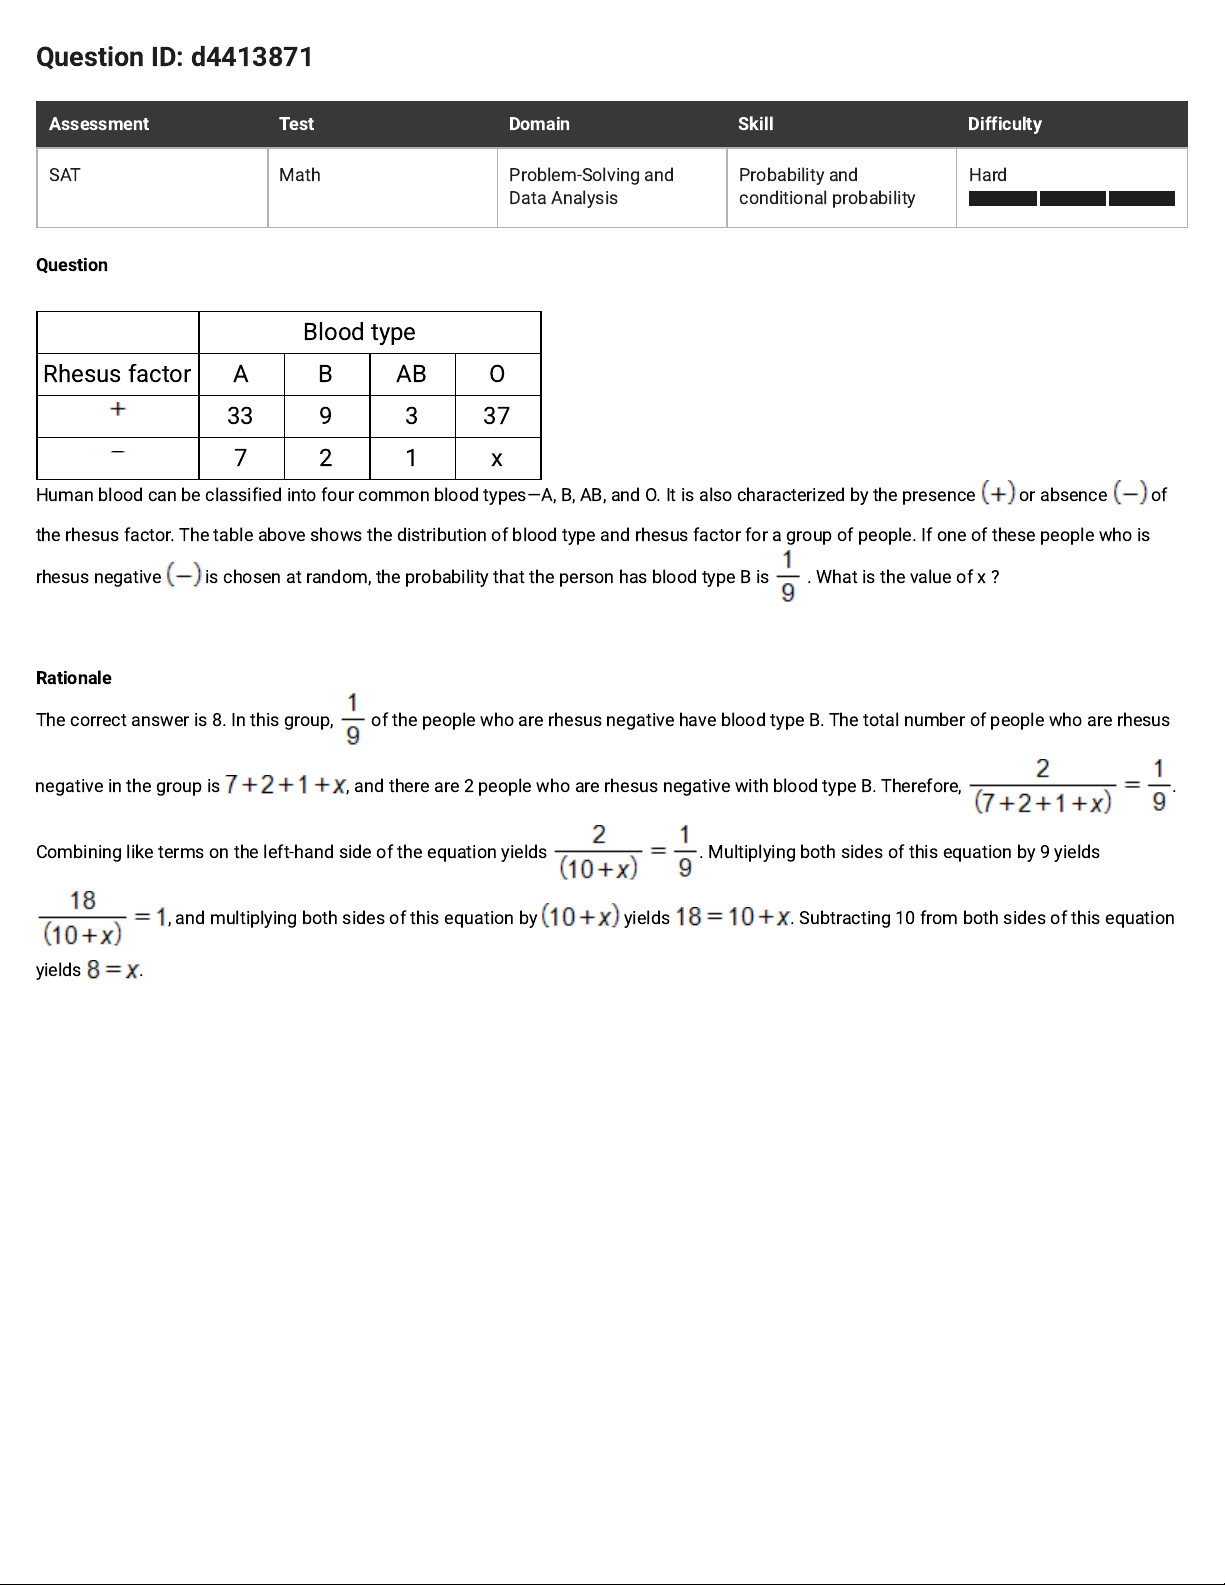
Blood type
Rhesus factor A B AB O
33 9 3 37
7 2 1 x
Human blood can be classified into four common blood types—A, B, AB, and O. It is also characterized by the presence or absence of
the rhesus factor. The table above shows the distribution of blood type and rhesus factor for a group of people. If one of these people who is
rhesus negative is chosen at random, the probability that the person has blood type B is . What is the value of x ?
Rationale
The correct answer is 8. In this group, of the people who are rhesus negative have blood type B. The total number of people who are rhesus
negative in the group is , and there are 2 people who are rhesus negative with blood type B. Therefore, .
Combining like terms on the left-hand side of the equation yields . Multiplying both sides of this equation by 9 yields
, and multiplying both sides of this equation by yields . Subtracting 10 from both sides of this equation
yields .
Page 9
Question ID: 0301c5dc
Assessment Test Domain Skill Difficulty
SAT Math Problem-Solving and
Data Analysis
Probability and
conditional probability
Medium
Question
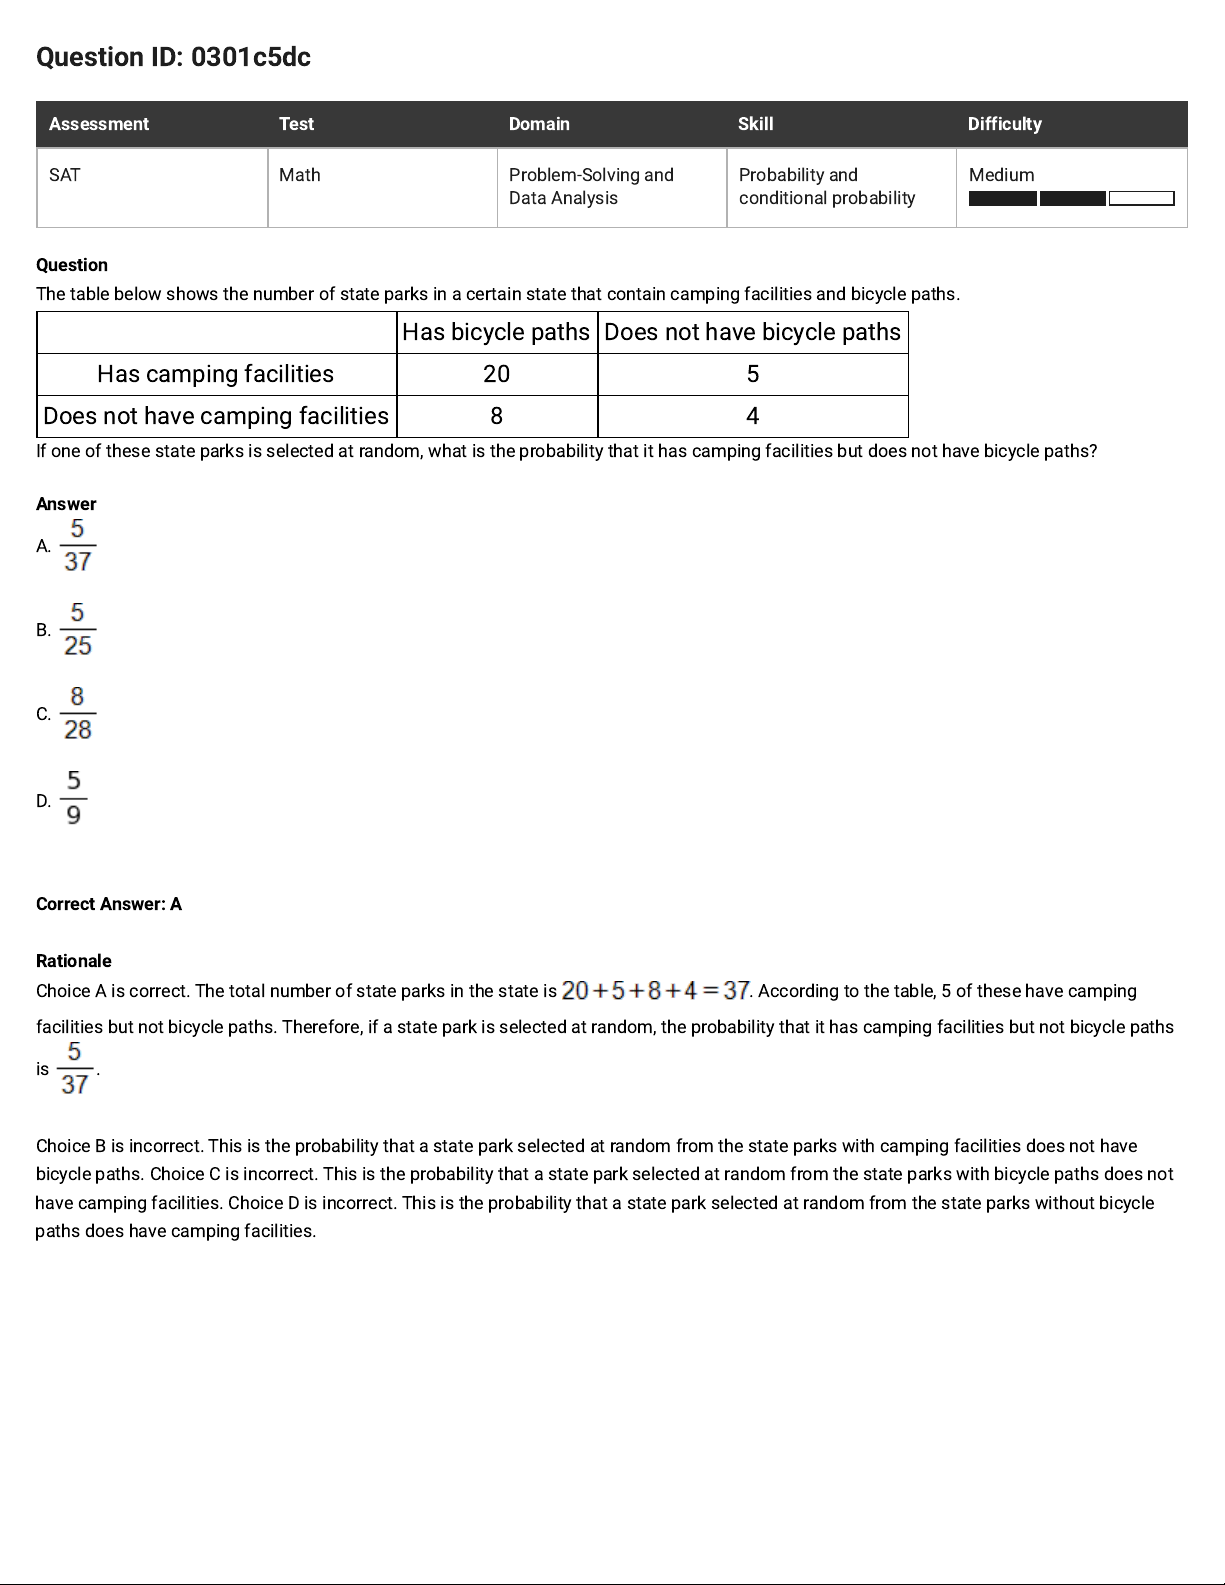
The table below shows the number of state parks in a certain state that contain camping facilities and bicycle paths.
Has bicycle paths Does not have bicycle paths
Has camping facilities 20 5
Does not have camping facilities 8 4
If one of these state parks is selected at random, what is the probability that it has camping facilities but does not have bicycle paths?
Answer
A.
B.
C.
D.
Correct Answer: A
Rationale
Choice A is correct. The total number of state parks in the state is . According to the table, 5 of these have camping
facilities but not bicycle paths. Therefore, if a state park is selected at random, the probability that it has camping facilities but not bicycle paths
is .
Choice B is incorrect. This is the probability that a state park selected at random from the state parks with camping facilities does not have
bicycle paths. Choice C is incorrect. This is the probability that a state park selected at random from the state parks with bicycle paths does not
have camping facilities. Choice D is incorrect. This is the probability that a state park selected at random from the state parks without bicycle
paths does have camping facilities.
Page 10
Question ID: 60caadfd
Assessment Test Domain Skill Difficulty
SAT Math Problem-Solving and
Data Analysis
Probability and
conditional probability
Easy
Question
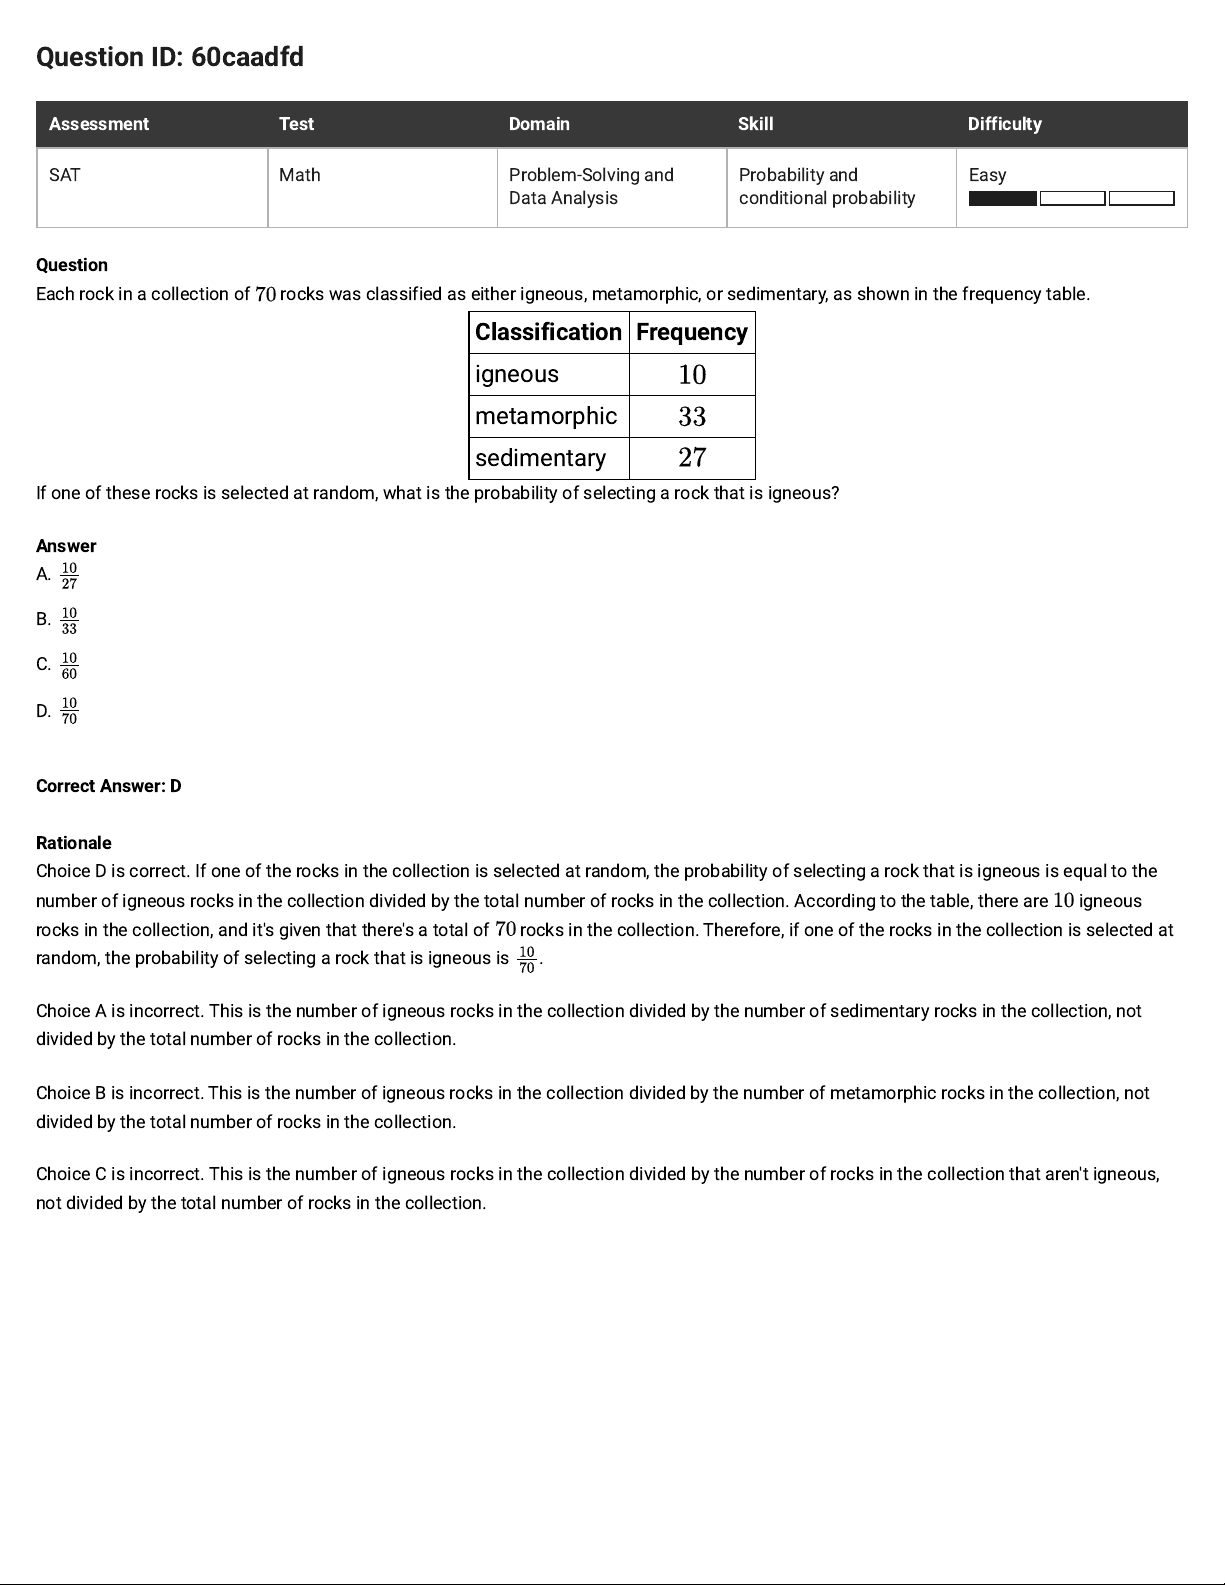
Each rock in a collection of rocks was classified as either igneous, metamorphic, or sedimentary, as shown in the frequency table.
Classification Frequency
igneous
metamorphic
sedimentary
If one of these rocks is selected at random, what is the probability of selecting a rock that is igneous?
Answer
A.
B.
C.
D.
Correct Answer: D
Rationale
Choice D is correct. If one of the rocks in the collection is selected at random, the probability of selecting a rock that is igneous is equal to the
number of igneous rocks in the collection divided by the total number of rocks in the collection. According to the table, there are igneous
rocks in the collection, and it's given that there's a total of rocks in the collection. Therefore, if one of the rocks in the collection is selected at
random, the probability of selecting a rock that is igneous is .
Choice A is incorrect. This is the number of igneous rocks in the collection divided by the number of sedimentary rocks in the collection, not
divided by the total number of rocks in the collection.
Choice B is incorrect. This is the number of igneous rocks in the collection divided by the number of metamorphic rocks in the collection, not
divided by the total number of rocks in the collection.
Choice C is incorrect. This is the number of igneous rocks in the collection divided by the number of rocks in the collection that aren't igneous,
not divided by the total number of rocks in the collection.
Page 11
Question ID: e5b5fbdd
Assessment Test Domain Skill Difficulty
SAT Math Problem-Solving and
Data Analysis
Probability and
conditional probability
Easy
Question
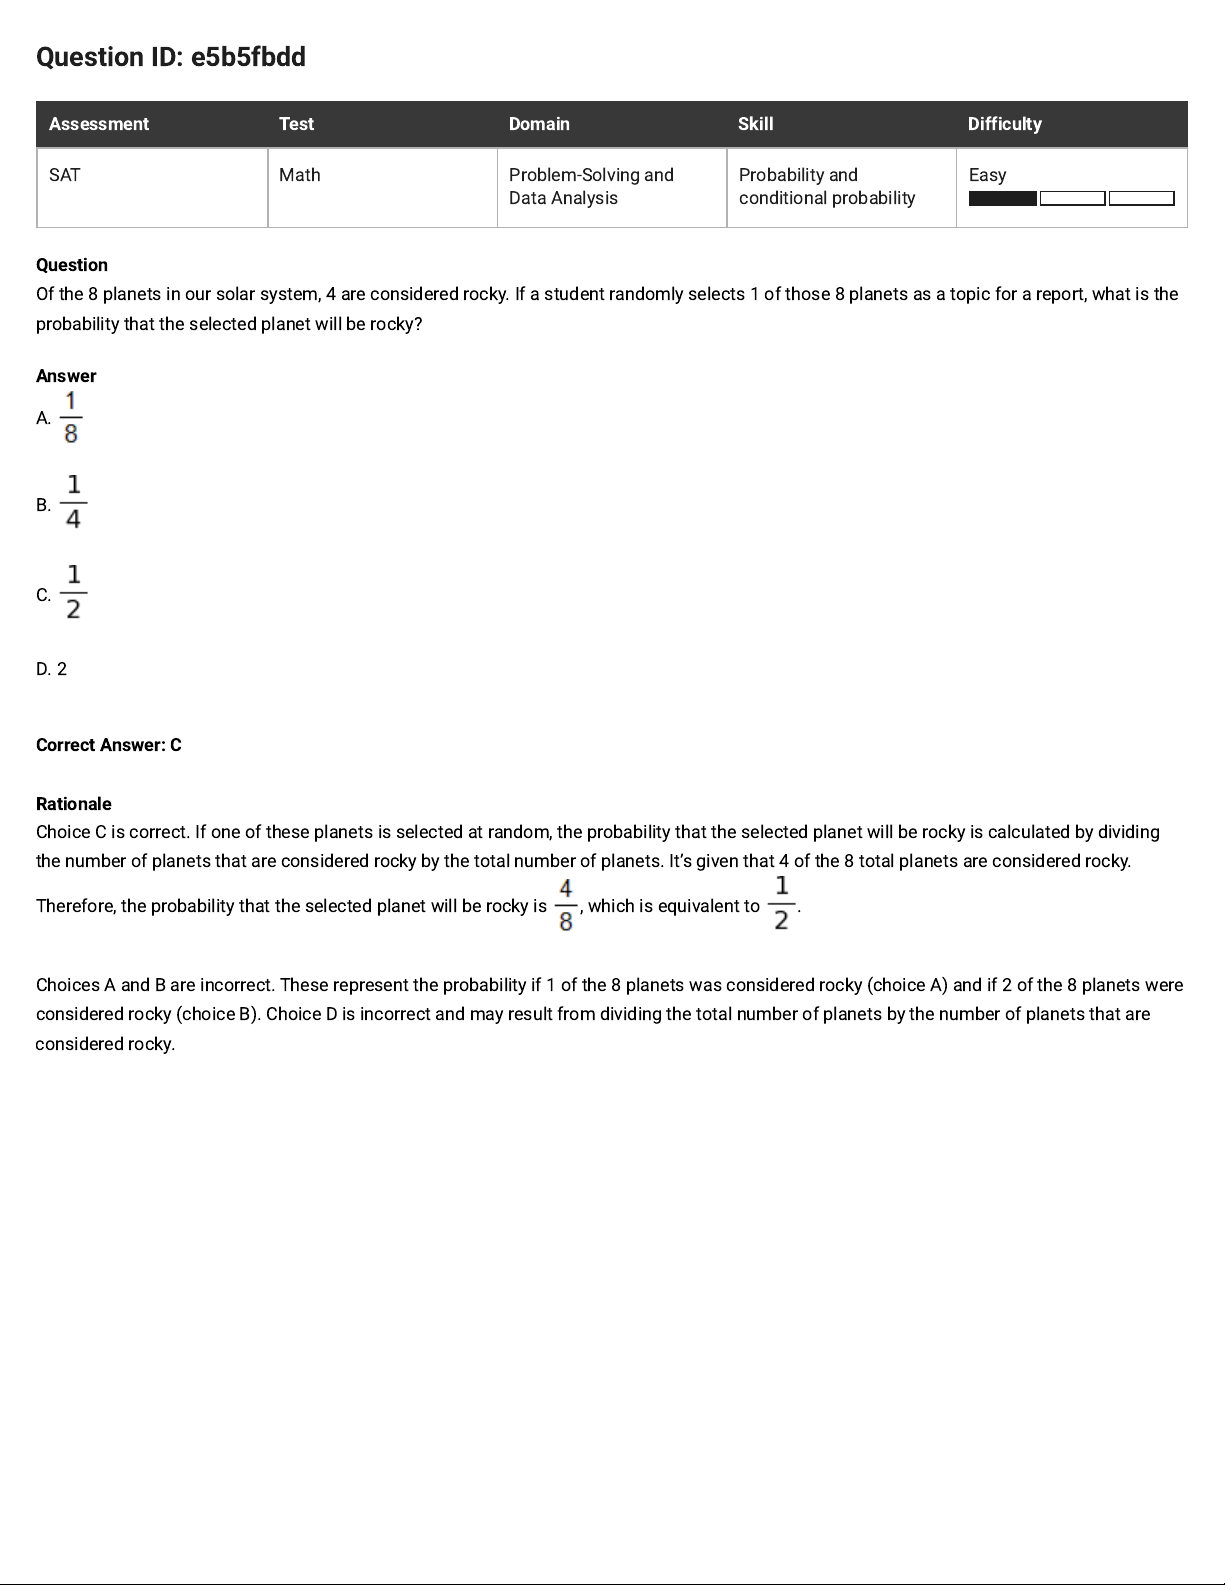
Of the 8 planets in our solar system, 4 are considered rocky. If a student randomly selects 1 of those 8 planets as a topic for a report, what is the
probability that the selected planet will be rocky?
Answer
A.
B.
C.
D. 2
Correct Answer: C
Rationale
Choice C is correct. If one of these planets is selected at random, the probability that the selected planet will be rocky is calculated by dividing
the number of planets that are considered rocky by the total number of planets. It’s given that 4 of the 8 total planets are considered rocky.
Therefore, the probability that the selected planet will be rocky is , which is equivalent to .
Choices A and B are incorrect. These represent the probability if 1 of the 8 planets was considered rocky (choice A) and if 2 of the 8 planets were
considered rocky (choice B). Choice D is incorrect and may result from dividing the total number of planets by the number of planets that are
considered rocky.
Page 12
Question ID: 2df8f293
Assessment Test Domain Skill Difficulty
SAT Math Problem-Solving and
Data Analysis
Probability and
conditional probability
Medium
Question
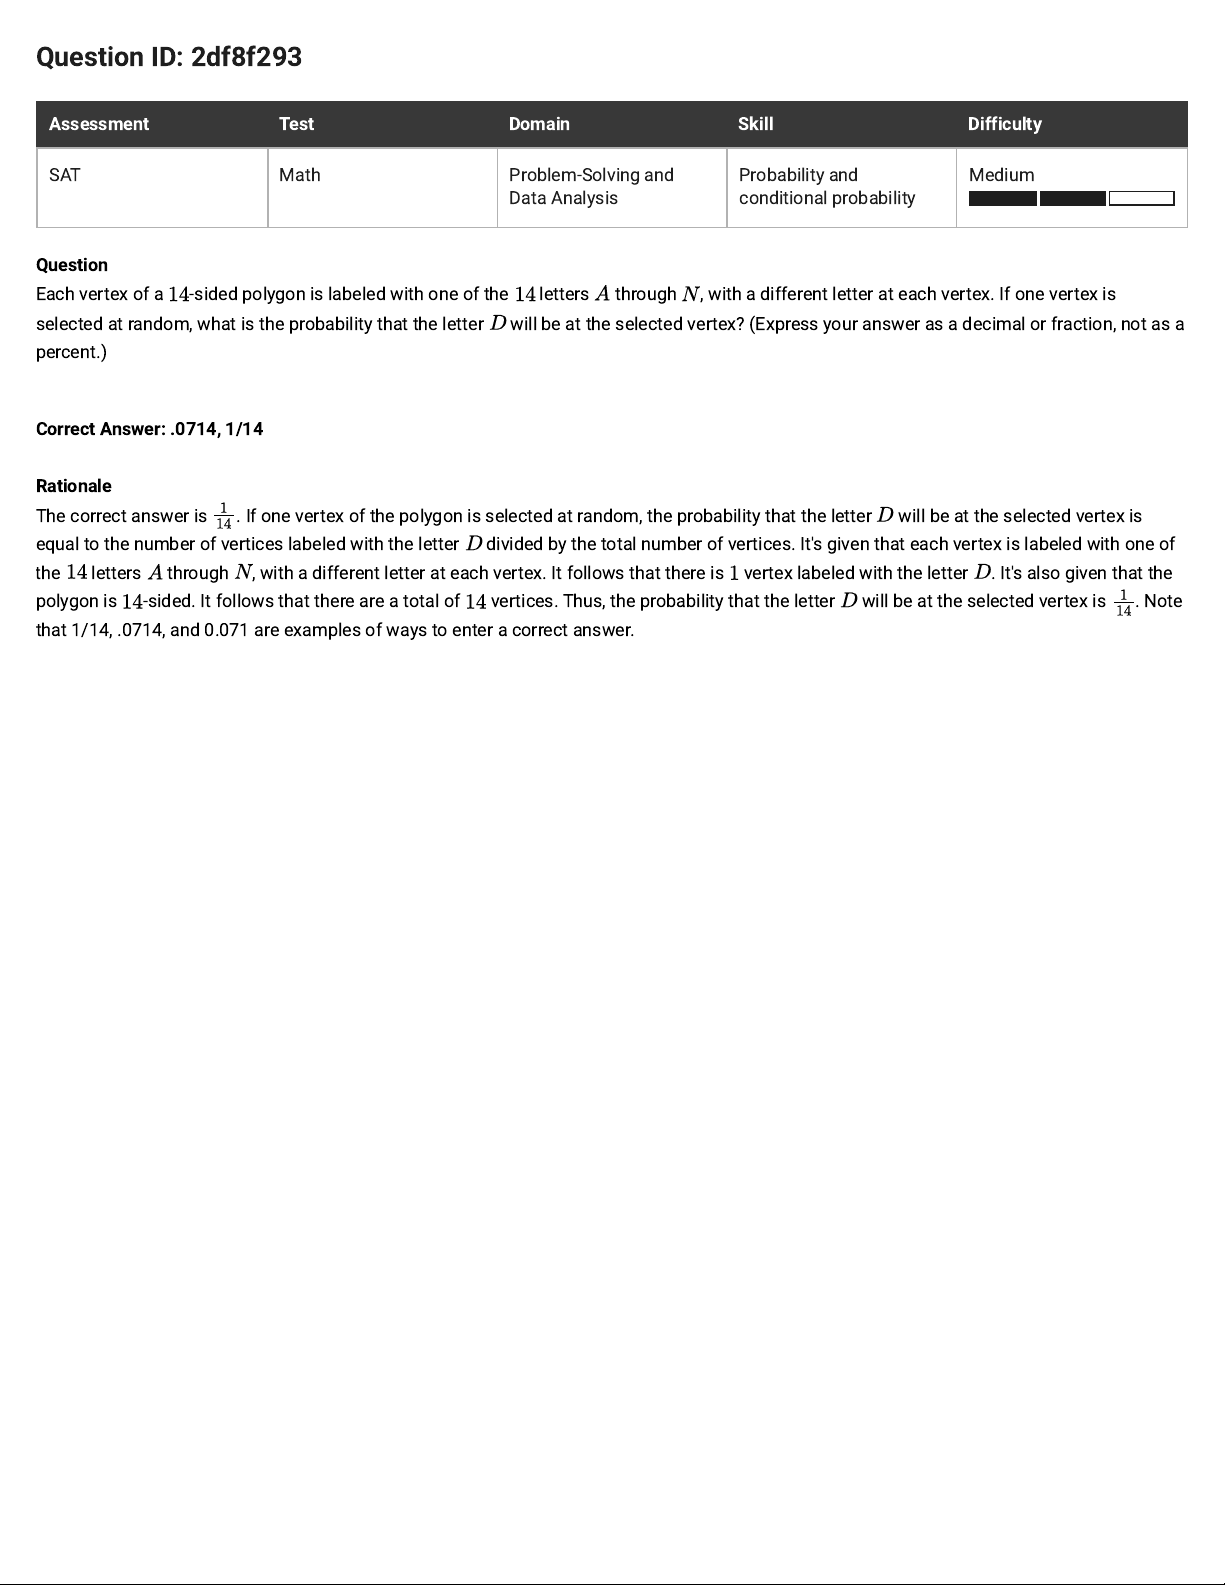
Each vertex of a -sided polygon is labeled with one of the letters through , with a different letter at each vertex. If one vertex is
selected at random, what is the probability that the letter will be at the selected vertex? (Express your answer as a decimal or fraction, not as a
percent.)
Correct Answer: .0714, 1/14
Rationale
The correct answer is . If one vertex of the polygon is selected at random, the probability that the letter will be at the selected vertex is
equal to the number of vertices labeled with the letter divided by the total number of vertices. It's given that each vertex is labeled with one of
the letters through , with a different letter at each vertex. It follows that there is vertex labeled with the letter . It's also given that the
polygon is -sided. It follows that there are a total of vertices. Thus, the probability that the letter will be at the selected vertex is . Note
that 1/14, .0714, and 0.071 are examples of ways to enter a correct answer.
Page 13
Question ID: ec7b0eb8
Assessment Test Domain Skill Difficulty
SAT Math Problem-Solving and
Data Analysis
Probability and
conditional probability
Easy
Question
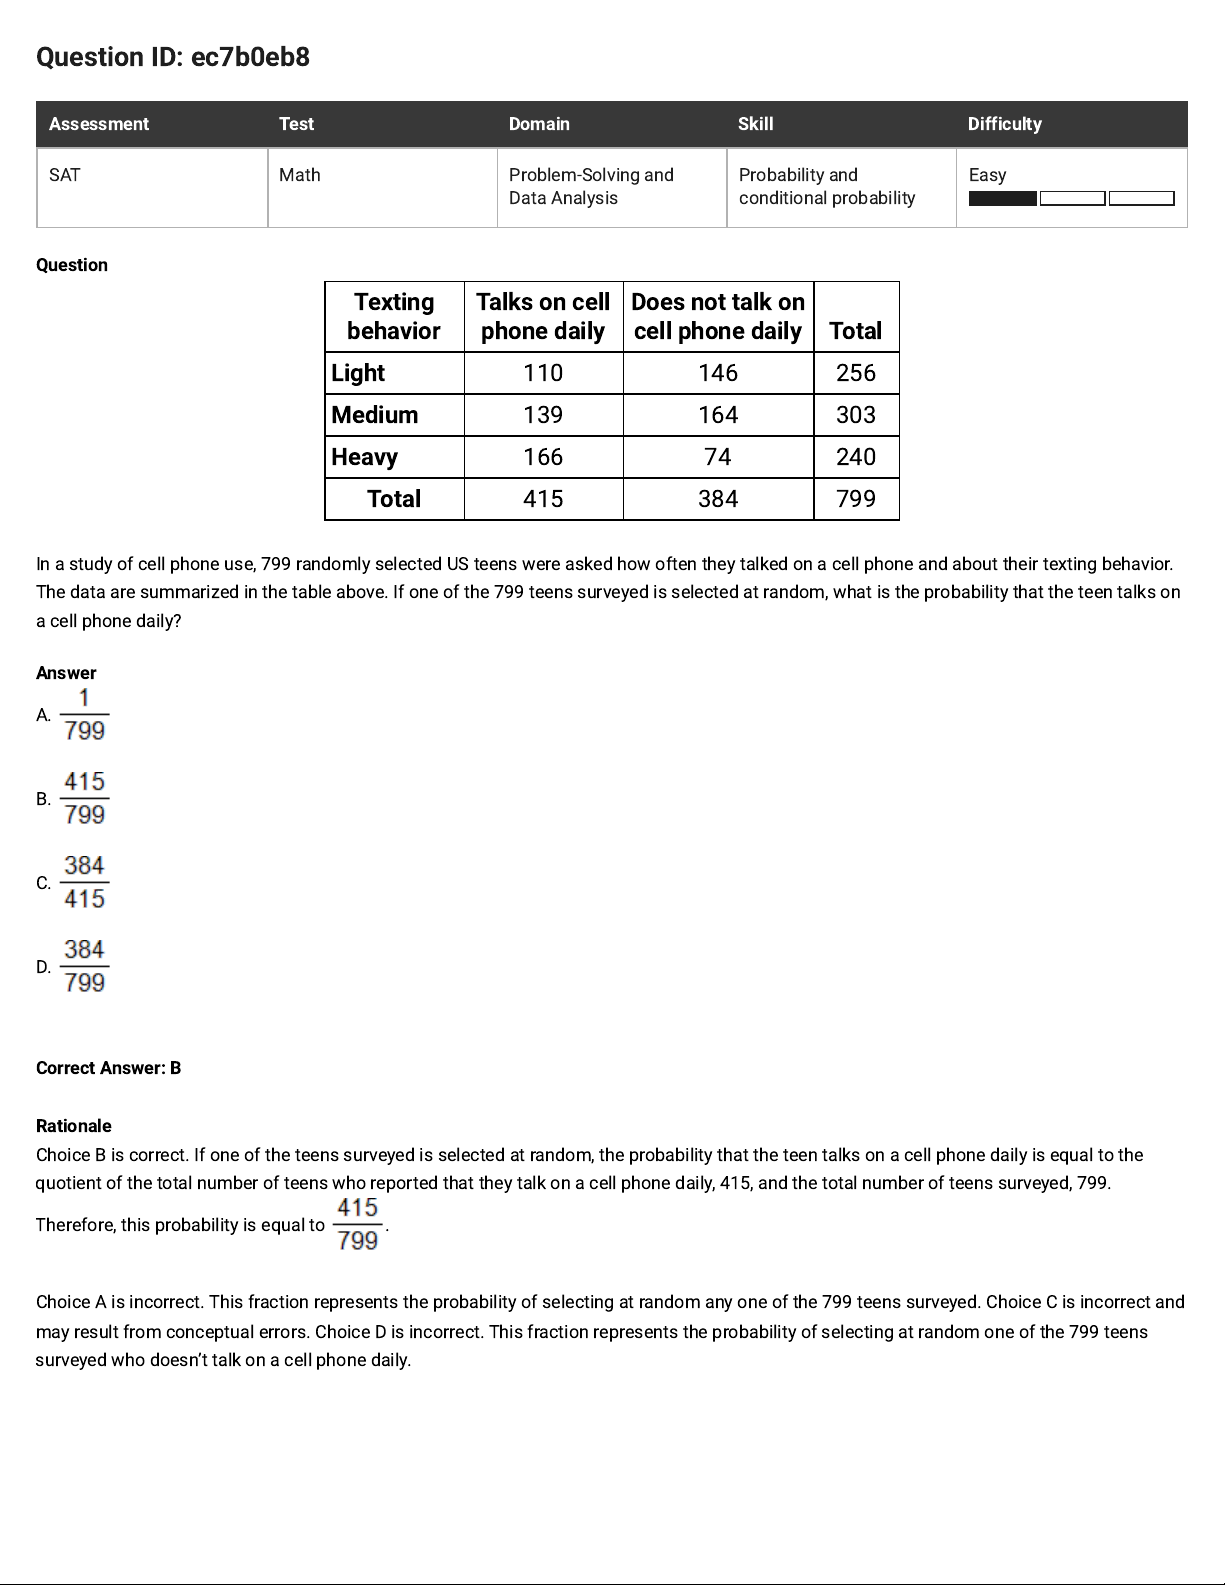
Texting
behavior
Talks on cell
phone daily
Does not talk on
cell phone daily Total
Light
110 146 256
Medium
139 164 303
Heavy
166 74 240
Total
415 384 799
In a study of cell phone use, 799 randomly selected US teens were asked how often they talked on a cell phone and about their texting behavior.
The data are summarized in the table above. If one of the 799 teens surveyed is selected at random, what is the probability that the teen talks on
a cell phone daily?
Answer
A.
B.
C.
D.
Correct Answer: B
Rationale
Choice B is correct. If one of the teens surveyed is selected at random, the probability that the teen talks on a cell phone daily is equal to the
quotient of the total number of teens who reported that they talk on a cell phone daily, 415, and the total number of teens surveyed, 799.
Therefore, this probability is equal to .
Choice A is incorrect. This fraction represents the probability of selecting at random any one of the 799 teens surveyed. Choice C is incorrect and
may result from conceptual errors. Choice D is incorrect. This fraction represents the probability of selecting at random oneof the 799 teens
surveyed who doesn’t talk on a cell phone daily.
Page 14
Question ID: 585de39a
Assessment Test Domain Skill Difficulty
SAT Math Problem-Solving and
Data Analysis
Probability and
conditional probability
Hard
Question
On May 10, 2015, there were 83 million Internet subscribers in Nigeria. The major Internet providers were MTN, Globacom, Airtel, Etisalat, and
Visafone. By September 30, 2015, the number of Internet subscribers in Nigeria had increased to 97 million. If an Internet subscriber in Nigeria on
September 30, 2015, is selected at random, the probability that the person selected was an MTN subscriber is 0.43. There were p million MTN
subscribers in Nigeria on September 30, 2015. To the nearest integer, what is the value of p ?
Rationale
The correct answer is 42. It’s given that in Nigeria on September 30, 2015, the probability of selecting an MTN subscriber from all Internet
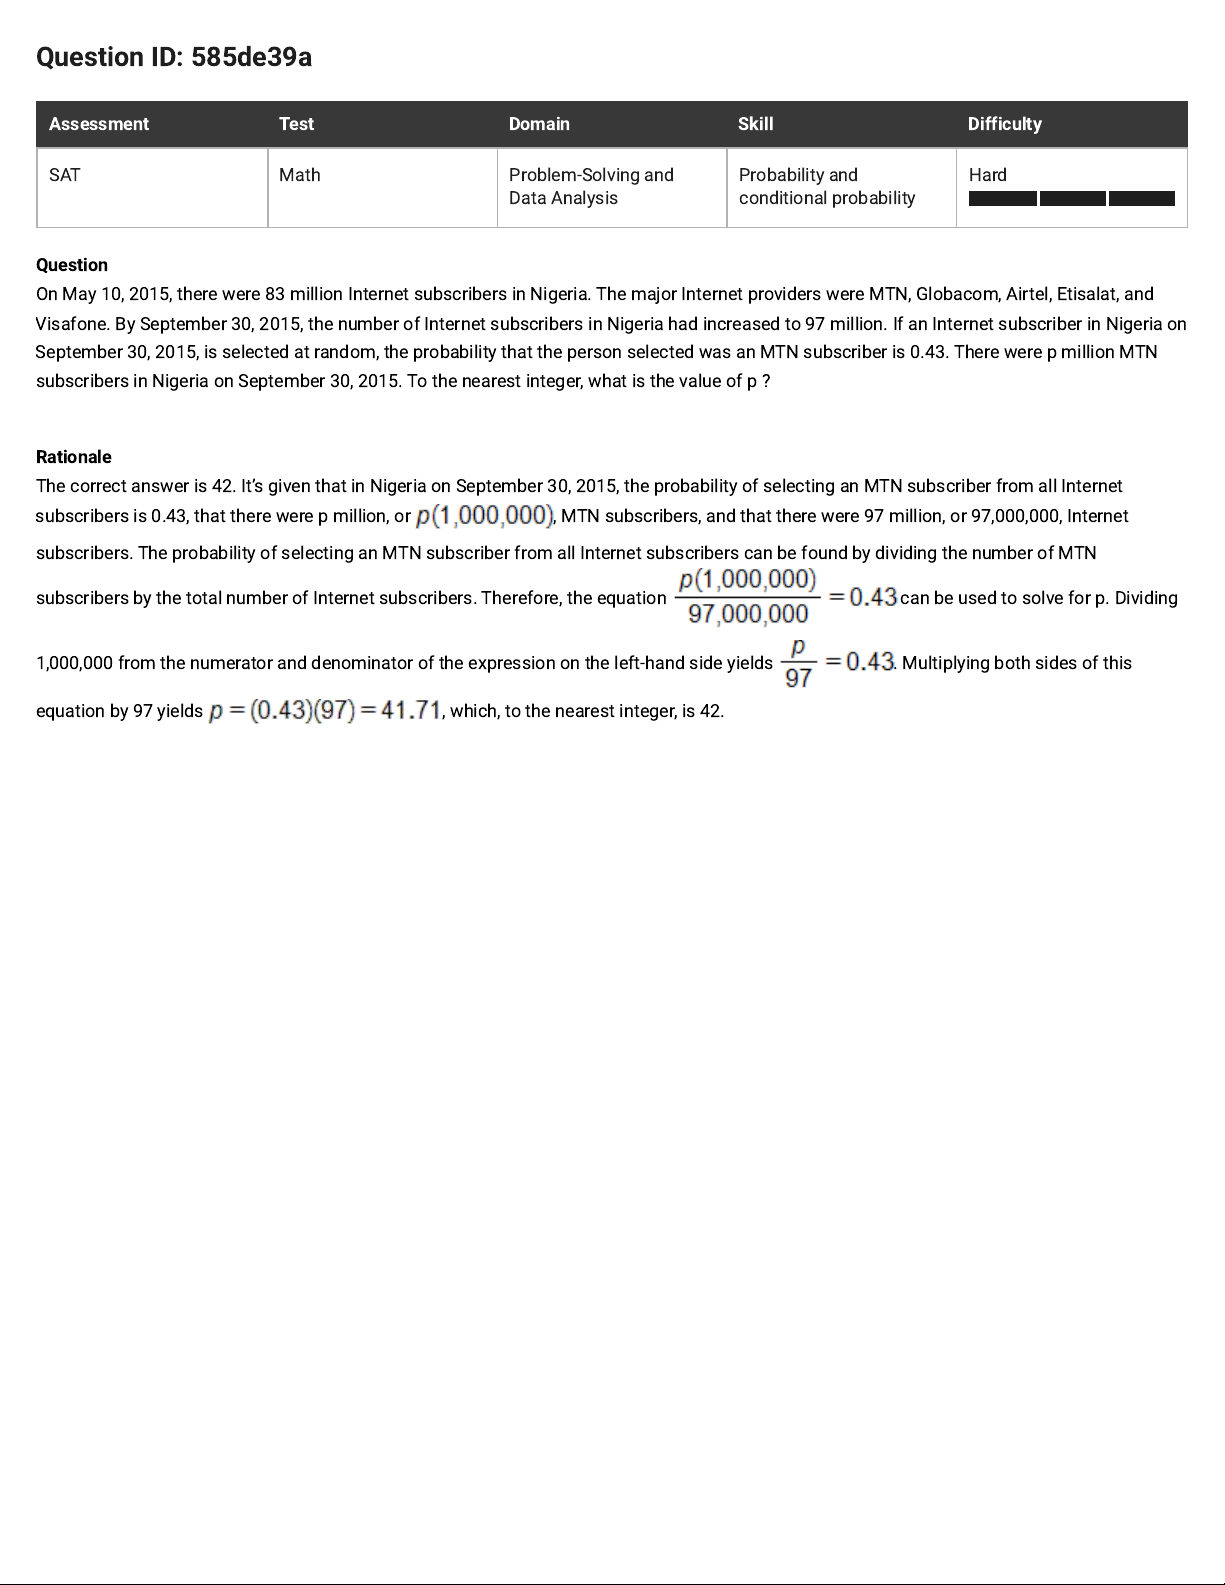
subscribers is 0.43, that there were p million, or , MTN subscribers, and that there were 97 million, or 97,000,000, Internet
subscribers. The probability of selecting an MTN subscriber from all Internet subscribers can be found by dividing the number of MTN
subscribers by the total number of Internet subscribers. Therefore, the equation can be used to solve for p. Dividing
1,000,000 from the numerator and denominator of the expression on the left-hand side yields . Multiplying both sides of this
equation by 97 yields , which, to the nearest integer, is 42.
Page 15
Question ID: 12dbe3de
Assessment Test Domain Skill Difficulty
SAT Math Problem-Solving and
Data Analysis
Probability and
conditional probability
Easy
Question
A store received a shipment of 1,000MP3 players, 4of which were defective. If an MP3 player is randomly selected from this shipment, what is
the probability that it is defective?
Answer
A. 0.004
B. 0.04
C. 0.4
D. 4
Correct Answer: A
Rationale
Choice A is correct. The probability of randomly selecting a defective MP3 player from the shipment is equal to the number of defective MP3
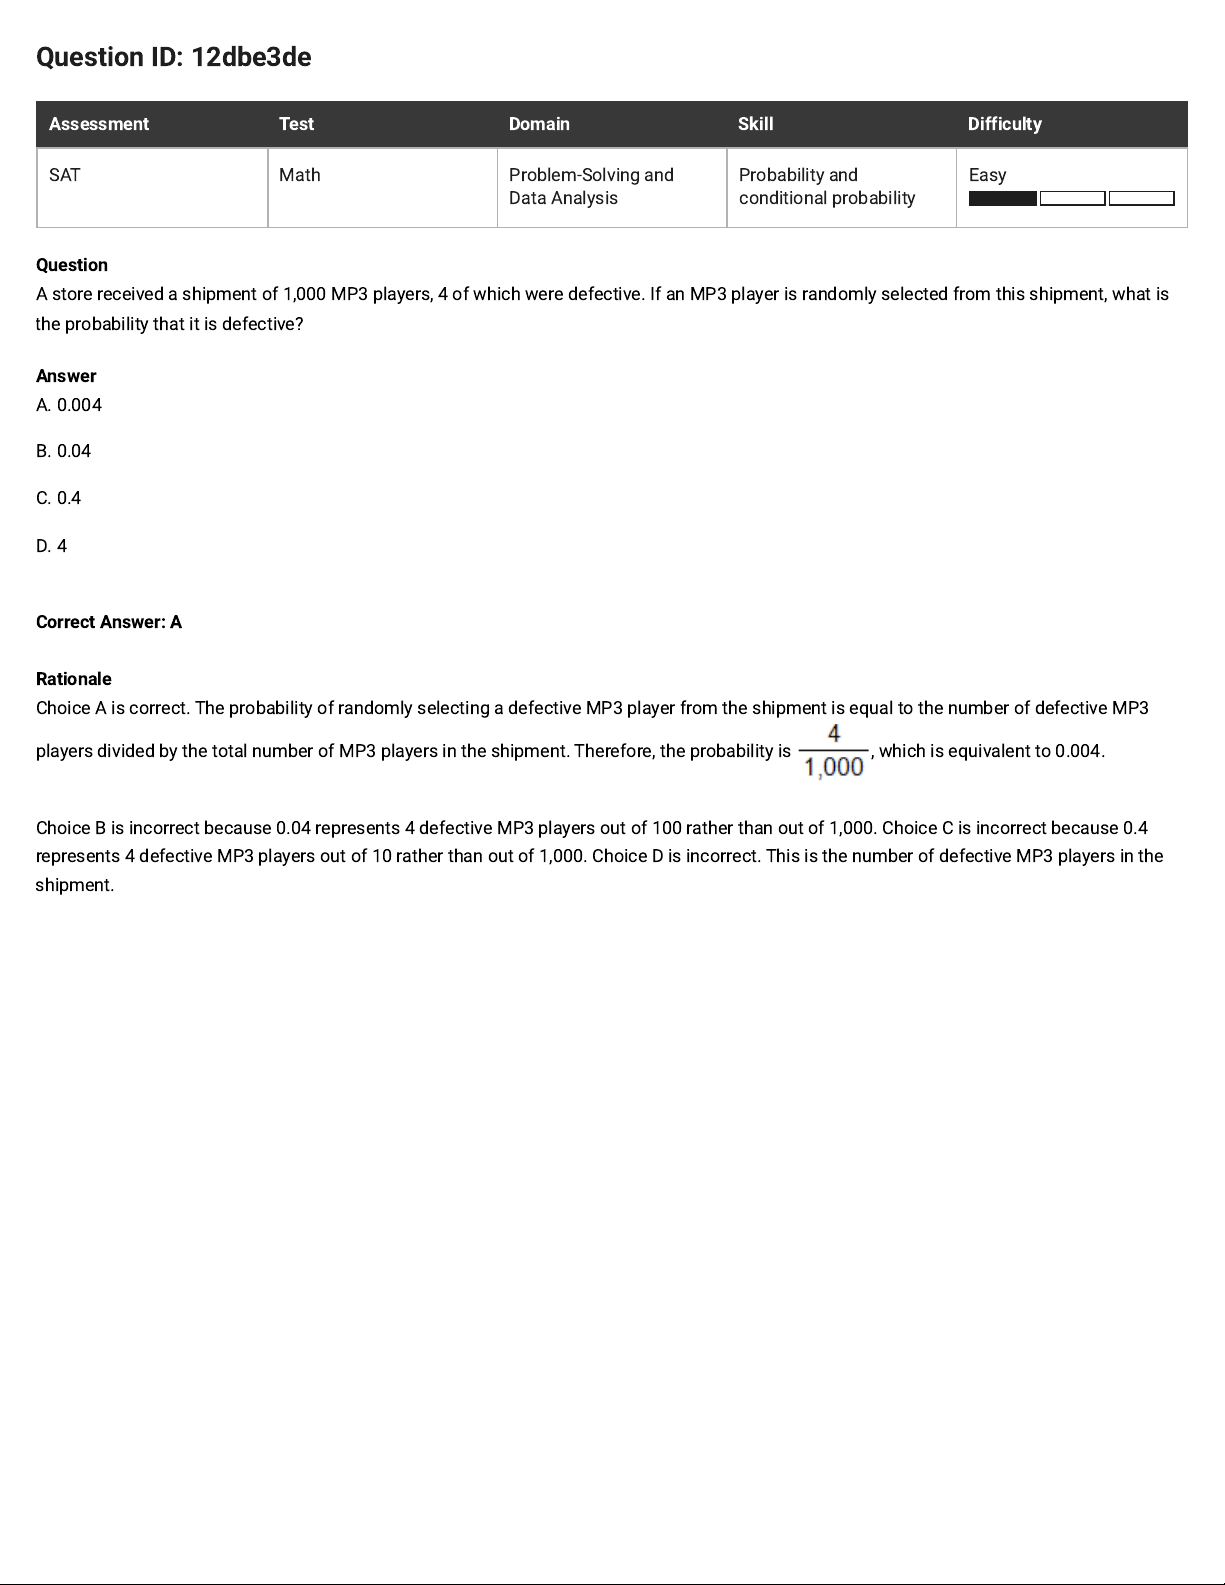
players divided by the total number of MP3 players in the shipment. Therefore, the probability is , which is equivalent to 0.004.
Choice B is incorrect because 0.04 represents 4 defective MP3 players out of 100 rather than out of 1,000. Choice C is incorrect because 0.4
represents 4 defective MP3 players out of 10 rather than out of 1,000. Choice D is incorrect. This is the number of defective MP3 players in the
shipment.
Page 16
Question ID: 912cd125
Assessment Test Domain Skill Difficulty
SAT Math Problem-Solving and
Data Analysis
Probability and
conditional probability
Medium
Question
For a science project, Anka recorded whether it rained each weekday and weekend day for 12weeks. Her results are summarized in the table
below.
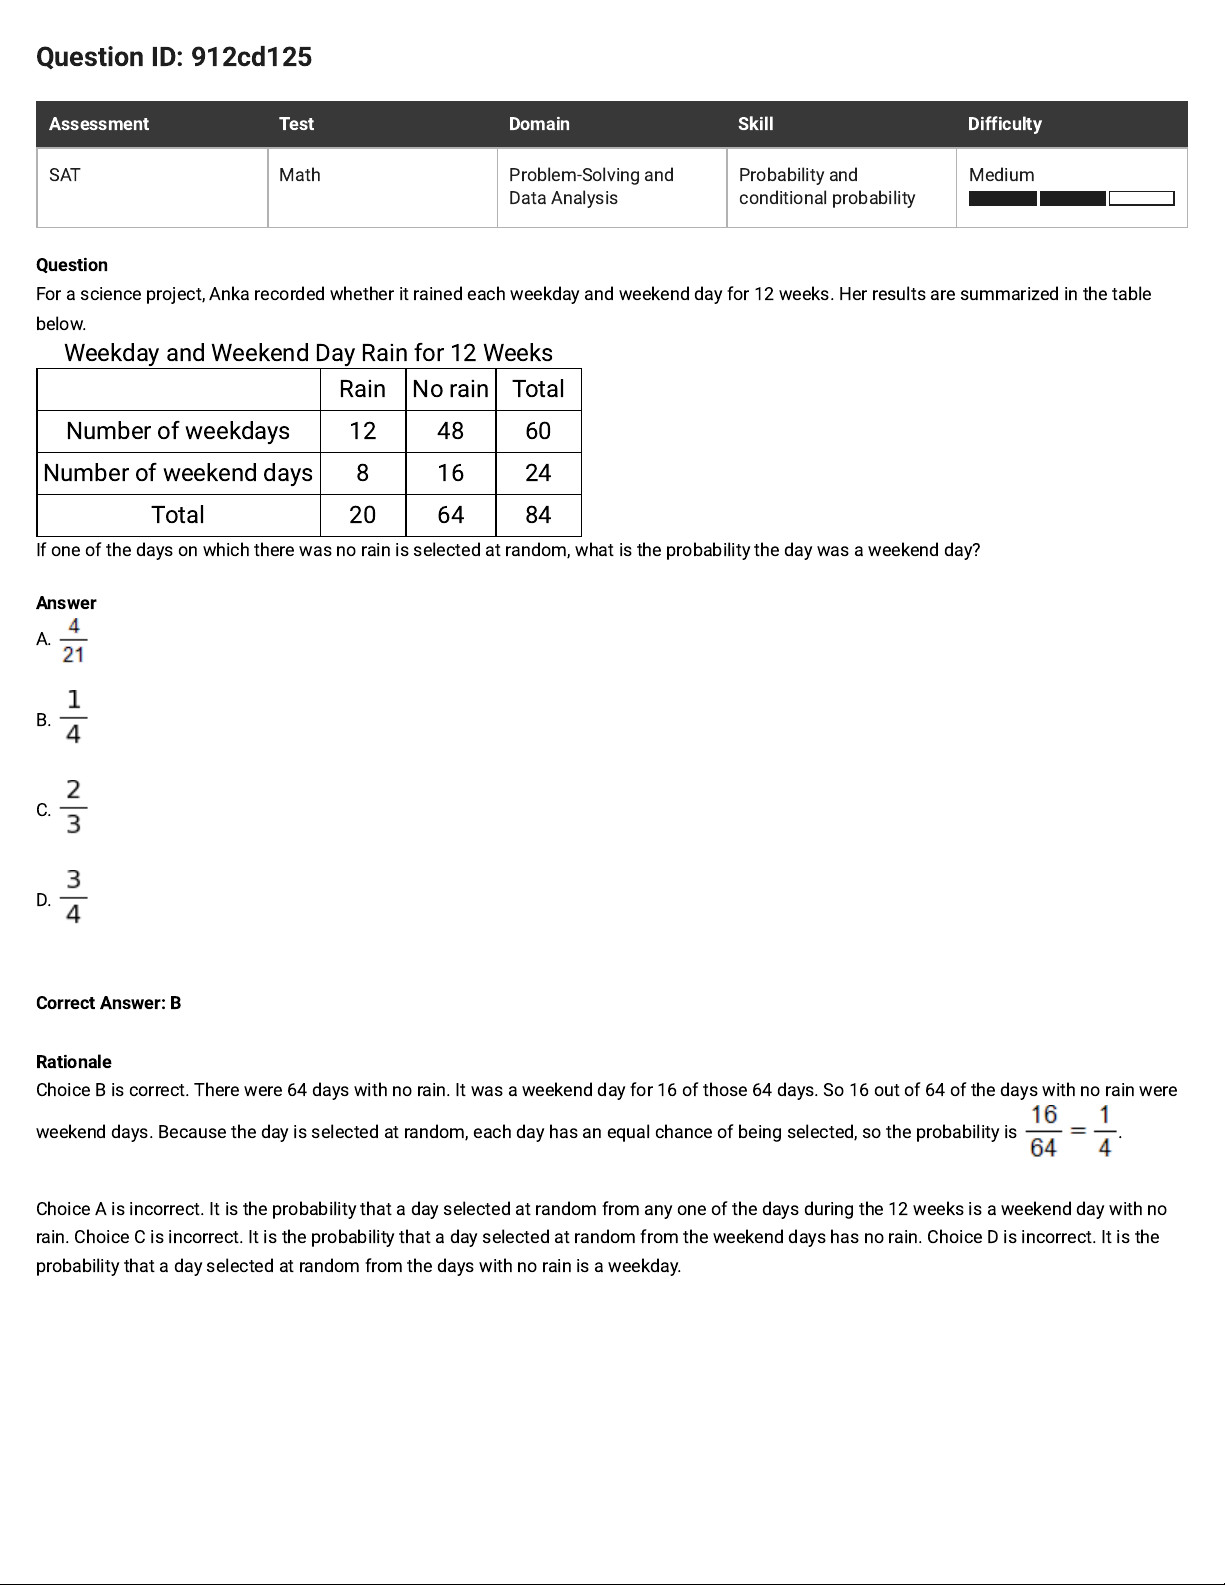
Weekday and Weekend Day Rain for 12 Weeks
Rain No rain Total
Number of weekdays 12 48 60
Number of weekend days 8 16 24
Total 20 64 84
If one of the days on which there was no rain is selected at random, what is the probability the day was a weekend day?
Answer
A.
B.
C.
D.
Correct Answer: B
Rationale
Choice B is correct. There were 64 days with no rain. It was a weekend day for 16 of those 64 days. So 16 out of 64 of the days with no rain were
weekend days. Because the day is selected at random, each day has an equal chance of being selected, so the probability is .
Choice A is incorrect. It is the probability that a day selected at random from any one of the days during the 12 weeks is a weekend day with no
rain. Choice C is incorrect. It is the probability that a day selected at random from the weekend days has no rain. Choice D is incorrect. It is the
probability that a day selected at random from the days with no rain is a weekday.
Page 17
Question ID: 6a715bed
Assessment Test Domain Skill Difficulty
SAT Math Problem-Solving and
Data Analysis
Probability and
conditional probability
Hard
Question
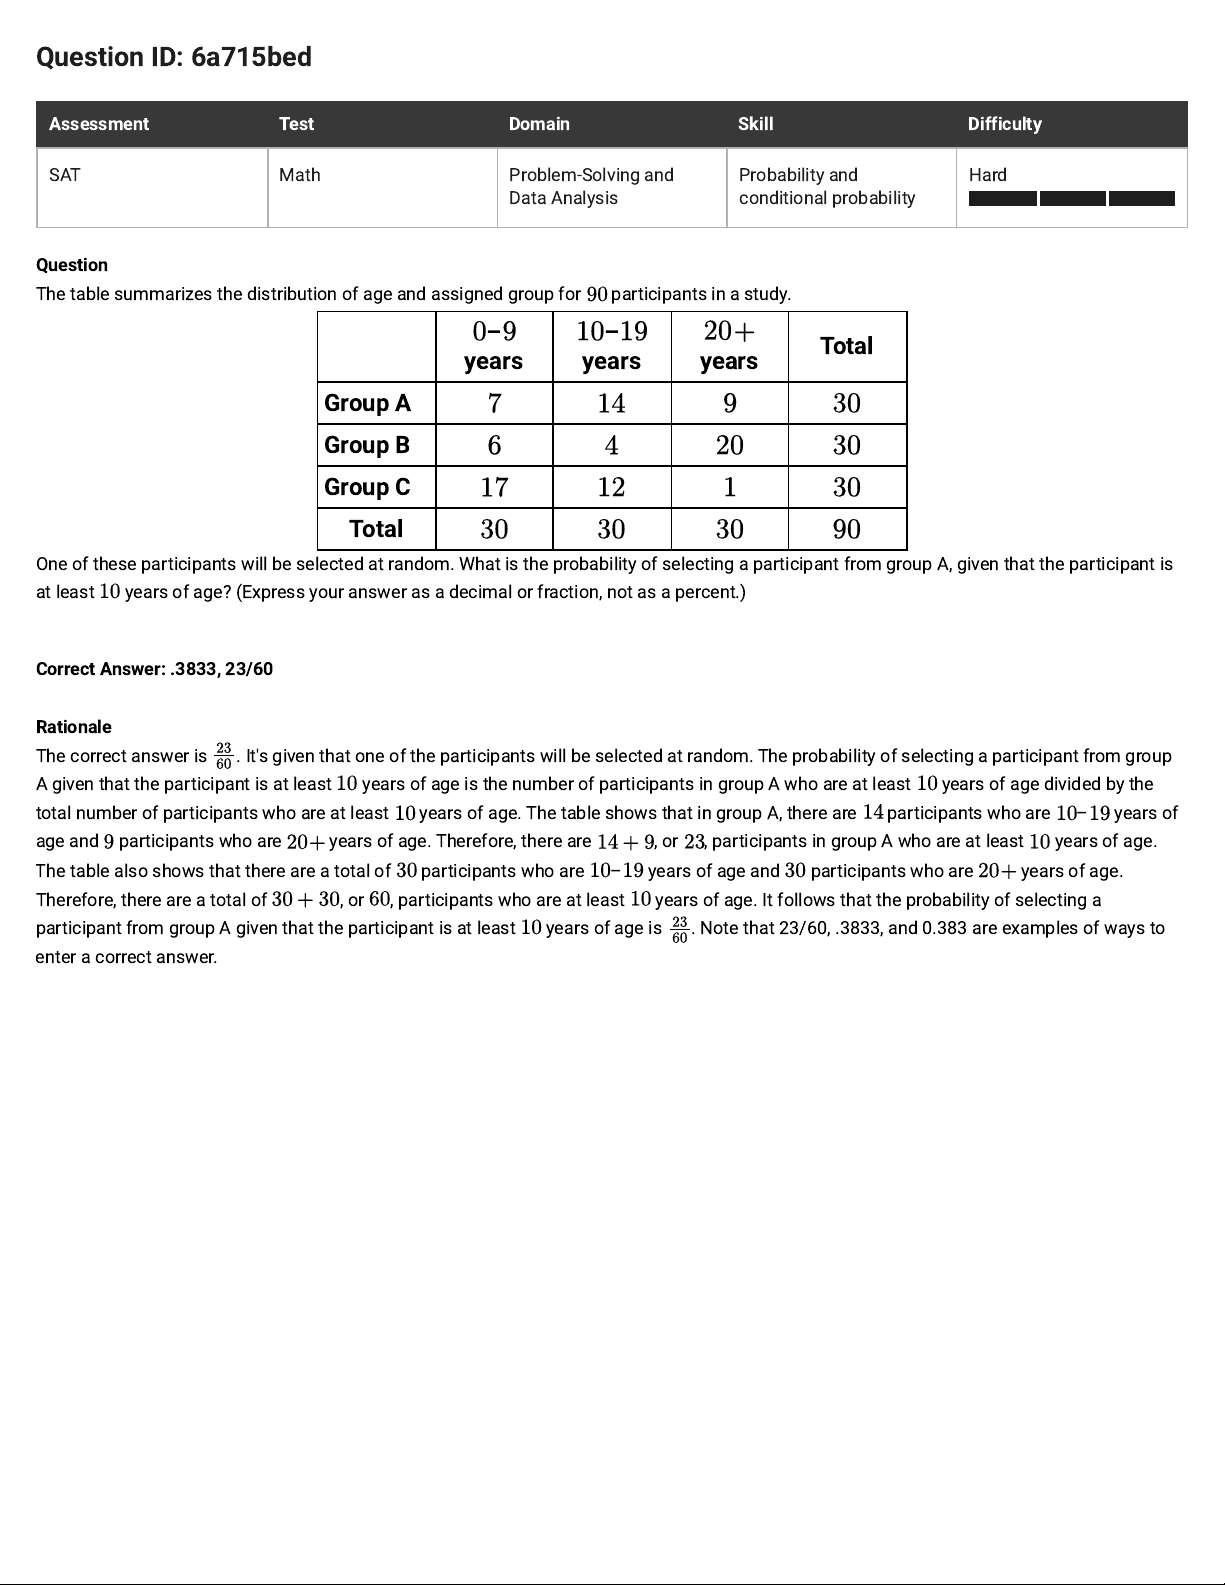
The table summarizes the distribution of age and assigned group for participants in a study.
–
years
–
years years
Total
Group A
Group B
Group C
Total
One of these participants will be selected at random. What is the probability of selecting a participant from group A, given that the participant is
at least years of age? (Express your answer as a decimal or fraction, not as a percent.)
Correct Answer: .3833, 23/60
Rationale
The correct answer is . It's given that one of the participants will be selected at random. The probability of selecting a participant from group
A given that the participant is at least years of age is the number of participants in group A who are at least years of age divided by the
total number of participants who are at least years of age. The table shows that in group A, there are participants who are
–
years of
age and par ticipants who are years of age. Therefore, there are
, or , participants in group A who are at least years of age.
The table also shows that there are a total of participants who are
–
years of age and participants who are years of age.
Therefore, there are a total of , or , participants who are at least years of age. It follows that the probability of selecting a
participant from group A given that the participant is at least years of age is . Note that 23/60, .3833, and 0.383 are examples of ways to
enter a correct answer.
Page 18
Question ID: 30db8f77
Assessment Test Domain Skill Difficulty
SAT Math Problem-Solving and
Data Analysis
Probability and
conditional probability
Medium
Question
At a conference, there are a total of attendees. Each attendee is assigned to either group A, group B, or group C. If one of these attendees is
selected at random, the probability of selecting an attendee who is assigned to group A is and the probability of selecting an attendee who
is assigned to group B is . How many attendees are assigned to group C?
Correct Answer: 88
Rationale
The correct answer is . It's given that there are a total of attendees and each attendee is assigned to either group A, group B, or group C.
It's also given that if one of these attendees is selected at random, the probability of selecting an attendee who is assigned to group A is
and the probability of selecting an attendee who is assigned to group B is . It follows that there are , or , attendees who are
assigned to group A and , or , attendees who are assigned to group B. The number of attendees who are assigned to group C is the
number of attendees who are not assigned to group A or group B. In other words, the number of attendees who are assigned to group C is the
total number of attendees minus the number of attendees who are assigned to group A and group B. Therefore, the number of attendees who are
assigned to group C is , or .
Page 19
Question ID: 2a08d878
Assessment Test Domain Skill Difficulty
SAT Math Problem-Solving and
Data Analysis
Probability and
conditional probability
Easy
Question
There are nnonfiction books and 12fiction books on a bookshelf. If one of these books is selected at random, what is the probability of
selecting a nonfiction book, in termsofn?
Answer
A.
B.
C.
D.
Correct Answer: B
Rationale
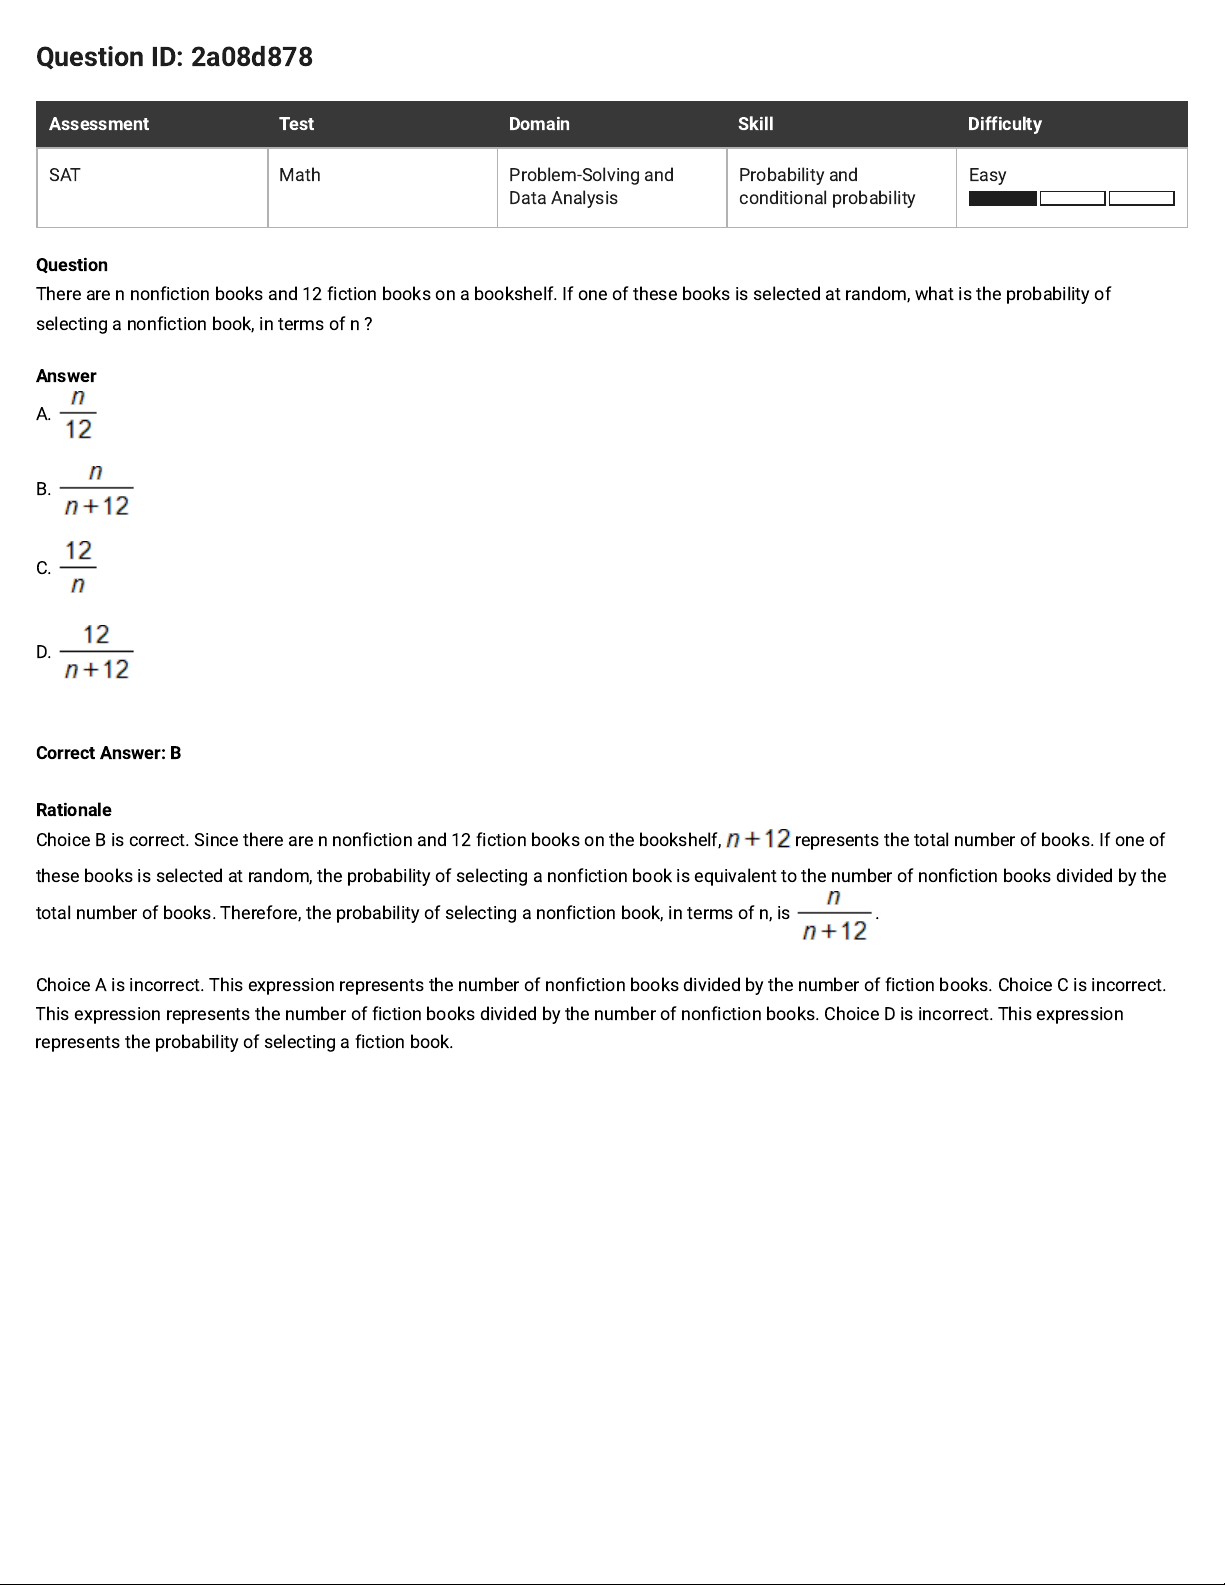
Choice B is correct. Since there are n nonfiction and 12 fiction books on the bookshelf, represents the total number of books. If one of
these books is selected at random, the probability of selecting a nonfiction book is equivalent to the number of nonfiction books divided by the
total number of books. Therefore, the probability of selecting a nonfiction book, in terms of n, is .
Choice A is incorrect. This expression represents the number of nonfiction books divided by the number of fiction books. Choice C is incorrect.
This expression represents the number of fiction books divided by the number of nonfiction books. Choice D is incorrect. This expression
represents the probability of selecting a fiction book.
Page 20
Question ID: 38a9ac45
Assessment Test Domain Skill Difficulty
SAT Math Problem-Solving and
Data Analysis
Probability and
conditional probability
Medium
Question
If 1,200 customers register for new accounts at a social media website every day, what fraction of the first 60,000 new accounts are registered in
the first 5 days?
Answer
A.
B.
C.
D.
Correct Answer: B
Rationale
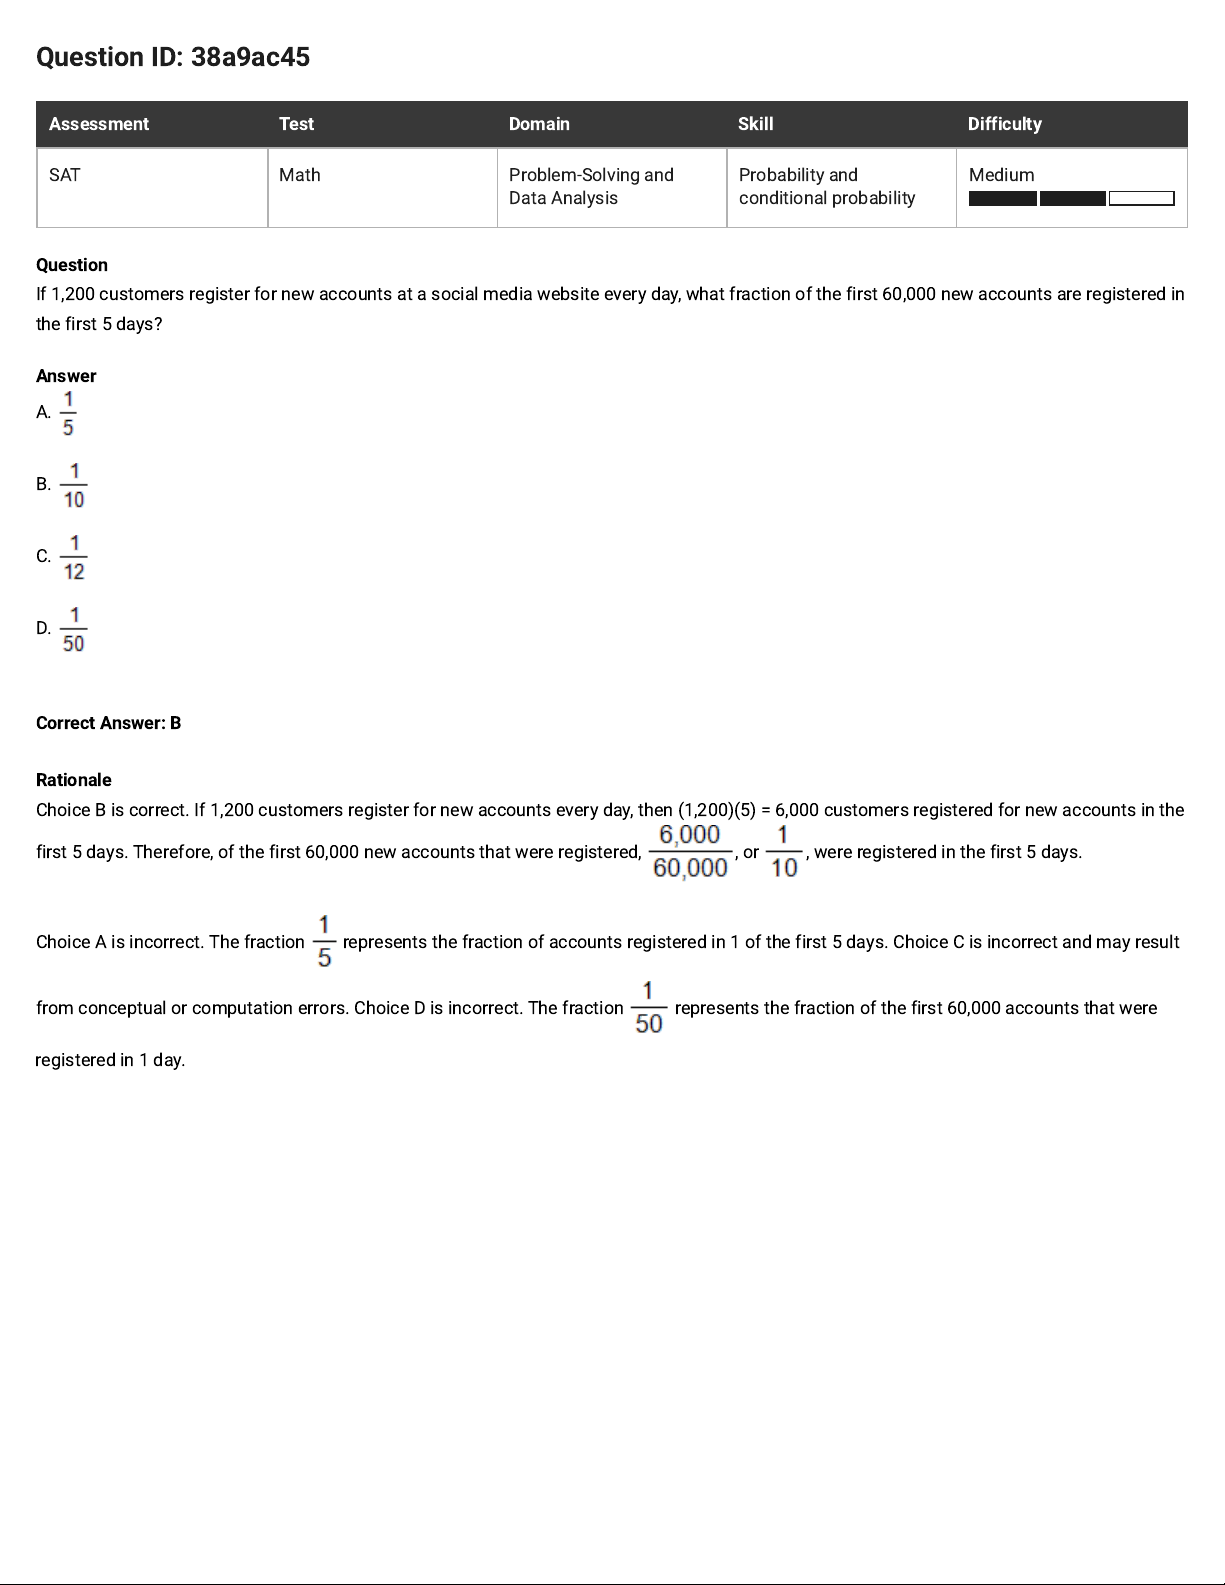
Choice B is correct. If 1,200 customers register for new accounts every day, then (1,200)(5) = 6,000 customers registered for new accounts in the
first 5 days. Therefore, of the first 60,000 new accounts that were registered, , or , were registered in the first 5 days.
Choice A is incorrect. The fraction represents the fraction of accounts registered in 1 of the first 5 days. Choice C is incorrect and may result
from conceptual or computation errors. Choice D is incorrect. The fraction
represents the fraction of the first 60,000 accounts that were
registered in 1 day.
Page 21
Question ID: dae79de4
Assessment Test Domain Skill Difficulty
SAT Math Problem-Solving and
Data Analysis
Probability and
conditional probability
Easy
Question
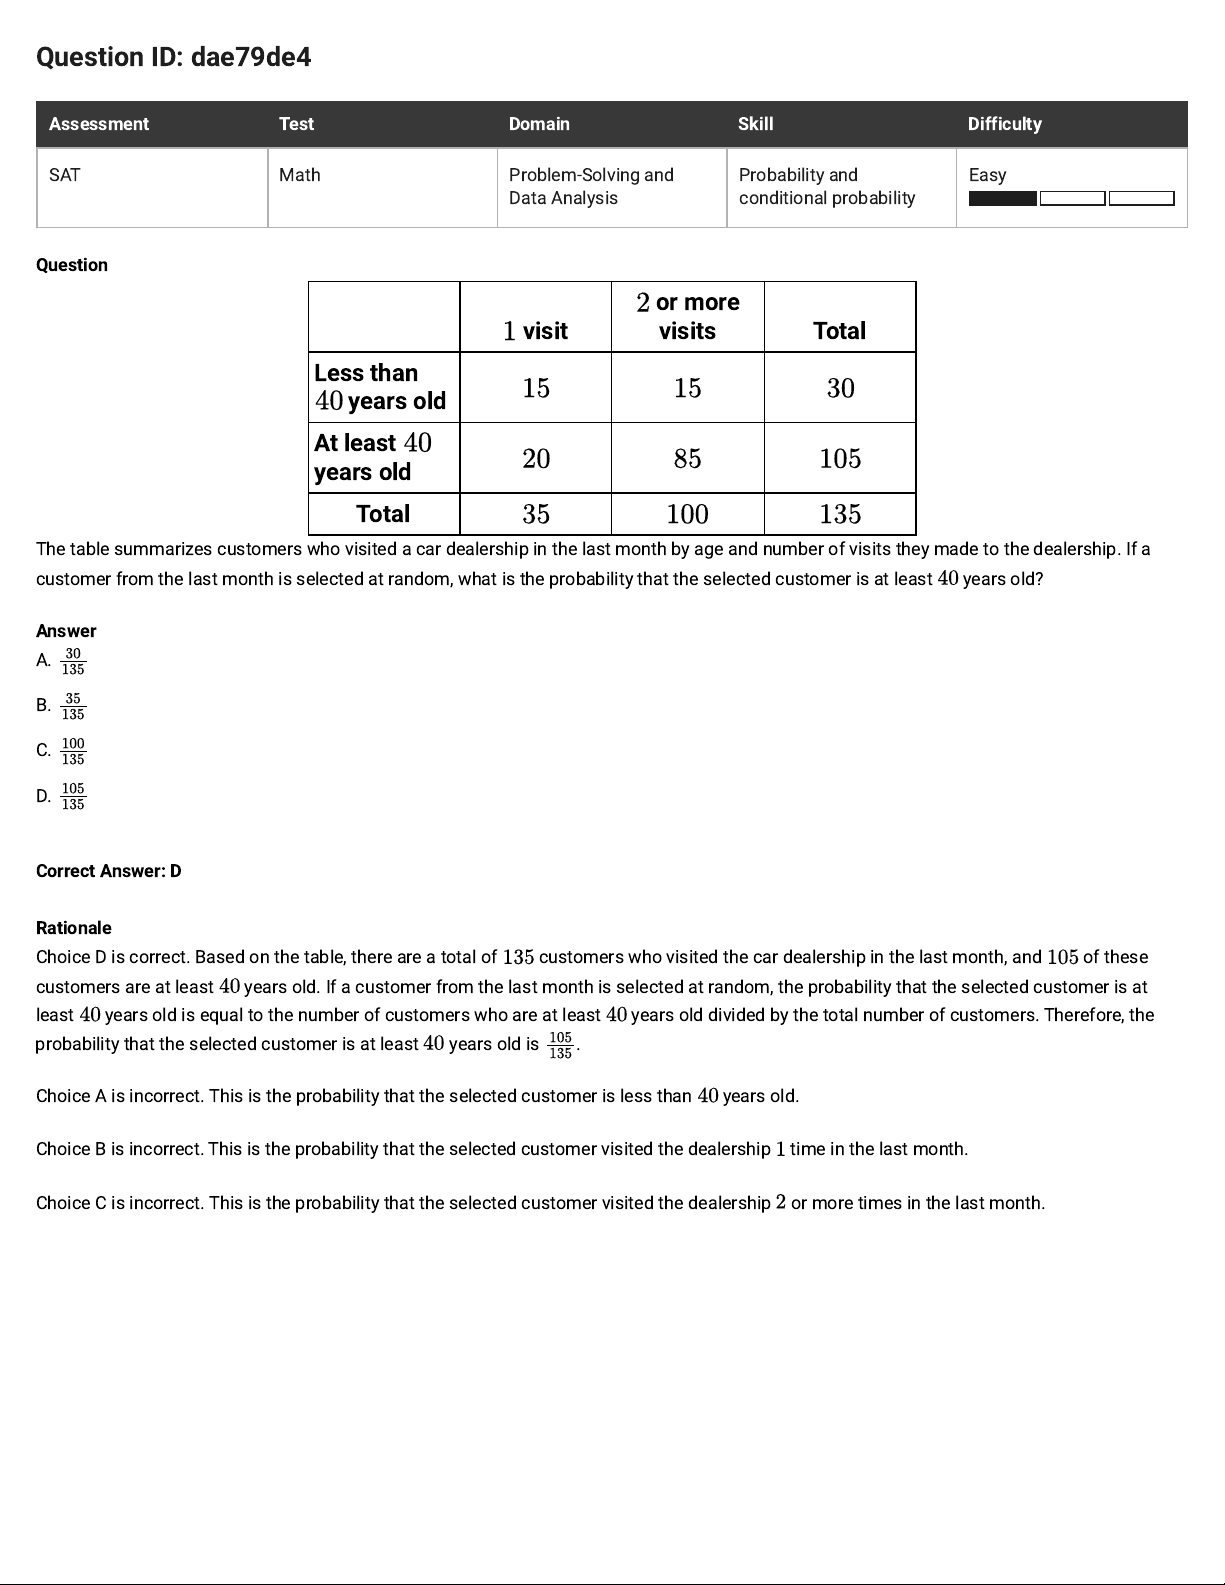
visit
or more
visits Total
Less than
years old
At least
years old
Total
The table summarizes customers who visited a car dealership in the last month by age and number of visits they made to the dealership. If a
customer from the last month is selected at random, what is the probability that the selected customer is at least years old?
Answer
A.
B.
C.
D.
Correct Answer: D
Rationale
Choice D is correct. Based on the table, there are a total of customers who visited the car dealership in the last month, and of these
customers are at least years old. If a customer from the last month is selected at random, the probability that the selected customer is at
least years old is equal to the number of customers who are at least years old divided by the total number of customers. Therefore, the
probability that the selected customer is at least years old is .
Choice A is incorrect. This is the probability that the selected customer is less than years old.
Choice B is incorrect. This is the probability that the selected customer visited the dealership time in the last month.
Choice C is incorrect. This is the probability that the selected customer visited the dealership or more times in the last month.
Page 22
Question ID: b6569d0e
Assessment Test Domain Skill Difficulty
SAT Math Problem-Solving and
Data Analysis
Probability and
conditional probability
Medium
Question
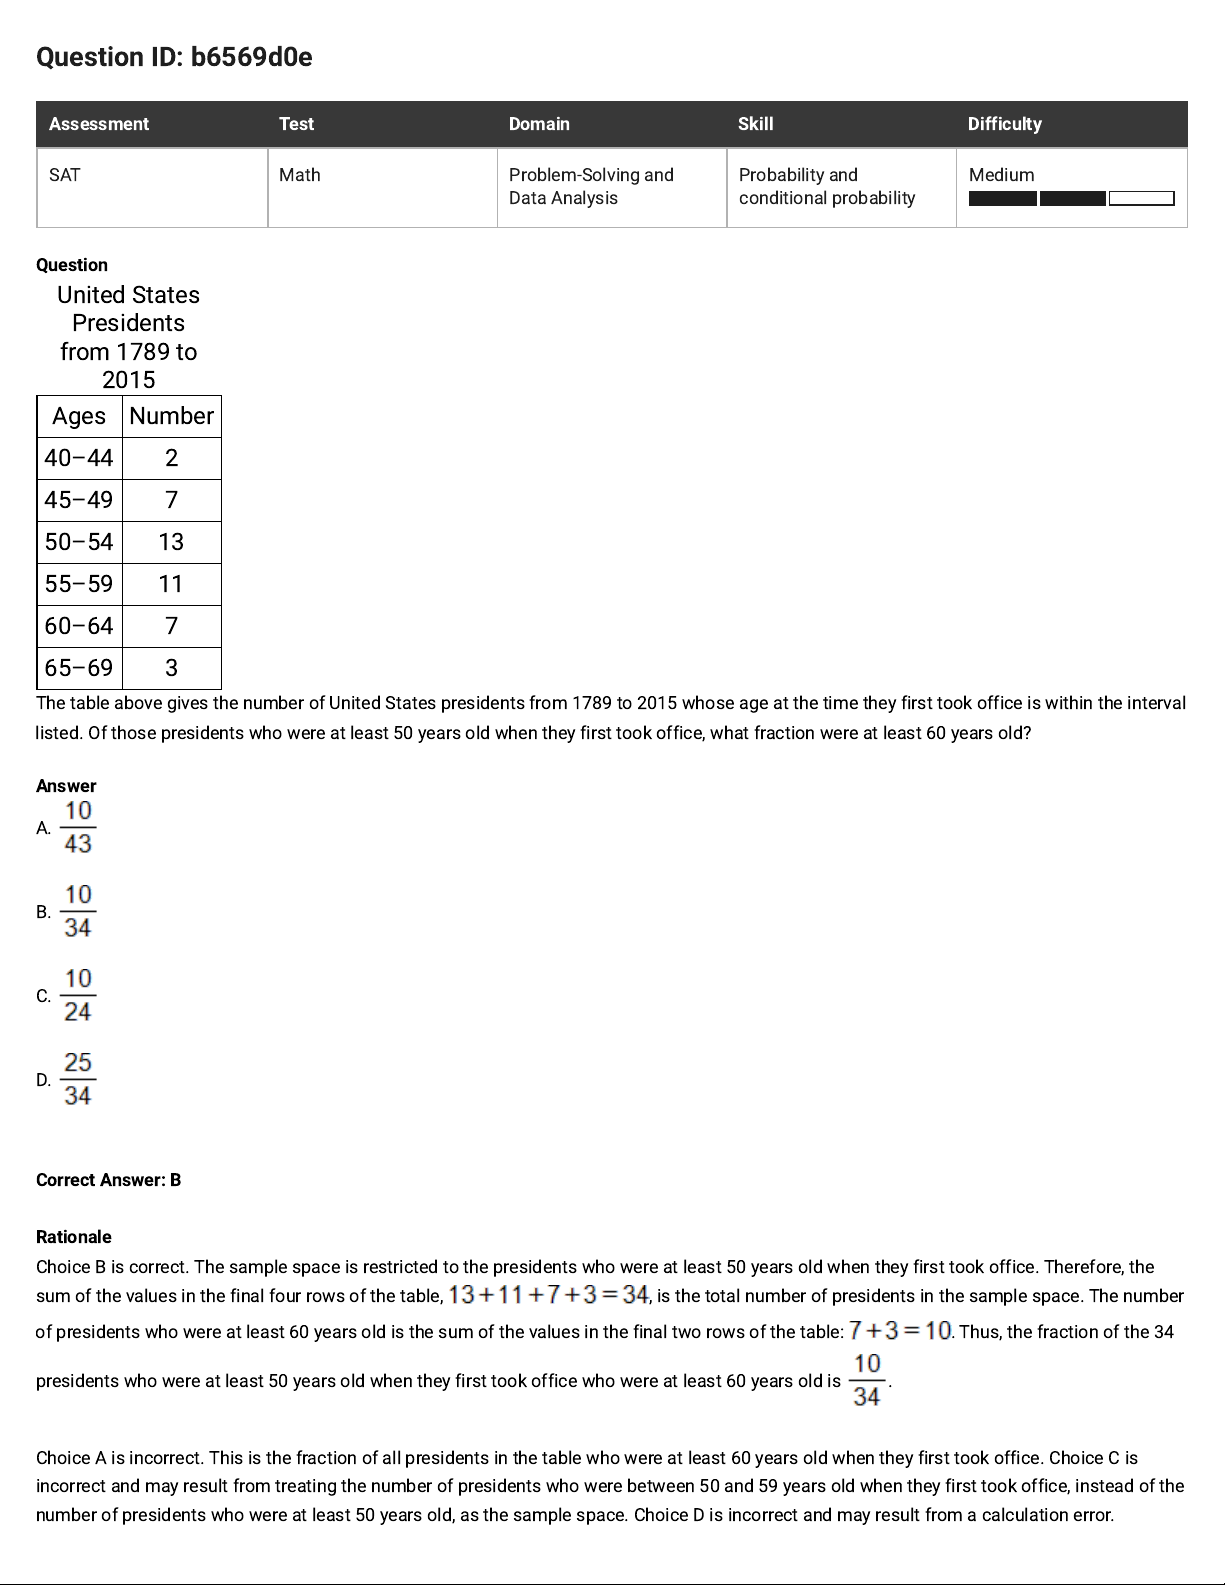
United States
Presidents
from 1789 to
2015
Ages Number
40–44 2
45–49 7
50–54 13
55–59 11
60–64 7
65–69 3
The table above gives the number of United States presidents from 1789 to 2015 whose age at the time they first took office is within the interval
listed. Of those presidents who were at least 50 years old when they first took office, what fraction were at least 60 years old?
Answer
A.
B.
C.
D.
Correct Answer: B
Rationale
Choice B is correct. The sample space is restricted to the presidents who were at least 50 years old when they first took office. Therefore, the
sum of the values in the final four rows of the table, , is the total number of presidents in the sample space. The number
of presidents who were at least 60 years old is the sum of the values in the final two rows of the table: . Thus, the fraction of the 34
presidents who were at least 50 years old when they first took office who were at least 60 years old is .
Choice A is incorrect. This is the fraction of all presidents in the table who were at least 60 years old when they first took office. Choice C is
incorrect and may result from treating the number of presidents who were between 50 and 59 years old when they first took office, instead of the
number of presidents who were at least 50 years old, as the sample space. Choice D is incorrect and may result from a calculation error.
Page 23

Page 24
Question ID: 5dc386fb
Assessment Test Domain Skill Difficulty
SAT Math Problem-Solving and
Data Analysis
Probability and
conditional probability
Hard
Question
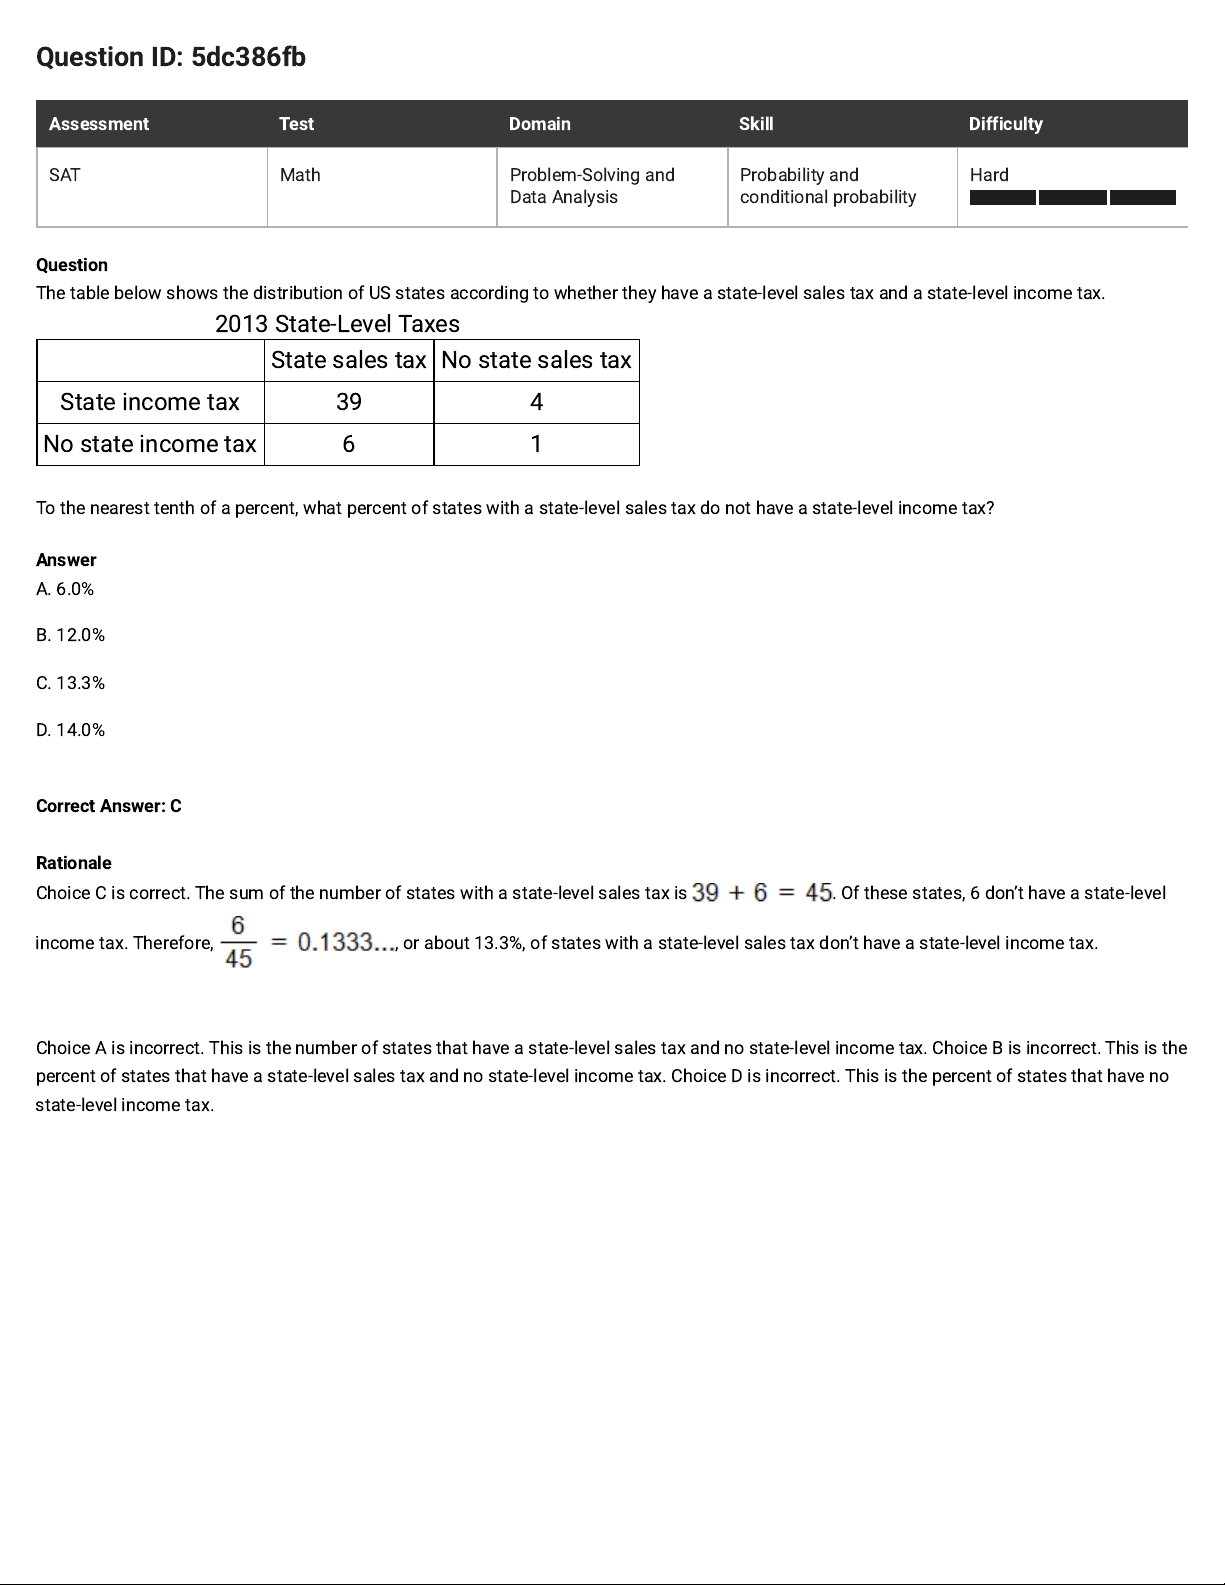
The table below shows the distribution of US states according to whether they have a state-level sales tax and a state-level income tax.
2013 State-Level Taxes
State sales tax No state sales tax
State income tax 39 4
No state income tax 6 1
To the nearest tenth of a percent, what percent of states with a state-level sales tax do not have a state-level income tax?
Answer
A. 6.0%
B. 12.0%
C. 13.3%
D. 14.0%
Correct Answer: C
Rationale
Choice C is correct. The sum of the number of states with a state-level sales tax is . Of these states, 6 don’t have a state-level
income tax. Therefore,
, or about 13.3%, of states with a state-level sales tax don’t have a state-level income tax.
Choice A is incorrect. This is the number of states that have a state-level sales tax and no state-level income tax. Choice B is incorrect. This is the
percent of states that have a state-level sales tax and no state-level income tax. Choice D is incorrect. This is the percent of states that have no
state-level income tax.
Page 25
Question ID: 014c47ab
Assessment Test Domain Skill Difficulty
SAT Math Problem-Solving and
Data Analysis
Probability and
conditional probability
Hard
Question
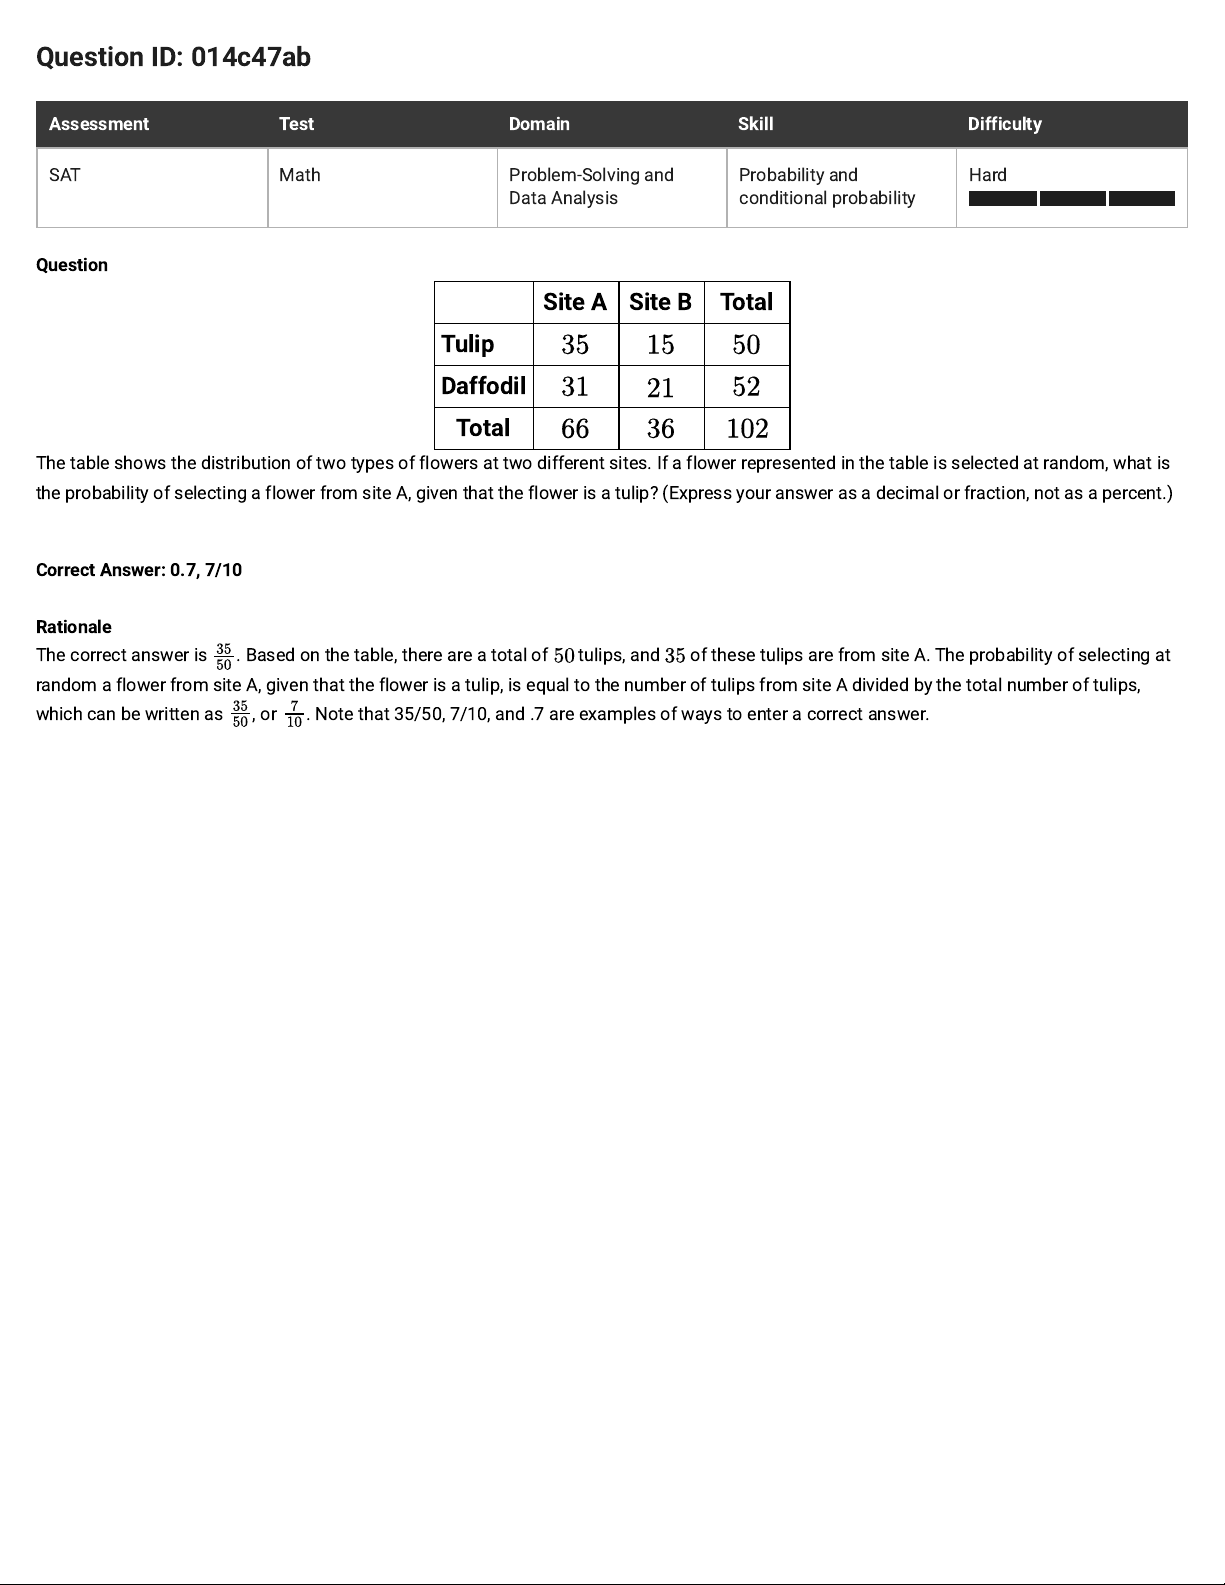
Site A Site B Total
Tulip
Daffodil
Total
The table shows the distribution of two types of flowers at two different sites. If a flower represented in the table is selected at random, what is
the probability of selecting a flower from site A, given that the flower is a tulip? (Express your answer as a decimal or fraction, not as a percent.)
Correct Answer: 0.7, 7/10
Rationale
The correct answer is . Based on the table, there are a total of tulips, and of these tulips are from site A. The probability of selecting at
random a flower from site A, given that the flower is a tulip, is equal to the number of tulips from site A divided by the total number of tulips,
which can be written as , or . Note that 35/50, 7/10, and .7are examples of ways to enter a correct answer.
Page 26
Question ID: 89f20d9e
Assessment Test Domain Skill Difficulty
SAT Math Problem-Solving and
Data Analysis
Probability and
conditional probability
Hard
Question
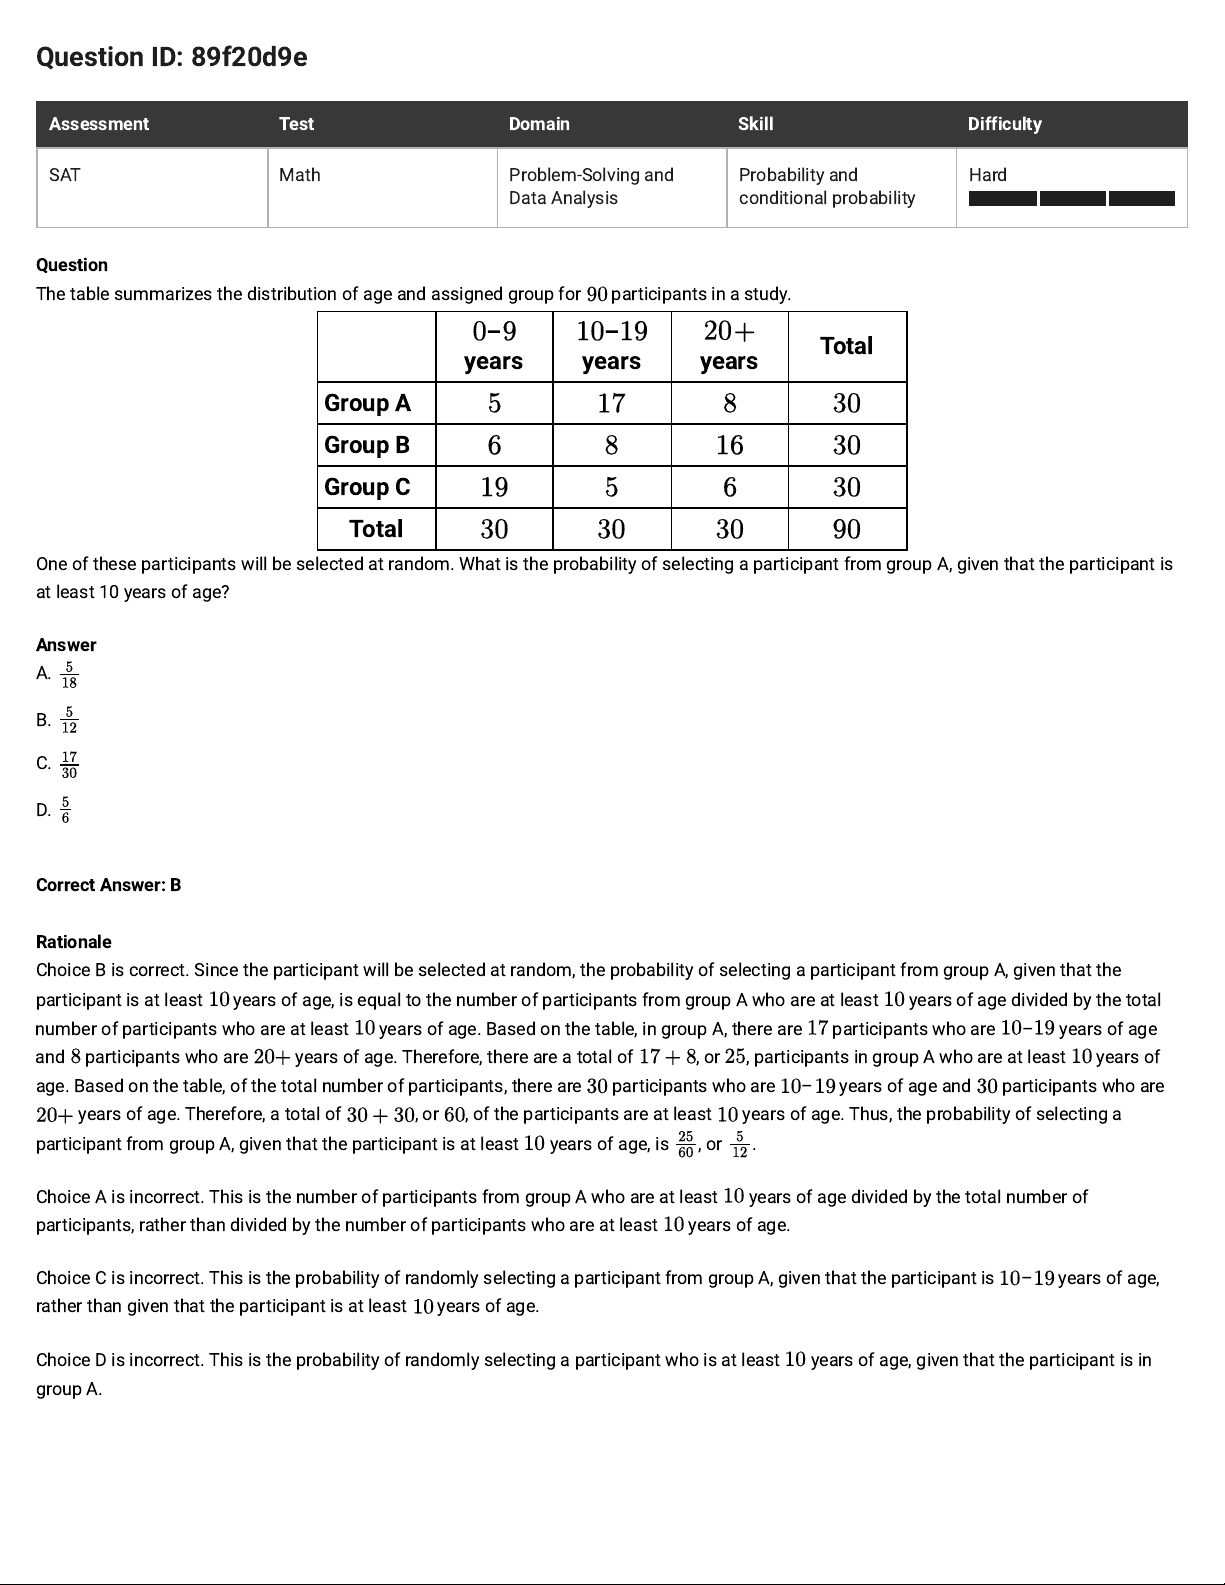
The table summarizes the distribution of age and assigned group for participants in a study.
–
years
–
years years
Total
Group A
Group B
Group C
Total
One of these participants will be selected at random. What is the probability of selecting a participant from group A, given that the participant is
at least 10 years of age?
Answer
A.
B.
C.
D.
Correct Answer: B
Rationale
Choice B is correct. Since the participant will be selected at random, the probability of selecting a participant from group A, given that the
participant is at least years of age, is equal to the number of participants from group A who are at least
years of age divided by the total
number of participants who are at least years of age. Based on the table, in group A, there are participants who are
–
years of age
and par ticipants who are
years of age. Therefore, there are a total of
, or, participants in group A who are at least years of
age. Based on the table, of the total number of participants, there are participants who are
–
years of age and participants who are
years of age. Therefore, a total of , or , of the participants are at least years of age. Thus, the probability of selecting a
participant from group A, given that the participant is at least years of age, is , or .
Choice A is incorrect. This is the number of participants from group A who are at least years of age divided by the total number of
participants, rather than divided by the number of participants who are at least years of age.
Choice C is incorrect. This is the probability of randomly selecting a participant from group A, given that the participant is
–
years of age,
rather than given that the participant is at least years of age.
Choice D is incorrect. This is the probability of randomly selecting a participant who is at least years of age, given that the participant is in
group A.
Page 27
Question ID: 1dcea480
Assessment Test Domain Skill Difficulty
SAT Math Problem-Solving and
Data Analysis
Probability and
conditional probability
Easy
Question
A bag contains a total of 60 marbles. A marble is to be chosen at random from the bag. If the probability that a blue marble will be chosen is
0.35, how many marbles in the bag are blue?
Answer
A. 21
B. 25
C. 35
D. 39
Rationale
Choice A is correct. Multiplying the number of marbles in the bag by the probability of selecting a blue marble gives the number of blue marbles
in the bag. Since the bag contains a total of 60 marbles and the probability that a blue marble will be selected from the bag is 0.35, there are a
total of blue marbles in the bag.
Choice B is incorrect and may result from subtracting 35 from 60. Choice C is incorrect. This would be the number of blue marbles in the bag if
there were a total of 100 marbles, not 60 marbles. Choice D is incorrect. This is the number of marbles in the bag that aren’t blue.
Page 28
Question ID: a3384df0
Assessment Test Domain Skill Difficulty
SAT Math Problem-Solving and
Data Analysis
Probability and
conditional probability
Medium
Question
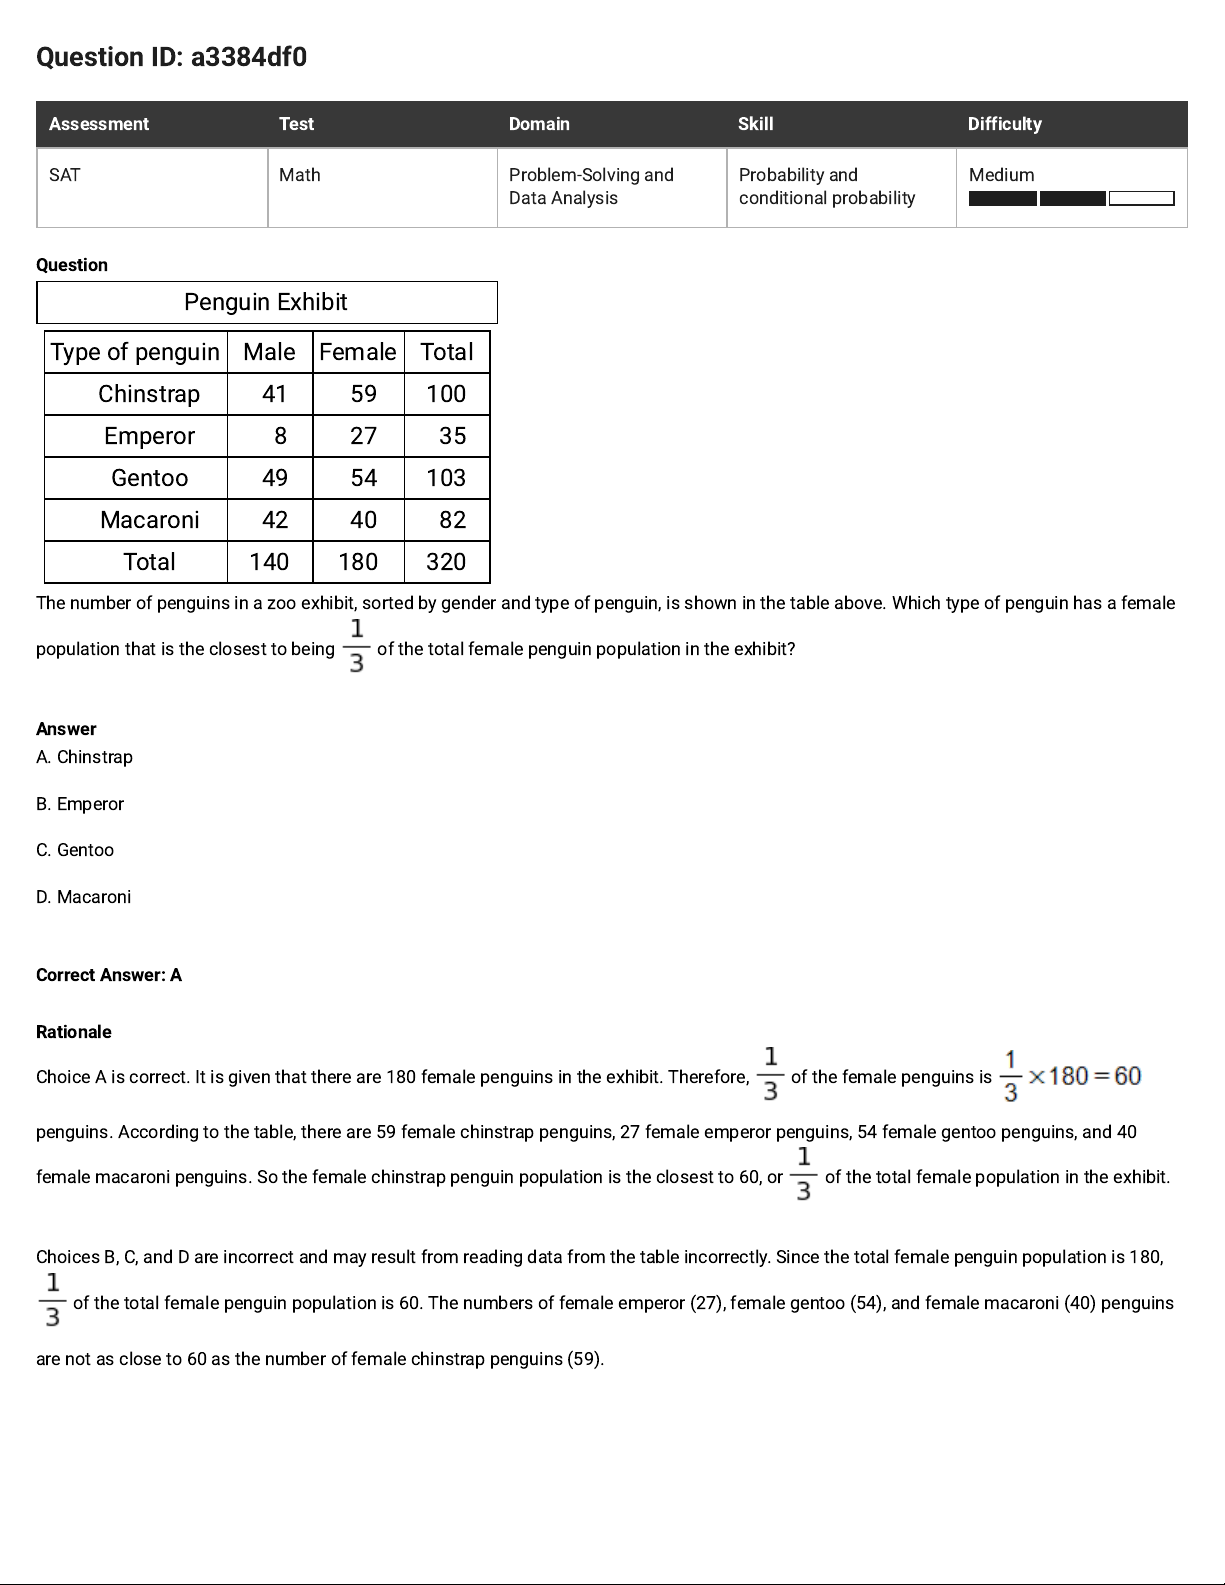
Penguin Exhibit
Type of penguin Male Female Total
Chinstrap
41
59 100
Emperor
8
27
35
Gentoo
49
54 103
Macaroni
42
40
82
Total 140 180 320
The number of penguins in a zoo exhibit, sorted by gender and type of penguin, is shown in the table above. Which type of penguin has a female
population that is the closest to being of the total female penguin population in the exhibit?
Answer
A. Chinstrap
B. Emperor
C. Gentoo
D. Macaroni
Correct Answer: A
Rationale
Choice A is correct. It is given that there are 180 female penguins in the exhibit. Therefore, of the female penguins is
penguins. According to the table, there are 59 female chinstrap penguins, 27 female emperor penguins, 54 female gentoo penguins, and 40
female macaroni penguins. So the female chinstrap penguin population is the closest to 60, or of the total female population in the exhibit.
Choices B, C, and D are incorrect and may result from reading data from the table incorrectly. Since the total female penguin population is 180,
of the total female penguin population is 60. The numbers of female emperor (27), female gentoo (54), and female macaroni (40) penguins
are not as close to 60 as the number of female chinstrap penguins (59).
Page 29
Question ID: 46b2e169
Assessment Test Domain Skill Difficulty
SAT Math Problem-Solving and
Data Analysis
Probability and
conditional probability
Medium
Question
A box contains red pens and blue pens. If one of these pens is selected at random, what is the probability of selecting a red pen? (Express
your answer as a decimal or fraction, not as a percent.)
Correct Answer: .26, 13/50
Rationale
The correct answer is . It's given that a box contains red pens and blue pens. If one of these pens is selected at random, the probability
of selecting a red pen is the number of red pens in the box divided by the number of red and blue pens in the box. The number of red and blue
pens in the box is , or . Since there are red pens in the box, it follows that the probability of selecting a red pen is . Note that
13/50 and .26 are examples of ways to enter a correct answer.
Page 30
Question ID: f8696cd8
Assessment Test Domain Skill Difficulty
SAT Math Problem-Solving and
Data Analysis
Probability and
conditional probability
Medium
Question
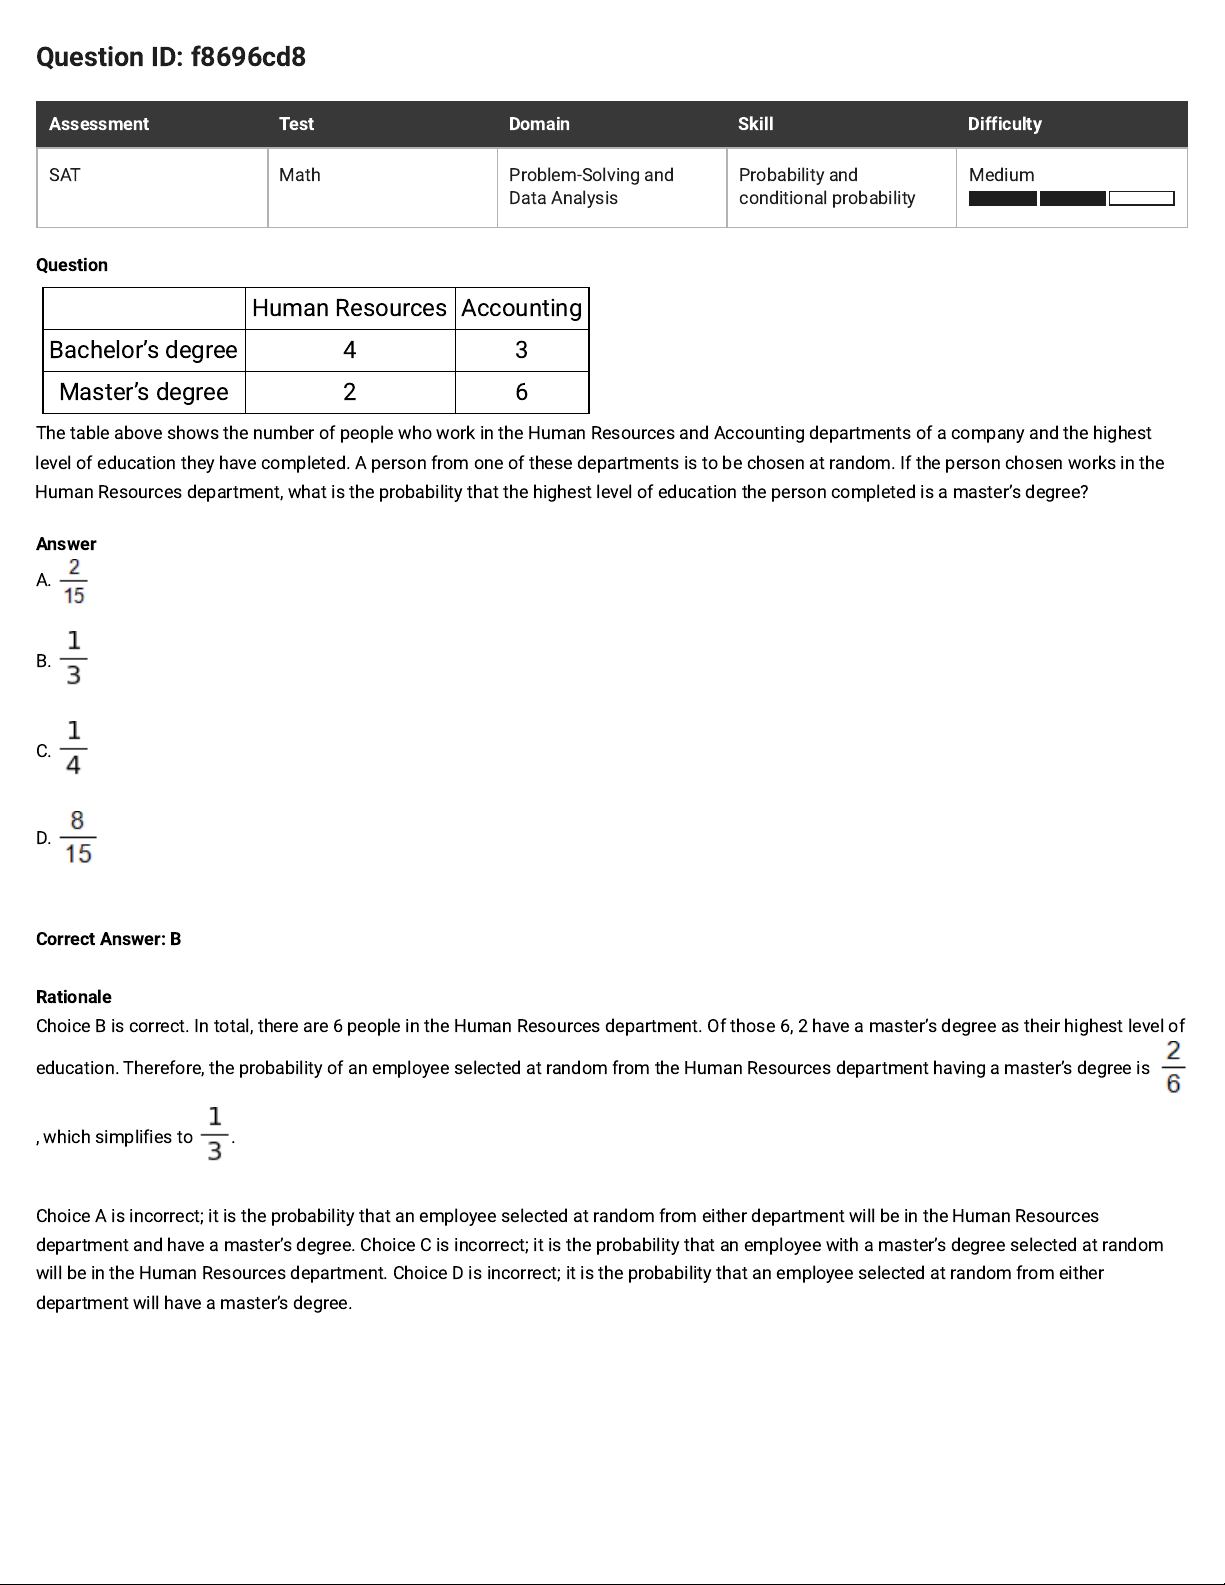
Human Resources Accounting
Bachelor’s degree 4 3
Master’s degree 2 6
The table above shows the number of people who work in the Human Resources and Accounting departments of a company and the highest
level of education they have completed. A person from one of these departments is to be chosen at random. If the person chosen works in the
Human Resources department, what is the probability that the highest level of education the person completed is a master’s degree?
Answer
A.
B.
C.
D.
Correct Answer: B
Rationale
Choice B is correct. In total, there are 6 people in the Human Resources department. Of those 6, 2 have a master’s degree as their highest level of
education. Therefore, the probability of an employee selected at random from the Human Resources department having a master’s degree is
, which simplifies to.
Choice A is incorrect; it is the probability that an employee selected at random from either department will be in the Human Resources
department and have a master’s degree. Choice C is incorrect; it is the probability that an employee with a master’s degree selected at random
will be in the Human Resources department. Choice D is incorrect; it is the probability that an employee selected at random from either
department will have a master’s degree.
 Loading...