

Page 1
Question ID: 1ea09200
Assessment Test Domain Skill Difficulty
SAT Math Problem-Solving and
Data Analysis
Evaluating statistical
claims: Observational
studies and experiments
Hard
Question
A sample of 40 fourth-grade students was selected at random from a certain school. The 40 students completed a survey about the morning
announcements, and 32 thought the announcements were helpful. Which of the following is the largest population to which the results of the
survey can be applied?
Answer
A. The 40 students who were surveyed
B. All fourth-grade students at the school
C. All students at the school
D. All fourth-grade students in the county in which the school is located
Correct Answer: B
Rationale
Choice B is correct. Selecting a sample of a reasonable size at random to use for a survey allows the results from that survey to be applied to the
population from which the sample was selected, but not beyond this population. In this case, the population from which the sample was selected
is all fourth-grade students at a certain school. Therefore, the results of the survey can be applied to all fourth-grade students at the school.
Choice A is incorrect. The results of the survey can be applied to the 40 students who were surveyed. However, this isn’t the largest group to
which the results of the survey can be applied. Choices C and D are incorrect. Since the sample was selected at random from among the fourth-
grade students at a certain school, the results of the survey can’t be applied to other students at the school or to other fourth-grade students who
weren’t represented in the survey results. Students in other grades in the school or other fourth-grade students in the country may feel differently
about announcements than the fourth-grade students at the school.
Page 2
Question ID: 37930b2a
Assessment Test Domain Skill Difficulty
SAT Math Problem-Solving and
Data Analysis
Evaluating statistical
claims: Observational
studies and experiments
Medium
Question
Residents of a town were surveyed to determine whether they are satisfied with the concession standat the local park. A random sample of
200residents was selected. All 200 responded, and87% said they are satisfied. Based on this information, which of the following statements
mustbe true?
I. Of all the town residents, 87% would say they are satisfied with the concession stand at the local park.
II. If another random sample of 200residents were surveyed, 87% wouldsay they are satisfied.
Answer
A. Neither
B. I only
C. II only
D. I and II
Correct Answer: A
Rationale
Choice A is correct. The purpose of surveying a random sample of residents is to approximate the percent of the town residents that are
satisfied with the concession stand. The sample doesn’t necessarily get the same result as surveying every resident of the town, nor would
another sample necessarily have identical results. Therefore, although it’s possible that either statement I or statement II could prove true by
surveying every resident of the town, these statements cannot be proven true solely based on the results of the sample.
Choice B is incorrect because surveying a sample of the town residents may not have the same result as surveying all the town residents.
Choices C and D are incorrect because surveying a different sample of residents could yield different results.
Page 3
Question ID: b4f5a7ca
Assessment Test Domain Skill Difficulty
SAT Math Problem-Solving and
Data Analysis
Evaluating statistical
claims: Observational
studies and experiments
Medium
Question
A survey was conducted using a sample of history professors selected at random from the California State Universities. The professors surveyed
were asked to name the publishers of their current texts. What is the largest population to which the results of the survey can be generalized?
Answer
A. All professors in the United States
B. All history professors in the United States
C. All history professors at all California State Universities
D. All professors at all California State Universities
Correct Answer: C
Rationale
Choice C is correct. Selecting a sample at random when conducting a survey allows the results to be generalized to the population from which
the sample was selected, but not beyond this population. In this situation, the population that the sample was selected from is history professors
from the California State Universities. Therefore, the largest population to which the results of the survey can be generalized is all history
professors at all California State Universities.
Choices A, B, and D are incorrect. Since the sample was selected at random from history professors from the California State Universities, the
results of the survey can’t be generalized to all professors in the United States, all history professors in the United States, or all professors at all
California State Universities. All three of these populations may use different texts and therefore may name different publishers.
Page 4
Question ID: 9bf4c545
Assessment Test Domain Skill Difficulty
SAT Math Problem-Solving and
Data Analysis
Evaluating statistical
claims: Observational
studies and experiments
Easy
Question
The members of a city council wanted to assess the opinions of all city residents about converting an open field into a dogpark. The council
surveyed a sample of 500city residents who own dogs. The survey showed that the majority of those sampled were in favor of the dog park.
Which of the following is true about the city council’s survey?
Answer
A. It shows that the majority of city residents are in favor of the dog park.
B. The survey sample should have included more residents who are dog owners.
C. The survey sample should have consisted entirely of residents who do not own dogs.
D. The survey sample is biased because it is not representative of all city residents.
Correct Answer: D
Rationale
Choice D is correct. The members of the city council wanted to assess opinions of all city residents. To gather an unbiased sample, the council
should have used a random sampling design to select subjects from all city residents. The given survey introduced a sampling bias because the
500 city residents surveyed were all dog owners. This sample is not representative of all city residents because not all city residents are dog
owners.
Choice A is incorrect because when the sampling method isn’t random, there is no guarantee that the survey results will be reliable; hence, they
cannot be generalized to the entire population. Choice B is incorrect because a larger sample of residents who are dog owners would not correct
the sampling bias. Choice C is incorrect because a survey sample of entirely non–dog owners would likely have a biased opinion, just as a
sample of dog owners would likely have a biased opinion.
Page 5
Question ID: 7d68096f
Assessment Test Domain Skill Difficulty
SAT Math Problem-Solving and
Data Analysis
Evaluating statistical
claims: Observational
studies and experiments
Hard
Question
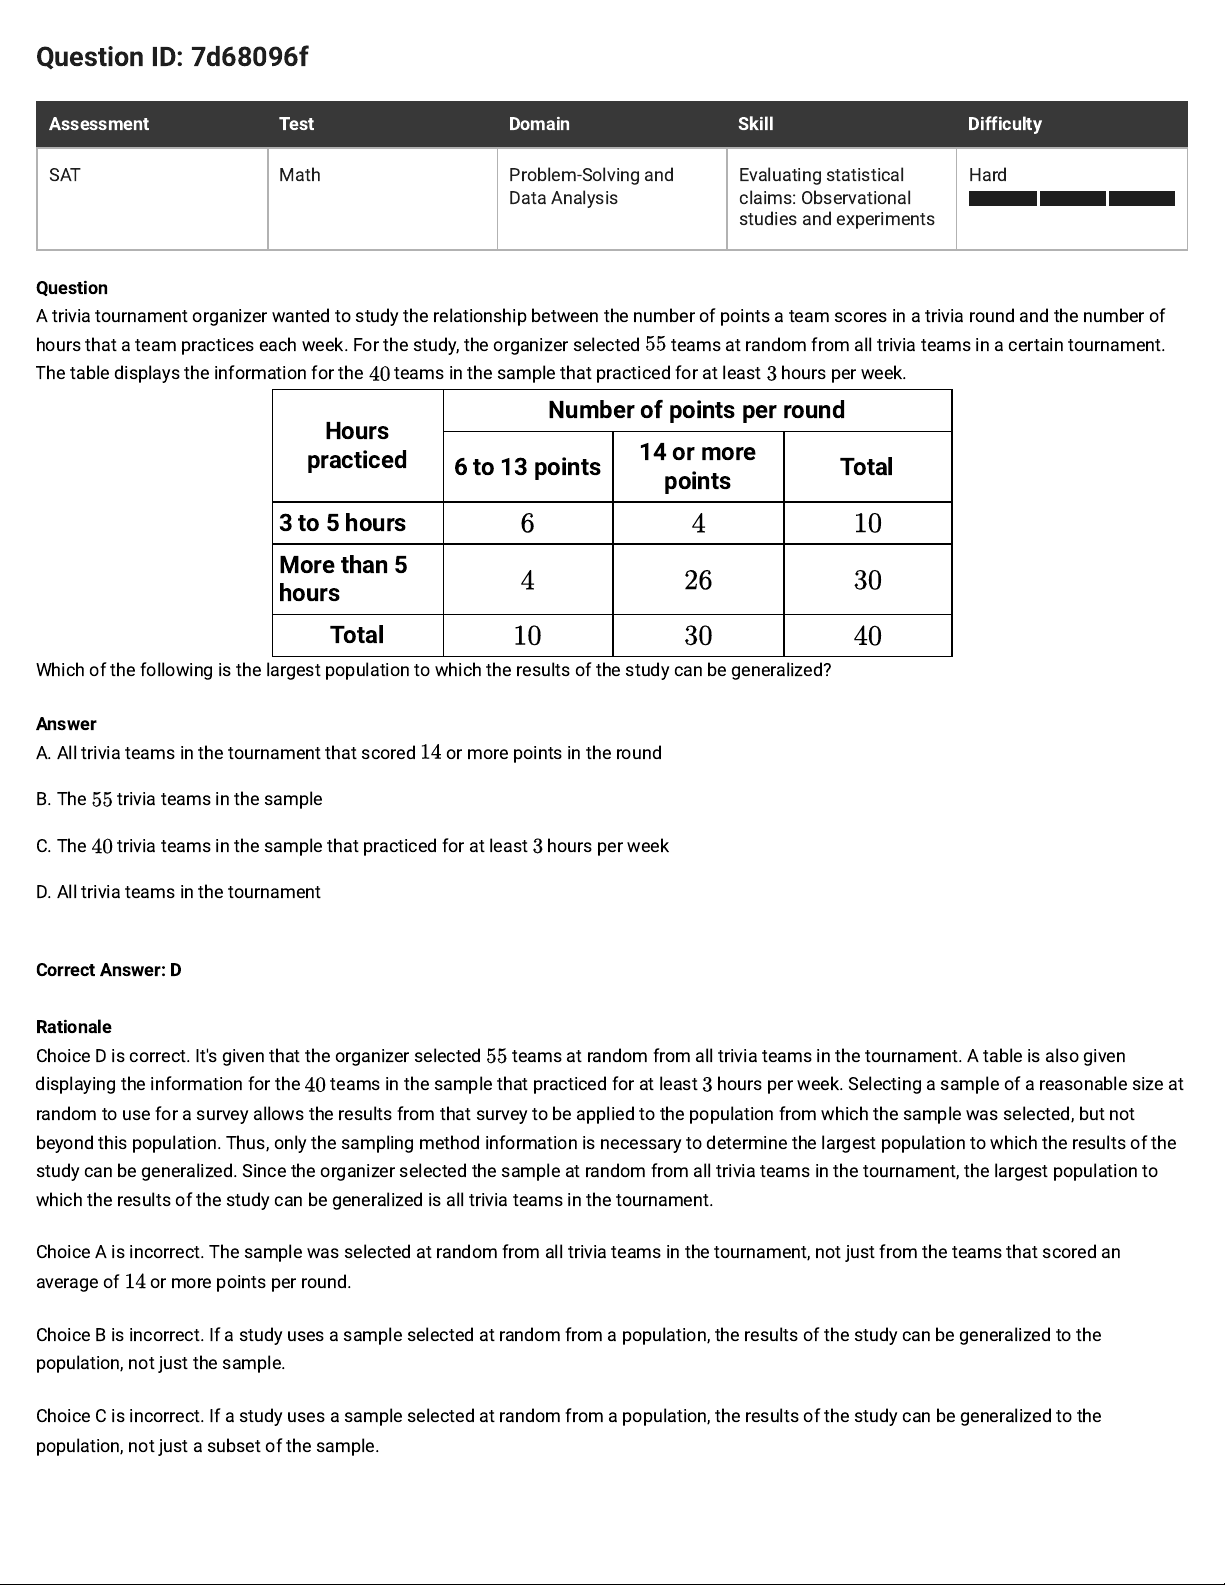
A trivia tournament organizer wanted to study the relationship between the number of points a team scores in a trivia round and the number of
hours that a team practices each week. For the study, the organizer selected teams at random from all trivia teams in a certain tournament.
The table displays the information for the teams in the sample that practiced for at least hours per week.
Hours
practiced
Number of points per round
6 to 13 points
14 or more
points
Total
3 to 5 hours
More than 5
hours
Total
Which of the following is the largest population to which the results of the study can be generalized?
Answer
A. All trivia teams in the tournament that scored or more points in the round
B. The trivia teams in the sample
C. The trivia teams in the sample that practiced for at least hours per week
D. All trivia teams in the tournament
Correct Answer: D
Rationale
Choice D is correct. It's given that the organizer selected teams at random from all trivia teams in the tournament. A table is also given
displaying the information for the teams in the sample that practiced for at least hours per week. Selecting a sample of a reasonable size at
random to use for a survey allows the results from that survey to be applied to the population from which the sample was selected, but not
beyond this population. Thus, only the sampling method information is necessary to determine the largest population to which the results of the
study can be generalized. Since the organizer selected the sample at random from all trivia teams in the tournament, the largest population to
which the results of the study can be generalized is all trivia teams in the tournament.
Choice A is incorrect. The sample was selected at random from all trivia teams in the tournament, not just from the teams that scored an
average of or more points per round.
Choice B is incorrect. If a study uses a sample selected at random from a population, the results of the study can be generalized to the
population, not just the sample.
Choice C is incorrect. If a study uses a sample selected at random from a population, the results of the study can be generalized to the
population, not just a subset of the sample.
Page 6
Question ID: 7ce2830a
Assessment Test Domain Skill Difficulty
SAT Math Problem-Solving and
Data Analysis
Evaluating statistical
claims: Observational
studies and experiments
Hard
Question
A psychologist designed and conducted a study to determine whether playing a certain educational game increases middle school students
’
accuracy in adding fractions. For the study, the psychologist chose a random sample of 35 students from all of the students at one of the middle
schools in a large city. The psychologist found that students who played the game showed significant improvement in accuracy when adding
fractions. What is the largest group to which the results of the study can be generalized?
Answer
A. The 35 students in the sample
B. All students at the school
C. All middle school students in the city
D. All students in the city
Correct Answer: B
Rationale
Choice B is correct. The largest group to which the results of a study can be generalized is the population from which the random sample was
chosen. In this case, the psychologist chose a random sample from all students at one particular middle school. Therefore, the largest group to
which the results can be generalized is all the students at the school.
Choice A is incorrect because this isn’t the largest group the results can be generalized to. Choices C and D are incorrect because these groups
are larger than the population from which the random sample was chosen. Therefore, the sample isn’t representative of these groups.
Page 7
Question ID: 642519d7
Assessment Test Domain Skill Difficulty
SAT Math Problem-Solving and
Data Analysis
Evaluating statistical
claims: Observational
studies and experiments
Medium
Question
A polling agency recently surveyed 1,000 adults who were selected at random from a large city and asked each of the adults, “Are you satisfied
with the quality of air in the city?” Of those surveyed, 78 percent responded that they were satisfied with the quality of air in the city. Based on the
results of the survey, which of the following statements must be true?
1. Of all adults in the city, 78 percent are satisfied with the quality of air in the city.
2. If another 1,000 adults selected at random from the city were surveyed, 78 percent of them would report they are satisfied with the
quality of air in the city.
3. If 1,000 adults selected at random from a different city were surveyed, 78 percent of them would report they are satisfied with the quality
of air in the city.
Answer
A. None
B. II only
C. I and II only
D. I and III only
Correct Answer: A
Rationale
Choice A is correct. Statement I need not be true. The fact that 78% of the 1,000 adults who were surveyed responded that they were satisfied
with the air quality in the city does not mean that the exact same percentage of all adults in the city will be satisfied with the air quality in the city.
Statement II need not be true because random samples, even when they are of the same size, are not necessarily identical with regard to
percentages of people in them who have a certain opinion. Statement III need not be true for the same reason that statement II need not be true:
results from different samples can vary. The variation may be even bigger for this sample since it would be selected from a different city.
Therefore, none of the statements must be true.
Choices B, C, and D are incorrect because none of the statements must be true.
Page 8
Question ID: 82dfb646
Assessment Test Domain Skill Difficulty
SAT Math Problem-Solving and
Data Analysis
Evaluating statistical
claims: Observational
studies and experiments
Easy
Question
A market researcher selected 200people at random from a group of people who indicated that they liked a certain book. The 200people were
shown a movie based on the book and then asked whether they liked or disliked the movie. Of those surveyed, 95% said they disliked the movie.
Which of the following inferences can appropriately be drawn from this survey result?
Answer
A. At least 95% of people who go see movies will dislike thismovie.
B. At least 95% of people who read books will dislike thismovie.
C. Most people who dislike this book will like thismovie.
D. Most people who like this book will dislike thismovie.
Correct Answer: D
Rationale
Choice D is correct. The sample was selected from a group of people who indicated that they liked the book. It is inappropriate to generalize the
result of the survey beyond the population from which the participants were selected. Choice D is the most appropriate inference from the survey
results because it describes a conclusion about people who liked the book, and the results of the survey indicate that most people who like the
book disliked the movie.
Choices A, B, and C are incorrect because none of these inferences can be drawn from the survey results. Choices A and B need not be true. The
people surveyed all liked the book on which the movie was based, which is not necessarily true of all people who go see movies or all people who
read books. Thus, the people surveyed are not representative of all people who go see movies or all people who read books. Therefore, the
results of this survey cannot appropriately be extended to at least 95% of people who go see movies or to at least 95% of people who read
books. Choice C need not be true because the sample includes only people who liked the book, and so the results do not extend to people who
dislike the book.
Page 9
Question ID: aa43b41f
Assessment Test Domain Skill Difficulty
SAT Math Problem-Solving and
Data Analysis
Evaluating statistical
claims: Observational
studies and experiments
Hard
Question
Near the end of a US cable news show, the host invited viewers to respond to a poll on the show’s website that asked, “Do you support the new
federal policy discussed during the show?” At the end of the show, the host reported that 28% responded “Yes,” and 70% responded “No.” Which
of the following best explains why the results are unlikely to represent the sentiments of the population of the United States?
Answer
A. The percentages do not add up to 100%, so any possible conclusions from the poll are invalid.
B. Those who responded to the poll were not a random sample of the population of the UnitedStates.
C. There were not 50% “Yes” responses and 50% “No” responses.
D. The show did not allow viewers enough time to respond to the poll.
Correct Answer: B
Rationale
Choice B is correct. In order for the poll results from a sample of a population to represent the entire population, the sample must be
representative of the population. A sample that is randomly selected from a population is more likely than a sample of the type described to
represent the population. In this case, the people who responded were people with access to cable television and websites, which aren’t
accessible to the entire population. Moreover, the people who responded also chose to watch the show and respond to the poll. The people who
made these choices aren’t representative of the entire population of the United States because they were not a random sample of the population
of the United States.
Choices A, C, and D are incorrect because they present reasons unrelated to whether the sample is representative of the population of the United
States.
Page 10
Question ID: 4a422e3e
Assessment Test Domain Skill Difficulty
SAT Math Problem-Solving and
Data Analysis
Evaluating statistical
claims: Observational
studies and experiments
Hard
Question
To determine the mean number of children per household in a community, Tabitha surveyed 20families at a playground. For the 20 families
surveyed, the mean number of children per household was 2.4. Which of the following statements must be true?
Answer
A. The mean number of children per household in the community is 2.4.
B. A determination about the mean number of children per household in the community should not be made because the sample size is too
small.
C. The sampling method is flawed and may produce a biased estimate of the mean number of children per household in the community.
D. The sampling method is not flawed and is likely to produce an unbiased estimate of the mean number of children per household in the
community.
Correct Answer: C
Rationale
Choice C is correct. In order to use a sample mean to estimate the mean for a population, the sample must be representative of the population
(for example, a simple random sample). In this case, Tabitha surveyed 20 families in a playground. Families in the playground are more likely to
have children than other households in the community. Therefore, the sample isn’t representative of the population. Hence, the sampling method
is flawed and may produce a biased estimate.
Choices A and D are incorrect because they incorrectly assume the sampling method is unbiased. Choice B is incorrect because a sample of size
20 could be large enough to make an estimate if the sample had been representative of all the families in the community.
Page 11
Question ID: 6fca0144
Assessment Test Domain Skill Difficulty
SAT Math Problem-Solving and
Data Analysis
Evaluating statistical
claims: Observational
studies and experiments
Hard
Question
For a baobab tree habitat in South Africa, a scientist randomly selected baobab trees that were years old and randomly assigned them to
two groups. Each group was subjected to a different watering pattern for consecutive years to observe whether the watering pattern affects
the trees’ growth rate. Based on the design of the study, what is the largest group to which these results can be applied?
Answer
A. All the baobab trees that were selected in this habitat
B. All the baobab trees that were years old in this habitat
C. All the baobab trees that were years old in South Africa
D. All the baobab trees that were years old in this habitat
Correct Answer: D
Rationale
Choice D is correct. When a study uses a randomly selected sample, the largest group to which the results of the study can be applied is the
population from which the sample was selected. It's given that the scientist randomly selected the trees from the baobab trees in a certain
habitat that were years old. Therefore, the largest group to which the results of this study can be applied is all the baobab trees that were
years old in this habitat.
Choice A is incorrect. Since the sample was randomly selected from a population, the results can be applied to a larger group than the sample.
Choice B is incorrect. The sample was selected from a population of baobab trees that were years old, not years old.
Choice C is incorrect. The sample was selected from a certain tree habitat in South Africa, not from all the baobab trees that were years oldin
South Africa.
 Loading...