

Page 1
Question ID: 128c75e2
Assessment Test Domain Skill Difficulty
SAT Math Advanced Math Nonlinear functions Hard
Question
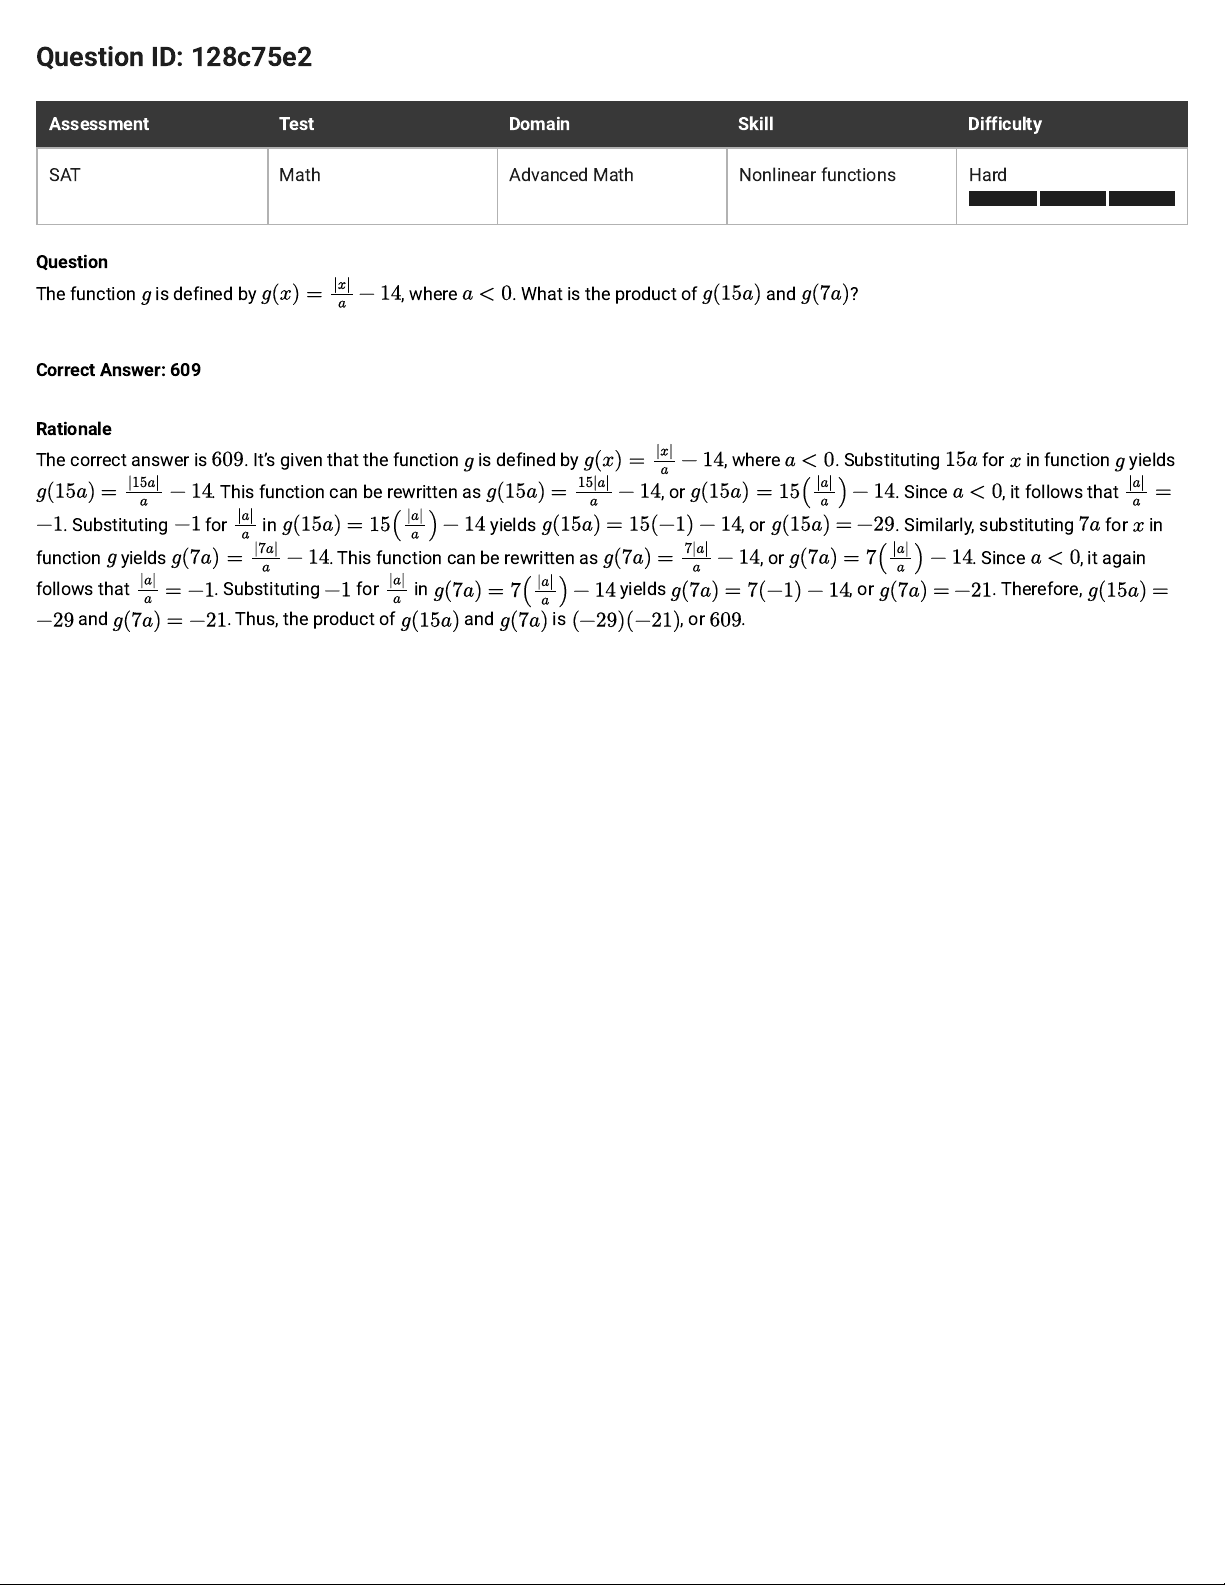
The function is defined by , where
. What is the product of
and
?
Correct Answer: 609
Rationale
The correct answer is . It’s given that the function is defined by , where . Substituting for in function yields
. This function can be rewritten as , or . Since , it follows that
. Substituting for in yields , or . Similarly, substituting for in
function yields . This function can be rewritten as , or . Since , it again
follows that . Substituting for in yields , or . Therefore,
and . Thus, the product of and is , or .
Page 2
Question ID: 91e7ea5e
Assessment Test Domain Skill Difficulty
SAT Math Advanced Math Nonlinear functions Hard
Question
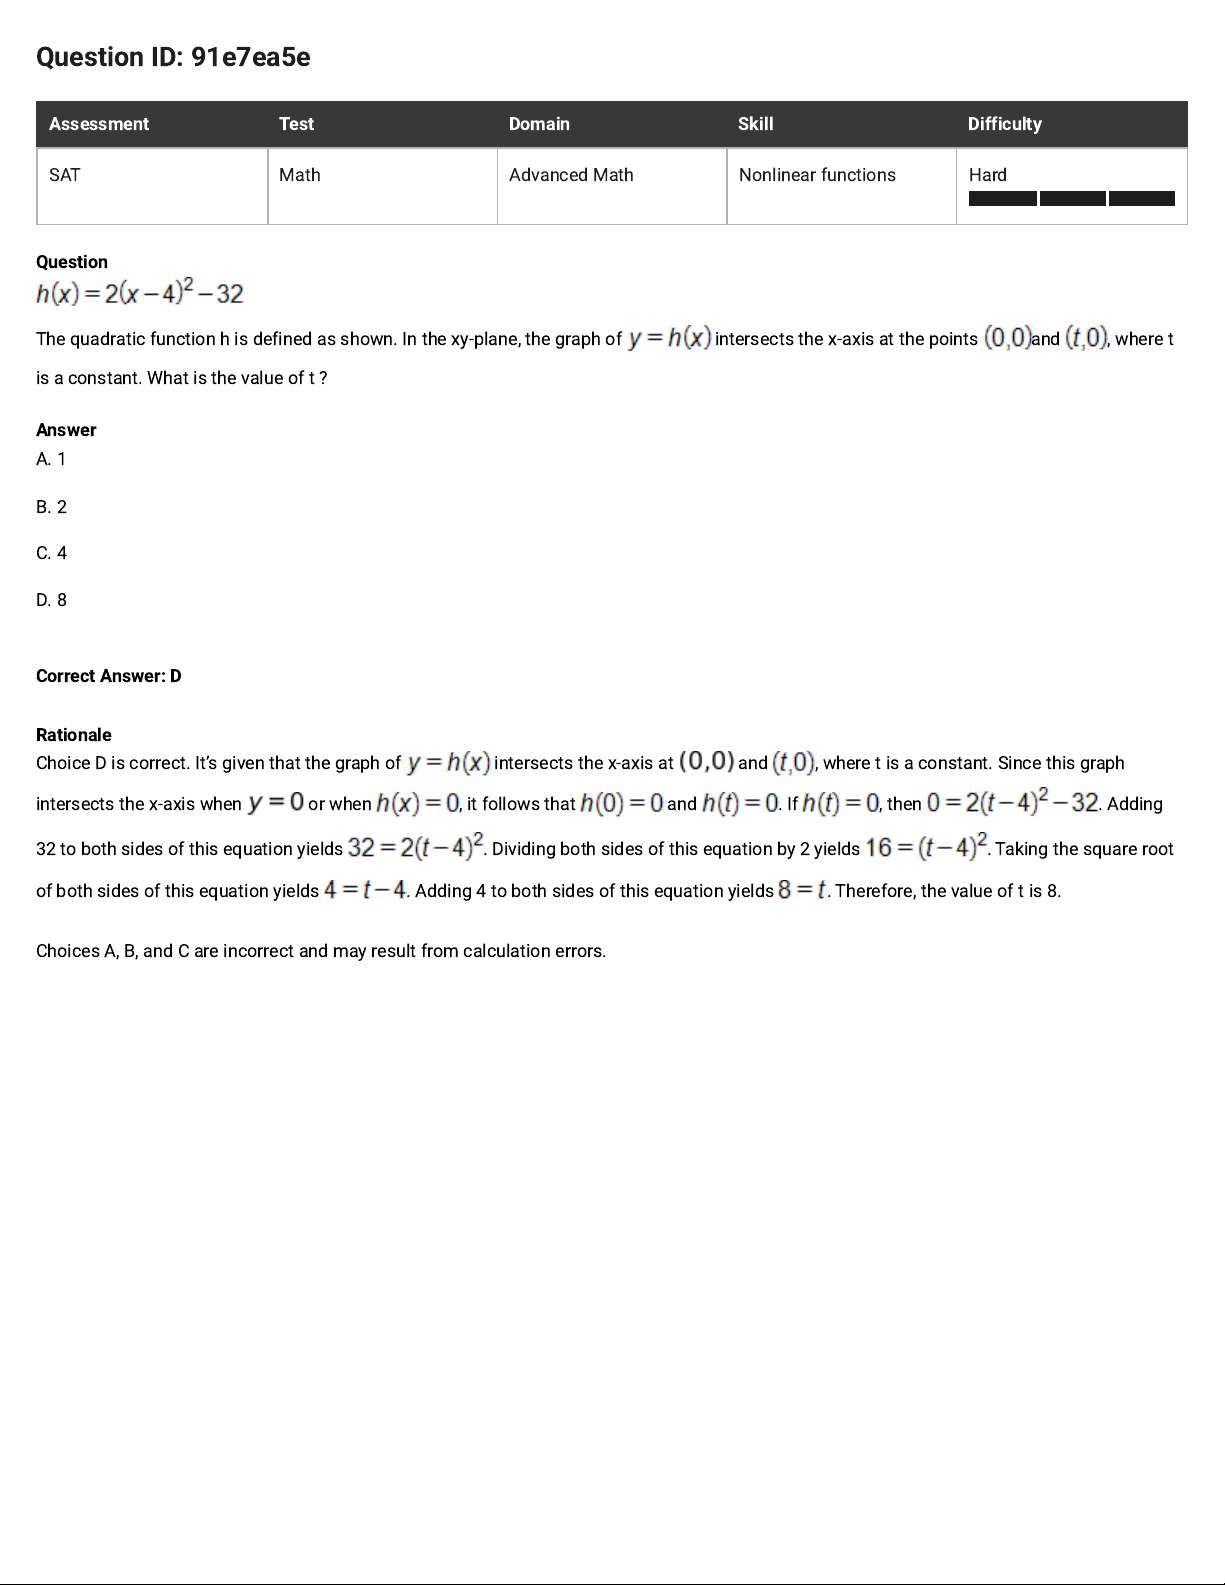
The quadratic function h is defined as shown. In the xy-plane, the graph of intersects the x-axis at the points and , where t
is a constant. What is the value of t ?
Answer
A. 1
B. 2
C. 4
D. 8
Correct Answer: D
Rationale
Choice D is correct. It’s given that the graph of intersects the x-axis at and , where t is a constant. Since this graph
intersects the x-axis when or when , it follows that and . If , then . Adding
32 to both sides of this equation yields . Dividing both sides of this equation by 2 yields . Taking the square root
of both sides of this equation yields . Adding 4 to both sides of this equation yields . Therefore, the value of t is 8.
Choices A, B, and C are incorrect and may result from calculation errors.
Page 3
Question ID: ebed7dc6
Assessment Test Domain Skill Difficulty
SAT Math Advanced Math Nonlinear functions Hard
Question
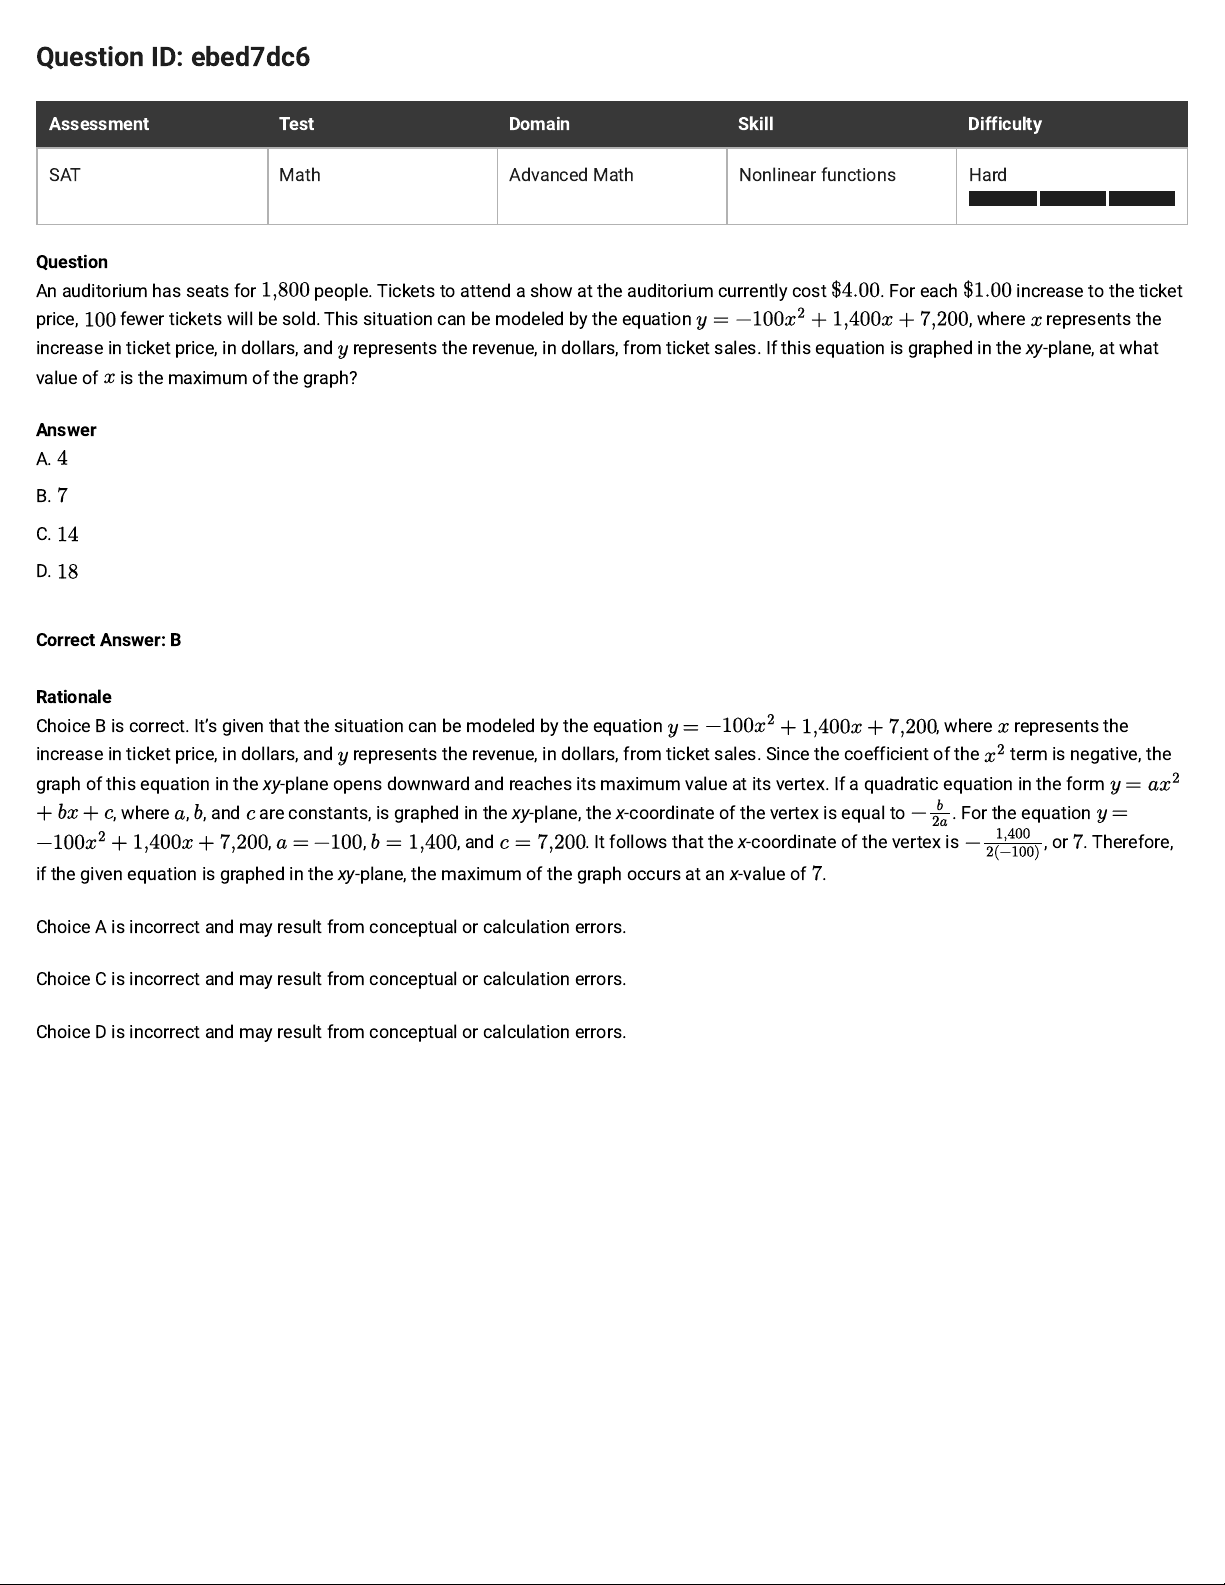
An auditorium has seats for people. Tickets to attend a show at the auditorium currently cost . For each increase to the ticket
price, fewer tickets will be sold. This situation can be modeled by the equation , where represents the
increase in ticket price, in dollars, and represents the revenue, in dollars, from ticket sales. If this equation is graphed in the xy-plane, at what
value of is the maximum of the graph?
Answer
A.
B.
C.
D.
Correct Answer: B
Rationale
Choice B is correct. It’s given that the situation can be modeled by the equation , where represents the
increase in ticket price, in dollars, and represents the revenue, in dollars, from ticket sales. Since the coefficient of the term is negative, the
graph of this equation in the xy-plane opens downward and reaches its maximum value at its vertex. If a quadratic equation in the form
, where , , and are constants, is graphed in the xy-plane, the x-coordinate of the vertex is equal to . For the equation
, , , and . It follows that the x-coordinate of the vertex is , or . Therefore,
if the given equation is graphed in the
xy
-plane, the maximum of the graph occurs at an x-value of .
Choice A is incorrect and may result from conceptual or calculation errors.
Choice C is incorrect and may result from conceptual or calculation errors.
Choice D is incorrect and may result from conceptual or calculation errors.
Page 4
Question ID: a9084ca4
Assessment Test Domain Skill Difficulty
SAT Math Advanced Math Nonlinear functions Hard
Question
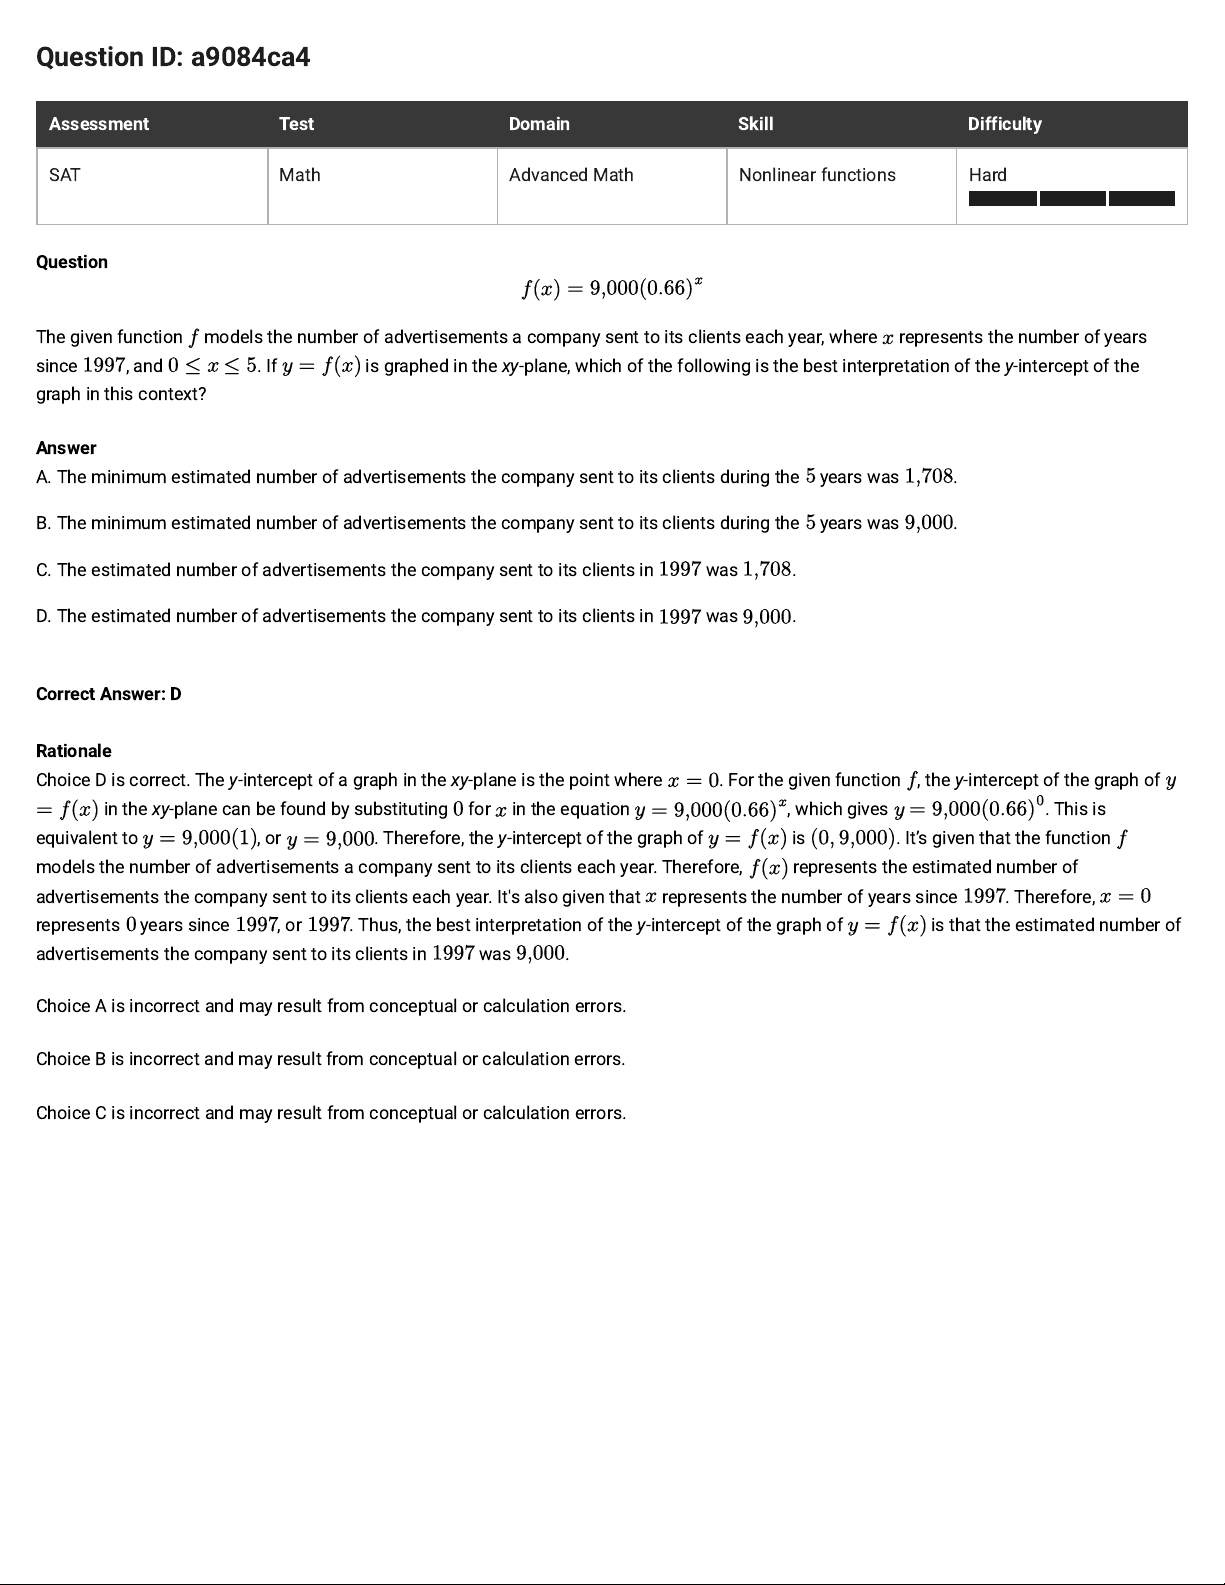
The given function models the number of advertisements a company sent to its clients each year, where represents the number of years
since , and . If is graphed in the xy-plane, which of the following is the best interpretation of the y-intercept of the
graph in this context?
Answer
A. The minimum estimated number of advertisements the company sent to its clients during the years was .
B. The minimum estimated number of advertisements the company sent to its clients during the years was .
C. The estimated number of advertisements the company sent to its clients in was .
D. The estimated number of advertisements the company sent to its clients in was .
Correct Answer: D
Rationale
Choice D is correct. The y-intercept of a graph in the xy-plane is the point where . For the given function , they
-intercept of the graph of
in the xy-plane can be found by substituting for in the equation , which gives . This is
equivalent to
, or . Therefore, the y-intercept of the graph of is . It’s given that the function
models the number of advertisements a company sent to its clients each year. Therefore, represents the estimated number of
advertisements the company sent to its clients each year. It's also given that represents the number of years since . Therefore,
represents years since , or . Thus, the best interpretation of the y-intercept of the graph of
is that the estimated number of
advertisements the company sent to its clients in was .
Choice A is incorrect and may result from conceptual or calculation errors.
Choice B is incorrect and may result from conceptual or calculation errors.
Choice C is incorrect and may result from conceptual or calculation errors.
Page 5
Question ID: 6abec9a8
Assessment Test Domain Skill Difficulty
SAT Math Advanced Math Nonlinear functions Easy
Question
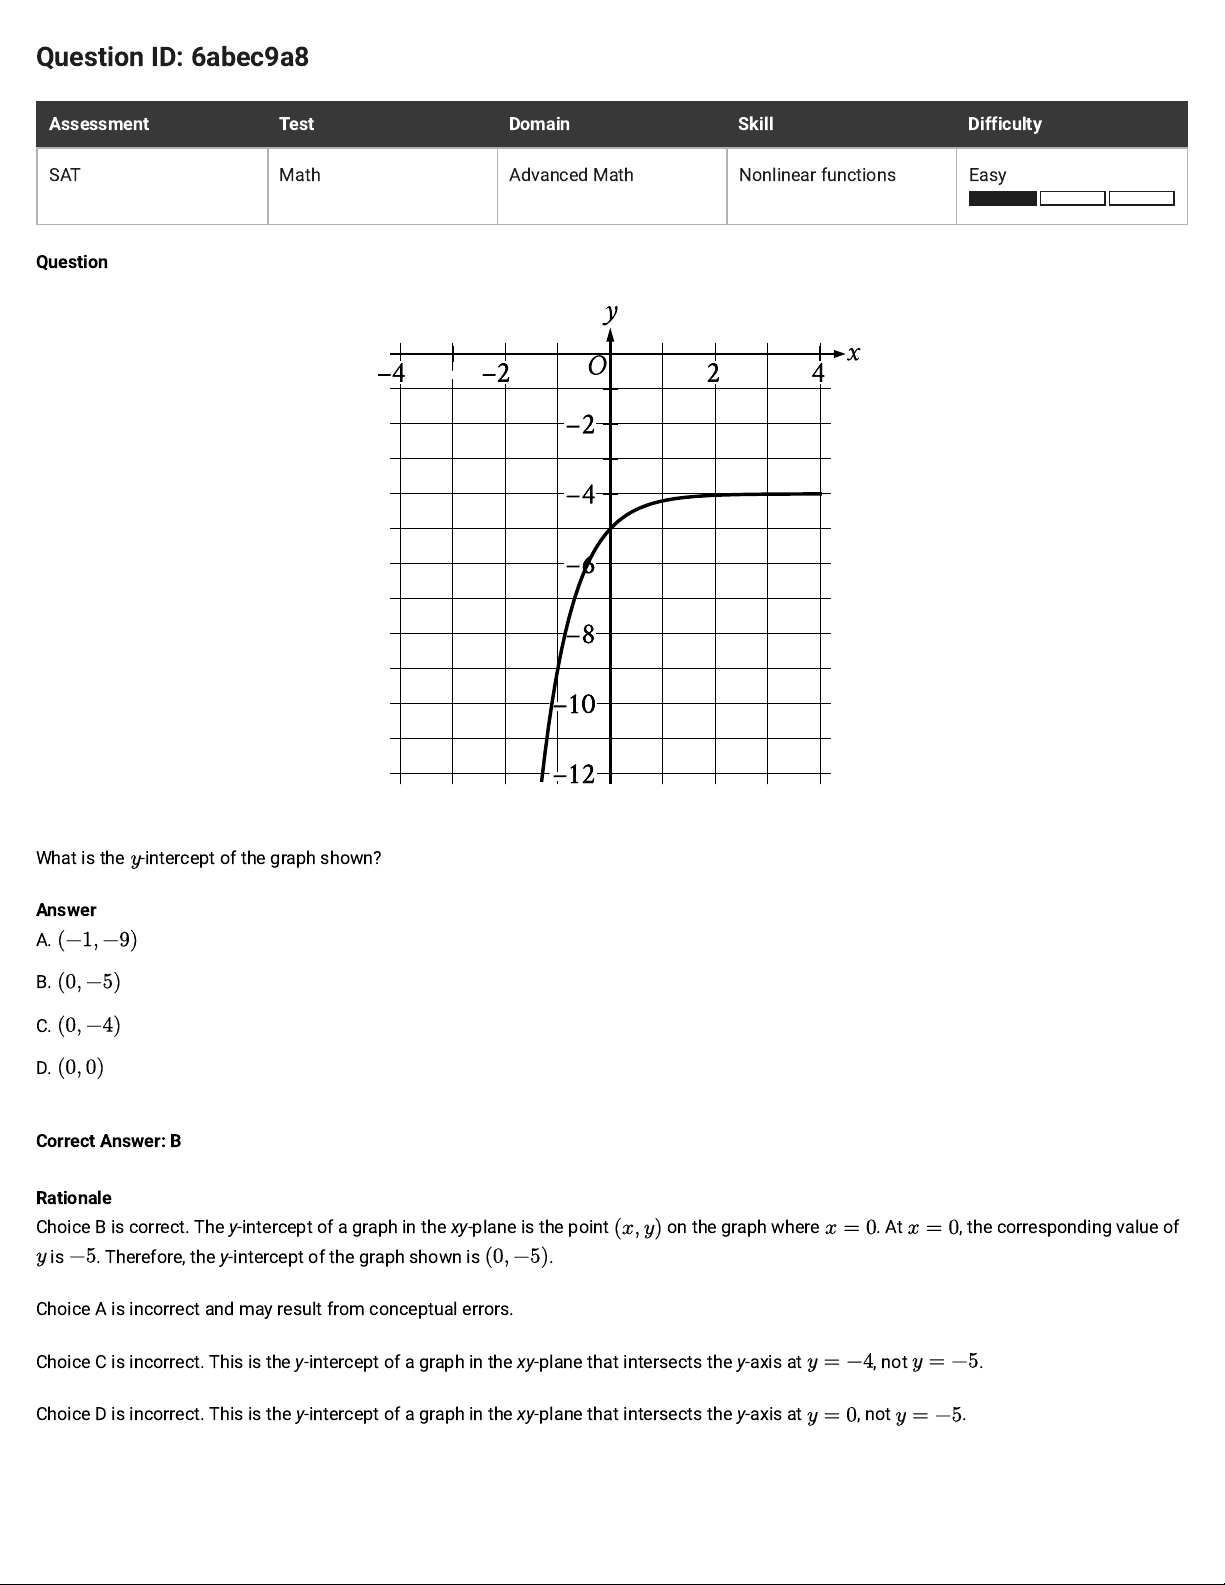
What is the -intercept of the graph shown?
Answer
A.
B.
C.
D.
Correct Answer: B
Rationale
Choice B is correct. The y-intercept of a graph in the xy-plane is the point
on the graph where . At , the corresponding value of
is . Therefore, the y-intercept of the graph shownis .
Choice A is incorrect and may result from conceptual errors.
Choice C is incorrect. This is the y-intercept of a graph in the xy-plane that intersects the y-axis at , not .
Choice D is incorrect. This is the y-intercept of a graph in the xy-plane that intersects the y-axis at , not .
Page 6
Question ID: b8f13a3a
Assessment Test Domain Skill Difficulty
SAT Math Advanced Math Nonlinear functions Hard
Question
Function is defined by , where and are constants. In the xy-plane, the graph of has a y-intercept at
. The product of and is . What is the value of ?
Correct Answer: 20
Rationale
The correct answer is . It’s given that . Substituting
for in the equation yields
. It’s given that the y-intercept of the graph of is . Substituting for and for in the equation
yields , which is equivalent to , or . Adding to both sides of this
equation yields . It’s given that the product of and is , or . Substituting for in this equation yields .
Dividing both sides of this equation by yields .
Page 7
Question ID: 1d3c5c95
Assessment Test Domain Skill Difficulty
SAT Math Advanced Math Nonlinear functions Medium
Question
An entomologist recommended a program to reduce a certain invasive beetle population in an area. The given function estimates this beetle
species' population years after , where . Which of the following is the best interpretation of in this context?
Answer
A. The estimated initial beetle population for this species and area in
B. The estimated beetle population for this species and area years after
C. The estimated percent decrease in the beetle population for this species and area each year after
D. The estimated percent decrease in the beetle population for this species and area every years after
Correct Answer: A
Rationale
Choice A is correct. For an exponential function in the form , where and are positive constants and , the initial value of
, or the value of when , is and the value of decreases by each time increases by . Therefore, the initial
value of the function , or the value of when , is . Therefore, the best interpretation of in this
context is the estimated initial beetle population for this species and area in .
Choice B is incorrect. The estimated beetle population for this species and area years after is , or approximately , not
.
Choice C is incorrect. The estimated percent decrease in the beetle population for this species and area each year after is ,
or , not .
Choice D is incorrect. The estimated percent decrease in the beetle population for this species and area every years after is
, or approximately , not .
Page 8
Question ID: 788bfd56
Assessment Test Domain Skill Difficulty
SAT Math Advanced Math Nonlinear functions Easy
Question
The function is defined by
. What is the value of
?
Answer
A.
B.
C.
D.
Correct Answer: B
Rationale
Choice B is correct. The value of
is the value of
when .It's given that the function is defined by .
Substituting
for in this equation yields
. Since the positive square root of is , it follows that this equation can
be rewritten as
, or . Therefore, the value of is .
Choice A is incorrect and may result from conceptual or calculation errors.
Choice C is incorrect. This is the value of
, not .
Choice D is incorrect. This is the value of , not
.
Page 9
Question ID: f89af023
Assessment Test Domain Skill Difficulty
SAT Math Advanced Math Nonlinear functions Medium
Question
A rectangular volleyball court has an area of 162square meters. If the length of the court is twice the width, what is the width of the court, in
meters?
Answer
A. 9
B. 18
C. 27
D. 54
Correct Answer: A
Rationale
Choice A is correct. It’s given that the volleyball court is rectangular and has an area of 162 square meters. The formula for the area of a
rectangle is , where A is the area, is the length, and w is the width of the rectangle. It’s also given that the length of the volleyball
court is twice the width, thus . Substituting the given value into the formula for the area of a rectangle and using the relationship
between length and width for this rectangle yields . This equation can be rewritten as . Dividing both sides of this
equation by 2 yields . Taking the square root of both sides of this equation yields . Since the width of a rectangle is a positive
number, the width of the volleyball court is 9 meters.
Choice B is incorrect because this is the length of the rectangle. Choice C is incorrect because this is the result of using 162 as the perimeter
rather than the area. Choice D is incorrect because this is the result of calculating w in the equation instead of
.
Page 10
Question ID: e53add44
Assessment Test Domain Skill Difficulty
SAT Math Advanced Math Nonlinear functions Medium
Question
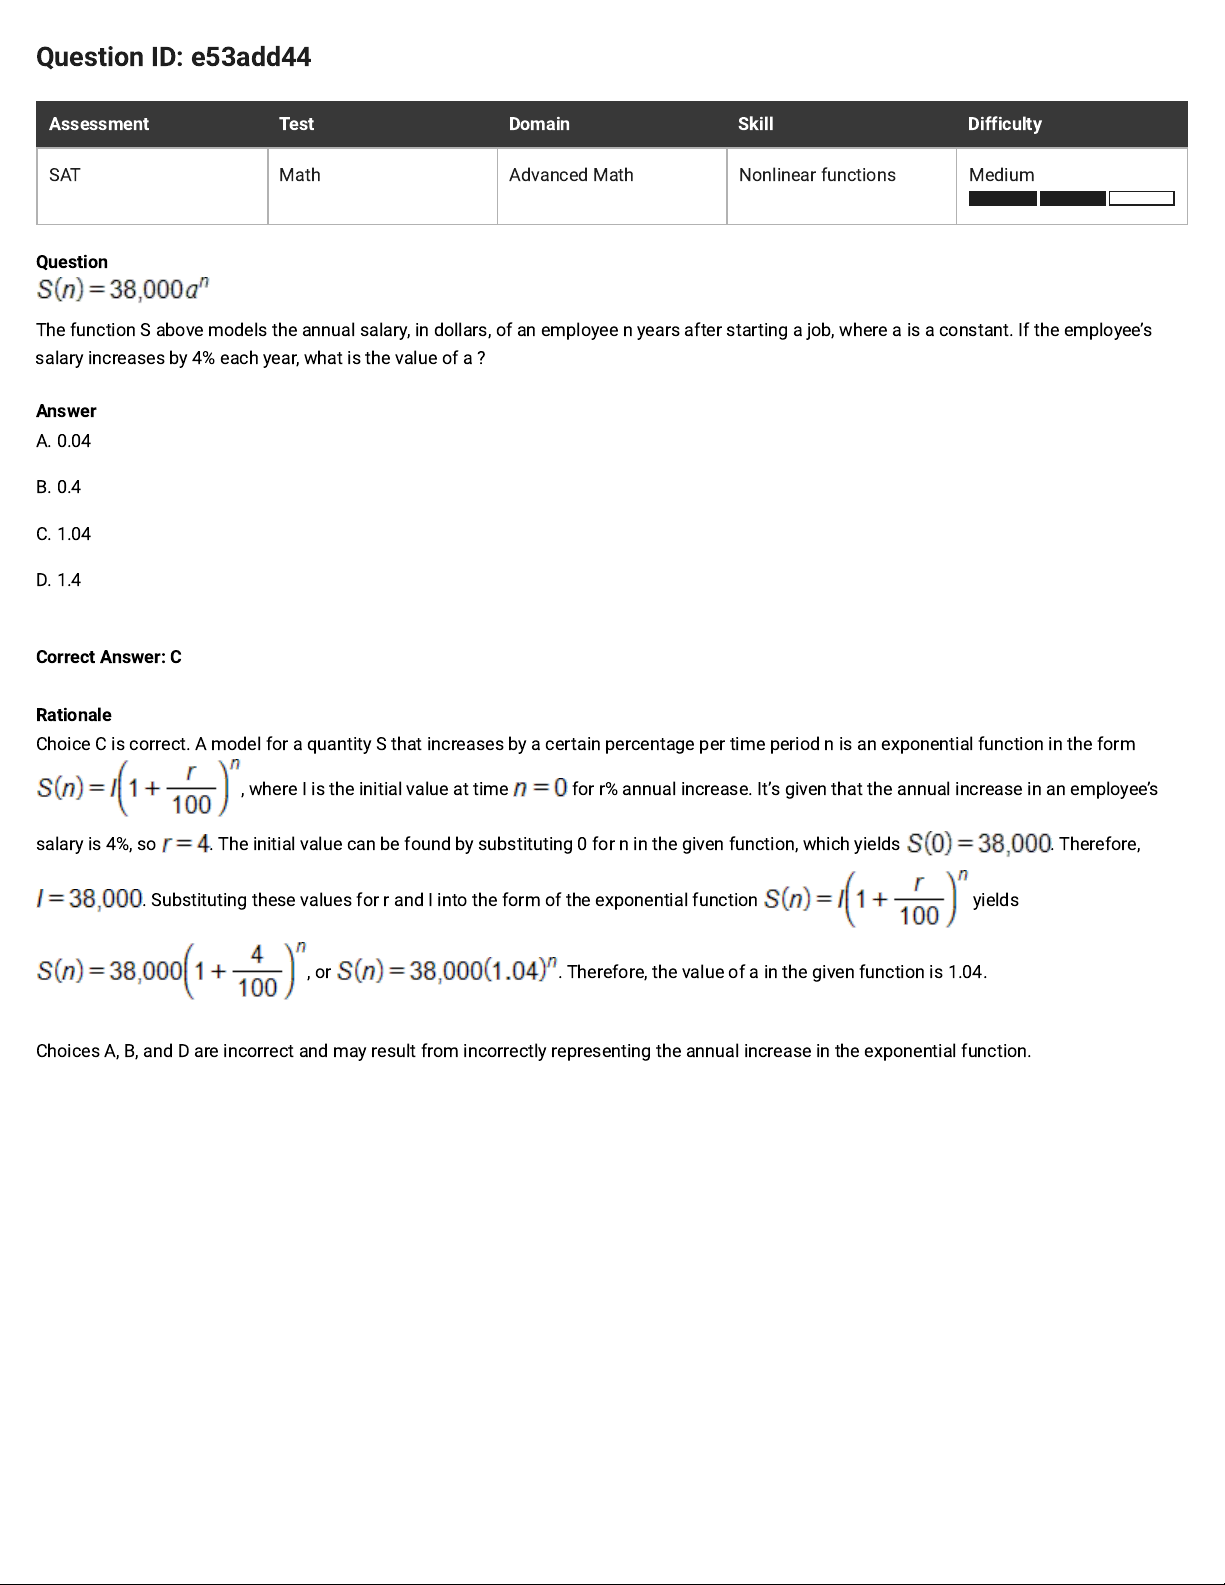
The function S above models the annual salary, in dollars, of an employee n years after starting a job, where a is a constant. If the employee’s
salary increases by 4% each year, what is the value of a ?
Answer
A. 0.04
B. 0.4
C. 1.04
D. 1.4
Correct Answer: C
Rationale
Choice C is correct. A model for a quantity S that increases by a certain percentage per time period n is an exponential function in the form
, where I is the initial value at time for r% annual increase. It’s given that the annual increase in an employee’s
salary is 4%, so . The initial value can be found by substituting 0 for n in the given function, which yields . Therefore,
. Substituting these values for r and I into the form of the exponential function yields
, or . Therefore, the value of a in the given function is 1.04.
Choices A, B, and D are incorrect and may result from incorrectly representing the annual increase in the exponential function.
Page 11
Question ID: 9654add7
Assessment Test Domain Skill Difficulty
SAT Math Advanced Math Nonlinear functions Hard
Question
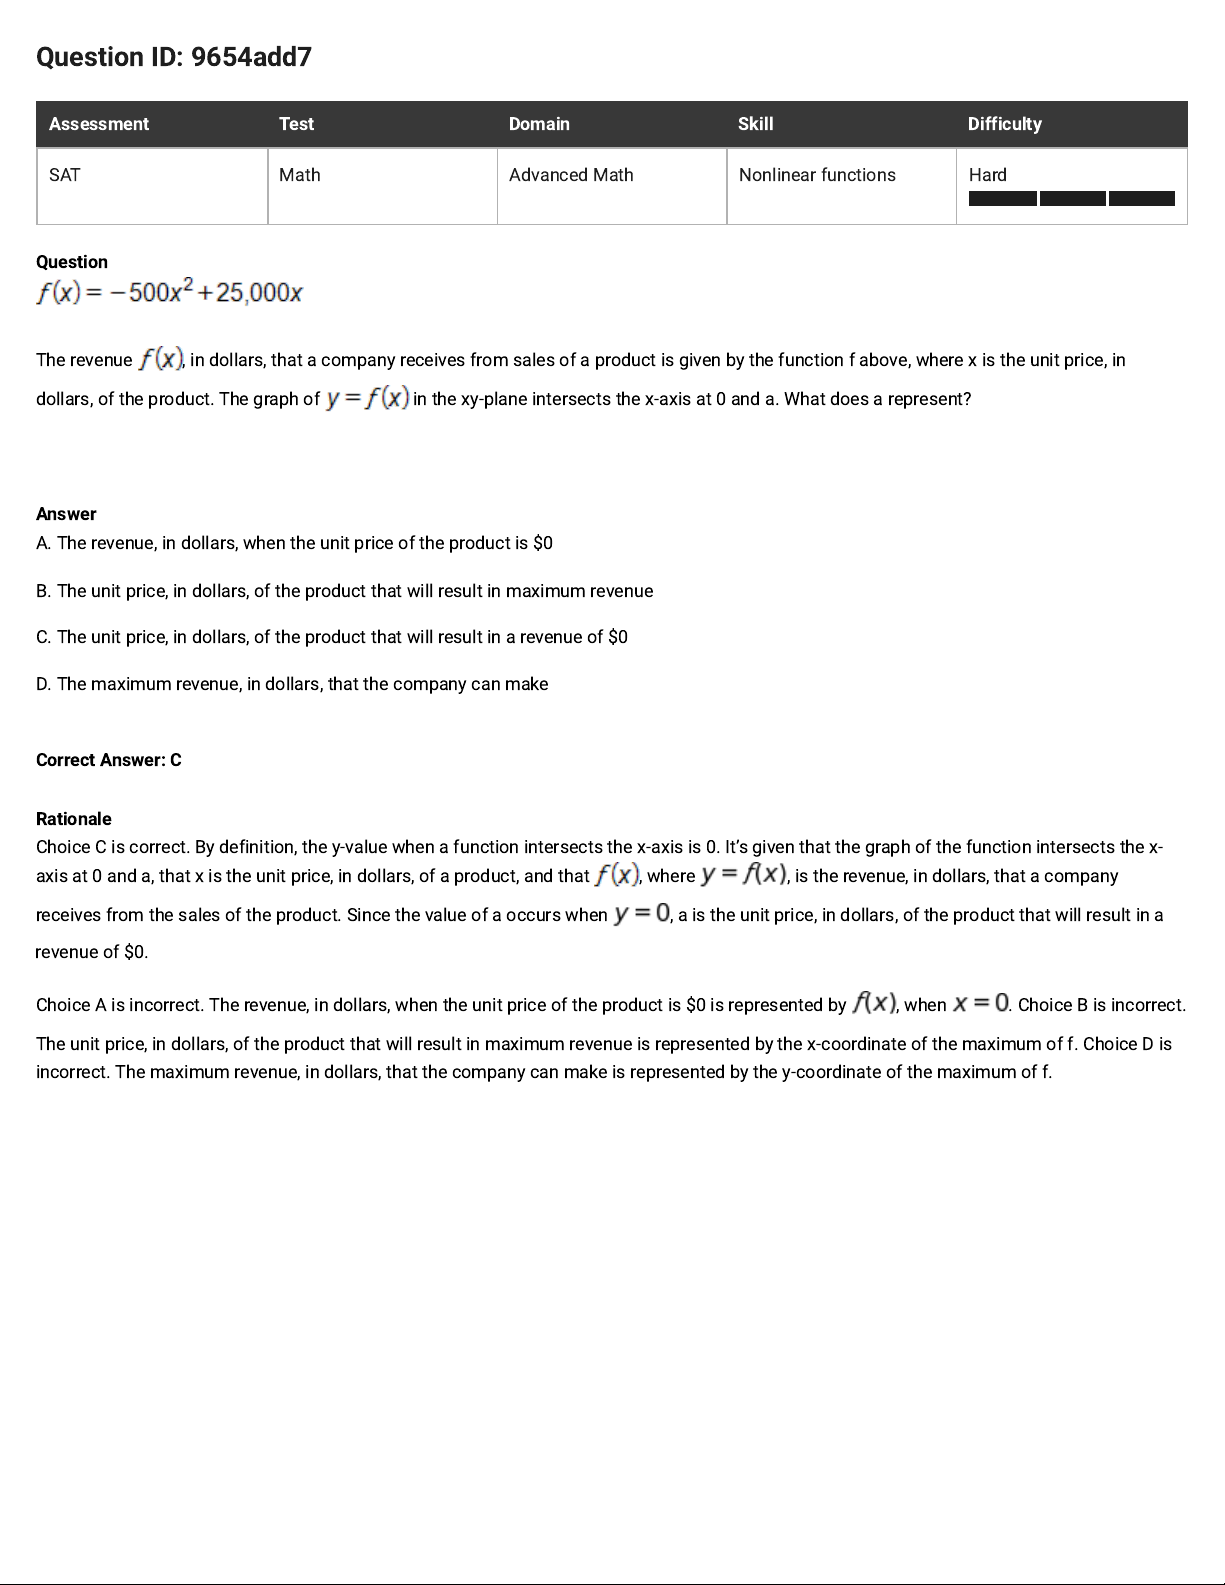
The revenue , in dollars, that a company receives from sales of a product is given by the function f above, where x is the unit price, in
dollars, of the product. The graph of in the xy-plane intersects the x-axis at 0 and a. What does a represent?
Answer
A. The revenue, in dollars, when the unit price of the product is $0
B. The unit price, in dollars, of the product that will result in maximum revenue
C. The unit price, in dollars, of the product that will result in a revenue of $0
D. The maximum revenue, in dollars, that the company can make
Correct Answer: C
Rationale
Choice C is correct. By definition, the y-value when a function intersects the x-axis is 0. It’s given that the graph of the function intersects the x-
axis at 0 and a, that x is the unit price, in dollars, of a product, and that , where , is the revenue, in dollars, that a company
receives from the sales of the product. Since the value of a occurs when , a is the unit price, in dollars, of the product that will result in a
revenue of $0.
Choice A is incorrect. The revenue, in dollars, when the unit price of the product is $0 is represented by , when . Choice B is incorrect.
The unit price, in dollars, of the product that will result in maximum revenue is represented by the x-coordinate of the maximum of f. Choice D is
incorrect. The maximum revenue, in dollars, that the company can make is represented by the y-coordinate of the maximum of f.
Page 12
Question ID: 263f9937
Assessment Test Domain Skill Difficulty
SAT Math Advanced Math Nonlinear functions Hard
Question
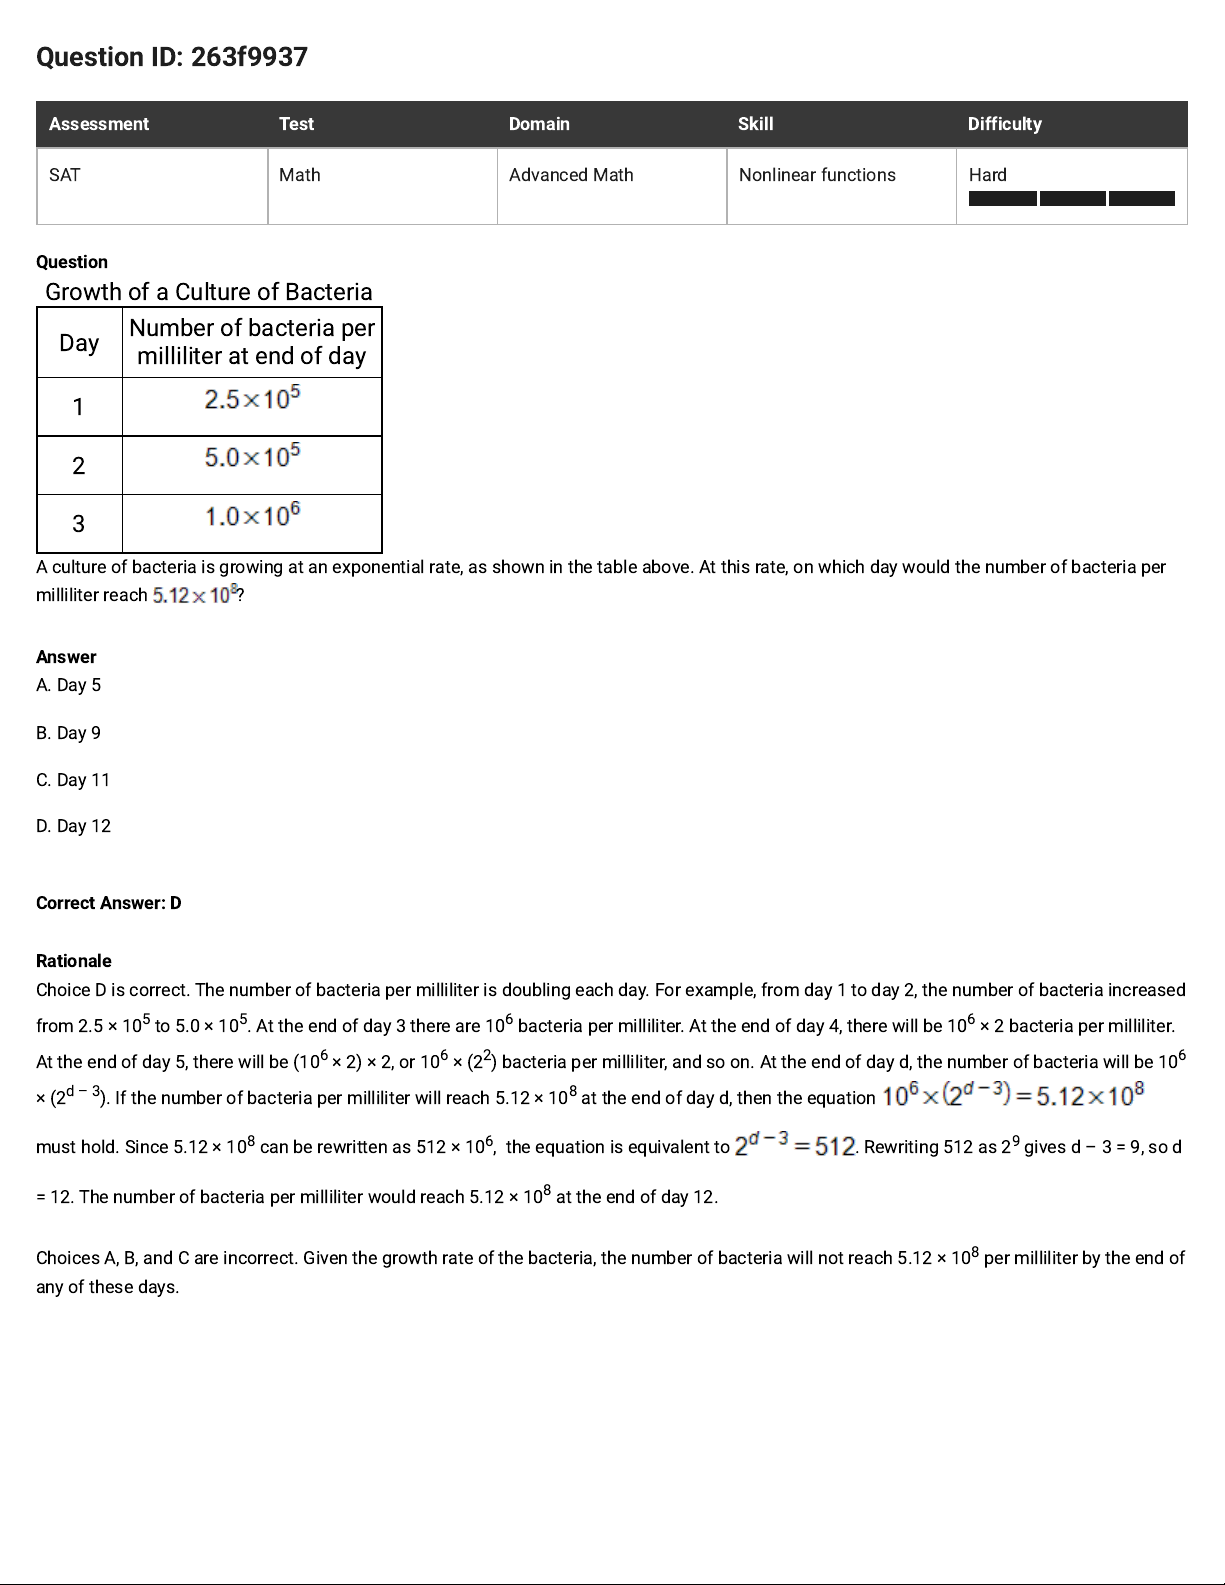
Growth of a Culture of Bacteria
Day
Number of bacteria per
milliliter at end of day
1
2
3
A culture of bacteria is growing at an exponential rate, as shown in the table above. At this rate, on which day would the number of bacteria per
milliliter reach ?
Answer
A. Day 5
B. Day 9
C. Day 11
D. Day 12
Correct Answer: D
Rationale
Choice D is correct. The number of bacteria per milliliter is doubling each day. For example, from day 1 to day 2, the number of bacteria increased
from 2.5 × 10⁵ to 5.0 × 10⁵. At the end of day 3 there are 106 bacteria per milliliter. At the end of day 4, there will be106 × 2 bacteria per milliliter.
At the end of day 5, there will be (106 × 2) × 2, or 106 × (22) bacteria per milliliter, and so on. At the end of day d, the number of bacteria will be 10
6
× (2
d – 3
). If the number of bacteria per milliliter will reach 5.12 × 10⁸ at the end of day d, then the equation
must hold. Since 5.12 × 10⁸ can be rewritten as 512 × 106, the equation is equivalent to . Rewriting 512 as 29 gives d – 3 = 9, so d
= 12. The number of bacteria per milliliter would reach 5.12 × 10⁸at the end of day 12.
Choices A, B, and C are incorrect. Given the growth rate of the bacteria, the number of bacteria will not reach 5.12× 10⁸ per milliliter by the end of
any of these days.
Page 13
Question ID: 926c246b
Assessment Test Domain Skill Difficulty
SAT Math Advanced Math Nonlinear functions Medium
Question
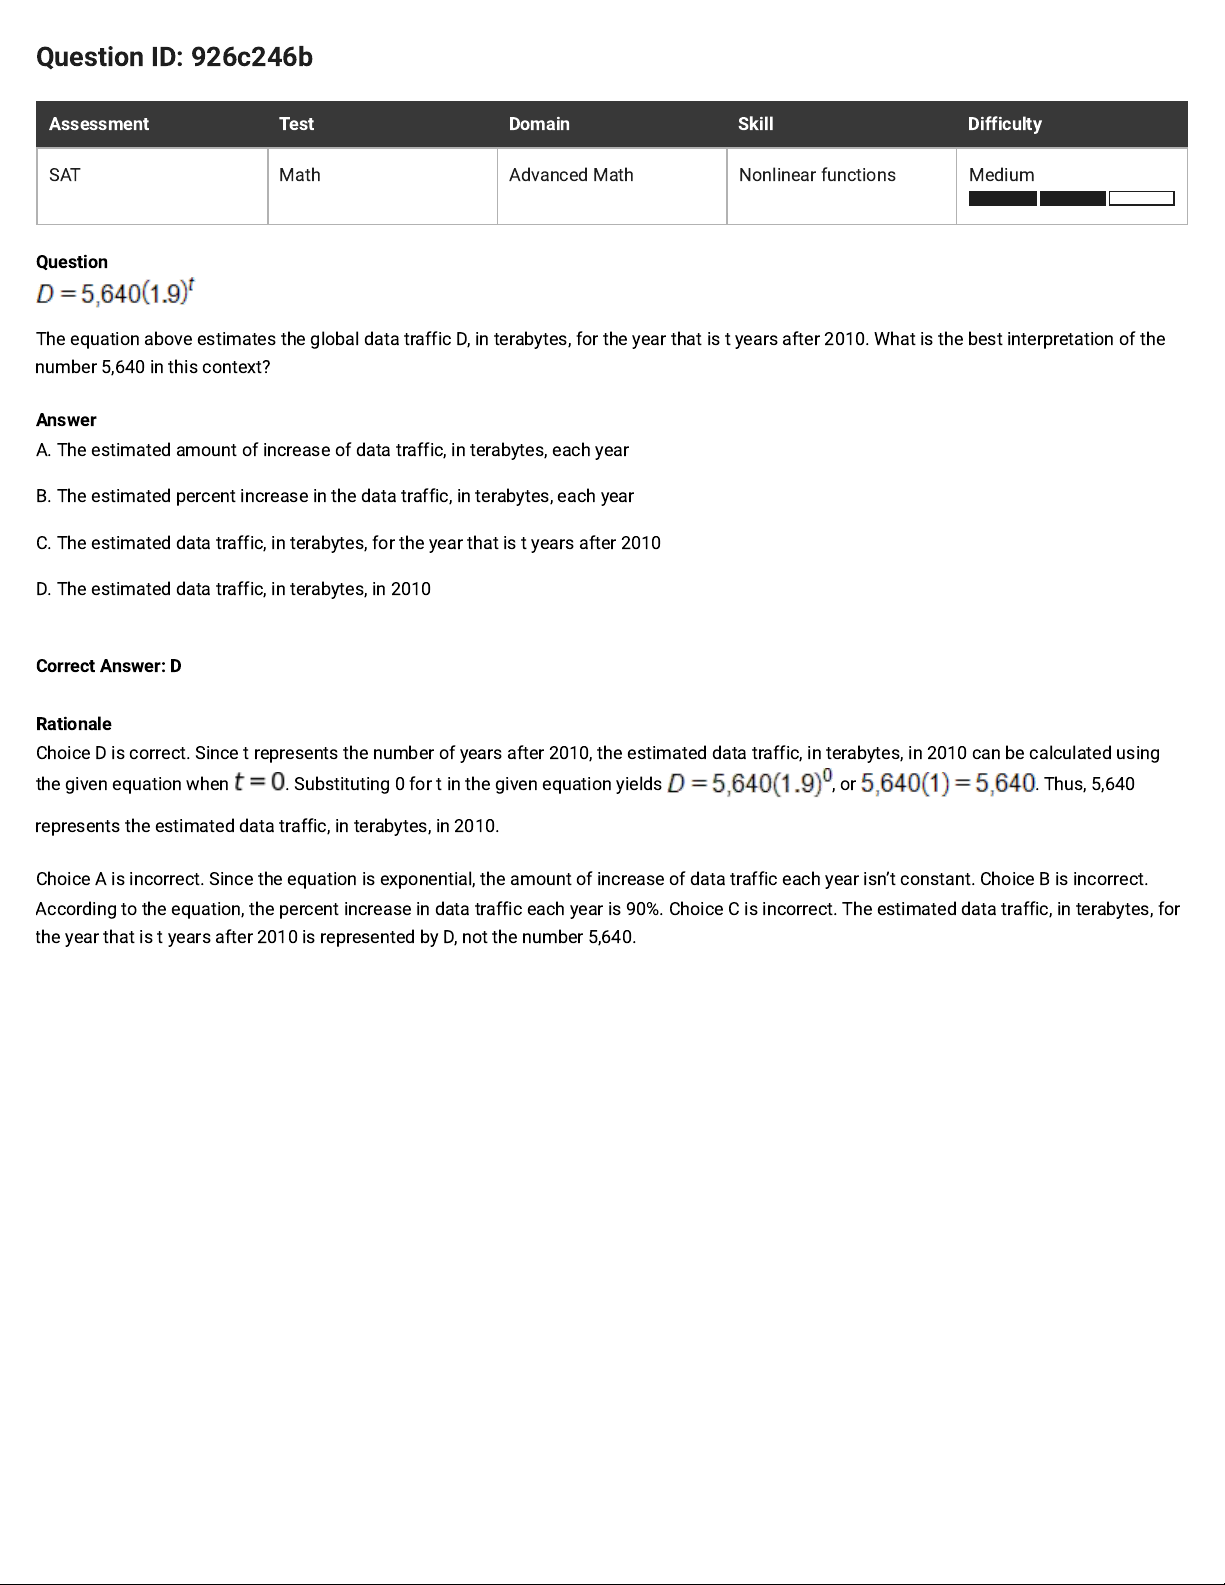
The equation above estimates the global data traffic D, in terabytes, for the year that is t years after 2010. What is the best interpretation of the
number 5,640 in this context?
Answer
A. The estimated amount of increase of data traffic, in terabytes, each year
B. The estimated percent increase in the data traffic, in terabytes, each year
C. The estimated data traffic, in terabytes, for the year that ist years after 2010
D. The estimated data traffic, in terabytes, in 2010
Correct Answer: D
Rationale
Choice D is correct. Since t represents the number of years after 2010, the estimated data traffic, in terabytes, in 2010 can be calculated using
the given equation when . Substituting 0 for t in the given equation yields , or . Thus, 5,640
represents the estimated data traffic, in terabytes, in 2010.
Choice A is incorrect. Since the equation is exponential, the amount of increase of data traffic each year isn’t constant. Choice B is incorrect.
According to the equation, the percent increase in data traffic each year is 90%. Choice C is incorrect. The estimated data traffic, in terabytes, for
the year that is t years after 2010 is represented by D, not the number 5,640.
Page 14
Question ID: 4dd4efcf
Assessment Test Domain Skill Difficulty
SAT Math Advanced Math Nonlinear functions Hard
Question
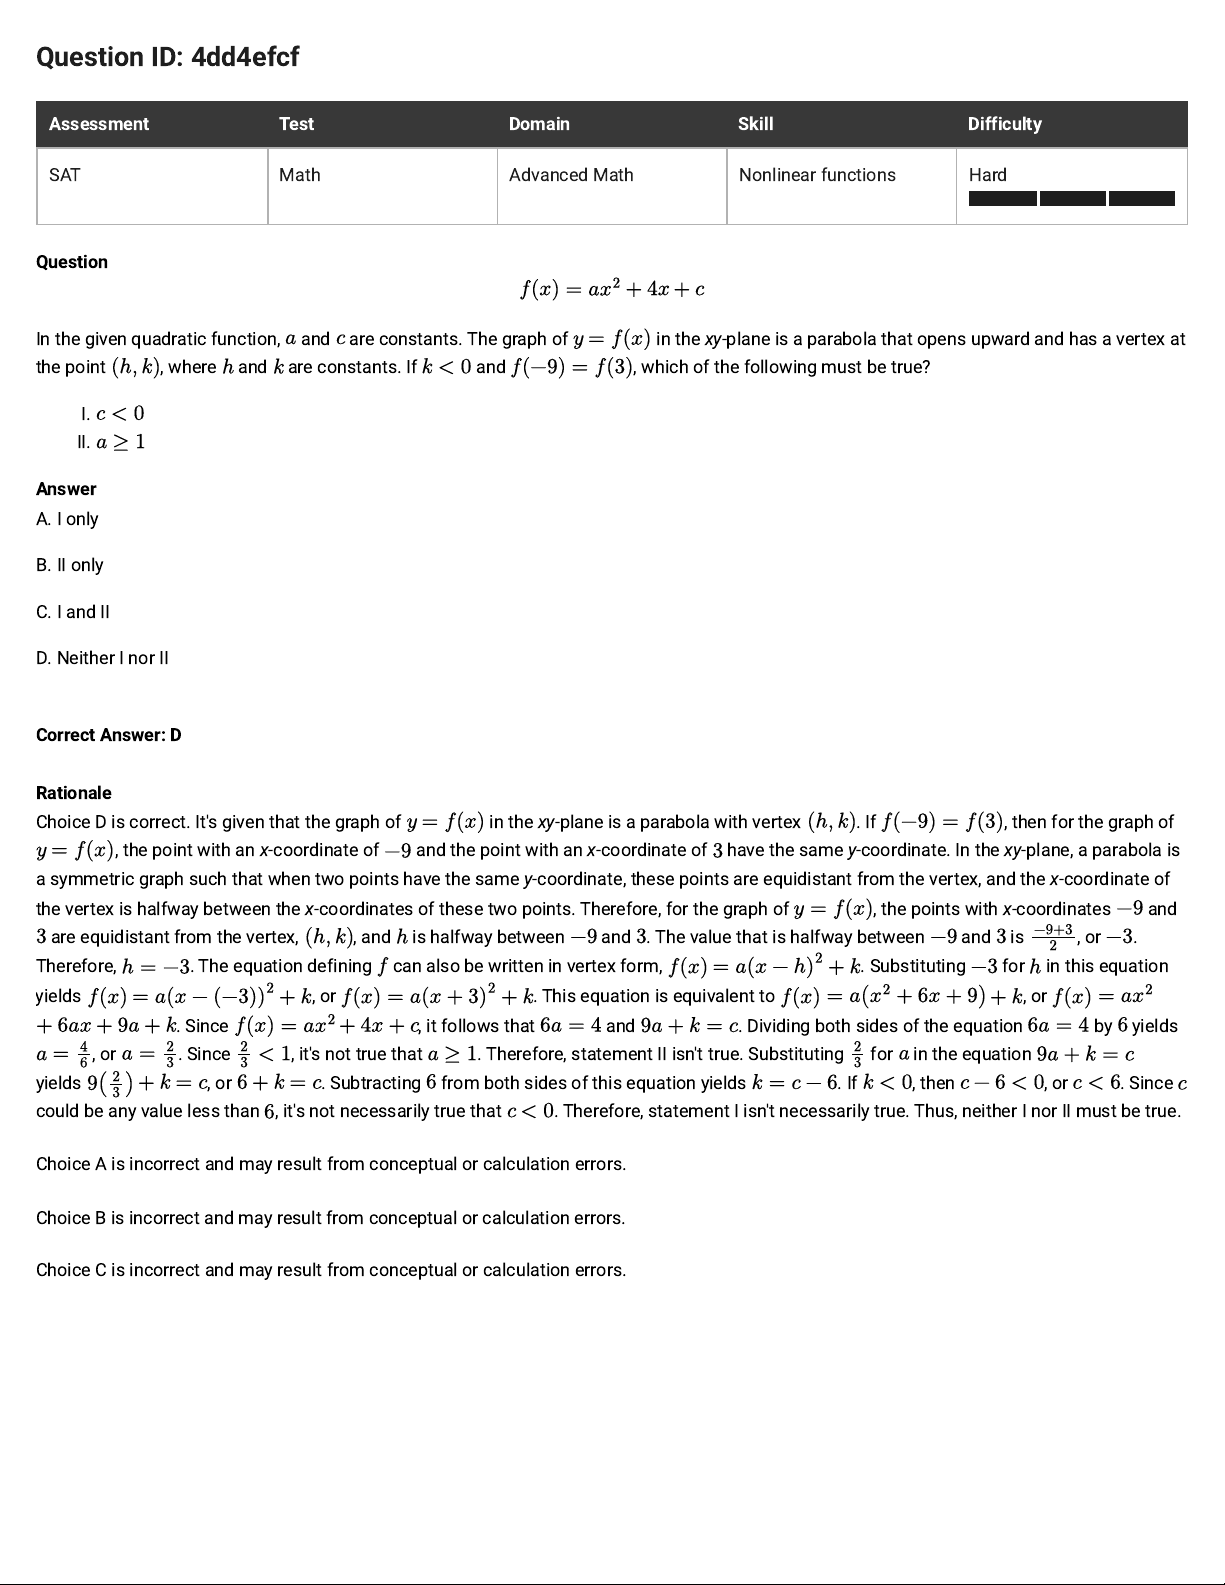
In the given quadratic function, and are constants. The graph of
in the xy-plane is a parabola that opens upward and has a vertex at
the point , where and are constants. If
and
, which of the following must be true?
I.
II.
Answer
A. I only
B. II only
C. I and II
D. Neither I nor II
Correct Answer: D
Rationale
Choice D is correct. It's given that the graph of
in the xy-plane is a parabola with vertex
. If , then for the graph of
, the point with an x-coordinate of and the point with an x-coordinate of have the same y-coordinate. In the xy-plane, a parabola is
a symmetric graph such that when two points have the same y-coordinate, these points are equidistant from the vertex, and the x-coordinate of
the vertex is halfway between the x-coordinates of these two points. Therefore, for the graph of , the points with x-coordinates and
are equidistant from the vertex, , and is halfway between and . The value that is halfway between and is , or .
Therefore,
. The equation defining can also be written in vertex form,
. Substituting for in this equation
yields
, or
. This equation is equivalent to
, or
. Since
, it follows that and . Dividing both sides of the equation by yields
, or . Since
, it's not true that
. Therefore, statement II isn't true. Substituting for in the equation
yields
, or
. Subtracting from both sides of this equation yields . If , then , or
. Since
could be any value less than , it's not necessarily true that
. Therefore, statement I isn't necessarily true. Thus, neither I nor II must be true.
Choice A is incorrect and may result from conceptual or calculation errors.
Choice B is incorrect and may result from conceptual or calculation errors.
Choice C is incorrect and may result from conceptual or calculation errors.
Page 15
Question ID: 252a3b3a
Assessment Test Domain Skill Difficulty
SAT Math Advanced Math Nonlinear functions Medium
Question
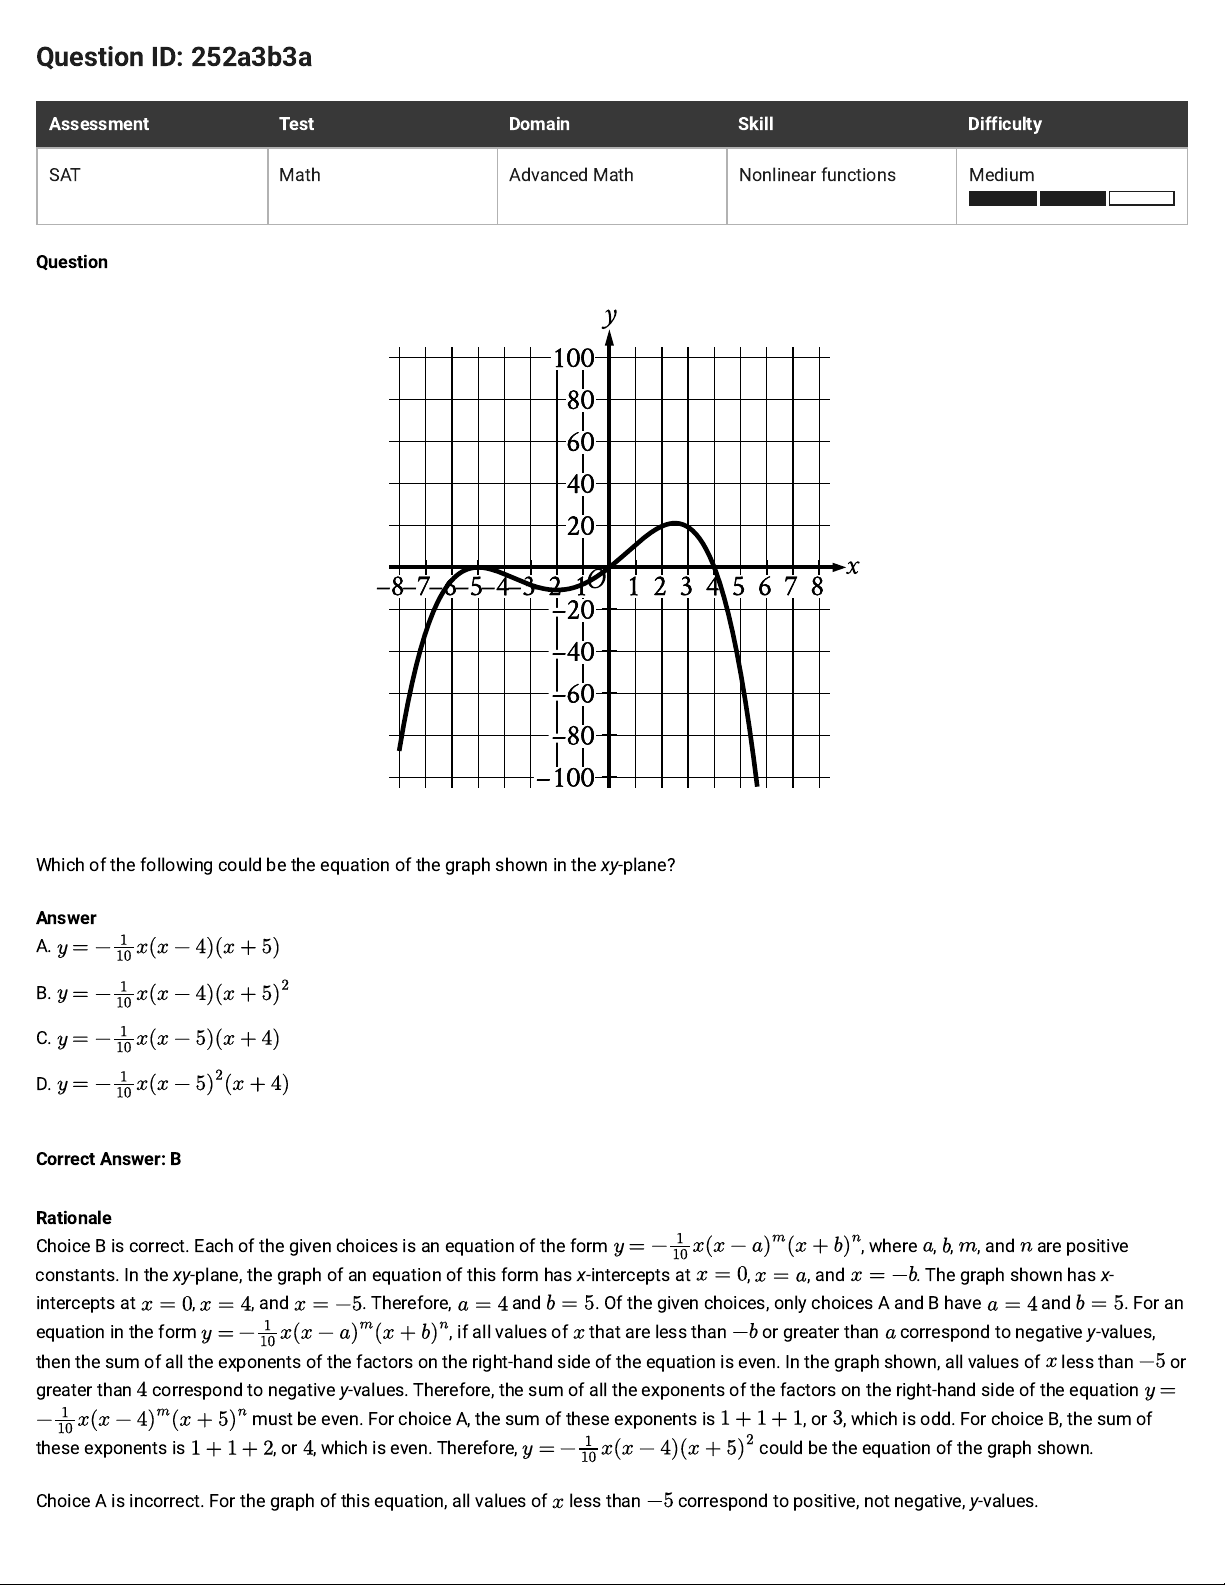
Which of the following could be the equation of the graph shown in the xy-plane?
Answer
A.
B.
C.
D.
Correct Answer: B
Rationale
Choice B is correct. Each of the given choices is an equation of the form
, where , , , and are positive
constants. In the xy-plane, the graph of an equation of this form has x-intercepts at , , and . The graph shown has x-
intercepts at , , and . Therefore, and . Of the given choices, only choices A and B have and . For an
equation in the form , if all values of that are less than or greater than correspond to negative y-values,
then the sum of all the exponents of the factors on the right-hand side of the equation is even. In the graph shown, all values of less than or
greater than correspond to negative y-values. Therefore, the sum of all the exponents of the factors on the right-hand side of the equation
must be even. For choice A, the sum of these exponents is , or , which is odd. For choice B, the sum of
these exponents is
, or , which is even. Therefore,
could be the equation of the graph shown.
Choice A is incorrect. For the graph of this equation, all values of less than correspond to positive, not negative, y-values.
Page 16
Choice C is incorrect. The graph of this equation has x-intercepts at , , and , rather than x-intercepts at , , and
.
Choice D is incorrect. The graph of this equation has x-intercepts at , , and , rather than x-intercepts at , , and
.
Page 17
Question ID: b39d74a0
Assessment Test Domain Skill Difficulty
SAT Math Advanced Math Nonlinear functions Easy
Question
x y
0 0
1 1
2 8
3 27
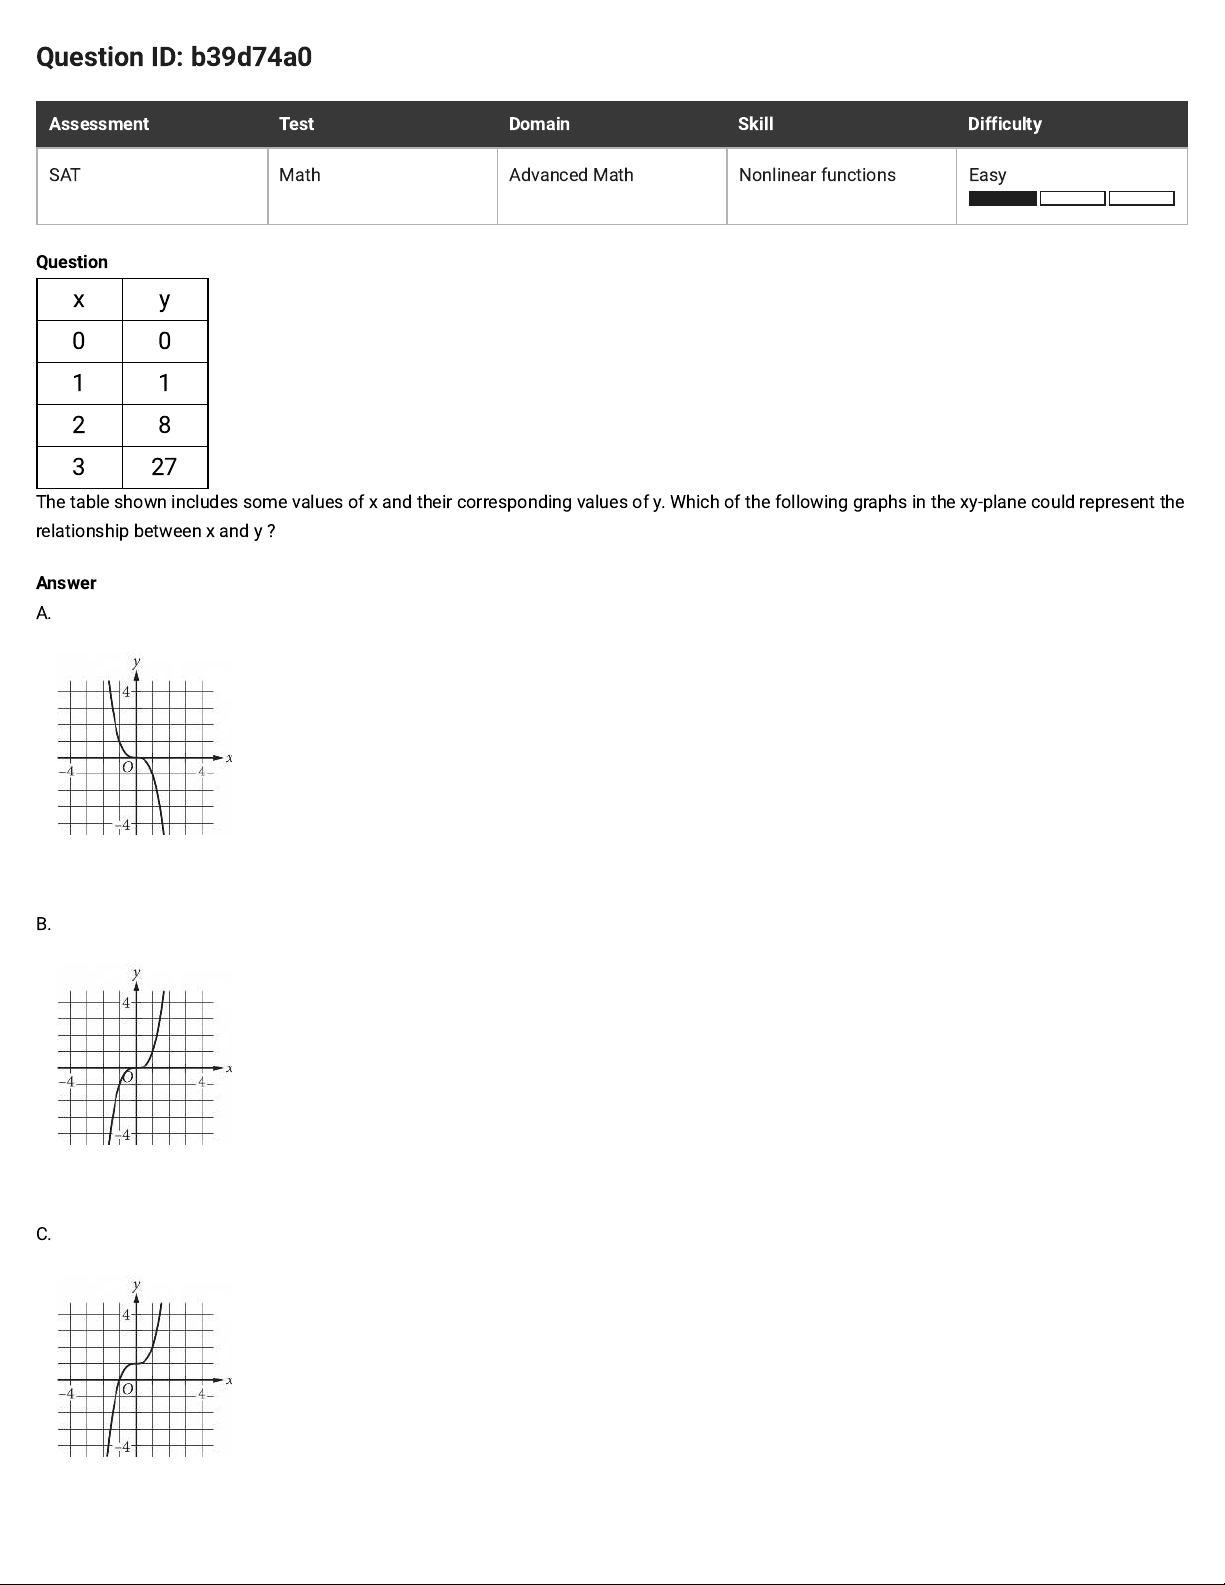
The table shown includes some values of x and their corresponding values of y. Which of the following graphs in the xy-plane could represent the
relationship between x and y ?
Answer
A.
B.
C.
Page 18
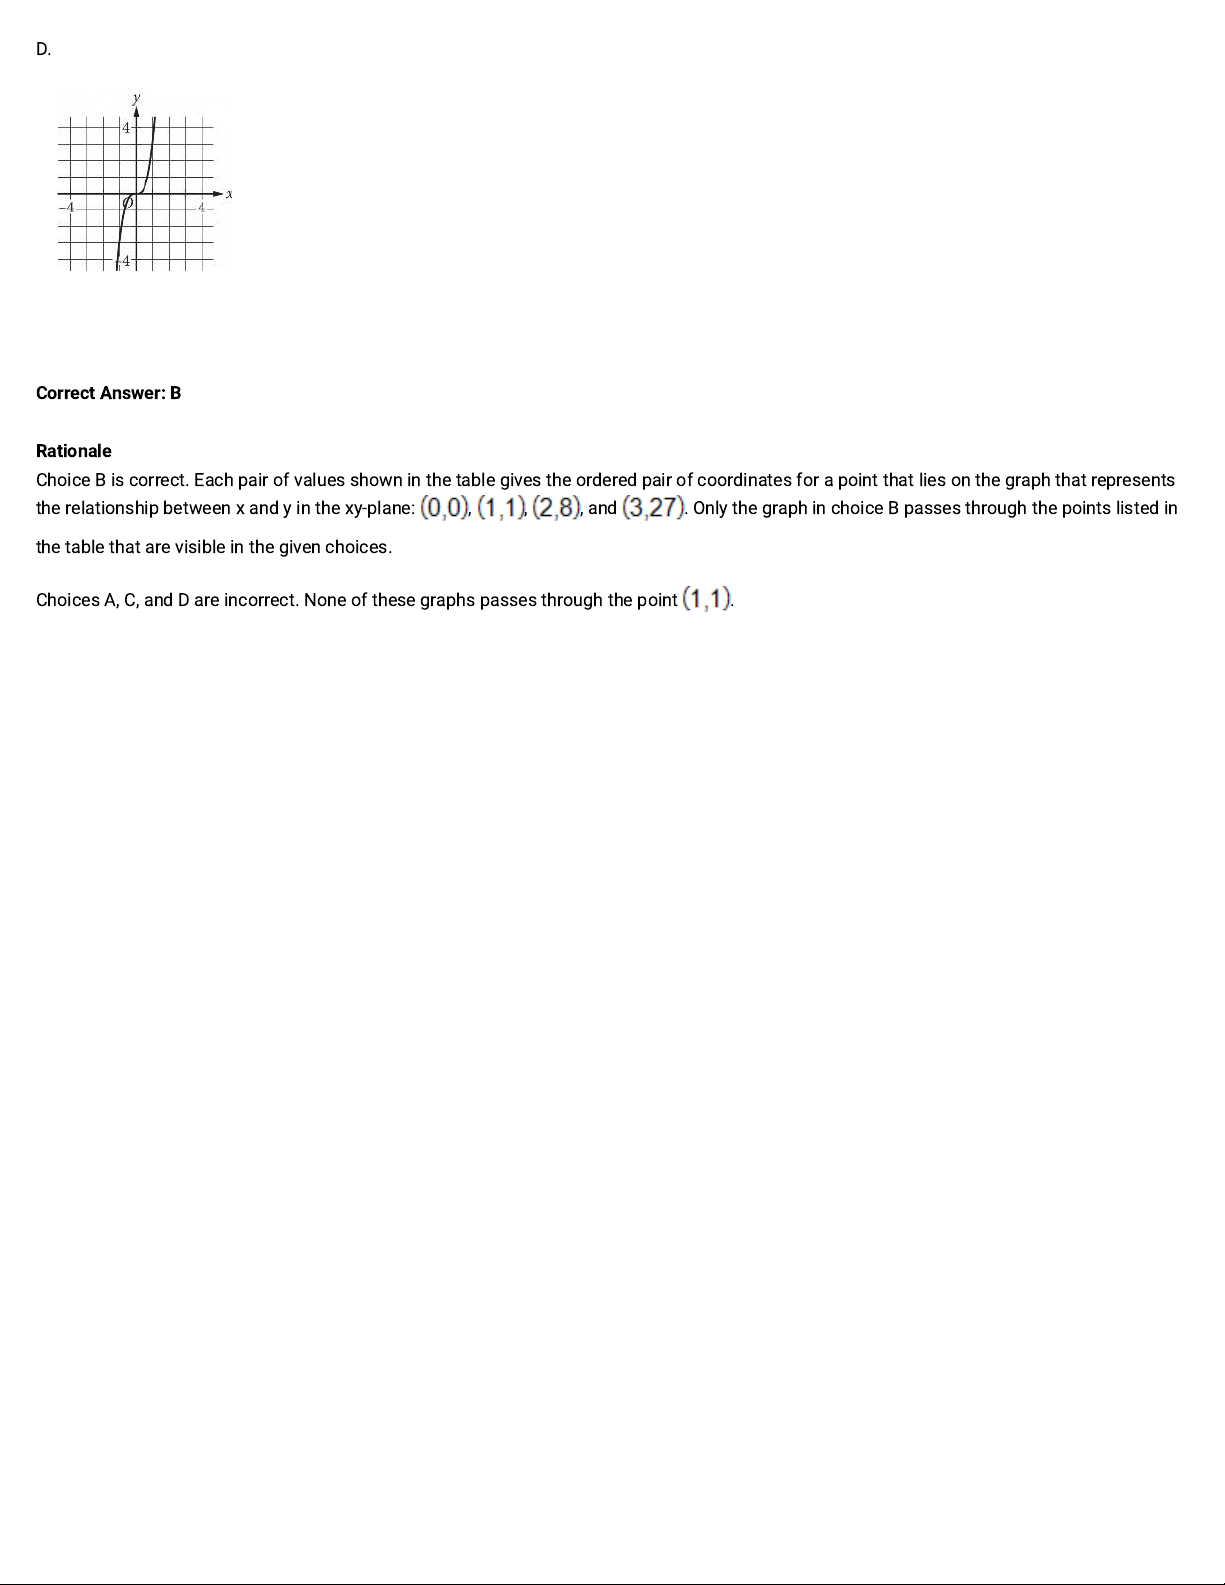
D.
Correct Answer: B
Rationale
Choice B is correct. Each pair of values shown in the table gives the ordered pair of coordinates for a point that lies on the graph that represents
the relationship between x and y in the xy-plane: , , , and . Only the graph in choice B passes through the points listed in
the table that are visible in the given choices.
Choices A, C, and D are incorrect. None of these graphs passes through the point .
Page 19
Question ID: d4950429
Assessment Test Domain Skill Difficulty
SAT Math Advanced Math Nonlinear functions Medium
Question
A rectangle has a length of units and a width of units. If the rectangle has an area of square units, what is the value of ?
Answer
A.
B.
C.
D.
Correct Answer: B
Rationale
Choice B is correct. The area of a rectangle is equal to its length multiplied by its width. Multiplying the given length, units, by the given width,
units, yields
square units. If the rectangle has an area of square units, it follows that
, or
. Subtracting from both sides of this equation yields
. Factoring the left-hand side of this equation yields
. Applying the zero product property to this equation yields two solutions: and . Since is the rectangle’s
length, in units, which must be positive, the value of is .
Choice A is incorrect. This is the width, in units, of the rectangle, not the value of .
Choice C is incorrect and may result from conceptual or calculation errors.
Choice D is incorrect. This is the area, in square units, of the rectangle, not the value of .
Page 20
Question ID: dd3b1e1a
Assessment Test Domain Skill Difficulty
SAT Math Advanced Math Nonlinear functions Medium
Question
For the given function , the graph of
in the xy-plane passes through the point , where is a constant. What is the value of ?
Correct Answer: 17
Rationale
The correct answer is . It's given that the graph of in the xy-plane passes through the point , where is a constant. It follows
that equals . Substituting for in the given function yields , or . Therefore, the value of is .
Page 21
Question ID: 35e05e19
Assessment Test Domain Skill Difficulty
SAT Math Advanced Math Nonlinear functions Hard
Question
A park ranger hung squirrel houses each in the shape of a right rectangular prism for fox squirrels. Each house has a height of inches. The
length of each house's base is inches, which is inch more than the width of the house's base. Which function gives the volume of each
house, in cubic inches, in terms of the length of the house's base?
Answer
A.
B.
C.
D.
Correct Answer: A
Rationale
Choice A is correct. The volume of a prism is equal to the area of its base times its height.It's given that the length of each house's base is
inches and that this length is inch more than the width, in inches, of the house's base. It follows that the width, in inches, of the house's base is
. The area of a rectangle is the product of its length and its width. Therefore, the area of the base of the house is square inches.
It's given that the height of each house is inches. Therefore, the function that gives the volume of each house, in cubic inches, in terms of
the length of the house's base is , or .
Choice B is incorrectand may result from conceptual or calculation errors.
Choice C is incorrectand may result from conceptual or calculation errors.
Choice D is incorrect and may result from conceptual or calculation errors.
Page 22
Question ID: 341ba5db
Assessment Test Domain Skill Difficulty
SAT Math Advanced Math Nonlinear functions Medium
Question
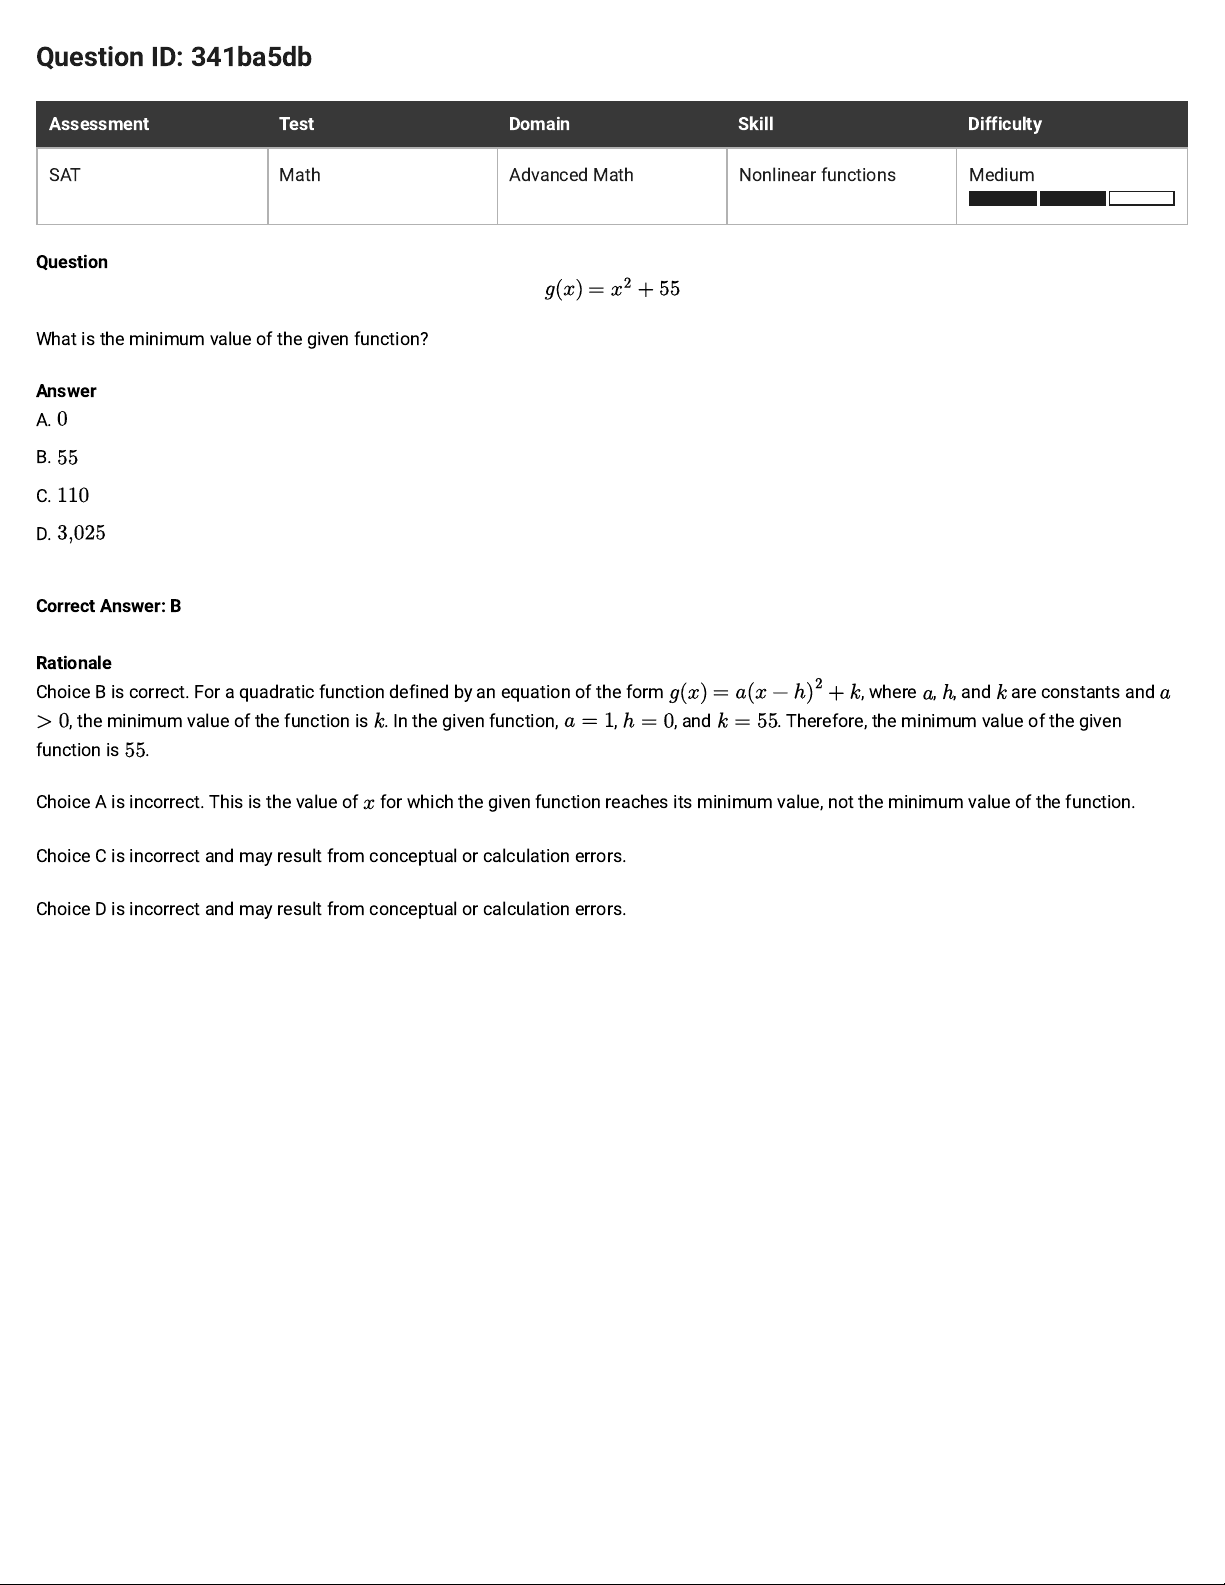
What is the minimum value of the given function?
Answer
A.
B.
C.
D.
Correct Answer: B
Rationale
Choice B is correct. For a quadratic function defined by an equation of the form , where , , and are constants and
, the minimum value of the function is . In the given function, , , and . Therefore, the minimum value of the given
function is .
Choice A is incorrect. This is the value of for which the given function reaches its minimum value, not the minimum value of the function.
Choice C is incorrect and may result from conceptual or calculation errors.
Choice D is incorrect and may result from conceptual or calculation errors.
Page 23
Question ID: 18e35375
Assessment Test Domain Skill Difficulty
SAT Math Advanced Math Nonlinear functions Hard
Question
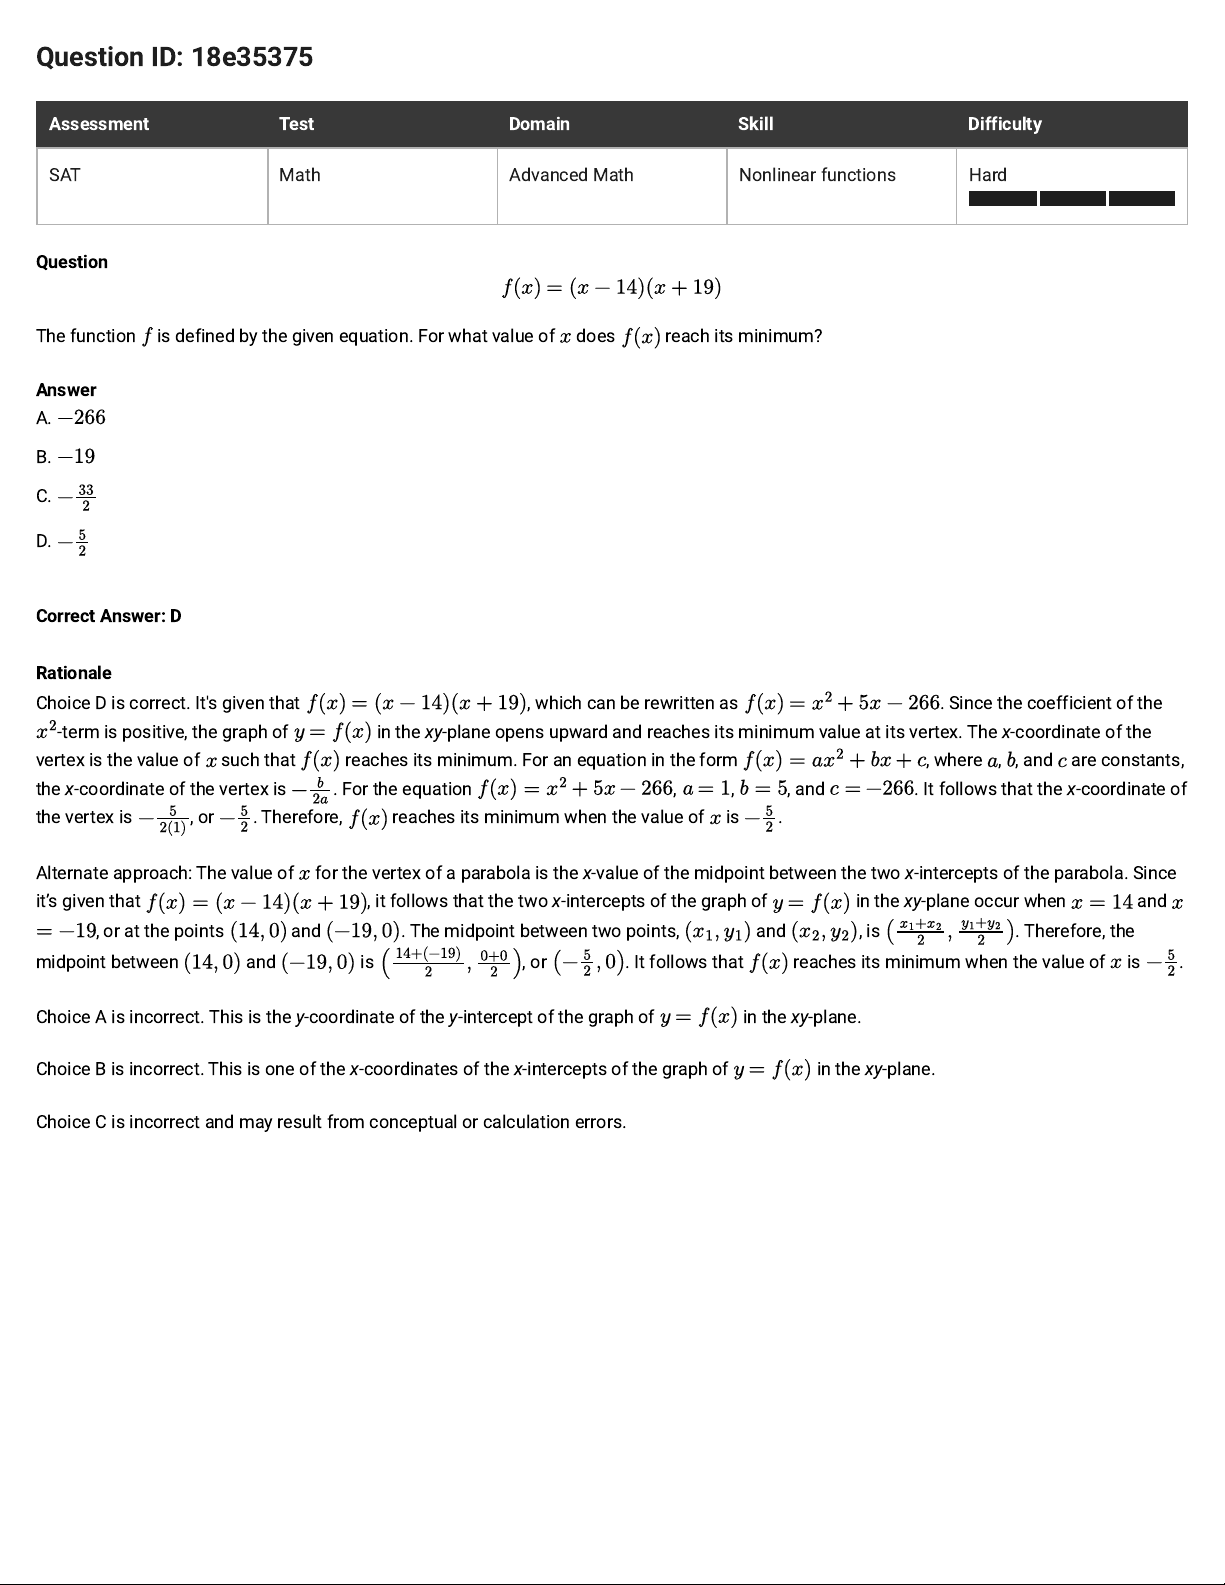
The function is defined by the given equation. For what value of does reach its minimum?
Answer
A.
B.
C.
D.
Correct Answer: D
Rationale
Choice D is correct. It's given that , which can be rewritten as . Since the coefficient of the
-term is positive, the graph of
in the
xy
-plane opens upward and reaches its minimum value at its vertex. The x-coordinate of the
vertex is the value of such that
reaches its minimum. For an equation in the form , where , , and are constants,
the x-coordinate of the vertex is . For the equation , , , and . It follows that the x-coordinate of
the vertex is , or . Therefore, reaches its minimum when the value of is .
Alternate approach: The value of for the vertex of a parabola is the x-value of the midpoint between the two x-intercepts of the parabola. Since
it’s given that , it follows that the two x-intercepts of the graph of in the xy-plane occur when and
, or at the points and . The midpoint between two points, and , is . Therefore, the
midpoint between
and
is , or . It follows that
reaches its minimum when the value of is .
Choice A is incorrect. This is the y-coordinate of the y-intercept of the graph of in the xy-plane.
Choice B is incorrect. This is one of the x-coordinates of the x-intercepts of the graph of in the xy-plane.
Choice C is incorrect and may result from conceptual or calculation errors.
Page 24
Question ID: b5c43226
Assessment Test Domain Skill Difficulty
SAT Math Advanced Math Nonlinear functions Easy
Question
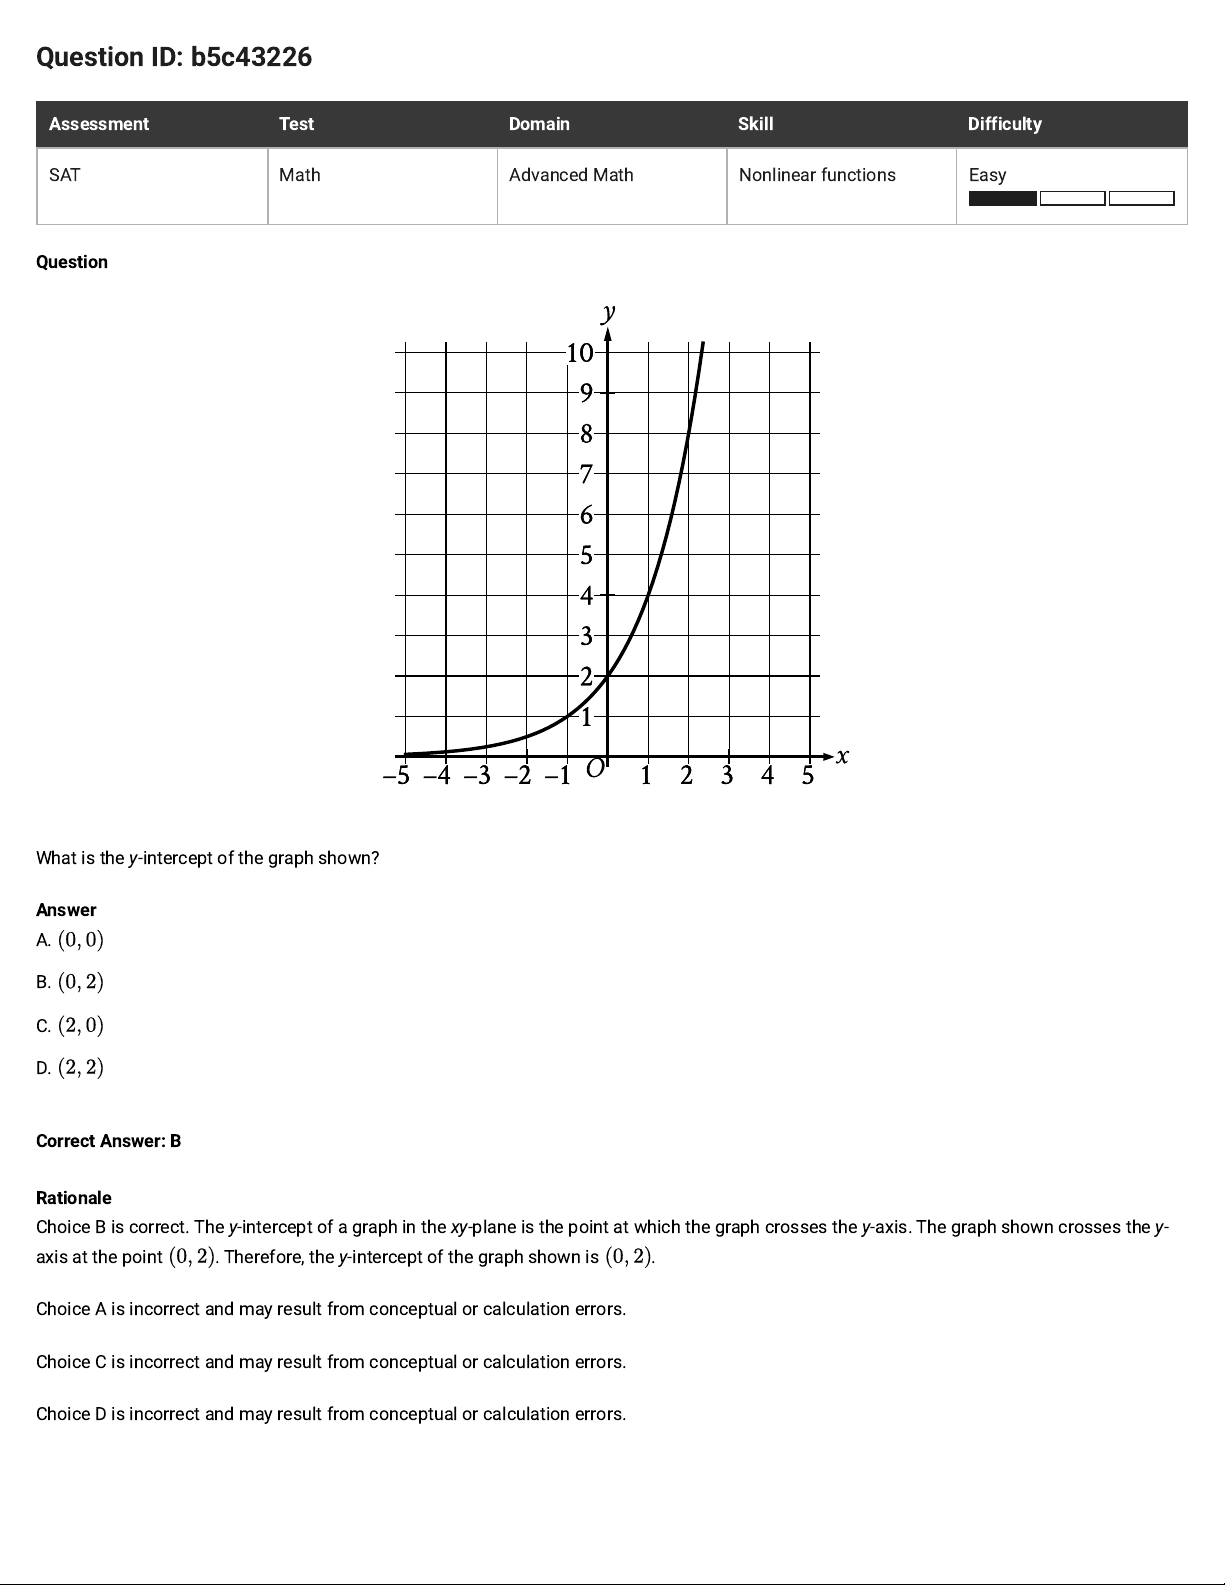
What is the y-intercept of the graph shown?
Answer
A.
B.
C.
D.
Correct Answer: B
Rationale
Choice B is correct. The y-intercept of a graph in the xy-plane is the point at which the graph crosses the y-axis. The graph shown crosses the y-
axis at the point . Therefore, the y-intercept of the graph shown is .
Choice A is incorrect and may result from conceptual or calculation errors.
Choice C is incorrect and may result from conceptual or calculation errors.
Choice D is incorrect and may result from conceptual or calculation errors.
Page 25
Question ID: 50e40f08
Assessment Test Domain Skill Difficulty
SAT Math Advanced Math Nonlinear functions Medium
Question
If the given function is graphed in the xy-plane, where , what is the x-coordinate of an x-intercept of the graph?
Correct Answer: -6, 4
Rationale
The correct answer is either or . The x-intercepts of a graph in the xy-plane are the points where . Thus, for an x-intercept of the graph
of , . Substituting for
in the equation
yields . By the zero product
property, and . Subtracting from both sides of the equation yields . Adding to both sides of the
equation yields . Therefore, the x-coordinates of the x-intercepts of the graph of
are and . Note that -6 and 4 are
examples of ways to enter a correct answer.
Page 26
Question ID: cfff8f8e
Assessment Test Domain Skill Difficulty
SAT Math Advanced Math Nonlinear functions Easy
Question
At the time of posting a video, a social media channel had subscribers. Each day for five days after the video was posted, the number of
subscribers doubled from the number the previous day. Which equation gives the total number of subscribers, , to the channel days after the
video was posted?
Answer
A.
B.
C.
D.
Correct Answer: B
Rationale
Choice B is correct. It's given that each day for five days after a social media channel posted a video, the number of subscribers doubled from the
number the previous day. Since the number of subscribers doubled each day, the relationship between and can be represented by an
exponential equation of the form , where is the number of subscribers at the time of posting the video and the number of subscribers
to the channel increases by a factor of each day. It's given that at the time of posting the video, the channel had subscribers. Therefore,
. It's also given that the number of subscribers doubled, or increased by a factor of , from the number the previous day. Therefore, .
Substituting
for and for in the equation yields .
Choice A is incorrect. This equation gives the total number of subscribers to a channel for which the initial number of subscribers was and the
number increased each day by times the number from the previous day.
Choice C is incorrect. This equation gives the total number of subscribers to a channel for which the number of subscribers each day was half
the number from the previous day, rather than double the number.
Choice D is incorrect and may result from conceptual errors.
Page 27
Question ID: 8462b105
Assessment Test Domain Skill Difficulty
SAT Math Advanced Math Nonlinear functions Hard
Question
The function gives the product of a number, , and a number that is more than . Which equation defines ?
Answer
A.
B.
C.
D.
Correct Answer: C
Rationale
Choice C is correct. It’s given that the function gives the product of a number, , and a number that is more than . A number that is
more than can be represented by the expression . Therefore, can be defined by the equation , or
.
Choice A is incorrect and may result from conceptual or calculation errors.
Choice B is incorrect and may result from conceptual or calculation errors.
Choice D is incorrect and may result from conceptual or calculation errors.
Page 28
Question ID: ce579859
Assessment Test Domain Skill Difficulty
SAT Math Advanced Math Nonlinear functions Hard
Question
A model estimates that at the end of each year from
to , the number of squirrels in a population was more than the number of
squirrels in the population at the end of the previous year. The model estimates that at the end of , there were squirrels in the
population. Which of the following equations represents this model, where is the estimated number of squirrels in the population years after
the end of and ?
Answer
A.
B.
C.
D.
Correct Answer: B
Rationale
Choice B is correct. Since the model estimates that the number of squirrels in the population increased by a fixed percentage, , each year,
the model can be represented by an exponential equation of the form
, where is the estimated number of squirrels in the
population at the end of
, and the model estimates that at the end of each year, the number is more than the number at the end of the
previous year. Since the model estimates that at the end of each year, the number was more than the number at the end of the previous
year,
. Substituting for in the equation yields , which is equivalent to , or
. It’s given that the estimated number of squirrels at the end of was . This means that when , . Substituting
for and for in the equation
yields
, or . Dividing each side of this equation by yields .
Substituting
for in the equation
yields
.
Choice A is incorrect. This equation represents a model where at the end of each year, the estimated number of squirrels was of, not
more than, the estimated number at the end of the previous year.
Choice C is incorrect. This equation represents a model where at the end of each year, the estimated number of squirrels was
of, not
more than, the estimated number at the end of the previous year, and the estimated number of squirrels at the end of , not the end of
, was .
Choice D is incorrect. This equation represents a model where the estimated number of squirrels at the end of , not the end of
, was
.
Page 29
Question ID: d139cf4b
Assessment Test Domain Skill Difficulty
SAT Math Advanced Math Nonlinear functions Hard
Question
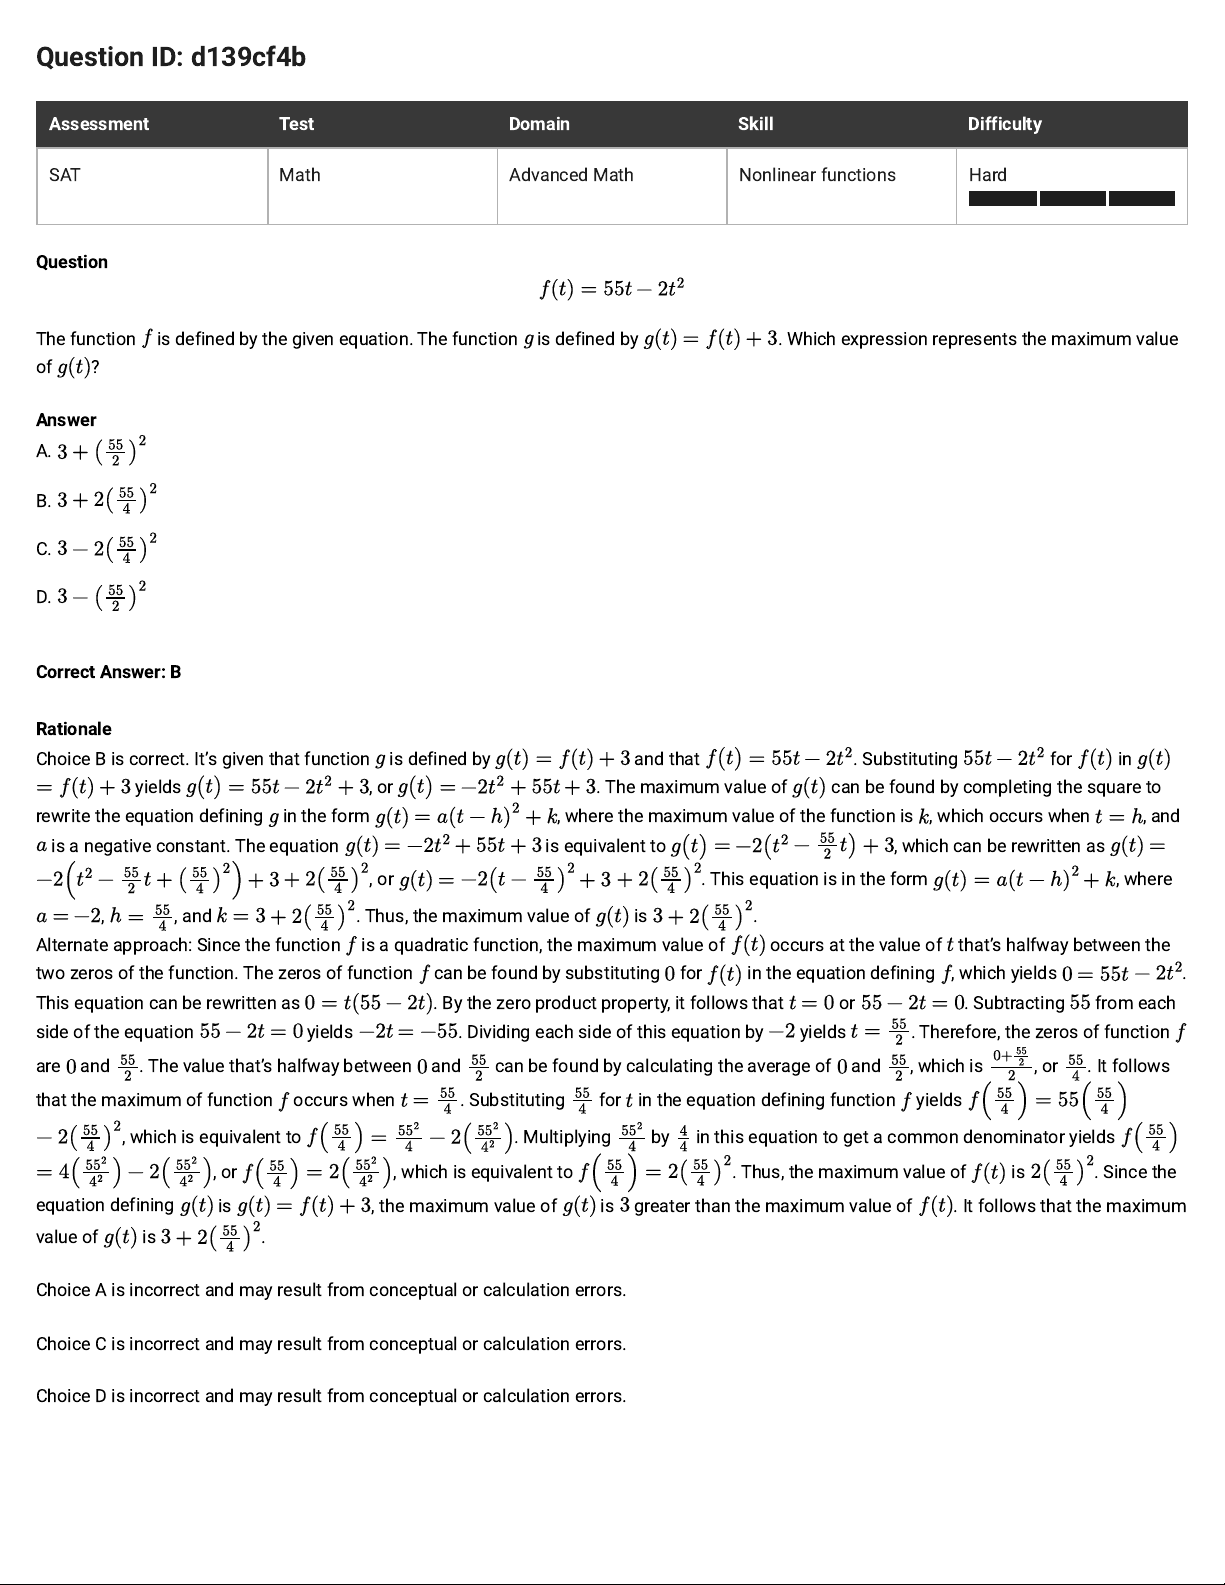
The function is defined by the given equation. The function is defined by . Which expression represents the maximum value
of ?
Answer
A.
B.
C.
D.
Correct Answer: B
Rationale
Choice B is correct. It’s given that function is defined by and that . Substituting for in
yields , or . The maximum value of can be found by completing the square to
rewrite the equation defining
in the form , where the maximum value of the function is , which occurs when , and
is a negative constant. The equation is equivalent to , which can be rewritten as
, or . This equation is in the form , where
, , and . Thus, the maximum value of is .
Alternate approach: Since the function is a quadratic function, the maximum value of occurs at the value of that’s halfway between the
two zeros of the function. The zeros of function can be found by substituting for in the equation defining , which yields .
This equation can be rewritten as . By the zero product property, it follows that or . Subtracting from each
side of the equation yields . Dividing each side of this equation by yields . Therefore, the zeros of function
are and . The value that’s halfway between and can be found by calculating the average of and , which is , or . It follows
that the maximum of function
occurs when . Substituting for in the equation defining function yields
, which is equivalent to . Multiplying by in this equation to get a common denominator yields
, or , which is equivalent to . Thus, the maximum value of is . Since the
equation defining
is , the maximum value of is greater than the maximum value of . It follows that the maximum
value of
is .
Choice A is incorrect and may result from conceptual or calculation errors.
Choice C is incorrect and may result from conceptual or calculation errors.
Choice D is incorrect and may result from conceptual or calculation errors.
Page 30
Question ID: a31417d1
Assessment Test Domain Skill Difficulty
SAT Math Advanced Math Nonlinear functions Medium
Question
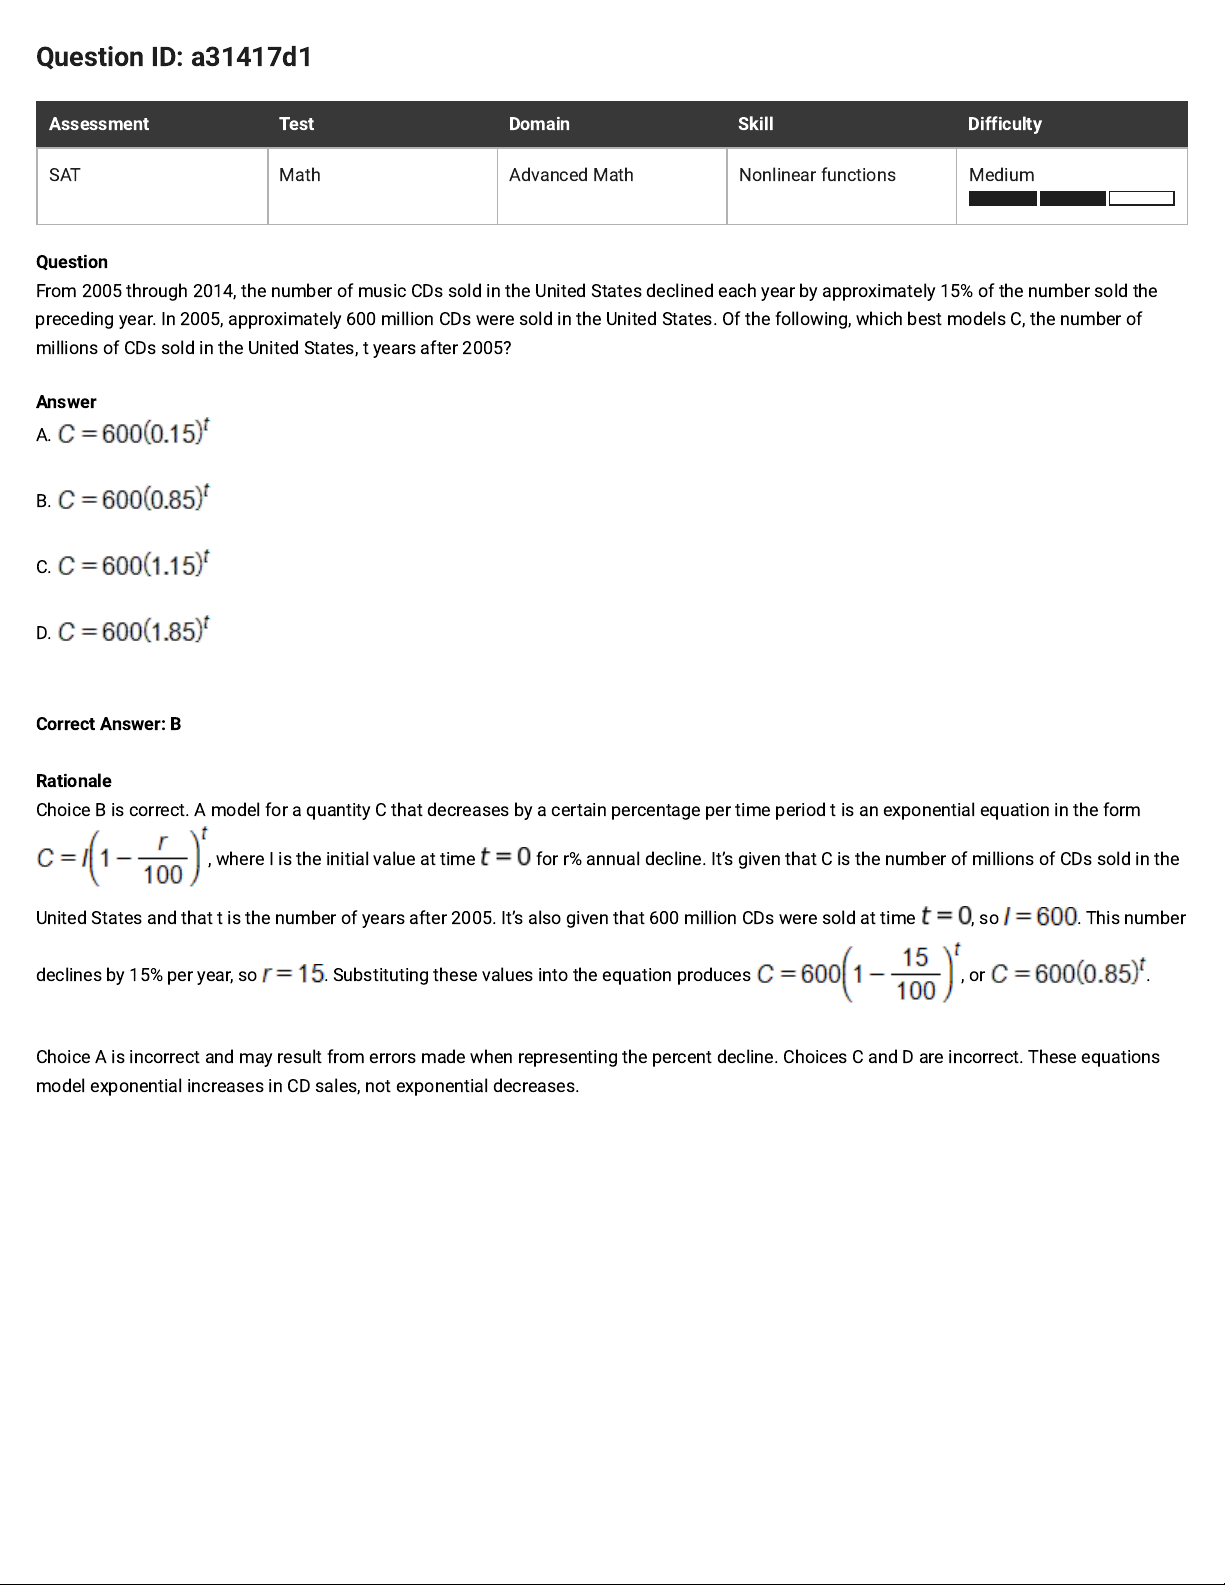
From 2005 through 2014, the number of music CDs sold in the United States declined each year by approximately 15% of the number sold the
preceding year. In 2005, approximately 600 million CDs were sold in the United States. Of the following, which best models C, the number of
millions of CDs sold in the United States, t years after 2005?
Answer
A.
B.
C.
D.
Correct Answer: B
Rationale
Choice B is correct. A model for a quantity C that decreases by a certain percentage per time period t is an exponential equation in the form
, where I is the initial value at time for r% annual decline. It’s given that C is the number of millions of CDs sold in the
United States and that t is the number of years after 2005. It’s also given that 600 million CDs were sold at time , so . This number
declines by 15% per year, so . Substituting these values into the equation produces , or .
Choice A is incorrect and may result from errors made when representing the percent decline. Choices C and D are incorrect. These equations
model exponential increases in CD sales, not exponential decreases.
Page 31
Question ID: 9afe2370
Assessment Test Domain Skill Difficulty
SAT Math Advanced Math Nonlinear functions Hard
Question
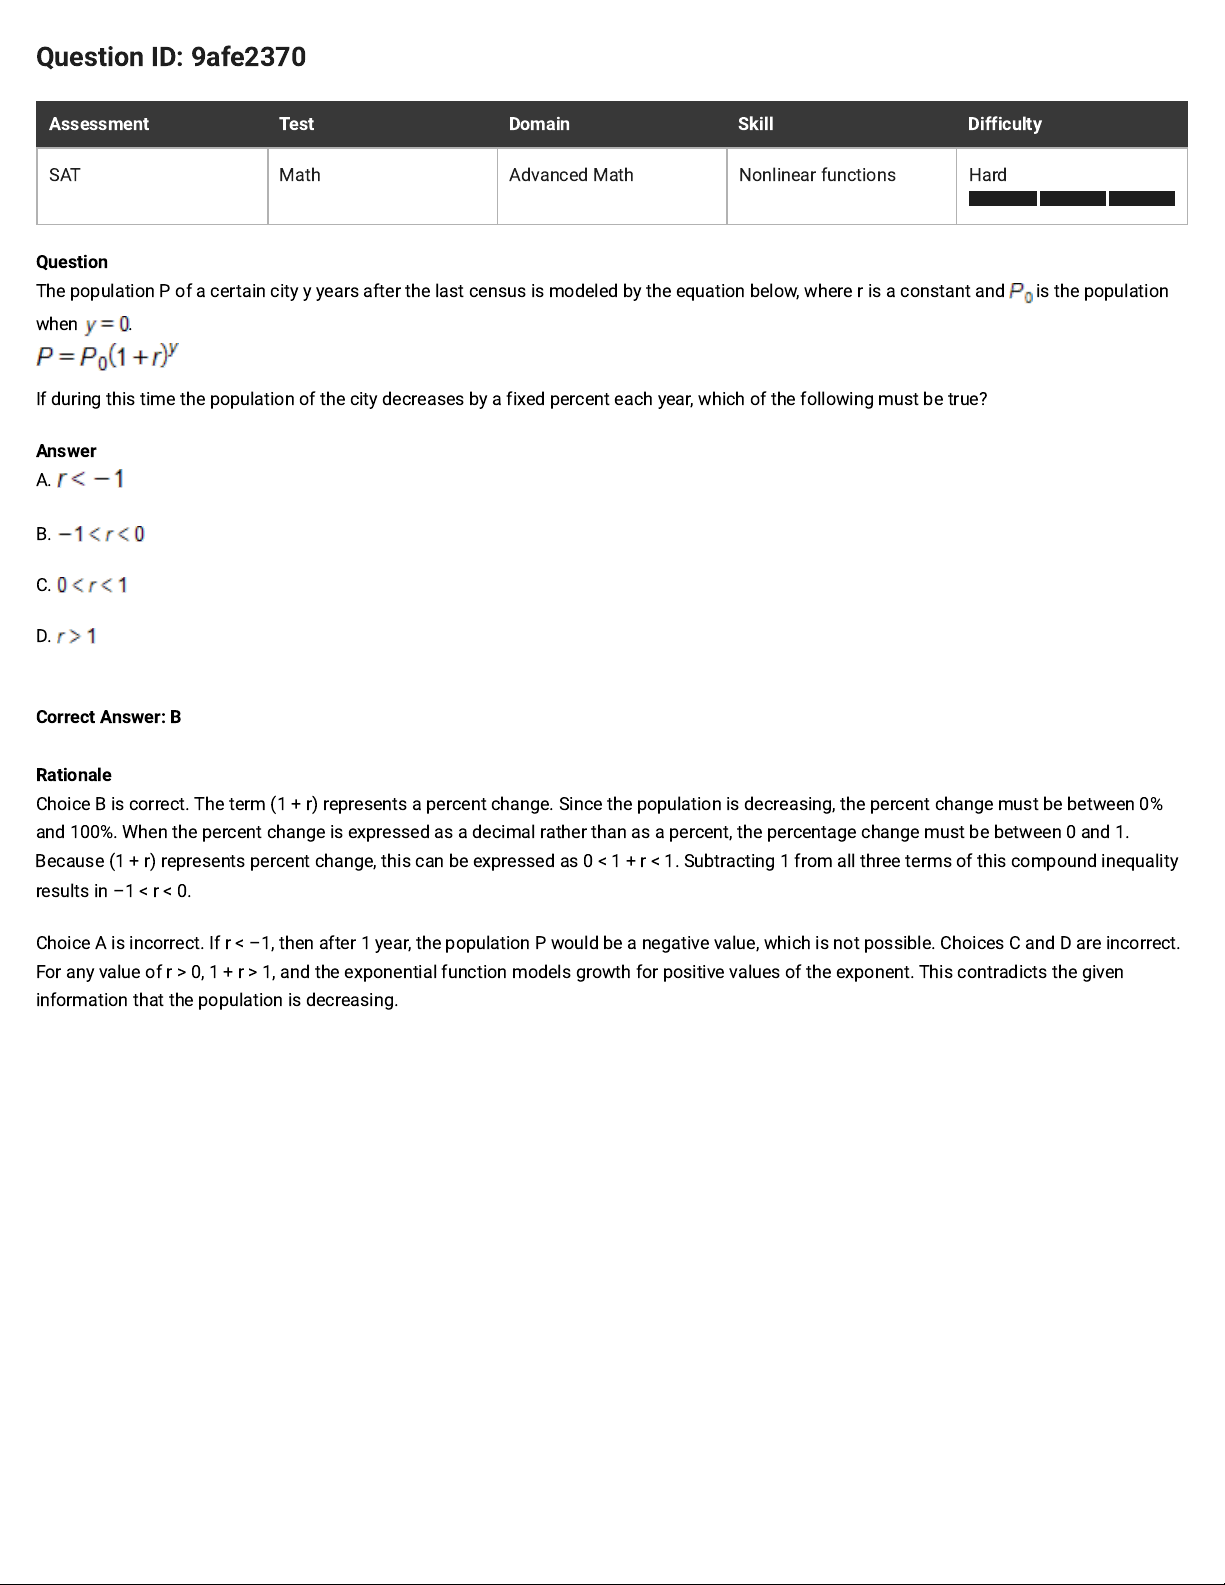
The population P of a certain city y years after the last census is modeled by the equation below, where r is a constant and is the population
when .
If during this time the population of the city decreases by a fixed percent each year, which of the following must be true?
Answer
A.
B.
C.
D.
Correct Answer: B
Rationale
Choice B is correct. The term (1 + r) represents a percent change. Since the population is decreasing, the percent change must be between 0%
and 100%. When the percent change is expressed as a decimal rather than as a percent, the percentage change must be between 0 and 1.
Because (1 + r) represents percent change, this can be expressed as 0 < 1 + r < 1. Subtracting 1 from all three terms of this compound inequality
results in –1 < r < 0.
Choice A is incorrect. If r < –1, then after 1 year, the population P would be a negative value, which is not possible. Choices C and D are incorrect.
For any value of r > 0, 1 + r > 1, and the exponential function models growth for positive values of the exponent. This contradicts the given
information that the population is decreasing.
Page 32
Question ID: df71424b
Assessment Test Domain Skill Difficulty
SAT Math Advanced Math Nonlinear functions Hard
Question
10 8 6 4 2 2 4 6 8 10
x
10
8
6
4
2
2
4
y
O
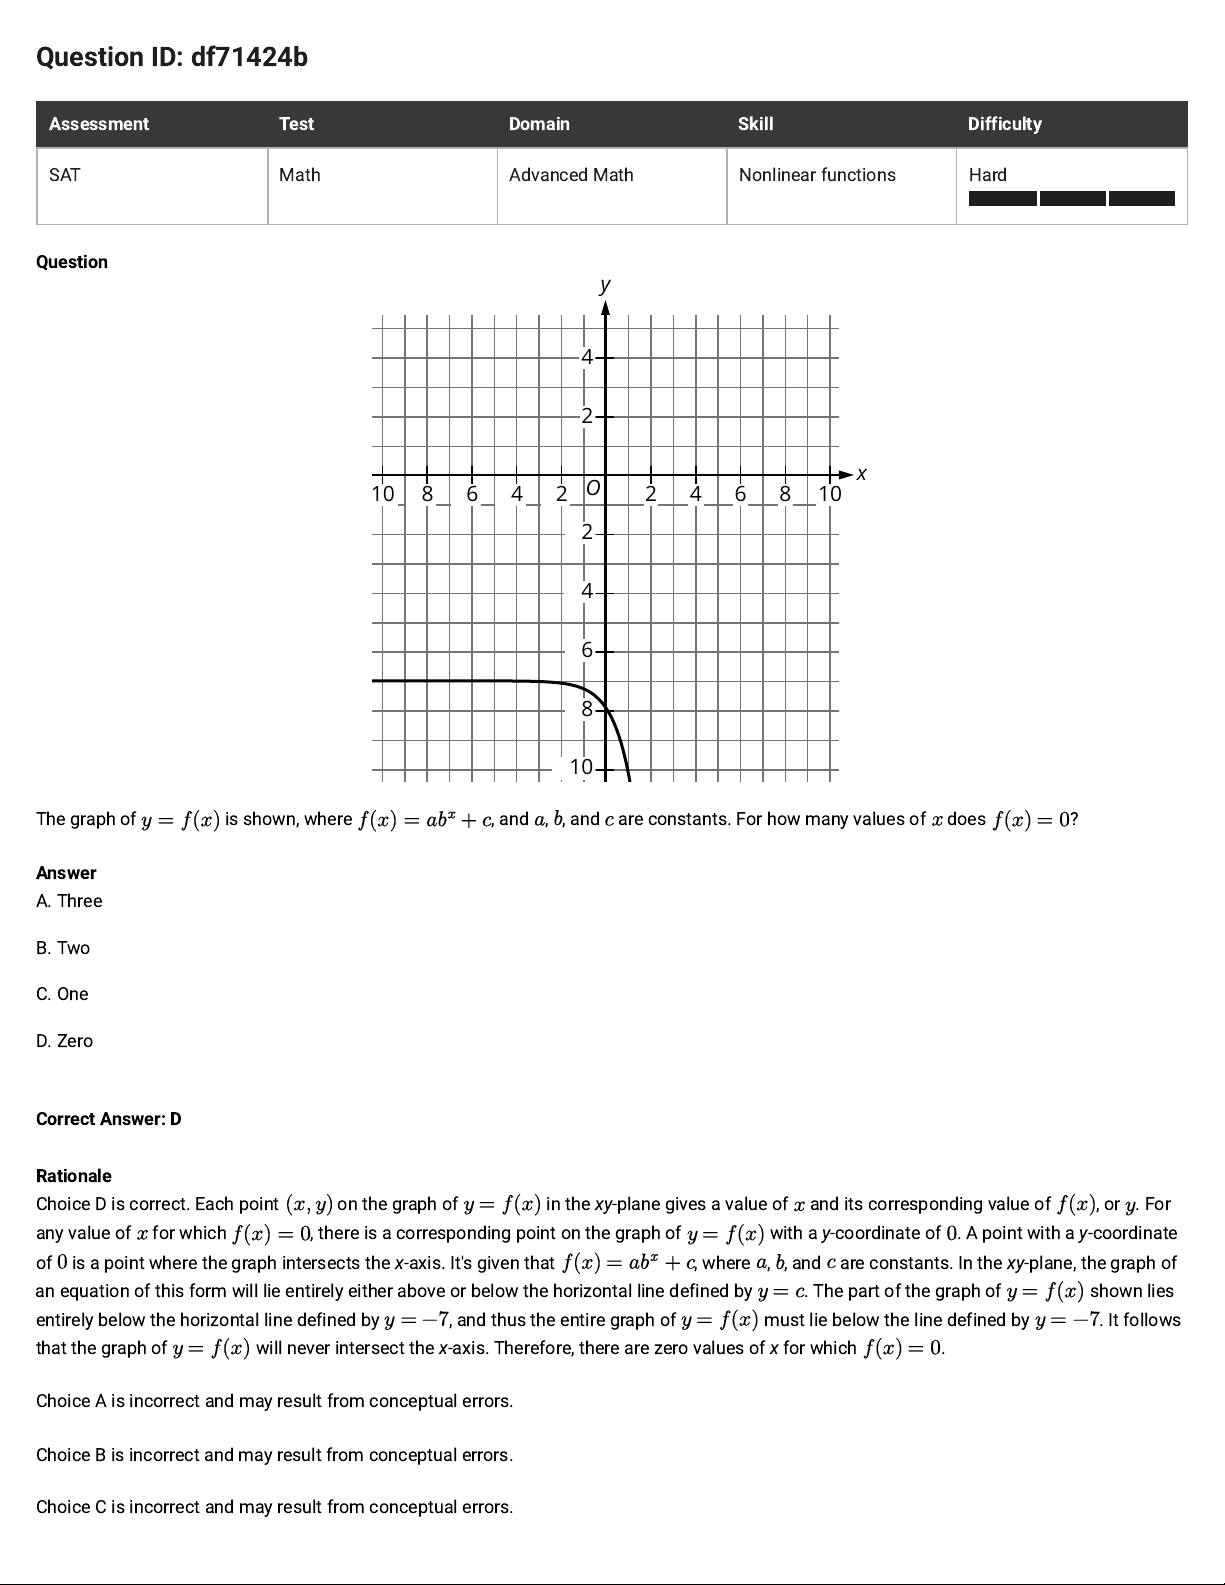
The graph of
is shown, where , and , , and are constants. For how many values of does ?
Answer
A. Three
B. Two
C. One
D. Zero
Correct Answer: D
Rationale
Choice D is correct. Each point
on the graph of
in the xy-plane gives a value of and its corresponding value of , or . For
any value of for which , there is a corresponding point on the graph of
with a y-coordinate of . A point with a y-coordinate
of is a point where the graph intersects the x-axis. It's given that , where , , and are constants. In the xy-plane, the graph of
an equation of this form will lie entirely either above or below the horizontal line defined by . The part of the graph of shown lies
entirely below the horizontal line defined by , and thus the entire graph of
must lie below the line defined by . It follows
that the graph of will never intersect the x-axis. Therefore, there are zero values of x for which .
Choice A is incorrect and may result from conceptual errors.
Choice B is incorrect and may result from conceptual errors.
Choice C is incorrect and may result from conceptual errors.
Page 33
Question ID: 203774bc
Assessment Test Domain Skill Difficulty
SAT Math Advanced Math Nonlinear functions Medium
Question
The product of two positive integers is . If the first integer is greater than twice the second integer, what is the smaller of the two
integers?
Answer
A.
B.
C.
D.
Correct Answer: B
Rationale
Choice B is correct. Let be the first integer and let be the second integer. If the first integer is greater than twice the second integer, then
. If the product of the two integers is , then . Substituting for in this equation results in
. Distributing the to both terms in the parentheses results in . Subtracting from both sides of this equation results
in . The left-hand side of this equation can be factored by finding two values whose product is , or , and
whose sum is . The two values whose product is and whose sum is are and . Thus, the equation
can be rewritten as , which is equivalent to , or . By the
zero product property, it follows that and . Subtracting from both sides of the equation yields
. Dividing both sides of this equation by yields . Since is a positive integer, the value of is not . Adding to both
sides of the equation yields . Substituting for in the equation yields . Dividing both sides of this
equation by results in . Therefore, the two integers are and , so the smaller of the two integers is .
Choice A is incorrect and may result from conceptual or calculation errors.
Choice C is incorrect. This is the larger of the two integers.
Choice D is incorrect and may result from conceptual or calculation errors.
Page 34
Question ID: c4cd5bcc
Assessment Test Domain Skill Difficulty
SAT Math Advanced Math Nonlinear functions Medium
Question
In the xy-plane, the y-coordinate of the y-intercept of the graph of the function f is c. Which of the following must be equal to c ?
Answer
A.
B.
C.
D.
Correct Answer: A
Rationale
Choice A is correct. A y-intercept is the point in the xy-plane where the graph of the function crosses the y-axis, which is where . It’s given
that the y-coordinate of the y-intercept of the graph of function f is c. It follows that the coordinate pair representing the y-intercept must be
. Therefore, c must equal .
Choices B, C, and D are incorrect because , , and would represent the y-value of the coordinate where , , and
, respectively.
Page 35
Question ID: 68607eca
Assessment Test Domain Skill Difficulty
SAT Math Advanced Math Nonlinear functions Medium
Question
On April , there were views of an advertisement posted on a website. Every days after April , the number of views of the advertisement
had increased by of the number of views days earlier. The function gives the predicted number of views days after April . Which
equation defines ?
Answer
A.
B.
C.
D.
Correct Answer: C
Rationale
Choice C is correct. It’s given that on April , there were views of the advertisement. It’s also given that every days after April , the number
of views of the advertisement had increased by of the number of views days earlier. This situation can be represented by an exponential
function of the form , where is the number of views on April and every days after April , the number of views had
increased by of the number of views days earlier. It follows that , , and . Substituting for , for , and for in
the equation
yields , or .
Choice A is incorrect. This function gives the predicted number of views for an advertisement for which every days, the number of views was
, rather thanincreased by , of the number of views days earlier.
Choice B is incorrect. This function gives the predicted number of views for an advertisement for which every days, the number of views was
of the number of views days earlier, rather than an advertisement for which every days, the number of views had increased by of
the number of views days earlier.
Choice D is incorrect. This function gives the predicted number of views for an advertisement for which every days, rather than every days,
the number of views had increased by of the number of views days earlier, rather than days earlier.
Page 36
Question ID: 78d5f91a
Assessment Test Domain Skill Difficulty
SAT Math Advanced Math Nonlinear functions Medium
Question
For the function f defined above, what is the value of ?
Answer
A.
B.
C. 7
D. 11
Correct Answer: C
Rationale
Choice C is correct. Substituting for x in the given function f gives , which simplifies to
. This further simplifies to , or .
Choice A is incorrect and may result from correctly substituting for x in the function but incorrectly simplifying the resulting expression to
, or . Choice B is incorrect and may result from arithmetic errors. Choice D is incorrect and may result from
correctly substituting for x in the function but incorrectly simplifying the expression to , or 11.
Page 37
Question ID: d675744f
Assessment Test Domain Skill Difficulty
SAT Math Advanced Math Nonlinear functions Medium
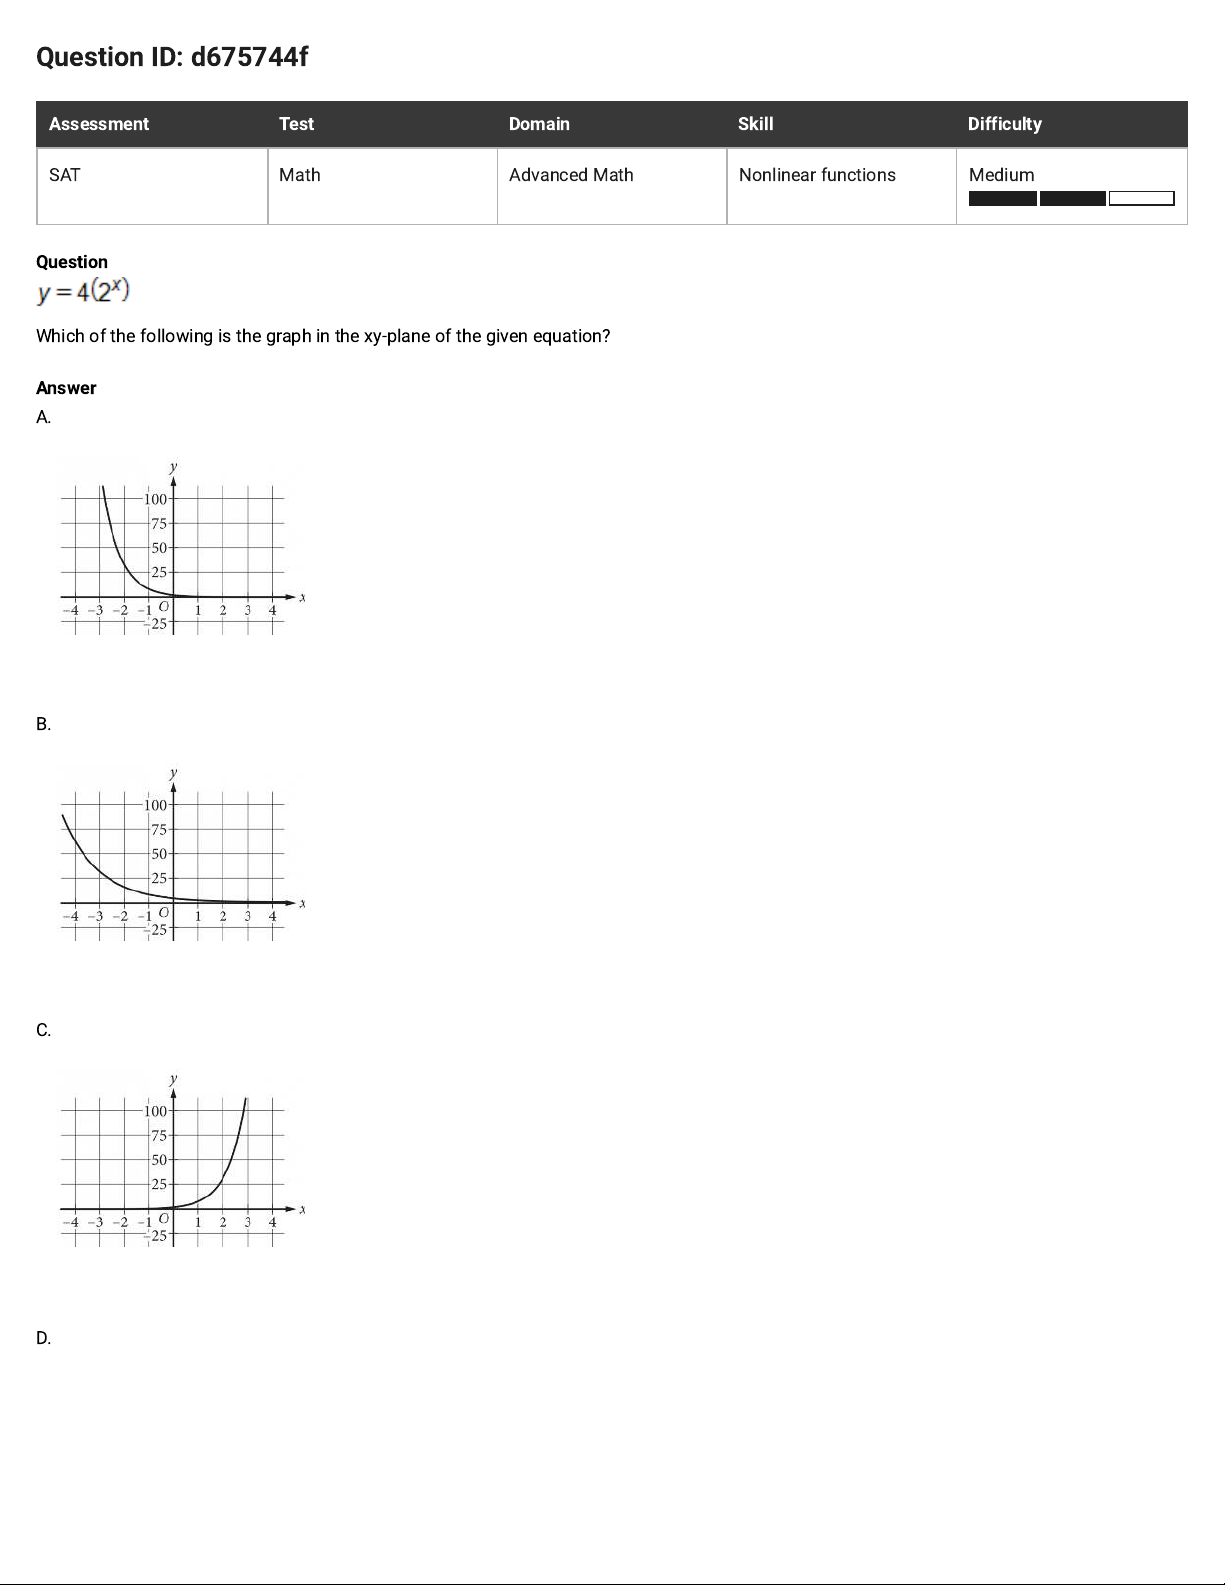
Which of the following is the graph in the xy-plane of the given equation?
A.
B.
C.
D.
Page 38
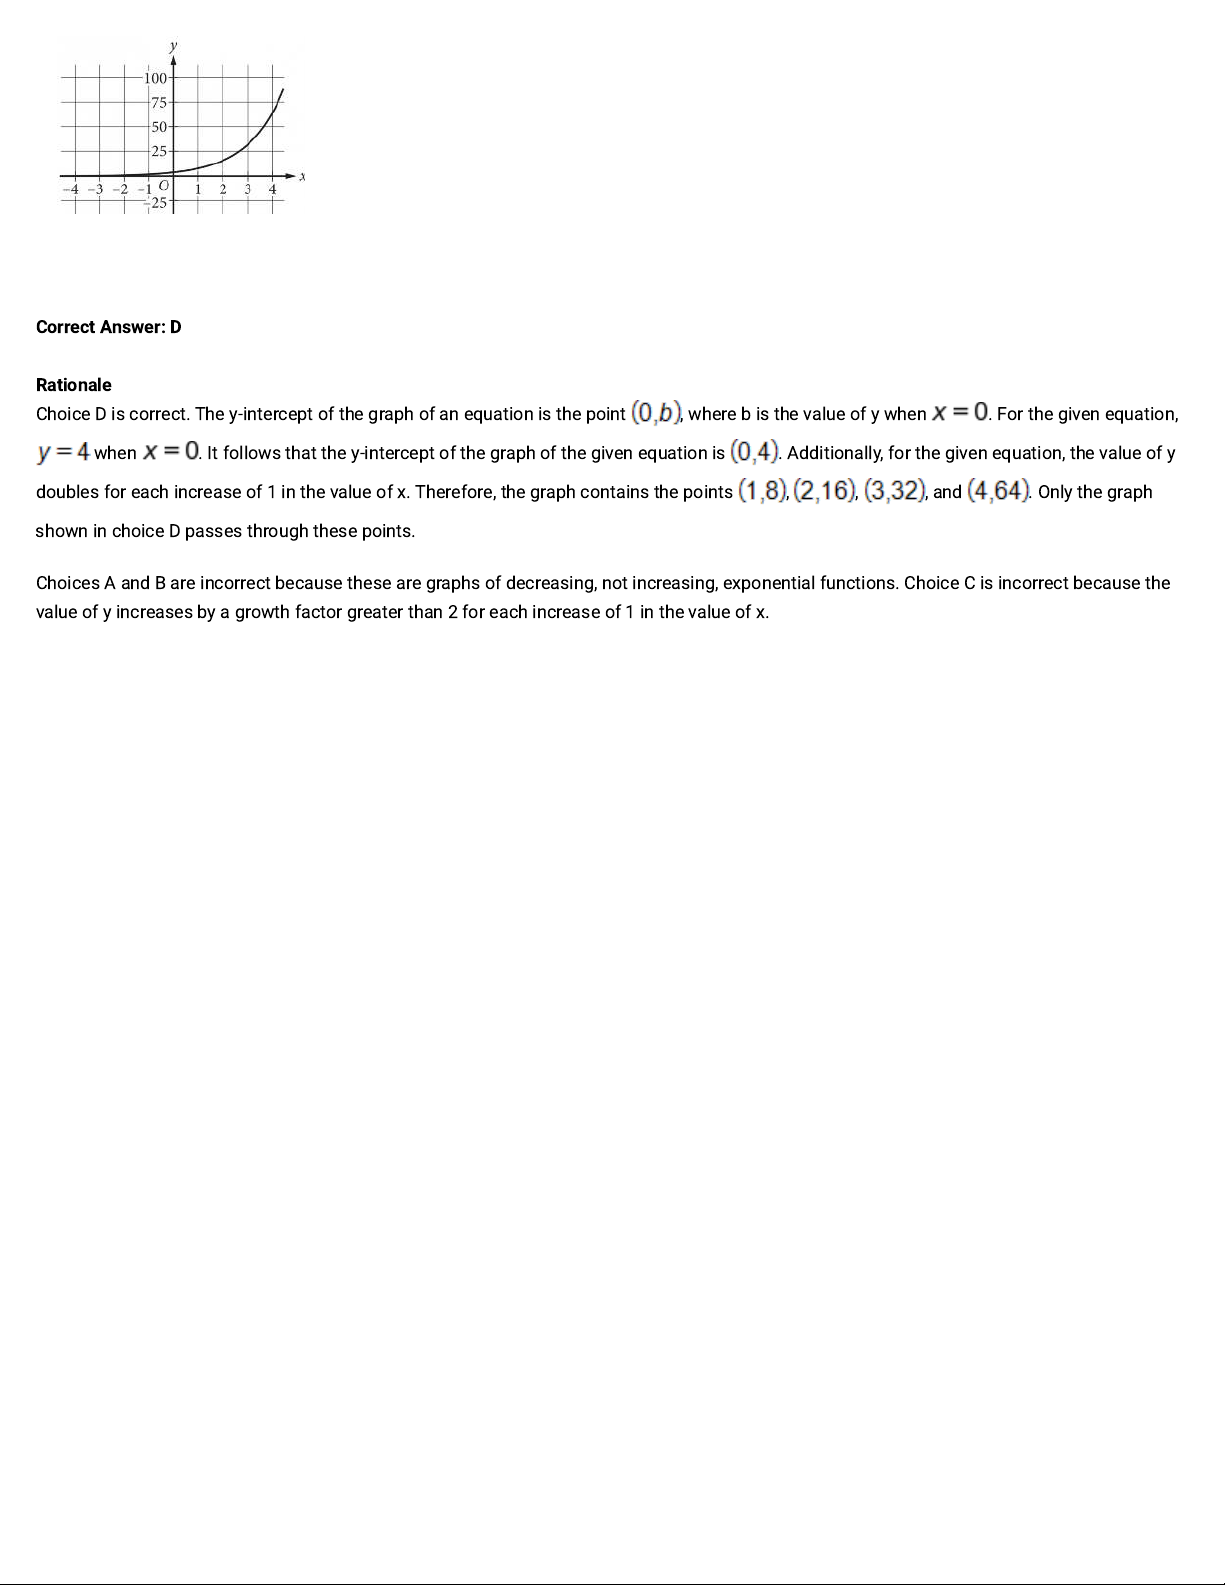
Choice D is correct. The y-intercept of the graph of an equation is the point , where b is the value of y when . For the given equation,
when . It follows that the y-intercept of the graph of the given equation is . Additionally, for the given equation, the value of y
doubles for each increase of 1 in the value of x. Therefore, the graph contains the points , , , and . Only the graph
shown in choice D passes through these points.
Choices A and B are incorrect because these are graphs of decreasing, not increasing, exponential functions. Choice C is incorrect because the
value of y increases by a growth factor greater than 2 for each increase of 1 in the value of x.
Page 39
Question ID: 5377d9cf
Assessment Test Domain Skill Difficulty
SAT Math Advanced Math Nonlinear functions Easy
Question
If , what is ?
Answer
A. –5
B. –2
C. 2
D. 5
Correct Answer: A
Rationale
Choice A is correct. Substituting –1 for x in the equation that defines f gives . Simplifying the expressions in
the numerator and denominator yields , which is equal to or –5.
Choices B, C, and D are incorrect and may result from misapplying the order of operations when substituting –1 for x.
Page 40
Question ID: f880f910
Assessment Test Domain Skill Difficulty
SAT Math Advanced Math Nonlinear functions Medium
Question
The area of a triangle is square centimeters. The length of the base of the triangle is centimeters greater than the height of the triangle.
What is the height, in centimeters, of the triangle?
Answer
A.
B.
C.
D.
Correct Answer: B
Rationale
Choice B is correct. The area,, of a triangle is given by the formula , where represents the length of the base of the triangle and
represents its height. It’s given that the area of a triangle is square centimeters and that the length of the base of this triangle is
centimeters greater than the height of the triangle. Let represent the height, in centimeters, of the triangle. It follows that the length of the base
of the triangle can be expressed as
. Substituting for , for , and for in the formula yields
, or . Multiplying both sides of this equation by yields . Applying the distributive property on
the right-hand side of this equation yields . Subtracting from both sides of this equation yields
. In
factored form, this equation is equivalent to . Applying the zero product property, it follows that or
. Subtracting from both sides of the equation yields . Adding to both sides of the equation yields
. Since represents the height of the triangle, it must be positive. Therefore, the height, in centimeters, of the triangle is.
Choice A is incorrect and may result from conceptual or calculation errors.
Choice C is incorrect and may result from conceptual or calculation errors.
Choice D is incorrect and may result from conceptual or calculation errors.
Page 41
Question ID: 75915e3c
Assessment Test Domain Skill Difficulty
SAT Math Advanced Math Nonlinear functions Easy
Question
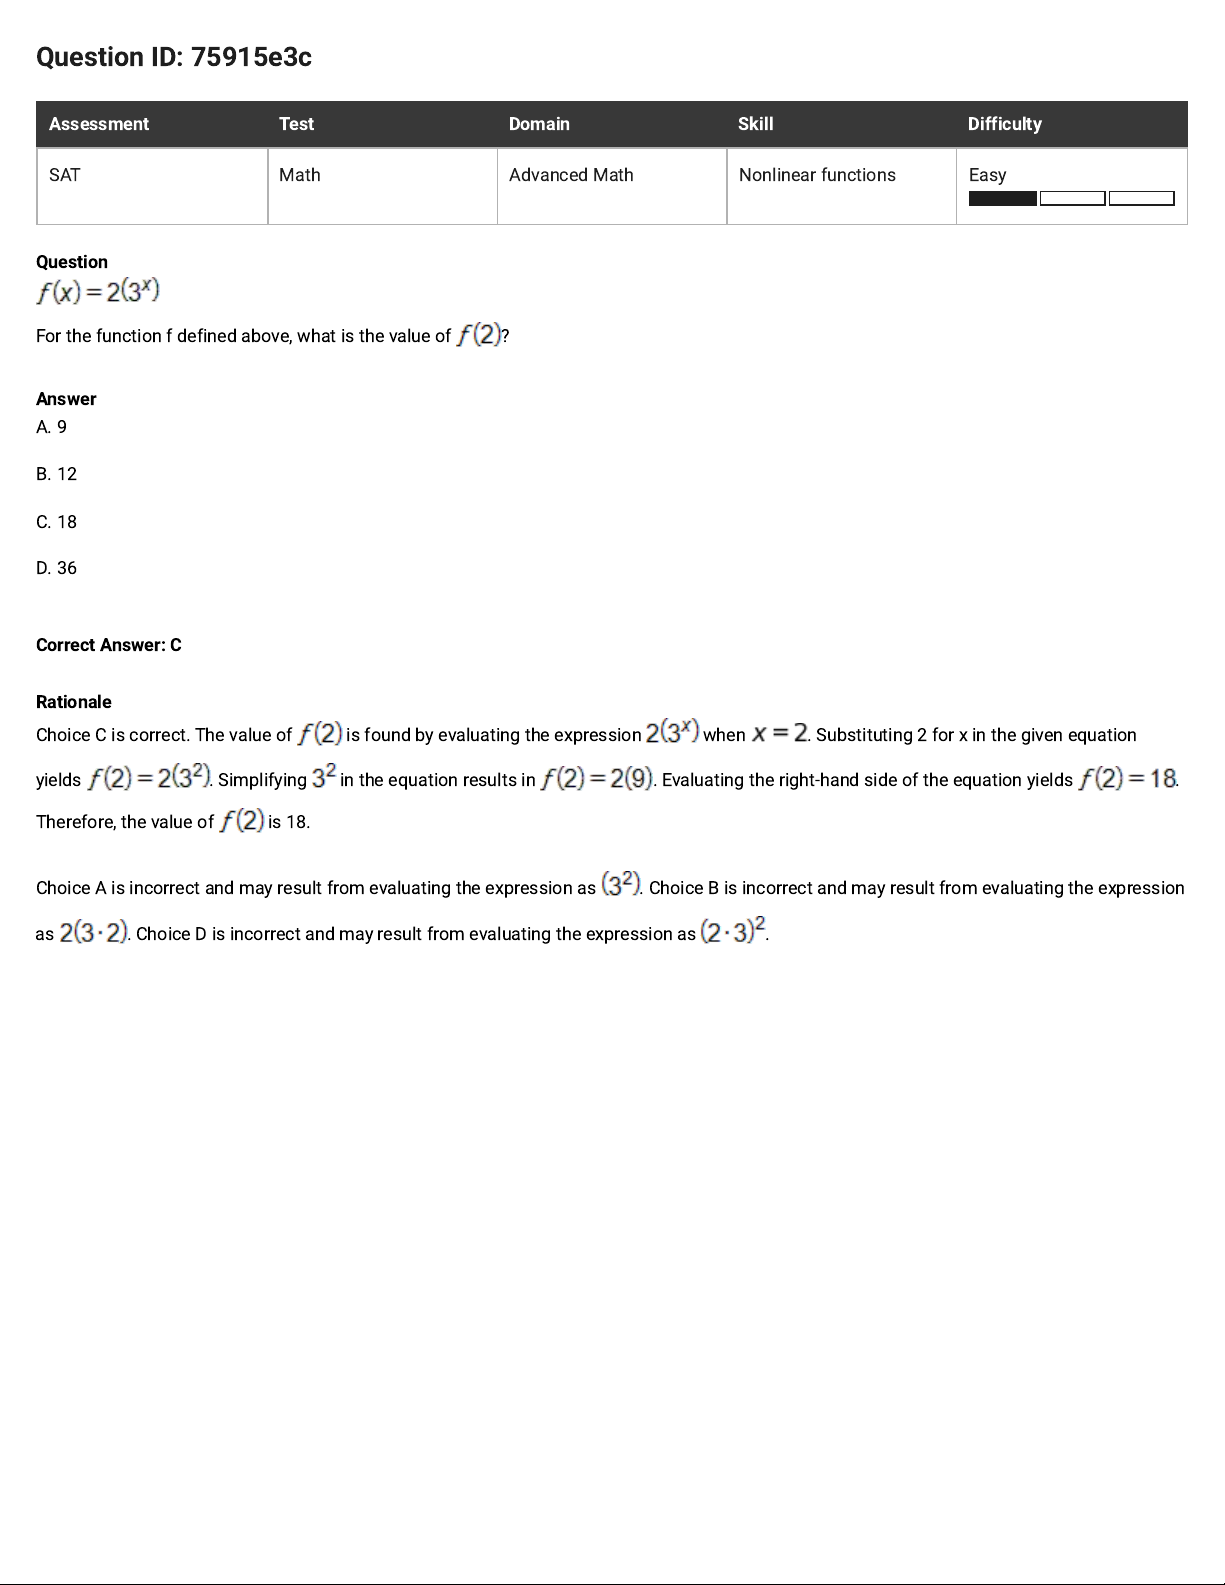
For the function f defined above, what is the value of ?
Answer
A. 9
B. 12
C. 18
D. 36
Correct Answer: C
Rationale
Choice C is correct. The value of is found by evaluating the expression when . Substituting 2 for x in the given equation
yields . Simplifying in the equation results in . Evaluating the right-hand side of the equation yields .
Therefore, the value of is 18.
Choice A is incorrect and may result from evaluating the expression as . Choice B is incorrect and may result from evaluating the expression
as . Choice D is incorrect and may result from evaluating the expression as .
Page 42
Question ID: f44a29a8
Assessment Test Domain Skill Difficulty
SAT Math Advanced Math Nonlinear functions Medium
Question
An object’s kinetic energy, in joules, is equal to the product of one-half the object’s mass, in kilograms, and the square of the object’s speed, in
meters per second. What is the speed, in meters per second, of an object with a mass of 4 kilograms and kinetic energy of 18 joules?
Answer
A. 3
B. 6
C. 9
D. 36
Correct Answer: A
Rationale
Choice A is correct. It’s given that an object’s kinetic energy, in joules, is equal to the product of one-half the object’s mass, in kilograms, and the
square of the object’s speed, in meters per second. This relationship can be represented by the equation , where K is the kinetic
energy, m is the mass, and v is the speed. Substituting a mass of 4 kilograms for m and a kinetic energy of 18 joules for K results in the equation
, or . Dividing both sides of this equation by 2 yields . Taking the square root of both sides yields
and . Since speed can’t be expressed as a negative number, the speed of the object is 3 meters per second.
Choice B is incorrect and may result from computation errors. Choice C is incorrect. This is the value of rather than v. Choice D is incorrect.
This is the value of rather than v.
Page 43
Question ID: 0121a235
Assessment Test Domain Skill Difficulty
SAT Math Advanced Math Nonlinear functions Hard
Question
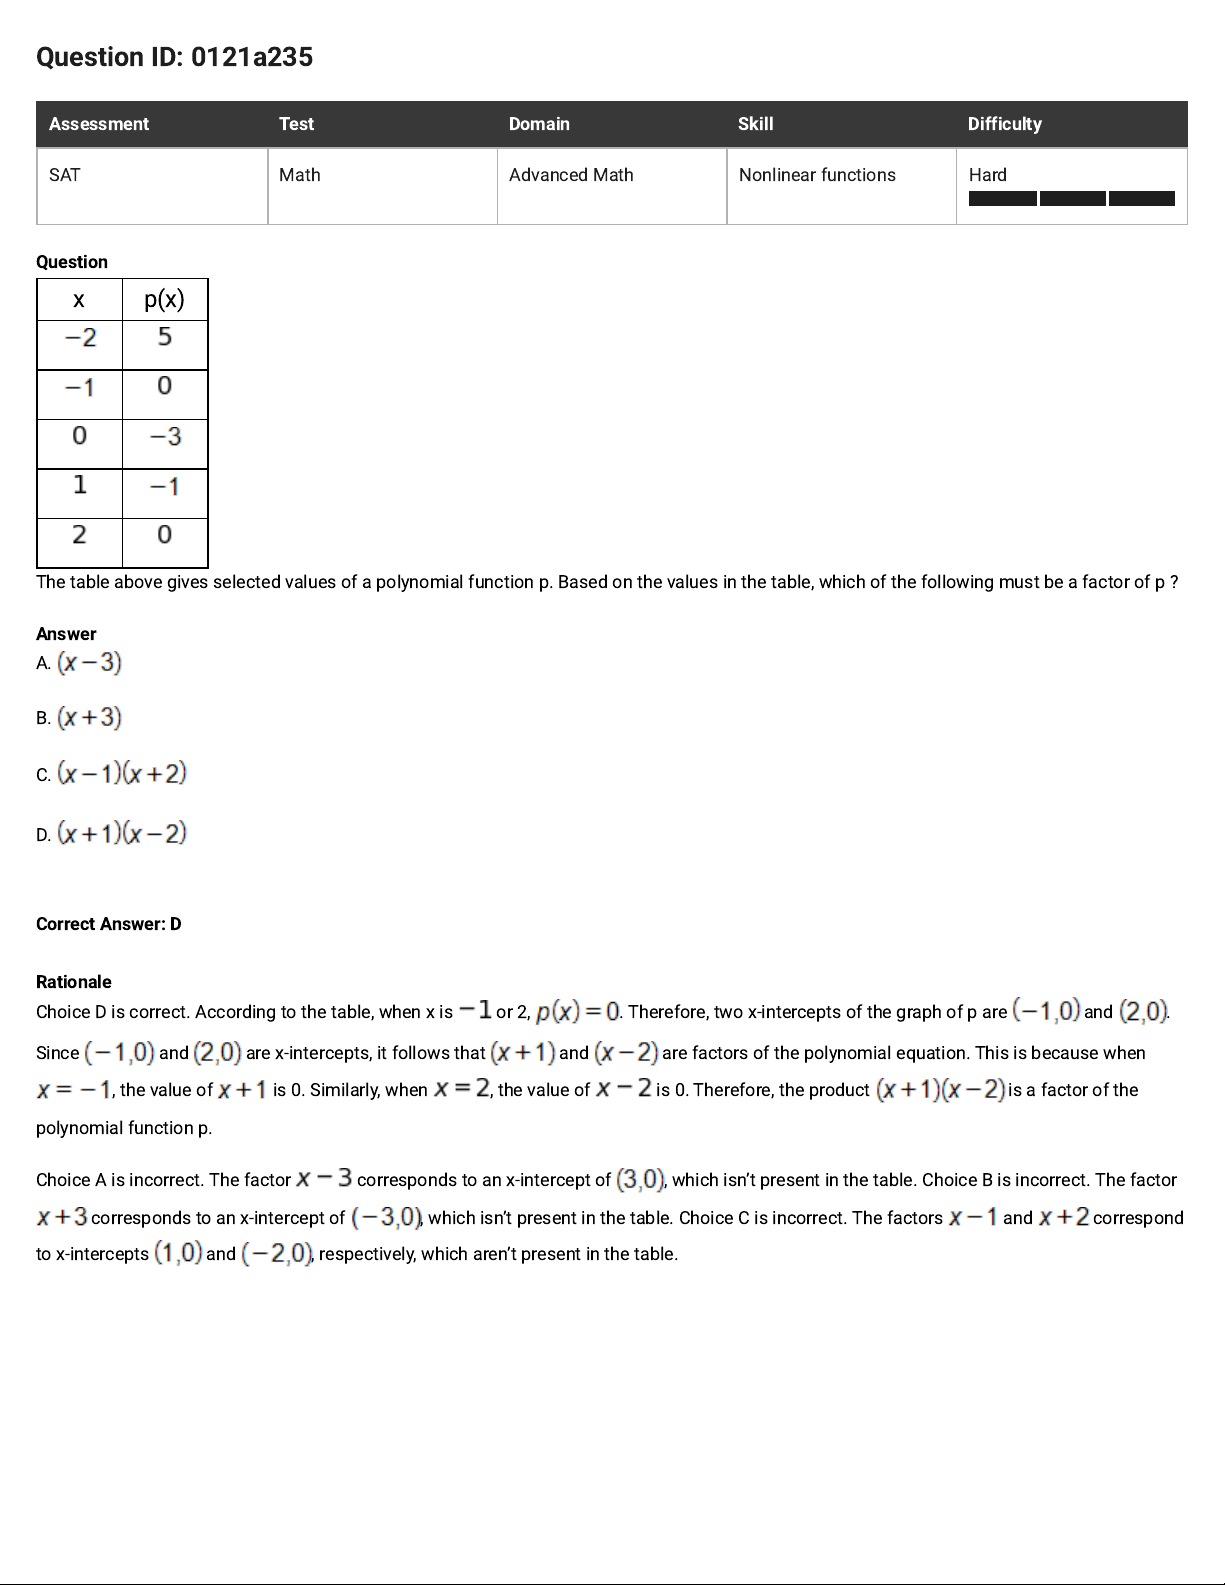
x p(x)
The table above gives selected values of a polynomial function p. Based on the values in the table, which of the following must be a factor of p ?
Answer
A.
B.
C.
D.
Correct Answer: D
Rationale
Choice D is correct. According to the table, when x is or 2, . Therefore, two x-intercepts of the graph of p are and .
Since and are x-intercepts, it follows that and are factors of the polynomial equation. This is because when
, the value of is 0. Similarly, when , the value of is 0. Therefore, the product is a factor of the
polynomial function p.
Choice A is incorrect. The factor corresponds to an x-intercept of , which isn’t present in the table. Choice B is incorrect. The factor
corresponds to an x-intercept of , which isn’t present in the table. Choice C is incorrect. The factors and correspond
to x-intercepts and , respectively, which aren’t present in the table.
Page 44
Question ID: d71f6dbf
Assessment Test Domain Skill Difficulty
SAT Math Advanced Math Nonlinear functions Medium
Question
The height, in feet, of an object x seconds after it is thrown straight up in the air can be modeled by the function .
Based on the model, which of the following statements best interprets the equation ?
Answer
A. The height of the object 1.4 seconds after being thrown straight up in the air is 1.64 feet.
B. The height of the object 1.64 seconds after being thrown straight up in the air is 1.4 feet.
C. The height of the object 1.64 seconds after being thrown straight up in the air is approximately 1.4 times as great as its initial height.
D. The speed of the object 1.4 seconds after being thrown straight up in the air is approximately 1.64 feet per second.
Correct Answer: A
Rationale
Choice A is correct. The value 1.4 is the value of x, which represents the number of seconds after the object was thrown straight up in the air.
When the function h is evaluated for x = 1.4, the function has a value of 1.64, which is the height, in feet, of the object.
Choices B and C are incorrect and may result from misidentifying seconds as feet and feet as seconds. Additionally, choice C may result from
incorrectly including the initial height of the object as the input x. Choice D is incorrect and may result from misidentifying height as speed.
Page 45
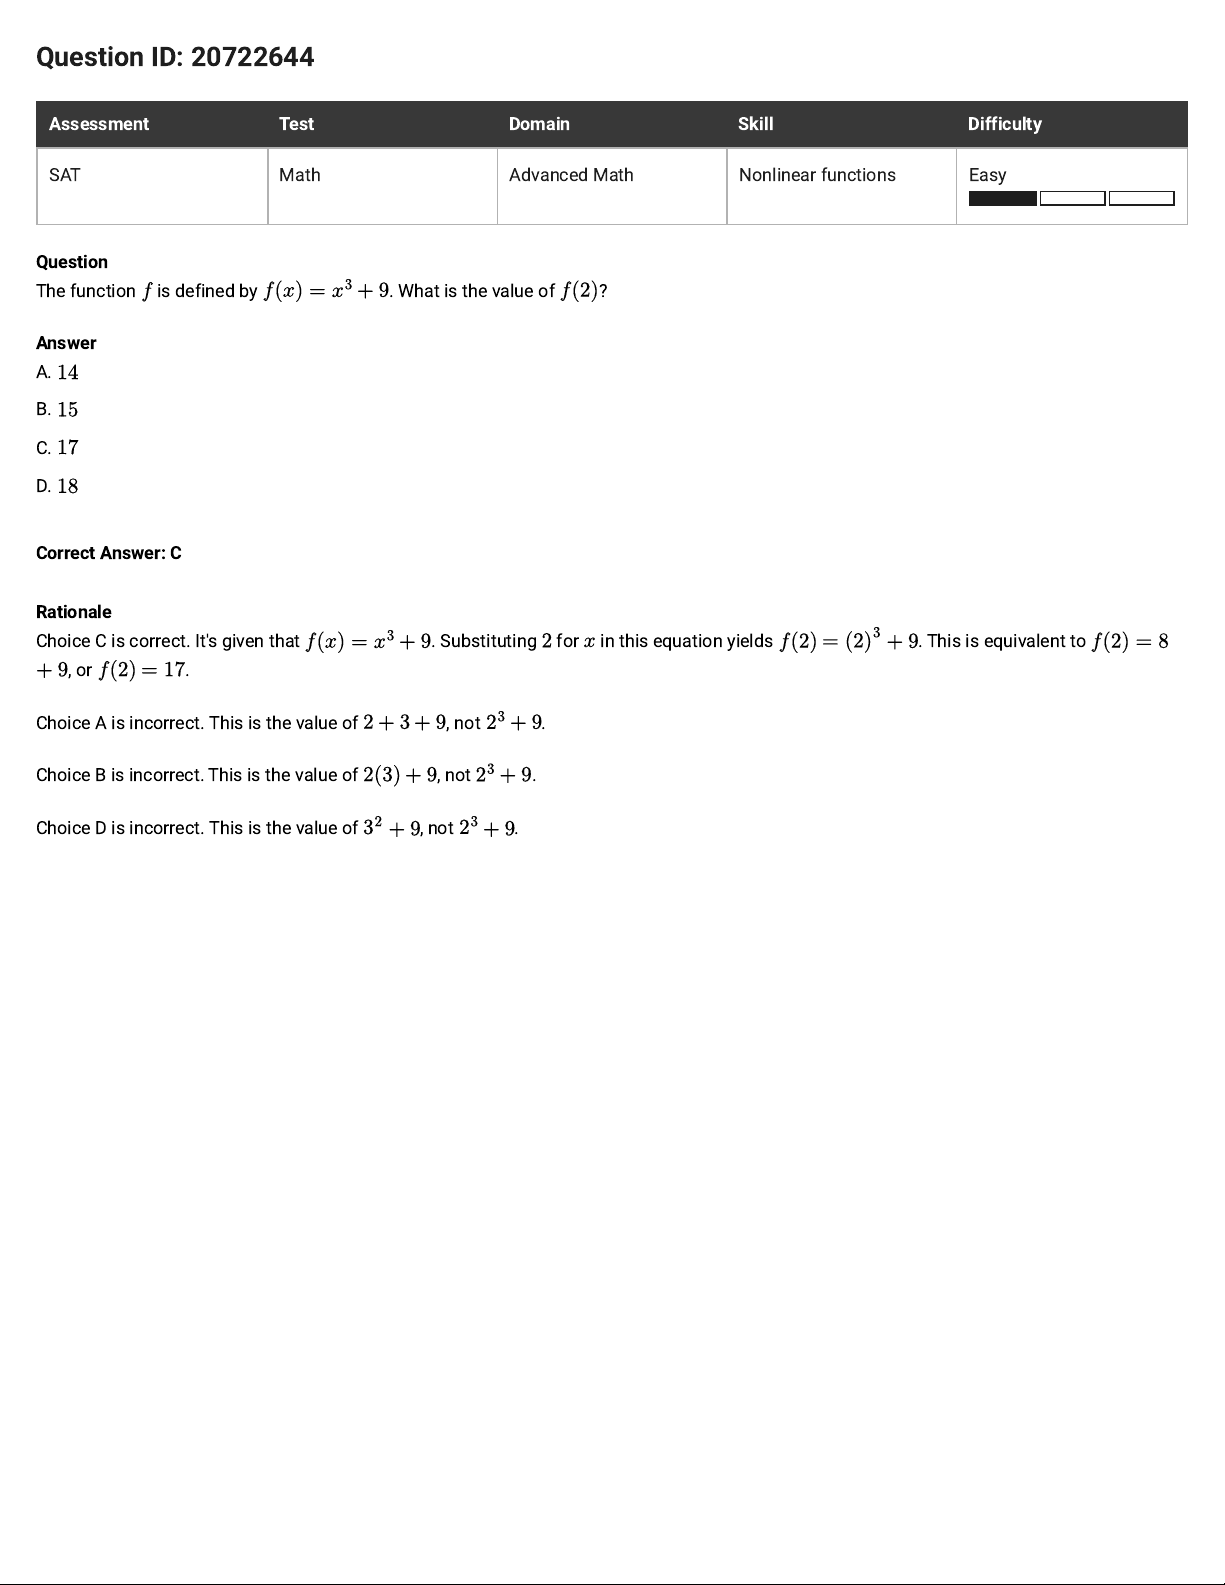
Question ID: 20722644
Assessment Test Domain Skill Difficulty
SAT Math Advanced Math Nonlinear functions Easy
Question
The function is defined by . What is the value of ?
Answer
A.
B.
C.
D.
Correct Answer: C
Rationale
Choice C is correct. It's given that . Substituting for in this equation yields . This is equivalent to
, or
.
Choice A is incorrect. This is the value of , not .
Choice B is incorrect. This is the value of , not .
Choice D is incorrect. This is the value of , not .
Page 46
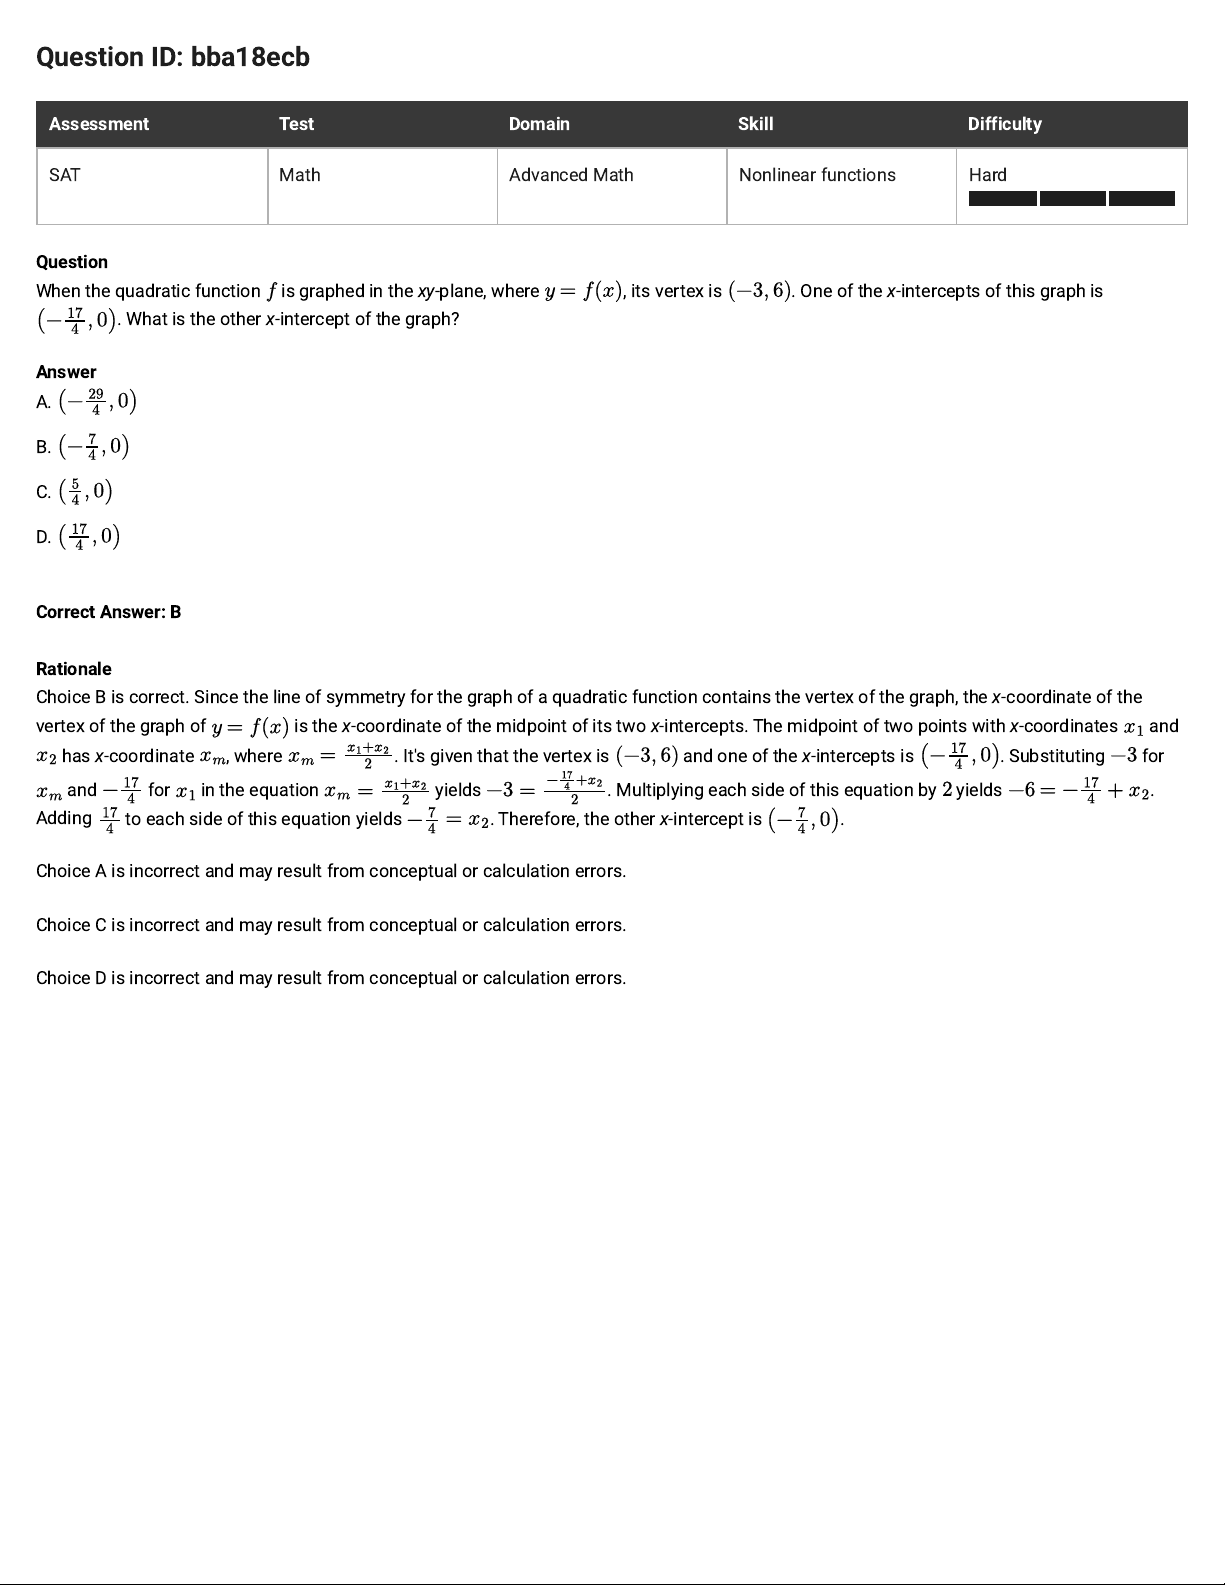
Question ID: bba18ecb
Assessment Test Domain Skill Difficulty
SAT Math Advanced Math Nonlinear functions Hard
Question
When the quadratic function is graphed in the xy-plane, where , its vertex is . One of the x-intercepts of this graph is
. What is the other x-intercept of the graph?
Answer
A.
B.
C.
D.
Correct Answer: B
Rationale
Choice B is correct. Since the line of symmetry for the graph of a quadratic function contains the vertex of the graph, the x-coordinate of the
vertex of the graph of
is the x-coordinate of the midpoint of its two x-intercepts. The midpoint of two points with x-coordinates and
has x-coordinate, where
. It′s given that the vertex is
and one of the x-intercepts is . Substituting for
and
for in the equation
yields . Multiplying each side of this equation by yields .
Adding
to each side of this equation yields . Therefore, the other x-intercept is .
Choice A is incorrect and may result from conceptual or calculation errors.
Choice C is incorrect and may result from conceptual or calculation errors.
Choice D is incorrect and may result from conceptual or calculation errors.
Page 47
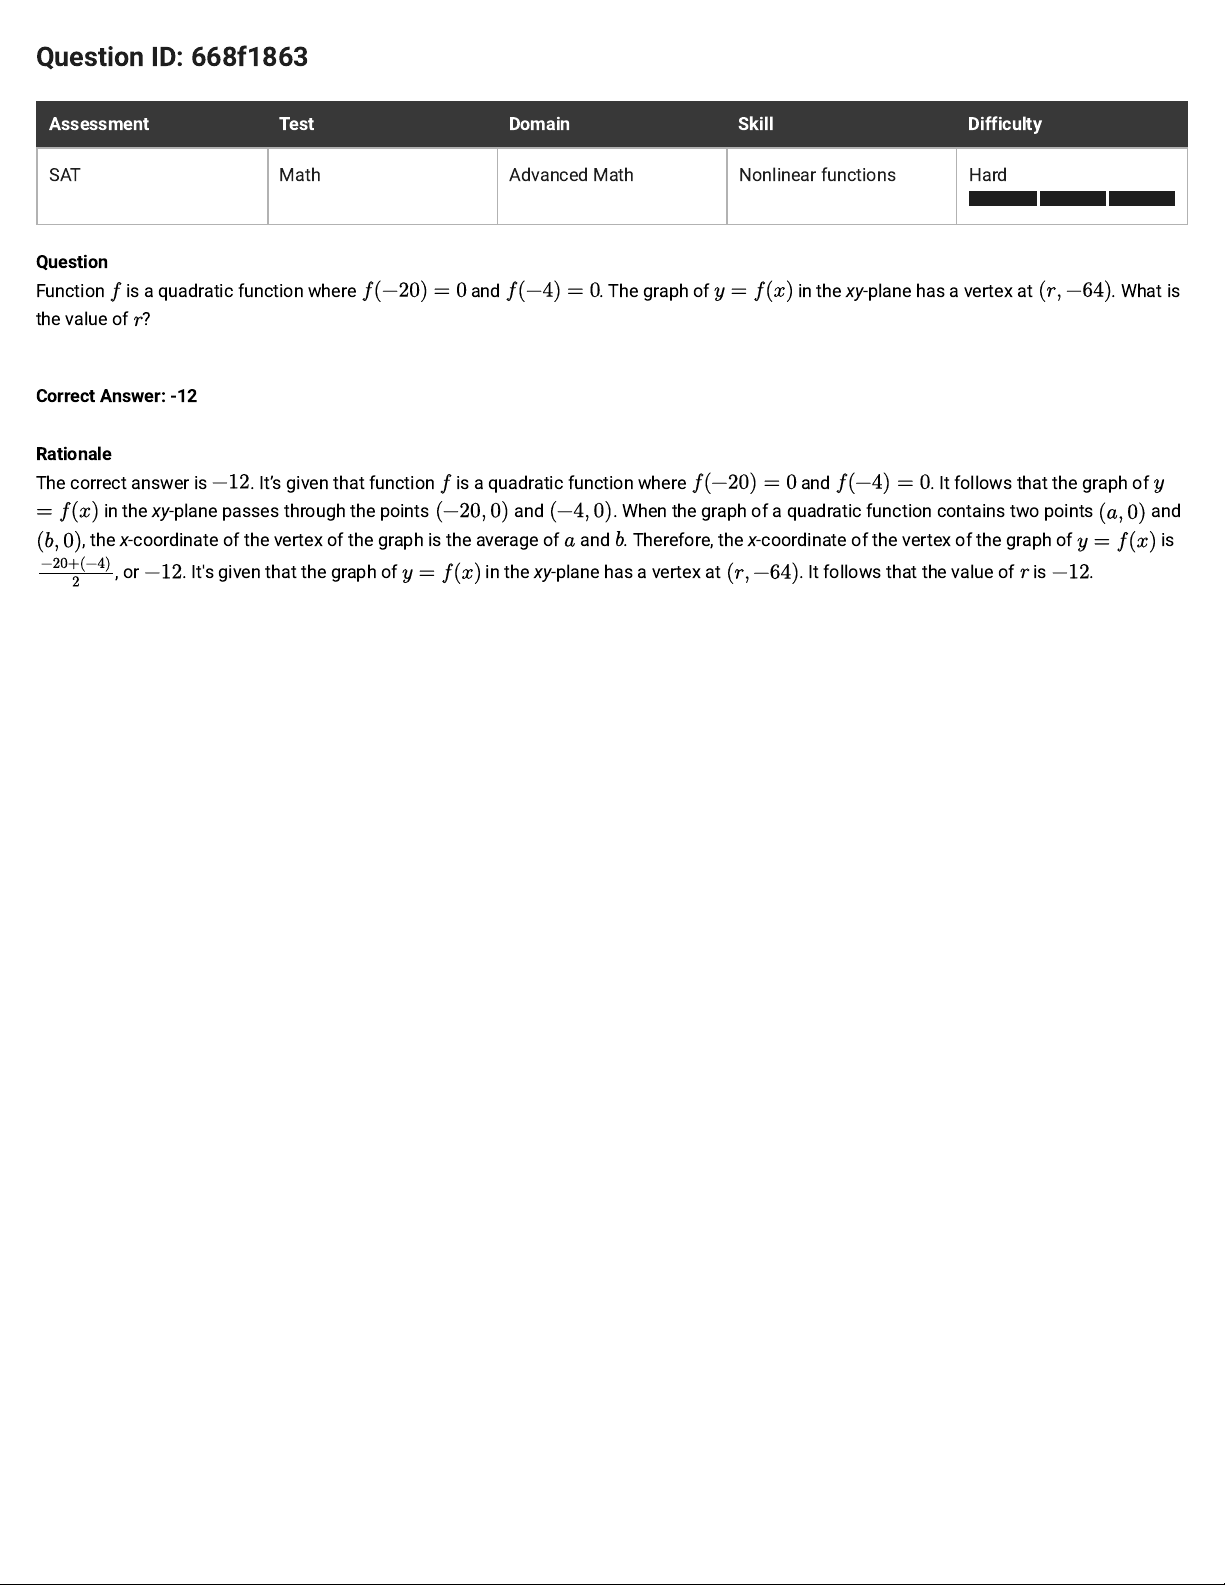
Question ID: 668f1863
Assessment Test Domain Skill Difficulty
SAT Math Advanced Math Nonlinear functions Hard
Question
Function is a quadratic function where and
. The graph of
in the xy-plane has a vertex at
. What is
the value of ?
Correct Answer: -12
Rationale
The correct answer is . It’s given that function is a quadratic function where
and . It follows that the graph of
in the xy-plane passes throughthe points and . When the graph of a quadratic function contains two points
and
, the x-coordinate of the vertex of the graph is the average of and .Therefore, the x-coordinate of the vertex of the graph of is
, or . It's given that the graph of in the xy-plane has a vertex at . It follows that the value of is
.
Page 48
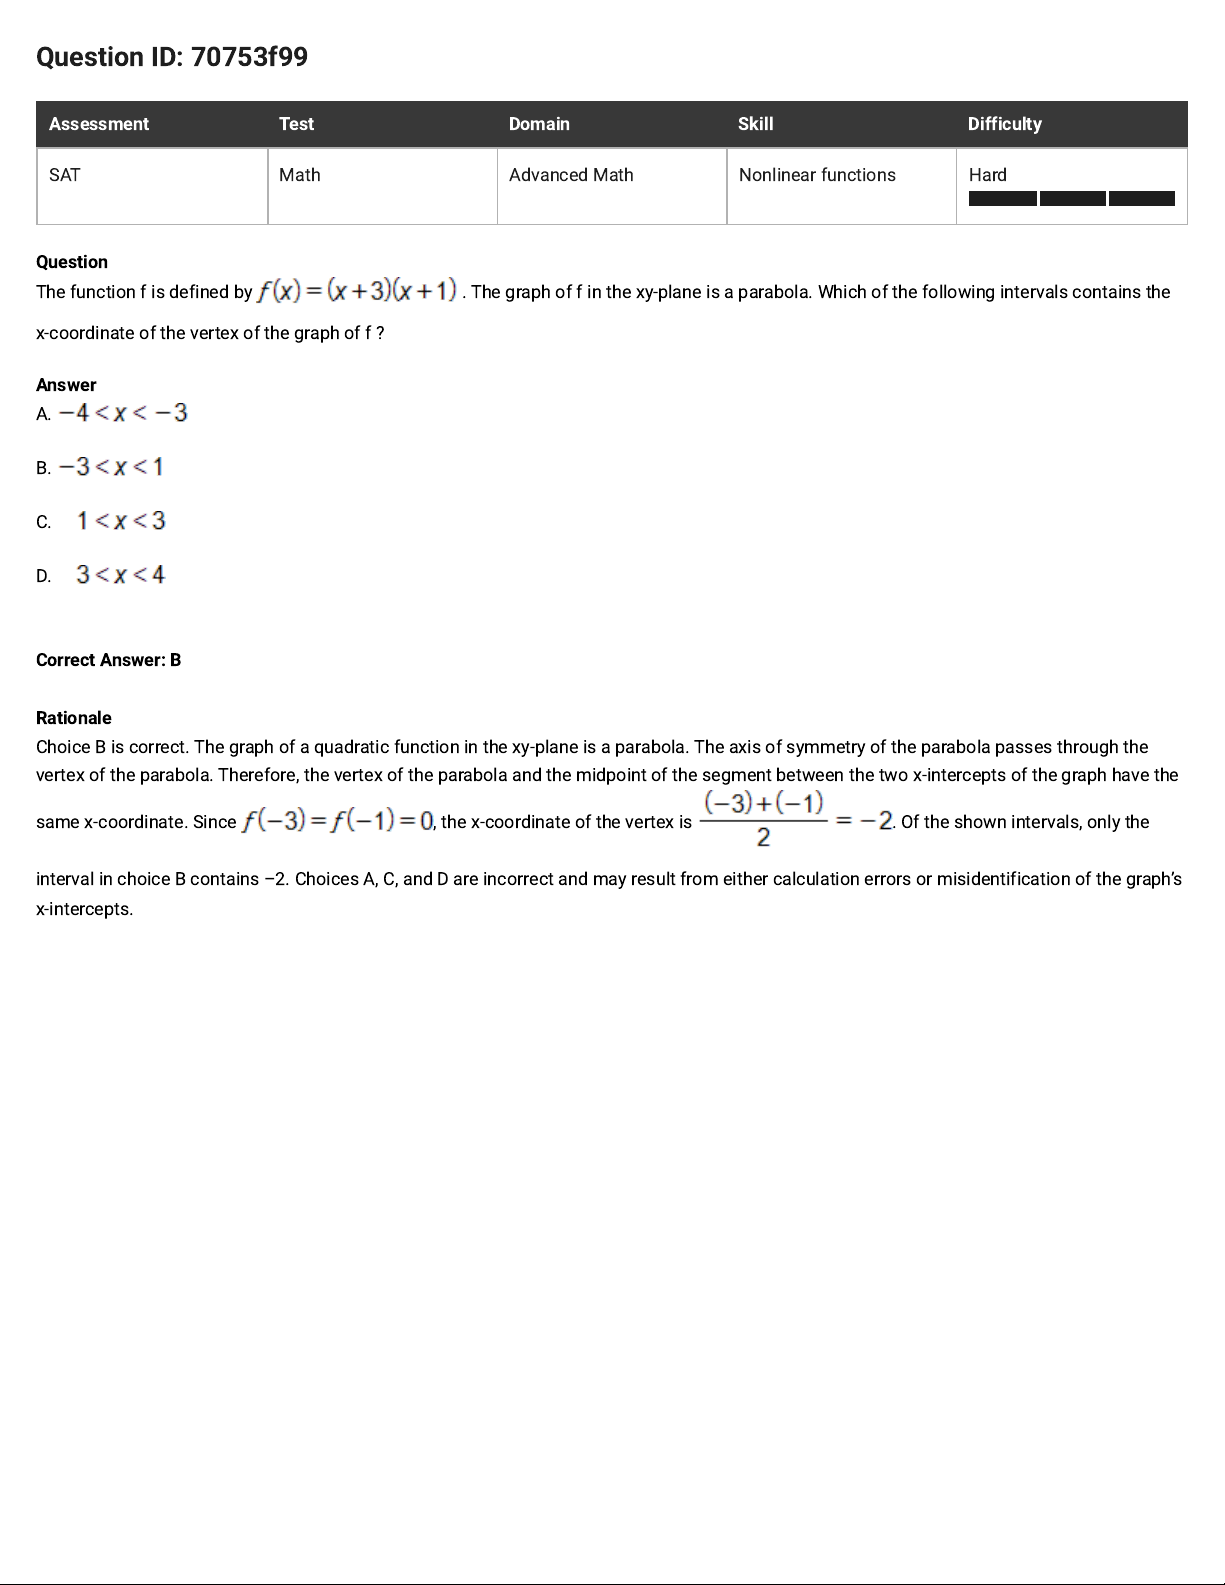
Question ID: 70753f99
Assessment Test Domain Skill Difficulty
SAT Math Advanced Math Nonlinear functions Hard
Question
The function f is defined by . The graph of f in the xy-plane is a parabola. Which of the following intervals contains the
x-coordinate of the vertex of the graph of f ?
Answer
A.
B.
C.
D.
Correct Answer: B
Rationale
Choice B is correct. The graph of a quadratic function in the xy-plane is a parabola. The axis of symmetry of the parabola passes through the
vertex of the parabola. Therefore, the vertex of the parabola and the midpoint of the segment between the two x-intercepts of the graph have the
same x-coordinate. Since , the x-coordinate of the vertex is . Of the shown intervals, only the
interval in choice B contains –2. Choices A, C, and D are incorrect and may result from either calculation errors or misidentification of the graph’s
x-intercepts.
Page 49
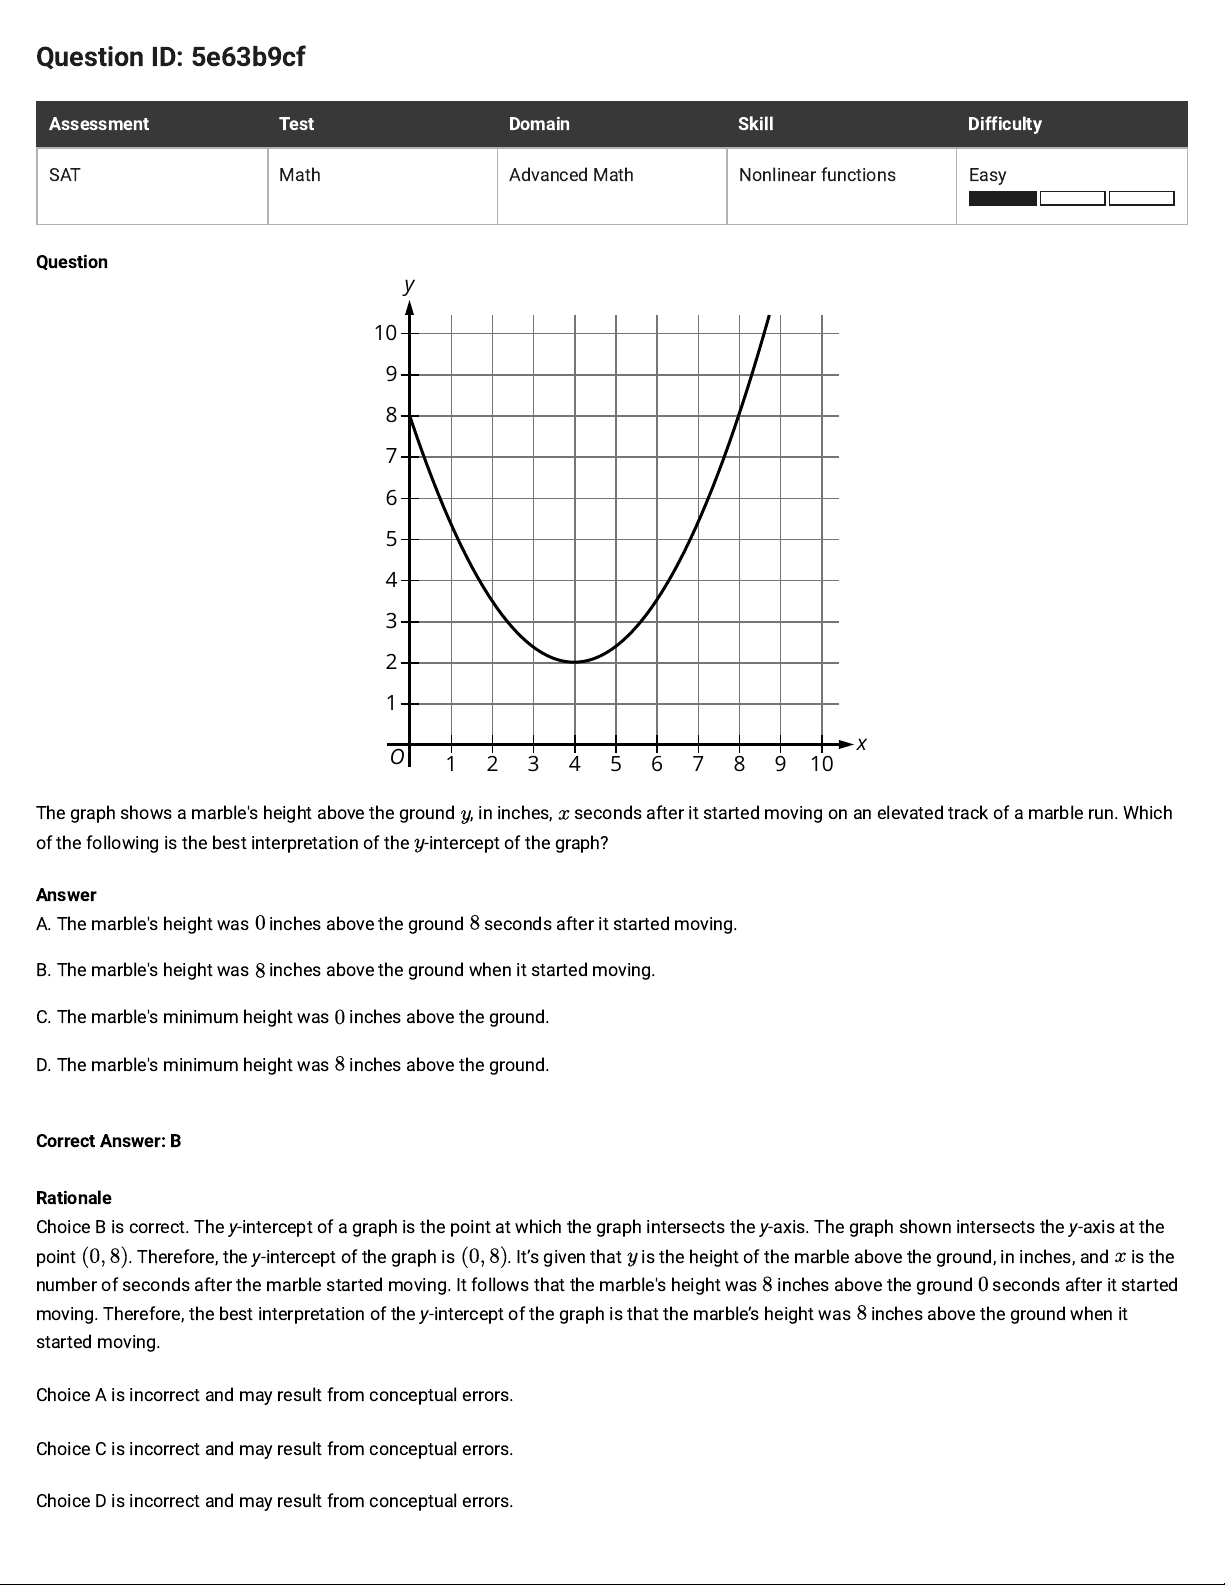
Question ID: 5e63b9cf
Assessment Test Domain Skill Difficulty
SAT Math Advanced Math Nonlinear functions Easy
Question
1 2 3 4 5 6 7 8 9 10
x
1
2
3
4
5
6
7
8
9
10
y
O
The graph shows a marble's height above the ground , in inches, seconds after it started moving on an elevated track of a marble run. Which
of the following is the best interpretation of the -intercept of the graph?
Answer
A. The marble's height was inches above the ground seconds after it started moving.
B. The marble's height was inches above the ground when it started moving.
C. The marble's minimum height was inches above the ground.
D. The marble's minimum height was inches above the ground.
Correct Answer: B
Rationale
Choice B is correct. The y-intercept of a graph is the point at which the graph intersects the y-axis. The graph shown intersects the y-axis at the
point . Therefore, the y-intercept of the graph is . It’s given that is the height of the marble above the ground, in inches, and is the
number of seconds after the marble started moving. It follows that the marble's height was inches above the ground seconds after it started
moving. Therefore, the best interpretation of the y-intercept of the graph is that the marble’s height was inches above the ground when it
started moving.
Choice A is incorrect and may result from conceptual errors.
Choice C is incorrect and may result from conceptual errors.
Choice D is incorrect and may result from conceptual errors.
Page 50
Question ID: 6676f055
Assessment Test Domain Skill Difficulty
SAT Math Advanced Math Nonlinear functions Medium
Question
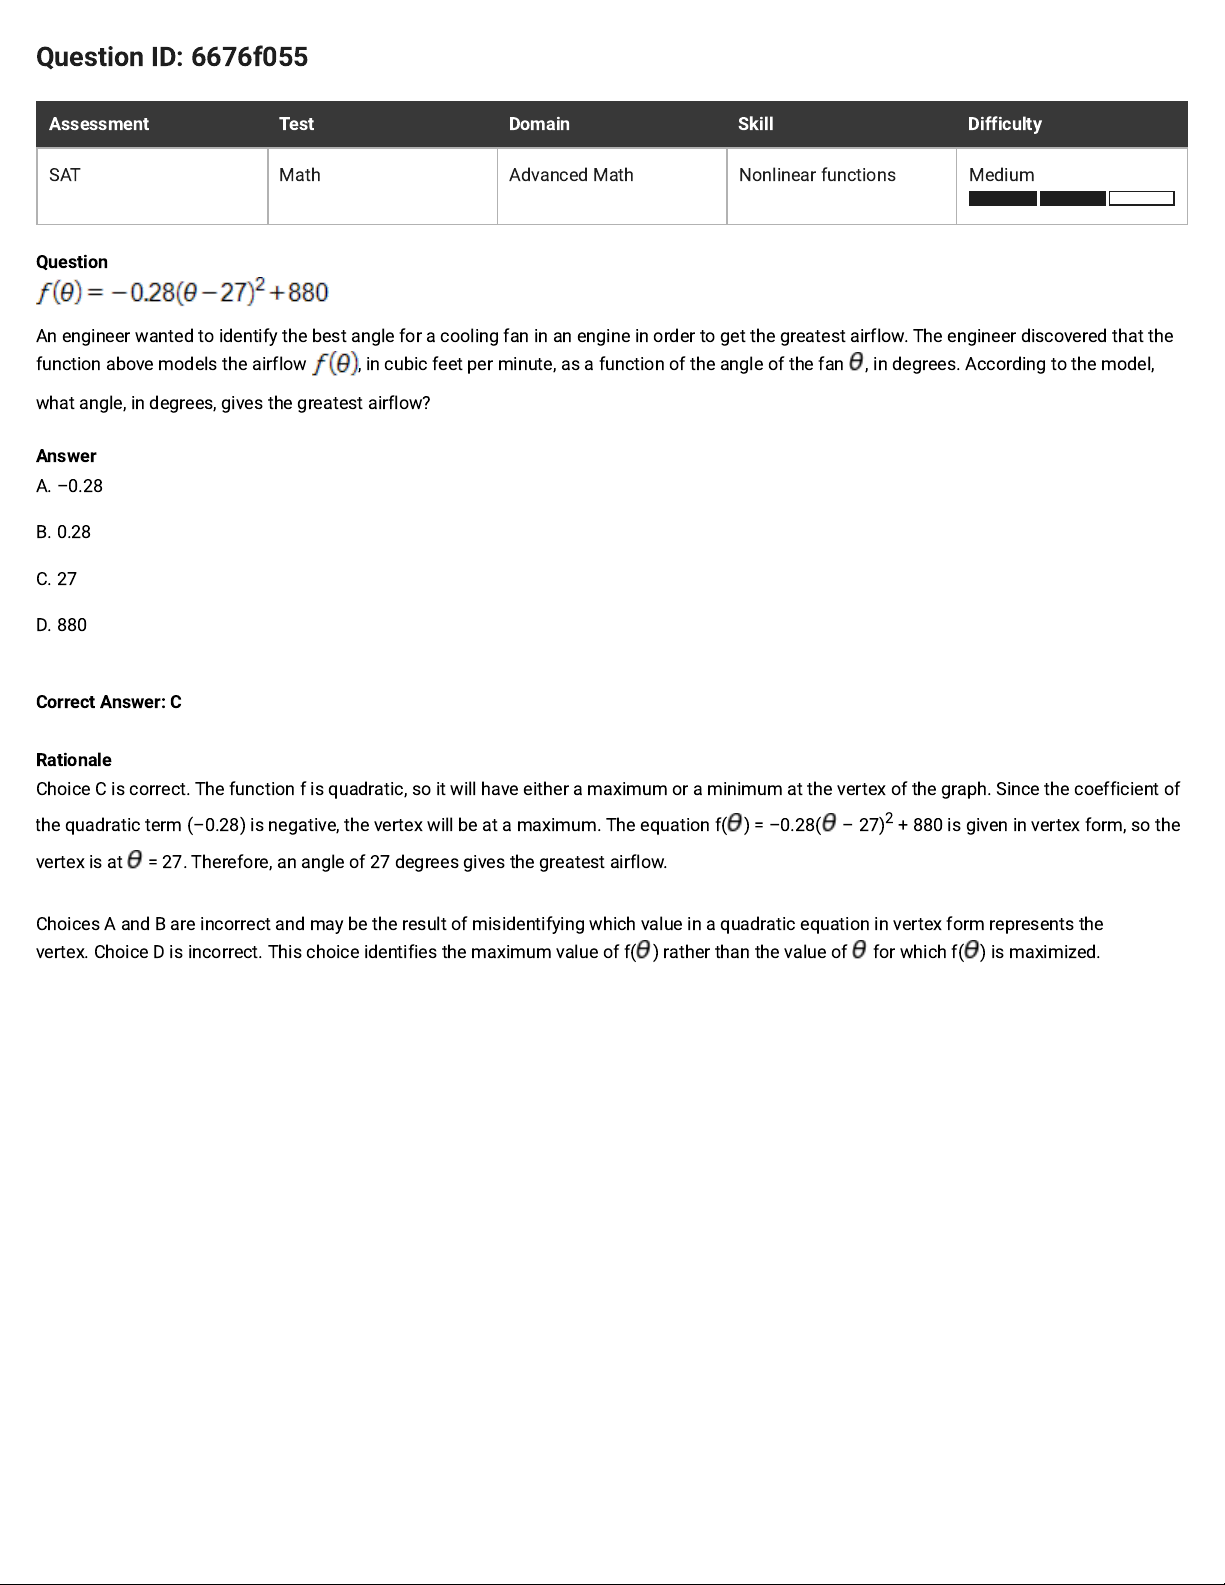
An engineer wanted to identify the best angle for a cooling fan in an engine in order to get the greatest airflow. The engineer discovered that the
function above models the airflow , in cubic feet per minute, as a function of the angle of the fan , in degrees. According to the model,
what angle, in degrees, gives the greatest airflow?
Answer
A. –0.28
B. 0.28
C. 27
D. 880
Correct Answer: C
Rationale
Choice C is correct. The functionfis quadratic, so it will have either a maximum or a minimum at the vertex of the graph. Since the coefficient of
the quadratic term(–0.28)is negative, the vertex will be at a maximum. The equation f( ) = –0.28( – 27)2 + 880 is given in vertex form, so the
vertex is at = 27. Therefore,an angle of 27 degreesgives the greatest airflow.
Choices A and B areincorrect and may be the result ofmisidentifyingwhich value in a quadratic equation in vertex form represents the
vertex.Choice D is incorrect.This choice identifies the maximum value of f( ) rather than the value of for which f( ) is maximized.
Page 51
Question ID: dd8ac009
Assessment Test Domain Skill Difficulty
SAT Math Advanced Math Nonlinear functions Medium
Question
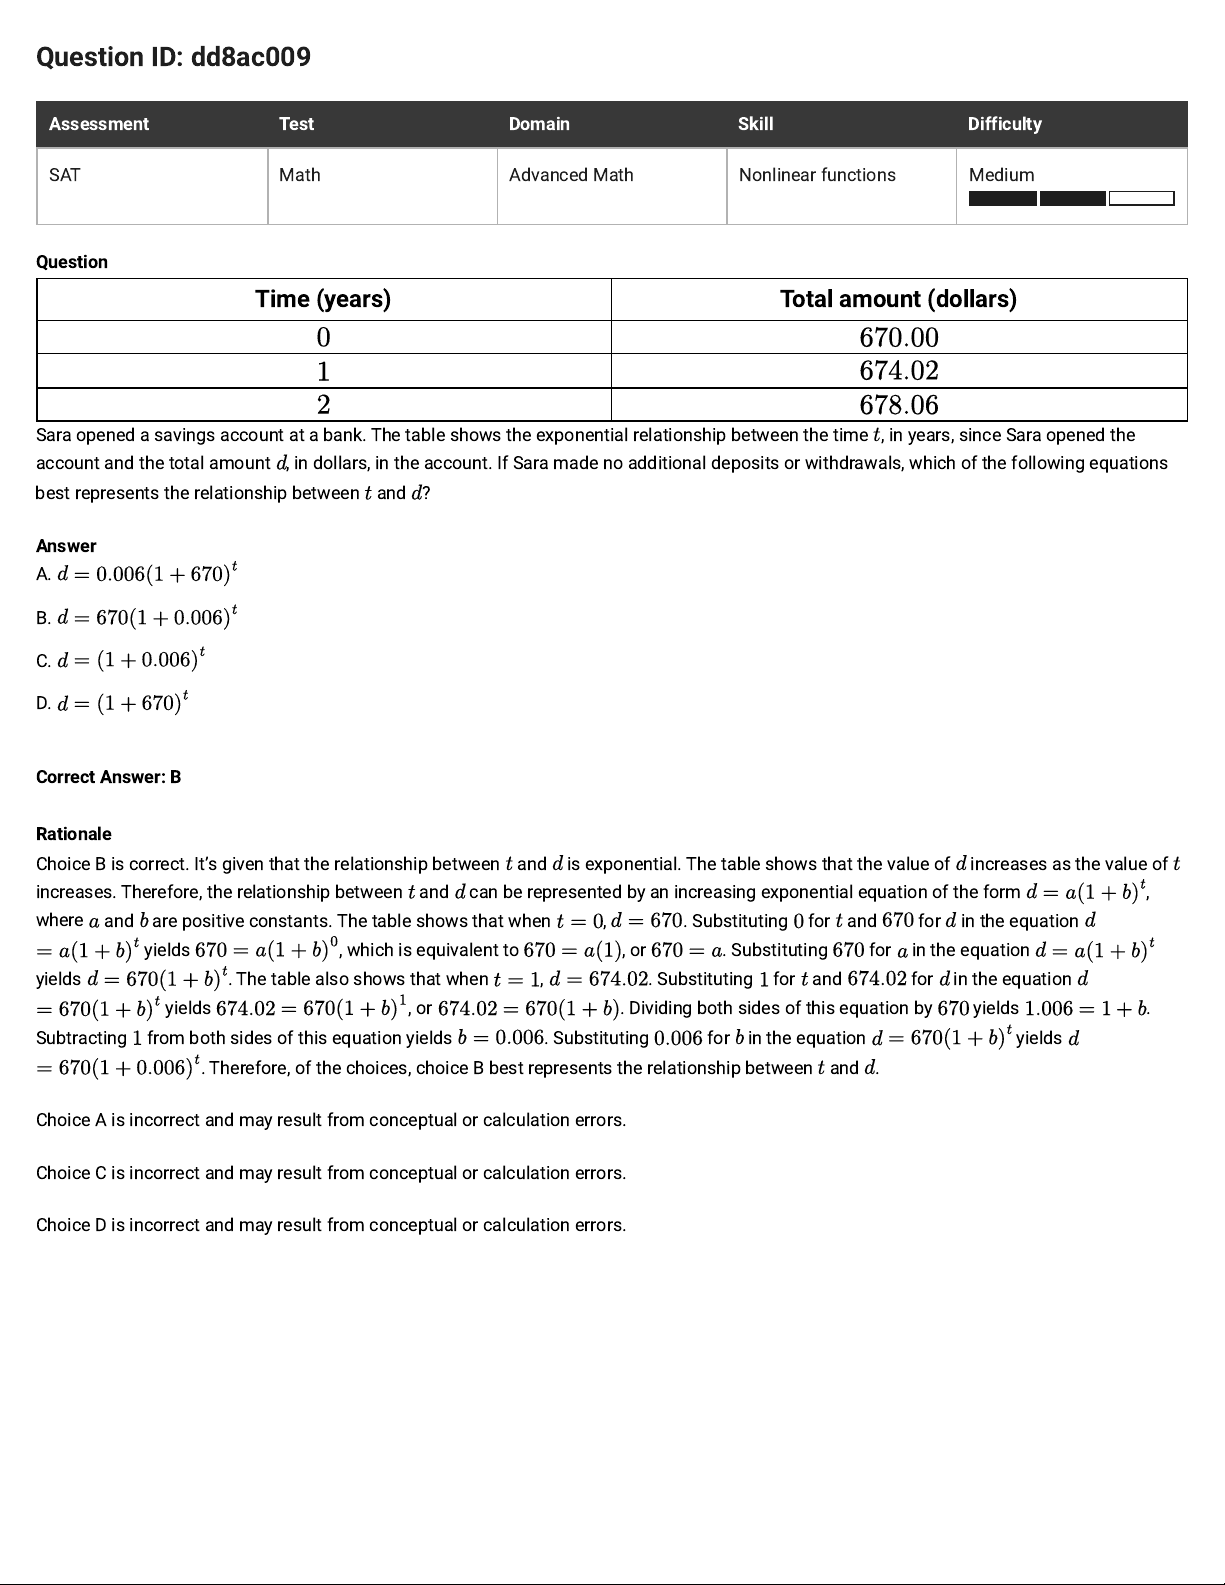
Time (years) Total amount (dollars)
Sara opened a savings account at a bank. The table shows the exponential relationship between the time , in years, since Sara opened the
account and the total amount , in dollars, in the account. If Sara made no additional deposits or withdrawals, which of the following equations
best represents the relationship between and ?
Answer
A.
B.
C.
D.
Correct Answer: B
Rationale
Choice B is correct. It’s given that the relationship between and is exponential. The table shows that the value of increases as the value of
increases. Therefore, the relationship between and can be represented by an increasing exponential equation of the form ,
where
and are positive constants. The table shows that when , . Substituting for and for in the equation
yields
, which is equivalent to
, or
. Substituting for in the equation
yields
. The table also shows that when , . Substituting for and for in the equation
yields
, or
. Dividing both sides of this equation by yields .
Subtracting
from both sides of this equation yields . Substituting for in the equation yields
. Therefore, of the choices, choice B best represents the relationship between and .
Choice A is incorrect and may result from conceptual or calculation errors.
Choice C is incorrect and may result from conceptual or calculation errors.
Choice D is incorrect and may result from conceptual or calculation errors.
Page 52
Question ID: 58dcc59f
Assessment Test Domain Skill Difficulty
SAT Math Advanced Math Nonlinear functions Hard
Question
A landscaper is designing a rectangular garden. The length of the garden is to be 5 feet longer than the width. If the area of the garden will be
104square feet, what will be the length, in feet, of the garden?
Rationale
The correct answer is 13. Let w represent the width of the rectangular garden, in feet. Since the length of the garden will be 5 feet longer than the
width of the garden, the length of the garden will be feet. Thus the area of the garden will be . It is also given that the area of
the garden will be 104 square feet. Therefore, , which is equivalent to . Factoring this equation results
in . Therefore, and . Because width cannot be negative, the width of the garden must be 8 feet. This
means the length of the garden must be feet.
Page 53
Question ID: 84dd43f8
Assessment Test Domain Skill Difficulty
SAT Math Advanced Math Nonlinear functions Hard
Question
For the function , , and for each increase in by , the value of decreases by . What is the value of ?
Correct Answer: 3.44, 86/25
Rationale
The correct answer is . It’s given that
and that for each increase in by , the value of
decreases by . Because the
output of the function decreases by a constant percentage for each -unit increase in the value of , this relationship can be represented by an
exponential function of the form
, where represents the initial value of the function and represents the rate of decay,
expressed as a decimal. Because
, the value of must be . Because the value of
decreases by
for each -unit increase
in , the value of must be , or . Therefore, the function can be defined by . Substituting for in this
function yields
, which is equivalent to , or . Either or
may be entered as the correct
answer.
Alternate approach: It’s given that and that for each increase in by , the value of
decreases by . Therefore, when
,
the value of
is , or , of , which can be expressed as . Since
, the value of is .
Similarly, when
, the value of
is
of , which can be expressed as . Since
, the value of
is . Either or
may be entered as the correct answer.
Page 54
Question ID: 59d1f4b5
Assessment Test Domain Skill Difficulty
SAT Math Advanced Math Nonlinear functions Hard
Question
The equation above models the number of members,M, of a gym t years after the gym opens. Of the following, which equation models the
number of members of the gym q quarter years after the gym opens?
Answer
A.
B.
C.
D.
Correct Answer: A
Rationale
Choice A is correct. In 1 year, there are 4 quarter years, so the number of quarter years, q, is 4 times the number of years, t ; that is, . This
is equivalent to , and substituting this into the expression for M in terms of t gives .
Choices B and D are incorrect and may be the result of incorrectly using instead of . (Choices B and D are nearly the same since
is equivalent to , which is approximately .) Choice C is incorrect and may be the result of incorrectly using
and unnecessarily dividing 0.02 by 4.
Page 55
Question ID: 281a4f3b
Assessment Test Domain Skill Difficulty
SAT Math Advanced Math Nonlinear functions Medium
Question
A certain college had 3,000 students enrolled in 2015. The college predicts that after 2015, the number of students enrolled each year will be
2%less than the number of students enrolled the year before. Which of the following functions models the relationship between the number of
students enrolled, , and the number of years after 2015, x?
Answer
A.
B.
C.
D.
Correct Answer: D
Rationale
Choice D is correct. Because the change in the number of students decreases by the same percentage each year, the relationship between the
number of students and the number of years can be modeled with a decreasing exponential function in the form , where
is the number of students, a is the number of students in 2015, r is the rate of decrease each year, and x is the number of years since 2015.
It’s given that 3,000 students were enrolled in 2015 and that the rate of decrease is predicted to be 2%, or 0.02. Substituting these values into the
decreasing exponential function yields , which is equivalent to .
Choices A, B, and C are incorrect and may result from conceptual errors when translating the given information into a decreasing exponential
function.
Page 56
Question ID: 100030d9
Assessment Test Domain Skill Difficulty
SAT Math Advanced Math Nonlinear functions Medium
Question
A rubber ball bounces upward one-half the height that it falls each time it hits the ground. If the ball was originally dropped from a distance of
20.0 feet above the ground, what was its maximum height above the ground, in feet, between the third and fourth time it hit the ground?
Rationale
The correct answer is 2.5. After hitting the ground once, the ball bounces to feet. After hitting the ground a second time, the
ball bounces to feet. After hitting the ground for the third time, the ball bounces to feet. Note that 2.5 and 5/2
are examples of ways to enter a correct answer.
Page 57
Question ID: d84a514a
Assessment Test Domain Skill Difficulty
SAT Math Advanced Math Nonlinear functions Easy
Question
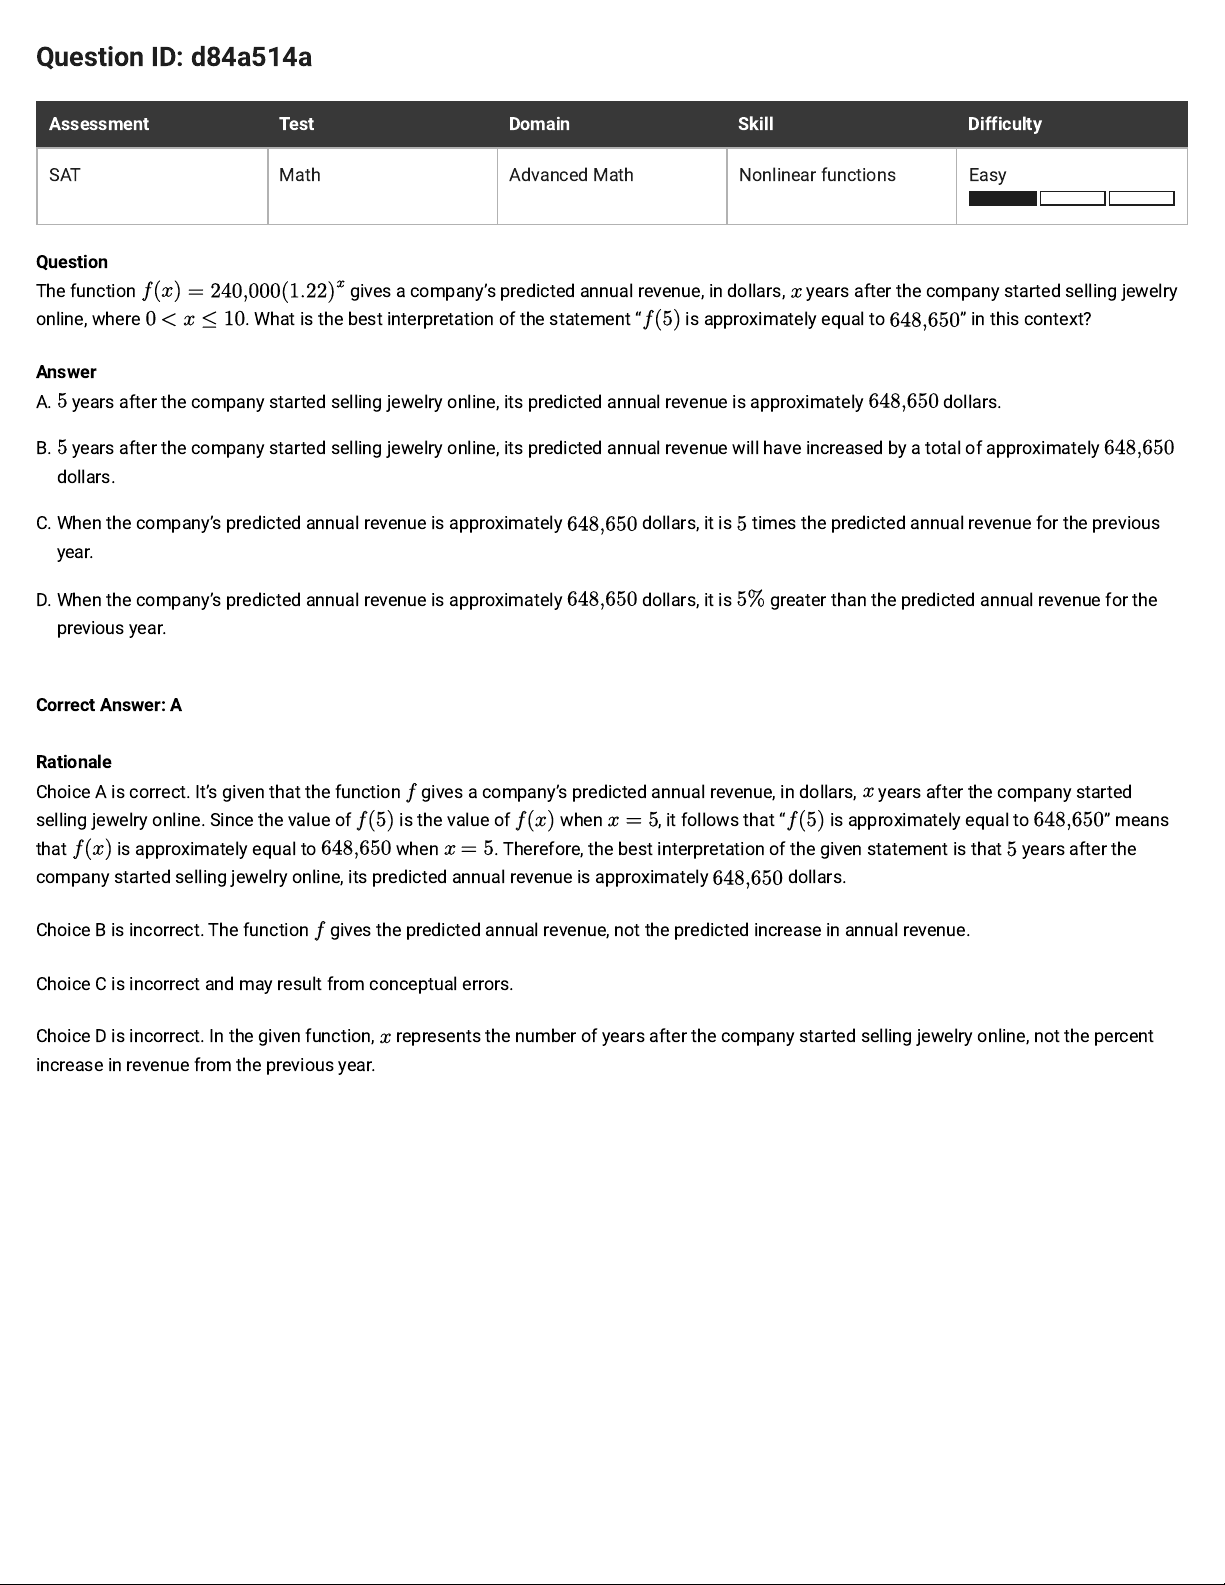
The function gives a company’s predicted annual revenue, in dollars, years after the company started selling jewelry
online, where . What is the best interpretation of the statement
“
is approximately equal to
”
in this context?
Answer
A. years after the company started selling jewelry online, its predicted annual revenue is approximately dollars.
B. years after the company started selling jewelry online, its predicted annual revenue will have increased by a total of approximately
dollars.
C. When the company’s predicted annual revenue is approximately dollars, it is times the predicted annual revenue for the previous
year.
D. When the company’s predicted annual revenue is approximately dollars, it is greater than the predicted annual revenue for the
previous year.
Correct Answer: A
Rationale
Choice A is correct. It’s given that the function gives a company’s predicted annual revenue, in dollars, years after the company started
selling jewelry online. Since the value of is the value of when , it follows that
“
is approximately equal to
”
means
that is approximately equal to when . Therefore, the best interpretation of the given statement is that years after the
company started selling jewelry online, its predicted annual revenue is approximately dollars.
Choice B is incorrect. The function gives the predicted annual revenue, not the predicted increase in annual revenue.
Choice C is incorrect and may result from conceptual errors.
Choice D is incorrect. In the given function, represents the number of years after the company started selling jewelry online, not the percent
increase in revenue from the previous year.
Page 58
Question ID: c7a187a7
Assessment Test Domain Skill Difficulty
SAT Math Advanced Math Nonlinear functions Medium
Question
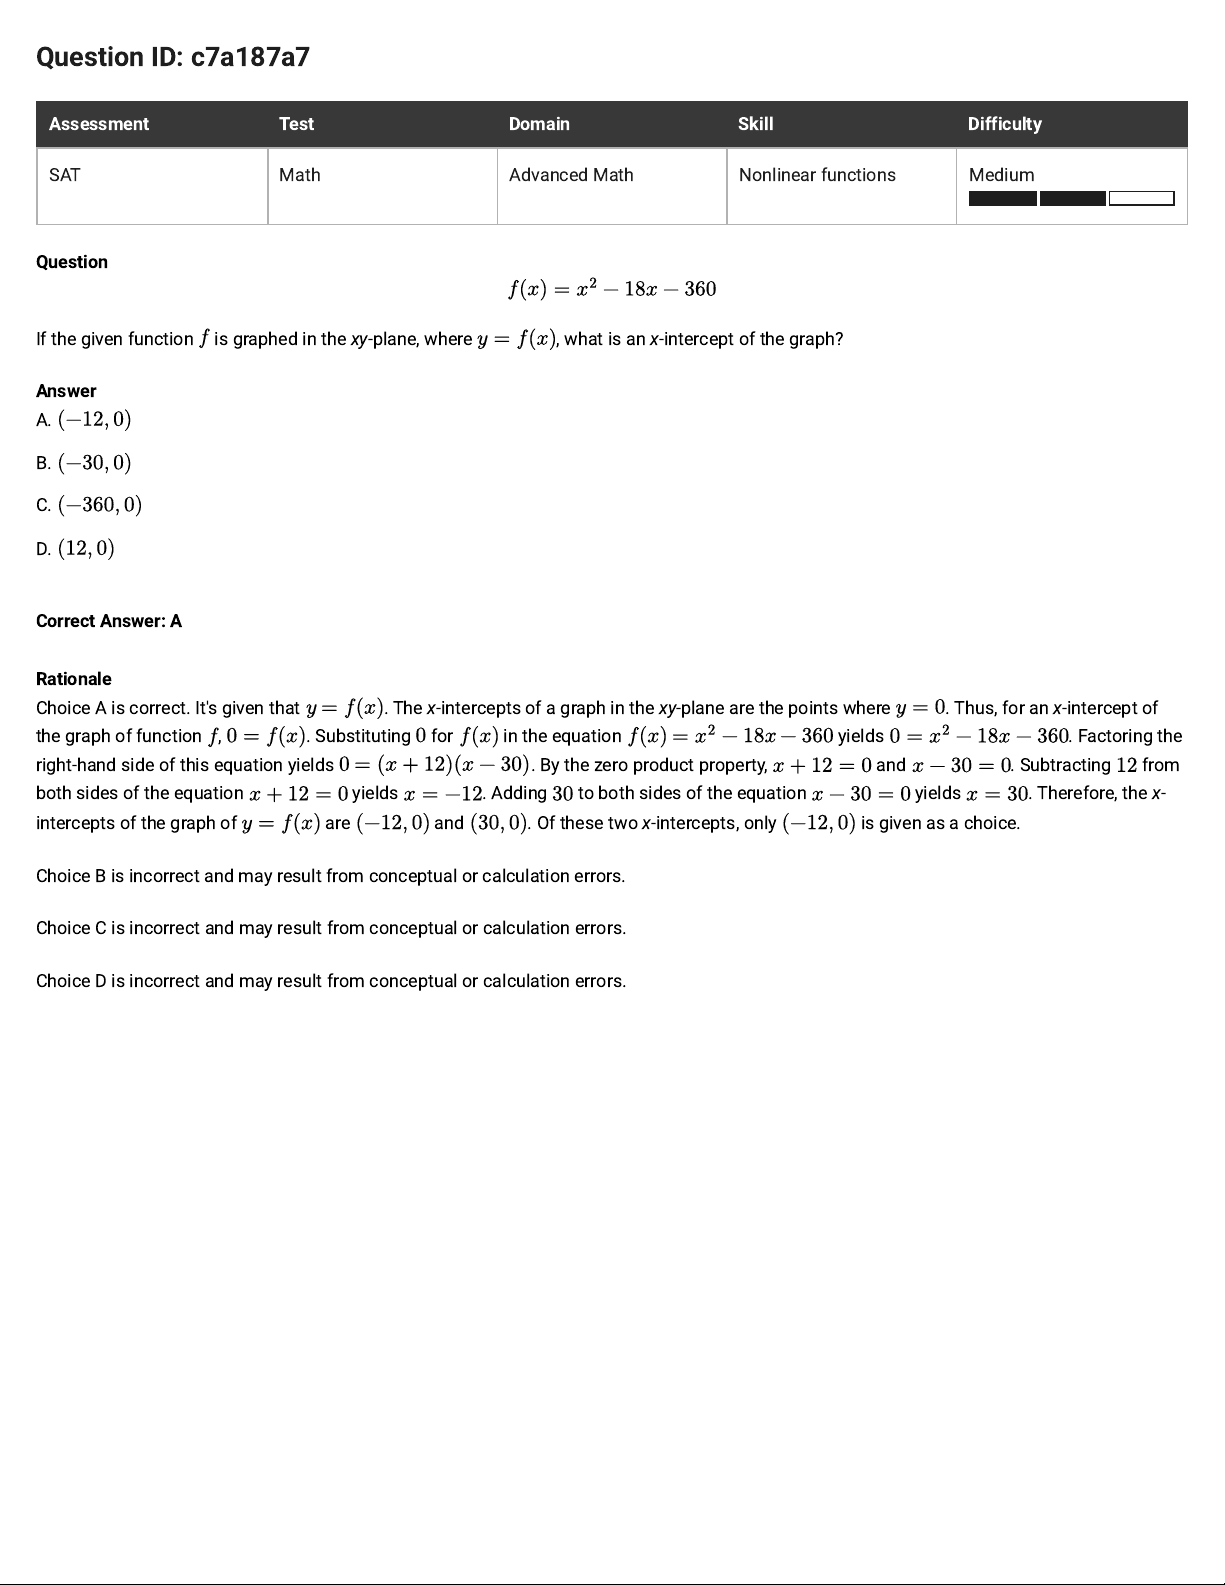
If the given function is graphed in the xy-plane, where , what is an x-intercept of the graph?
Answer
A.
B.
C.
D.
Correct Answer: A
Rationale
Choice A is correct.It's given that
. The x-intercepts of a graph in the xy-plane are the points where . Thus, for an x-intercept of
the graph of function , . Substituting for in the equation
yields . Factoring the
right-hand side of this equation yields . By the zero product property, and . Subtracting from
both sides of the equation yields . Adding to both sides of the equation yields . Therefore, the x-
intercepts of the graph of
are
and . Of these two x-intercepts, only
is given as a choice.
Choice B is incorrect and may result from conceptual or calculation errors.
Choice C is incorrect and may result from conceptual or calculation errors.
Choice D is incorrect and may result from conceptual or calculation errors.
Page 59
Question ID: ebe4bde0
Assessment Test Domain Skill Difficulty
SAT Math Advanced Math Nonlinear functions Easy
Question
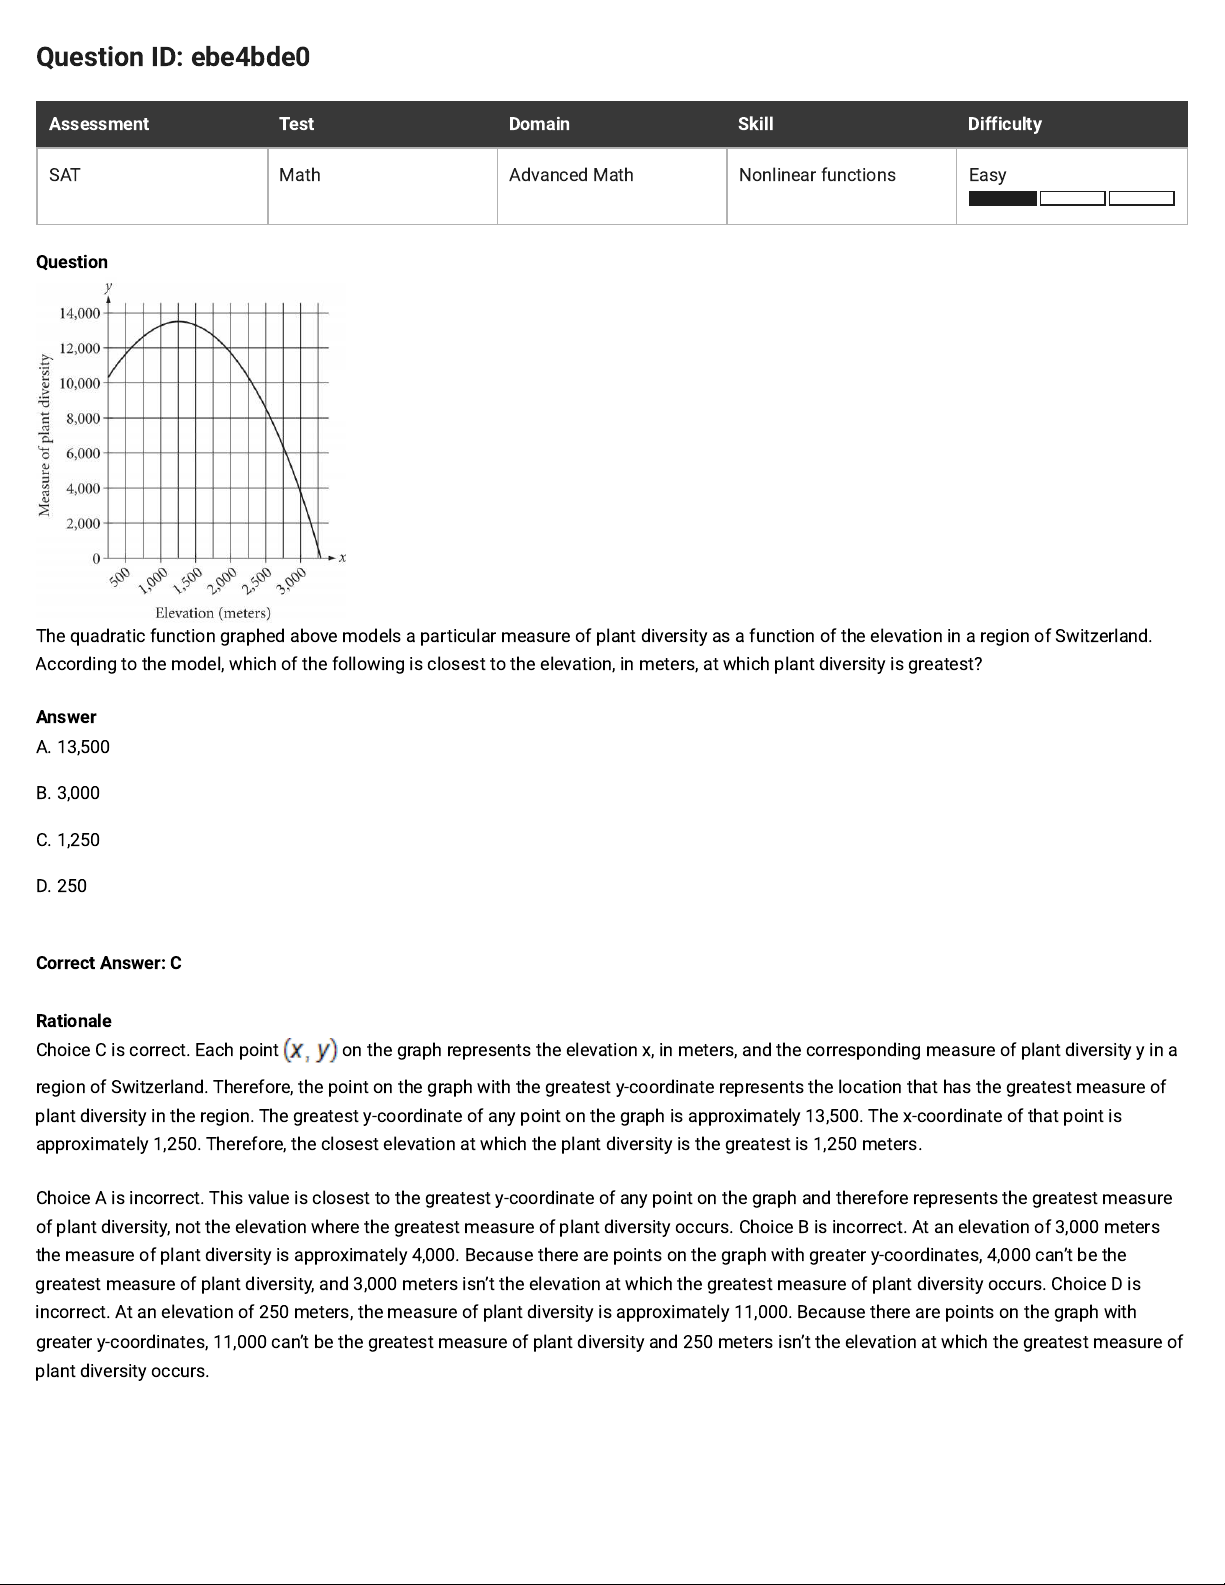
The quadratic function graphed above models a particular measure of plant diversity as a function of the elevation in a region of Switzerland.
According to the model, which of the following is closest to the elevation, in meters, at which plant diversity is greatest?
Answer
A. 13,500
B. 3,000
C. 1,250
D. 250
Correct Answer: C
Rationale
Choice C is correct. Each point on the graph represents the elevation x, in meters, and the corresponding measure of plant diversity y in a
region of Switzerland. Therefore, the point on the graph with the greatest y-coordinate represents the location that has the greatest measure of
plant diversity in the region. The greatest y-coordinate of any point on the graph is approximately 13,500. The x-coordinate of that point is
approximately 1,250. Therefore, the closest elevation at which the plant diversity is the greatest is 1,250 meters.
Choice A is incorrect. This value is closest to the greatest y-coordinate of any point on the graph and therefore represents the greatest measure
of plant diversity, not the elevation where the greatest measure of plant diversity occurs. Choice B is incorrect. At an elevation of 3,000 meters
the measure of plant diversity is approximately 4,000. Because there are points on the graph with greater y-coordinates, 4,000 can’t be the
greatest measure of plant diversity, and 3,000 meters isn’t the elevation at which the greatest measure of plant diversity occurs. Choice D is
incorrect. At an elevation of 250 meters, the measure of plant diversity is approximately 11,000. Because there are points on the graph with
greater y-coordinates, 11,000 can’t be the greatest measure of plant diversity and 250 meters isn’t the elevation at which the greatest measure of
plant diversity occurs.
Page 60
Question ID: 635f54ee
Assessment Test Domain Skill Difficulty
SAT Math Advanced Math Nonlinear functions Hard
Question
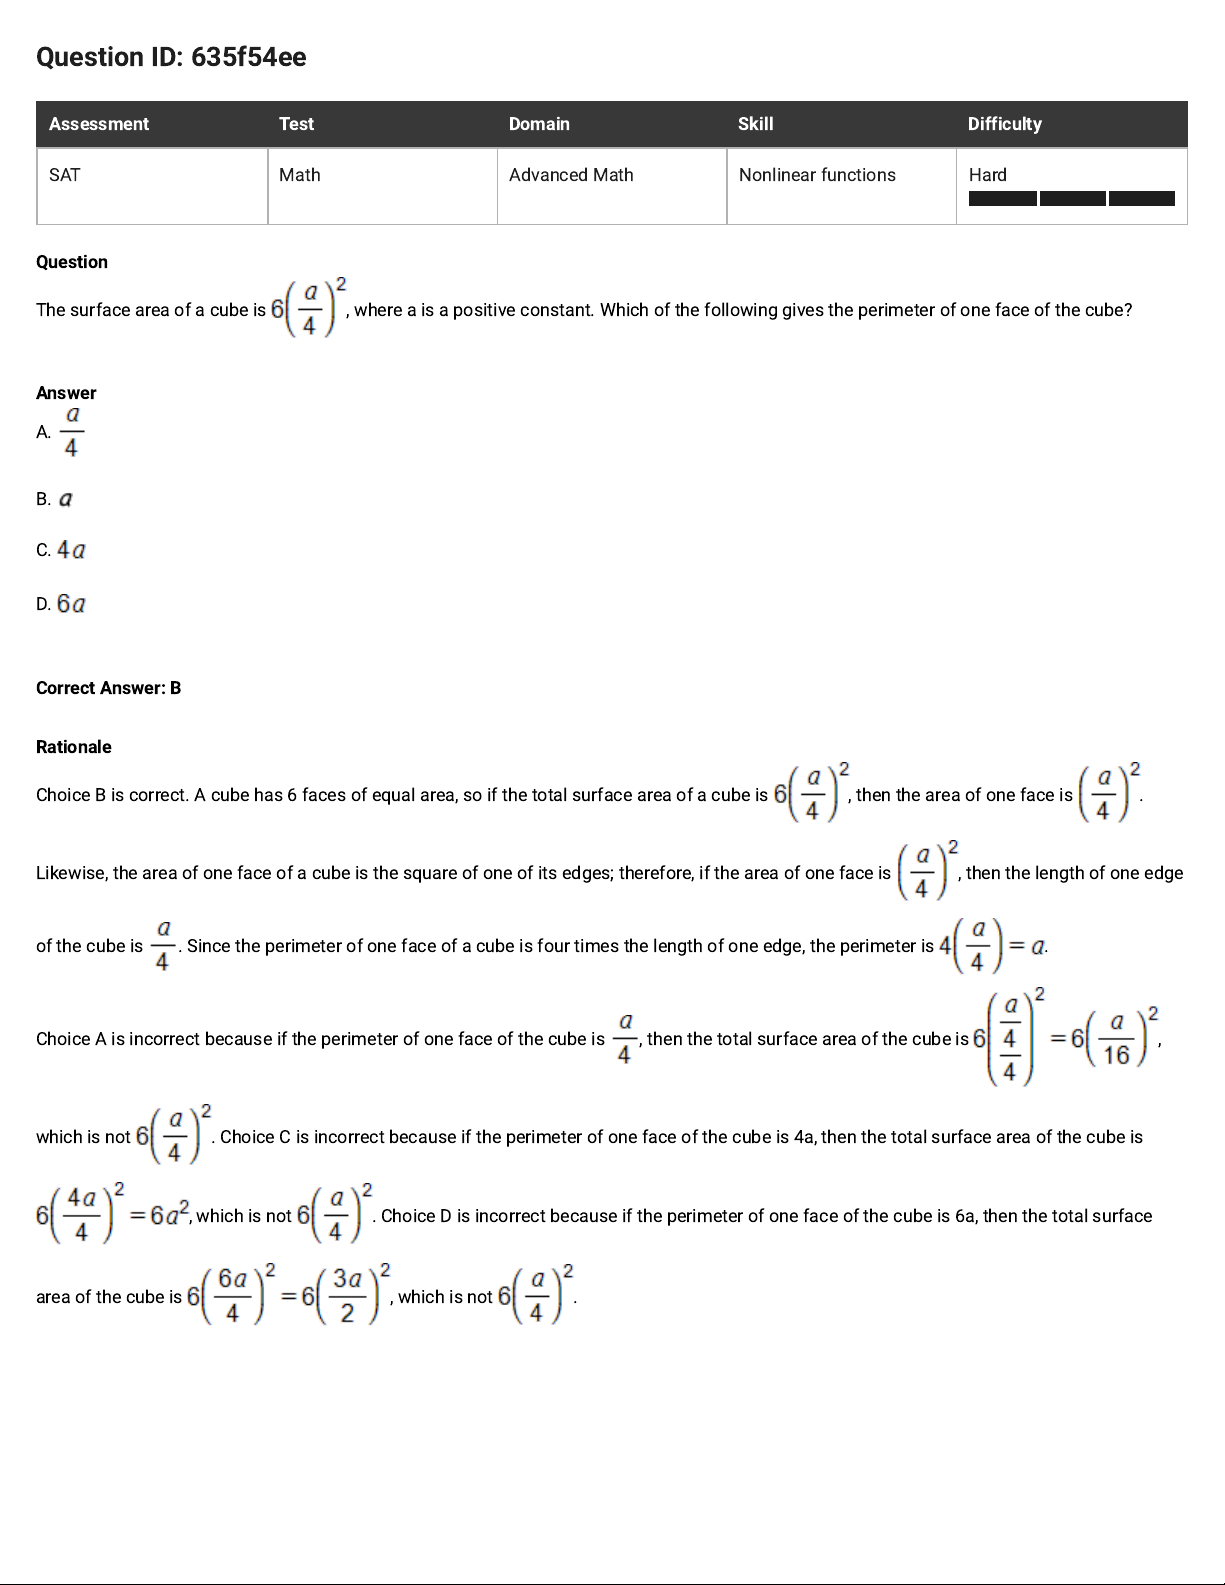
The surface area of a cube is , where a is a positive constant. Which of the following gives the perimeter of one face of thecube?
Answer
A.
B.
C.
D.
Correct Answer: B
Rationale
Choice B is correct. A cube has 6 faces of equal area, so if the total surface area of a cube is , then the area of one face is .
Likewise, the area of one face of a cube is the square of one of its edges; therefore, if the area of one face is , then the length of one edge
of the cube is . Since the perimeter of one face of a cube is four times the length of one edge, the perimeter is .
Choice A is incorrect because if the perimeter of one face of the cube is , then the total surface area of the cube is ,
which is not . Choice C is incorrect because if the perimeter of one face of the cube is 4a, then the total surface area of the cube is
, which is not . Choice D is incorrect because if the perimeter of one face of the cube is 6a, then the total surface
area of the cube is , which is not .
Page 61
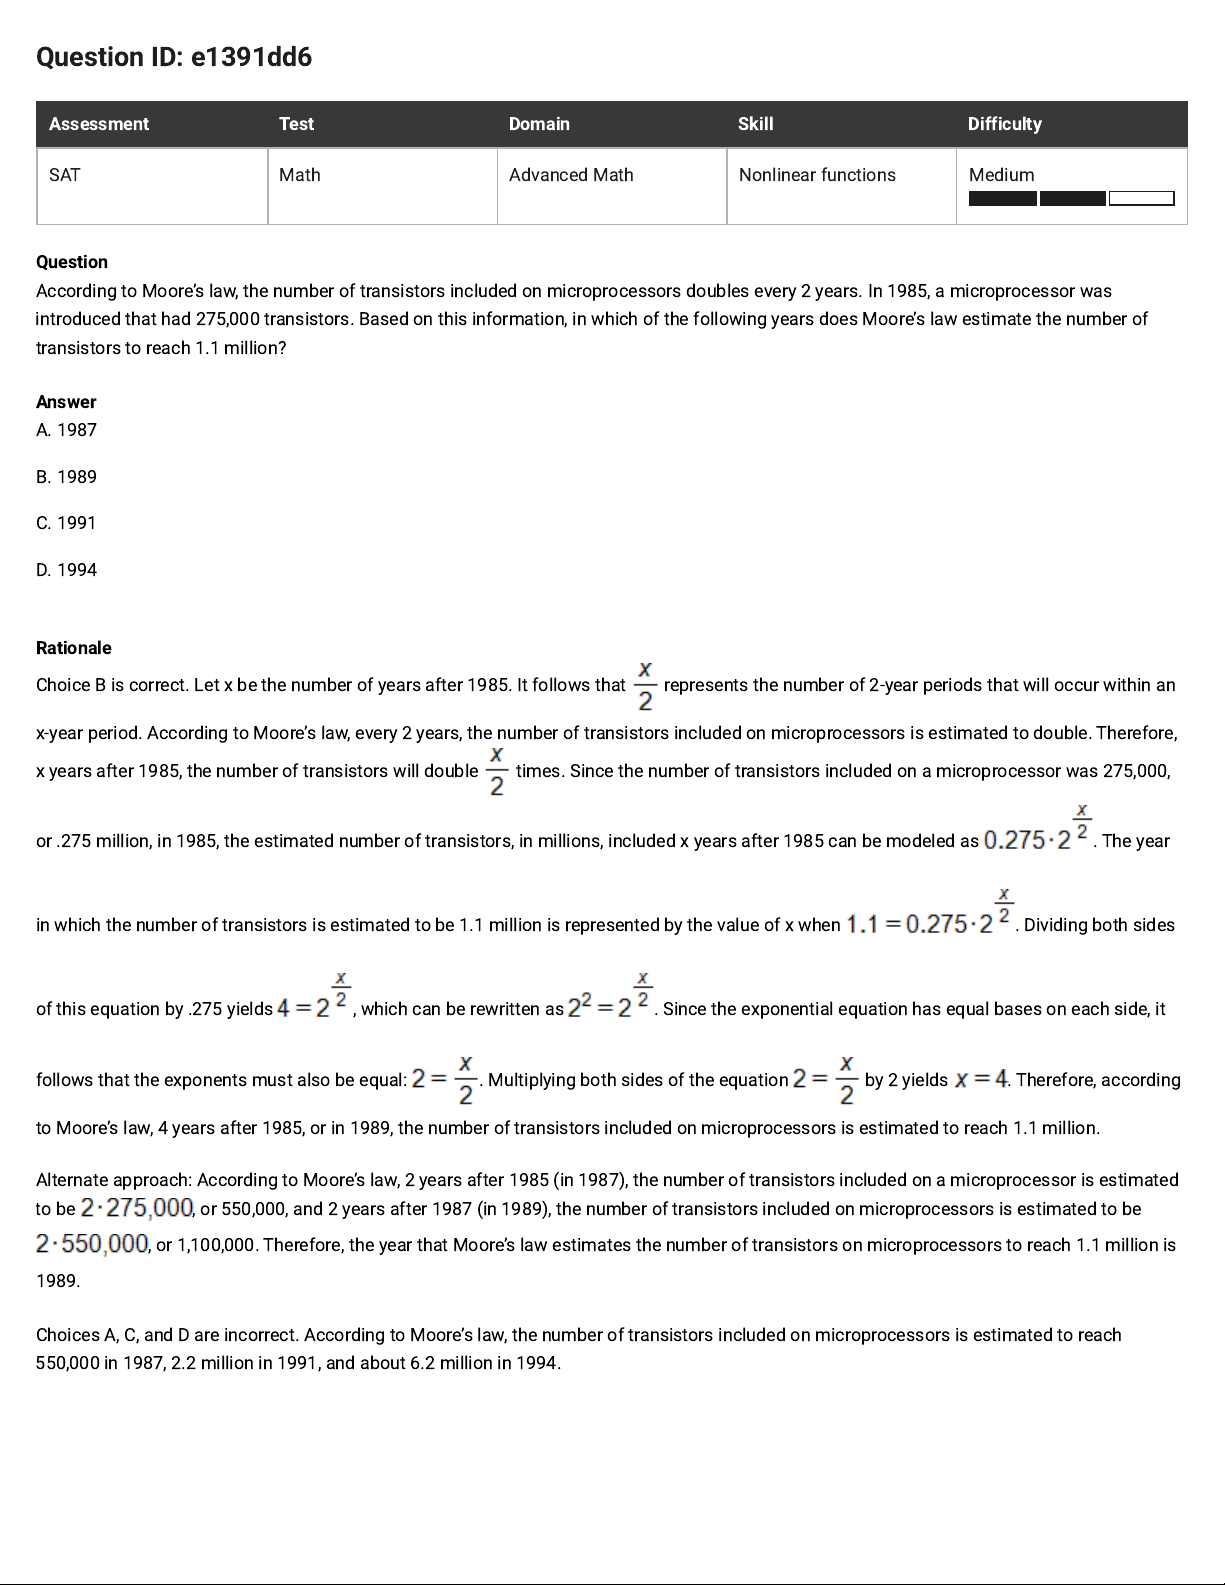
Question ID: e1391dd6
Assessment Test Domain Skill Difficulty
SAT Math Advanced Math Nonlinear functions Medium
Question
According to Moore’s law, the number of transistors included on microprocessors doubles every 2 years. In 1985, a microprocessor was
introduced that had 275,000 transistors. Based on this information, in which of the following years does Moore’s law estimate the number of
transistors to reach 1.1million?
Answer
A. 1987
B. 1989
C. 1991
D. 1994
Rationale
Choice B is correct. Let x be the number of years after 1985. It follows that represents the number of 2-year periods that will occur within an
x-year period. According to Moore’s law, every 2 years, the number of transistors included on microprocessors is estimated to double. Therefore,
x years after 1985, the number of transistors will double times. Since the number of transistors included on a microprocessor was 275,000,
or .275 million, in 1985, the estimated number of transistors, in millions, included x years after 1985 can be modeled as . The year
in which the number of transistors is estimated to be 1.1 million is represented by the value of x when . Dividing both sides
of this equation by .275 yields , which can be rewritten as . Since the exponential equation has equal bases on each side, it
follows that the exponents must also be equal: . Multiplying both sides of the equation by 2 yields . Therefore, according
to Moore’s law, 4 years after 1985, or in 1989, the number of transistors included on microprocessors is estimated to reach 1.1 million.
Alternate approach: According to Moore’s law, 2 years after 1985 (in 1987), the number of transistors included on a microprocessor is estimated
to be , or 550,000, and 2 years after 1987 (in 1989), the number of transistors included on microprocessors is estimated to be
, or 1,100,000. Therefore, the year that Moore’s law estimates the number of transistors on microprocessors to reach 1.1 million is
1989.
Choices A, C, and D are incorrect. According to Moore’s law, the number of transistors included on microprocessors is estimated to reach
550,000 in 1987, 2.2 million in 1991, and about 6.2 million in 1994.
Page 62
Question ID: d46da42c
Assessment Test Domain Skill Difficulty
SAT Math Advanced Math Nonlinear functions Easy
Question
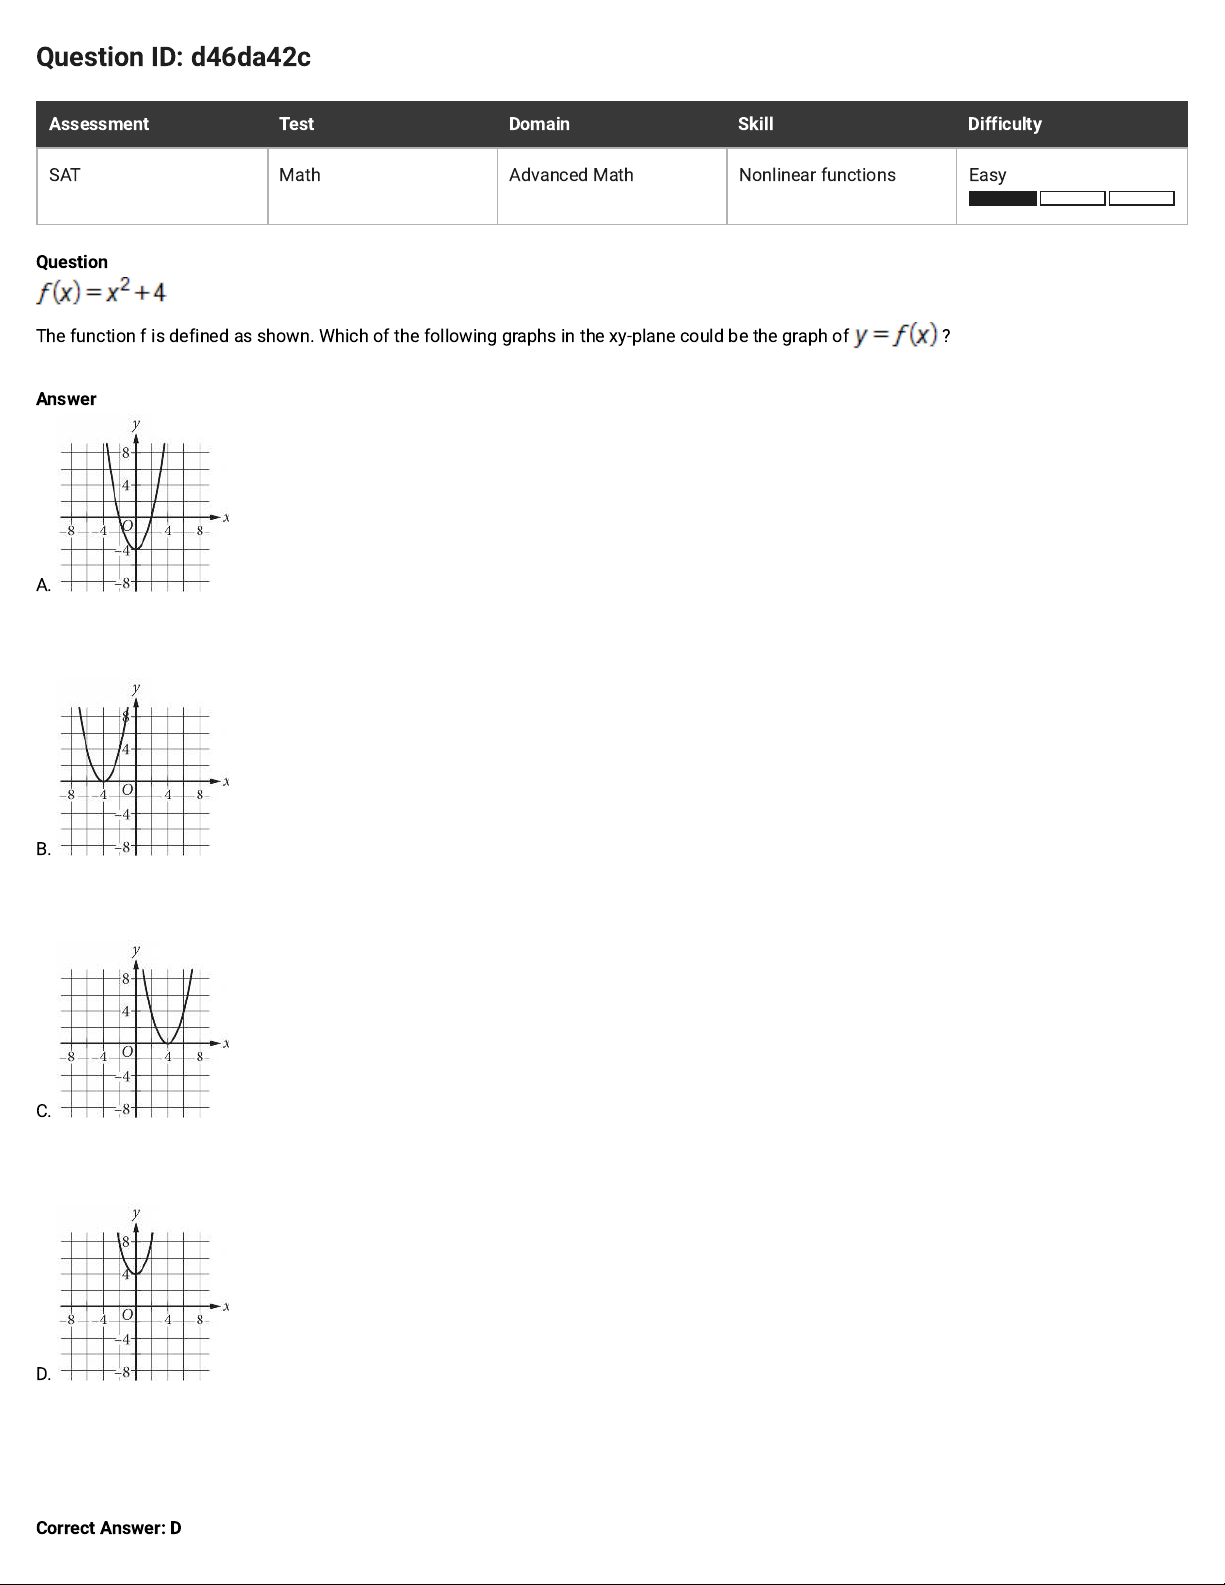
The function f is defined as shown. Which of the following graphs in the xy-plane could be the graph of ?
Answer
A.
B.
C.
D.
Correct Answer: D
Page 63
Rationale
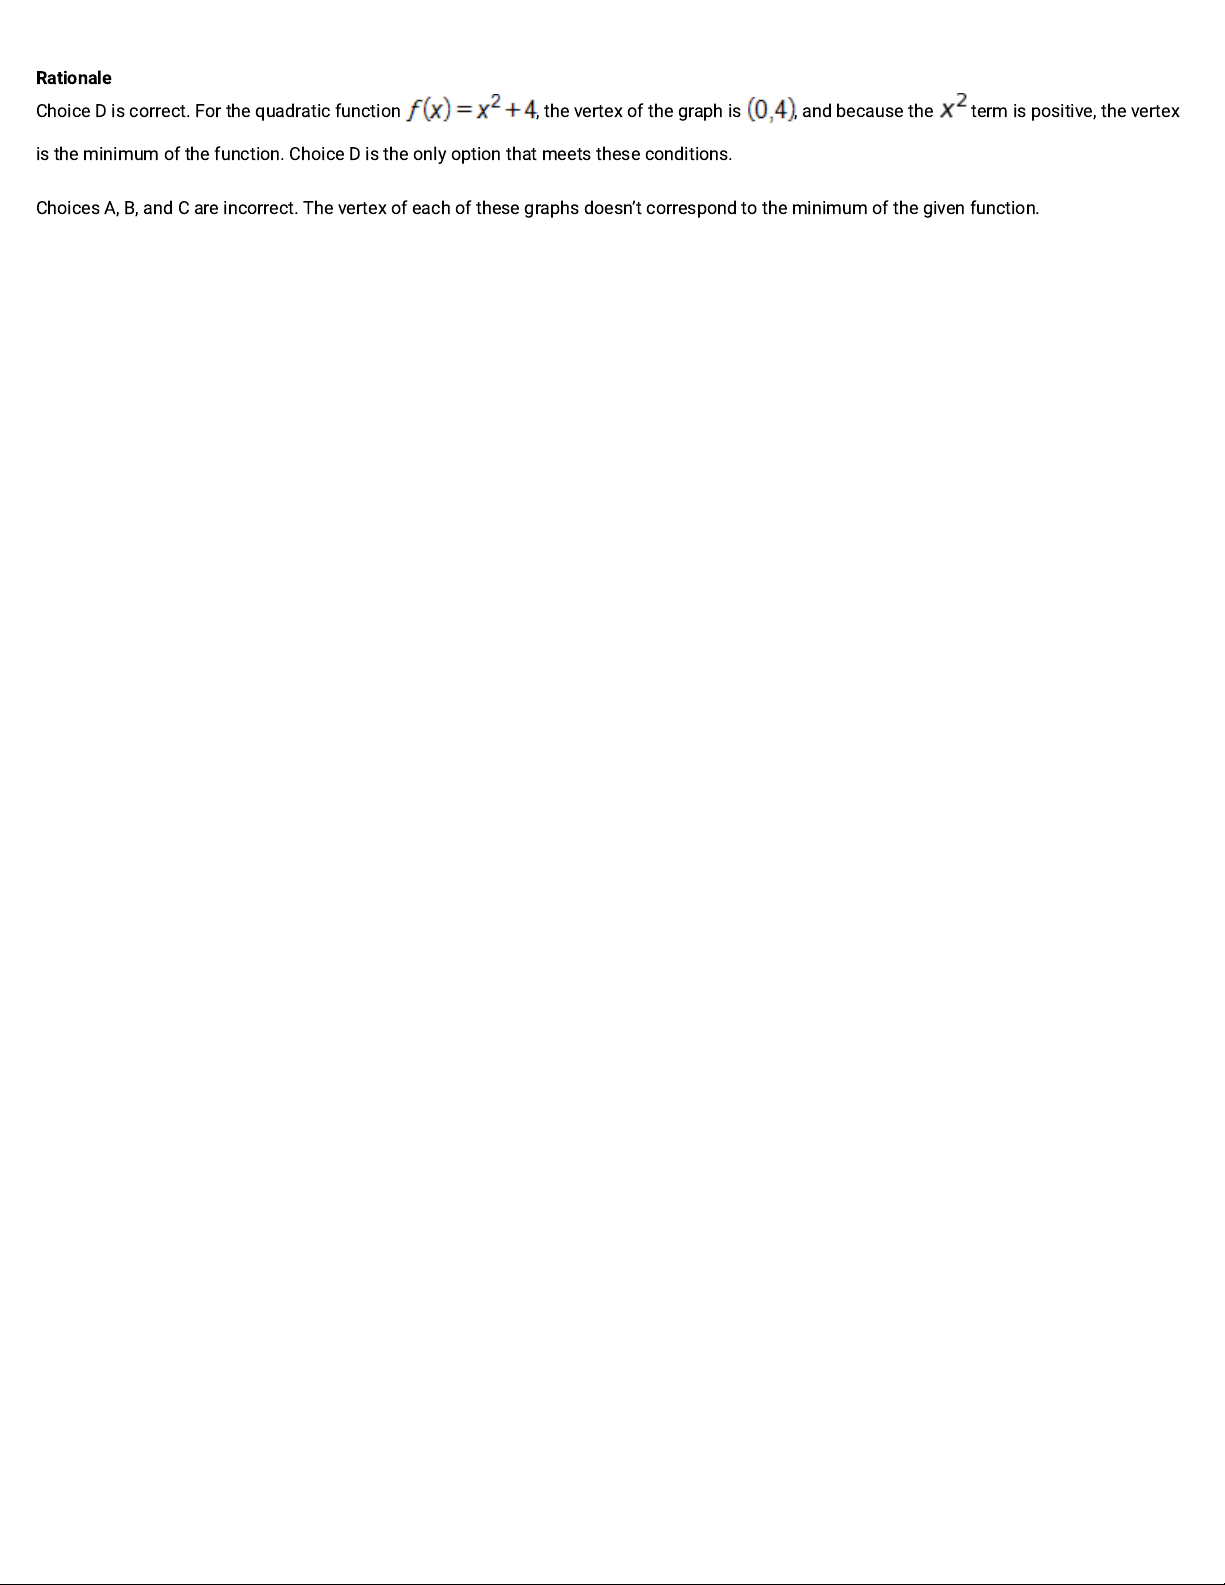
Choice D is correct. For the quadratic function , the ver tex of the graph is , and because the term is positive, the vertex
is the minimum of the function. Choice D is the only option that meets these conditions.
Choices A, B, and C are incorrect. The vertex of each of these graphs doesn’t correspond to the minimum of the given function.
Page 64
Question ID: 5bf0f84a
Assessment Test Domain Skill Difficulty
SAT Math Advanced Math Nonlinear functions Medium
Question
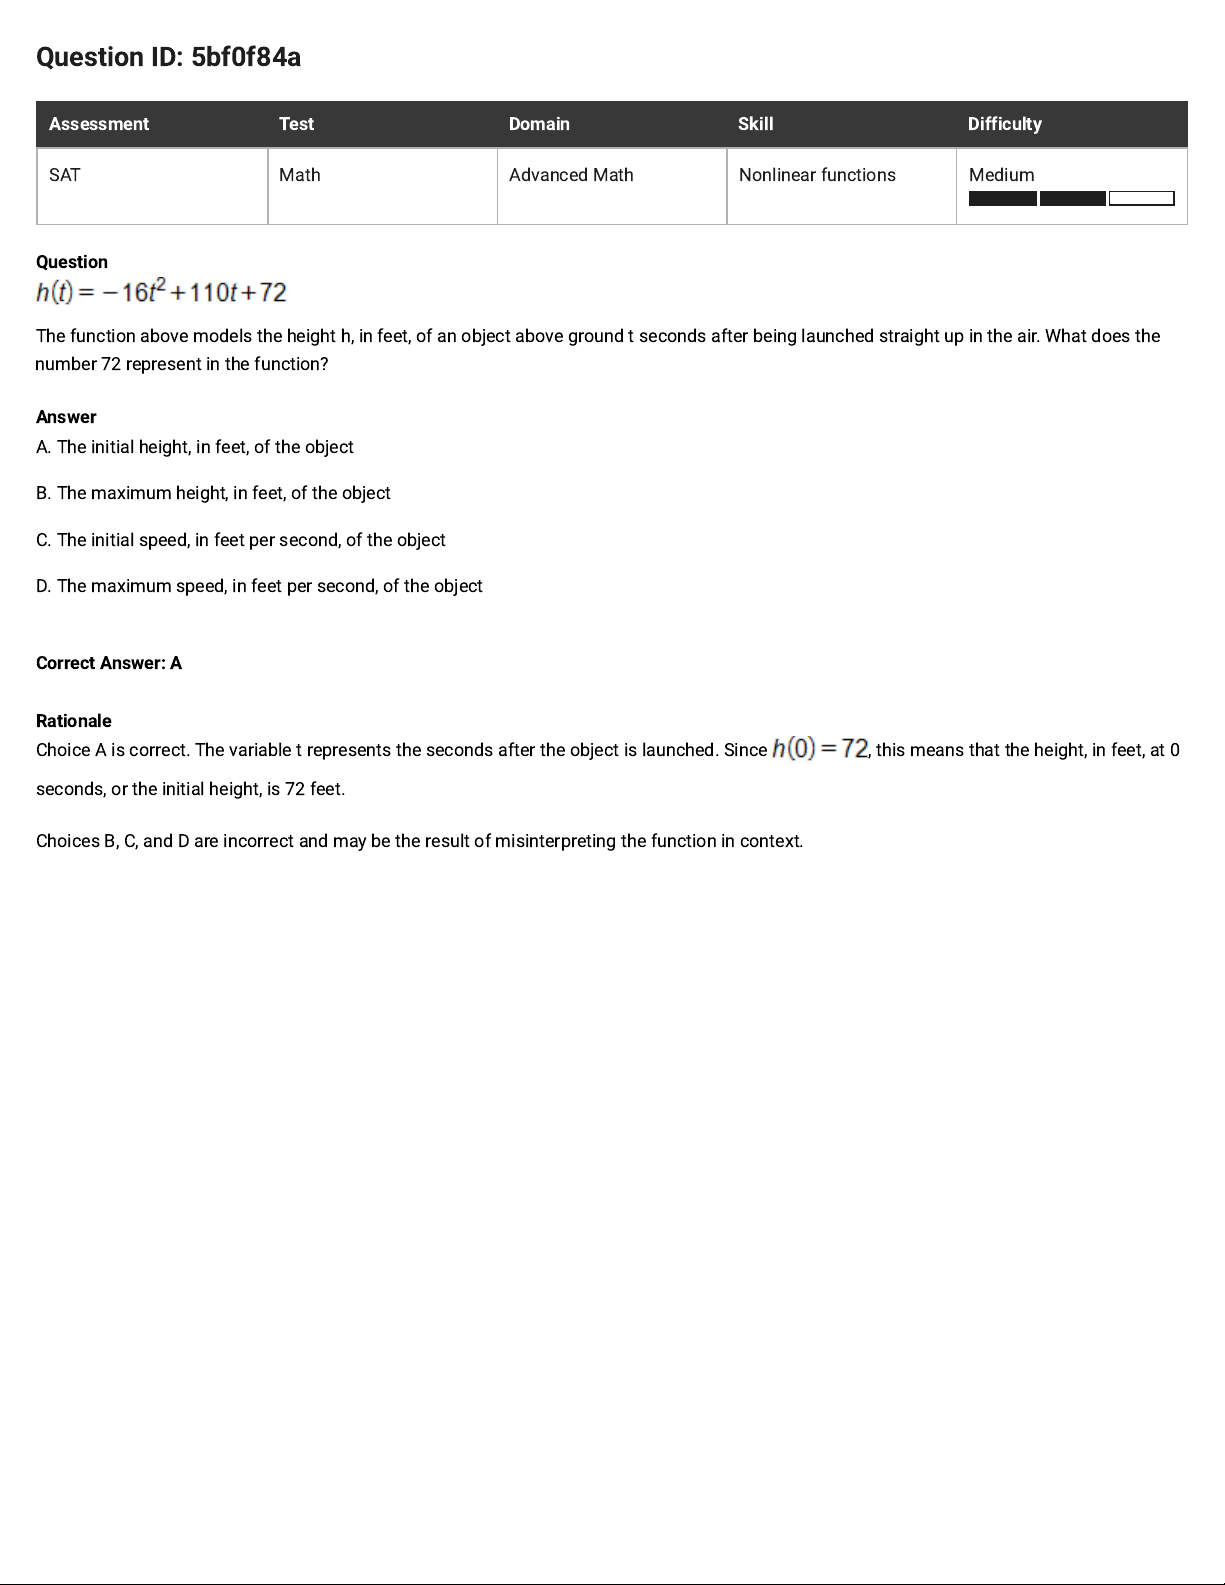
The function above models the height h, in feet, of an object above ground tseconds after being launched straight up in the air. What does the
number 72 represent in the function?
Answer
A. The initial height, in feet, of the object
B. The maximum height, in feet, of the object
C. The initial speed, in feet per second, of the object
D. The maximum speed, in feet per second, of the object
Correct Answer: A
Rationale
Choice A is correct. The variable t represents the seconds after the object is launched. Since , this means that the height, in feet, at 0
seconds, or the initial height, is 72 feet.
Choices B, C, and D are incorrect and may be the result of misinterpreting the function in context.
Page 65
Question ID: 70ebd3d0
Assessment Test Domain Skill Difficulty
SAT Math Advanced Math Nonlinear functions Medium
Question
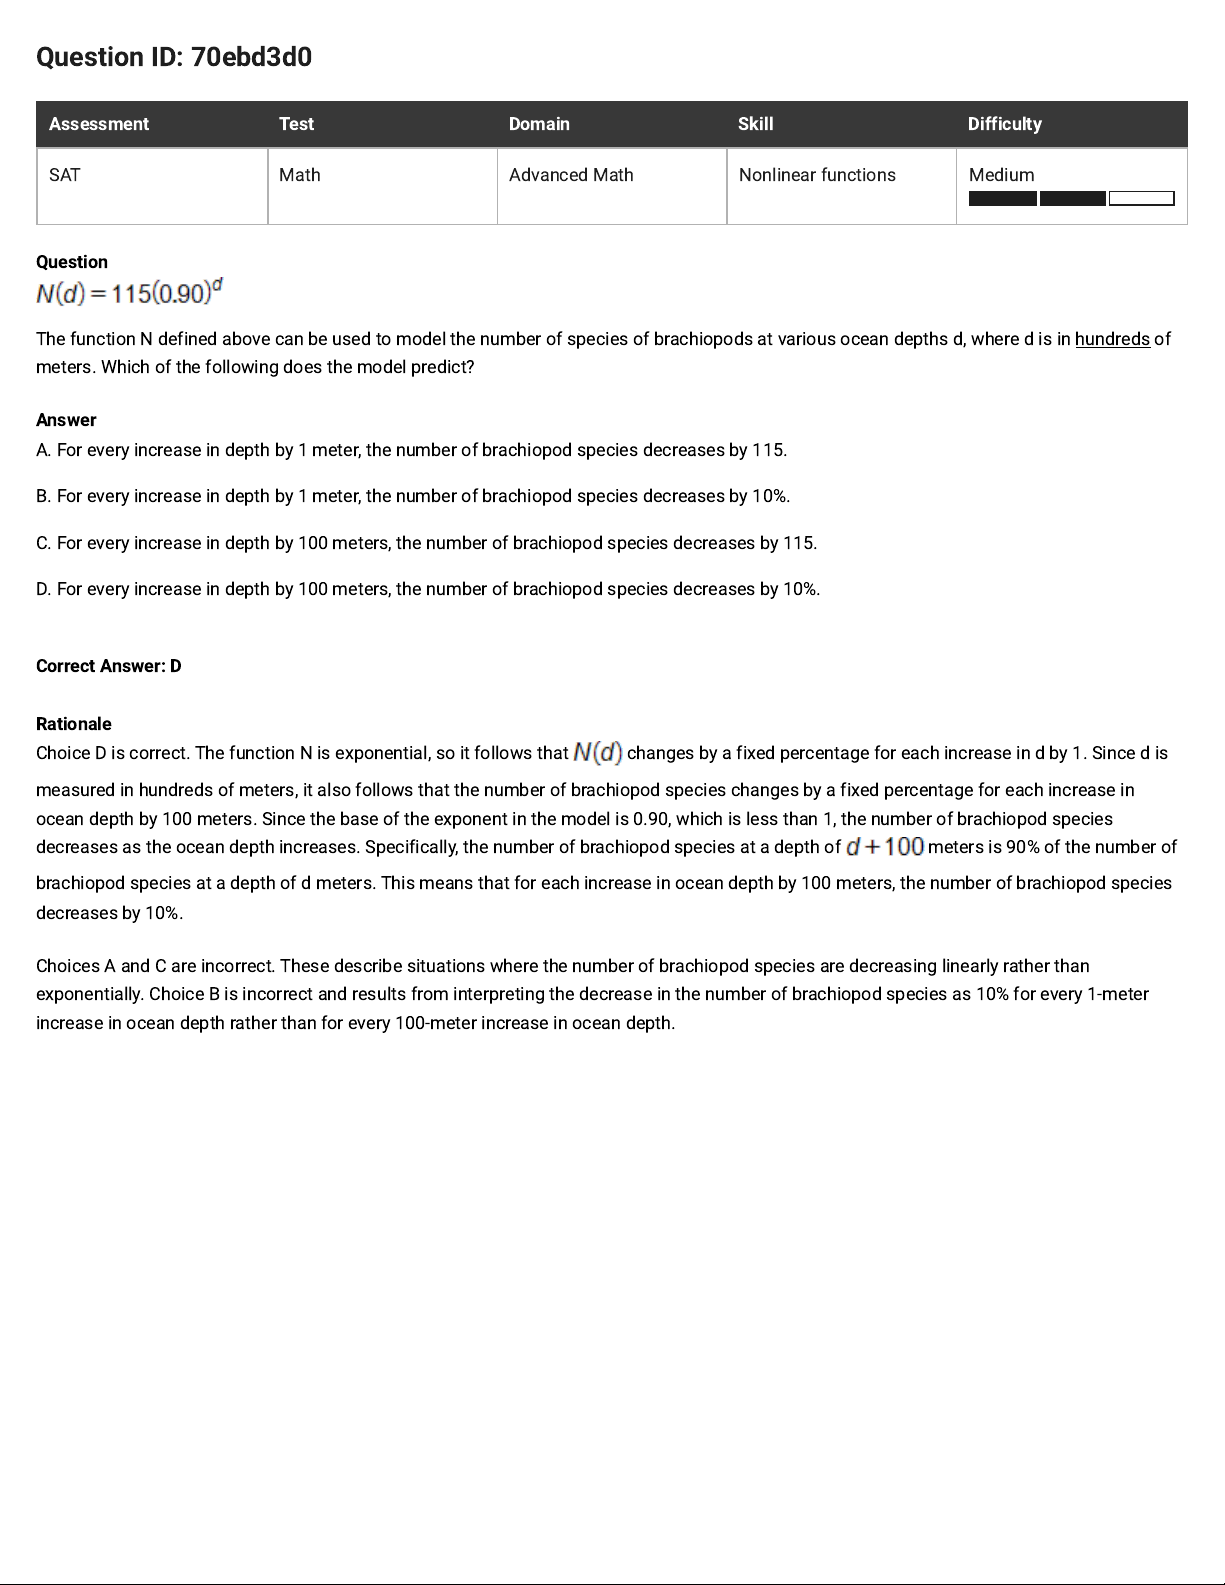
The function N defined above can be used to model the number of species of brachiopods at various ocean depths d, where d is in hundreds of
meters. Which of the following does the model predict?
Answer
A. For every increase in depth by 1 meter, the number of brachiopod species decreases by 115.
B. For every increase in depth by 1 meter, the number of brachiopod species decreases by 10%.
C. For every increase in depth by 100 meters, the number of brachiopod species decreases by 115.
D. For every increase in depth by 100 meters, the number of brachiopod species decreases by 10%.
Correct Answer: D
Rationale
Choice D is correct. The function N is exponential, so it follows that changes by a fixed percentage for each increase in d by 1. Since d is
measured in hundreds of meters, it also follows that the number of brachiopod species changes by a fixed percentage for each increase in
ocean depth by 100 meters. Since the base of the exponent in the model is 0.90, which is less than 1, the number of brachiopod species
decreases as the ocean depth increases. Specifically, the number of brachiopod species at a depth of meters is 90% of the number of
brachiopod species at a depth of d meters. This means that for each increase in ocean depth by 100 meters, the number of brachiopod species
decreases by 10%.
Choices A and C are incorrect. These describe situations where the number of brachiopod species are decreasing linearly rather than
exponentially. Choice B is incorrect and results from interpreting the decrease in the number of brachiopod species as 10% for every 1-meter
increase in ocean depth rather than for every 100-meter increase in ocean depth.
Page 66
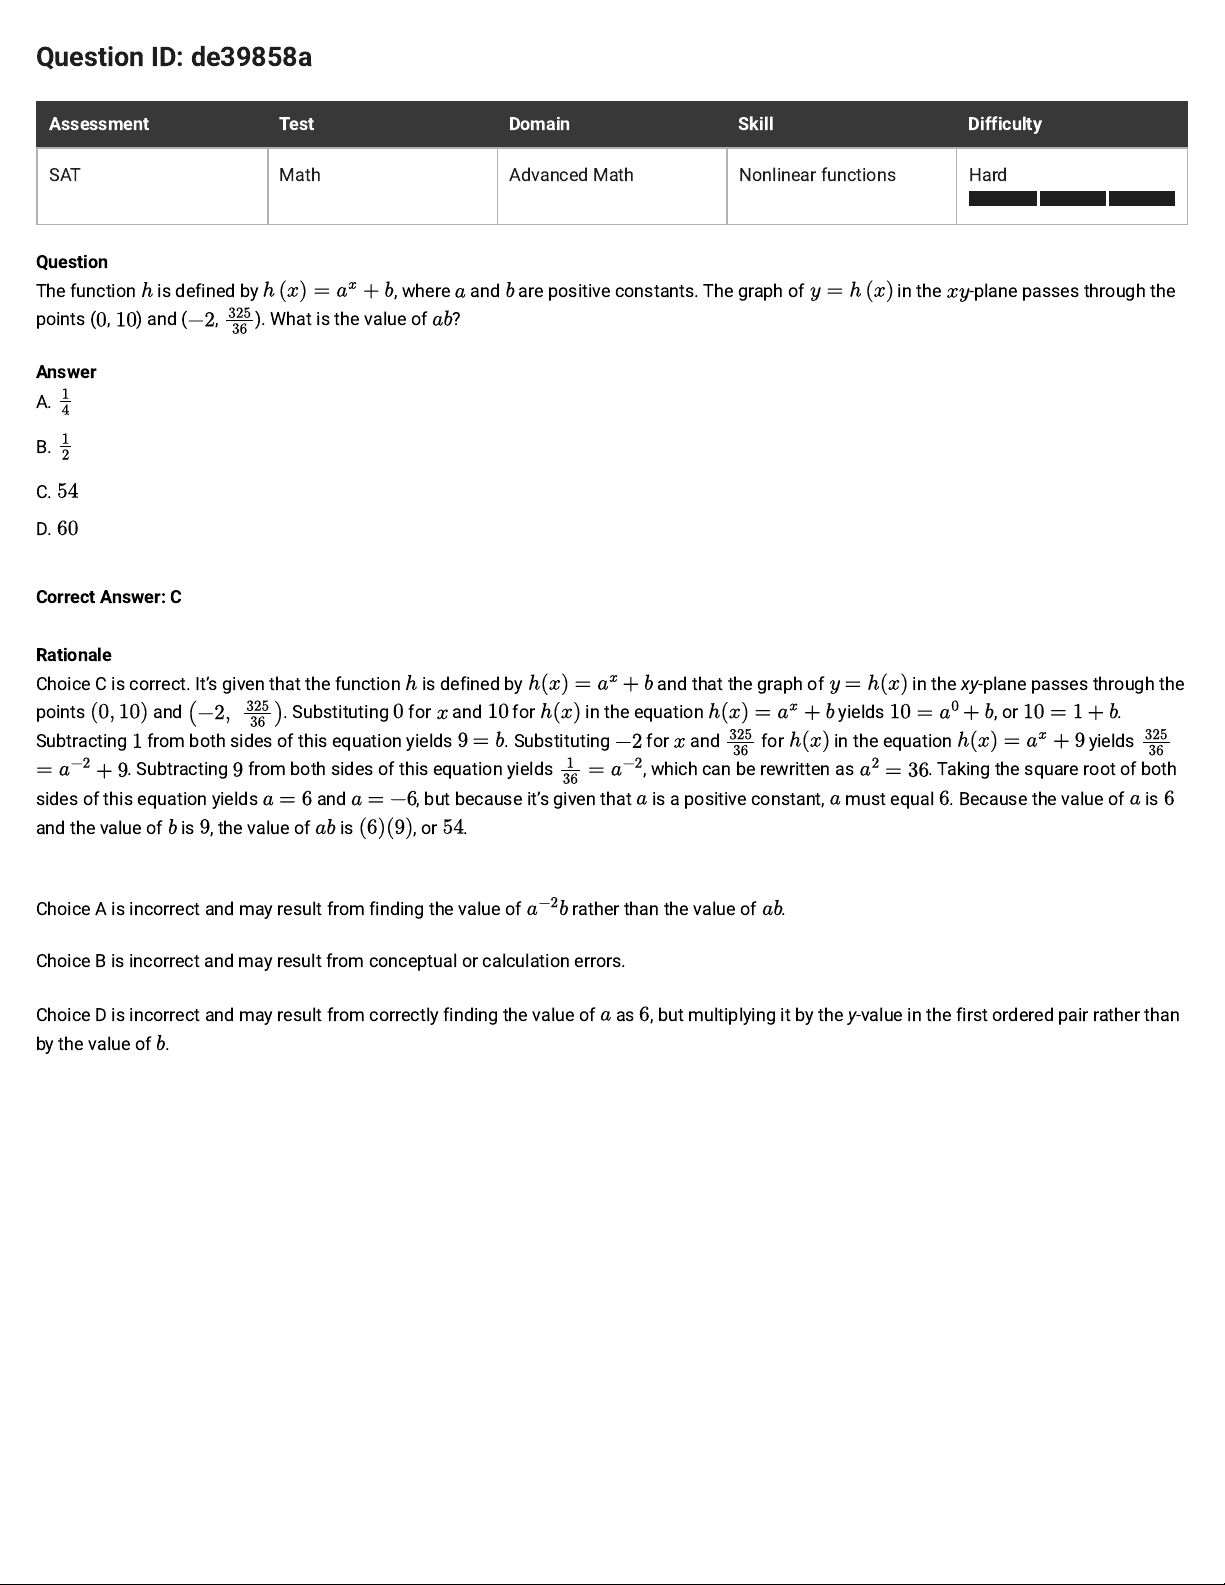
Question ID: de39858a
Assessment Test Domain Skill Difficulty
SAT Math Advanced Math Nonlinear functions Hard
Question
The function is defined by , where and are positive constants. The graph of in the -plane passes through the
points ( , ) and ( , ). What is the value of ?
Answer
A.
B.
C.
D.
Correct Answer: C
Rationale
Choice C is correct. It’s given that the function is defined by and that the graph of in the xy-plane passes through the
points
and
. Substituting for and for in the equation
yields , or
.
Subtracting from both sides of this equation yields
. Substituting for and for
in the equation
yields
. Subtracting from both sides of this equation yields , which can be rewritten as . Taking the square root of both
sides of this equation yields
and , but because it’s given that is a positive constant, must equal . Because the value of is
and the value of is , the value of is , or .
Choice A is incorrect and may result from finding the value of rather than the value of .
Choice B is incorrect and may result from conceptual or calculation errors.
Choice D is incorrect and may result from correctly finding the value of as , but multiplying it by the y-value in the first ordered pair rather than
by the value of .
Page 67
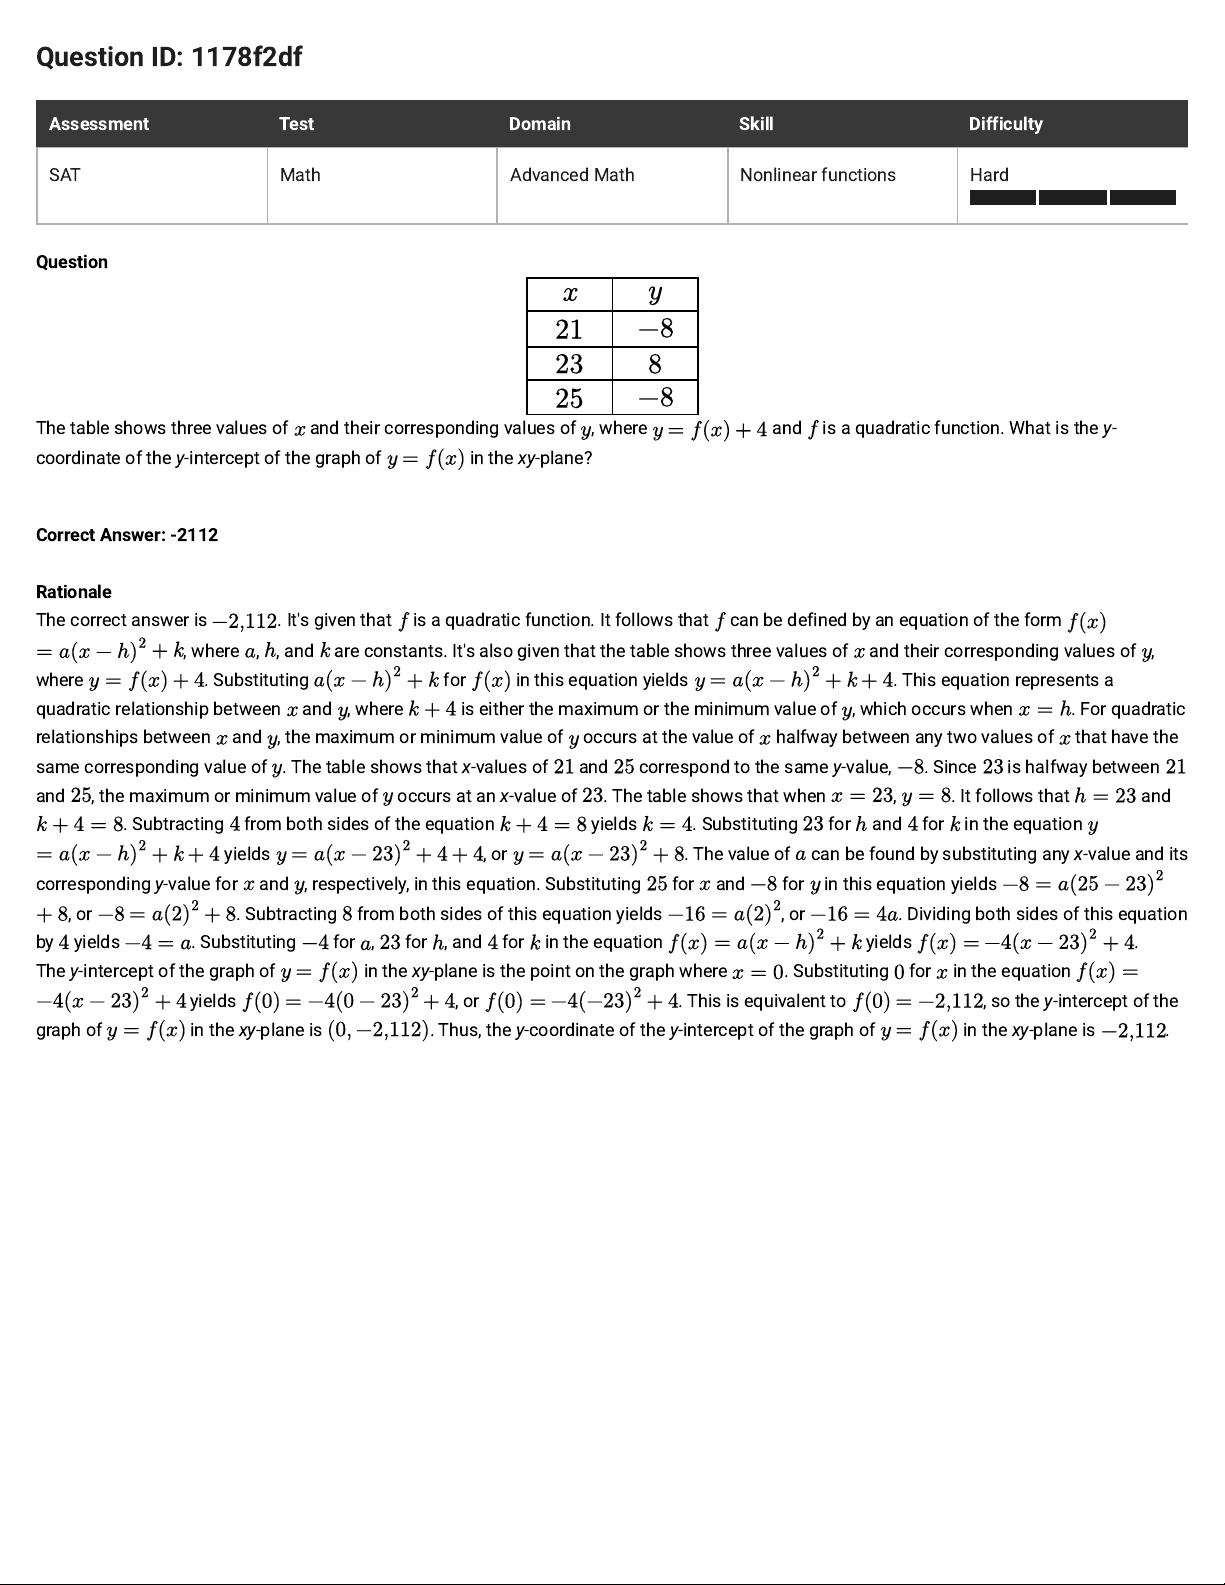
Question ID: 1178f2df
Assessment Test Domain Skill Difficulty
SAT Math Advanced Math Nonlinear functions Hard
Question
The table shows three values of and their corresponding values of , where
and is a quadratic function. What is the y-
coordinate of the y-intercept of the graph of
in the xy-plane?
Correct Answer: -2112
Rationale
The correct answer is
. It's given that is a quadratic function. It follows that can be defined by an equation of the form
, where , , and are constants.It's also given that the table shows three values of and their corresponding values of ,
where
. Substituting
for
in this equation yields
. This equationrepresents a
quadratic relationship between
and , where
is either the maximum or the minimum value of , which occurs when . For quadratic
relationships between
and , the maximum or minimum value of occurs at the value of halfway between any two values of that have the
same corresponding value of . The table shows that x-values of and correspond to the same y-value, . Since is halfway between
and , the maximum or minimum value of occurs at an x-valueof . The table shows that when , . It follows that and
. Subtracting from both sides of the equation yields . Substituting for and for in the equation
yields
, or
. The value of can be found by substituting any x-value and its
corresponding y-value for and , respectively, in this equation. Substituting for and for in this equation yields
, or
. Subtracting from both sides of this equation yields
, or
. Dividing both sides of this equation
by
yields
. Substituting for , for , and for in the equation yields
.
The
y
-intercept of the graph of
in the xy-plane is the point on the graph where . Substituting for in the equation
yields
, or
. This is equivalent to
, so the y-intercept of the
graph of
in the xy-plane is . Thus,the y-coordinate of they
-intercept of the graph of
in thexy
-plane is
.
Page 68
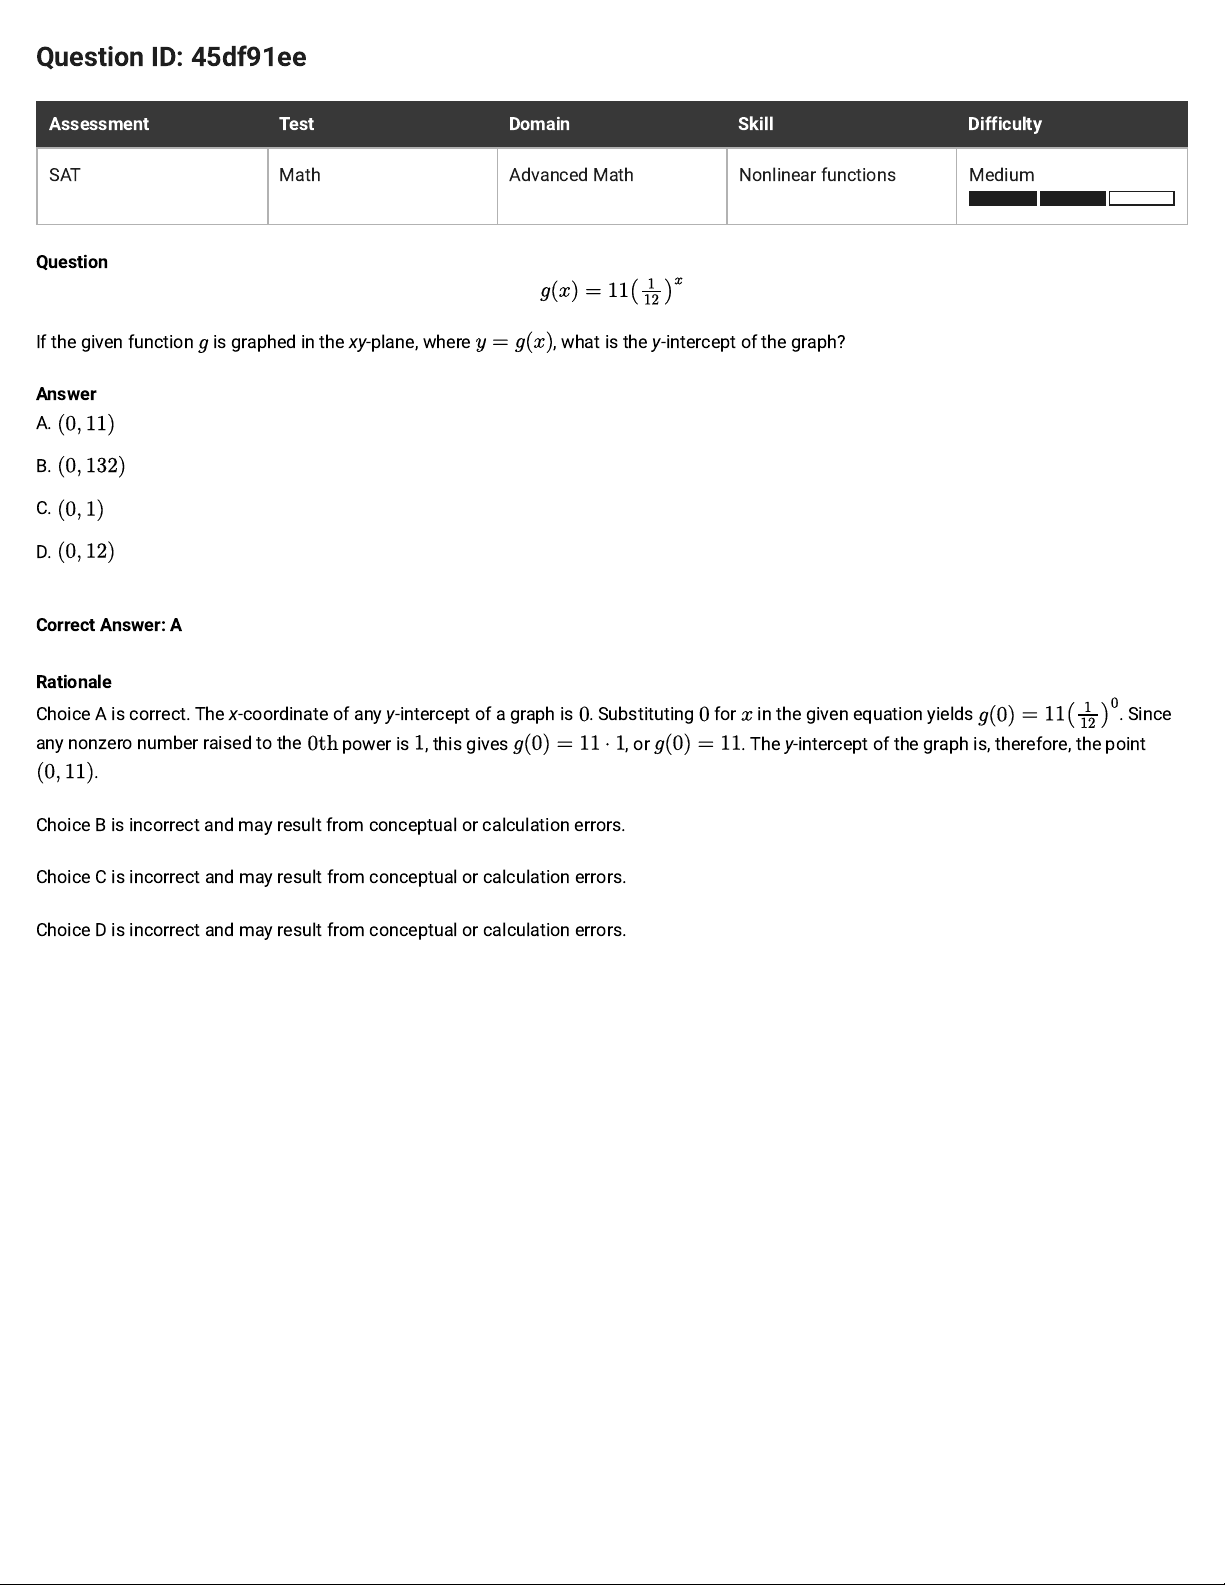
Question ID: 45df91ee
Assessment Test Domain Skill Difficulty
SAT Math Advanced Math Nonlinear functions Medium
Question
If the given function is graphed in the xy-plane, where , what is the y-intercept of the graph?
Answer
A.
B.
C.
D.
Correct Answer: A
Rationale
Choice A is correct. The x-coordinate of any y-intercept of a graph is . Substituting for in the given equation yields . Since
any nonzero number raised to the
power is , this gives , or . The y-intercept of the graph is, therefore, the point
.
Choice B is incorrect and may result from conceptual or calculation errors.
Choice C is incorrect and may result from conceptual or calculation errors.
Choice D is incorrect and may result from conceptual or calculation errors.
Page 69
Question ID: 97158b3a
Assessment Test Domain Skill Difficulty
SAT Math Advanced Math Nonlinear functions Medium
Question
The area A, in square centimeters, of a rectangular painting can be represented by the expression , where is the width, in
centimeters, of the painting. Which expression represents the length, in centimeters, of the painting?
Answer
A.
B.
C.
D.
Correct Answer: C
Rationale
Choice C is correct. It's given that the expression
represents the area, in square centimeters, of a rectangular painting, where is
the width, in centimeters, of the painting. The area of a rectangle can be calculated by multiplying its length by its width. It follows that the length,
in centimeters, of the painting is represented by the expression .
Choice A is incorrect. This expression represents the width, in centimeters, of the painting, not its length, in centimeters.
Choice B is incorrect. This is the difference between the length, in centimeters, and the width, in centimeters, of the painting, not its length, in
centimeters.
Choice D is incorrect. This expression represents the area, in square centimeters, of thepainting, not its length, in centimeters.
Page 70
Question ID: 84e8cc72
Assessment Test Domain Skill Difficulty
SAT Math Advanced Math Nonlinear functions Hard
Question
A quadratic function models the height, in feet, of an object above the ground in terms of the time, in seconds, after the object is launched off an
elevated surface. The model indicates the object has an initial height of feet above the ground and reaches its maximum height of feet
above the ground seconds after being launched. Based on the model, what is the height, in feet, of the object above the ground seconds
after being launched?
Answer
A.
B.
C.
D.
Correct Answer: C
Rationale
Choice C is correct. It's given that a quadratic function models the height, in feet, of an object above the ground in terms of the time, in seconds,
after the object is launched off an elevated surface. This quadratic function can be defined by an equation of the form
,
where
is the height of the object seconds after it was launched, and , , and are constants such that the function reaches its
maximum value, , when . Since the model indicates the object reaches its maximum height of feet above the ground seconds
after being launched, reaches its maximum value, , when . Therefore, and . Substituting for and
for in the function yields . Since the model indicates the object has an initial height of
feet above the ground, the value of is when . Substituting for and for in the equation
yields , or . Subtracting from both sides of this equation yields . Dividing
both sides of this equation by yields . Therefore, the model can be represented by the equation .
Substituting for in this equation yields , or . Therefore, based on the model, seconds
after being launched, the height of the object above the ground is
feet.
Choice A is incorrect and may result from conceptual or calculation errors.
Choice B is incorrect and may result from conceptual or calculation errors.
Choice D is incorrect and may result from conceptual or calculation errors.
Page 71
Question ID: 0ad5012e
Assessment Test Domain Skill Difficulty
SAT Math Advanced Math Nonlinear functions Easy
Question
The given equation models a company’s scheduled deliveries over months, where is the estimated number of scheduled deliveries months
after the end of May , where . Which statement is the best interpretation of the y-intercept of the graph of this equation in the xy-
plane?
Answer
A. At the end of May , the estimated number of scheduled deliveries was .
B. At the end of May , the estimated number of scheduled deliveries was .
C. At the end of June , the estimated number of scheduled deliveries was .
D. At the end of June , the estimated number of scheduled deliveries was .
Correct Answer: B
Rationale
Choice B is correct. The y-intercept of a graph in the xy-plane is the point where . For the given equation, the y-intercept of the graph in the
xy
-plane can be found by substituting for in the equation, which yields , or . Therefore, the y-intercept of
the graph is
. It’s given that is the estimated number of scheduled deliveries months after the end of May . Therefore,
represents months after the end of May , or the end of May . Thus, the best interpretation of the y-intercept of the graph of this
equation in the xy-plane is that at the end of May , the estimated number of scheduled deliveries was .
Choice A is incorrect and may result from conceptual errors.
Choice C is incorrect and may result from conceptual errors.
Choice D is incorrect and may result from conceptual errors.
Page 72
Question ID: dba7432e
Assessment Test Domain Skill Difficulty
SAT Math Advanced Math Nonlinear functions Medium
Question
x f(x)
0 5
1
2
3
The table above gives the values of the function f for some values of x. Which of the following equations could define f ?
Answer
A.
B.
C.
D.
Correct Answer: D
Rationale
Choice D is correct. Each choice has a function with coefficient 5 and base 2, so the exponents must be analyzed. When the input value of x
increases, the output value of f(x) decreases, so the exponent must be negative. An exponent of –x yields the values in the table: ,
, , and .
Choices A and B are incorrect and may result from choosing equations that yield an increasing, rather than decreasing, output value of f(x) when
the input value of x increases. Choice C is incorrect and may result from choosing an equation that doesn’t yield the values in the table.
Page 73
Question ID: 0aaef7aa
Assessment Test Domain Skill Difficulty
SAT Math Advanced Math Nonlinear functions Medium
Question
The function is defined by . What is the value of when is equal to ?
Answer
A.
B.
C.
D.
Correct Answer: A
Rationale
Choice A is correct. It's given that . Substituting for in this equation yields . Dividing each side of this equation by
yields . Taking the cube root of each side of this equation yields . Therefore, when is equal to , the value of is .
Choice B is incorrect and may result from conceptual or calculation errors.
Choice C is incorrect and may result from conceptual or calculation errors.
Choice D is incorrect and may result from conceptual or calculation errors.
Page 74
Question ID: b7cd6ca6
Assessment Test Domain Skill Difficulty
SAT Math Advanced Math Nonlinear functions Medium
Question
The equation
gives the estimated number of employees at a restaurant, where is the number of years since the restaurant
opened. Which of the following is the best interpretation of the number
in this context?
Answer
A. The estimated number of employees when the restaurant opened
B. The increase in the estimated number of employees each year
C. The number of years the restaurant has been open
D. The percent increase in the estimated number of employees each year
Correct Answer: A
Rationale
Choice A is correct. For an exponential function of the form , where and are constants, the initial value of the function—that is,
the value of the function when
—
is and the value of the function increases by a factor of each time increases by . Since the function
gives the estimated number of employees at a restaurant and is the number of years since the restaurant opened, the best
interpretation of the number
in this context is the estimated number of employees when , or when the restaurant opened.
Choice B is incorrect and may result from conceptual errors.
Choice C is incorrect and may result from conceptual errors.
Choice D is incorrect and may result from conceptual errors.
Page 75
Question ID: 6d9e01a2
Assessment Test Domain Skill Difficulty
SAT Math Advanced Math Nonlinear functions Hard
Question
The given equation defines the function . For what value of does reach its minimum?
Correct Answer: 25/4, 6.25
Rationale
The correct answer is . The given equation can be rewritten in the form , where , , and are constants. When
, is the value of for which
reaches its minimum. The given equation can be rewritten as , which is
equivalent to
. This equation can be rewritten as ,
or
, which is equivalent to . Therefore, , so the value of for which
reaches its minimum is . Note that 25/4 and 6.25 are examples of ways to enter a correct answer.
Page 76
Question ID: 9f2ecade
Assessment Test Domain Skill Difficulty
SAT Math Advanced Math Nonlinear functions Hard
Question
The function h is defined above, where a, b, and c are integer constants. If the zeros of the function are 6, and 7, what is the value of c ?
Rationale
The correct answer is 210. Since , 6, and 7 are zeros of the function, the function can be rewritten as .
Expanding the function yields . Thus, , , and . Therefore, the value of c is 210.
Page 77
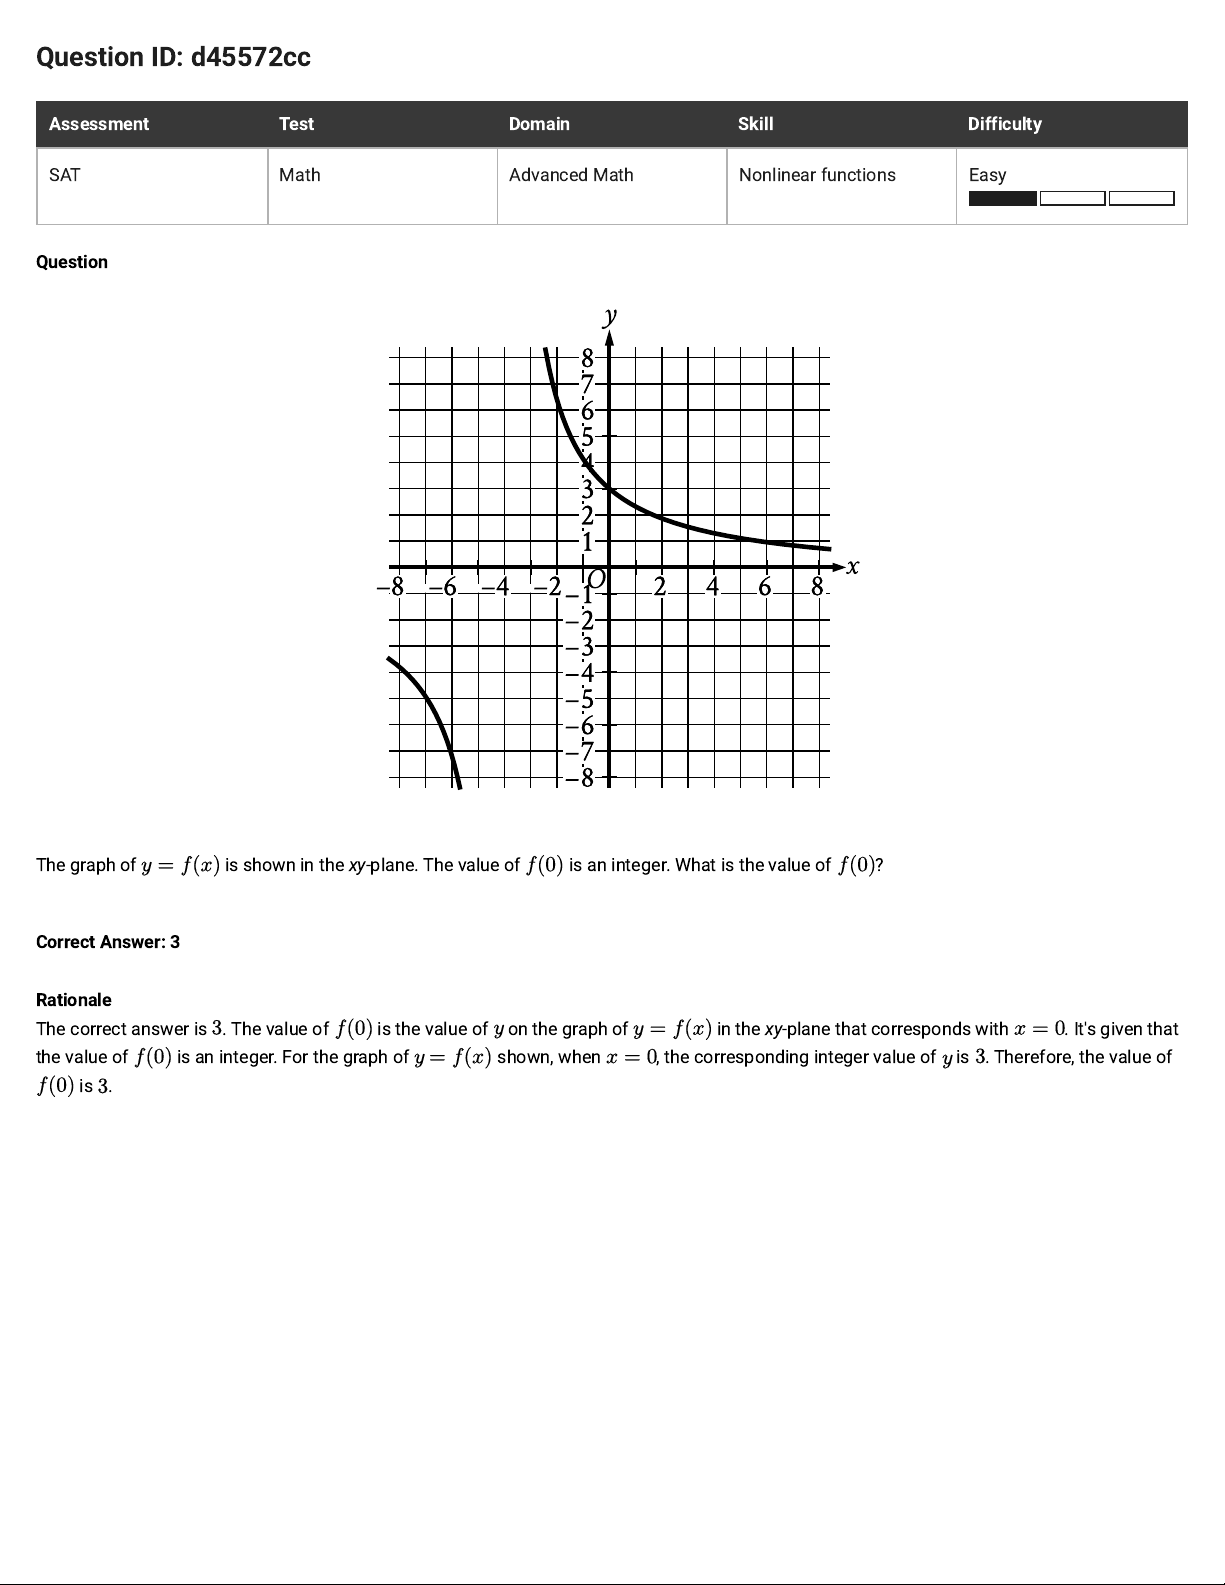
Question ID: d45572cc
Assessment Test Domain Skill Difficulty
SAT Math Advanced Math Nonlinear functions Easy
Question
The graph of is shown in the xy-plane. The value of is an integer. What is the value of ?
Correct Answer: 3
Rationale
The correct answer is . The value of is the value of on the graph of in the xy-plane that corresponds with . It's given that
the value of is an integer. For the graph of shown, when , the corresponding integer value of is . Therefore, the value of
is .
Page 78
Question ID: 79ba511a
Assessment Test Domain Skill Difficulty
SAT Math Advanced Math Nonlinear functions Easy
Question
The function is defined by . What is the value of ?
Answer
A.
B.
C.
D.
Correct Answer: C
Rationale
Choice C is correct. The value of is the value of
when . Substituting for in the given function yields , or
, which is equivalent to . Therefore, the value of is .
Choice A is incorrect and may result from conceptual or calculation errors.
Choice B is incorrect. This is the value of
when , rather than .
Choice D is incorrect and may result from conceptual or calculation errors.
Page 79
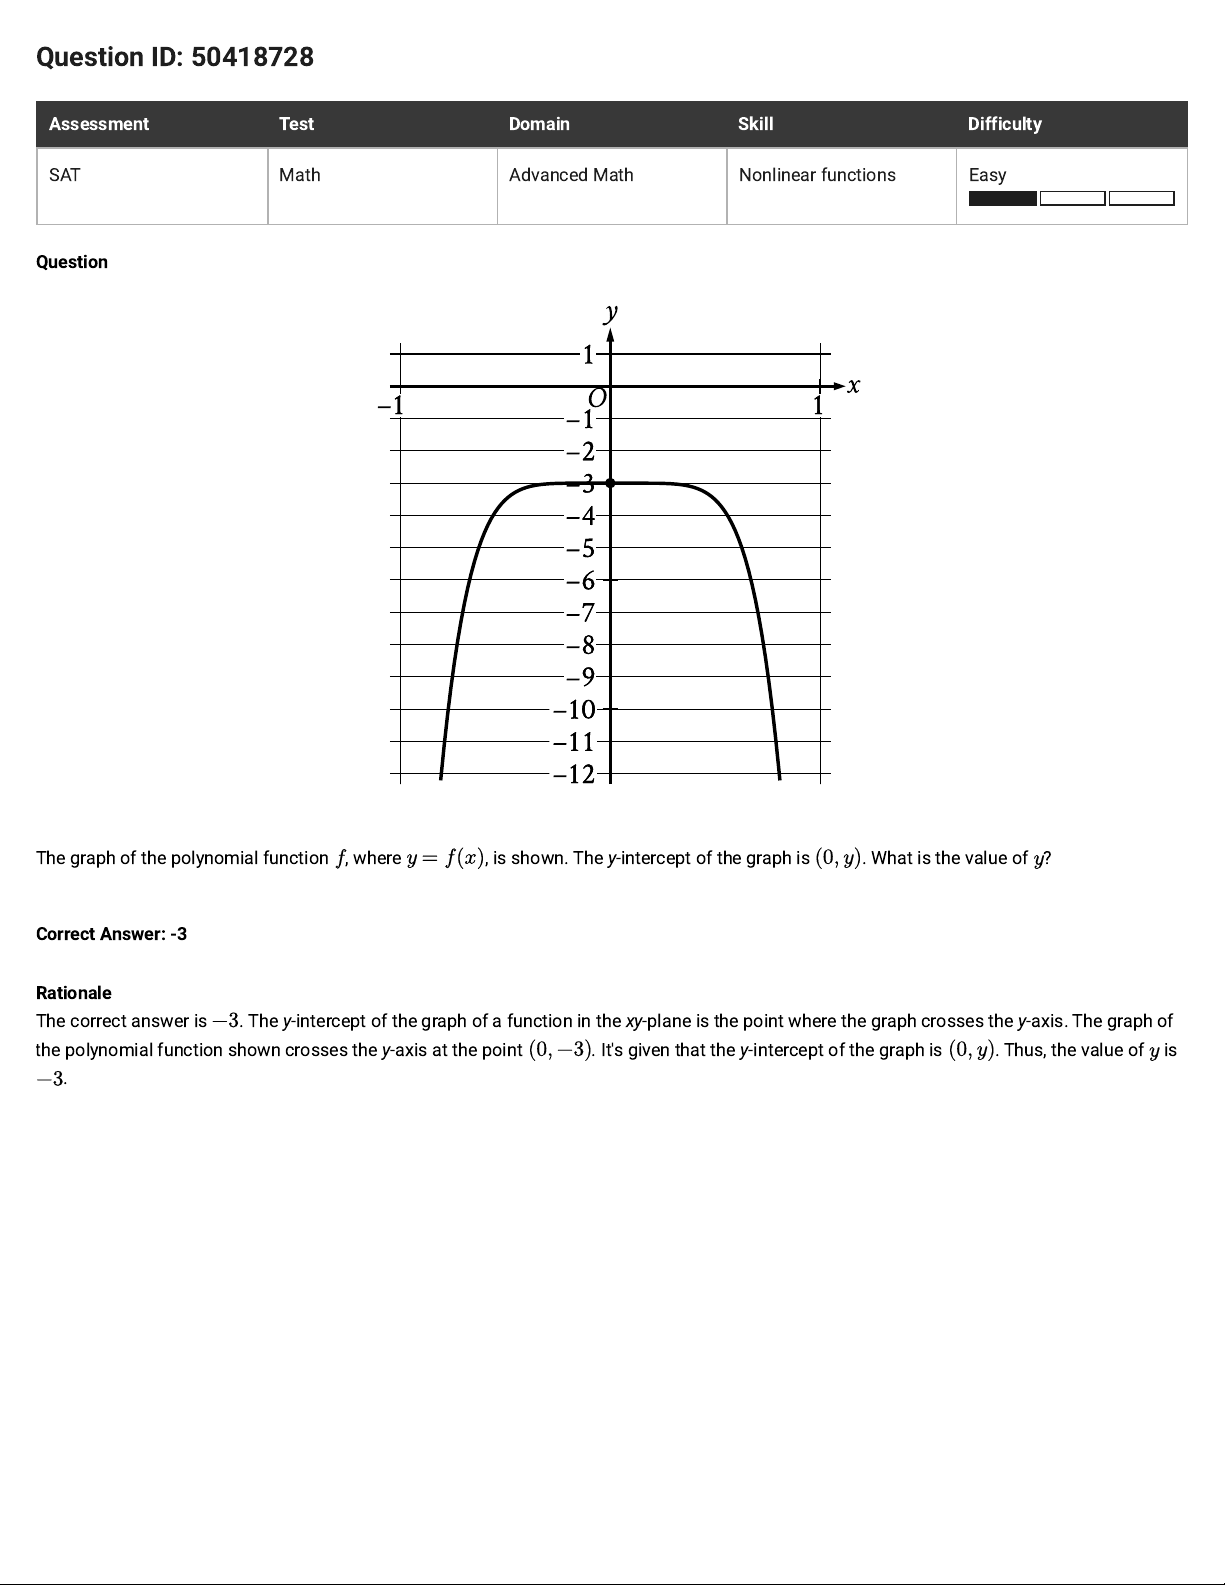
Question ID: 50418728
Assessment Test Domain Skill Difficulty
SAT Math Advanced Math Nonlinear functions Easy
Question
The graph of the polynomial function , where , is shown. The y-intercept of the graph is . What is the value of ?
Correct Answer: -3
Rationale
The correct answer is. The y-intercept of the graph of a function in the xy-plane is the point where the graph crosses the y-axis. The graph of
thepolynomial function shown crosses the y-axis at the point . It's given that the y-intercept of the graph is
. Thus, the value of is
.
Page 80
Question ID: f5e8ccf1
Assessment Test Domain Skill Difficulty
SAT Math Advanced Math Nonlinear functions Medium
Question
The function f is defined above. Which of the following is NOT an x-intercept of the graph of the function in the xy-plane?
Answer
A.
B.
C.
D.
Correct Answer: B
Rationale
Choice B is correct. The graph of the function f in the xy-plane has x-intercepts at the points , where . Substituting 0 for
in the given equation yields . By the zero product property, if , then
, , or . Solving each of these linear equations for x, it follows that , , and ,
respectively. This means that the graph of the function f in the xy-plane has three x-intercepts: , , and . Therefore,
isn’t an x-intercept of the graph of the function f.
Alternate approach: Substitution may be used. Since by definition an x-intercept of any graph is a point in the form where k is a constant,
and since all points in the options are in this form, it need only be checked whether the points in the options lie on the graph of the function f.
Substituting for x and 0 for in the given equation yields , or . Therefore,
the point doesn’t lie on the graph of the function f and can’t be an x-intercept of the graph.
Choices A, C, and D are incorrect because each of these points is an x-intercept of the graph of the function f in the xy-plane. By definition, an x-
intercept is a point on the graph of the form , where k is a constant. Substituting for x and 0 for in the given equation yields
, or . Since this is a true statement, the point lies on the graph of the function f and is an
x-intercept of the graph. Performing similar substitution using the points and also yields the true statement , illustrating
that these points also lie on the graph of the function f and are x-intercepts of the graph.
Page 81

Page 82
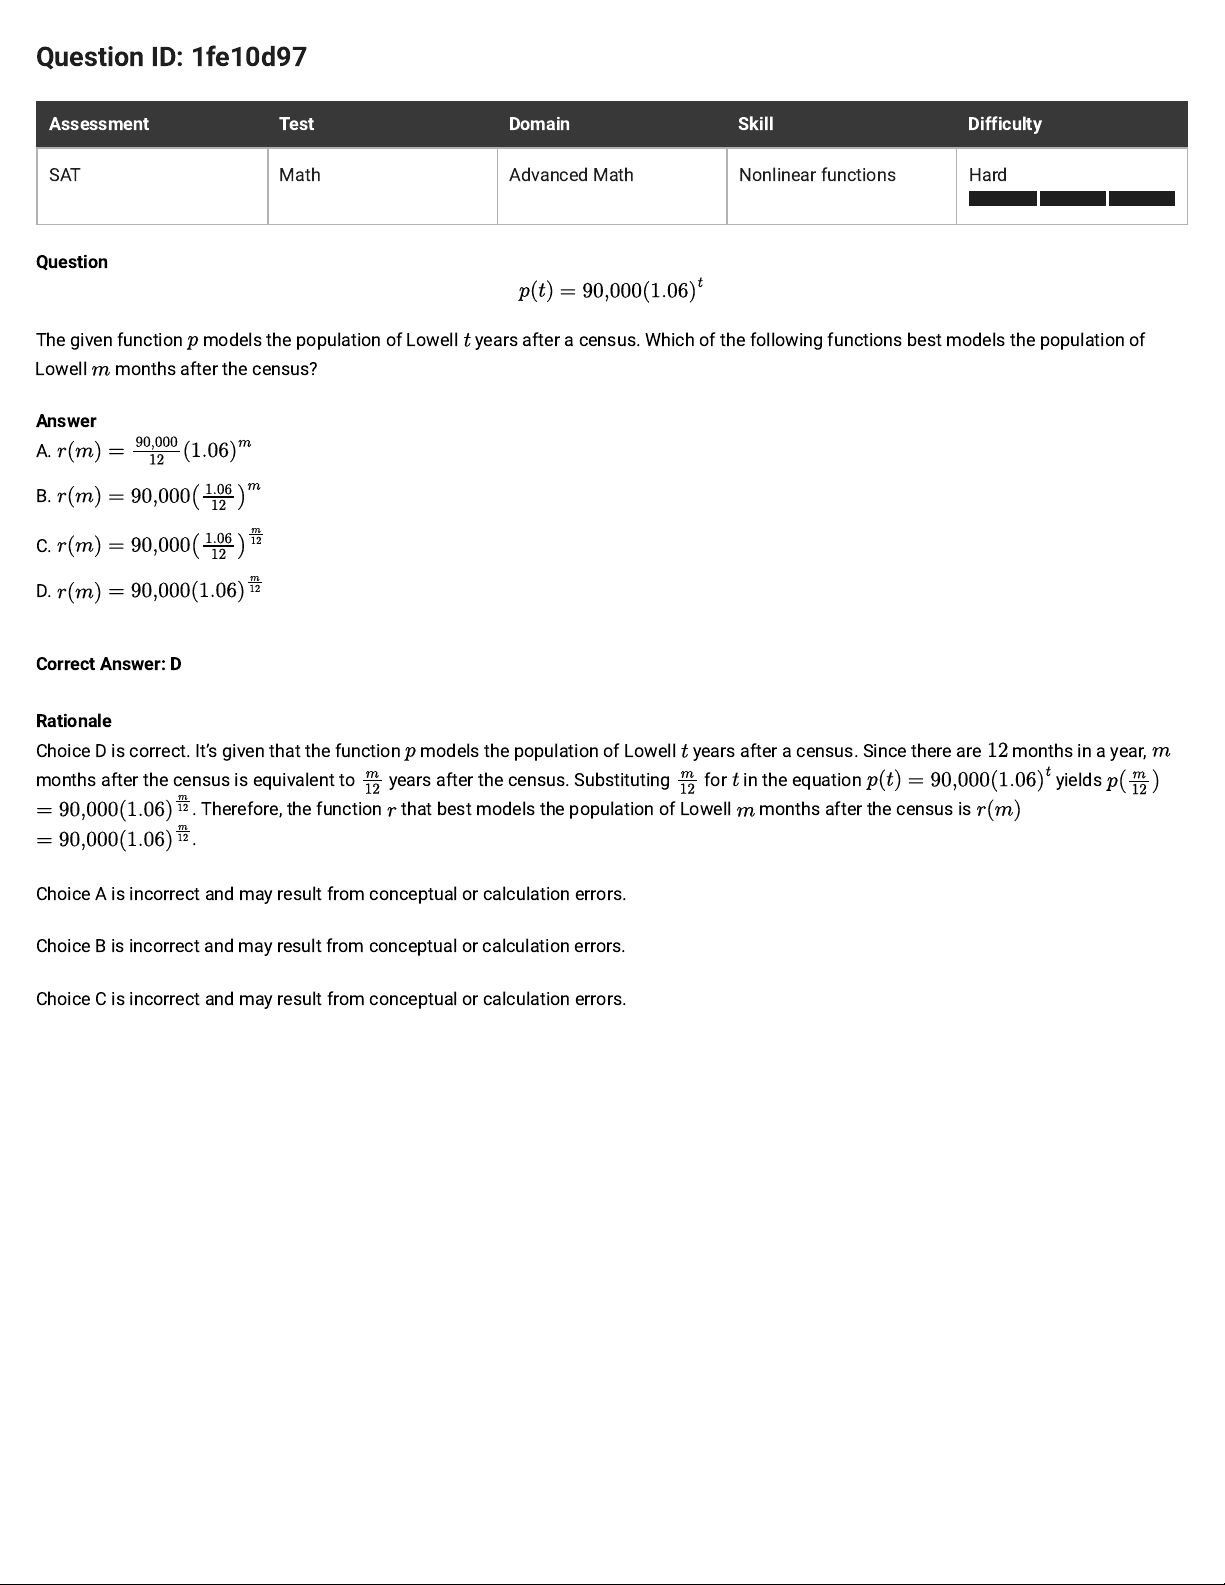
Question ID: 1fe10d97
Assessment Test Domain Skill Difficulty
SAT Math Advanced Math Nonlinear functions Hard
Question
The given function models the population of Lowell years after a census. Which of the following functions best models the population of
Lowell months after the census?
Answer
A.
B.
C.
D.
Correct Answer: D
Rationale
Choice D is correct. It’s given that the function models the population of Lowell years after a census. Since there are months in a year,
months after the census is equivalent to years after the census. Substituting for in the equation
yields
. Therefore, the function that best models the population of Lowell months after the census is
.
Choice A is incorrect and may result from conceptual or calculation errors.
Choice B is incorrect and may result from conceptual or calculation errors.
Choice C is incorrect and may result from conceptual or calculation errors.
Page 83
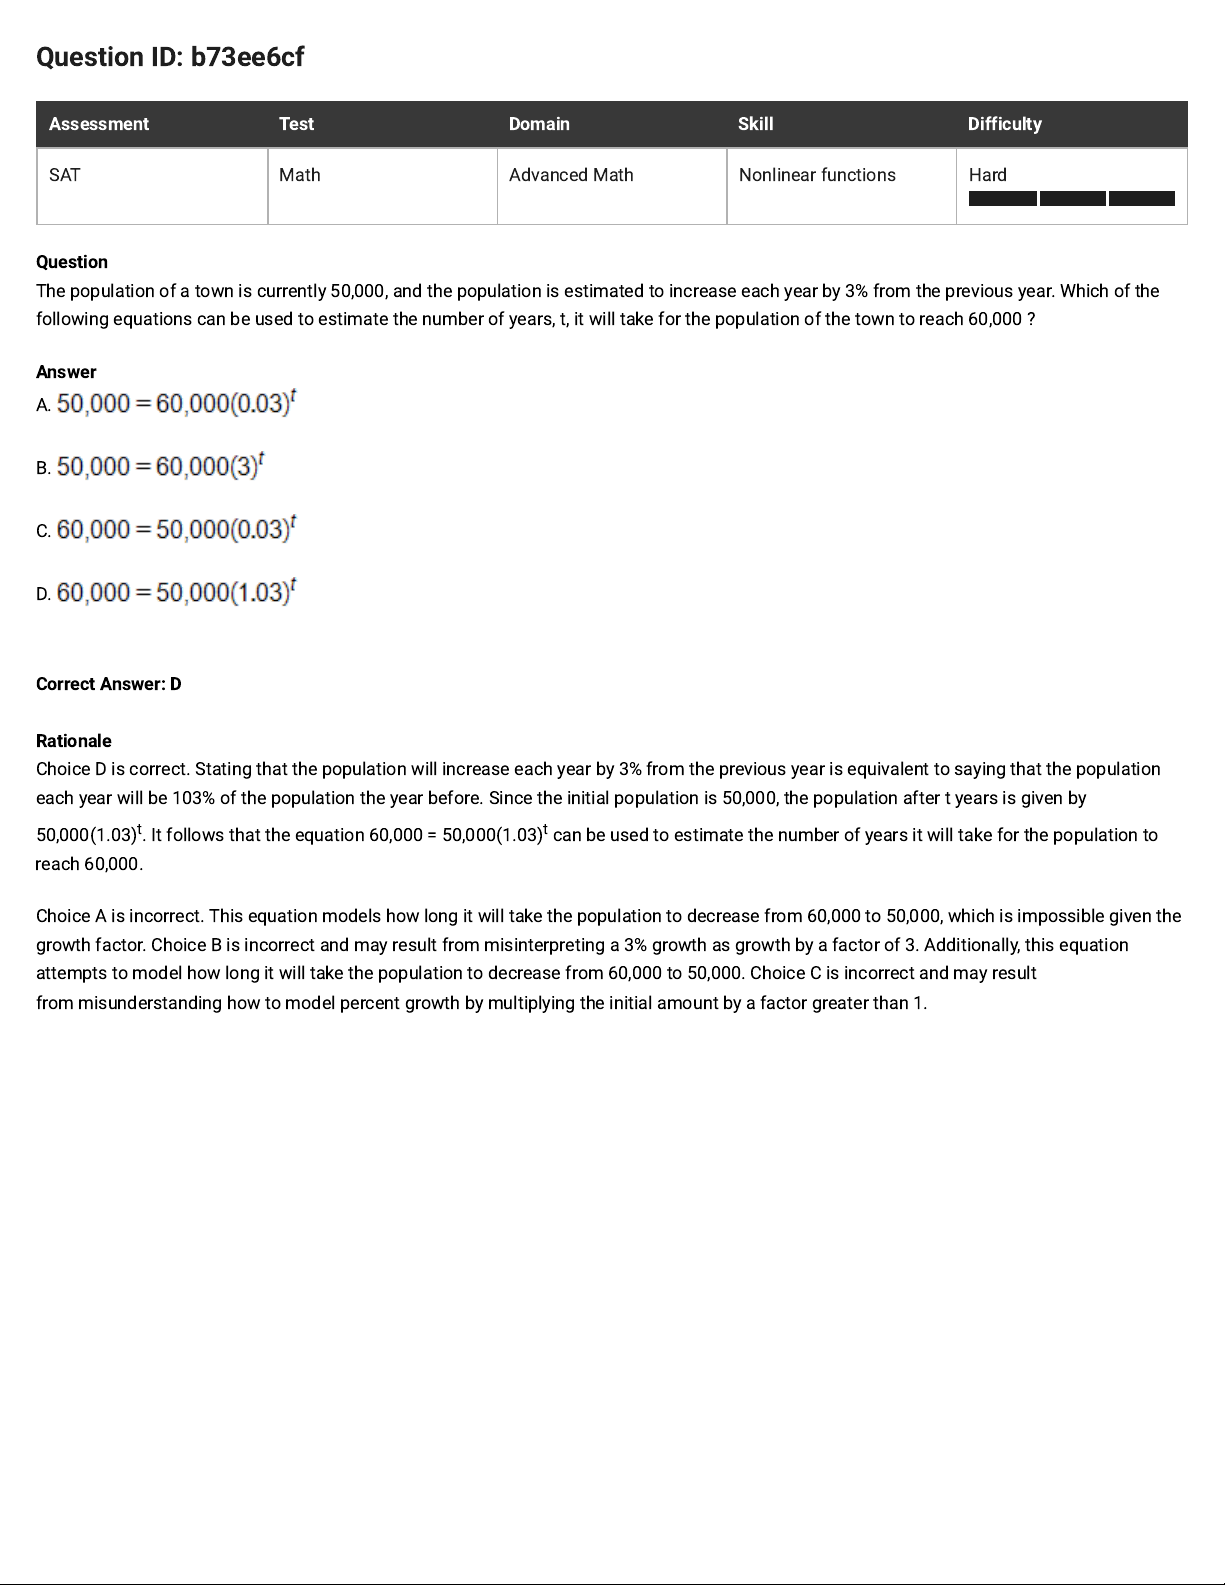
Question ID: b73ee6cf
Assessment Test Domain Skill Difficulty
SAT Math Advanced Math Nonlinear functions Hard
Question
The population of a town is currently 50,000, and the population is estimated to increase each year by 3% from the previous year. Which of the
following equations can be used to estimate the number of years, t, it will take for the population of the town to reach 60,000 ?
Answer
A.
B.
C.
D.
Correct Answer: D
Rationale
Choice D is correct. Stating that the population will increase each year by 3% from the previous year is equivalent to saying that the population
each year will be 103% of the population the year before. Since the initial population is 50,000, the population after tyears is given by
50,000(1.03)t. It follows that the equation 60,000 = 50,000(1.03)t can be used to estimate the number of years it will take for the population to
reach 60,000.
Choice A is incorrect. This equation models how long it will take the population to decrease from 60,000 to 50,000, which is impossible given the
growth factor. Choice B is incorrect and may resultfrom misinterpreting a 3% growth as growth by a factor of 3. Additionally, this equation
attempts to model how long it will take the population to decrease from 60,000 to 50,000. Choice C is incorrect and may result
frommisunderstanding how to model percent growthby multiplying the initial amount by a factor greater than 1.
Page 84
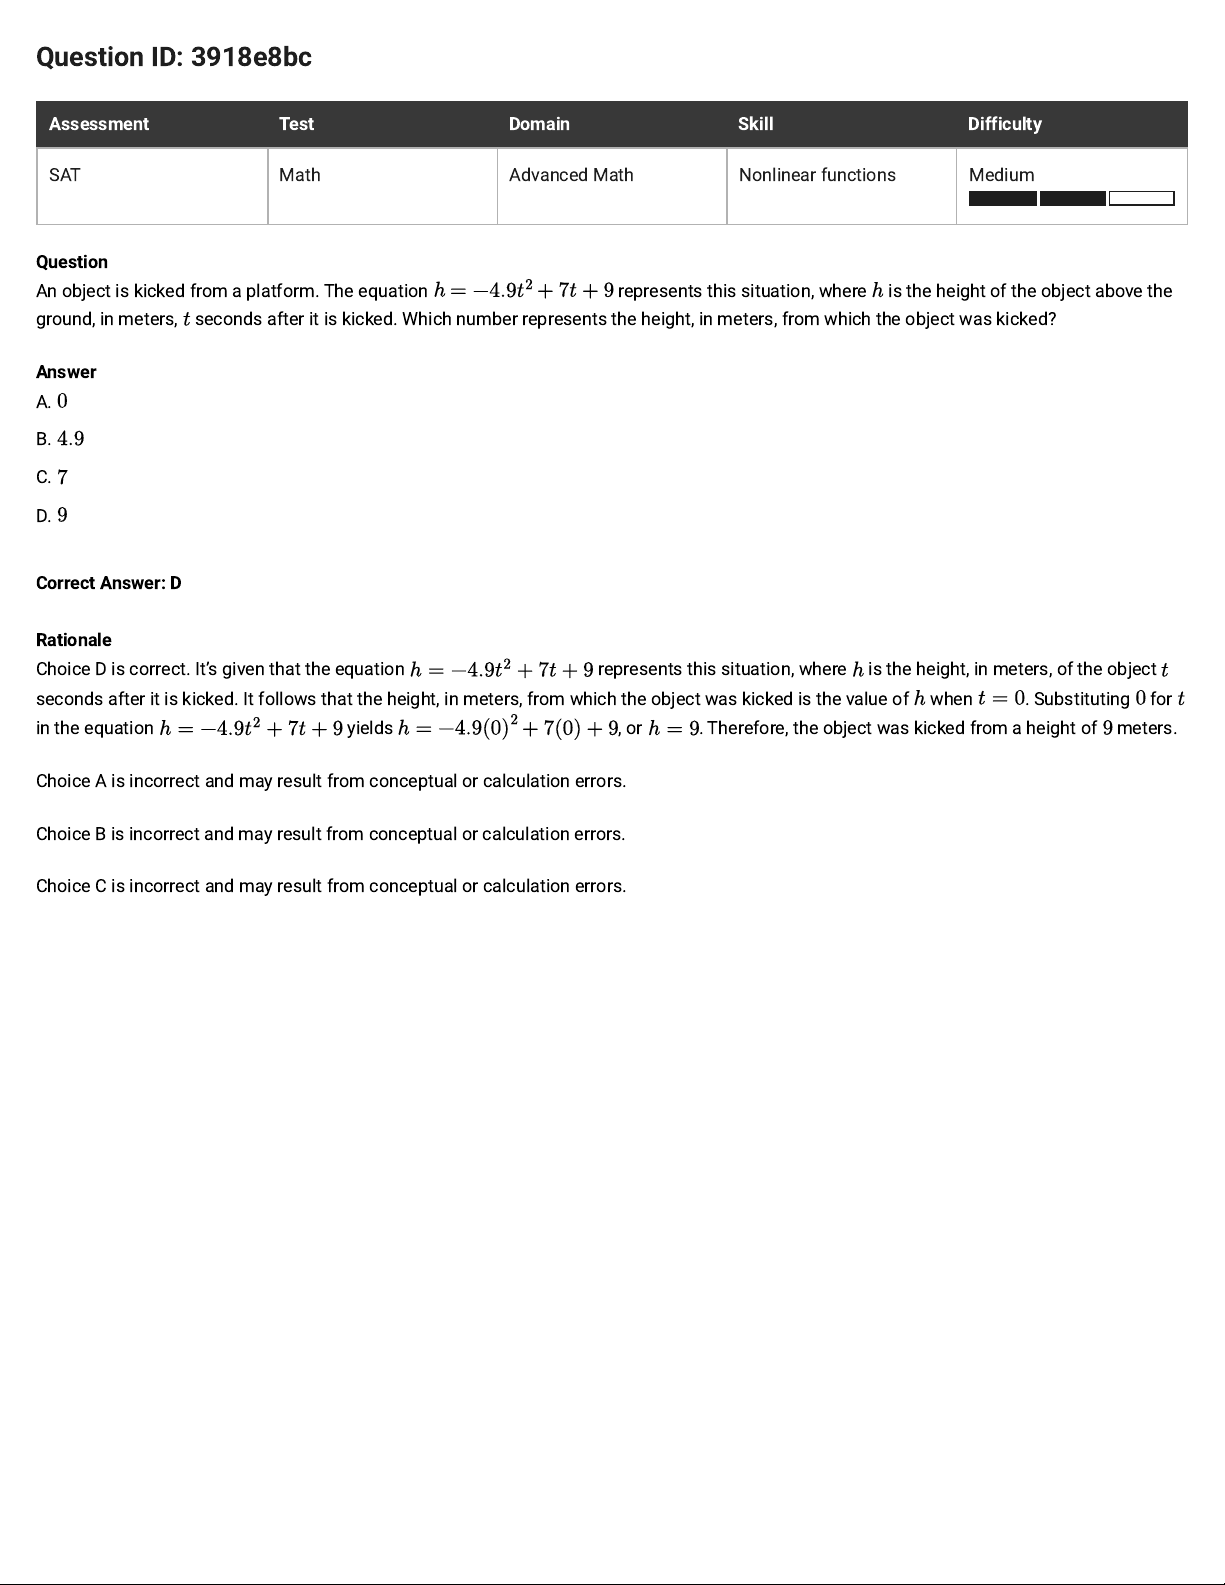
Question ID: 3918e8bc
Assessment Test Domain Skill Difficulty
SAT Math Advanced Math Nonlinear functions Medium
Question
An object is kicked from a platform. The equation represents this situation, where is the height of the object above the
ground, in meters, seconds after it is kicked. Which number represents the height, in meters, from which the object was kicked?
Answer
A.
B.
C.
D.
Correct Answer: D
Rationale
Choice D is correct. It’s given that the equation represents this situation, where is the height, in meters, of the object
seconds after it is kicked. It follows that the height, in meters, from which the object was kicked is the value of when . Substituting for
in the equation yields , or . Therefore, the object was kicked from a height of meters.
Choice A is incorrect and may result from conceptual or calculation errors.
Choice B is incorrect and may result from conceptual or calculation errors.
Choice C is incorrect and may result from conceptual or calculation errors.
Page 85
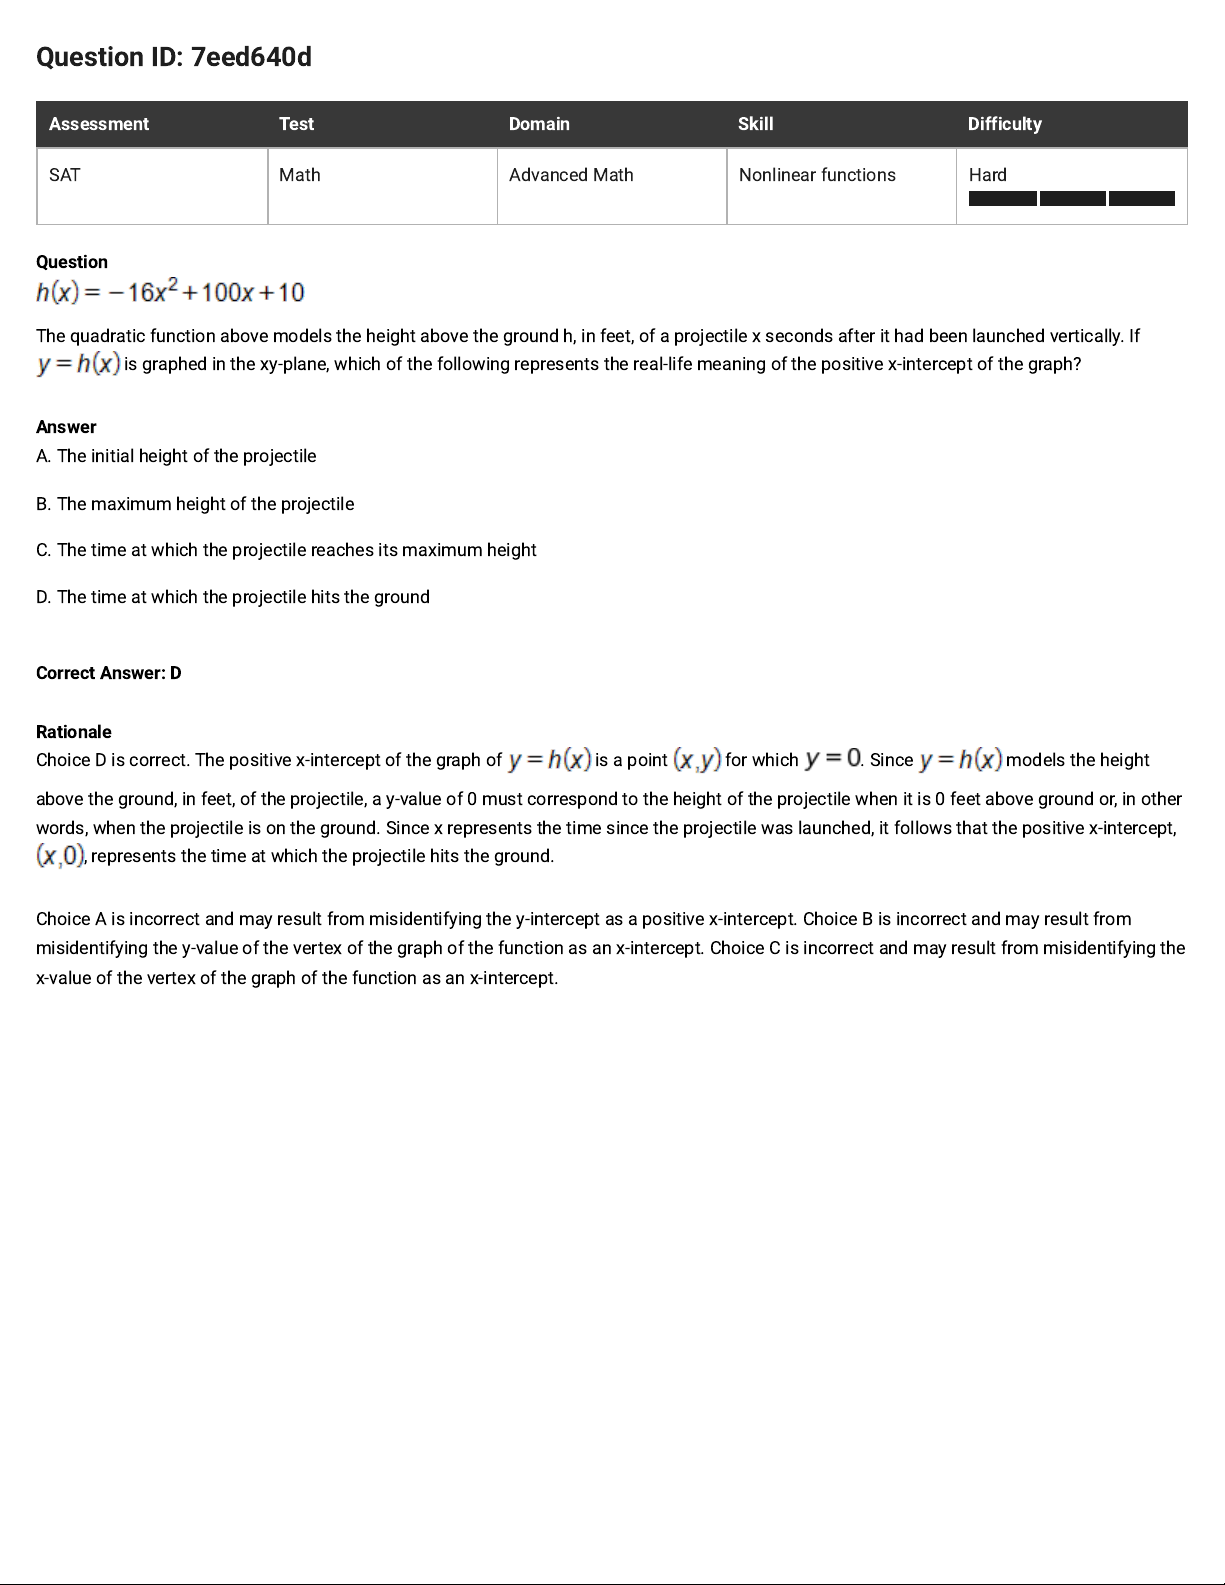
Question ID: 7eed640d
Assessment Test Domain Skill Difficulty
SAT Math Advanced Math Nonlinear functions Hard
Question
The quadratic function above models the height above the ground h, in feet, of a projectile x seconds after it had been launched vertically. If
is graphed in the xy-plane, which of the following represents the real-life meaning of the positive x-intercept of the graph?
Answer
A. The initial height of the projectile
B. The maximum height of the projectile
C. The time at which the projectile reaches its maximum height
D. The time at which the projectile hits the ground
Correct Answer: D
Rationale
Choice D is correct. The positive x-intercept of the graph of is a point for which . Since models the height
above the ground, in feet, of the projectile, a y-value of 0 must correspond to the height of the projectile when it is 0 feet above ground or, in other
words, when the projectile is on the ground. Since x represents the time since the projectile was launched, it follows that the positive x-intercept,
, represents the time at which the projectile hits the ground.
Choice A is incorrect and may result from misidentifying the y-intercept as a positive x-intercept. Choice B is incorrect and may result from
misidentifying the y-value of the vertex of the graph of the function as an x-intercept. Choice C is incorrect and may result from misidentifying the
x-value of the vertex of the graph of the function as an x-intercept.
Page 86
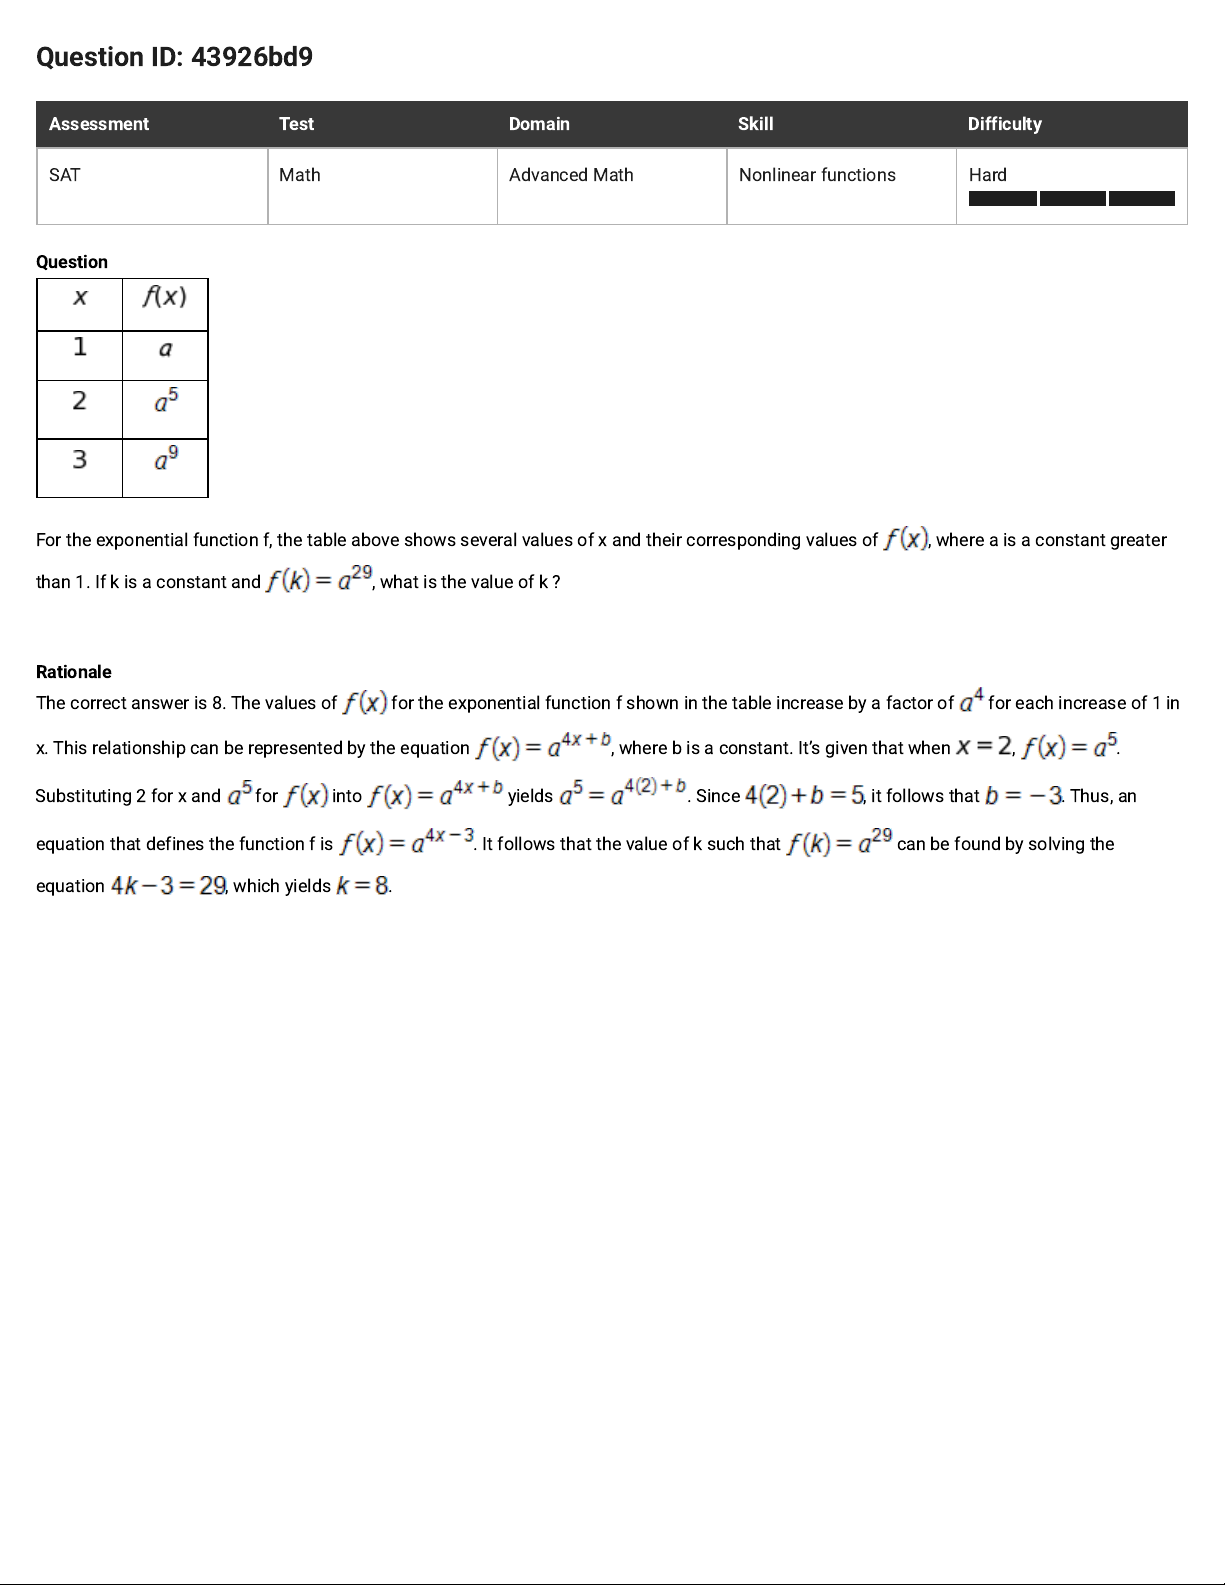
Question ID: 43926bd9
Assessment Test Domain Skill Difficulty
SAT Math Advanced Math Nonlinear functions Hard
Question
For the exponential function f, the table above shows several values of x and their corresponding values of , where a is a constant greater
than 1. If k is a constant and , what is the value of k ?
Rationale
The correct answer is 8. The values of for the exponential function f shown in the table increase by a factor of for each increase of 1 in
x. This relationship can be represented by the equation , where b is a constant. It’s given that when , .
Substituting 2 for x and for into yields . Since , it follows that . Thus, an
equation that defines the function f is . It follows that the value of k such that can be found by solving the
equation , which yields .
Page 87
Question ID: f25a34aa
Assessment Test Domain Skill Difficulty
SAT Math Advanced Math Nonlinear functions Hard
Question
The area of a triangle is equal to square centimeters. The length of the base of the triangle is centimeters, and the height of the
triangle is centimeters. What is the value of ?
Correct Answer: 110
Rationale
The correct answer is . The area of a triangle is equal to one half of the product of the length of the base of the triangle and the height of the
triangle. It's given that the length of the base of the triangle is centimeters and the height of the triangle is centimeters;
therefore, its area is square centimeters. It's also given that the area of the triangle is equal to square centimeters.
Therefore, it follows that . This equation can be rewritten as , or .
Subtracting from both sides of this equation yields . Adding to both sides of this equation yields . Therefore, the
value of is .
Page 88
Question ID: a58232b7
Assessment Test Domain Skill Difficulty
SAT Math Advanced Math Nonlinear functions Hard
Question
The functions and are defined by the given equations, where . Which of the following equations displays, as a constant or coefficient,
the minimum value of the function it defines, where ?
I.
II.
Answer
A. I only
B. II only
C. I and II
D. Neither I nor II
Correct Answer: D
Rationale
Choice D is correct. A function defined by an equation in the form , where , , and are positive constants and , has a
minimum value of
. It's given that function is defined by , which is equivalent to .
Substituting for in this equation yields , or . Therefore, the minimum value of is , so
doesn't display its minimum value as a constant or coefficient. It's also given that function is defined by
. Substituting for in this equation yields , or . Therefore, the minimum value of is
, so doesn't display its minimum value as a constant or coefficient. Therefore, neither I nor II displays, as a
constant or coefficient, the minimum value of the function it defines, where
.
Choice A is incorrect and may result from conceptual or calculation errors.
Choice B is incorrect and may result from conceptual or calculation errors.
Choice C is incorrect and may result from conceptual or calculation errors.
Page 89
Question ID: a7711fe8
Assessment Test Domain Skill Difficulty
SAT Math Advanced Math Nonlinear functions Hard
Question
What is the minimum value of the functionf defined by
?
Answer
A.
B.
C. 2
D. 4
Correct Answer: A
Rationale
Choice A is correct. The given quadratic function f is in vertex form, , where is the vertex of the graph of
in the xy-plane. Therefore, the vertex of the graph of is . In addition, the y-coordinate of the vertex represents either the
minimum or maximum value of a quadratic function, depending on whether the graph of the function opens upward or downward. Since the
leading coefficient of f (the coefficient of the term ) is 1, which is positive, the graph of opens upward. It follows that at
, the minimum value of the function f is .
Choice B is incorrect and may result from making a sign error and from using the x-coordinate of the vertex. Choice C is incorrect and may result
from using the x-coordinate of the vertex. Choice D is incorrect and may result from making a sign error.
Page 90
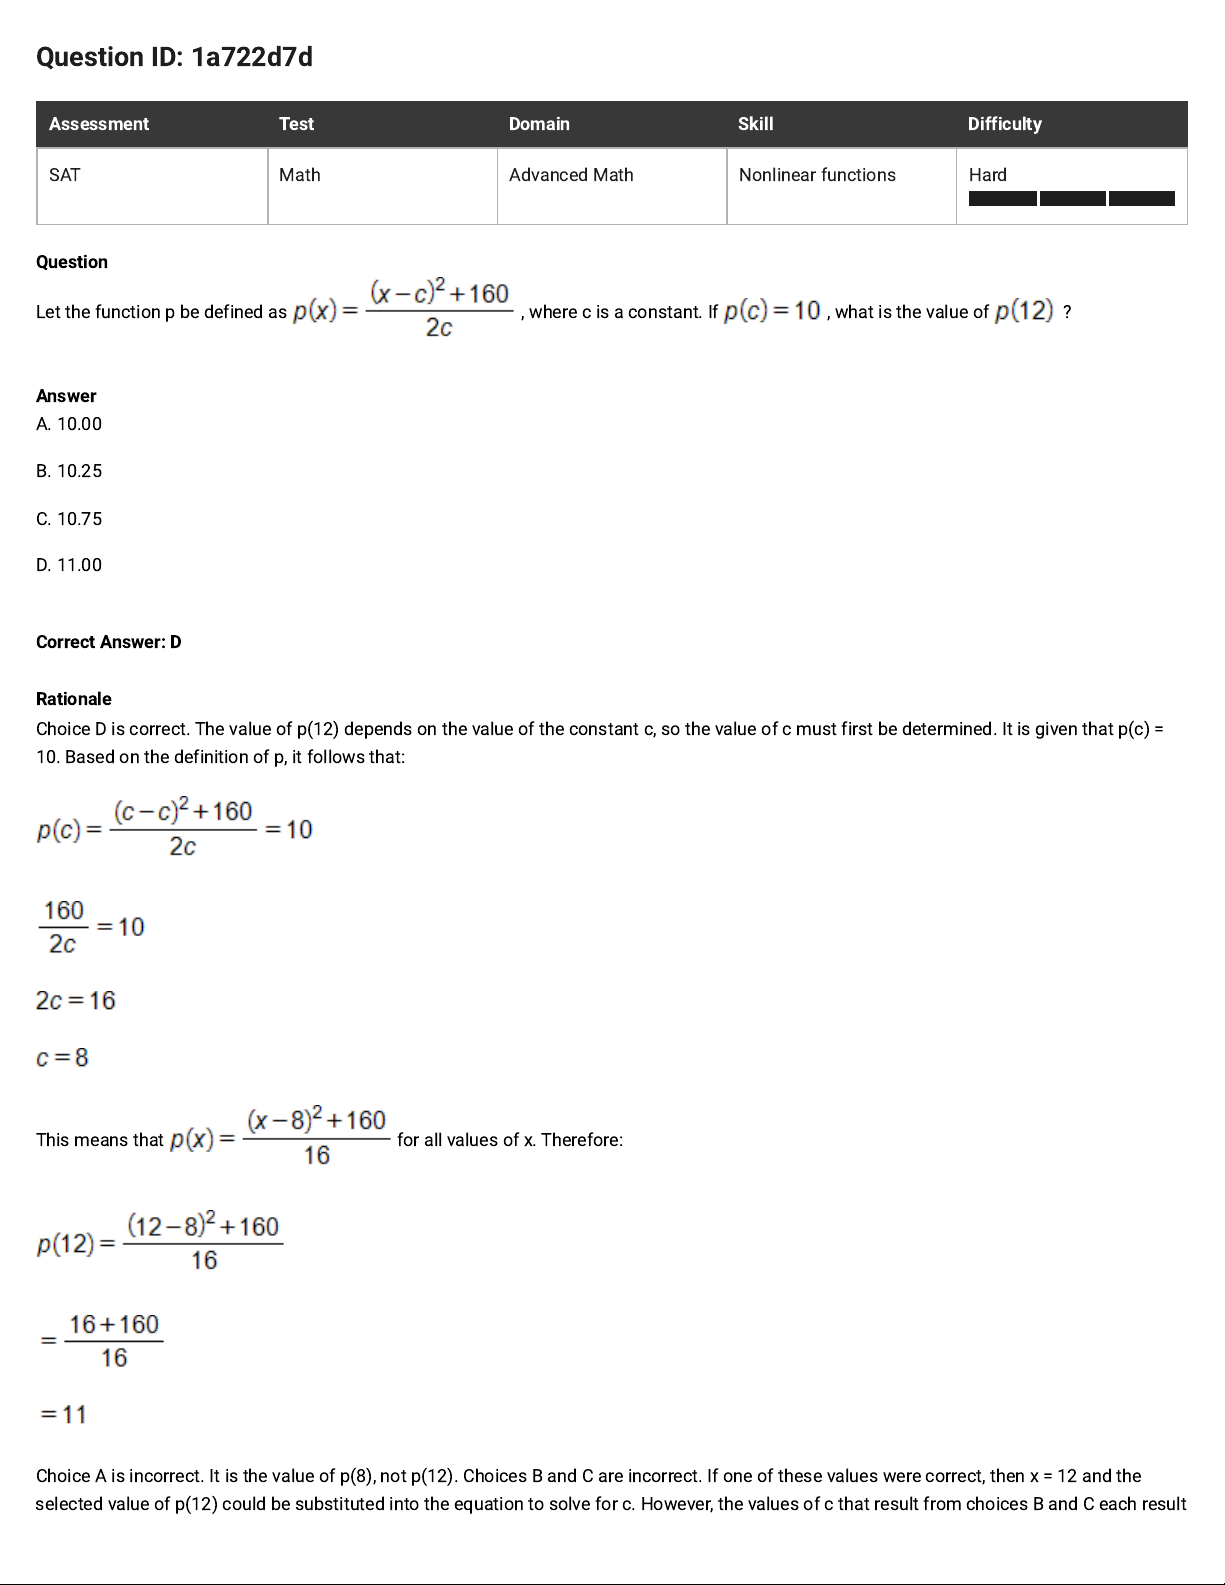
Question ID: 1a722d7d
Assessment Test Domain Skill Difficulty
SAT Math Advanced Math Nonlinear functions Hard
Question
Let the functionp be defined as , wherec is a constant. If , what is the value of ?
Answer
A. 10.00
B. 10.25
C. 10.75
D. 11.00
Correct Answer: D
Rationale
Choice D is correct. The value of p(12) depends on the value of the constant c, so the value of c must first be determined. It is given that p(c) =
10. Based on the definition of p, it follows that:
This means that for all values of x. Therefore:
Choice A is incorrect. It is the value of p(8), not p(12). Choices B and C are incorrect. If one of these values were correct, then x = 12 and the
selected value of p(12) could be substituted into the equation to solve for c. However, the values of c that result from choices B and C each result
Page 91

in p(c) < 10.
Page 92
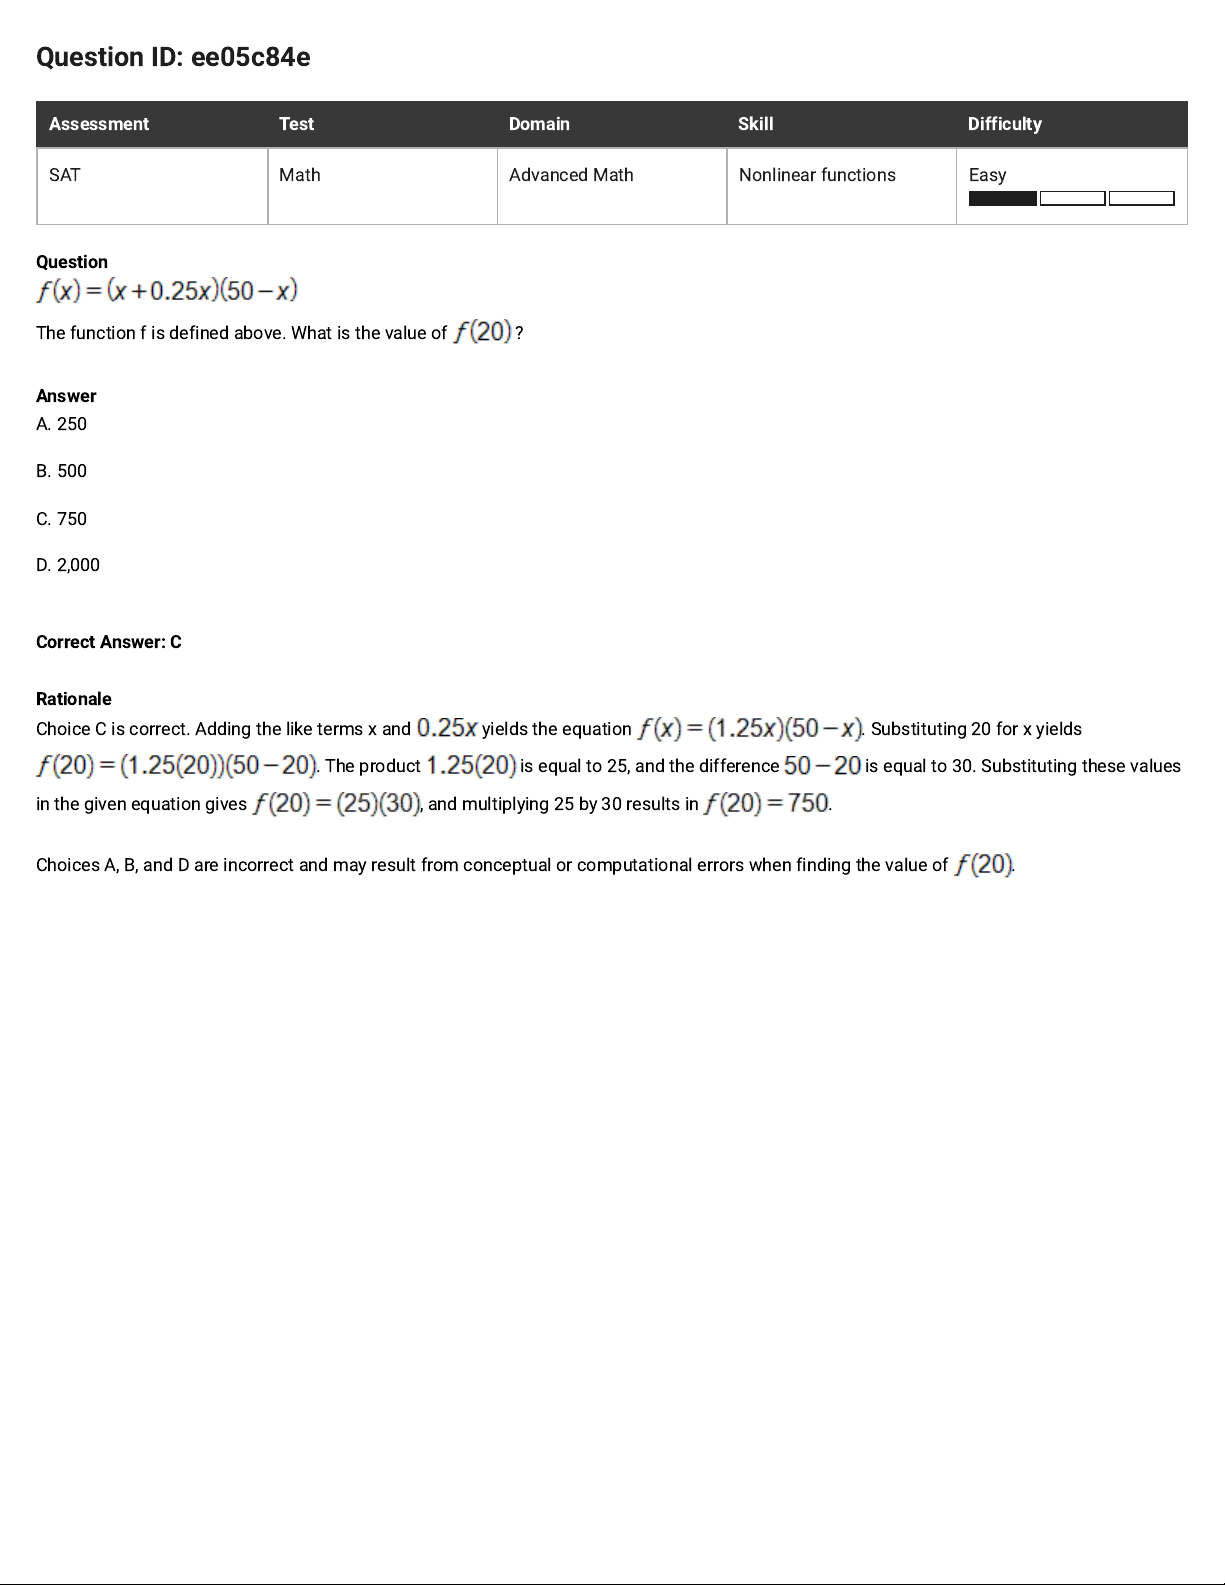
Question ID: ee05c84e
Assessment Test Domain Skill Difficulty
SAT Math Advanced Math Nonlinear functions Easy
Question
The function f is defined above. What is the value of ?
Answer
A. 250
B. 500
C. 750
D. 2,000
Correct Answer: C
Rationale
Choice C is correct. Adding the like terms x and yields the equation . Substituting 20 for x yields
. The product is equal to 25, and the difference is equal to 30. Substituting these values
in the given equation gives , and multiplying 25 by 30 results in
.
Choices A, B, and D are incorrect and may result from conceptual or computational errors when finding the value of .
Page 93
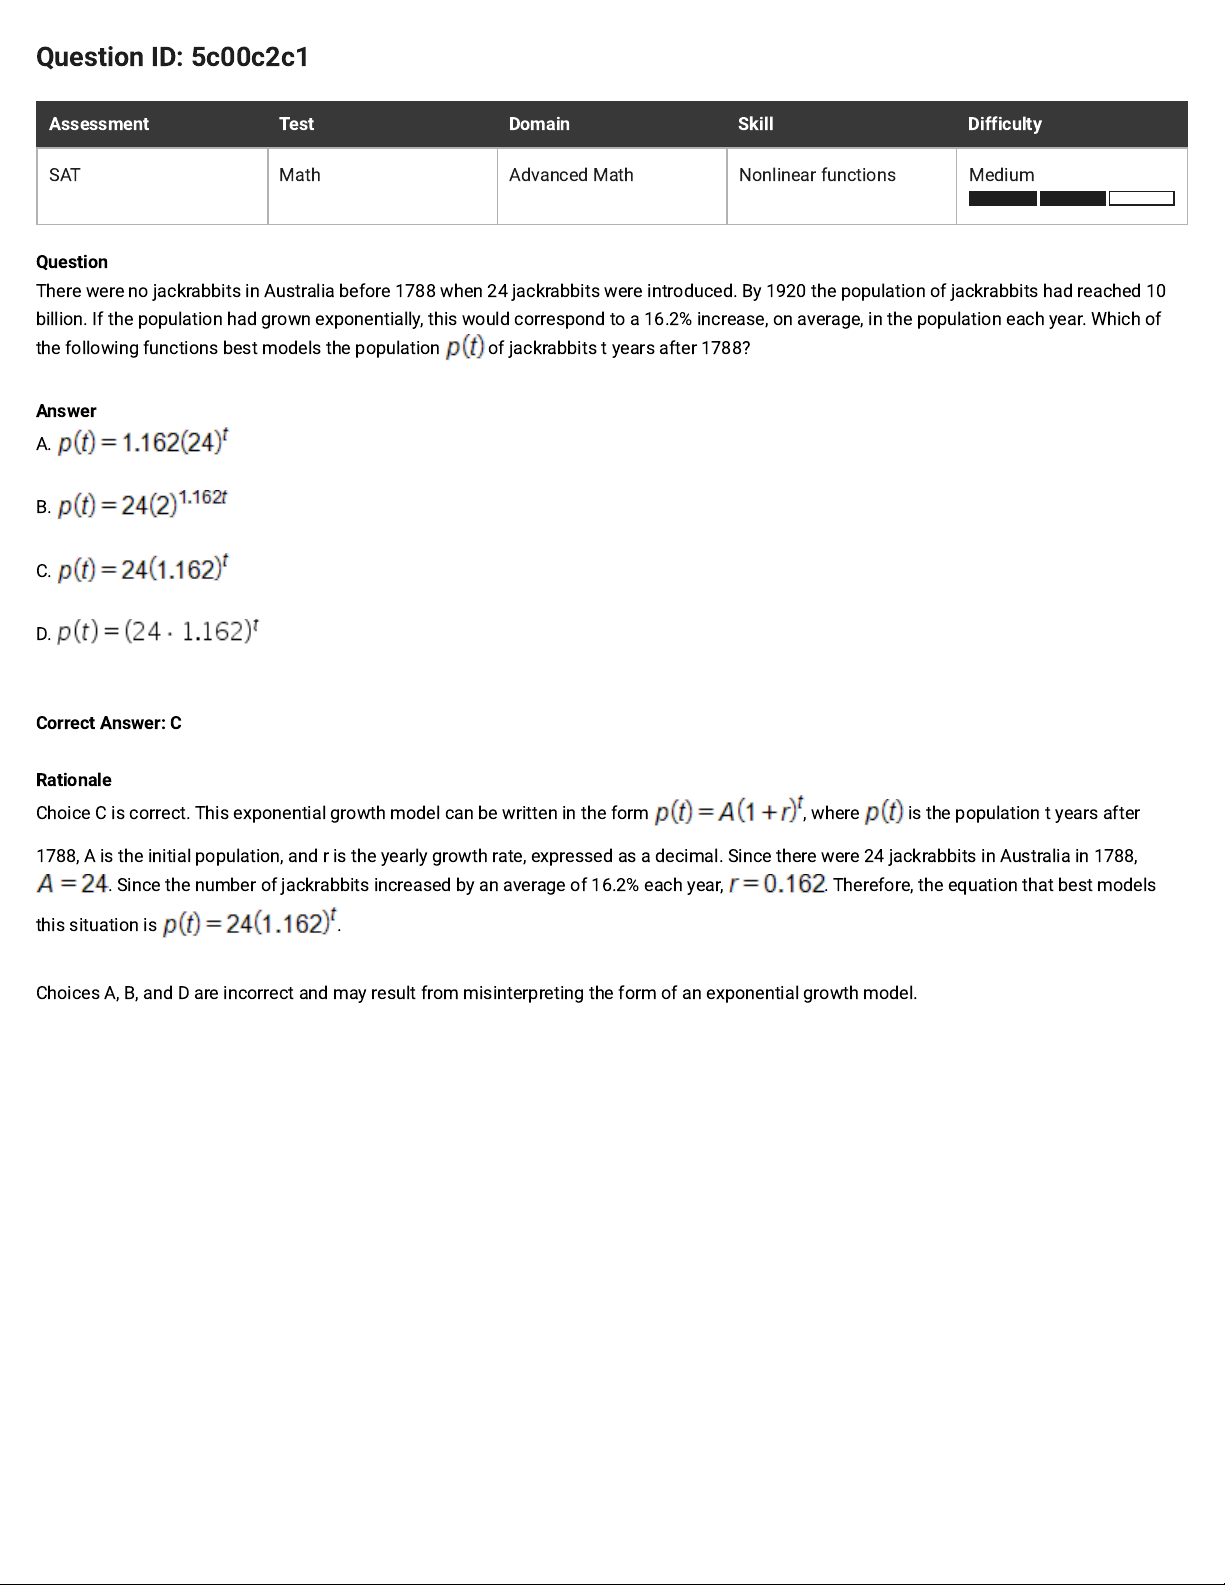
Question ID: 5c00c2c1
Assessment Test Domain Skill Difficulty
SAT Math Advanced Math Nonlinear functions Medium
Question
There were no jackrabbits in Australia before 1788 when 24 jackrabbits were introduced. By 1920 the population of jackrabbits had reached 10
billion. If the population had grown exponentially, this would correspond to a 16.2% increase, on average, in the population each year. Which of
the following functions best models the population of jackrabbits t years after 1788?
Answer
A.
B.
C.
D.
Correct Answer: C
Rationale
Choice C is correct. This exponential growth model can be written in the form , where is the population t years after
1788, A is the initial population, and r is the yearly growth rate, expressed as a decimal. Since there were 24 jackrabbits in Australia in 1788,
. Since the number of jackrabbits increased by an average of 16.2% each year, . Therefore, the equation that best models
this situation is .
Choices A, B, and D are incorrect and may result from misinterpreting the form of an exponential growth model.
 Loading...