

Page 1
Question ID: 85939da5
Assessment Test Domain Skill Difficulty
SAT Math Problem-Solving and
Data Analysis
Inference from sample
statistics and margin of
error
Hard
Question
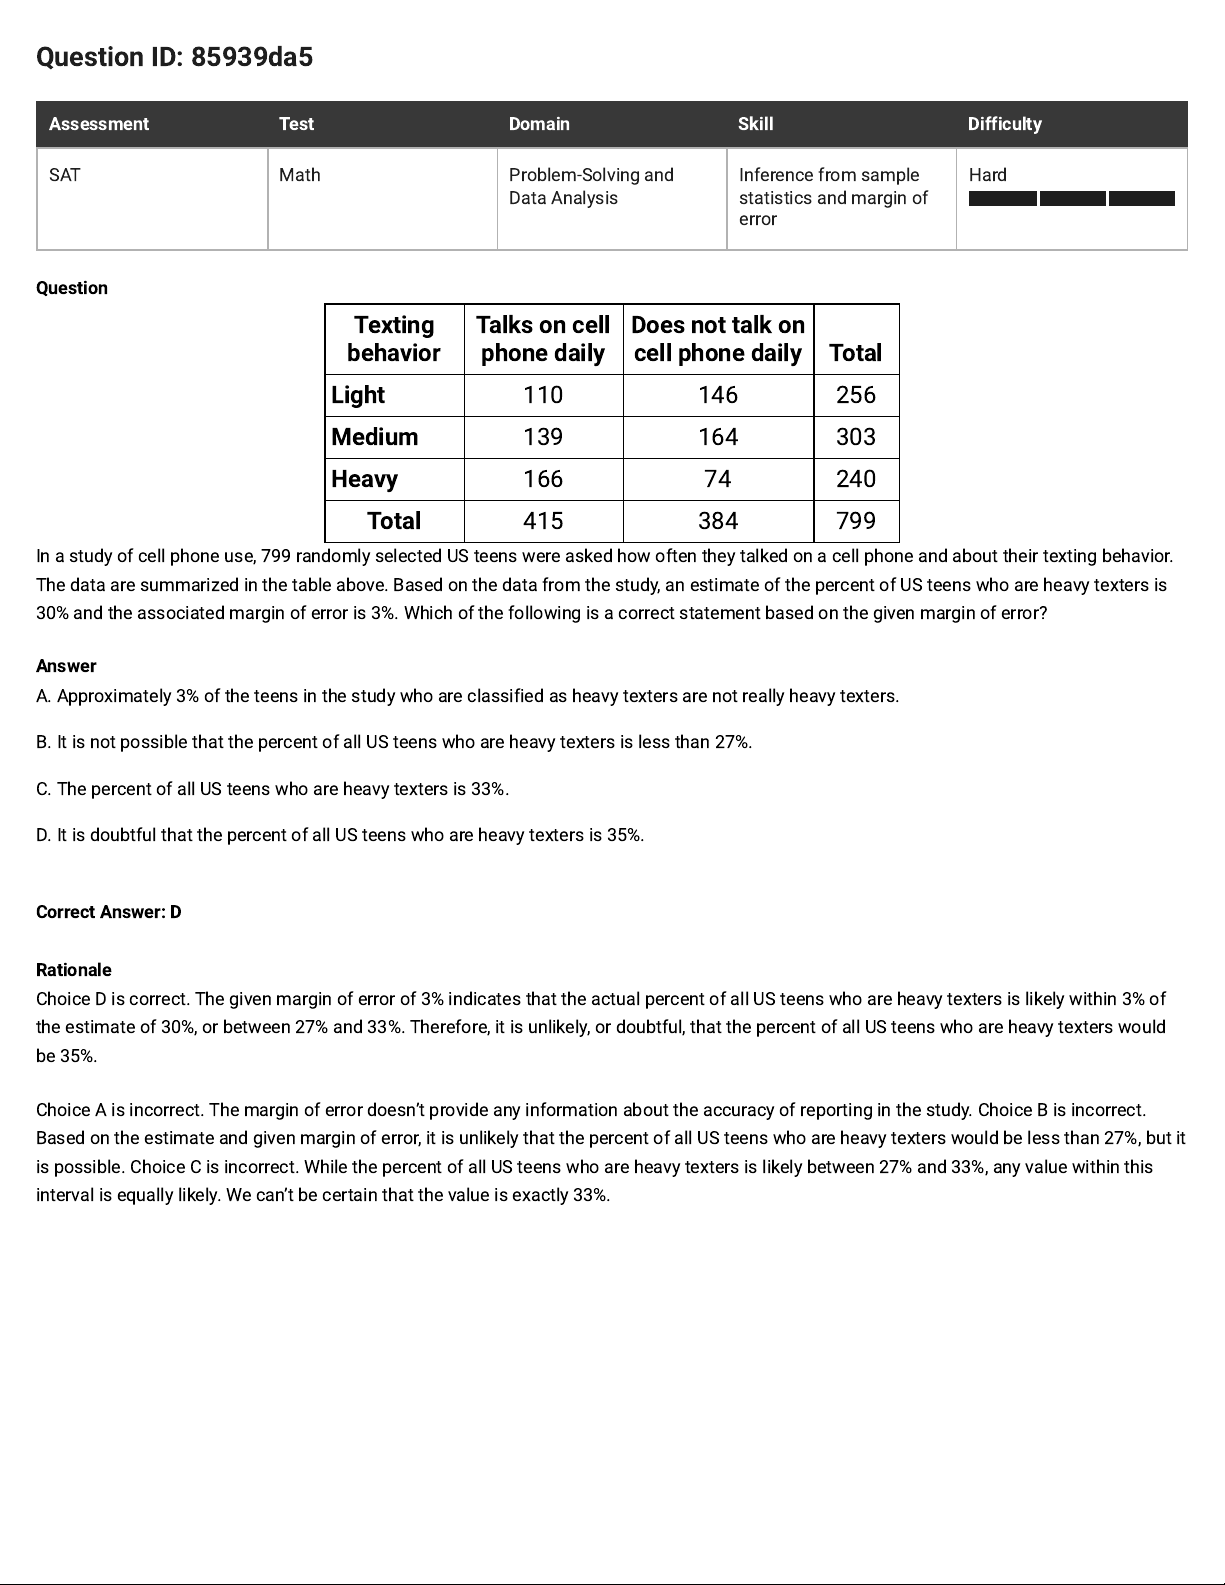
Texting
behavior
Talks on cell
phone daily
Does not talk on
cell phone daily Total
Light
110 146 256
Medium
139 164 303
Heavy
166 74 240
Total
415 384 799
In a study of cell phone use, 799 randomly selected US teens were asked how often they talked on a cell phone and about their texting behavior.
The data are summarized in the table above. Based on the data from the study, an estimate of the percent of US teens who are heavy texters is
30% and the associated margin of error is 3%. Which of the following is a correct statement based on the given margin of error?
Answer
A. Approximately 3% of the teens in the study who are classified as heavy texters are not really heavy texters.
B. It is not possible that the percent of all US teens who are heavy texters is less than 27%.
C. The percent of all US teens who are heavy texters is 33%.
D. It is doubtful that the percent of all US teens who are heavy texters is 35%.
Correct Answer: D
Rationale
Choice D is correct. The given margin of error of 3% indicates that the actual percent of all US teens who are heavy texters is likely within 3% of
the estimate of 30%, or between 27% and 33%. Therefore, it is unlikely, or doubtful, that the percent of all US teens who are heavy texters would
be 35%.
Choice A is incorrect. The margin of error doesn’t provide any information about the accuracy of reporting in the study. Choice B is incorrect.
Based on the estimate and given margin of error, it is unlikely that the percent of all US teens who are heavy texters would be less than 27%, but it
is possible. Choice C is incorrect. While the percent of all US teens who are heavy texters is likely between 27% and 33%, any value within this
interval is equally likely. We can’t be certain that the value is exactly 33%.
Page 2
Question ID: 90eed2e5
Assessment Test Domain Skill Difficulty
SAT Math Problem-Solving and
Data Analysis
Inference from sample
statistics and margin of
error
Easy
Question
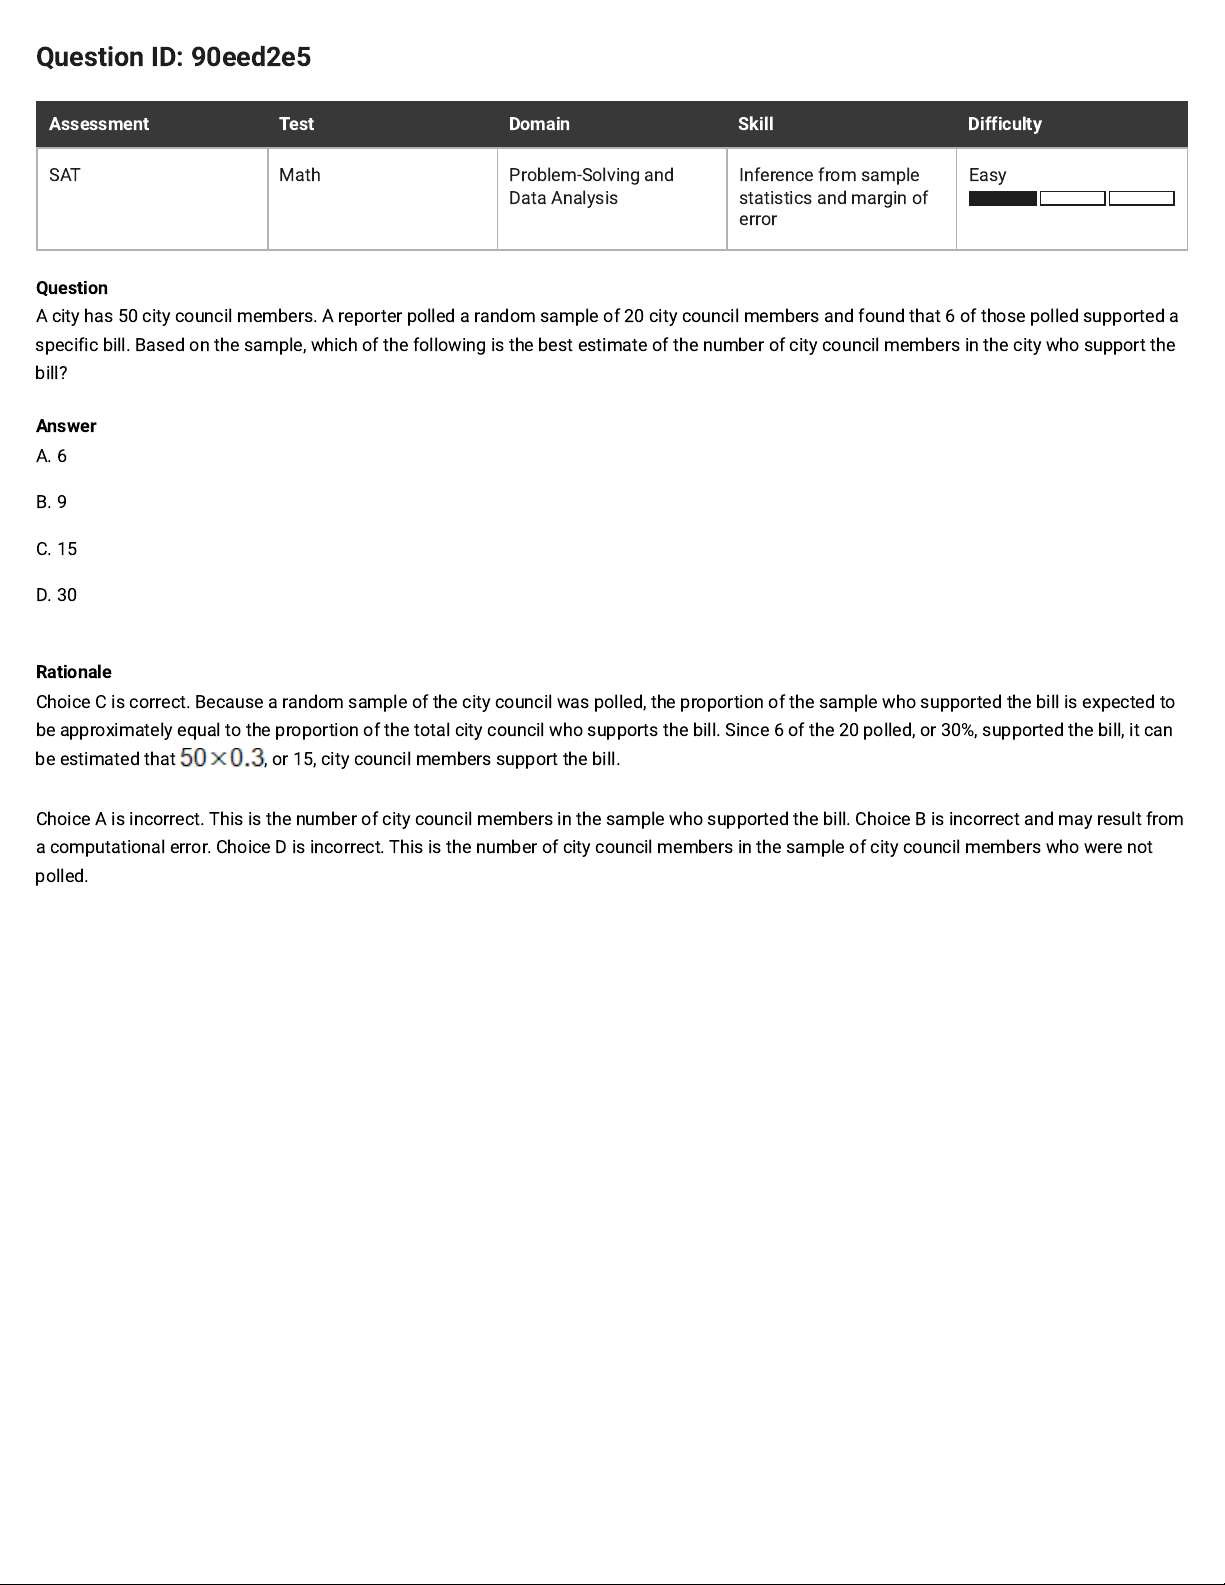
A city has 50city council members. A reporter polled a random sample of 20city council members and found that 6 of those polled supported a
specific bill. Based on the sample, which of the following is the best estimate of the number of city council members in the city who support the
bill?
Answer
A. 6
B. 9
C. 15
D. 30
Rationale
Choice C is correct. Because a random sample of the city council was polled, the proportion of the sample who supported the bill is expected to
be approximately equal to the proportion of the total city council who supports the bill. Since 6 of the 20 polled, or 30%, supported the bill, it can
be estimated that , or 15, city council members support the bill.
Choice A is incorrect. This is the number of city council members in the sample who supported the bill. Choice B is incorrect and may result from
a computational error. Choice D is incorrect. This is the number of city council members in the sample of city council members who were not
polled.
Page 3
Question ID: 53d97af5
Assessment Test Domain Skill Difficulty
SAT Math Problem-Solving and
Data Analysis
Inference from sample
statistics and margin of
error
Medium
Question
A study was done on the weights of different types of fish in a pond. A random sample of fish were caught and marked in order to ensure that
none were weighed more than once. The sample contained 150largemouth bass, of which 30% weighed more than 2 pounds. Which of the
following conclusions is best supported by the sample data?
Answer
A. The majority of all fish in the pond weigh less than 2 pounds.
B. The average weight of all fish in the pond is approximately 2 pounds.
C. Approximately 30% of all fish in the pond weigh more than 2 pounds.
D. Approximately 30% of all largemouth bass in the pond weigh more than 2 pounds.
Correct Answer: D
Rationale
Choice D is correct. The sample of 150 largemouth bass was selected at random from all the largemouth bass in the pond, and since 30% of the
fish in the sample weighed more than 2 pounds, it can be concluded that approximately 30% of all largemouth bass in the pond weigh more than
2 pounds.
Choices A, B, and C are incorrect. Since the sample contained 150 largemouth bass, of which 30% weighed more than 2 pounds, this result can
be generalized only to largemouth bass in the pond, not to all fish in the pond.
Page 4
Question ID: f8f79e11
Assessment Test Domain Skill Difficulty
SAT Math Problem-Solving and
Data Analysis
Inference from sample
statistics and margin of
error
Medium
Question
A park ranger asked a random sample of visitors how far they hiked during their visit. Based on the responses, the estimated mean was found to
be 4.5 miles, with an associated margin of error of 0.5 miles. Which of the following is the best conclusion from these data?
Answer
A. It is likely that all visitors hiked between 4 and 5 miles.
B. It is likely that most visitors hiked exactly 4.5 miles.
C. It is not possible that any visitor hiked less than 3 miles.
D. It is plausible that the mean distance hiked for all visitors is between 4 and 5 miles.
Correct Answer: D
Rationale
Choice D is correct. The given estimated mean has an associated margin of error because from sample data, the population mean can’t be
determined precisely. Rather, from the sample mean, an interval can be determined within which it’s plausible that the population’s mean is likely
to lie. Since the estimated mean is 4.5 miles with an associated margin of error of 0.5 miles, it follows that between miles and
miles, or between 4 and 5 miles, is plausibly the mean distance hiked for all visitors.
Choices A, B, and C are incorrect. Based on the estimated mean, no determination can be made about the number of miles hiked for all visitors
to the park.
Page 5
Question ID: 2c76bcce
Assessment Test Domain Skill Difficulty
SAT Math Problem-Solving and
Data Analysis
Inference from sample
statistics and margin of
error
Easy
Question
A company designs and makes handbags. To estimate the mean weight of the handbags made by the company on a particular day, a sample of
the handbags made by the company on that day was selected at random. Based on the sample, it is estimated that the mean weight of all
handbags made by the company on that day is , with an associated margin of error of . Based on this estimate and
associated margin of error, which of the following is the most plausible conclusion?
Answer
A. The mean weight of all handbags made by the company on that day is between and .
B. The actual weights of all handbags made by the company on that day are between and .
C. The actual weights of all handbags from the sample are between and .
D. The mean weight of all handbags made by the company on that day is .
Correct Answer: A
Rationale
Choice A is correct. It's given that the estimated mean weight of all handbags made by the company on a particular day is
, with an
associated margin of error of
. It follows that plausible values for the mean weight are between
and
. Therefore, the most plausible conclusion is that the mean weight of all handbags made by the company on that day isbetween
and .
Choice B is incorrect and may result from conceptual or calculation errors.
Choice C is incorrect and may result from conceptual or calculation errors.
Choice D is incorrect and may result from conceptual or calculation errors.
Page 6
Question ID: e03f3477
Assessment Test Domain Skill Difficulty
SAT Math Problem-Solving and
Data Analysis
Inference from sample
statistics and margin of
error
Medium
Question
A sample consisting of adults who own televisions was selected at random for a study. Based on the sample, it is estimated that of all
adults who own televisions use their televisions to watch nature shows, with an associated margin of error of . Which of the following is
the most plausible conclusion about all adults who own televisions?
Answer
A. More than of all adults who own televisions use their televisions to watch nature shows.
B. Between and of all adults who own televisions use their televisions to watch nature shows.
C. Since the sample included adults who own televisions and not just those who use their televisions to watch nature shows, no conclusion can
be made.
D. Since the sample did not include all the people who watch nature shows, no conclusion can be made.
Correct Answer: B
Rationale
Choice B is correct. It's given that based on a sample selected at random, it's estimated that of all adults who own televisions use their
televisions to watch nature shows, with an associated margin of error of
. Subtracting the margin of error from the estimate and adding
the margin of error to the estimate gives an interval of plausible values for the true percentage of adults who own televisions who use their
televisions to watch nature shows. This means it's plausible that between , or
, and
, or
, of all
adults who own televisions use their televisions to watch nature shows. Therefore, of the given choices, the most plausible conclusion is that
between
and
of all adults who own televisions use their televisions to watch nature shows.
Choice A is incorrect and may result from conceptual errors.
Choice C is incorrect. To make a plausible conclusion about all adults who own televisions, the sample must be selected at random from all
adults who own televisions, not just those who use their televisions to watch nature shows.
Choice D is incorrect. Since the sample was selected at random from all adults who own televisions, a plausible conclusion can be made about
all adults who own televisions.
Page 7
Question ID: e7d9649f
Assessment Test Domain Skill Difficulty
SAT Math Problem-Solving and
Data Analysis
Inference from sample
statistics and margin of
error
Easy
Question
A random sample of 50people from a town with a population of14,878 were asked to name their favorite flavor of icecream. If 7people in the
sample named chocolate as their favorite ice‑cream flavor, about how many people in the town would be expected to name chocolate?
Answer
A. 350
B. 2,100
C. 7,500
D. 10,500
Correct Answer: B
Rationale
Choice B is correct. Let x be the number of people in the entire town that would be expected to name chocolate. Since the sample of 50 people
was selected at random, it is reasonable to expect that the proportion of people who named chocolate as their favorite ice-cream flavor would be
the same for both the sample and the town population. Symbolically, this can be expressed as . Using cross multiplication,
; solving for x yields 2,083. The choice closest to the value of 2,083 is choice B, 2,100.
Choices A, C, and D are incorrect and may be the result of errors when setting up the proportion, solving for the unknown, or incorrectly
comparing the choices to the number of people expected to name chocolate, 2,083.
Page 8
Question ID: fc46af57
Assessment Test Domain Skill Difficulty
SAT Math Problem-Solving and
Data Analysis
Inference from sample
statistics and margin of
error
Medium
Question
A bag containing 10,000 beads of assorted colors is purchased from a craft store. To estimate the percent of red beads in the bag, a sample of
beads is selected at random. The percent of red beads in the bag was estimated to be 15%, with an associated margin of error of 2%. If r is the
actual number of red beads in the bag, which of the following is most plausible?
Answer
A.
B.
C.
D.
Correct Answer: B
Rationale
Choice B is correct. It was estimated that 15% of the beads in the bag are red. Since the bag contains 10,000 beads, it follows that there are an
estimated red beads. It’s given that the margin of error is 2%, or beads. If the estimate is
too high, there could plausibly be red beads. If the estimate is too low, there could plausibly be
red beads. Therefore, the most plausible statement of the actual number of red beads in the bag is
.
Choices A and D are incorrect and may result from misinterpreting the margin of error. It’s unlikely that more than 1,700 beads or fewer than
1,300 beads in the bag are red. Choice C is incorrect because 200 is the margin of error for the number of red beads, not the lower bound of the
range of red beads.
Page 9
Question ID: 308084c5
Assessment Test Domain Skill Difficulty
SAT Math Problem-Solving and
Data Analysis
Inference from sample
statistics and margin of
error
Hard
Question
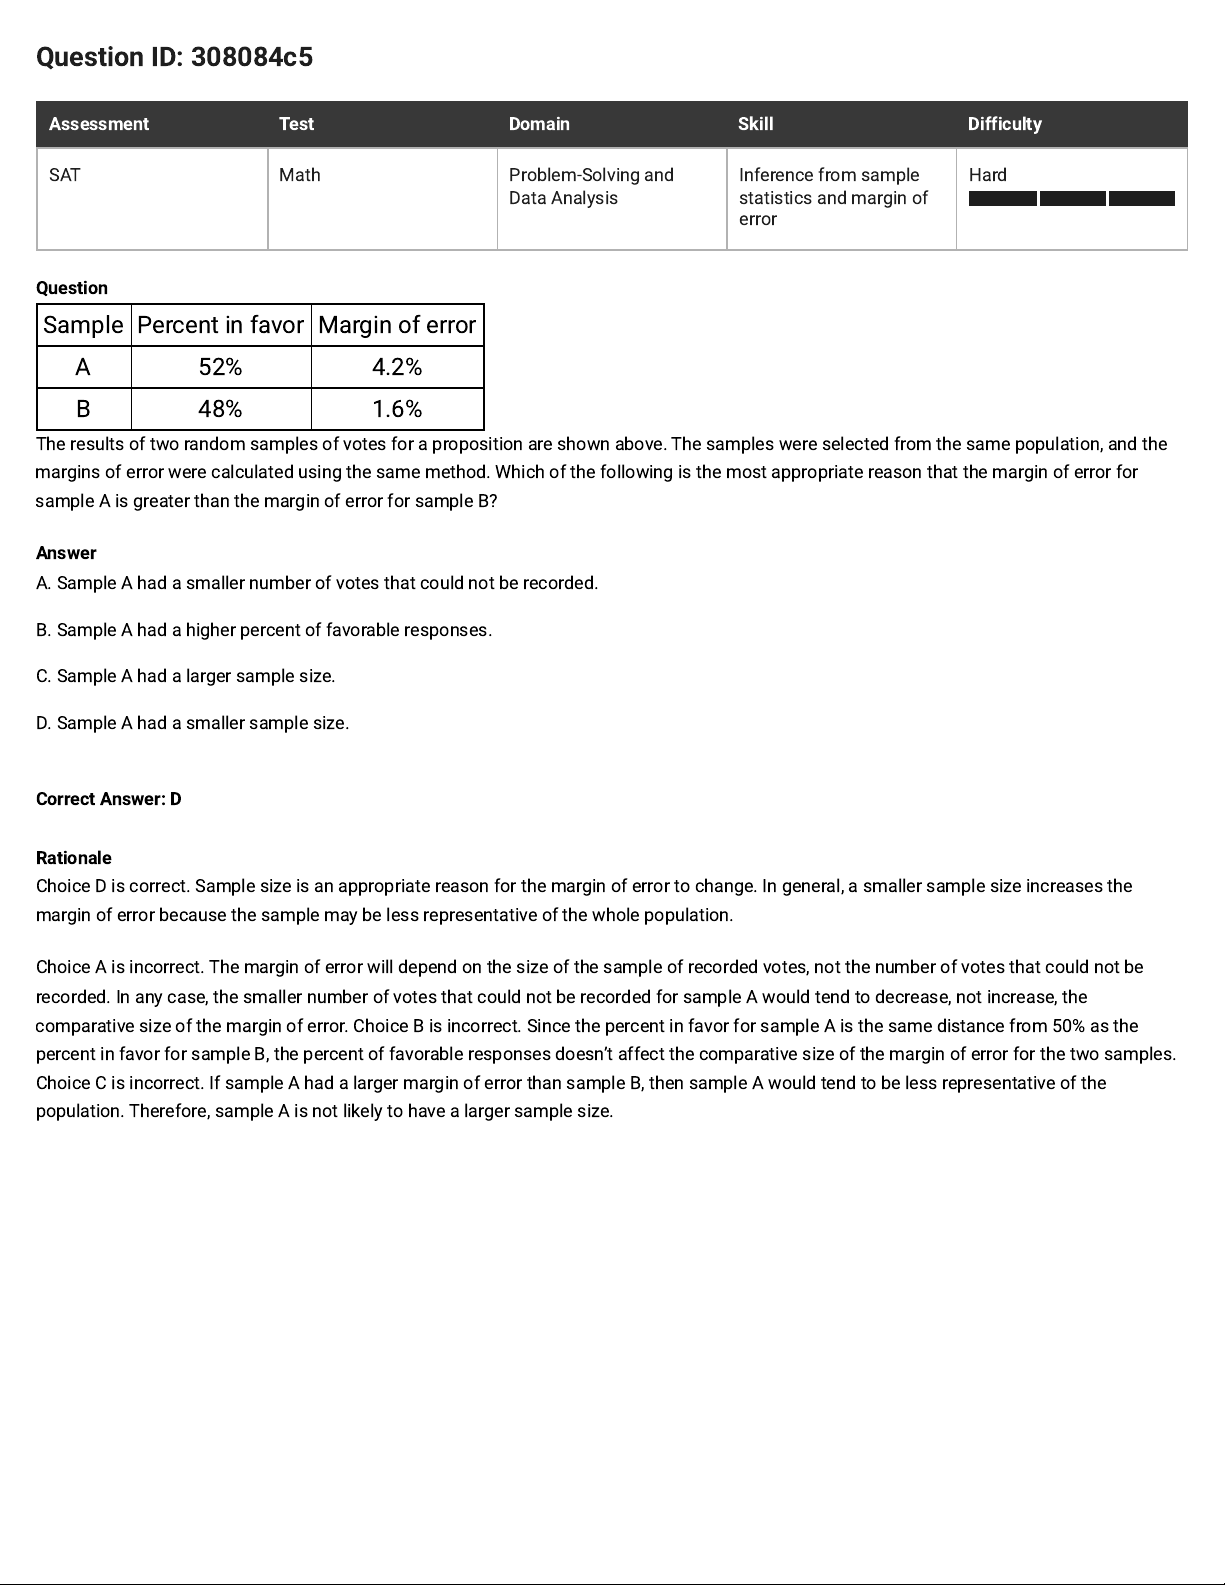
Sample Percent in favor Margin of error
A 52% 4.2%
B 48% 1.6%
The results of tworandom samples of votes for a proposition areshown above. The samples were selected from the same population, and the
margins of error were calculated using the same method. Which of the following is the most appropriate reason that the margin of error for
sample A is greater than the margin of error for sample B?
Answer
A. Sample A had a smaller number of votes that could not be recorded.
B. Sample A had a higher percent of favorable responses.
C. Sample A had a larger sample size.
D. Sample A had a smaller sample size.
Correct Answer: D
Rationale
Choice D is correct. Sample size is an appropriate reason for the margin of error to change. In general, a smaller sample size increases the
margin of error because the sample may be less representative of the whole population.
Choice A is incorrect. The margin of error will depend on the size of the sample of recorded votes, not the number of votes that could not be
recorded. In any case, the smaller number of votes that could not be recorded for sample A would tend to decrease, not increase, the
comparative size of the margin of error. Choice B is incorrect. Since the percent in favor for sample A is the same distance from 50% as the
percent in favor for sample B, the percent of favorable responses doesn’t affect the comparative size of the margin of error for the two samples.
Choice C is incorrect. If sample A had a larger margin of error than sample B, then sample A would tend to be less representative of the
population. Therefore, sample A is not likely to have a larger sample size.
Page 10
Question ID: f04d40b2
Assessment Test Domain Skill Difficulty
SAT Math Problem-Solving and
Data Analysis
Inference from sample
statistics and margin of
error
Medium
Question
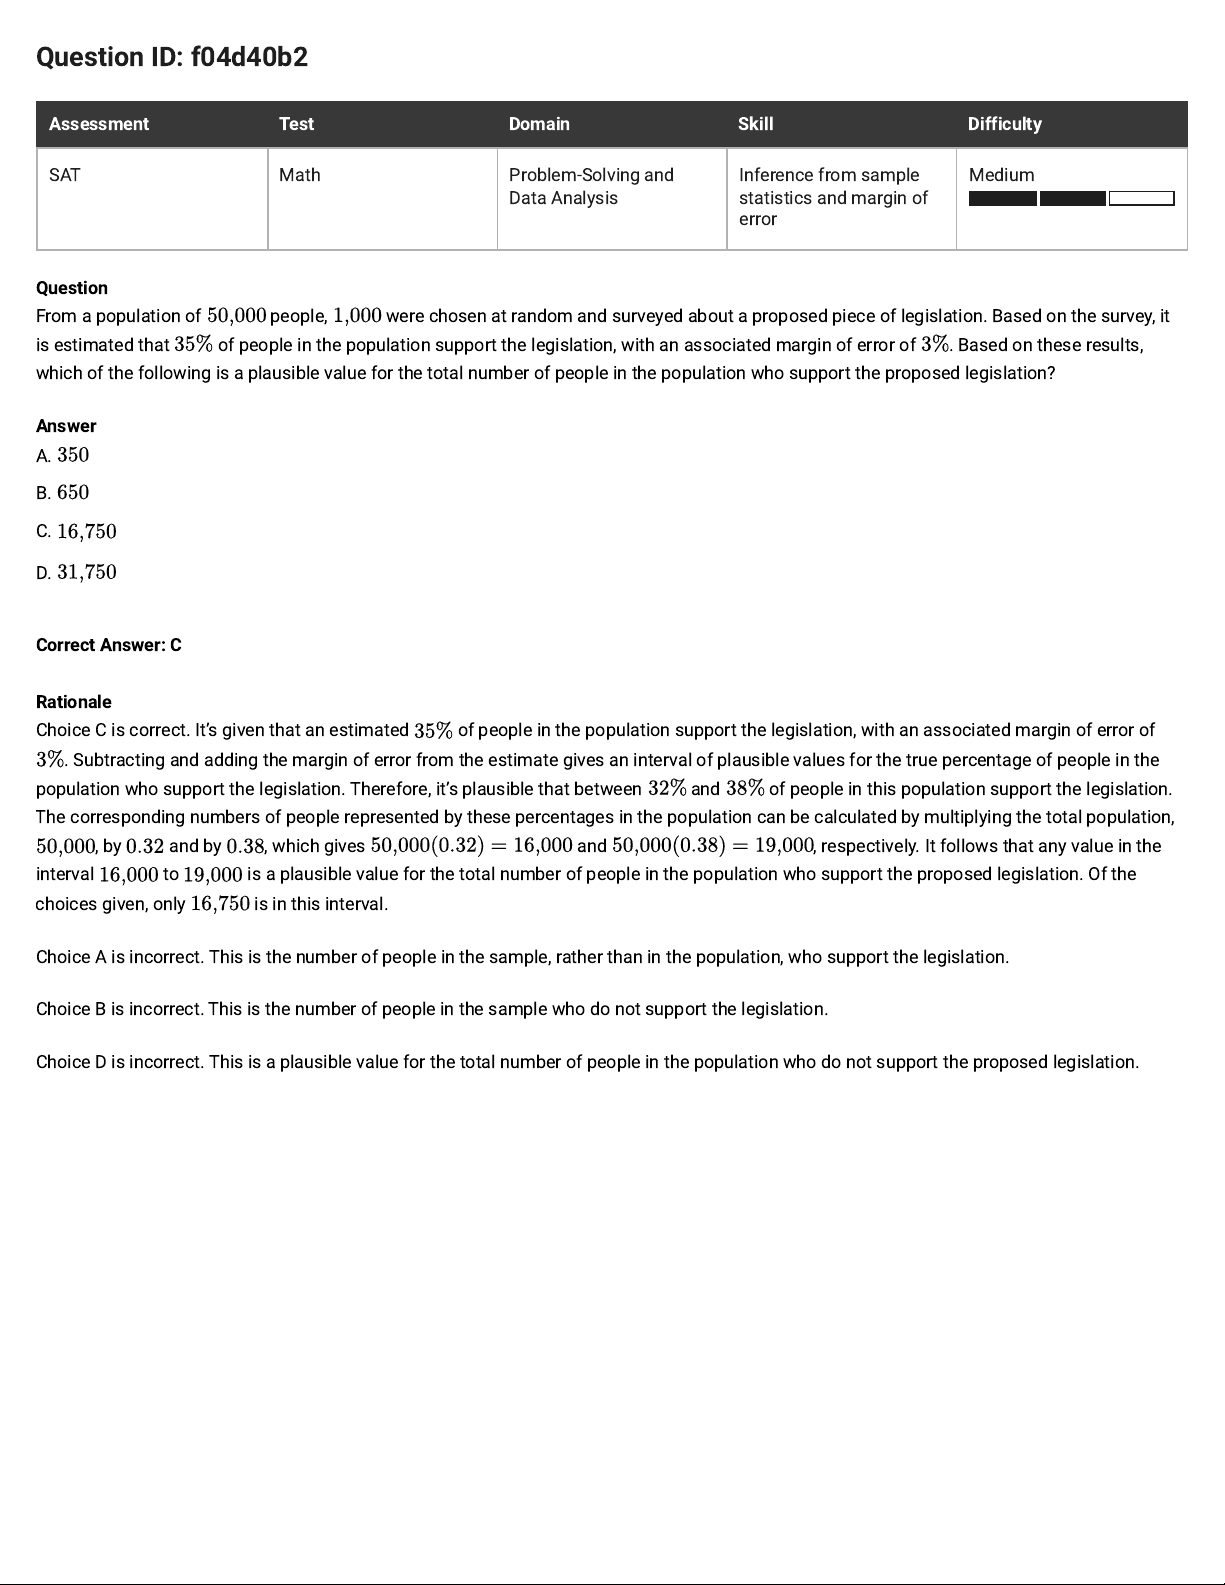
From a population of people, were chosen at random and surveyed about a proposed piece of legislation. Based on the survey, it
is estimated that of people in the population support the legislation, with an associated margin of error of . Based on these results,
which of the following is a plausible value for the total number of people in the population who support the proposed legislation?
Answer
A.
B.
C.
D.
Correct Answer: C
Rationale
Choice C is correct. It’s given that an estimated
of people in the population support the legislation, with an associated margin of error of
. Subtracting and adding the margin of error from the estimate gives an interval of plausible values for the true percentage of people in the
population who support the legislation. Therefore, it’s plausible that between
and
of people in this population support the legislation.
The corresponding numbers of people represented by these percentages in the population can be calculated by multiplying the total population,
, by and by , which gives and , respectively. It follows that any value in the
interval to is a plausible value for the total number of people in the population who support the proposed legislation. Of the
choices given, only is in this interval.
Choice A is incorrect. This is the number of people in the sample, rather than in the population, who support the legislation.
Choice B is incorrect. This is the number of people in the sample who do not support the legislation.
Choice D is incorrect. This is a plausible value for the total number of people in the population who do not support the proposed legislation.
Page 11
Question ID: f4b3672a
Assessment Test Domain Skill Difficulty
SAT Math Problem-Solving and
Data Analysis
Inference from sample
statistics and margin of
error
Easy
Question
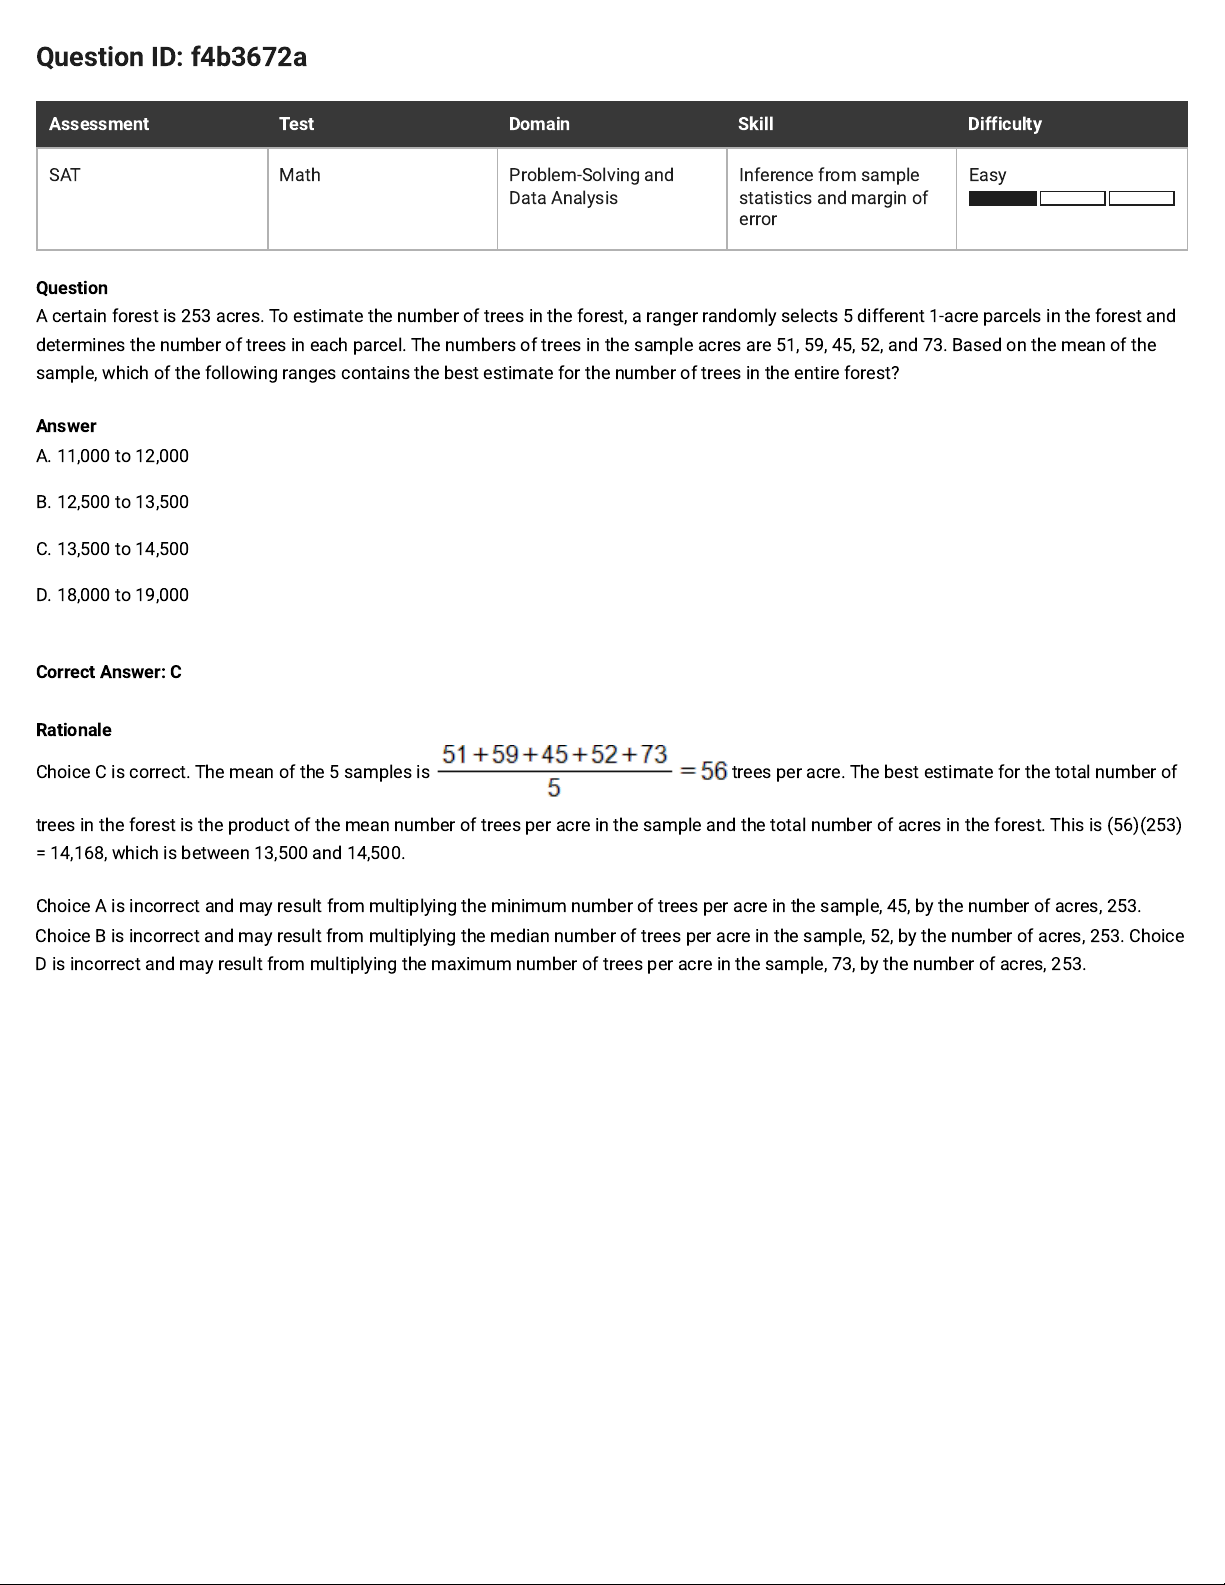
A certain forest is 253 acres. To estimate the numberof trees in the forest, a ranger randomly selects 5 different 1-acre parcels in the forest and
determines the number of trees in each parcel. The numbers of trees in the sample acres are 51, 59, 45, 52, and 73. Based on the mean of the
sample, which of the following ranges contains the best estimate for the number of trees in the entire forest?
Answer
A. 11,000 to 12,000
B. 12,500 to 13,500
C. 13,500 to 14,500
D. 18,000 to 19,000
Correct Answer: C
Rationale
Choice C is correct. The mean of the 5 samples is trees per acre. The best estimate for the total number of
trees in the forest is the product of the mean number of trees per acre in the sample and the total number of acres in the forest. This is (56)(253)
= 14,168, which is between 13,500 and 14,500.
Choice A is incorrect and may result from multiplying the minimum number of trees per acre in the sample, 45, by the number of acres, 253.
Choice B is incorrect and may result from multiplying the median number of trees per acre in the sample, 52, by the number of acres, 253. Choice
D is incorrect and may result from multiplying the maximum number of trees per acre in the sample, 73, by the number of acres, 253.
Page 12
Question ID: 0108ac2d
Assessment Test Domain Skill Difficulty
SAT Math Problem-Solving and
Data Analysis
Inference from sample
statistics and margin of
error
Easy
Question
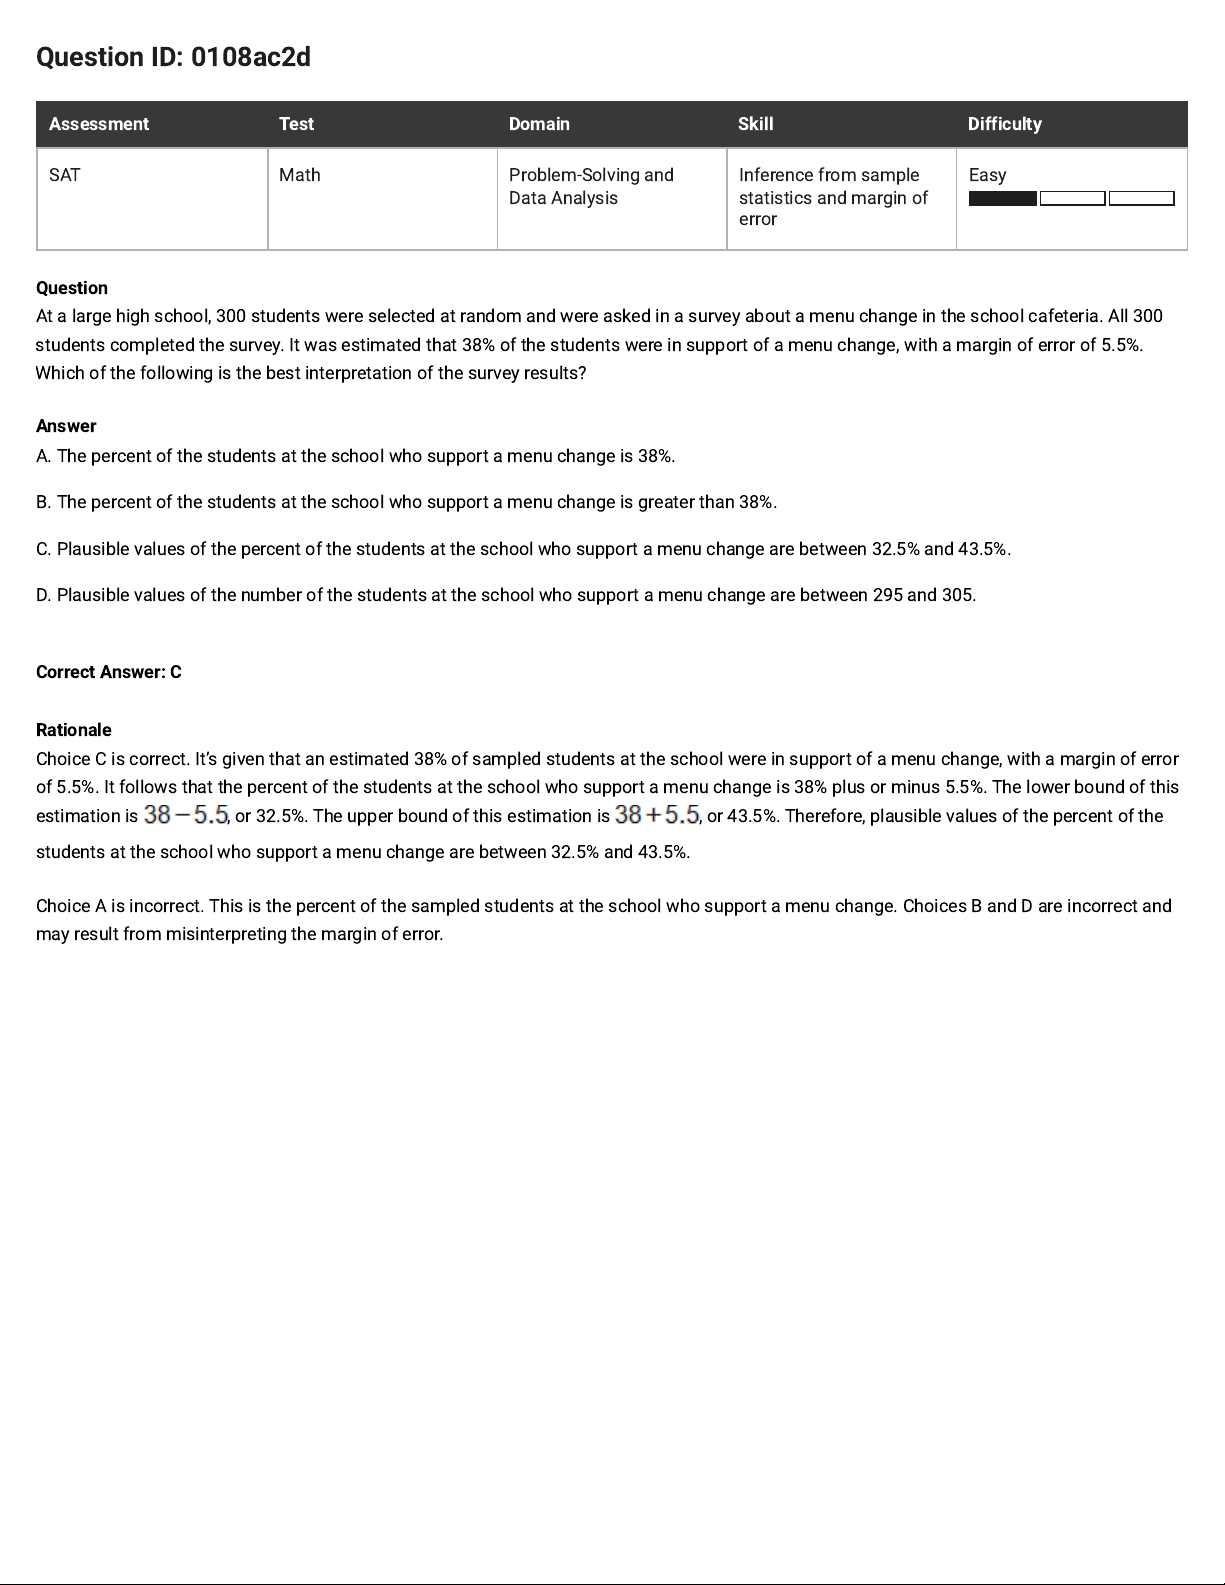
At a large high school, 300 students were selected at random and were asked in a survey about a menu change in the school cafeteria. All 300
students completed the survey. It was estimated that 38% of the students were in support of a menu change, with a margin of error of 5.5%.
Which of the following is the best interpretation of the survey results?
Answer
A. The percent of the students at the school who support a menu change is 38%.
B. The percent of the students at the school who support a menu change is greater than 38%.
C. Plausible values of the percent of the students at the school who support a menu change are between 32.5% and 43.5%.
D. Plausible values of the number of the students at the school who support a menuchange are between 295 and 305.
Correct Answer: C
Rationale
Choice C is correct. It’s given that an estimated 38% of sampled students at the school were in support of a menu change, with a margin of error
of 5.5%. It follows that the percent of the students at the school who support a menu change is 38% plus or minus 5.5%. The lower bound of this
estimation is , or 32.5%. The upper bound of this estimation is , or 43.5%. Therefore, plausible values of the percent of the
students at the school who support a menu change are between 32.5% and 43.5%.
Choice A is incorrect. This is the percent of the sampled students at the school who support a menu change. Choices B and D are incorrect and
may result from misinterpreting the margin of error.
Page 13
Question ID: 9ba3e283
Assessment Test Domain Skill Difficulty
SAT Math Problem-Solving and
Data Analysis
Inference from sample
statistics and margin of
error
Hard
Question
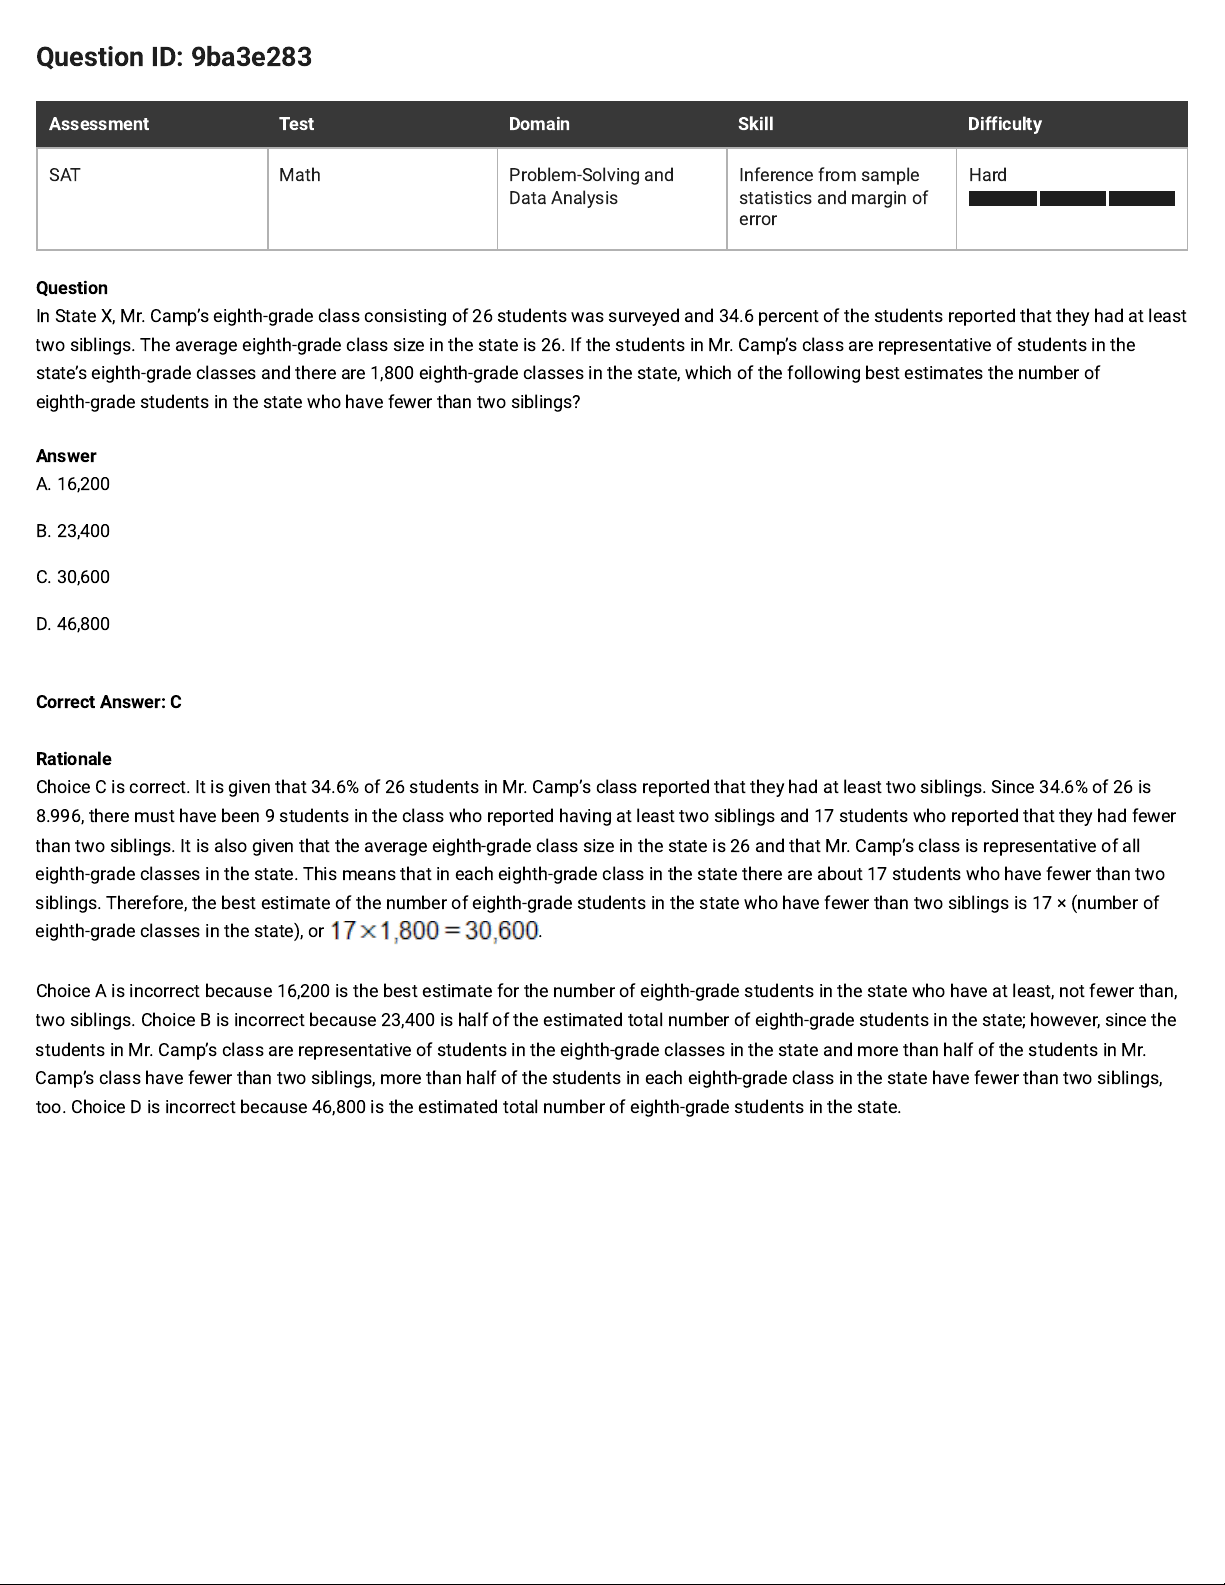
In State X, Mr. Camp’s eighth-grade class consisting of 26 students was surveyed and 34.6 percent of the students reported that they had at least
two siblings. The average eighth‑grade class size in the state is 26. If the students in Mr. Camp’s class are representative of students in the
state’s eighth-grade classes and there are 1,800 eighth-grade classes in the state, which of the following best estimates the number of
eighth‑grade students in the state who have fewer thantwo siblings?
Answer
A. 16,200
B. 23,400
C. 30,600
D. 46,800
Correct Answer: C
Rationale
Choice C is correct. It is given that 34.6% of 26 students in Mr. Camp’s class reported that they had at least two siblings. Since 34.6% of 26 is
8.996, there must have been 9 students in the class who reported having at least two siblings and 17 students who reported that they had fewer
than two siblings. It is also given that the average eighth-grade class size in the state is 26 and that Mr. Camp’s class is representative of all
eighth-grade classes in the state. This means that in each eighth-grade class in the state there are about 17 students who have fewer than two
siblings. Therefore, the best estimate of the number of eighth-grade students in the state who have fewer than two siblings is 17 × (number of
eighth-grade classes in the state), or .
Choice A is incorrect because 16,200 is the best estimate for the number of eighth-grade students in the state who have at least, not fewer than,
two siblings. Choice B is incorrect because 23,400 is half of the estimated total number of eighth-grade students in the state; however, since the
students in Mr. Camp’s class are representative of students in the eighth-grade classes in the state and more than half of the students in Mr.
Camp’s class have fewer than two siblings, more than half of the students in each eighth-grade class in the state have fewer than two siblings,
too. Choice D is incorrect because 46,800 is the estimated total number of eighth-grade students in the state.
Page 14
Question ID: 89f8d08a
Assessment Test Domain Skill Difficulty
SAT Math Problem-Solving and
Data Analysis
Inference from sample
statistics and margin of
error
Medium
Question
A store manager reviewed the receipts from 80customers who were selected at random from all the customers who made purchases last
Thursday. Of those selected, 20receipts showed that the customer had purchased fruit. If 1,500customers made purchases last Thursday,
which of the following is the most appropriate conclusion?
Answer
A. Exactly 75 customers must have purchased fruit last Thursday.
B. Exactly 375customers must have purchased fruit last Thursday.
C. The best estimate for the number of customers who purchased fruit last Thursday is75.
D. The best estimate for the number of customers who purchased fruit last Thursday is375.
Correct Answer: D
Rationale
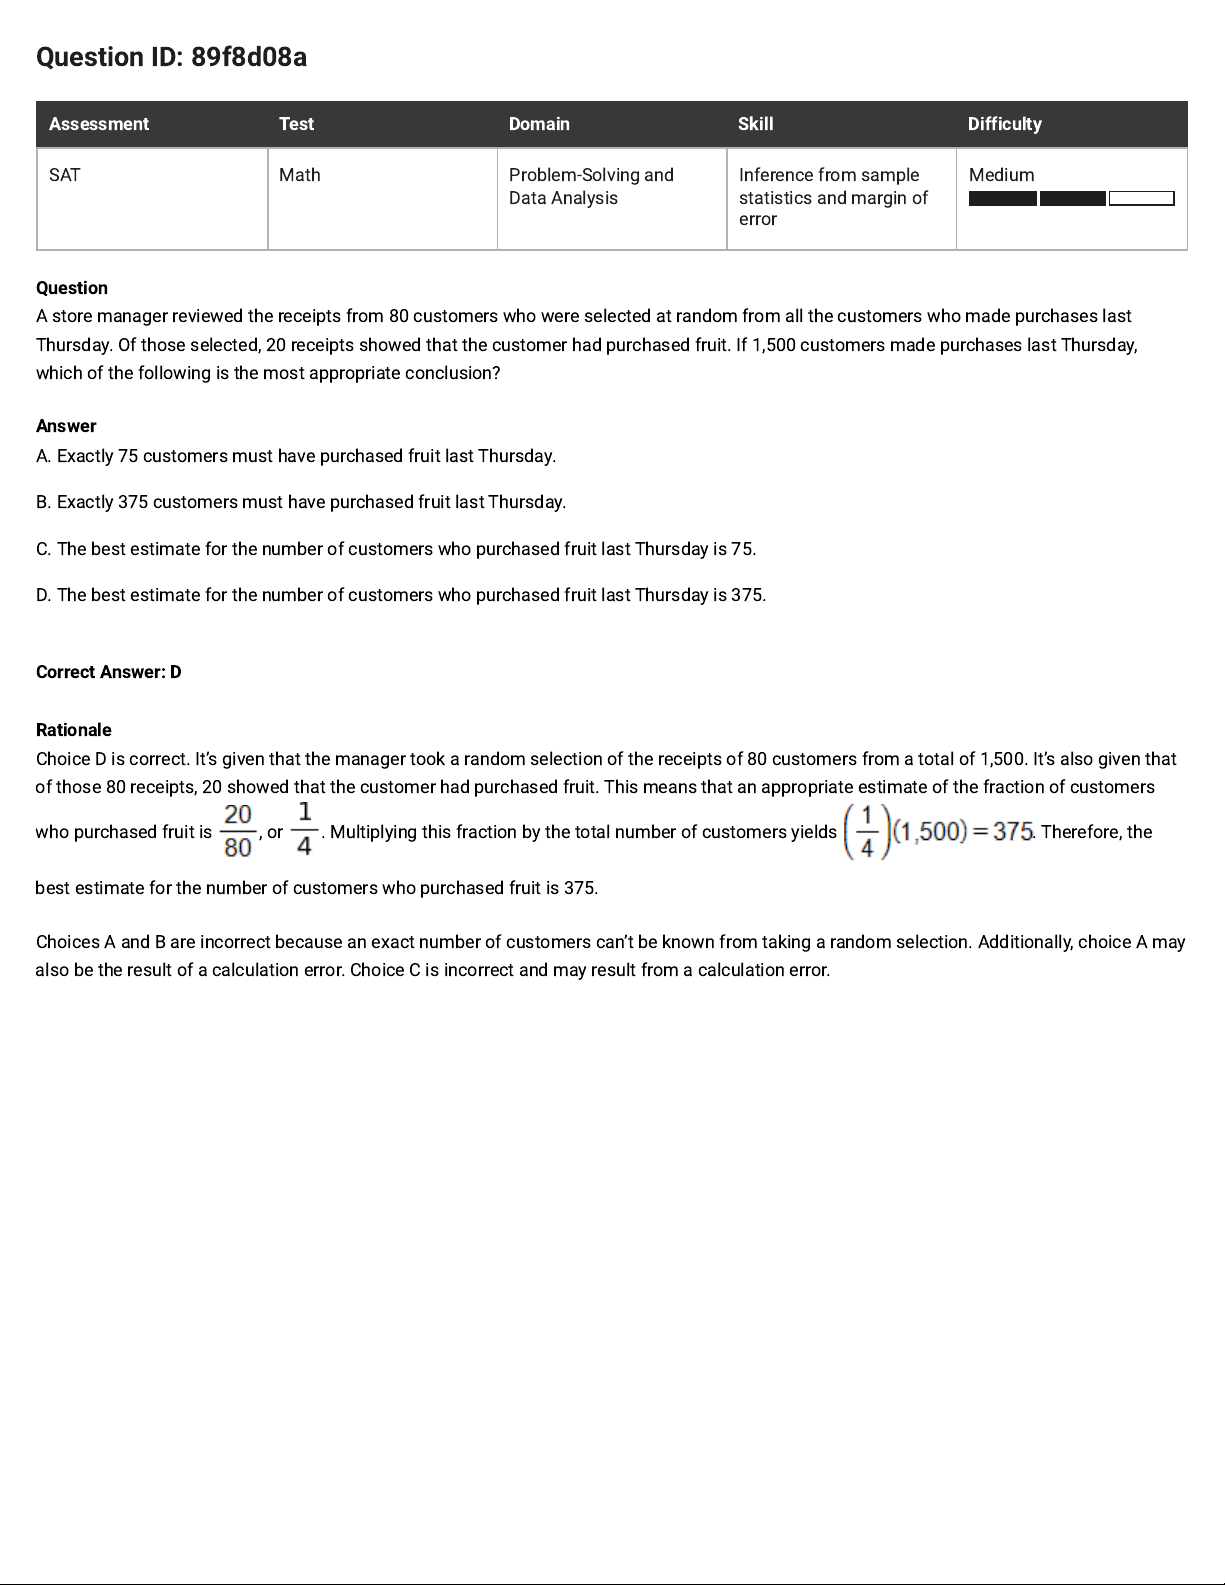
Choice D is correct. It’s given that the manager took a random selection of the receipts of 80 customers from a total of 1,500. It’s also given that
of those 80 receipts, 20 showed that the customer had purchased fruit. This means that an appropriate estimate of the fraction of customers
who purchased fruit is , or . Multiplying this fraction by the total number of customers yields . Therefore, the
best estimate for the number of customers who purchased fruit is 375.
Choices A and B are incorrect because an exact number of customers can’t be known from taking a random selection. Additionally, choice A may
also be the result of a calculation error. Choice C is incorrect and may result from a calculation error.
Page 15
Question ID: 6a305cd0
Assessment Test Domain Skill Difficulty
SAT Math Problem-Solving and
Data Analysis
Inference from sample
statistics and margin of
error
Easy
Question
In a study, the data from a random sample of a population had a mean of 37, with an associated margin of error of 3. Which of the following is
the most appropriate conclusion that can be made about the population mean?
Answer
A. It is less than 37.
B. It is greater than 37.
C. It is between 34 and 40.
D. It is less than 34 or greater than 40.
Correct Answer: C
Rationale
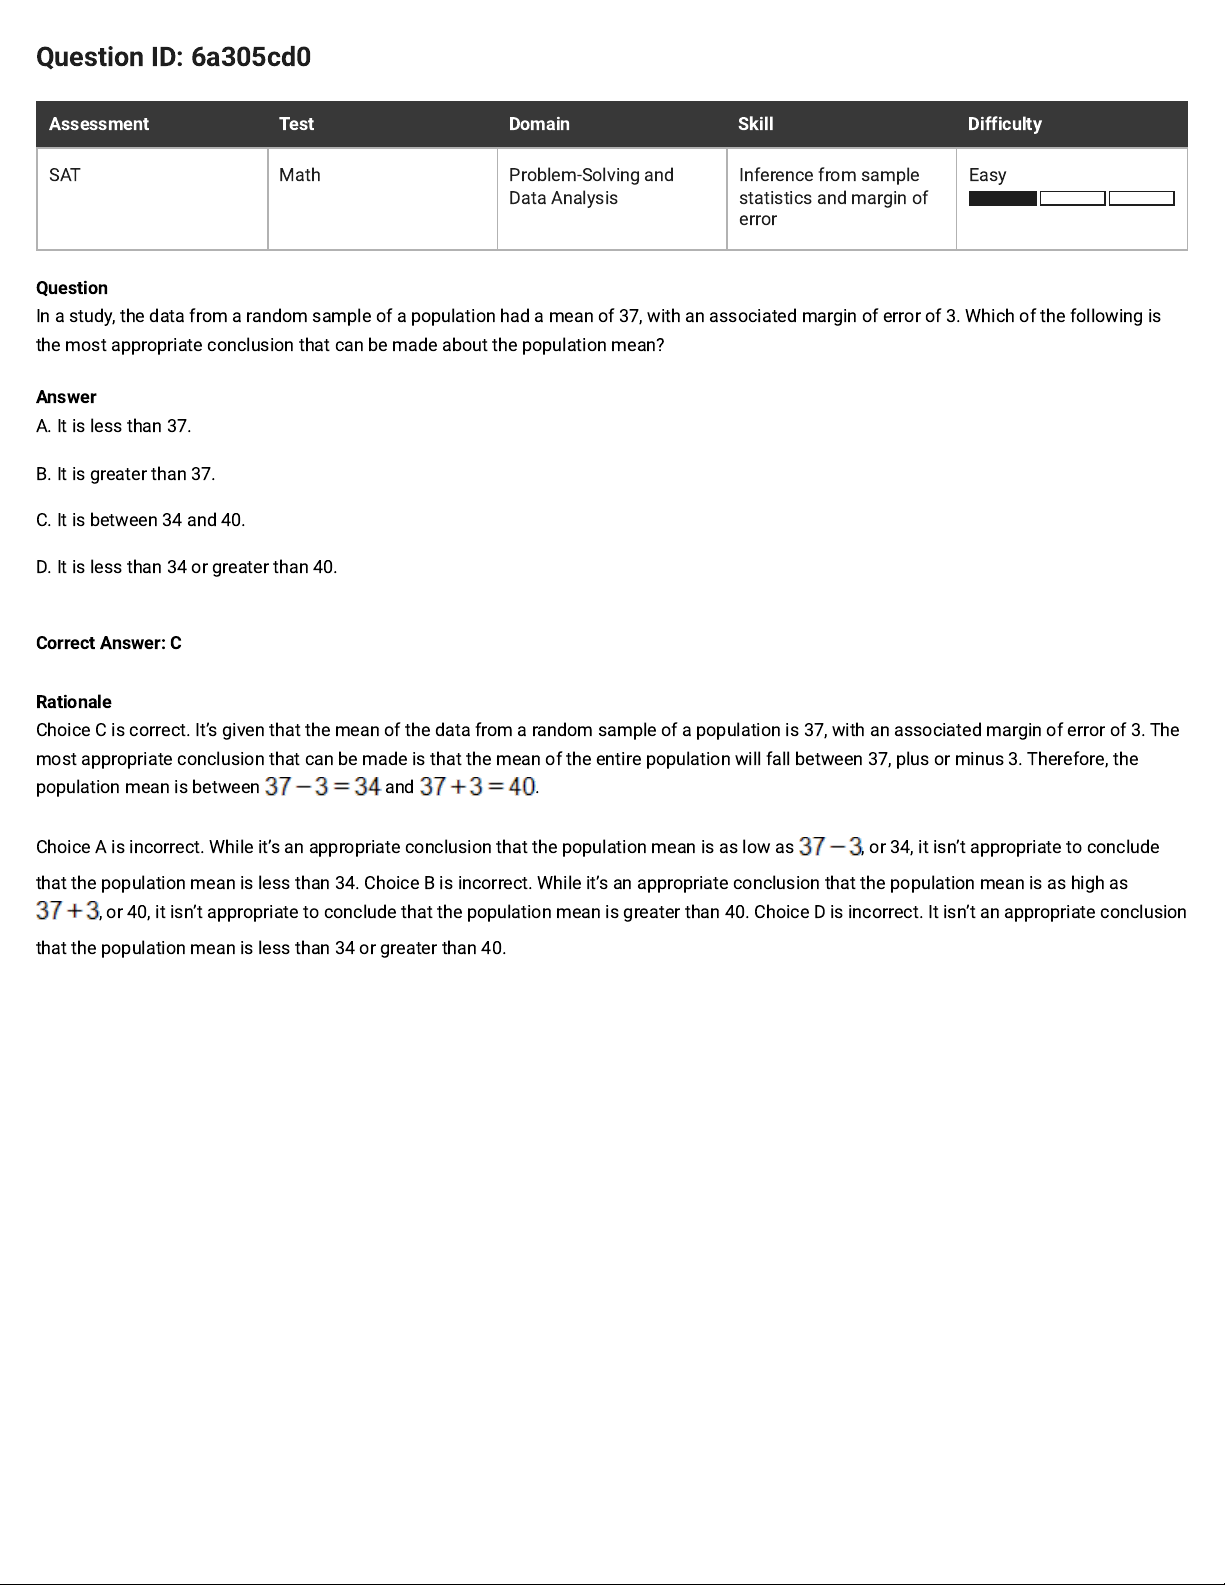
Choice C is correct. It’s given that the mean of the data from a random sample of a population is 37, with an associated margin of error of 3. The
most appropriate conclusion that can be made is that the mean of the entire population will fall between 37, plus or minus 3. Therefore, the
population mean is between and .
Choice A is incorrect. While it’s an appropriate conclusion that the population mean is as low as , or 34, it isn’t appropriate to conclude
that the population mean is less than 34. Choice B is incorrect. While it’s an appropriate conclusion that the population mean is as high as
, or 40, it isn’t appropriate to conclude that the population mean is greater than 40. Choice D is incorrect. It isn’t an appropriate conclusion
that the population mean is less than 34 or greater than 40.
Page 16
Question ID: 9ee22c16
Assessment Test Domain Skill Difficulty
SAT Math Problem-Solving and
Data Analysis
Inference from sample
statistics and margin of
error
Medium
Question
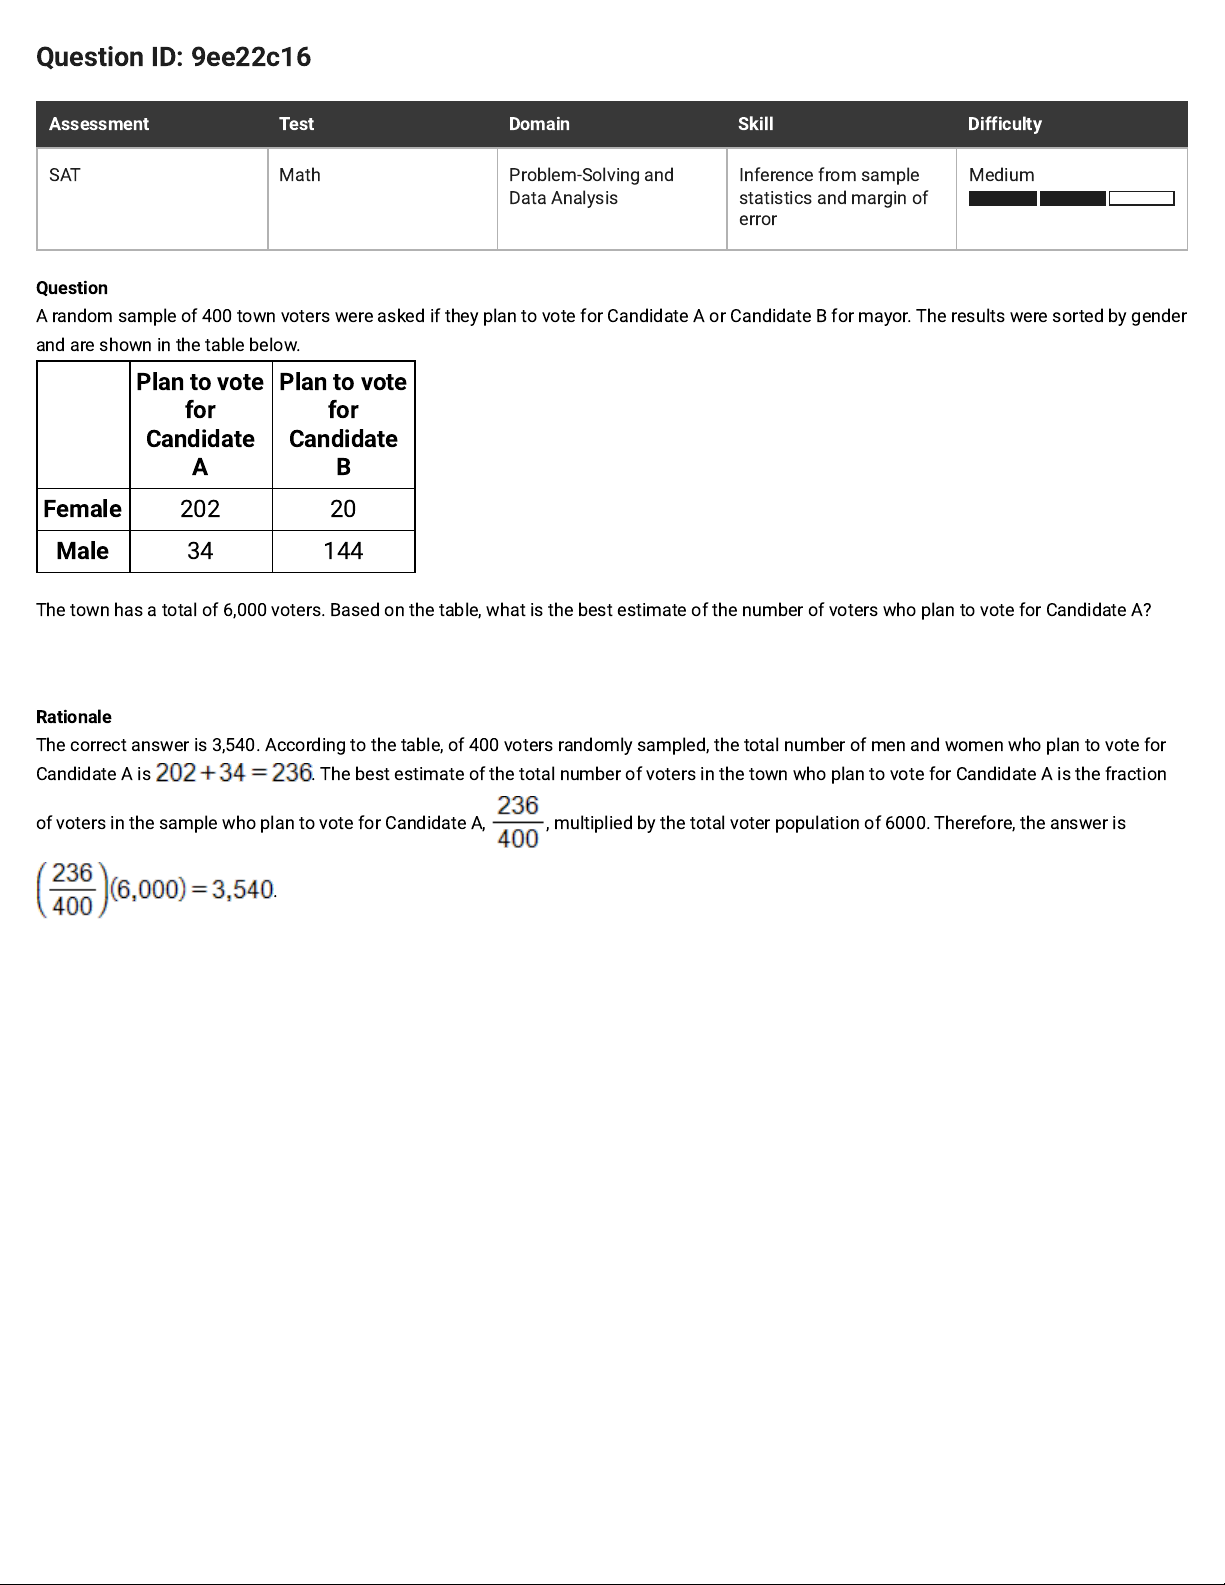
A random sample of 400 town voters were asked if they plan to vote for Candidate A or Candidate B for mayor. The results were sorted by gender
and are shown in the table below.
Plan to vote
for
Candidate
A
Plan to vote
for
Candidate
B
Female
202 20
Male
34 144
The town has a total of 6,000 voters. Based on the table, what is the best estimate of the number of voters who plan to vote for Candidate A?
Rationale
The correct answer is 3,540. According to the table, of 400 voters randomly sampled, the total number of men and women who plan to vote for
Candidate A is . The best estimate of the total number of voters in the town who plan to vote for Candidate A is the fraction
of voters in the sample who plan to vote for Candidate A, , multiplied by the total voter population of 6000. Therefore, the answer is
.
 Loading...