

Page 1
Page 2

PDQuest
™
User Guide for Version 7.1
Windows and Macintosh
P/N 4000129-14 RevA
Page 3

PDQuest User Guide
Bio-Rad Technical Service Department
Phone: 800-424-6723
510-741-2612
Fax: 510-741-5802
E-mail: LSG.TechServ.US@Bio-Rad.com
Notice:
No part of this publication may be reproduced or transmitted in any form or by any
means, electronic or mechanical, including photocopy, recording, or an y information
storage or retrieval system, without permission in writing from Bio-Rad.
PDQuest and The Discovery Series are trademarks of Bio-Rad Laboratories. All
other trademarks and registered trademarks are of their respective companies.
WASTE text engine © 1993–1997 Marco Piovanelli
Limitations of Liabi lit y :
Bio-Rad is not responsible for the misinterpretation o f res ults obtained by following
the instructions in this guide. Whenever possible, you should contact the Technical
Services Department at Bio-Rad to discuss your results. As with all scientific studies,
we recommend that you repeat your experiment at least once before making any
significant conclusions for presentation or publication.
Copyright © 2002 by Bio-Rad Laboratories. All rights reserved.
ii
Page 4

Table of Contents
1. Introduction ........................................................................ 1-1
1.1. Overview of PDQuest ..................................................................................... 1-1
1.2. Digital Data and Signal Intensity .................................................................... 1-2
1.3. PDQuest Workflow ....................................................................................... 1-4
1.4. Computer Requirements .................................. ............................................... 1-7
1.5. Installation ...................................................................................................... 1-9
1.6. Hardware Security Key (HSK) ..................................................................... 1-10
1.7. Starting the Program ..................................................................................... 1-12
1.8. Software License .......................................................................................... 1-13
1.9. Downloading from the Internet .................................................................... 1-16
1.10. PDQuest Basic ............................................................................................ 1-17
1.11. Contacting Bio-Rad ........................................................ ...... ...................... 1-17
2. General Operation .............................................................. 2-1
2.1. Graphical Interface ......................................................................................... 2-1
2.2. Keyboard Shortcuts ........................................................................................ 2-5
2.3. File Commands and Functions ....................................................................... 2-7
2.4. Printing and Exporting .................................................................................. 2-20
2.5. Printing ......................................................................................................... 2-21
2.6. Exporting ...................................................................................................... 2-25
2.7. Preferences .................................................................................................... 2-35
2.8. Mouse-assignable Tools ............................................................................... 2-45
3. Viewing and Editing Images ............................................. 3-1
3.1. Windows and Subwindows ......................................... .................................. .. 3-1
3.2. Configuring Subwindows .......................... ...... ...... .................................. ..... .. 3-1
3.3. Assigning and Interchanging Images .............................................................. 3-3
iii
Page 5

PDQuest User Guide
3.4. Tiling Windows ............................................................................................... 3-4
3.5. Magnifying Images .............................................................. ........................... 3-4
3.6. Positioning Images .......................................................................................... 3-7
3.7. Hiding Overlays ............................................................................................ 3-10
3.8. Density Tools ................................................................................................ 3-11
3.9. Colors ............................................................................................................ 3-13
3.10. Multi-Channel Viewer ....................................................... ..... .................... 3-16
3.11. 3D Viewer ................................................................................................... 3-18
3.12. Transform .................................................................................................... 3-20
3.13. Cropping Images ..................................................................... ...... ...... ........ 3-26
3.14. Flipping and Rotating Images ..................................................................... 3-29
3.15. Filtering Images .......................................................................................... 3-32
3.16. Invert Data ................................................................................................... 3-38
3.17. Text Overlays ..................................................................... ..... ...... .............. 3-38
4. Detecting and Editing Spots ............................................. 4-1
4.1. Selecting Spot Detection Parameters .............................................................. 4-1
4.2. Detecting Spots .............................................................................................. 4-9
4.3. Filtered and Gaussian Images ....................................................................... 4-12
4.4. Spot Crosshairs and Ellipses ......................................................................... 4-14
4.5. Adding and Removing Spots ........................................................................ 4-15
4.6. Spot Boundary Tools .................................................................................... 4-18
4.7. Cancelling Spots ........................................................................................... 4-22
4.8. Combining Spots ........................................................................................... 4-23
4.9. Saturated and Faint Spots .............................................................................. 4-23
4.10. Spot Quantity .............................................................................................. 4-24
4.11. Spot Quality ................................................................................................ 4-26
4.12. Spot Parameters ........................................................................................... 4-28
4.13. Finding Spots .............................................................................................. 4-28
5. MatchSets ........................................................................... 5-1
5.1. Creating a MatchSet ........................................................................................ 5-3
iv
Page 6

Contents
5.2. Selecting the Master ...................................................................................... 5-9
5.3. Matching Spots ..................................... ..... .................................. ...... ...... ..... 5-10
5.4. Landmarking Spots ....................................................................................... 5-14
5.5. Automated Matching ................................................................................... 5-17
5.6. Cybergels ...................................................................................................... 5-23
5.7. Adding Spots to the Master .......................................................................... 5-26
5.8. Edit Match Submenu .................................................................................... 5-29
5.9. Matching Summary ................................... ...... ...... .................................. ..... 5-37
6. Analysis Tools .................................................................... 6-1
6.1. Spot Review Tool ........................................................................................... 6-1
6.2. Image Stack Tool ............................................................................................ 6-5
6.3. Scatter Plot Tool ............................................................................................. 6-7
6.4. Replicate Groups ............................................................................................ 6-9
6.5. Group Consensus .......................................................................................... 6-13
6.6. Sample Database ........................................................................................... 6-17
6.7. Normalization ............................................................................................... 6-23
6.8. MrpI Data .............................................. ..... .................................. ...... ...... ..... 6-29
6.9. Standard Spot Numbers ................................................................................ 6-32
6.10. Database Spot Numbers .............................................................................. 6-34
7. Analysis Sets and Annotations ........................................ 7-1
7.1. Analysis Sets ................................................................................................... 7-1
7.2. Annotation Tool ............................................................................................ 7-22
7.3. Browsing Annotations .................................................................................. 7-33
7.4. Creating Annotations from Analysis Sets ..................................................... 7-34
7.5. Printing Annotations ..................................................................................... 7-36
7.6. Transferring Annotations ............................................................. ................. 7-37
8. Basic Excision Tool ........................................................... 8-1
8.1. Spot Cutter Setup ............................................................................................ 8-2
8.2. Cutting Spots .................................................................................................. 8-8
v
Page 7

PDQuest User Guide
8.3. Other Spot Cutter Controls .................................................. ..... .................... 8-23
9. Integrated Excision Tool ................................................... 9-1
9.1. Excision Gel Selection .................................................................................... 9-2
9.2. Integrated Excision Tool ................................................................................. 9-8
10. Mass Spectrometry Analysis .......................................... 10-1
10.1. Creating a MassLynx Batch File ................................................................. 10-1
10.2. Importing MassLynx Results ...................................................................... 10-3
10.3. Mass Spec Score Overlay ........................................................................... 10-5
10.4. Protein Probe ..................................................... .......................................... 10-6
10.5. Import Mascot Results ................................................................................ 10-7
11. Graphs and Reports ........................................................ 11-1
11.1. Configure Graphs ........................................................................................ 11-1
11.2. Histogram Graphs ................................................................... ...... ...... ........ 11-4
11.3. A-B Overlay ................................................................................................ 11-7
11.4. Quantity Table Report ................................................................................. 11-9
11.5. Master Image Report ................................................................................. 11-13
11.6. Scatter Plot Report .................................................................................... 11-14
Appendix A.
Gel Doc 2000 ............................................................................. A-1
Appendix B.
ChemiDoc .................................................................................. B-1
Appendix C.
ChemiDoc XRS ......................................................................... C-1
Appendix D.
GS-700 Imaging Densitometer ................................................ D-1
vi
Page 8

Contents
Appendix E.
GS-710 Imaging Densitometer ............................. ..... .... ..... ..... E-1
Appendix F.
GS-800 Imaging Densitometer ................................................ F-1
Appendix G.
Fluor-S MultiImager ............................................................. .... G-1
Appendix H.
Fluor-S MAX MultiImager ......................................................... H-1
Appendix I.
Personal Molecular Imager FX ................................................. I-1
Appendix J.
Molecular Imager FX Family (FX Pro, FX Pro Plus and Molecular
FX) .............................................................................................. J-1
Appendix K.
VersaDoc ................................................................................... K-1
Appendix L.
Calibration and Merging .......................................................... L-1
Appendix M.
Cross-Platform File Exchange ........................................... .... M-1
vii
Page 9

PDQuest User Guide
viii
Page 10

Preface
1. About This Document
This user guide is designed to be used as a reference in your everyday use of
PDQuest™. It provides detailed information about the tools and commands of
PDQuest for the Windows and Macintosh platforms. Any platform differences in
procedures and commands are noted in the text.
This guide assumes you have a working knowledge of your computer operating
system and its conventions, including how to use a mouse and standard menus and
commands, and how to open, save, and close files. For help with any of these
techniques, see the documentation that came with your computer.
This guide uses certain text conventions to describe specific commands and
functions.
Example Indicates
File > Open Choosing the Open command under the File menu.
Dragging Positioning the cursor on an object and holding down
.
the left mouse button while you move the mouse.
CTRL+S Holding down the Control key while typing the letter s.
Right-click/
Left-click/
Double-click
Some of the illustrations of menus and dialog boxes found in this manual are taken
from the Windows version of the software, and some are taken from the Macintosh
version. Both versions of a menu or dialog box will be shown only when there is a
significant difference between the two.
Clicking the right mouse button/
Clicking the left mouse button/
Clicking the left mouse button twice.
ix
Page 11

PDQuest User Guide
2. Overview of Raw 2-D Gel Electrophoresis
Raw 2-D electrophoresis is a method for separating proteins and nucleic acids in a
sample into a two-dimensional pattern of spots in a gel. It combines the techniques of
isoelectric focusing (IEF) with SDS-polyacrylamide gel electrophoresis (SDSPAGE). Since these two separation methods rely on independent properties of
proteins—chemical and physical—this procedure can resolve complex biological
samples with a high degree of specificity and accuracy. The resolved proteins and
polypeptide fractions can be then identified by their molecular weights and charges
(as indicated by their locations in the Raw 2-D gel), as well as by their differential
expression in different samples, proximity to other spots, intensity, etc.
Raw 2-D electrophoresis involves two sequential separations of a sample in
perpendicular directions. The IEF dimension is run first, in tube gels or on
immobilized pH gradient (IPG) strips. After focusing, the tube gel or strip is placed
on top of an SDS-PAGE slab gel and electrophoresed. This technique can resolve
thousands of prot ein spo ts in a sin gle sa mple; these pr oteins can then b e visualized by
metabolic radiolabeling or a variety of staining methods.
Proteomics Applications
Proteomics is the study of protein expression and regulation in cells, tissues, and
entire organisms. Sev eral thous and proteins are expressed at any given moment in an
organism; at the cellular level, dozens of proteins may be expressed and regulated in
fractions of a second.
Two-dimensional gel electrophoresis is a a cornerstone in the study of how proteins
are expressed, regulated, and modified throughout living systems. Developed almost
a quarter of a century ago, Raw 2-D gel techno logy remains one of the most po werfu l
techniques for resolvin g comp le x mixt u res of p rot eins . The technology has improved
significantly over the past several years, with the advent of IPG strips and simplified
gel running techniques, large-format and cyber gels that allow for greater pH range
and specificity, and new stains and staining techniques. In addition, mass
spectrometry now allows for peptide mass fingerprinting of very small amounts of
protein isolated from gels.
Using a combination of these techniques, pharmaceutical companies can now use
Raw 2-D technology for high-throughput screening of drug compound candidates
using protein targets; research laboratories can study large-scale changes in protein
x
Page 12

Preface
expression; and companies and institutions can cross-identify and catalog hundreds of
thousands of protein specie s at the cellular level. This prov ides an ex cellent technique
for the study of differential gene expression under various growth conditions. Since
the expression and regulation of indivi dual pro teins can be detected,Raw 2-D gels are
an indirect way to monitor gene activity. They allow for the investigation of
quantitative as well as qualitative changes in cellular protein expression.
The environmental conditions of a cell can be changed in order to determine optimal
growth conditions as well as monitor the cell’s response to different stresses.
Environmental conditions that can stress the cell include changes in temperature, pH,
and nutrient availability. Some examples of the chemical stresses that can be placed
on a cell include drug and hormone treatments. Since protein structure and function
are the direct result of gene expression, the loss or change of a protein as detected by
a Raw 2-D gel can be extrapolated back to events occurring at the DNA level.
Many questions encountered when genes are inserted and express ed in bacteria, yeast,
and other cell types can be answered with Raw 2-D analysis: Is the cell making the
protein? Is the cell’s progeny making the protein? Is the protein being made but not
secreted? Have mutations occurred?
Medical Applications
Raw 2-D gels can also have important application s in medical research. For example,
this technique can be used to verify the presence of specific protein markers that are
linked to genetic diseases and disease states. Used in conjunction with other tests,
Raw 2-D gels can be part of medical screening procedures associated with mutations
and teratology linked to genetic damage.
Growth factors are being studied for their role in the regulation of cell growth. Raw 2D gels can be used to evaluate quantitative and qualitative changes in cellular proteins
in response to growth factor stimulation.
Raw 2-D gels allow the visualization of proteins whose expression is altered as the
result of cell transformation, introducing oncogenes into the host genome.
Assessment of phosphorylation, sulfation, or other secondary modifications could
reveal functional protein pathways affected by on cogene expression . This informatio n
could contribute to a better understanding of cell growth and regulation.
xi
Page 13

PDQuest User Guide
Sample Experiments
Valuable information can be learned by exposing cells to a set of specific
experimental conditions and subsequently examining their biological response.
A preliminary in vitro ex peri men t that is us eful when b e ginning Raw 2-D gel work i s
to radiolabel a cell’s proteins to steady-state with
these proteins will help to determine the commonly expressed proteins in the cell
under normal conditions.
Subsequently, other amino acids such as 3H-leucine, 3H-proline, 3H-lysine, etc., can
be used to radiolabel the proteins to steady-state. This will label any proteins that do
not contain methionine and were, therefore, not detected in the first experiment, and
will provide preliminary information on the amino acid composition.
Other experiments complementary to Raw 2-D gels include: cell fractionation
procedures, and post-translational mod ifications (phosphorylation, methylation, etc.).
Data from these experiments can be added to a database, accumulating information
about these proteins.
35
S-methionine. Running gels of
3. Bio-Rad Listens
The staff at Bio-Rad are receptive to your suggestions. Many of the new features and
enhancements in this version of PDQuest are a direct result of con vers ations with ou r
customers. Please let us know what you would like to see in the next version of
PDQuest by faxing, calling, or e-mailing our Technical Services staff. You can also
use Solobug (installed with PDQuest) to make software feature requests.
xii
Page 14

1. Introduction
1.1 Overview of PDQuest
PDQuest is a software package for imaging, analyzing, and databasing Raw 2-D
electrophoresis gels.
The software runs in a Windows or Macintosh environment and has a graphical
interface with standard pull-down menus, toolbars, and keyboard commands.
PDQuest can acquire images of gels usi ng any of several Bio-Rad imaging syst ems.
An image of a gel is captured using the controls in the imaging device window and
displayed on your computer screen. T he scanned gel can then b e cropped, rotated , etc.
using the image editing controls.
Spot Detection, Analysis and Databasing
With Automated Spot Detection and Matching you can select the gels you want to
anlayze, detect spots of interest, create a MatchSet, and match gels all from one
dialog box. The Spot Detect ion Wizard guides you through the process of identifying
and quantifying the spots in the gel image.
After detection, gels in the same experimental series are placed in a MatchSet for
comparison, statistical analysis, and databasing. Histograms allow you to quickly
compare the quantities of the same spot in all the gels in a matchset. Spots can also be
compared qualitatively, organized into user-defined sets for further analysis, and
annotated and databased for easy identification. Spots from differen t experi ment al
series can be organized and compared in high-level matchsets.
PDQuest can be used to simultaneously analyze thousands of spots on hundreds of
gels. Data can be exported to other applications such as spreadsheets for further
analysis.
1-1
Page 15

PDQuest User Guide
Mass Spec Analysis
PDQuest is part of Bio-Rad’ s ProteomeWorks protein analysis package, and controls
Bio-Rad’s ProteomeWorks Spot Cutter. You can cut spots from gels or membranes
using PDQuest, digest them, and perform advanced protein analysis using
MicroMass’ s mass spectrometry instruments and software. Data from MicroMass can
then be imported back into PDQuest to be included in spot annotations.
And More...
Scan files acquired in PDQuest can be analyzed using other Bio-Rad Discovery
Series software applications, such as Quantity One or Diversity Database. Scans can
be converted into TIFF format for easy compatibility with other applications.
1.2 Digital Data and Signal Intensity
The Bio-Rad imaging devices supported by PDQuest are light and/or radiation
detectors that convert signals from biological samples into digital data. PDQuest then
displays the digital data on your computer screen, in the form of gray scale or color
images.
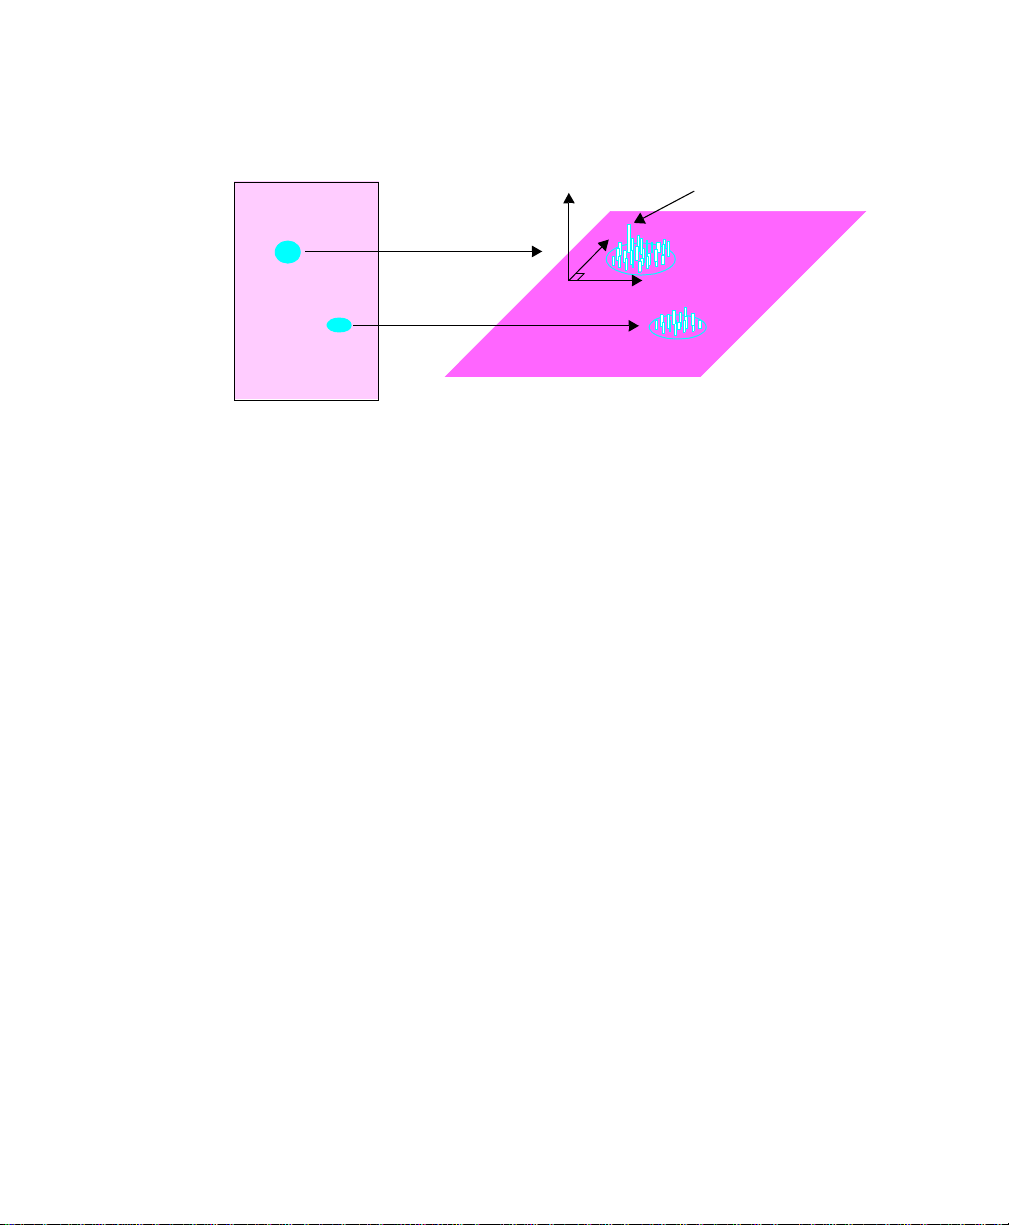
A data object as displayed on the computer is composed of tiny individual screen
pixels. Each pixel ha s an X an d Y coo rdinate, an d a valu e Z. Th e X and Y c oordi nates
are the pixel’s horizontal and vertical positions on the image, and the Z value is the
signal intensity of the pixel.
1-2
Page 16
Introduction
Signal intensity of a single pixel
intensity
3-D View
2-D View
Fig. 1-1. Representation of the pixels in two digitally imaged spots in a gel.
For a data object to be visible and quantifiable, the intensity of its clustered pixels
must be higher than the intensity of the pixels that make up the background of the
image. The total intensity of a data object is the sum of the intensities of all the pixels
that make up the object. The mean intensity of a data object is the total intensity
divided by the number of pixels in the object.
The units of signal intensity are Optical Density (O.D.) in the case of the GS-700 an d
GS-710 densitometers, the Gel Doc and ChemiDoc with a white light source, or the
Fluor-S and Fluor-S MAX MultiImagers with white light illumination. Signal
intensity is expressed in counts when using the Personal FX or FX, or in the case of
the Gel Doc, ChemiDoc, Fluor-S, or Fluor-S MAX when using the UV light source.
1-3
Page 17

PDQuest User Guide
1.3 PDQuest Workflow
Acquire the image
Size and orient the image
Spot identification
Spot comp a r is on and
matching
Data analysis
Spot cutting and mass spec
analysis
Publish results
Fig. 1-2. S teps involved in using PD Quest.
Image Acquisition
PDQuest can acquire images o f gels using Bio-Rad’s densitometers, storage phosphor
imagers, and camera-based imaging systems.
First you open the acquisition window for your imaging device, and capture the
image using the control s. Gel i mages ar e saved on your hard disk, networ k file server,
or removable storage media. The displayed image in PDQuest is ready for analysis.
Image Sizing and Orientation
In this step, you adjust the size and or ientation of t he image by using the cropp ing and
rotating tools on the Image menu.
1-4
Page 18
Introduction
Sp ot Identifica tion
Now you are ready to identify the spots in the gel. The Spot Detection Wizard
automates the process of selecting the proper spot detection parameters for your gels.
Using the Wizard, you select the parameters, study the results of spot detection, then
adjust the parameters until you have identified all spots of interest in your gels.
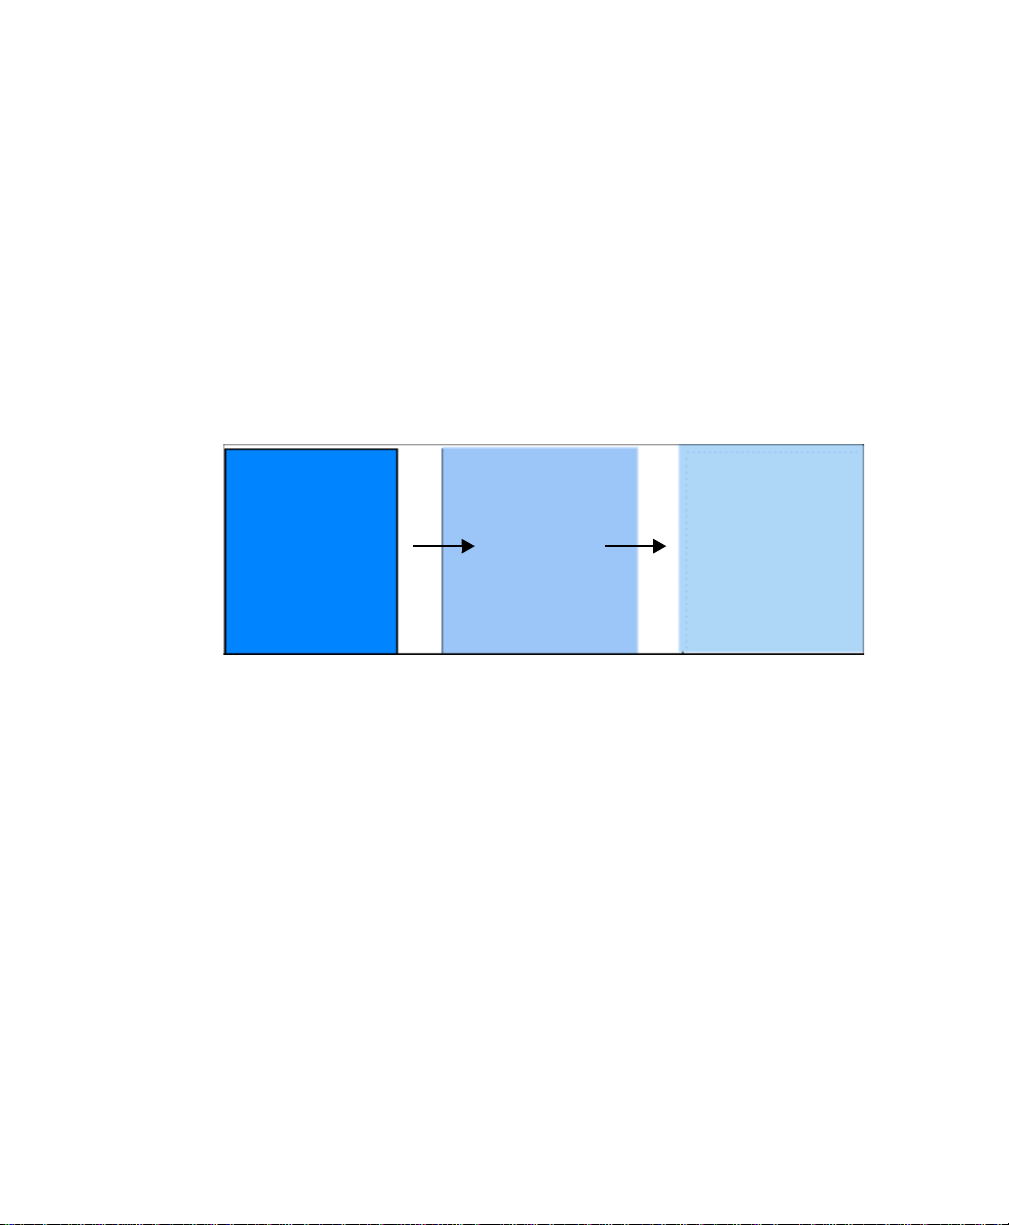
When spots are detected in PDQuest, the original gel image is filtered and smoothed
to clarify the spots, then three-dimensional Gaussian spots are created from the
clarified spots. The end result is three separate images: the original unaltered scan (2D Scan), the filtered and processed scan (Filtered image), and a synthetic image
containing the Gaussian spots (Gaussian image).
2-D Scan Filtered Image Gaussian I mage
Fig. 1-3. Images created during spot detection.
All spot matching and analysis in PDQuest are performed on Gaussian spots.
What Are Gaussian Spots?
Fuzzy, streaked, or overlapping spots in a 2-D gel can be difficult to accurately
distinguish and quantify. Because the image profile of an ideal spot confirms to a
Gaussian curve, PDQuest uses Gaussian modeling to generate spots that can be
precisely identified and quantitated.
A Gaussian spot is a three-dimensional representation of an original scanned spot.
Gaussian curves are fitted to the scanned spot in the X and Y dimensions, and then
additional modeling is performed to create the final Gaussian spot.
Using Gaussian modeling, you can accurately quantitate overlapping spots, spots in
gel streaks, and multiple spots in dense clusters.
1-5
Page 19

PDQuest User Guide
Matching and Editing
After you have detected the spots in a gel or set of gels, you are ready to create a
matchset. A matchset is composed of the Raw 2-D, Filtered and Gaussian images of
the gel(s) in an experiment.
In a matchset, the protein spots from the different gels are matched to each other and
are included in a synthetic image called a matchset standard. The standard in cludes all
the information about the spots in the matchset.
As you match the spots in a matchset, you will correct the results of autom a tic spot
detection by comparing the Gaussian spots with the original spots in the Filtered
image.
Data Analysis
PDQuest provides a variety of analytical tools to help you determine which spots are
statistically and scientifically meaningful.
You can normalize the spot quantities in different gels for more accurate comparison.
You can define replicate groups of duplicate gels. You can create groups of spots that
are quantitatively, qualitatively, and statistically sig nificant using analysis sets. You
can compare the similarity of gels using scatter plots, and review the quantitation of
individual spots usin g the Sp ot Review Tool.
Many of these tools are interactive with the matchset, so you can study the actual
spots in the images as you review their quantities and other data.
You can create high-level matchsets to compare the results of different experiments.
And the powerful annotation tool allows you to annotate your spots, link to Internet
protein databases or other files, and create HTML pages of spot data.
Spot Cutting and Mass Spec Analysis
PDQuest is part of Bio-Rad’s ProteomeWorks protein analysis package, and controls
Bio-Rad’s ProteomeWorks Spot Cutter. You can cut spots from gels or membranes,
digest them, and perform advanced protein analysis using MicroMass’s mass
spectrometry instruments and software. Data from MicroMass can then be imported
back into PDQuest to be included in spot annotations.
1-6
Page 20

Introduction
Publish Results
When your analysis is complete, you can print your experimental data or export it to
another system for further analysis.
1.4 Computer Requirements
This software is supporte d on Windows 98, XP, NT 4.0, and 2000, or on a Macintosh
PowerPC.
The computer memory requirements are mainly determined by the file size of the
images you will scan and analyze. High-resolution image files can be very large. For
this reason, we recommend that you archive images on a network file server or highcapacity removable disk.
PC
The following is the recommended system configuration for installing and running
on a PC:
Operating system: Windows 98 SE
Windows NT 4.0 with service pack 6
Windows 2000
Windows XP
Processor: Pentium ≥ 333 MHz
RAM: ≥ 128 MB or bet ter for Gel Doc , ChemiDoc, ChemiDoc
XRS, and VersaDoc systems.
≥ 256 MB or better for Molecular Imager FX systems,
Personal FX system, and GS-800 densitometer.
Hard disk space: ≥ 3 GB
Monitor: 17" monitor, 1024 x 768 resolution (absolutely required),
True color.
1-7
Page 21

PDQuest User Guide
SCSI: Required for all Bio-Rad imaging devices except the Gel
Doc, ChemiDoc, ChemiDoc XRS, and VersaDoc systems.
Adaptec SCSI card recommended.
Printer: Optional.
Macintosh
The following is the recommended system configuration for installing and running
on a Macintosh:
Operating system: System 9.0 or higher, excluding Mac OS X.
Processor/Model: PowerPC G3 processor or better.
RAM: ≥ 256 MB for all Bio-Rad imaging systems.
Hard disk space: ≥ 3 GB
Monitor: 17" monitor, 1024 x 768 resolution (absolutely required),
Millions of colors.
SCSI: Required for all Bio-Rad imaging devices except the Gel
Doc, ChemiDoc, ChemiDoc XRS, and VersaDoc systems.
Adaptec SCSI card recommended.
Printer: Optional.
Note: The default amount o f memory assigned to th is program on the Macintosh is 1 28
MB. If the total RAM in your Macintosh is 128 MB or less, you should reduce
the amount of memory assigned to the program to 10 MB
RAM. With the application icon selected, go to File > Get Info in your Finder to
reduce the memory requirements for the application. See your Macintosh
computer documentation for details.
1-8
less than your total
Page 22

Introduction
1.5 Installation
Windows
Note: Windows NT and 2000 users: You must be a member of the Administrators
group to install Discovery Series software. After installation, members of the
Users group must have “write” access to the Discovery Series folder to use the
software.
Insert the Discovery Series CD-ROM into your computer. The installer will start
automatically. (If the CD does not auto-start, use Windows Explorer to open the root
directory on the CD-ROM and double-click on the Setup.exe file.)
The installer program will guide you through the installation. The installer will create
a default directory under Program Files on your computer called Bio-Rad\The
Discovery Series (you can select your own directory if you wish). The application
program will be placed in the Bin folder inside the Discovery Series folder.
Additional directories for storing user profiles and sample images will also be created
The installer will place an application icon on your desktop and create a Discovery
Series folder under Programs on your Windows Start menu.
After installation, you must reboot your computer before using an imaging device.
Macintosh
Insert the Discovery Series CD-ROM into your Macintosh. The TDS-Mac folder will
open on your desktop, displaying the installers for the Discovery Series applications.
Double-click on the installer for your application.
Fig. 1-4. Installation program icon (Macintosh).
The installer will guide you through a series of screens. The installer will create a
folder on your hard drive that contains the main application and associated sample
images (you can select a different folder if you wish). The installation will also create
1-9
Page 23
PDQuest User Guide
a folder called The Discovery Series in the Preferences folder in your System Folder;
this contains the Help file and various system files.
Once installation is complete, the folder containing the application icon will appear
open on your desktop.
Before running the software, you must install the Hardware Security K ey on your
computer (unless you have installed a computer download version of the software).
1.6 Hardware Security Key (HSK)
Note: Initial installation of a network server does require the Hardware Security Key
included in the software package. Installation of an additional Network Client
User to a Network License Server System does not require an HSK. Please refer
to the Network License Installation Guide that ships with Network Licenses .
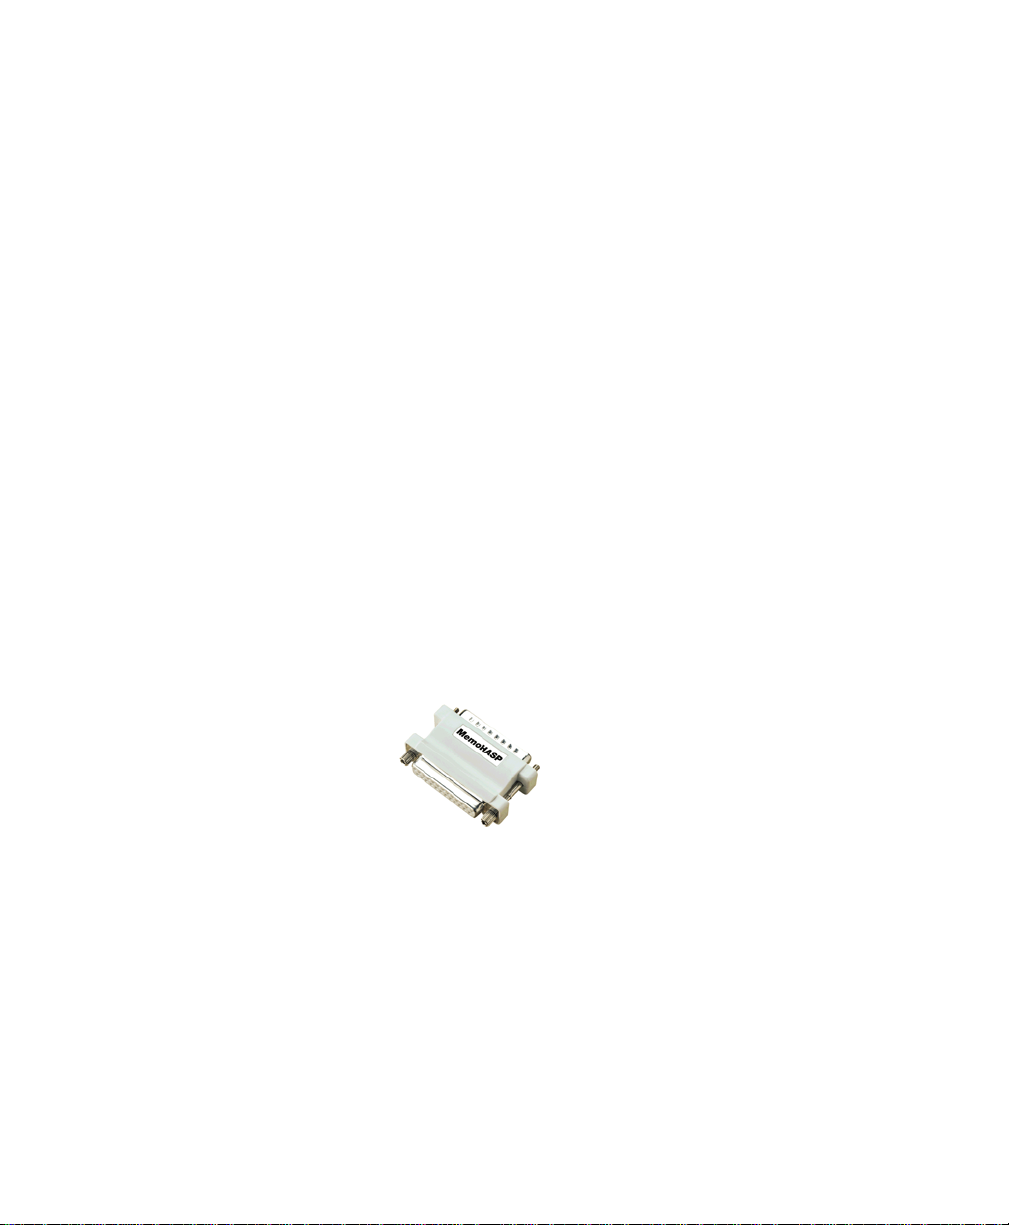
Discovery Series software is password-protected using a Hardware Security Key
(HSK), which is included in your software package. You must attach the Hardware
Security Key to your computer before you can run the software.
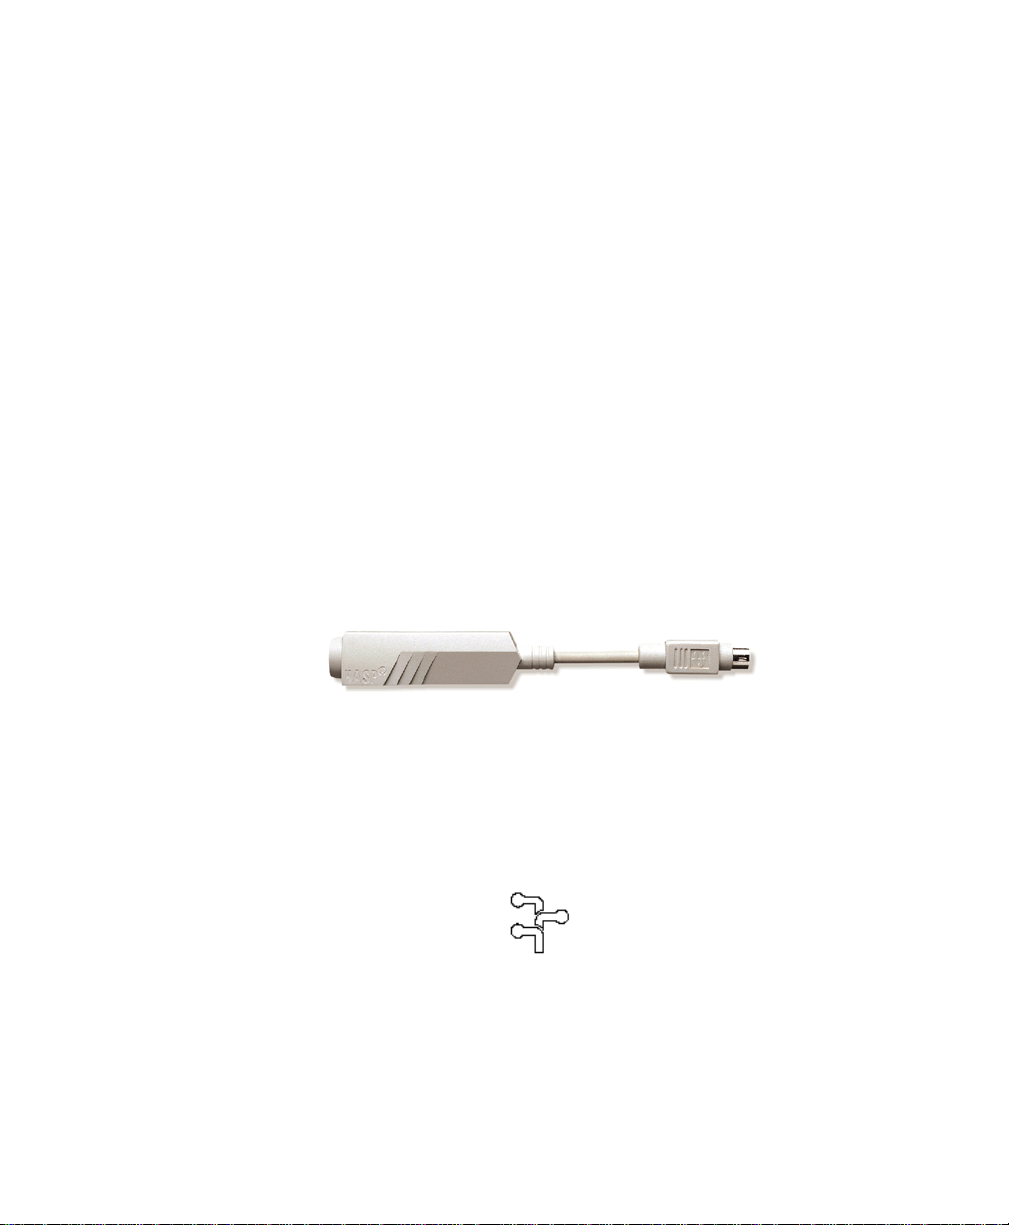
Windows
Fig. 1-5. PC Hardware Security Key
Before proceeding, please turn off your computer.
The HSK attaches to the parallel port on the back of your PC. If a printer cable is
attached to this port, turn off the printer and disconnect it. After you have attached the
HSK, you can attach the printer cable to the key itself and restart your computer and
printer.
1-10
Page 24
Introduction
Note: Some parallel port devices such as zip drives may be incompatible with HSKs.
Please check with your peripherals vendor.
The code for the PC hardware security key is EYYCY. This is printed on the key
itself.
You will also need to install the system driver that allows the computer to recognize
the HSK.
Note: Windows NT and 2000 users must be in the local administrator group to install
the HSK driver.
To install the driver, open the Windows Start menu and select Programs > The
Discovery Series. Select Install HASP Hardware Security Key driver to begin
installation.
Note: Windo ws 98 users must reboot their compu ter after instal ling the HSK. W indows
NT and 2000 users do not have to reboot.
Macintosh
Fig. 1-6. Macintosh Hardware Security Key
Before proceeding, please turn off your Macintosh.
The Macintosh HSK must be inserted in the Apple Desktop Bus (ADB) path. The
ADB port is located on the back of your Macintosh.
Fig. 1-7. Apple Desktop Bus icon on back of Macintosh.
1-11
Page 25

PDQuest User Guide
The HSK can be inserted at any point in the ADB path—between the computer and
the keyboard, between the keyboard and the mouse, between the keyboard and the
monitor, etc. After you have attached the HSK, you can restart your computer.
The code for the Macintosh HSK is QCDIY. This code is printed on the key itself.
1.7 Starting the Program
The Hardware Security Key must be attached to the co mputer b efore yo u can st art the
software (unless you are using a network license).
Windows
The installation program creates an application icon on your desktop. To start the
program, double-click on this icon.
Fig. 1-8. Application icon.
You can also start the program from the Windows Start menu. Click on the Start
button, select Programs, select The Discovery Series, an d s elect the ap plication n ame.
Macintosh
After installation, the main application folder will be open on your desktop. To start
the program, double-click on the application icon shortcut inside the folder. You can
move this shortcut icon to your desktop.
1-12
Page 26

Introduction
1.8 Software License
When the software opens for the first time, you will see a Software License screen
that shows the current status of your software license.
With a new HSK or network license, you receive a 30-day temporary license (“Your
license will expire on _______”). The temporary license is designed to give you time
to purchase the software, if you have not already done so.
Fig. 1-9. Temporary license screen.
During the 30-day period, the Software License screen will appear every time you
open the software. To use the software during this period, click on the Run button.
Network license holders can click on the Check License but ton at any t ime durin g the
30-day period to activate their full network license. (If your network license is not
activated when you click on Check License, notify your network administrator.)
HSK users have 30 days to p urchase the s oftwar e and o btain a purchase order number
and software serial number from Bio-Rad. When you have this information, click on
the Check License or Registration Form button in the Software License screen to
register your software.
1-13
Page 27

PDQuest User Guide
Fig. 1-10. Software License Registration Form.
Fill out the information in the Software License Registration Form. Be sure to enter
your purchase order number and software serial number under the Purchase
Information tab when registering.
Registering by Internet
If you have Internet access from your computer, click on the Submit via Internet
button to send the Software Registration Form directly to Bio-Ra d.
Your information will b e submitted , and a temporary password will be generated
automatically and sent back to you r com puter. Simply continue to run the application
as before.
Bio-Rad will confirm your purchase information and generate a permanent license.
After 2–3 days, click on Check License in the Software License screen again to
update to a permanent password. (The Software License screen will not appear
automatically after the temporary password has been generated; the software will
1-14
Page 28
Introduction
simply open normally. Go to the Help menu and select Register to open the Software
License screen.)
Registering by Fax or E-mail
If you do not have Internet access, click on the Print button in the Software License
Registration Form and fax the form to Bio-Rad at the number listed on the form.
Alternatively , yo u can en ter the conten ts of the form into an e-mail and send it to BioRad at the address listed in the Registration Form.
Bio-Rad will contact you by fax or e-mail in 2–3 days with a full license.
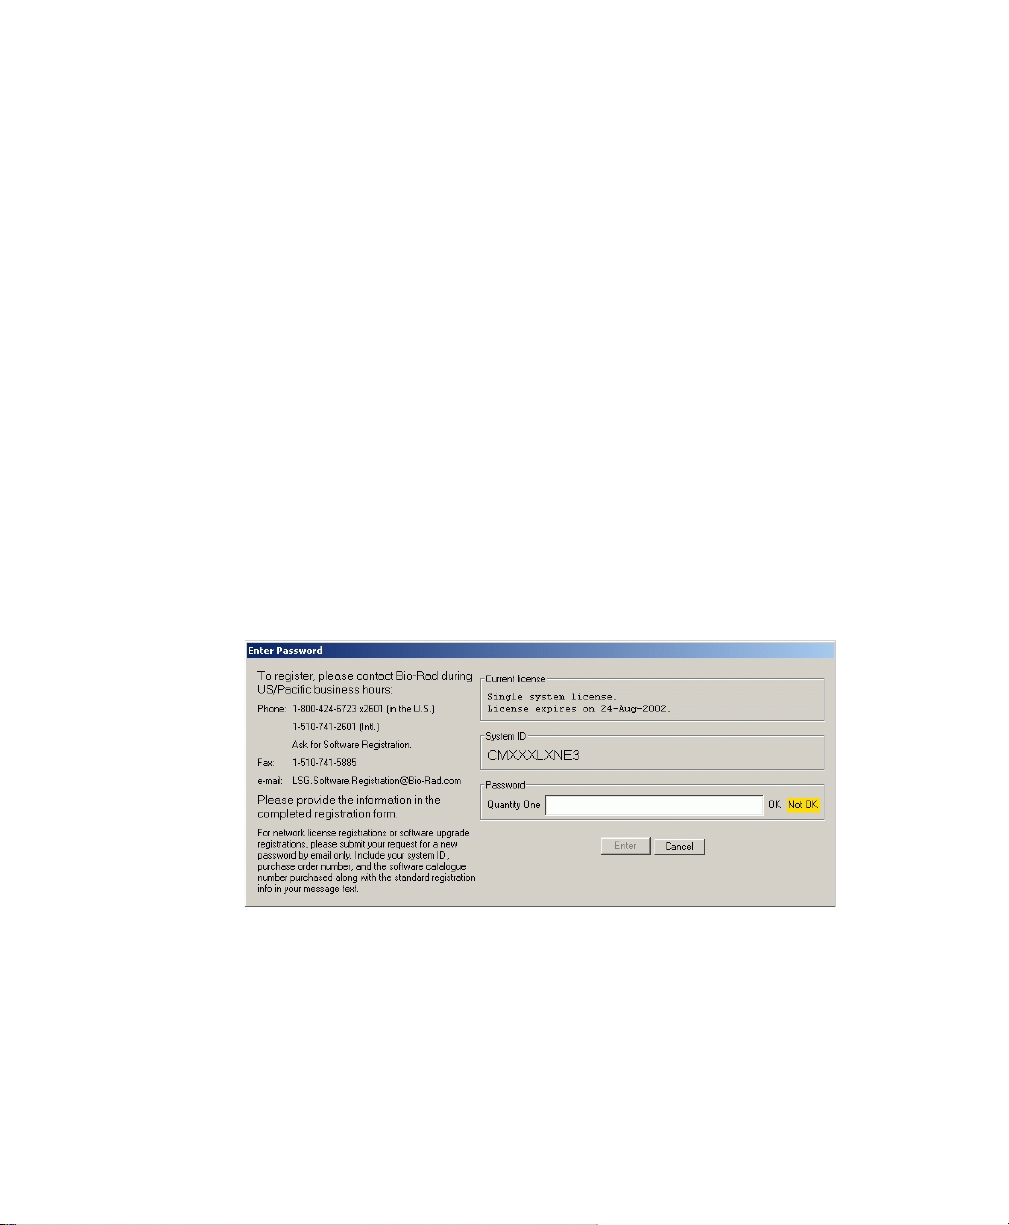
Entering a P assword
If you fax or e-mail your registration information, you will receive a password from
Bio-Rad. You must enter this password manually.
To enter your password, click on Enter Password in the Software License screen. If
you are not currently in the Software License screen, select Register from the Help
menu.
Fig. 1-11. Enter Password screen.
In the Enter Password screen, type in your password in the field.
1-15
Page 29
PDQuest User Guide
Once you have typed in the correct passwor d, the OK l ight nex t to th e passwor d fiel d
will change to green and the Enter button will activate. Click on Enter to run the
program.
1.9 Downloading from the Internet
You can download a trial version of the software from Bio-Rad’s Web site. Go to the
Discovery Series download page at www.bio-rad.com and select from the list of
applications. Follow the instructions to download the installer onto your computer,
then run the installer.
After installation, double-click on the application icon to run the program. The
software will open and the Software License screen will be displayed.
Note: If you attempt to start the downloaded program and receive an “Unable to obtain
authorization” message, you will need a Hardware Security Key to run the
program. Contact Bio-Rad to obtain a key.
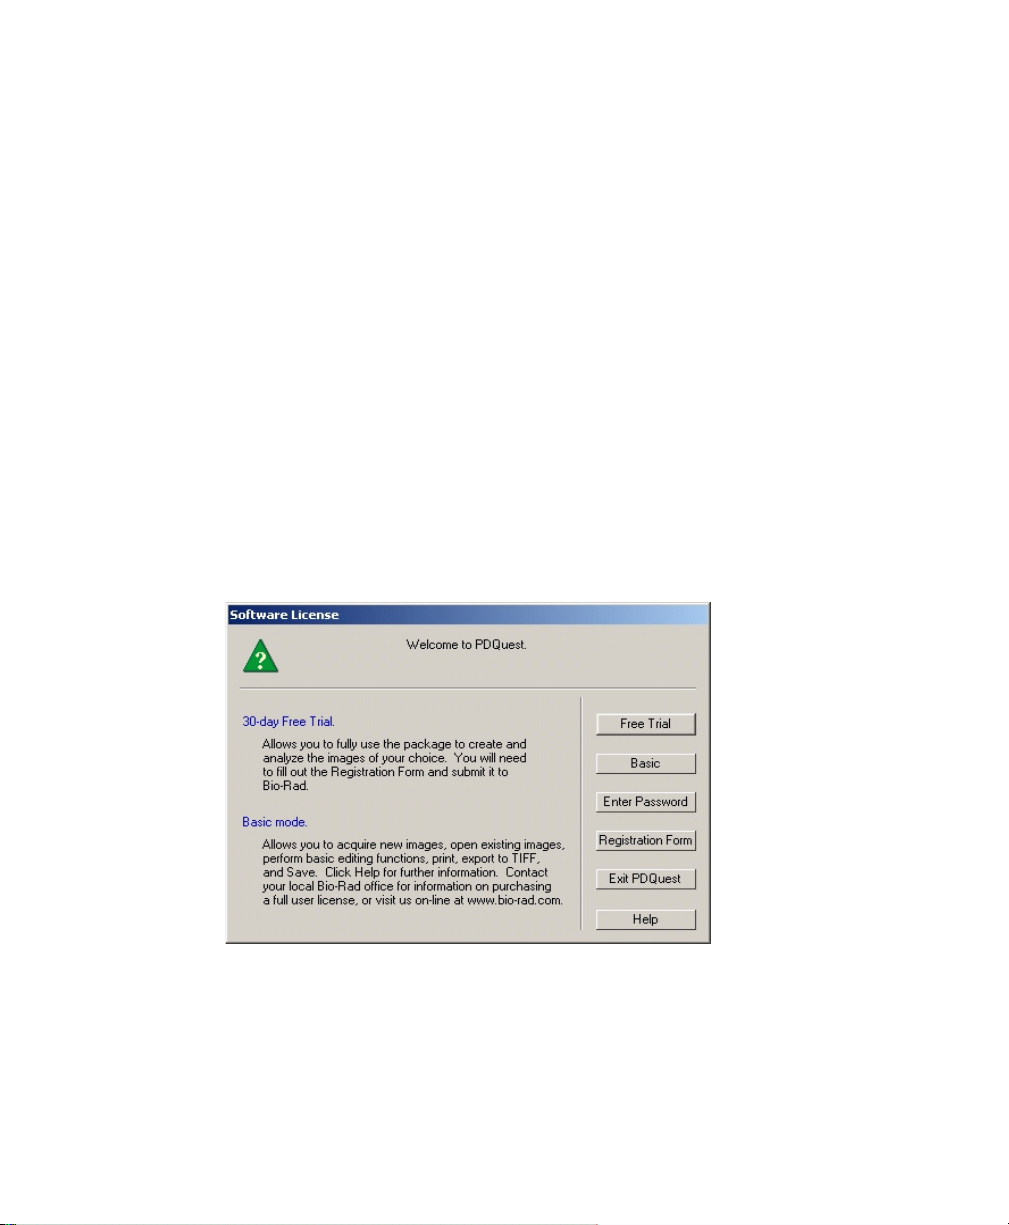
Fig. 1-12. Free Trial screen.
In the Software License screen, click on the Free Trial button. This will open the
Software License Registration Form. Enter the required information (you will not
1-16
Page 30

Introduction
have a purchase order number or software serial number, and can leave these fields
blank) and click on Submit Via Internet.
A free trial password will be automatically downloaded to your computer. This
password will allow you to use the software for 30 days.
If you decide to purchase the software during that period, contact Bio-Rad to receive
a software package and a Hardware Security Key. You can then complete the
registration process as described in the previous sections.
1.10 PDQuest Basic
In order to meet requests for additional software copies at low cost when buying an
imaging system, Bio-Rad has provided a scaled down version of PDQuest called
PDQuest Basic. PDQuest Basic looks and acts exactly like the full version of
PDQuest but with the advanced functions inactive (grayed out).
The Basic version of PDQuest includes the following active functionality: Image
acquisition, Transform, Crop, Flip, Rotate, Text Tool, Basic Excision, Print, and
Export to TIFF and Save. PDQuest Basic also allows you to view previously saved
data created using advanced functionality.
PDQuest Basic does not require a software license. To activate the advanced
commands of PDQuest, contact Bio-Rad for a valid user license.
1.11 Contacting Bio-Rad
Bio-Rad technical service hours are from 8:00 a.m. to 4:00 p.m., Pacific Standard
Time in the U.S.
Phone: 800-424-6723
510-741-2612
Fax: 510-741-5802
E-mail: LSG.TechServ.US@Bio-Rad.com
For software registration:
1-17
Page 31

PDQuest User Guide
Phone: 800-424-6723 (in the U.S.)
+1-510-741-6996 (outside the U.S.)
1-18
Page 32

2. General Operation
F
2.1 Graphical Interface
2.1.a Menu Bar
PDQuest has a standard menu bar with pulldown menus that contain all the major
features and functions available in the software.
ile Commands Viewing Commands Toolbars
Fig. 2-1. Main toolbar.
The pulldown menus contain:
• File—General file commands (Open, Save, New MatchSet, Revert to Saved),
imaging device acquisition windows, and others.
• Edit—Text overlays, Calibration, Preferences, Mouse commands, and others.
• Vi ew—Toolbars, Zoom Box, V iew Density, Advanced View, Multichannel View
and others.
• Image—Image Info, Transform, Advanced Crop, Filter List, and others.
• Spots—Automated Detection and Matching, Spot Detection Report, Spot
Editing, Crosshairs, Quantity, and Quality and others.
• Match—Automated and Classic Spot Matching, Edit matching tools, Cybergels
and others.
• Analysis—Analysis set functions, Annotation tools, MrpI Standards, Replicate
groups func tions, and o thers.
2-1
Page 33

PDQuest User Guide
• Identification—Excision (Spot cutting) and Mass Spectrometry analysis tools.
• Reports—Graphs and Reports. Print and Export.
• Window—Tile windows, Imitate Zoom, Configure Subwindows and others.
• Help—Quick Reference Guide, On-line Help, Keyboard Layout, Software
Registration.
Below the menu bar is the main toolbar, containing some of the most common ly used
commands. Next to the main toolbar is a status box which provides information about
cursor selec t ion and toolbar buttons.
2.1.b Main Toolbar
The main toolbar in PDQuest appears below the menu bar. It includes buttons for the
main file commands (Open, Save, Print) and essential viewing tools (Zoom Box,
Grab), and buttons to open the secondary toolbars. See
Fig. 2-1., Main toolbar..
Tool Help
Graph Tools
Fig. 2-2. Tool Help and Status Box
Status Boxes
Tool Help
If you hold the cursor over a toolbar icon, the name of the command will pop up
below the icon. This utility is called Tool Help. Tool Help appears on a time delay
basis that can be specified in the Display Preferences dialog box under Edit >
Preferences. You can also specify how lo ng th e Tool Help will remain displayed.
2-2
Page 34

General Operation
2.1.c Status Boxes
There are two status boxes in PDQuest. These appear to the right of the main toolbar.
The first box displays any function that is assigned to the mouse (see section 2.8,
Mouse-assignable Tools). If you select a command such as Zoom Box, the name and
icon of that command will appear in this status box and remain there until another
mouse function is selected or the mouse is deassigned.
The second status box is designed to supplement Tool Help (see above). It provides
additional information about the toolbar buttons. If you hold your cursor over a
button, a short expl anation about t hat command w ill be disp layed in thi s second statu s
box.
2.1.d Secondary Toolbars
PDQuest has secondary toolbars t hat contain icons fo r groups of as sociated functi ons.
You can open these toolbars from the main toolbar or from the View > Toolbars
pulldown menu.
The secondary toolbars can be toggled between vertical, horizontal, and expanded
formats by clicking the resize button on the toolbar itself.
2-3
Page 35

PDQuest User Guide
Expanded format
Horizontal format
Hold cursor over icon
to reveal Tool Help
Click question marks
for on-line help
Click resize button
to toggle format
Fig. 2-3. Secondary toolbar formats and features.
Vertical format
The expanded toolbar format shows the name of each of the commands. Click the
Resize button to access the extended format with direct links to the on-line Help file
for that command.
2.1.e Quick Guide
The PDQuest Quick Guide (accessed from the Help menu) is a tool palette that is
organized to guide you through the major functions of the software. Like the
secondary toolbars, it can be toggled between vertical, horizontal, and expanded
formats by clicking on the resize button.
2-4
Page 36

Commands are numbered
to indicate sequence for
scanning the gel,
analyzing the image, and
outputting data
General Operation
? opens
on-line Help
Resize button
Fig. 2-4. PDQuest Quick Guide
In the expanded format, the Quick Guide commands are numbered as well as named,
so that the order of operation is clear. Simply follow the steps and the Quick Guide
will lead you through the analysis. Note that many of the buttons open toolbars of
related commands (e.g., Match Tools).
As with the secondary toolbars, you can click the ? next to the name of a function to
display Hel p.
2.2 Keyboard Shortcuts
Many of the functions may b e executed using keyboard command s (e.g., pressing the
F1 key will activate the View Entire Image command). A list of key combinations and
their associated commands will be displayed if you select Keyboard Layout from the
Help menu.
2-5
Page 37

PDQuest User Guide
Fig. 2-5. Keyboard Layout.
The pulldown menus also list the shortcut keys for the menu commands.
Note: Mouse-assignable commands behave differently if you assign them using the
keyboard versus selecting them from the menus or toolbars. For example, to use
the Zoom Box command as a keyboard command, position your cursor on the
image where you want to begin to create the magnifying box, then press the F2
key. The command is assi gned to your mouse and immediately activated, so that
when you move your cursor over the image, the zoom box is created. When you
2-6
Page 38

General Operation
click the mouse button once, the defined region is magnified and the tool is
automatically deassigned from your mouse.
2.3 File Commands and Functions
This section describes the basic file commands and functions of PDQuest.
Note: Print and Export commands are described in Chapter 12.
2.3.a File Types in PDQuest
The types of files supported by PDQuest are:
Raw 2-D scans (.gsc)
Filtered images (.gim)
Gaussian images (.gsp)
Calstrip scans (.csc)
MatchSets (.ms)
Backup scans (.sbk) (Backups cannot be opened in Windows; you must change the
extension to .gsc using Windows Explorer to open the file).
2.3.b MatchSets, Scansets, and Analysis Sets
MatchSets
A MatchSet is PDQuest’S mechanism for comparing and analyzing the spots in an
experiment. Each image in a MatchSet is called a member. A MatchSet contains one
or more separate members in the form of Raw 2-D, Filtered, or Gaussian images.
Using a MatchSet, you can make quantitative and qualitative spot comparisons across
gels, calculate molecular weight/isoelectric point values, annotate spots, group them
into analysis sets, combine the data from multiple gels into replicate groups, and
select spots for excision and mass spec analysis.
2-7
Page 39

PDQuest User Guide
A MatchSet can consist of one gel or many gels, depending on the type and size of the
experiment. The MatchSet is displayed in a single window, with subwindows for the
images of the member gels, and a subwindow for the MatchSet Master.
Fig. 2-6. Example of a MatchSet.
The commands for creating MatchSets are located under File>New MatchSet, and as
Step 3 of the Automated Detection and Matching dialog.
Scansets
The members of a scanset are three separate files of the same root image. You can
open and close scanset images (i.e., different exposure s or versions of the same
image) individually, even though they are loaded into the same window.
2-8
Page 40

General Operation
Fig. 2-7. Example of a Scanset.
A scanset consists of three separate images of the same gel image. They are
displayed in subwindows as a Raw 2-D Image, as a Filtered image, and as a
Gaussian image All of these are saved as separate images, but they are part of the
same scanset. They have the same root file name, and when you open them they are
loaded into subwindows of the same image window.
T o perform an operation on a parti cular image in a MatchSet or scanset, simply move
your cursor over its subwindow. A green border appears around the selected
subwindow. The border shifts as you move the cursor over different subwindows.
Alternatively, you can select Click to Focus Subwindow under Edit > Preferences >
Display, in which case you must click on a subwindow to select it.
For example, the following image files are all in the same scanset:
Proteins v1 x2.gsc (Raw 2 -D scan, exposure 2)
Proteins v1.gim (Filtered image)
Proteins v1. gsp (Gaussian image).
2-9
Page 41

PDQuest User Guide
Analysis Set
An Analysis set is a set of spots you have chosen to study. Analysis sets allow you to
create groups of spots that are statistically and biologically significant. For more
information see Chapter
7, . Analysis Sets and Annotations.
Fig. 2-8. Analysis Set.
2.3.c Opening Files
The Open command on the File menu or main toolbar opens previ ously sa ved images
and MatchSets.
Note: This version of PDQuest will load any images and MatchSets created with earlier
versions of PDQuest.
2-10
Page 42

Fig. 2-9. Open dialog box.
In the PDQuest Open dialog box:
General Operation
• Already open images are marked with an asterisk.
• File types and icons are listed next to each image name.
• MatchSets are listed as single files, even though they are really collections of
images.
In the Open dialog box, open an image b y double-cl icking on it s name or selecting the
file name and clicking the Open button. Specify the file type by selecting one from
the Files of Type pulldown menu. Your options include Loadable Images and
MatchSets, Raw Image, Filtered Image or Gaussian Images, MatchSets, or All Files.
To select multiple files to open, use the standard ctrl-click and shift-click key
combinations in Windows, or shift-click the Macintosh. Images in a scanset or a
MatchSet will be loaded into the same window.
Click the Parent Folder button to go up one level in the directory tree. Click the
Desktop icon to open the desktop folder.
In the Look In: field, click the default name
2-11
Page 43

PDQuest User Guide
or down arrow to the right of the field to display a hierarchical tree structure locating
the default drive, folder and file.
Note: The drive buttons only include mapped drives. If you need to access an
unmapped (network) drive, you can type the drive name directly into the Folder
field using UNC notation (e.g., \\remote server name\shared directory
name\...\file name). Or you can create a shortcut to the drive on your desktop.
To go directly to the folder where your images are stored, click the Sample Images
Folder. To go to the folder containing your MatchSets, click Sample MatchSet Folder.
Specify the locations of these folders in Path Preferences under Edit > Preferences.
An image created in the Windows version of PDQuest can be opened in the
Macintosh version, and visa versa. However, you must add the appropriate extension
to your Macintosh files to open them in Windows (e.g.,.gsc for Raw 2-D scans, .gim
for Filtered images, .csc for calstrip scans, etc.).
PDQuest comes with a selection of sample images. In Windows, these files may be
found in the Discovery Series/Sample Images/2D directory. On the Macintosh, they
are stored in the Sample Images folder in the PDQuest folder. These sample images
are related, and can be used to create a MatchSet.
Opening TIFF Images
The Open command can also be used to import TIFF images from other software
applications.
TIFF images do not contain all of the tagged information that would normally be
included in a Discovery Series image file (e.g., scanner type, date, color, etc.). For this
reason, the Image Info and Print > Image Report commands will not display all such
tagged information from TIFF files.
There are many types of TIFF formats that exist on the market. Not all are supported
by the Discovery Series. There are two broad categories of TIFF files that are
supported:
1. 8-bit Grayscale. Most scanners have an option between line art, full color, and
grayscale formats. Select grayscale for use with the Discovery Series sof tware. In
a grayscale format, each pixel is assigned a value from 0 to 255, with each value
corresponding to a particular shade of gray. Hewlett Packard
™
Sharp
each make scanners that produce compatible 8-bit grayscale images.
™
, Microtek™, and
2-12
Page 44

General Operation
2. 16-bit Grayscale. Bio-Rad’s Molecular Imager (storage phosphor) systems use
16-bit pixel values to describe intensity of scale. Molecular Dynamics
also use 16-bit pixel values . Th e Disco very Series und ers t ands thes e f ormats and
can interpret images from both Bio-Rad and Molecular Dynamics storage
phosphor systems.
Note: PDQuest can import 8- and 16-bit TIFF images from both Macintosh and PC
platforms. PDQuest cannot import compressed images.
TIFF files that are not supported include:
1. 1-bit Line Art. This format is generally used for scanning text for optical
character recognition or line drawings. Each pixel in an image is read as either
black or white. Because the software needs to read continuous gradations to
perform gel analysis, this on-off pixel format is not used.
2. 24-bit Full Col or or 256 Inde xed Color. These formats are frequently used for
retouching photographs and are currently unsupported in the Discovery Series,
although most scanners that are capable of producing 24-bit and indexed color
images will be able to produce grayscale scans as well.
3. Compressed Files. The software does not read compressed TIFF images. Since
most programs offer compression as a selectable option, files intended for
compatibility with the Discovery Series should be formatted with the
compression option turned off.
™
imagers
Export Image as TIFF
The Reports>Export to TIFF dialog box contains the setting s for exporting a Raw 2-D
scan, Filtered image, or Gaussian image in TIFF format.
2-13
Page 45

PDQuest User Guide
Fig. 2-10. Export to TIFF dialo g.
Note: See Filtered Images and Gaussian Images for a description of the different image
types.
In the export dialog, first select whether you want to export the raw data image
(Analysis option) or the currently displayed view of the image (Publishing optio n).
Select the appropriate radio button to publish the export view excluding or including
overlays.
Analysis Export
2-14
Page 46

General Operation
The Analysis option exports the image data unmodified by any viewing adjustments
you may have made (such as Transform or Zoom). If you select this option, the other
controls in the dialog box will become inactive.
Publishing Export
If you select the Publishing export option, the exported TIFF image will look like the
image as it is currently displayed on the computer screen.
You can specify a resolution for the exported image by selecting 72 dpi (typical
computer screen resol uti on) , 1 50 dpi or 300 dpi (s tan dard pr i nt ing res ol uti ons ), Same
as scan, or any resolution you specify (up to the resolution of the scan).
If you have log transformed the image, you can specify a Linear transform, or
preserve the Current view.
If your image has a pixel dep th of 1 6 bi ts , yo u can compress it to 8 bit data for exp ort
to TIFF by selecting the 8 bit option.
Note: Note:TIFF images are exported from the Multi-chann el Viewer in 24 bit RGB
mode to preserve the colors displayed in the viewer.
Finally, if you are only displaying part of the image due to magnification or
repositioning, you can preserve the Current view or export the Entire image.
Exporting the Image
The size of the pixels in the image and the file size of the image are listed at the
bottom of the dialog. When you are ready to export, click the Export button.
A Save In dialog box will open. The default file name will have a .tif extension, and
the file type will indicate that this is a TIFF image. You can change the file name or
select a different directory to save in.
2.3.d Closing files
To unload a single image from a window or subwindow, select the window or
subwind ow, then select File > U nload. If the image is in a subwindow, the image will
close but the larger window will remain open; if the image is in its own window, the
entire window will close. If the file has changed since it was last saved, you will be
prompted to save the changes before closing. The File > Unload option is inactivated
2-15
Page 47

PDQuest User Guide
if this action is not executable. If the action is executable you will be prompted to
confirm.
File > Close (Alt F4) closes the entire active window, including any subwindows. If
any of the images in the window has changed, you will be prompted to save the
changes before closing.
File > Close All closes all open images in all windows. If you have made changes to
any of the images, a message box will open for each unsaved image giving you the
option of saving those changes.
2.3.e Saving Files
File > Save will save a new or old scan, scanset, or MatchSet to your hard disk,
network dri ve, or other st orage media.
Note: In Windows, new PDQuest images will be given a .gsc extension when they are
first saved.
File > Save As dialog can be used to save scans, scansets, and MatchSets under
different names and different directories. The default name of the file is listed in the
Name field, along with the type of file, for example, MatchSet.
Note that in the case of scansets (see section 2.3.a, File Types in PDQuest), all the
different files in the set must be loaded when you select Save As if you want the root
name to be changed for all of them.
Save All on the main toolbar or File menu saves all images, scansets, and/or
MatchSets that are currently open.
2.3.f Revert to Saved
File > Revert to Saved will recover the last saved version of the image or MatchSet
you are working on. This is a quick w ay t o und o any alterat ion s yo u hav e made since
you last saved it.
Any changes you have made since last saving the file will be lost. (Any open dialog
box will also be closed.) A message box will warn you before completing the
command.
2-16
Page 48

General Operation
2.3.g Image Info
On the main toolbar, Image> Image Info displays general information about your
image, including the scan date, scanner used, scan area, number of pixels in the
image, data range, and the size of the file. Gaussian image info includes the number
of spots, total data in the spots, and other information. There is also a field where you
can type in a file description or comments.
Fig. 2-11. Image Info box.
The Image Info dialog displays differ ently, depending on the type of file you are
acquiring information about, for example, Raw 2-D or Gaussian. History lists the
2-17
Page 49

PDQuest User Guide
changes made to the image including the date the changes were made. To print the file
information, click Print.
2.3.h Reduce File Size
Scan files can be quite large, and computer systems do not hav e unli mite d memory or
storage space. If you are having difficulty loading or storing a particular scan, you
may want to reduce the size of the file by redu cing th e number of pixels in the image.
(You can also trim unneeded parts of an image to reduce its memory size. See section
3.13, Cropping Images.)
Note: This command only works on Raw 2-D scans.
This function is comparable to scanning at a lower resolution, in that you are
increasing the size of the pixels in the image, thereby reducing the total number of
pixels and thus memory size.
Note: Reducing the file size of an image will result in some loss of resolution. In most
cases this will not affect quantitation. In general, as long as the pixel size remains
less than 10 percent of the size of the objects in your image, changing the pixel
size will not affect quantitation.
Select Image > Reduce File Size. The dialog box shows you the size of the pixels in
the image (Pixel Size: X by Y microns), the number of pixels in the image (Pixel
Count: X by Y pixels), and the Memory Size of the image.
As you increase the size of the pixels, the pixel count will decrease, as will the
memory size. You can increase the pixel size in either dimension (see the following
figure for an example). You cannot reduce the pixel size, yo u can only inc rease it. You
can reduce the pixel count.
2-18
Page 50

Before:
Pixel size increase confirmation
After:
Pixel Count and Memory Size reduced
General Operation
Fig. 2-12. Reduce File Size dialog box, before and after pixel size increase.
Note: Asymmetric pixel reduction (i.e., making pixels smaller in one dimension than
the other) is not recommended for 2-D gels, since you want to resolve spots in
both dimensions.
A pop-up box prompts you to confirm the resolution reduction. If you choose to
reduce in place, the descriptions of objects in the scan will be lost. Only the scan
image is retained. Click Reduce an d Copy to make a copy the original file and reduce
the copy’s size, or click Reduce to reduce the file size of the displayed image.
Reducing the file size is an irreversible pr ocess. For that reason, we suggest you make
a copy of the image and reduce its file size. That way, if you lose too much resolution,
you can simply delete the copy and try again. Once you are happy with the reduced
image, don’t forget to delete the original. The goal is to save space!
2-19
Page 51

PDQuest User Guide
If you choose to make a copy of the image, you will be asked to enter a name for the
new copy before the operation is performed.
2.3.i Exiting PDQuest
File > Exit quits the application. You will be prompted to save any unsaved changes
to images or MatchSets.
2.4 Printing and Exporting
The commands for printing images, actual-size images, image reports, and video
printouts are located on the File > Print submenu.
Fig. 2-13. File > Print submenu.
2-20
Page 52

General Operation
2.5 Printing
1. Page Setup opens a dialog box where you can select the size and source of your
paper, portrait or landscape orientation, and set margins for your report.
2. Print Image moves you directly to the print menu. You can also send an image to
the printer using C
3. Print Actual Size prints an actual size copy of the image.
4. Image Report prints the image and information about its scan history, number of
pixels, data range, etc.
5. Video Print prints images and reports to a video printer.
2.5.a Printing Images
Print Image prints a copy of the active image window and any image overlays that are
displayed.
File > Print > Print Image opens the Print dialog box with three tabs: General, Layout,
and Paper/Quality.
NTRL+P.
2-21
Page 53

PDQuest User Guide
Fig. 2-14. Print Image dialog box.
In the General tab, select the pri nter and page rang e you want to us e. In the Layout t ab
select page orientation, duplex printing, and advanced options, if necessary. In the
Paper/Quality tab set the paper source, whether or not you want to print in color, and
advanced options, if necessary.
When you are satisfied with all the print parameters, click Print to send the image to
the printer.
2.5.b Print Actual Size
You can print your images at their actual size using the Print Actual Size command.
Note: If you are using the Gel Doc, ChemiDoc, Fluor-S, or Fluor-S MAX, you must
specify the correct image area size when capturing your images to ensure
accurate 1:1 printing. You can specify the image area size in the acquisition
window for the instrument. See the chapter on each imaging device for more
information.
2-22
Page 54

General Operation
Select Print Actual Size from the File > Print submenu. The standard Print Image
dialog box will open (see previous section).
2.5.c Image Report
Image Report allows you to print out a single-page report of an image and its
associated information. The format of the report is designed to provide a concise yet
thorough summary of the most relevant features of an image for documentation
purposes.
Fig. 2-15. Master Image Report.
The report includes the following information:
2-23
Page 55

PDQuest User Guide
• The image title.
• A description of the image if you specified one.
• The directory location.
• The filename of the image.
• The type of imaging device (scanner).
• Pixel size by X and Y axis as measured in um.
• The scan (image) area in terms of X an d Y axis and the data range as measured in
integers.
• The number of pixels scanned and the memory size as measured in Kilobytes.
• The Scan history (date and time of the report) and the action(s) perf ormed dur ing
that scan.
• The imaging area and number of pixels.
• The intensity range, image color, and memory size.
• Image background information.
• Relevant lane and band information.
To print a image report of a particular gel, select Image Report from the File > Print
submenu. This opens the standard print dialog box (see Print Image, above).
Note: TIFF images do not contain all the tagged information that would normally be
included in an image file (for example, imaging device, scan date, image color,
etc.). For this reason, the Image Report may list this information as Unknown for
imported TIFF files.
2.5.d Video Printing
The Video Print command allows you to print images and reports on a video printer.
To create a video printout of the active window, select Video Print from the File >
Print submenu.
Note: Video printing requires installation of the video board and cable that come with
the Gel Doc 1000/2000 and ChemiDoc gel documentation systems. The video
board and cable can also be ordered separately.
2-24
Page 56

General Operation
Settings for the Mitsubishi P90W/P91W Video Printer
There are three settings for the Mi tsub ishi P90 W/P 91W vi deo p rint er. Set Contrast to
0, Brightness to 0, and Gam ma to 5.
The dip switches should stay in the orientation in which they are shipped: Pin 1 is up
(on), and Pins 2–10 are down (off).
2.6 Exporting
You can export gel images to TIFF images, and export MatchSets and Annotations
using the Export submenu in the Reports menu.
Fig. 2-16. Export submenu.
2-25
Page 57

PDQuest User Guide
2.6.a Exporting an Image
T o export a Raw 2-D scan, Filtered image, or Gaussian image as a TIFF image, select
Export to TIFF Image from the File > Export submenu, then click the image in a
MatchSet or scanset.
Fig. 2-17. Exporting TIFF Images.
In the export dialog, first select whether you want to export the original image data
(Analysis option) or the currently displayed view of the image (Publis hing option).
Note: Only the Publishing option is av ailable if you are exporting from the Mutli-
Channel Viewer.
2-26
Page 58

General Operation
Analysis Export Mode
The Analysis option exports the image data unmodified by any viewing adjustments
you may have made (such as Transform or Zoom). If you select this option, the other
controls in the dialog box become inactive.
Publishing Export Mode
If you select the Publishing export option, the exported TIFF image will look like the
image as it is currently displayed on the computer screen. You can choose whether or
not you want to include overlays.
Specify a resolution for the exported image by selecting 72 dpi (typical computer
screen resolution), 150 dpi or 300 dpi (standard printing resolutions), Same as scan,
or any resolution you Specify (up to the resolution of the scan) .
If you have log transformed the image, you can specify a Linear transform, or
preserve the Current view.
If your image has a pixel dep th of 1 6 bi ts , yo u can compress it to 8 bit data for exp ort
to TIFF by selecting the 8 bit option.
Note: TIFF images are exported from the Multi-channel Viewer in 24 bit RGB mode to
preserve the colors displayed in the viewer.
Finally, if you are only displaying part of the image due to magnification or
repositioning, you can preserve the Current view or export the Entire image.
Exporting the Image
The size of the pixels in the image and the file size of the image are listed at the
bottom of the dialog. When you are ready to export, click the Export button.
The Export TIFF Image dialog box opens. The default file name will have a .tif
extension, and the file type will indicate that this is a TIFF image. You can change the
file name or select a different directory to save in. Click Save to complete the export.
A confirmation appears in the status box of the top menu bar.
2-27
Page 59

PDQuest User Guide
Fig. 2-18. Status box confirms your export to TIFF is successful.
2.6.b MatchSet Data
Data from a MatchSet can be exported as an AS CII t ext fil e f or further analysis using
spreadsheet programs. Alternatively, you can export the MatchSet to the Clipboard.
With the MatchSet loaded, select Export MatchSet from the File > Export submenu.
2-28
Page 60

General Operation
Fig. 2-19. Exporting MatchSet data.
In the dialog, you can export data for each gel in a MatchSet (Spot Data by Gel), or
for each replicate group in the MatchSet (Spot Data by Group).
Under Spot Data by Gel, select the data to export for each spot (position, quantity,
quality, Gaussian size, normalized quantity, and/or peak value).
2-29
Page 61

PDQuest User Guide
The quantities of saturated spots can be estimated, reported as the value -3.0, or
reported in some other way that you specify. If you opt for the latter, click the Other
button and enter the value that should be reported.
If a spot is unmatched in one or more members of a MatchSet, it can be estimated as
the value -1.0 or as a value that you enter in the text box next to the Other button.
For each spot, you can include the SSP number, DSN (if designated), replicate group
ID, and/or MrpI (Peak) value if calculated by selecting the appropriate checkboxes.
You can export annotations in all categories or a specified category. If you select
Specified, select the category from the pulldown list.
You can export all analysis sets or a specified analysis set. To specify an analysis set,
select one from the pulldown list.
Under Spots to Export, specify the spots whose data should be exported. You can
choose all the spots in the MatchSet, those spots that are matched in every member of
the MatchSet, or the spots in a particular analysis set. The spot count automatically
adjusts to reflect the total number of spots selected.
Under Output Options, you can include headers for each column in the report. Select
how you want to sort the spot data: by SSP number, DSN, or gel/replicate group.
Select the field separators you want to use to separate columns of data in your
spreadsheets: commas or tabs for Excel.
Your data can be exported as a file or to the clipboard. If you choose the file option
button, clicking Done opens the Export MatchSet Data dialog box, in which you can
enter a name and export location for the file. The file type automatically defaults to an
.xls spreadsheet.
If you choose the clipboard option, clicking Done saves your data to the system
clipboard.
If you have created replicate groups for the MatchSet, you can export the averaged
data for each group. Under Spot Data by Group, select the data to export (Master
position, average quantity, coefficient of variation, standard Gaussian size, average
normalized quantity, normalized coefficient of variation, and/or the counts in the
member gels).
2-30
Page 62

General Operation
Fig. 2-20. Spot data by group tab.
Basic Export MatchSet
The Basic Export MatchSet dialog allows you to export the individual characteristics
of spots in a MatchSet. This is a more basic version of the standard Export MatchSet
dialog. Data will be exported in ASCII text format.
With the MatchSet loaded, select Basic Export MatchSet from the File > Export
submenu.
2-31
Page 63

PDQuest User Guide
Fig. 2-21. Export MatchSet Data dialog box.
Next to the Data to export options, select the characteristic of the spot that you want
to export.
Specify the spots whose data should be expo rted. You can choose either all the spots
in the MatchSet, those spots that are completely matched in every member of the
MatchSet or the spots in a particular Analysis Set.
The Spot Count automatically adjusts to reflect the total number of spot s selected.
If you are exporting spot quantity data, select either estimated or specified as the way
in which saturated spots and unmatched spots are reported.
The quantitation of saturated spots can be estimated, reported as (- 3.0) , or reported in
some other way that you specify. If you opt for the latter, enter the value that should
be reported in the Specify field.
If a spot is unmatched in one or more members of a MatchSet, it can be reported as
the minimum spot quantitation value (the minimum quantity needed for a spot to be
2-32
Page 64

General Operation
detected for the gel). Alternatively, it can be reported as (-1.0) or as a value that you
enter in the text box next to the Specify button.
Next, select the field separators you want to use to separate columns of data in your
spreadsheets: commas or tabs.
Your data can be exported as a file or to the clipboard.
If you choose the File option button, clicking OK opens the Basic Export MatchSet
dialog box, in which you can enter a name and export location for the file.
If you choose the Clipboard option button, clicking OK saves your data to the
clipboard.
2.6.c Exporting Annotations
You can export MatchSet annotations by category to a text file for inclusion in a
document or spreadsheet.
With the MatchSet open, select Export Annotations from the Report > Export
submenu. The box prompts you to select the annotation category or categories to
export.
2-33
Page 65

PDQuest User Guide
Fig. 2-22. Export Annotations pop-up box .
Click an individual category name to select it, or shift-click or ctrl-click to select
multiple categories.
When you have made your selection(s), click Export. In the file name dialog, enter a
name for the export file and select the directory to save to.
The data in the text file is tab-delimited. Each row includes the annotation category,
SSP number for a spot in that category, and the associated annotation entry.
Text files can be opened in standard Windows and Macintosh documents and
spreadsheets. If you selected multiple categories to export, the annotations will be
sorted by category.
2-34
Page 66

General Operation
2.7 Preferences
The Preferences dialog box allows you to customize basic features of your system.
Select Edit > Preferences to open the dialog. Tabs for Misc, Paths, Display, Toolbars,
Application, and Imagers display.
Fig. 2-23. Preferences dialog box.
Click the appropriate tab to access groups of related preferences. After you have
selected your preferences, click OK to implement them. Some of your preferences
will only be implemented by exiting and restarting the program. A message will
notify you if this is necessary.
2.7.a Misc Preferences
Click the Misc tab to access the following preferences.
The Memory Allowance field allows you to specify the amount of virtual memory
allocated for the application at start up. The default value of 512.00 megabytes is
recommended If you receive a warning message when opening the program that the
amount of virtual memory is set too high, you can enter a smaller value in this field.
However, this should be considered a temporary fix.
2-35
Page 67

PDQuest User Guide
Your institution name can be included in reports if you enter it in the Institute Name
field.
Under Windows, the Maximize application window check box determines whether the
main window occupies the entire computer screen when first opened. If this is
unchecked, the menu and status boxes will appear across the top of the screen and any
toolbars will appear “floating” on the screen.
If Enable DOS File Name Parsing is checked, for 8-character filenames ending in two
digits, the final two digits are interpreted as version and exposure numbers. For
example, the file name IMAGE-11.gsc would be parsed as IMAGE ver 1 xpo 1.gsc.
This is designed to enable backwards compatibility for users with DOS image fil es.
You should only check this box if you are using these image files.
Enable UNIX File Name Parsing is similar to DOS file name parsing. Windows and
Macintosh users are unlikely to run into difficulties with UNIX parsing, therefore this
setting is checked by default.
Multiple Mouse Assignment Mode is designed for backward compatibility with
previous versions of PDQuest. It is not documented in this manual.
The Use Custom Open box option to
If Get name for Network Drives or Removable Drives are checked, the names of
these drives will appear in the Custom Open dialog along with the drive letters.
2.7.b Path Preferences
Navigate to the Edit > Preferences > Paths tab to set the file paths for various
shortcuts and links through out PDQues t .
2-36
Page 68

General Operation
Fig. 2-24. Path preferences Browse button
To set a particular file path, click the Browse button next to the path field and
navigate to the appropriate directory, then highlight the folder where you want to set
the path. Click OK. Check Default to return the path to the default setting.
The Images path Browse button connects to the main directory where you keep your
image files.
2-37
Page 69

PDQuest User Guide
The MatchSets path Browse button connects to the main directory where you keep
your MatchSet files.
The Log path Browse button sets the directory where spot detection log files are
saved. Select Spot Detection Report from the Spots menu to acces s the log files in this
directory.
Fig. 2-25. Log report from Spot Detection menu.
The Micromass Projects path sets the directory where your Micromass project files
are stored. This path is used to link to Micromass project files using the Generate
MassLynx Batch File and Import MassLynx Results tools.
2-38
Page 70

General Operation
The Micromass Install path sets the directory where your Micromass processing
parameters are stored. This path is used to link to Micromass parameter files using the
Generate MassLynx Batch File function.
The Temporary path sets the directory where temporary image files and other files
generated by PDQuest are stored.
2.7.c Display Preferences
Fig. 2-26. Display Preferences
Click the Display tab to access the following preferences.
Zoom % allows you to specify the percentage by which an image moves closer or
farther away when you use the Zoom functions. This percentage is based on the size
of the image.
Pan % determines the percentage by which the image moves side to side or up and
down when you use the arrow keys . T his percen t age i s bas ed on the size of the image.
2-39
Page 71

PDQuest User Guide
If you want to apply a uniform background to Gaussian images so they more closely
resemble the original gels, enter a background optical density (O.D.) value in the text
box next to the Gel Spot Bkgd prompt.
In Windows, Jump Cursor on Alert will automatically jump the cursor to the OK
button when an alert box pops up. Deselect the checkbox to turn off this feature.
By default, a subwindo w is s elected when you mo ve your cur sor ov er it. If you wou ld
rather click a subwindow to select it, select Click to Focus Subwindow.
Note: Click to Focus Subwindow will change the behavior of mouse-assignable tools.
Some commands that were previously mouse-assignable will be performed
immediately on the active subwindow; other commands will require you to click
once in a subwindow to select it, then click or drag again to perform the action.
Auto ‘All Same’ duplicates the zoom and positioning commands made in one
subwindow in all displayed subwindows. For example, with Auto ‘All Same’
selected, Zoom In on one subwindow; the other open subwindows will also zoom in.
The Save subwindow configuration saves subwindows in the last order displayed.
If Bold Match Symbols is selecte d, landmarks , manual matches, add ed spots, etc. will
appear larger and bolder on the screen.
If Filled Spot Ellipses is checked, marked spots (e.g., spots marked using the
Saturated Spots command) will be displayed as filled ellipses. If unchecked, they will
be displayed as unfilled ellipses.
Solid Label Background will automatically display spot labels in a filled-background
box.
If Small Window Labels is checked, any text in the windows/subwindows will be
displayed in a smaller font.
Show Filtered Images by Default will automatically display the Filtered images when
you first open a MatchSet (provided the MatchSet includes Filtered images).
In Gaussian images, specify whether you want to see only single spots or multiple
spots by clicking on the appropriate button under Display combined spots. Note that
valid spots are spots that ha ve not been cancelled. If you elect to display combined
spots, they will appear in the Gaussian image as they do in the Filtered image,
although the quantitation will be combined.
2-40
Page 72

General Operation
2.7.d Toolbar Preferences
Fig. 2-27. Toolbar pr eferences
Click the Toolbar tab to set the behavior and positioning of the secondary toolbars and
Quick Guide.
If the Show Quick Guide checkbox is selected, the quick guide will open
automatically when you open PDQuest.
If Align Quick Guide with Document is selected, the quick guide will pop up flush
with the edge of your documents. Otherwise, it will appear flush with the edge of the
screen.
The Guides always on top checkbox deter mines wheth er the quick guide and t oolbars
will always be displayed on top of images, or whether they can be hidden behind
images.
Quick Guide Placement and Toolbar Placement determine which side of the screen
the quick guide and toolbars will first open.
2-41
Page 73

PDQuest User Guide
The Placement Behavior setting determines whether a quick guide or toolbar will
always pop up in the same place and format (Always Auto), or whether it will pop up
in the last location it was moved to and the last format selected (Save Prior).
The Toolbar Orientation opti on b utt on s specify whet her too l bars wi ll fir st app ear i n a
vertical, horizontal, or expanded format when you open PDQuest. In the extended
version, quick access to context sensitive Help displays in the Quick Reference guide.
Tool Help Delay allows you to specify the amount of time (in seconds) the cursor
must remain over a toolbar icon before the Tool Help appears. First-time users may
want to specify a short delay to learn the names of the toolbar functions, while
experienced users can specify a longer delay once they are familiar with the icons.
Persistence determines how long the Tool Help will linger on the screen after you
move the cursor off a toolbar icon.
2.7.e Application Preferences
Fig. 2-28. Application preferences
Click the Application tab to access these preferences.
2-42
Page 74

General Operation
Enter up to three letters for the MatchSet Name Prefix and a number for the MatchSet
Name Sequence #.
When you create a MatchSet, you can give it a default name. The MatchSet Name
Prefix field determines the prefix of the default name, while the MatchSet Name
Sequence # determines the number added to the prefix to complete the name. The
sequence number increases by 1 each time a new MatchSet is created using the
default name.
Once the prefix and the sequence number have been initially set, you probably will
not need to change them.
If Auto-match after Landmark is selected, PDQuest will auto-match all gels in the
MatchSet each time you place a landmark in all the gels.
Finally, indicate the orientation in which your gels are run by clicking on either the
Acid-Base or Base-Acid button next to the pH Gradient prompt.
2.7.f Imagers
Checking the name of a scanning device in the Imagers tab allows you to scan using
that instrument.
See the individual appendices on each imaging devices for more details.
2-43
Page 75

PDQuest User Guide
Fig. 2-29. Imagers.
The Edit > Preferences > Imagers tab contains a list of Bio-Rad imaging devices
supported by the Discovery Series software. These are:
1. Gel Doc
2. ChemiDoc
3. G S -700 Imagi ng Densitometer
4. G S -710 Imagi ng Densitometer
5. G S -800 Imagi ng Densitometer
6. Fluor-S MultiImager
7. Fluor-S MAX MultiImager
8. Fluor-S MAX2 MultiImager
9. VersaDoc
10. Personal Molecular Imager FX
2-44
Page 76

General Operation
11. Molecular Imager FX
Note: If you check one or all of these devices they display in the File menu. You need to
restart the program in order for your selections to take effect.
2.8 Mouse-assignable Tools
Mouse and Mouse Macro functions are designed for backwards compatibility with
previous versions of PDQuest. They are not recommended for new users.
PDQuest has a number of commands that don’t perform actions right away, but
instead assign a function to your mouse (e.g., Zoom Box, Density at Cursor, Add
Spot). Select Mouse from the Edit menu to open the Mouse dialog or Edit > Mouse
macro for a pulldown menu.
Fig. 2-30. Mouse Preferences.
2-45
Page 77

PDQuest User Guide
You can choose f rom up to fou r groups of mouse functions, and select either two or
three buttons to assign to each group.type the name of the mouse configuration file
into the appropriate field. Lower button options contain. Load, Save, Reset, Delete,
Done.
Note: Mouse assignable tools selected using the keyboard have slightly different
behavior.
Example of
Mouse-assigned
tool cursor:
Mouse Macro
Pulldown Menu
Density at
Cursor
Fig. 2-31. Mouse Macros and Example of a mouse-assignable tool.
When a mouse-assignable function is selected, the cursor appearance changes. The
name and icon of the function appear in the status box next to the main toolbar (see
section 2.1.c). The status box displays text accord ing to where yo ur mouse was p laced
last.
To deassign a function from the mouse, click the toolbar button of the assigned
function or click in the status box displaying the assigned function. You can also
double-click the Hide Overlays button.
2-46
Page 78

General Operation
Note: Some commands in PDQuest become mouse-assignable if you are displaying
multiple subwindows. For example, if you select Spots > Spot Crosshairs with a
single image displayed in a window, crosshairs will simply be displayed.
However, if you select Spots > Spot Crosshairs with multiple subwindows
displayed, the command will be assigned to your mouse and you must click a
subwindow to display the crosshairs in that subwindow.
2-47
Page 79

PDQuest User Guide
2-48
Page 80

3. Viewing and Editing
Images
This chapter describes the tools for displaying images in windows and subw indows,
and magnifying and optimizing images. This chapter also describes the tools for
cropping, flipping, and rotating images and filtering image noise.
These tools may be found on the View, Edit, Image, and Window menus.
3.1 Windows and Subwindows
PDQuest displays the multiple images in a MatchSet or a scanset in subwindows of
the same image window. Subwindows appear as separate, s maller windo ws within the
main image window. Subwindows are designed to allow you to easily compare and
edit MatchSet and scanset images at the same time.
3.2 Configuring Subwindows
To control how MatchSets and scansets are partitioned into subwindows, click the
Configure Subwindows button on the main toolbar (also Ctrl+F1 and Windows
menu). The Configure Subwindows dialog box will open.
The Loaded Images buttons show the types of files that are open (2D sc ans, Gaussian
images, MatchSets, etc.) and list how many images are in each type. Click a button to
display only images of that type in the subwindows.
Click All to display all available image types in subw indows.
3-1
Page 81

PDQuest User Guide
Fig. 3-1. Configuring the subwindows of a scanset.
The Quick Config buttons immediately partition the subwindows into the
configuration depicted on the button . (Note that if you have selected a Loaded Images
option, only images of that type will be displayed.)
Otherwise, select a configuration by typing values in the Windows, Rows, and Cols
fields. The Windows field specifies how many subwind ows to create. Rows and Cols
specify how to layer the subwindows.
For large MatchSets with many members, you can deselect the Display Images Once
Configured checkbox. Then, when you apply a new configuration, the images will not
be immediately refreshed in the windows. Click in a subwindow to make the image in
that subwindow appear.
Note: Deselect this checkbox only if you have a slow computer and are displaying
many images.
Click the Apply button to implement your configuration selections .
3-2
Page 82

Viewing and Editing Images
3.3 Assigning and Interchanging Images
You can use the Assign and Interchange commands to select the image you want to
display in a particular wi ndow or subwi ndow.
Assigning Images
To assign an image to a particular subwindow, select the Assign tool
from the main toolbar or Window menu and click in the subwindow, or
use the Ctrl+A key command in desired subwindow. This will open a
pop-up list of all the images currently loaded in the MatchSet or scanset.
Select an image name from the list; the image will appear in the selected window.
Fig. 3-2. Assign Image lists all the loaded images; select one to display it.
Interchangin g Images
Interchange Images switches between the Raw 2-D scan, Filtered image, and
Gaussian image of the same gel within a selected subwindow. With the images
loaded, select the tool from the main toolbar or View menu and click in the
subwindow, or use the F11 key command in the subwindow. The type of image
currently displayed is listed at the bottom of each subwindow.
Interchange All Images (Shift+F11, View menu) switches between the Filtered
images and Gaussian images in all the displayed subwindows of a MatchSet.
3-3
Page 83

PDQuest User Guide
3.4 Tiling Windows
The tile commands under the Window menu are used to arrange image windows on
the screen.
Note: The tile commands only affect image windows, not subwindows.
Select Tile to resize all open windows so that all the images are maximized. The
windows will be arranged on the screen from left to right and top to bottom.
Tile Vertical will resize all open windows and arrange them in columns across the
screen.
Tile Horizontal will resize all open windows and arrange them in rows across the
screen.
3.5 Magnifying Images
The magnifying tools in PDQuest can be accessed from the main toolbar or View
menu, or by key command.
Note that, by default, if you magnify a region in one image of a MatchSet or scanset,
the same region in all the other subwindows will be magnified. To turn off this
feature, deselect the Auto “All Same” checkbox under Display Preferences (Edit >
Preferences).
Ctrl+F3 will undo your last magnification or other viewing command.
3-4
Page 84

Viewing and Editing Images
Fig. 3-3. Viewing functions on View menu and main toolbar.
Zoom Box
Use the Zoom Box tool to magnify a specific region of an image, MatchSet, or
scanset.
Select Zoom Box from the main toolb ar or View menu, or position your cursor on the
image and press F2. Drag a box on the image, then release the mouse button. The area
you selected will be magnified.
3-5
Page 85

PDQuest User Guide
.
1. Click Zoom Box button.
2. Drag box on image. 3. Boxed region is magnified to fill window
Fig. 3-4. Zoom Box tool.
Zoom In/Zoom Out
Zoom In (Alt+F2, View menu and toolbar) will magnify an image, or all the images in
a MatchSet or scanset, by a defined percentage. The percent magnification is
specified under Display Preferences (Edit > Preferences).
Zoom Out (Ctrl+F2, View menu and toolbar) will reduce the magnification by the
same percentage.
View Entire Image
If you have magnified par t of an i mag e or mov e d p art of an i mage o ut of
view, this command will restore the original, full view. Select View
Entire Image from the main toolbar or View menu and click the image,
or position your cursor on the image and press F1.
3-6
Page 86

Viewing and Editing Images
Imitate Zoom
Imitate Zoom applies the magnification and positioning of a selected window or
subwindow to all open windows and subwindows. This command only works on
comparable images with similar dimensions.
Note: Imitate Zoom is different than the Auto “All Same” setting under Display
Preferences, in that is affects all open windows, not just the subwindows in a
single window.
Select a window or subwindow you want to imitate, then select Imitate Zoom from
the Window menu. The other windows will change their display to match that of the
active window
Magnifying Sections of an Image
T o magnify o ne of nine sections of an image or MatchSet /scanset, go the 3x3 Sect ions
submenu on the View > Advanced View submenu, and select a region (Upper Left,
Middle, Lower Right, etc.) That region will be magnified in the image or MatchSet/
scanset.
Location in Gel
Location in Gel on the View>Advanced View submenu displays a graphical overlay
on a subwindow or all subwindows showing the region that is magnified (green box)
relative to the entire image (blue box). Select the command, then click the image.
3.6 Positioning Images
The image positioning tools in PDQuest can be accessed from the main toolbar or
View menu, or by key command.
Note that, by default, if you reposition one image of a MatchSet or scanset in a
subwindow, all the other subwindows will be repositioned as well. To turn off this
feature, deselect the Auto “All Same” checkbox under Display Preferences (Edit >
Preferences).
Ctrl+F3 will “undo” your last positioning or other viewing command.
3-7
Page 87

PDQuest User Guide
Grab
Use this tool to drag the image in a window.
Select Grab from the main toolbar or Vi ew menu, or position your cursor
on the image and press Ctrl+G. Drag the image, then release the mouse
button. The image will be repositioned.
Swap
The swap command allows you to swap the location of gels in a window. This is
useful for positioning cl osely relat ed gels next to one another i n a wi ndo w. To use the
swap command, select Grab from the main toolbar or View menu, or position your
cursor on the image and press shift+G. Drag the image to another image, then release
the mouse button. The two images change places.
Arrow Keys
You can shift the displayed region in a subwindow or all subwindows by using the
Arrow keys on your keyboar d. With a window or subwindo w selected, cl ick an arrow
button. The image will shift in the direction of the arrow click. The amount the image
shifts is determined by the Pan % setting in Display Preferences under Edit >
Preferences.
3-8
Page 88

3.6.a Advanced View
Viewing and Editing Images
Fig. 3-5. Advanced View submenus.
Centering an Image
Y o u can center an image or images in a MatchSet/scanset quickly and easily u sing the
At Cursor command (F3 on the keyboard; also on the View > Advanced View
submenu). This is useful if you are comparing the same region of spots on multiple
images and want to center the image windows on the same spot.
Position your cursor on a point on the image, then press F3. The image will shift so
that that point is at the center of the image window.
3-9
Page 89

PDQuest User Guide
Displaying Sections of an Image
T o display one of nine sections of an imag e or MatchSe t/scanset, go the 3x 3 Sections
submenu on the View > Advanced View submenu, and select a region (Upper Left,
Middle, Lower Right, etc.) That region will be magnified in the image or MatchSet/
scanset.
Pan means to move the camera, (or the focus of your gel), to the right or left, up or
down.
All Windows indicates that the selections you have made in the Advanced View
submenu will be applied to every window in your set.
Location in Gel
Location in Gel on the View >Advanced View submenu displays a graphical overlay
on a subwindow or all subwindows showing the region that is displayed (gr een box)
relative to the entire image (blue box). Select the command, then click the image.
3.7 Hiding Overlays
To conceal spot markings, graphs, information boxes, etc. in a
subwindow or multiple subwindows, select Hide Overlays from the main
toolbar or View menu and click in the subwindow, or use the F4 key
command in the subwindow.
Note that, by default, hiding the overlays in one image of a MatchSet or scanset will
hide them in all the other subwindows. To turn of f this feature, deselect the Auto “All
Same” checkbox under Display Preferences (Edit > Preferences).
Note: Shift+F4 (Hide All Overlays) will conceal overlays in all subwindows regardless
of whether Auto “All Same” is selected.
3-10
Page 90

Viewing and Editing Images
3.8 Density Tools
The tools under the View>View Density submenu and on the Density Tools toolbar
are designed for advanced users when analyzing gels. They provide a quick measure
of the signal intensity of the data in Raw 2-D scans or Filtered images. Note that these
commands will not work on Gaussian images.
Fig. 3-6. Density submenu and toolbar.
Density at Cursor
To display the signal intensity at a point on the image, select Density at
Cursor from the submenu or toolbar and click the image. The pop-up box
will list the intensity in image units (ODs or counts), and will also show the
average intensity for a 3 x 3 image pixel box centered on that point.
Density in Box
To display the total signal intensity inside a specified region on the image,
select Density in Box from the submenu or toolbar and drag a box around
the area you want to measure. The area of the box (in square millimeters),
the total image intensity (volume) inside the box (in image units—ODs or
counts), and the average intensity will be displayed in a pop-up box.
3-11
Page 91

PDQuest User Guide
Plot Density Distribution
Plot Density Distribution displays a histogram of the signal intensity
distribution for the entire image. Select the command from the menu or
toolbar, and click on the image.
Plot Cross-section
To display a cross-sectional intensity trace centered on a point on the
image, select Plot Cross-section from the submenu or toolbar, or use the
Ctrl+T key command, and click or drag on the image. The trace will be
displayed, and will be continuously updated as you move your cursor
over the image. The intensity (in ODs or counts) at the cursor point is listed, as is the
maximum intensity along the lines of the cross-section.
Note: The sampling width for the density traces is one image pixel.
Click button, then
click or drag on the image.
Fig. 3-7. Plot Cross-section tool.
3-12
Page 92

Viewing and Editing Images
Plot Vertical Trace
Plot Vertical Trace plots an intensity trace down a vertical line centered on
the point where you click your mouse. Select the command from the menu
or toolbar, and click or drag on the image.
Note: The sampling width for the density traces is one pixel.
3.9 Colors
Edit > Colors opens a dialog box in which you can adjust the colors of the image,
windows, buttons, etc.
Fig. 3-8. Colors dialog box.
Selecting a Color Group
Within the Colors dialog box, click the Color Group button to select the colors of the
particular group of objects you want to change (e.g., pop-up boxes, image colors,
etc.).
3-13
Page 93

PDQuest User Guide
Fig. 3-9. List of Color Groups.
Click a color group in the list to select it.
Changing a Colo r
After you have selected the color group to change, click the specific color button to
change. The Color Edit dialog box will open, allowing you to adjust the red-greenblue (RGB) values of the color you selected.
Fig. 3-10. Color Edit dialog box.
Drag the sliders or enter a value in the fields. The color of the button will change with
your adjustments.
3-14
Page 94

Viewing and Editing Images
Saving/Selecting a Defined Set of Colors
After you have changed t he colors withi n color groups , you can s ave these settin gs for
future use on other images. The Colormap Na me fiel d dis pla ys th e name of a defi ned
set of colors and color groups. There are several standard colormaps, or you can
create your own.
To select a predefined colormap, click the Load button. From the list displayed, click
the set of colors you want to apply.
User-defined sets of colors
Fig. 3-11. Selecting a Colormap.
To create your own colormap, adjust the colors within the color groups as described
above and type in a new colormap name. Click OK to apply your changes.
To remove a colormap, click the Delete button. Select the colormap to be deleted
from the displayed list. A pop-up box will ask you to confirm the deletion.
If you want to return to the standard colormap for the selected group, click the Reset
button. All colors will be returned to their default values.
3-15
Page 95

PDQuest User Guide
3.10 Multi-Channel Viewer
You can use the Multi-Channel Viewer to distinguish different types and levels of
fluorescence in a gel that has been imaged at different wavelengths. The MultiChannel Viewer can be used to the merge the information from up to three different
images of the same gel.
Note: The viewer requires that the images being compared are exactly the size and in
exactly the same position. When capturing the images, you shou l d be caref ul not
to move the gel between expo su res. If your images are not exactly the same size,
you can use the Crop tool to resize them.
With at least one image open, select Multi-Channel V i ewer from the View menu. The
topmost open image will be displayed in the viewer window using the Red channel.
Fig. 3-12. Multi-Channel Viewer.
3-16
Page 96

Viewing and Editing Images
Note: The color channel used to display an image in the viewer has no relation to the
filter used when capturing the image. The red, green, and blue channels are
simply designed to distinguish different images.
The image name is displayed in the Red name field at the top of the viewer, and the
Red Channel checkbox will appear selected.
To add another image, make sure the image is open and click the pulldown button
next to the Green or Blue name field. Select the image name from the pulldown list.
Add a third image using the same procedure.
You can reassign the different images to different channels using the pulldown
buttons to the right of the name fields. Select <clear> from the pulldown list to
remove an image from that channel of the viewer.
Viewing Options
To remove a particular color channel from the display, click in the checkbox
associated with that channel to deselect it.
Selecting the Auto-Scale Image When Assigned checkbox will automatically adjust
the brightness and contrast of each loaded image based on the data range in the imag e.
It invokes the Auto-Scale command from the Transform window when an image is
first opened in the viewer. Note that this setting affects only how the image is
displayed in the viewer, not the actual data.
Note: If you deselect this checkbox, any images currently displayed will remain auto-
scaled. click the Transform button in the viewer and click the Reset button in the
Transform window to undo auto-scaling.
Buttons for various viewing tools are included in the Multi-channel viewer.
Commands such as Zoom Box and Grab will change the display of all the images in
the viewer at once.
Note that if you open the Transform window, you can adjust the display of each
channel independently, by selecting the appropriate channel option button in the
Transform window. Similarly, the Plot Cross-Section command will report the
intensity of each channel separately.
3-17
Page 97

PDQuest User Guide
Exporting an d Printing
You can export a 24-bit TIFF image of your merged view by
clicking on the Export button. This will open a version of the
Export to TIFF dialog. Note that you cannot export image data
from the Multi-channel Viewer—only the current view of the image (designated as
Publishing Mode in the Export dialog). The colors in the viewer will be preserved in
the exported TIFF image.
You can also print a copy of your merged view to a color or grayscale printer by
clicking on the Print button.
3.11 3D Viewer
The 3D Viewer tool allows you to see a three-dimensional rendering of a portion of
your image. This is important for such instances as determining whether a selected
spot is actually two or more separate spots.
To see a 3D rendering of a portion of your image, select 3D Viewer from the View
menu. Your curser turns into a crosshair. Click and drag your curser over the image
area you would like to view creating a box.
Note: viewing a large area of your image may reduce performance.
• To reposition the box, position your cursor at the center of the box. The cursor
appearance will change to a multidirectional arrow symbol. You can then drag
the box to a new position.
• To resize the box, position your cursor on a box corner. The cursor appearance
will change to a bi-directional arrow. You can then drag that corner in or out,
resizing the box.
• To redraw the box selection, position your cursor outside the box and click once.
The box disappears, and you can then draw a new box.
To view the selected area, position your cursor inside the box slightly off-center. The
cursor appearance will change to an arrow. Click once to open the 3D viewer.
3-18
Page 98

Viewing and Editing Images
Fig. 3-13. 3D Viewer
Use your mouse or keyboard to reposition and rotate the image.
Windows
Rotate the image - Left click and drag to rotate the image.
Reposition the image - Right click and drag to reposition the image.
3-19
Page 99

PDQuest User Guide
Zoom in/out - To zoom in or out, Click the center mouse button or roll the wheel. If
you do not have a three button mouse or a mouse with a wheel, hold down the shift
key and left click and drag to zoom in or out.
Macintosh
Rotate the image - Click and drag to rotate the image.
Reposition the image - Ctrl>click and drag to reposition the image.
Zoom in/out - Shift>click and drag to zoom in or out.
The 3D viewer window allows you to view the image in three different modes; wire
frame, lighting, an d textured.
• Wire-frame shows the image in a transparent frame view.
• Lighting shows the image with different areas of light and shadow depending on
the angle of view.
• Texture gives the image texture.
Use the Scale function to scale the image. This is useful for viewing shallow spots in
the 3D viewer.
If you lose the image becaus e y ou mov e d it too far past the window bo rder, or rotated
it and disoriented the view, click Reset View to return the image to the original view.
Note: Reset view does not change the scale factor. To reset the scale factor, close the
3D viewer and click the box again to re-open the 3D Viewer with the original
scale factor.
3.12 T ransform
The Transform contro ls are used to adjust imag e brightness and con trast and optimize
the image display. These controls affect the display only, not the underlying data.
Select Transform from the Image menu or main toolbar and click in the subwindow,
or use the Ctrl+B key command in the subwindow.
3-20
Page 100

Viewing and Editing Images
Fig. 3-14. Transform command.
The preview window in the Transform dialog shows a smaller view of the selected
image. Changes are automatically reflected in the preview window, and are only
applied to the main image(s) when you click OK or (PDQuest only) Apply All.
3-21
 Loading...