

Page 1

Version 4.8.1
MARCH 2021
Asset DB
Analyst
User Manual
Page 2

© 2021 Xerox Corporation. All rights reserved. Xerox® is a trademark of Xerox Corporation in the United
States and/or other countries. BRXXXXX
Other company trademarks are also acknowledged.
Document Version: 1.0 (April 2021).
Page 3

Analyst User Manual
- 1 - Asset DB v4.8.1
Table of Contents
1 DATA PREPARATION .......................................................................................................... 3
1.1 Meter Reading Errors ................................................................................................... 3
1.2 Field Validation Errors .................................................................................................. 4
2 VOLUME GENERATION ....................................................................................................... 6
Volume Generation Assumptions ................................................................................................ 6
1.1. Creating Volume Generation Assumptions .................................................................. 6
1.2. Editing and deleting Volume Assumptions ................................................................... 9
1.3. Assigning Volume Generation Assumptions ................................................................ 9
1.4. Generating Volumes ................................................................................................... 10
3 CALCULATING COSTS: THE TCO TOOL ........................................................................ 12
3.1 Creating a New TCO Analysis ................................................................................... 13
3.2 Assign a TCO Category Status to each printing asset .............................................. 13
3.3 Fetch Pricing and Yield Data ...................................................................................... 15
3.4 Adding in Customer Cost Data ................................................................................... 18
3.5 Removing Consumables ............................................................................................ 19
3.6 Local Consumables .................................................................................................... 20
3.6.1. Using previously created local consumables ........................................................ 22
3.6.2. Managing Consumables ........................................................................................ 22
3.7 View Devices for Consumables ................................................................................. 23
3.8 Setting up contracts .................................................................................................... 23
3.8.1. Setting up a Lease or Rental contract ................................................................... 25
3.8.2. Setting up a Cost per Click Contract ..................................................................... 26
3.8.3. Setting up a Tri-Colour Cost per Click Contract .................................................... 26
3.8.4. Other Support Cost contracts ................................................................................ 27
3.8.5. Exporting and importing contract data .................................................................. 28
3.9 Creating Assumption Sets .......................................................................................... 28
3.10 Assign Contracts and Assumption Sets ..................................................................... 30
3.11 Calculate the costs ..................................................................................................... 32
3.12 Import and Export TCO Analyses .............................................................................. 32
3.13 Move TCO data to the Current State in Asset DB ..................................................... 33
3.14 Confirm TCO costs ..................................................................................................... 34
4 CALCULATING CO2: THE GREEN CALCULATOR .......................................................... 35
4.1 Starting a Green Calculation Analysis ....................................................................... 35
Page 4

Analyst User Manual
- 2 - Asset DB v4.8.1
4.2 Treat As ...................................................................................................................... 36
4.3 Assumptions ............................................................................................................... 37
4.4 Calculate ..................................................................................................................... 39
4.5 Import and Export Green Analyses ............................................................................ 40
5 USER DATA ........................................................................................................................ 41
5.1 Import User Data ........................................................................................................ 41
5.2 Mapping and Viewing ................................................................................................. 42
6 ANALYST FEATURES ........................................................................................................ 44
6.1 Statistics ..................................................................................................................... 44
6.2 Highlight/Filter Assets Tool......................................................................................... 45
6.3 Showing Distances around Icons ............................................................................... 48
7 THE PRINT ASSESSMENT SUMMARY REPORT ............................................................ 49
8 PORTFOLIO ........................................................................................................................ 50
8.1 Exporting Portfolio ...................................................................................................... 50
8.2 Import Portfolio ........................................................................................................... 51
Page 5
Analyst User Manual
- 3 - Asset DB v4.8.1
1 Data Preparation
The Data Preparation tab presents you with an alternative view on your asset data and helps you
to prepare your data ready for the Volume Generation step described in Section 2, where you
can calculate average monthly volumes for your fleet. Here you can:
▪ View your project assets in tabular format.
▪ Verify and edit meter reading data.
▪ Set and assign assumptions for volume generation.
▪ Calculate and view monthly volumes for each asset.
All print/scan assets that exist in your project (including those that are out of scope) will appear in
the data preparation tab. There is a search bar at the bottom of the window which works in the
same way as the one in the current state asset table and which you can use to quickly find an
asset using several different criteria.
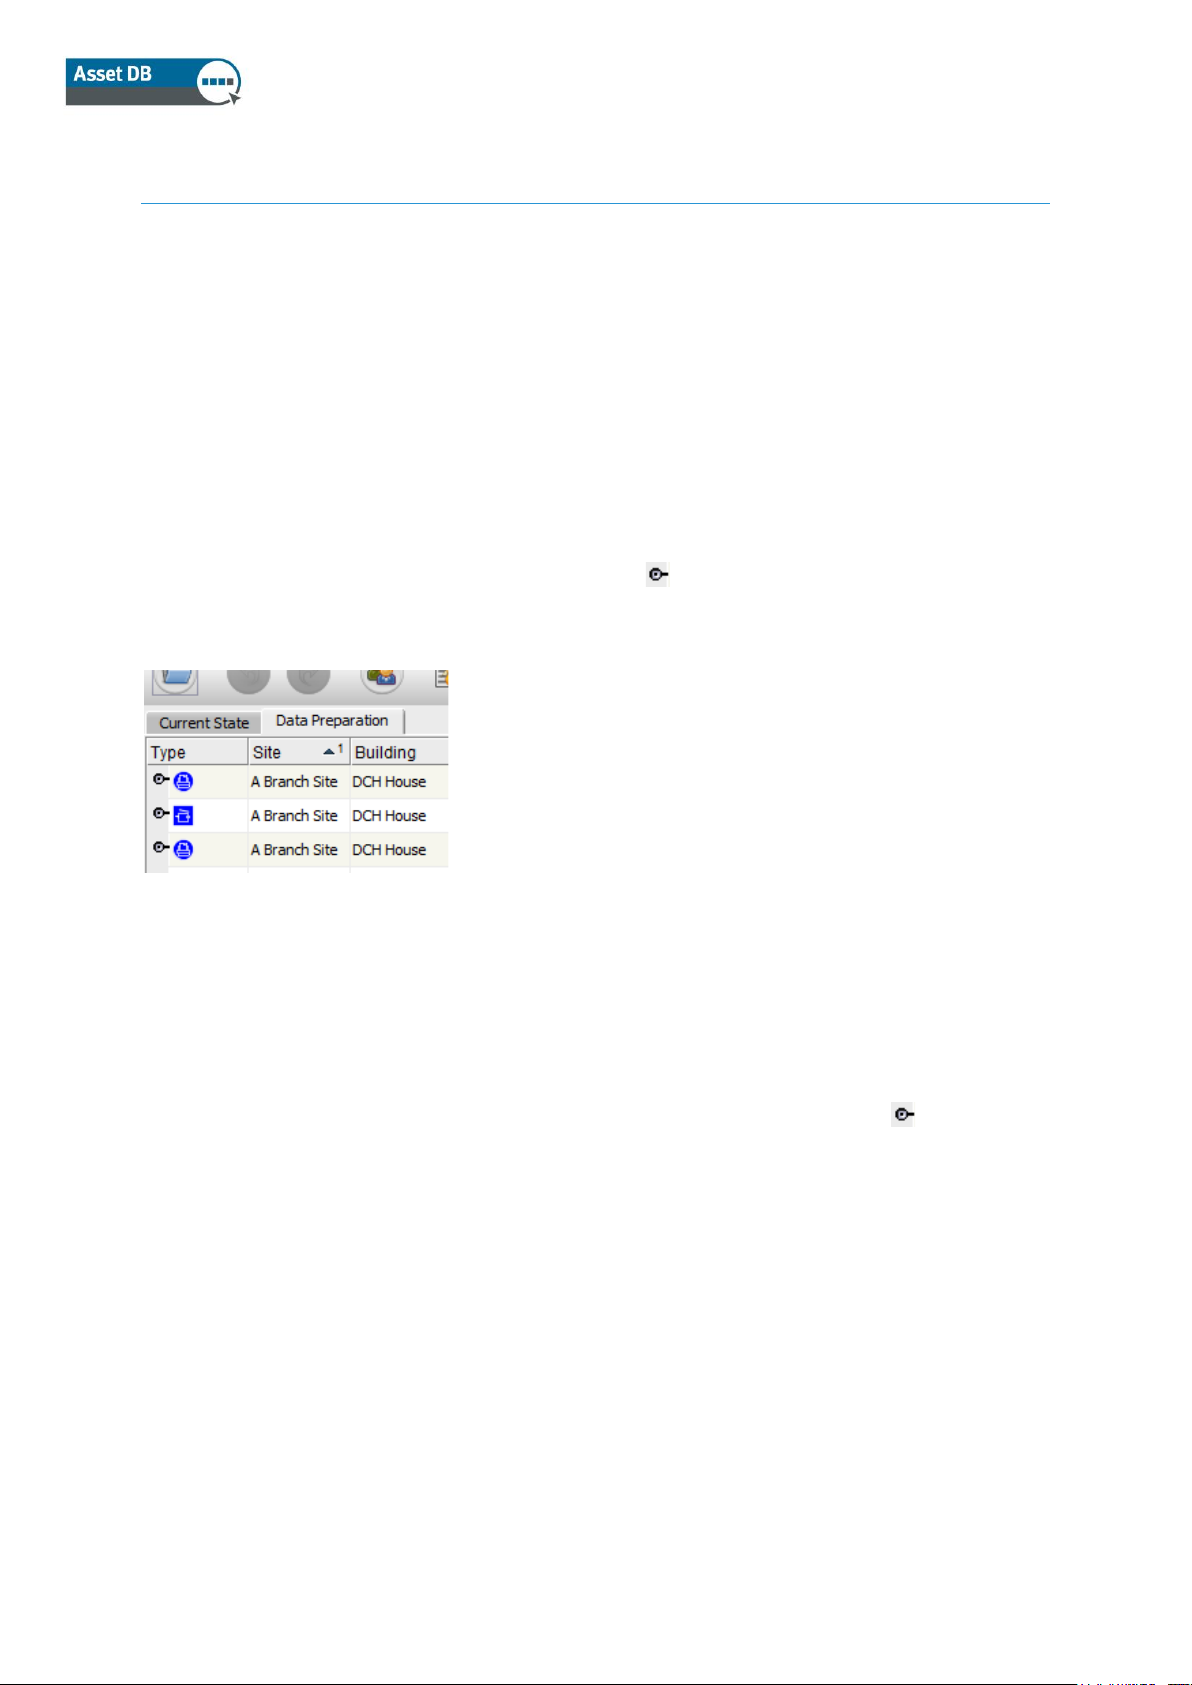
Double click on an asset in the table and you will be taken to the current state where the asset
will be highlighted on the floor plan. If you click on the button on the left-hand side of the
device row, the row will expand to show you the meter readings (see Figure 1).
Figure 1. Show meter readings
1.1 Meter Reading Errors
Once you have gathered all your audit data and you come to the data cleanse part of your
project, you can use the Data Preparation tab to review your meter readings. The indications in
the Meter Status column show whether volumes can be calculated correctly or not for each
device. A warning symbol indicates meter-reading errors (see Figure 2). Hovering over the
warning symbol will show the explanation of the error. Expand the row using the button on the
left of the row and any problematic meter readings will be shown in red. A warning symbol will
appear when:
▪ Sub-meters don’t add up to the total meter for the same date (e.g. the sum of Total Mono
and Total Colour is larger than Life Total).
▪ A reading for a later date is smaller than the reading for an earlier date.
▪ Readings are present for a field, which is not visible in the Meter Readings tab. This can
occur when meter readings are imported for devices which do not have all their
capabilities correctly ticked (e.g. Importing A3 Colour readings for a device which does
not have ‘A3 Capable’ and ‘Colour Capable’ ticked).
▪ There are no meter readings at all for the device.
To rectify these errors, you will either need to edit the meter readings (this can be done on
this tab) or edit the capabilities of the asset in the Details Panel on the Current State tab.
Page 6
Analyst User Manual
- 4 - Asset DB v4.8.1
Figure 2. Meter reading status
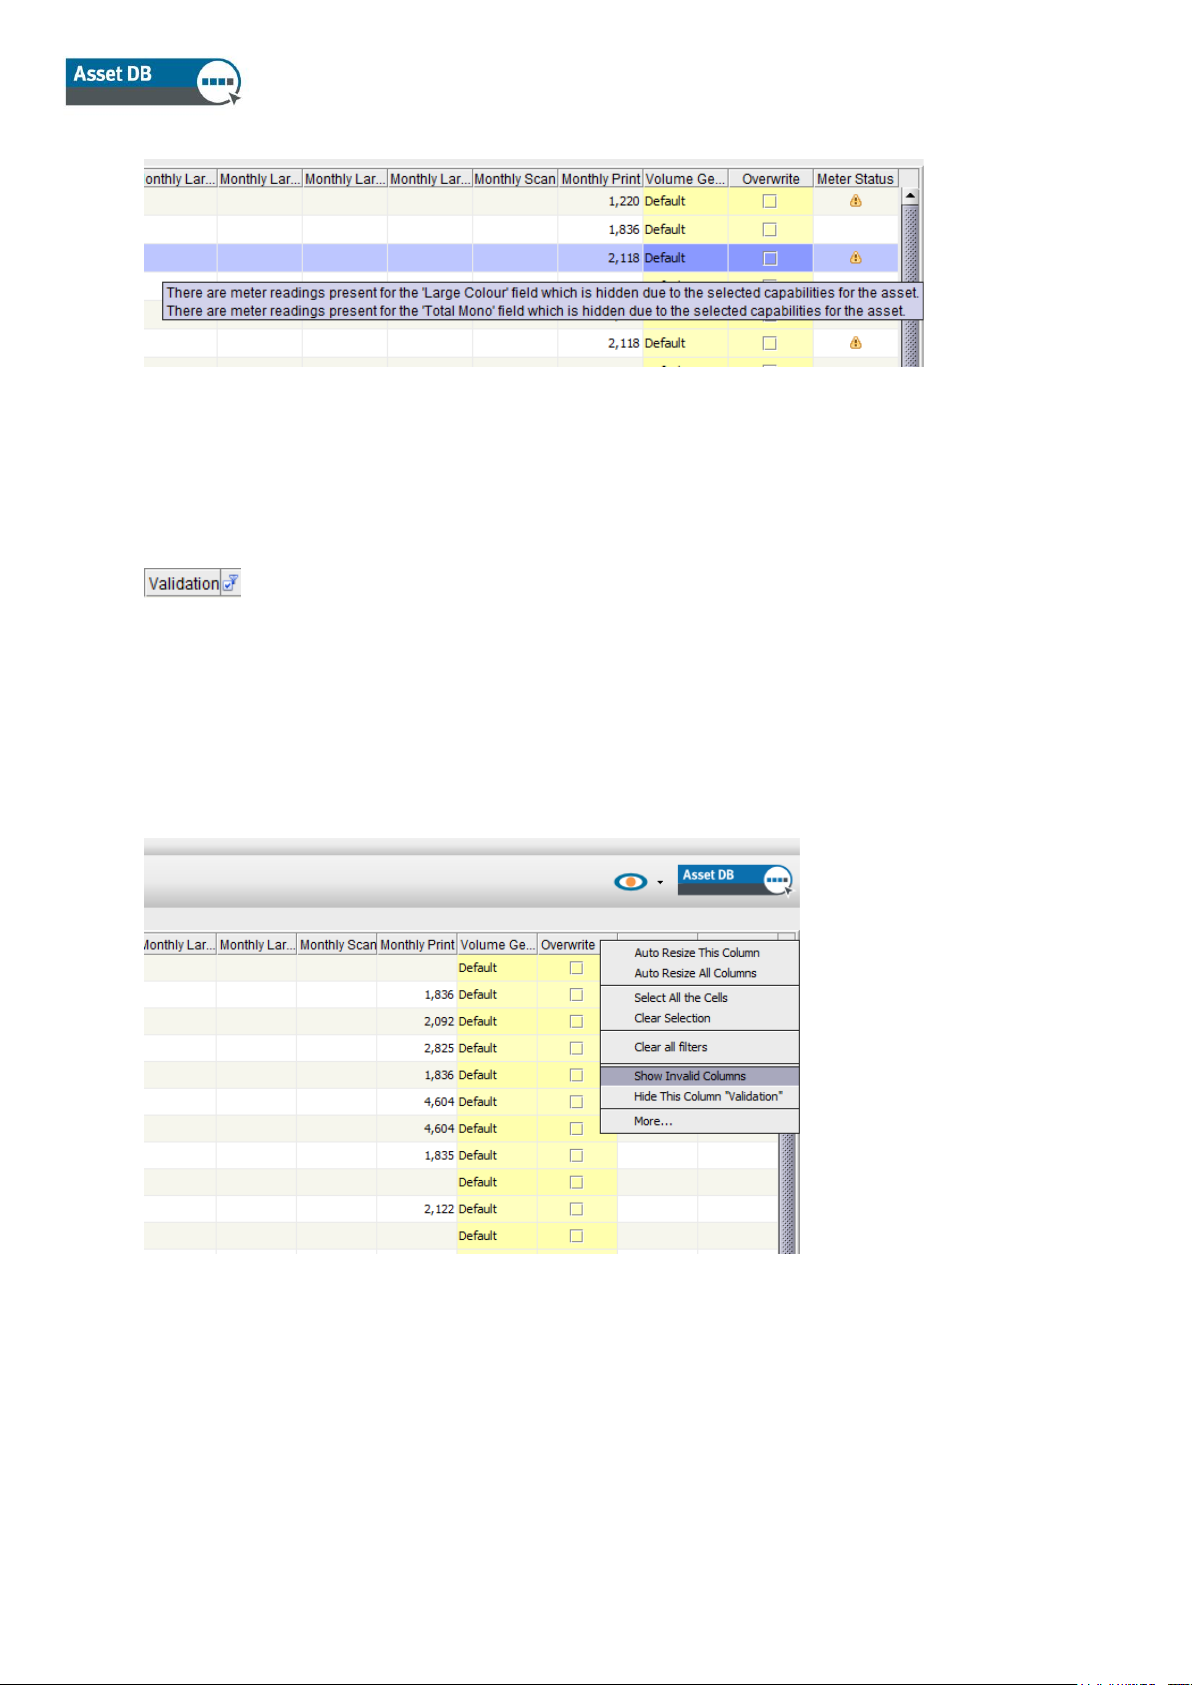
1.2 Field Validation Errors
The indications in the Validation column show whether there are any validation errors present for
an asset. Hovering over the warning symbol will give an explanation as to which fields have
validation errors and the reason why they are invalid. You are then able to use the filter option
next to the header in the Validation column, in order to only show rows that contain a
particular error.
Where there are many validation errors occurring for the same reason (e.g. Manufacture Date
missing) you can fix the problem directly in the Data Preparation tab without having to go back
into the current state. In order to do so, right-click on the Validation column header and select
Show Invalid Columns from the pop-up (see Figure 3).
Figure 3. Validation column options
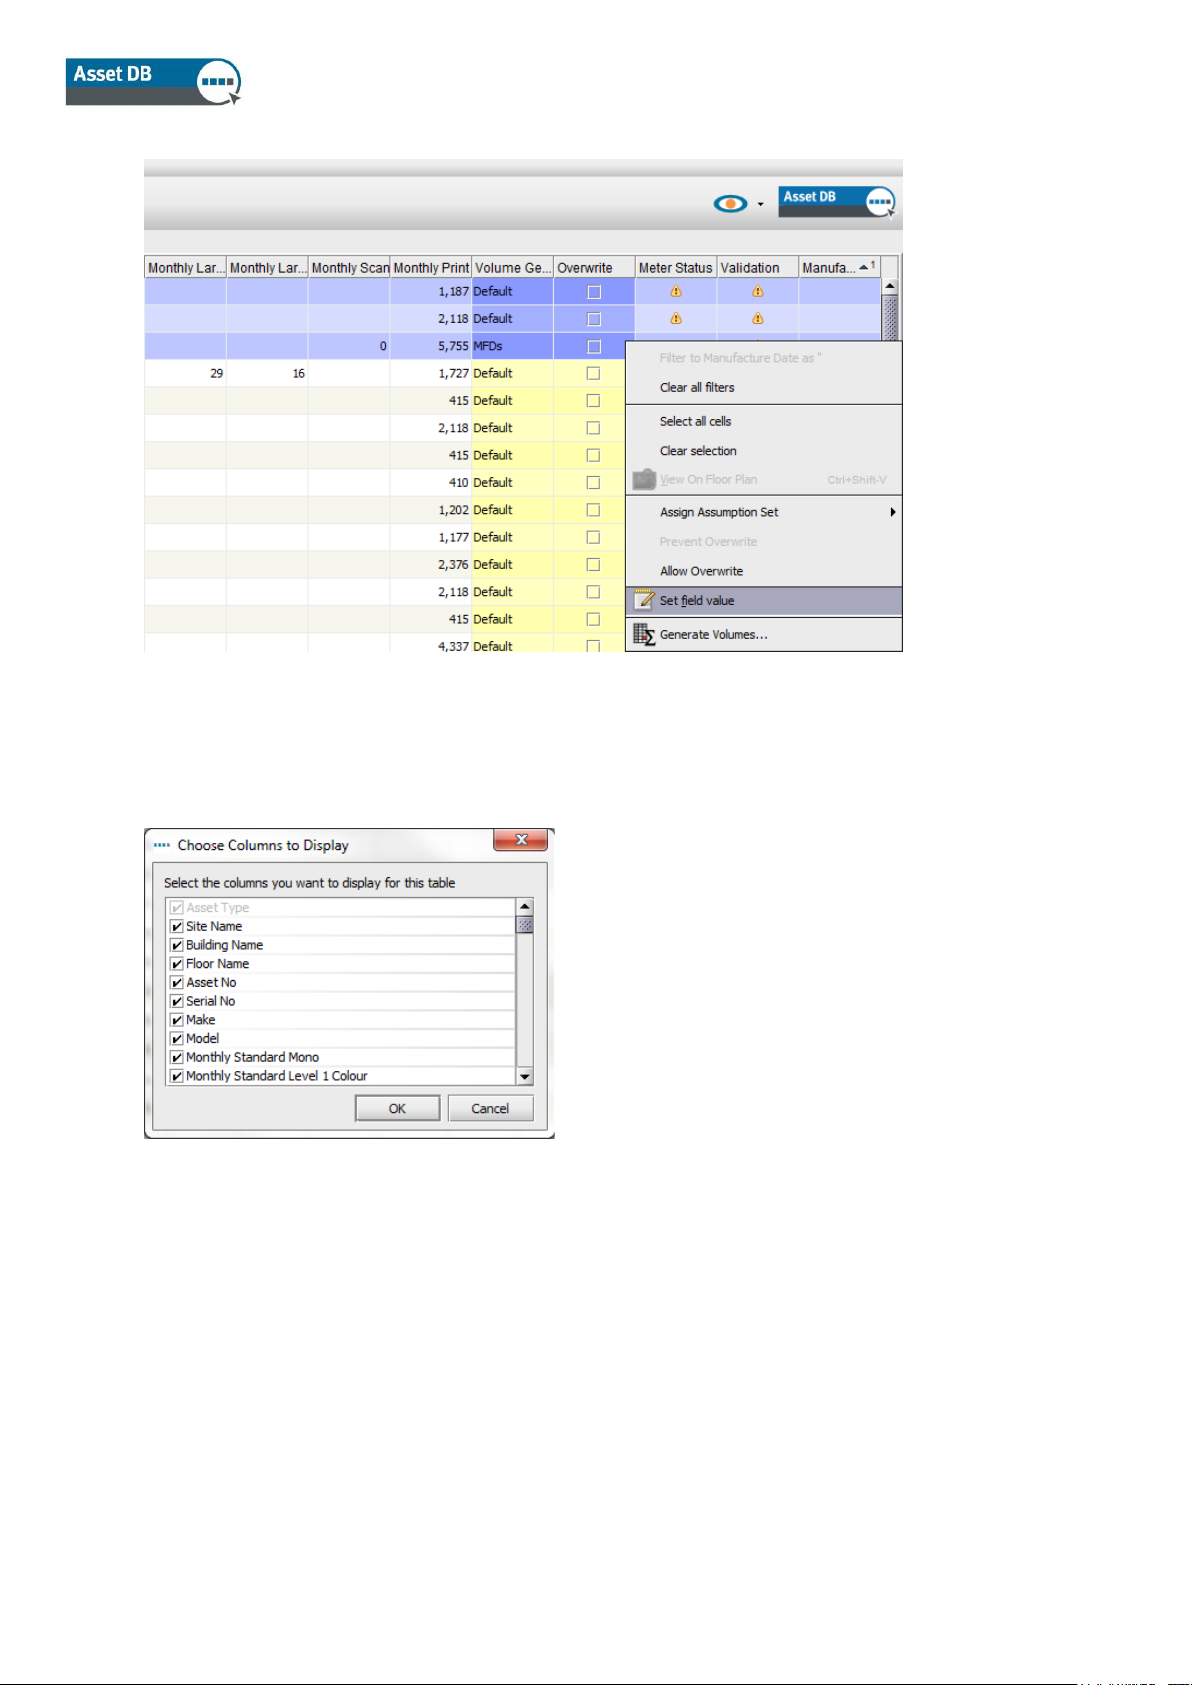
New columns for the fields that contain validation errors will now be displayed to the right of the
‘Validation’ column. To change the values for a single asset simply right-click in the tab and
select ‘Set field value’. To change assets in bulk, mark all assets that need amending, right-click
in one of the cells that you want to change the value of and again select ‘Set field value’ (see
Figure 4).
Page 7
Analyst User Manual
- 5 - Asset DB v4.8.1
Figure 4. Editing invalid fields in bulk
To change the visible columns in this table, right-click in any column header bar and choose
‘More…’ from the options. A dialog box will appear, allowing you to choose which columns you
want to display (see Figure 5).
Figure 5. Selecting which columns to display
Page 8
Analyst User Manual
- 6 - Asset DB v4.8.1
2 Volume Generation
Volume Generation is a tool that calculates average monthly volumes based on various criteria.
Asset DB will generate average monthly volumes from individual meter readings. To calculate
this, each device will either need two meter readings, or an installation date and one meter
reading, or a manufacture date and one meter reading.
Before generating volumes, you should ensure that you have reviewed your data in the ‘Data
Preparation’ tab. You may also want to define ‘Assumption Sets’. These allow you to set
parameters to ‘fill in’ any gaps in the data - for example, where functionality-specific meter
readings are not available.
Volume Generation Assumptions
Volume Generation Assumptions allow you to specify criteria for generating volumes in your
project. The assumptions allow Asset DB to produce a detailed calculation even when the data
you have is more general.
1.1. Creating Volume Generation Assumptions
To set up your assumptions, click the ‘Add, remove or edit Assumption Sets used for
volume generation’ button above the ‘Data Preparation’ tab (see Figure 6).
Page 9
Analyst User Manual
- 7 - Asset DB v4.8.1
Figure 6. Create or edit volume generation assumptions
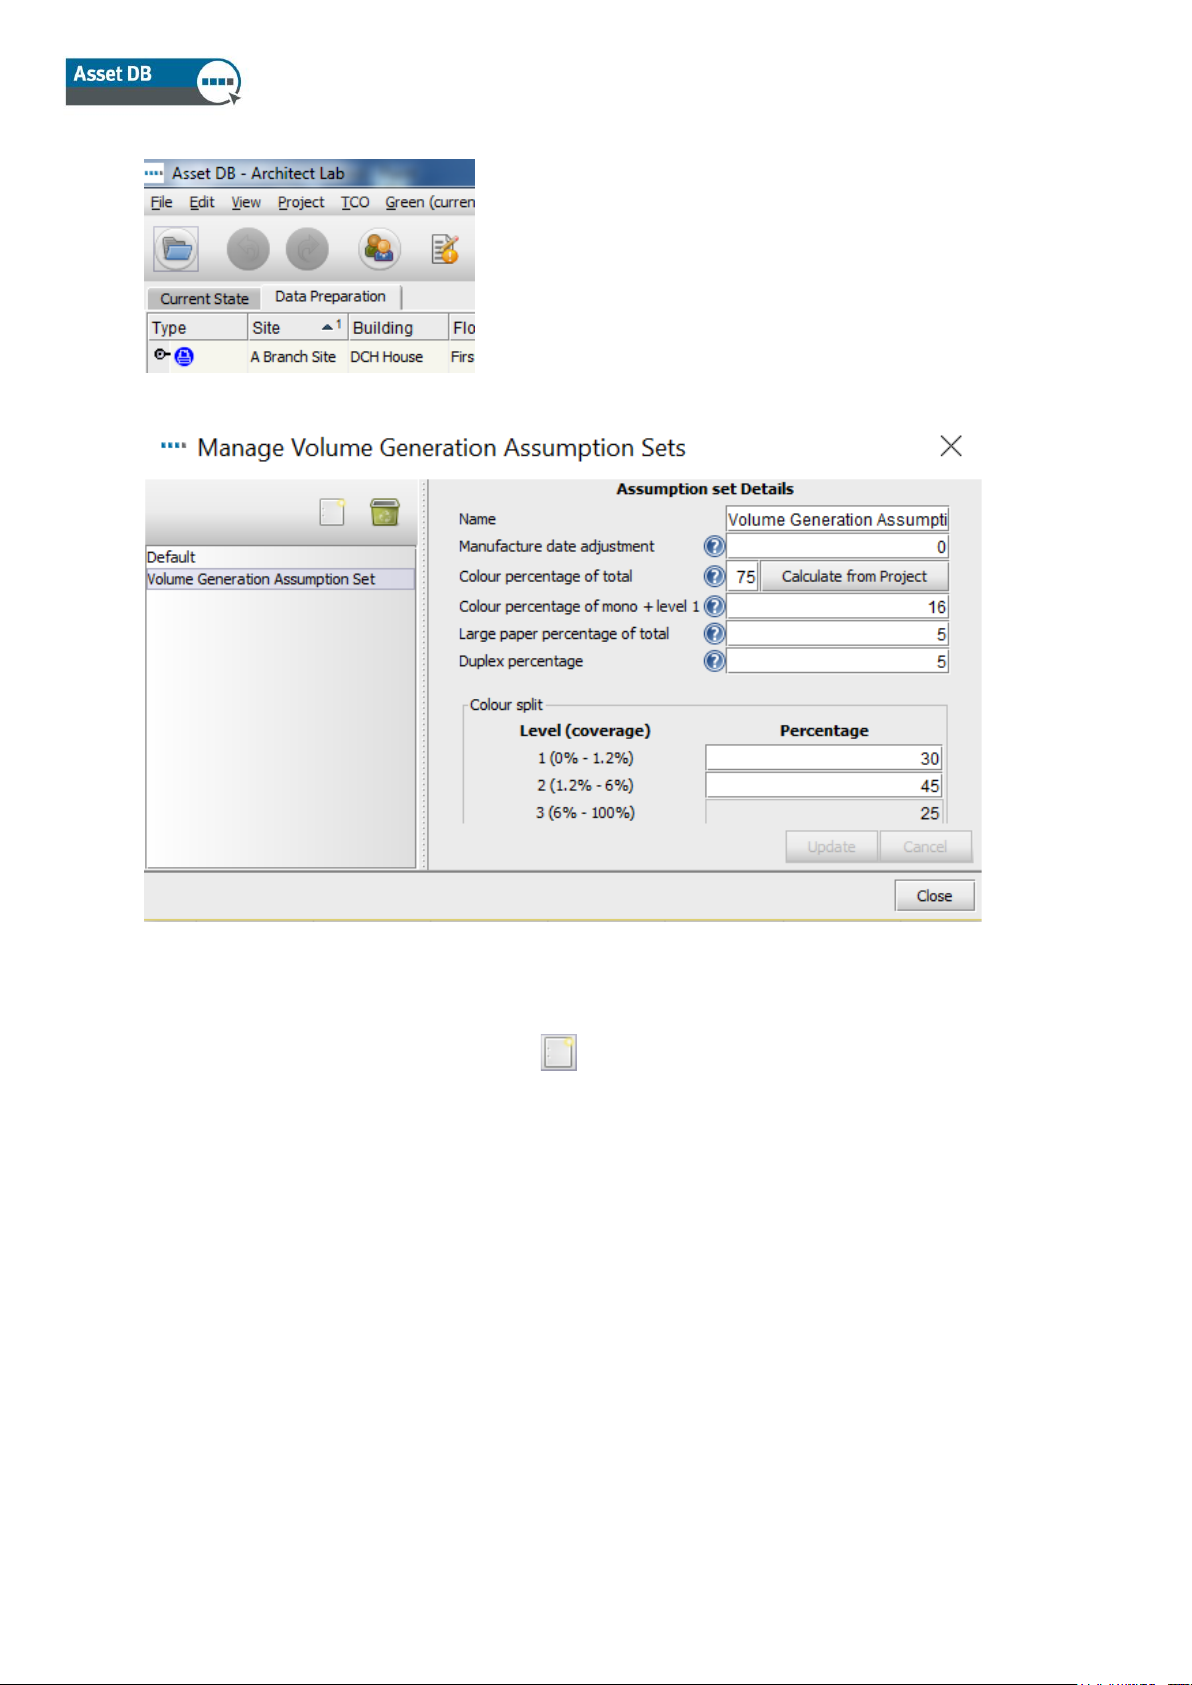
Figure 7. Manage Volume Generation Assumption Sets window
There is a default assumption set within Asset DB, which will be applied automatically to all
devices unless you create your own assumptions and apply those.
To create a new assumption set, click the ‘Create new’ button at the top of the pop-up.
Once you have edited the default values as necessary, click ‘Update’ to save your changes.
The fields you can edit are:
▪ Name – so you can tell the assumptions apart when you assign them to assets.
▪ Manufacture date adjustment – the number of days to add to the manufacture date to
simulate a realistic installation date. This will be used only in the event a specific
installation date is not available.
▪ Colour percentage of total – the proportion of the total or ‘Life’ meter reading that will
be treated as colour. This will be used only if specific colour meter readings are not
available. The default value is 75%, however if you click on ‘Calculate from Project’ you
will get the value for the actual calculated colour percentage for all devices that have
complete data, i.e. full mono and colour volumes or meter readings
Page 10

Analyst User Manual
- 8 - Asset DB v4.8.1
▪ Colour percentage of mono + level 1 – the proportion of mono + level 1 meter reading
that will be treated as colour. This will be used only if separate mono and level 1 colour
meter readings are not available.
▪ Large paper percentage of total – the proportion of the total or ‘Life’ meter reading that
will be treated as large format. This will be used only if a specific large meter reading is
not available.
▪ Duplex percentage – the proportion of the total or ‘Life’ meter reading that will be treated
as duplex. This will be used only if a specific duplex reading is not available.
Colour split
This applies to tri-colour meter devices and allows you to manage the split of colour volume
between each of the three levels when all you have is an overall colour value. The sum of the
three percentages in this section should equal 100 as they refer to the percentage of the total
colour volume that should be attributed to each level, not the percentage of the total volume to be
attributed. If there is a single colour meter reading for a tri-colour meter device, the percentages
here will be applied to the volume calculated from that. If there is only a Life Total for a tri-colour
meter device, the percentages will be applied to the volume calculated from the ‘Colour
percentage of total’ split applied further up in the assumption.
In an ideal world, you would always gather specific readings for each of the available meter
reading types on a device. For an A3 colour device, that would mean having Standard Mono,
Large Mono, Standard Colour, Large Colour and Life Total readings. Sometimes, however, it is
only possible to obtain a total or ‘Life’ reading, and calculating a volume from there without
assumptions would mean that you wouldn’t have a colour/mono or standard/large split, which
could greatly affect your TCO.
All the values entered into the assumption set will only be applied where there are gaps in your
project data; they will not be used in circumstances where the real installation date or where
functionality-specific readings are present.
Page 11
Analyst User Manual
- 9 - Asset DB v4.8.1
1.2. Editing and deleting Volume Assumptions
To edit an assumption you have created previously, click to select the assumption in the list on
the left hand side of the pop-up and type your values into the fields on the right. Click Update to
save your changes.
To delete an assumption, click to select it from the list, then click the ‘Delete’ button above
the list.
You can create as many assumptions as you require for a particular project.
1.3. Assigning Volume Generation Assumptions
Once volume generation assumptions have been defined, they should be assigned to devices in
the Data Preparation tab. Volumes for devices to which a user-created assumption has not been
assigned will be calculated using the ‘Default’ assumptions.
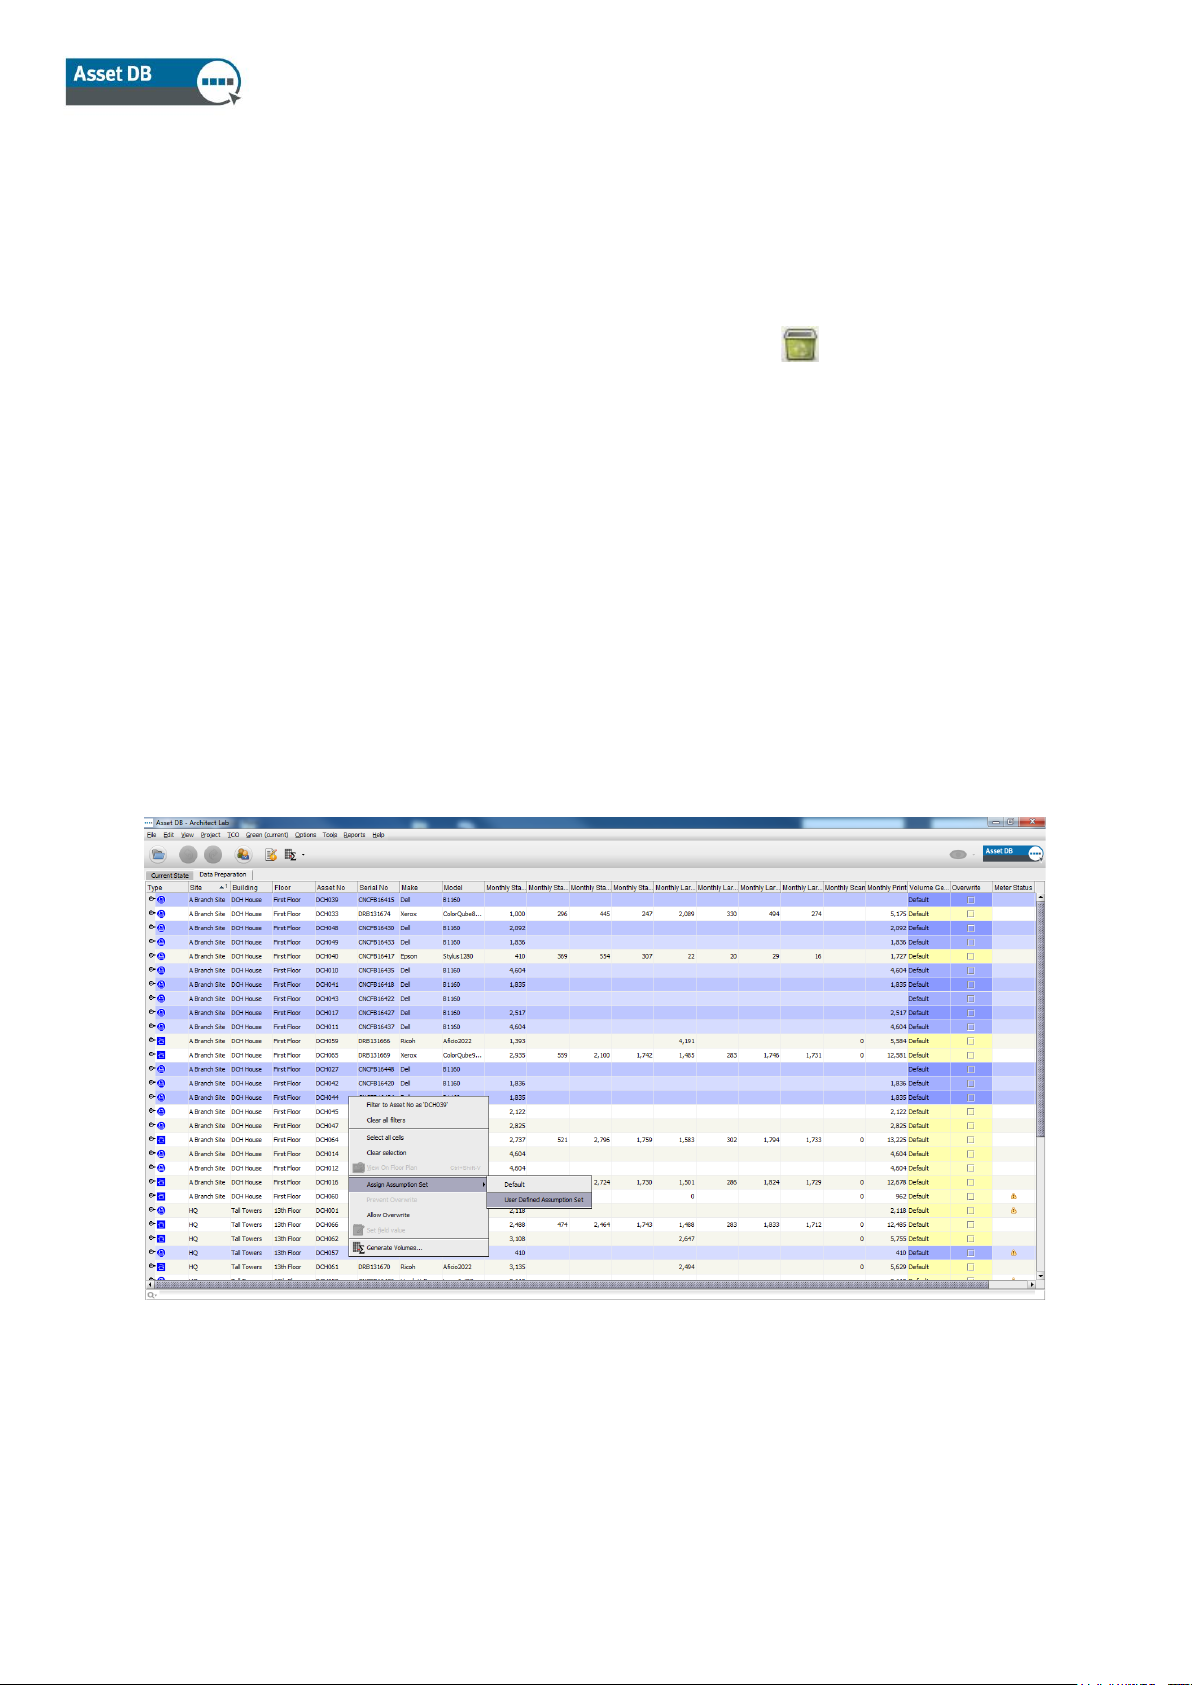
To assign user-created assumptions to devices, you can select the relevant devices and rightclick on any one of them. Using menu option ‘Assign Assumption Set’, you can select the
assumption set to be used for the selected devices. By default, all other devices will use the
‘Default’ Assumption Set.
Figure 8. Assigning Assumption Sets to multiple devices
Page 12
Analyst User Manual
- 10 - Asset DB v4.8.1
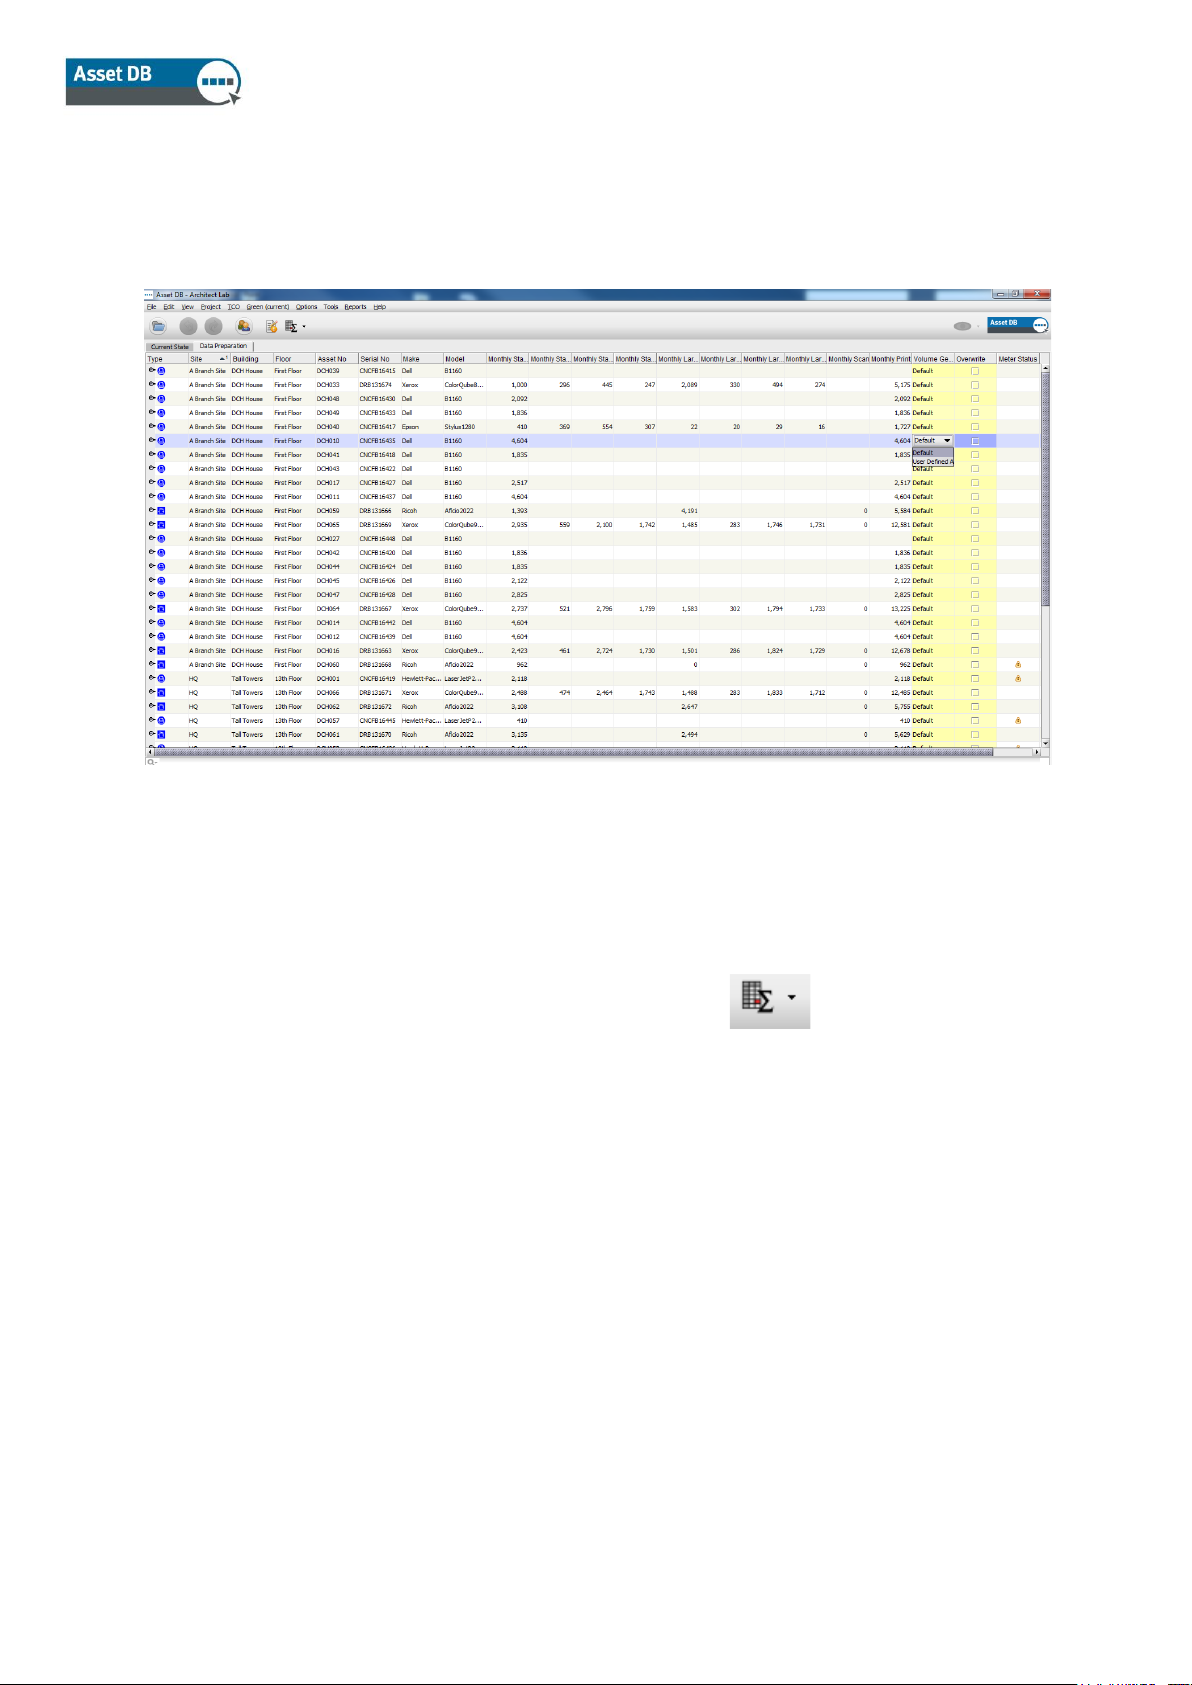
Alternatively, you can assign Assumption Sets to individual devices by clicking in the
‘Assumption Set’ column for the device in the ‘Data Preparation’ table and selecting the
assumption set to be used.
Figure 9. Assigning Assumption Sets to devices individually
1.4. Generating Volumes
Once Assumption Sets have been created and assigned to devices, volumes can be generated
for all devices in a project or for a sub-set of the devices. To generate volumes for all assets,
click on the ‘Generate Volumes’ button in the Asset DB toolbar and click ‘All Asset’, or
use keyboard shortcut ‘Ctrl-G’.
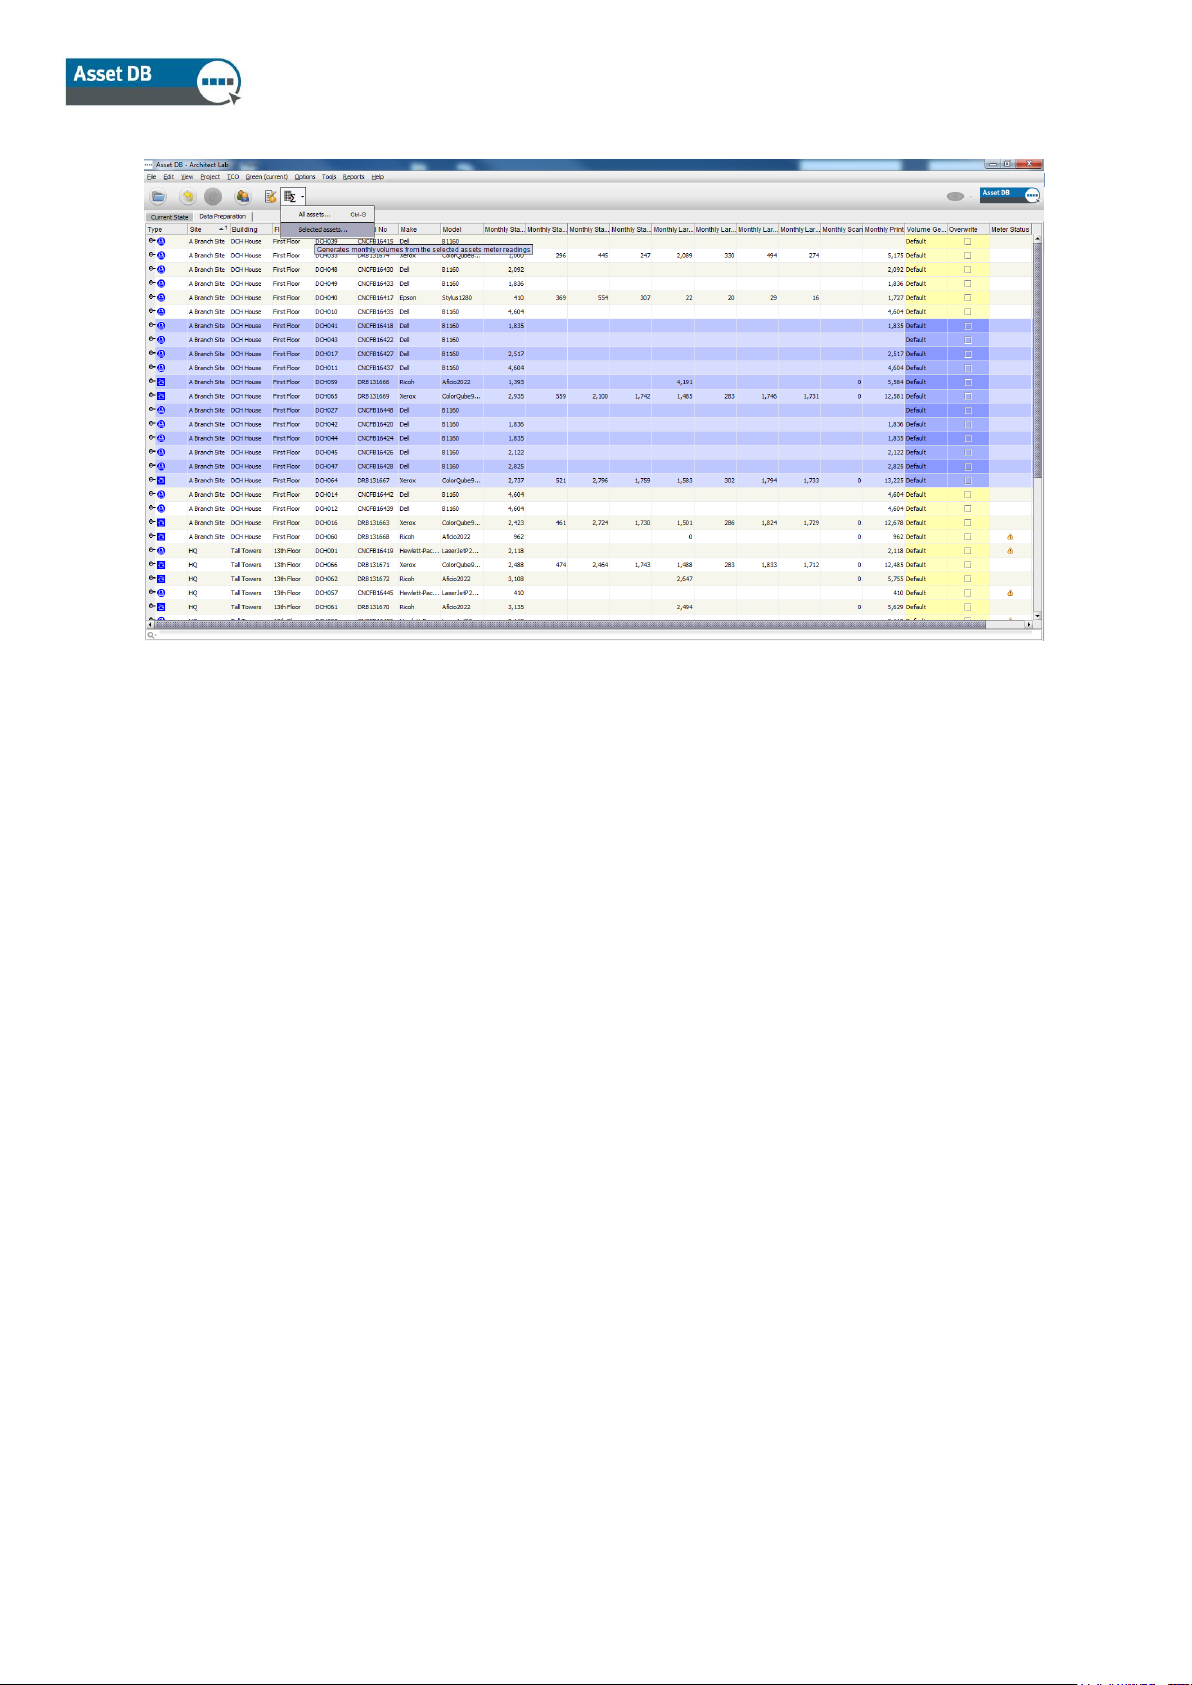
To generate volumes for a sub-set of devices in your project, you should select the devices from
the Data Preparation table for which you wish to generate monthly volumes and then click the
‘Generate Volumes’ button in the Asset DB toolbar and choose ‘Selected assets…’.
To overwrite any previously generated volumes, make sure to tick the ‘Overwrite’ box. This is un-
ticked by default but any changes made to the tick status are remembered for the project in the
local version.
Page 13
Analyst User Manual
- 11 - Asset DB v4.8.1
Figure 10. Generating volumes for selected assets
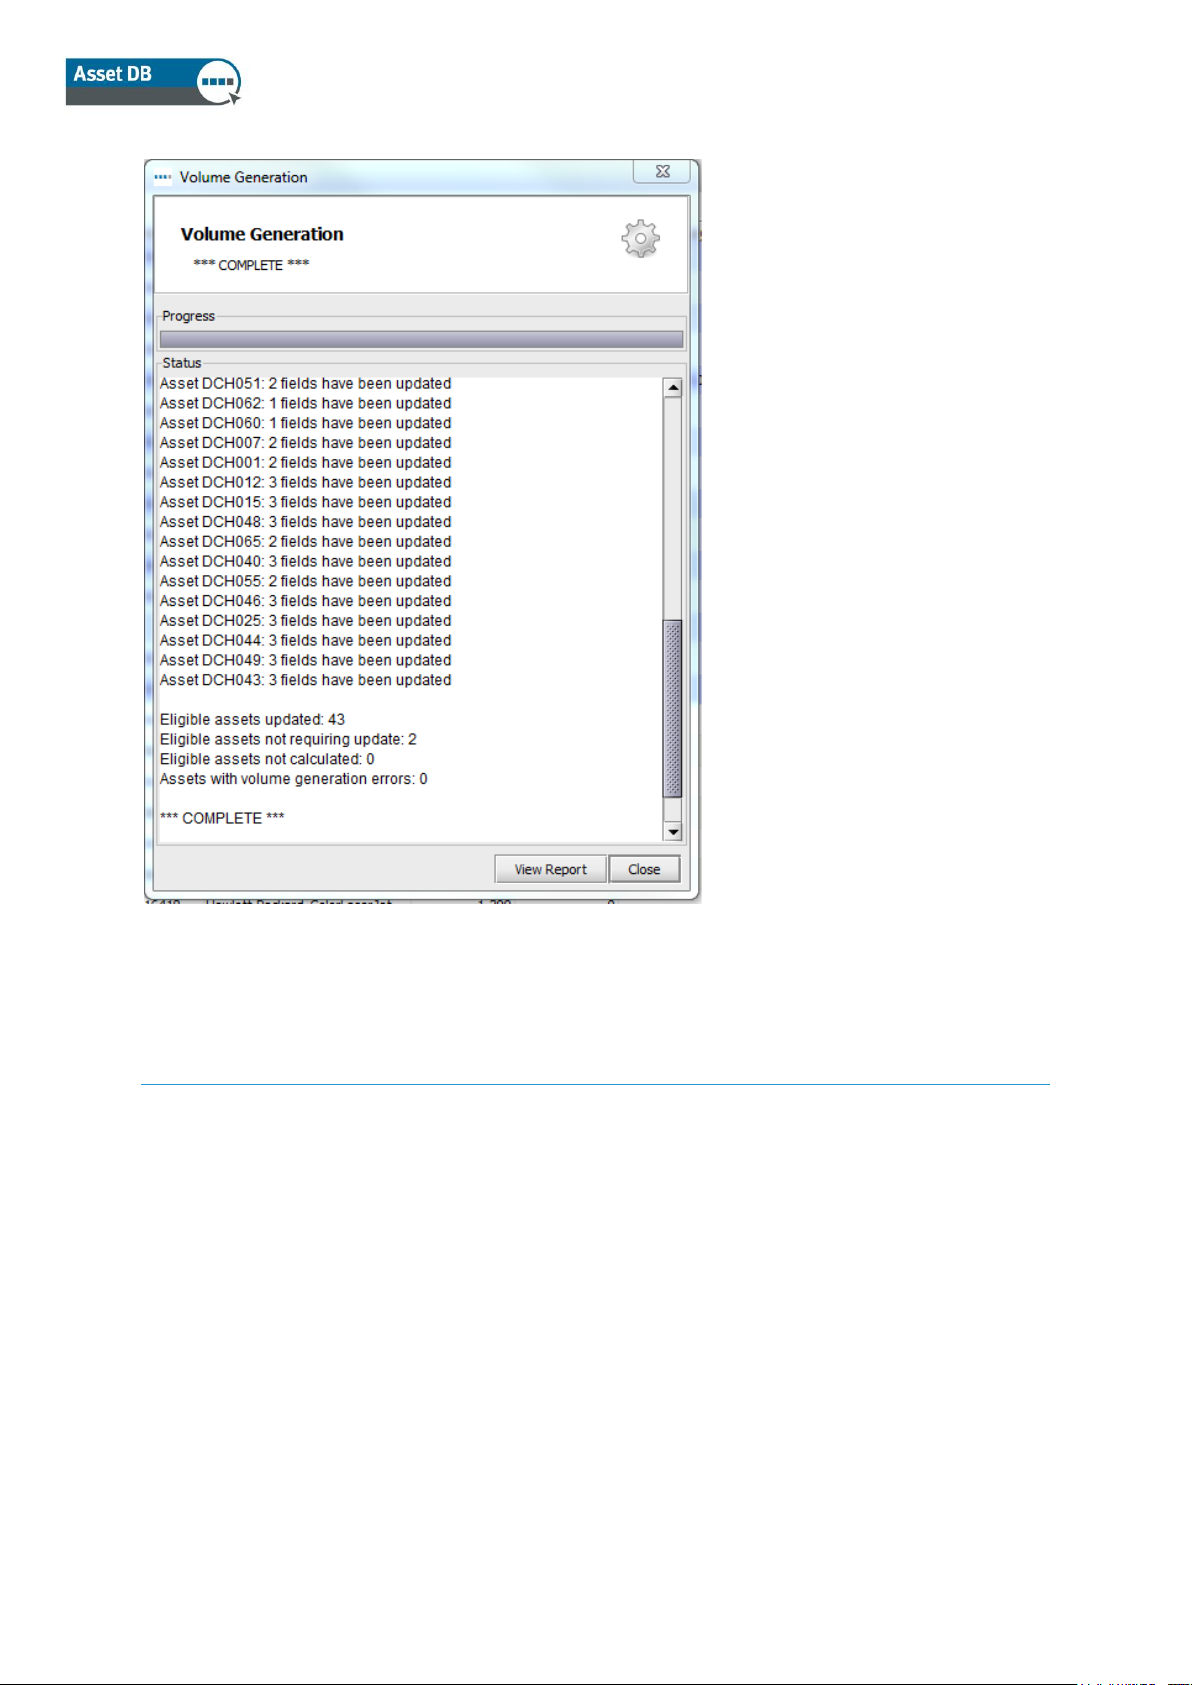
You will then be presented with a breakdown of the results of the volume generation calculation,
showing the following:
▪ Eligible assets updated – the number of devices for which new monthly volume values
were calculated and applied.
▪ Eligible assets not requiring update – the number of devices for which the newly
calculated monthly values are the same as the values already present.
▪ Eligible assets not calculated – the number of devices for which no new monthly
volume values could be calculated because not enough meter reading data was
available. This may be because no meter reading data at all is available for the asset or
because only one meter reading is available and there is no installation or manufacture
date available.
▪ Assets with volume generation errors – the meter reading data present is incorrect.
Very often, this is because two meter readings are available but the meter reading value
for the later date is lower than a meter reading previously recorded.
Page 14
Analyst User Manual
- 12 - Asset DB v4.8.1
Figure 11. Volume generation summary
3 Calculating costs: The TCO Tool
For the TCO analysis, cost and yield data relating to printers and MFDs is held on a server
hosted by Xerox, which allows easier and faster updates of the database. In order to access this
data, an Internet connection will be required. If you choose to manually enter all pricing,
consumable and other data, then you will be able to perform a TCO analysis without needing an
Internet connection.
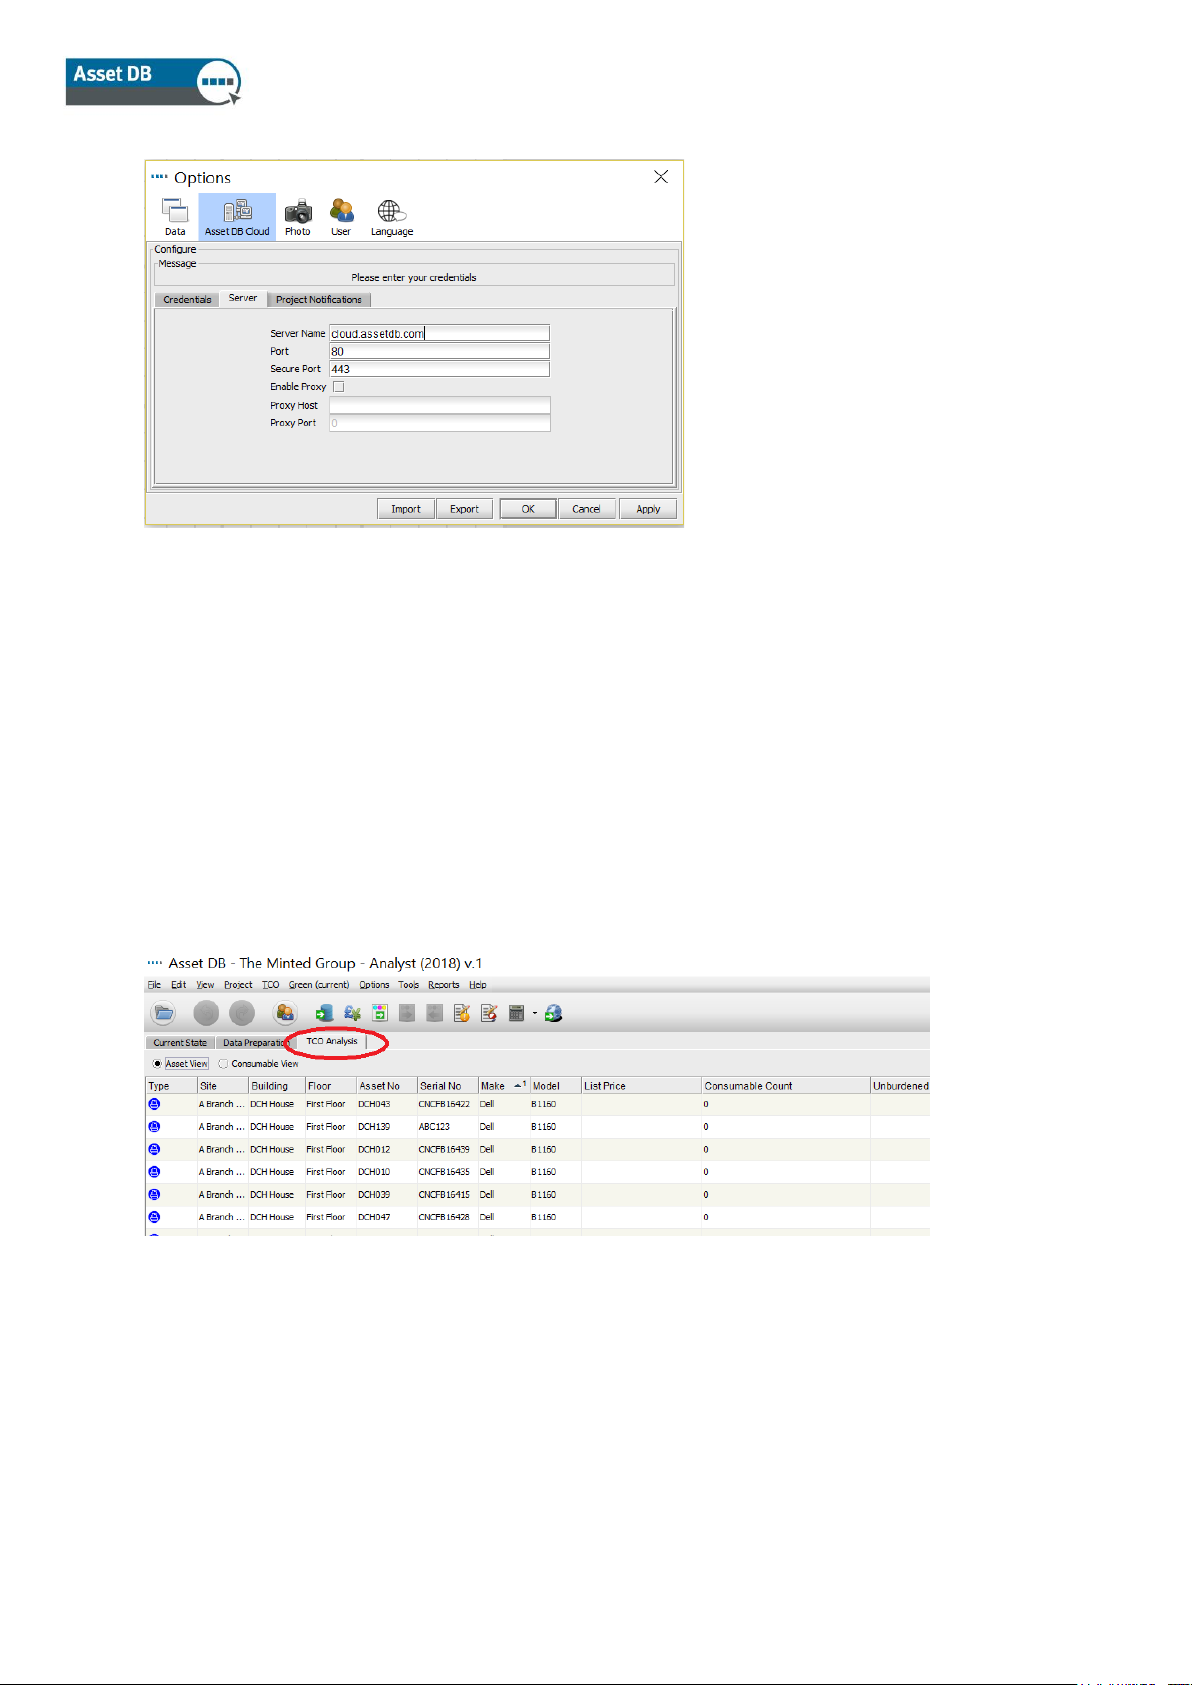
To access Xerox’s database, firstly check whether your organisation uses a Proxy Server or
direct connection to access the Internet. If using a proxy server, you will need to know the proxy
settings so that you can enter them on the ‘Server’ tab under Options > General Options, Asset
DB Cloud.
Page 15
Analyst User Manual
- 13 - Asset DB v4.8.1
Figure 12. Configuration for use of proxy server
3.1 Creating a New TCO Analysis
Setting up a TCO Analysis in Asset DB is similar to the core project. You select File > New >
TCO Analysis. This will then bring up a pop-up requesting you name your new TCO Analysis.
Click ‘OK’ and the new TCO Analysis will be created. An existing TCO Analysis can be opened
by navigating to File > Open, and selecting the relevant one from the list of TCO Analyses linked
to the project you have opened. Once a TCO analysis is created or opened, a new workspace
area is created (see Figure 13), showing a list of all the printers and MFDs in the scope of the
Asset DB project, including the ones that have not been plotted but for which you have data in
the table view. There is a 10 Step process to completing a TCO Analysis.
Figure 13. TCO Tab View
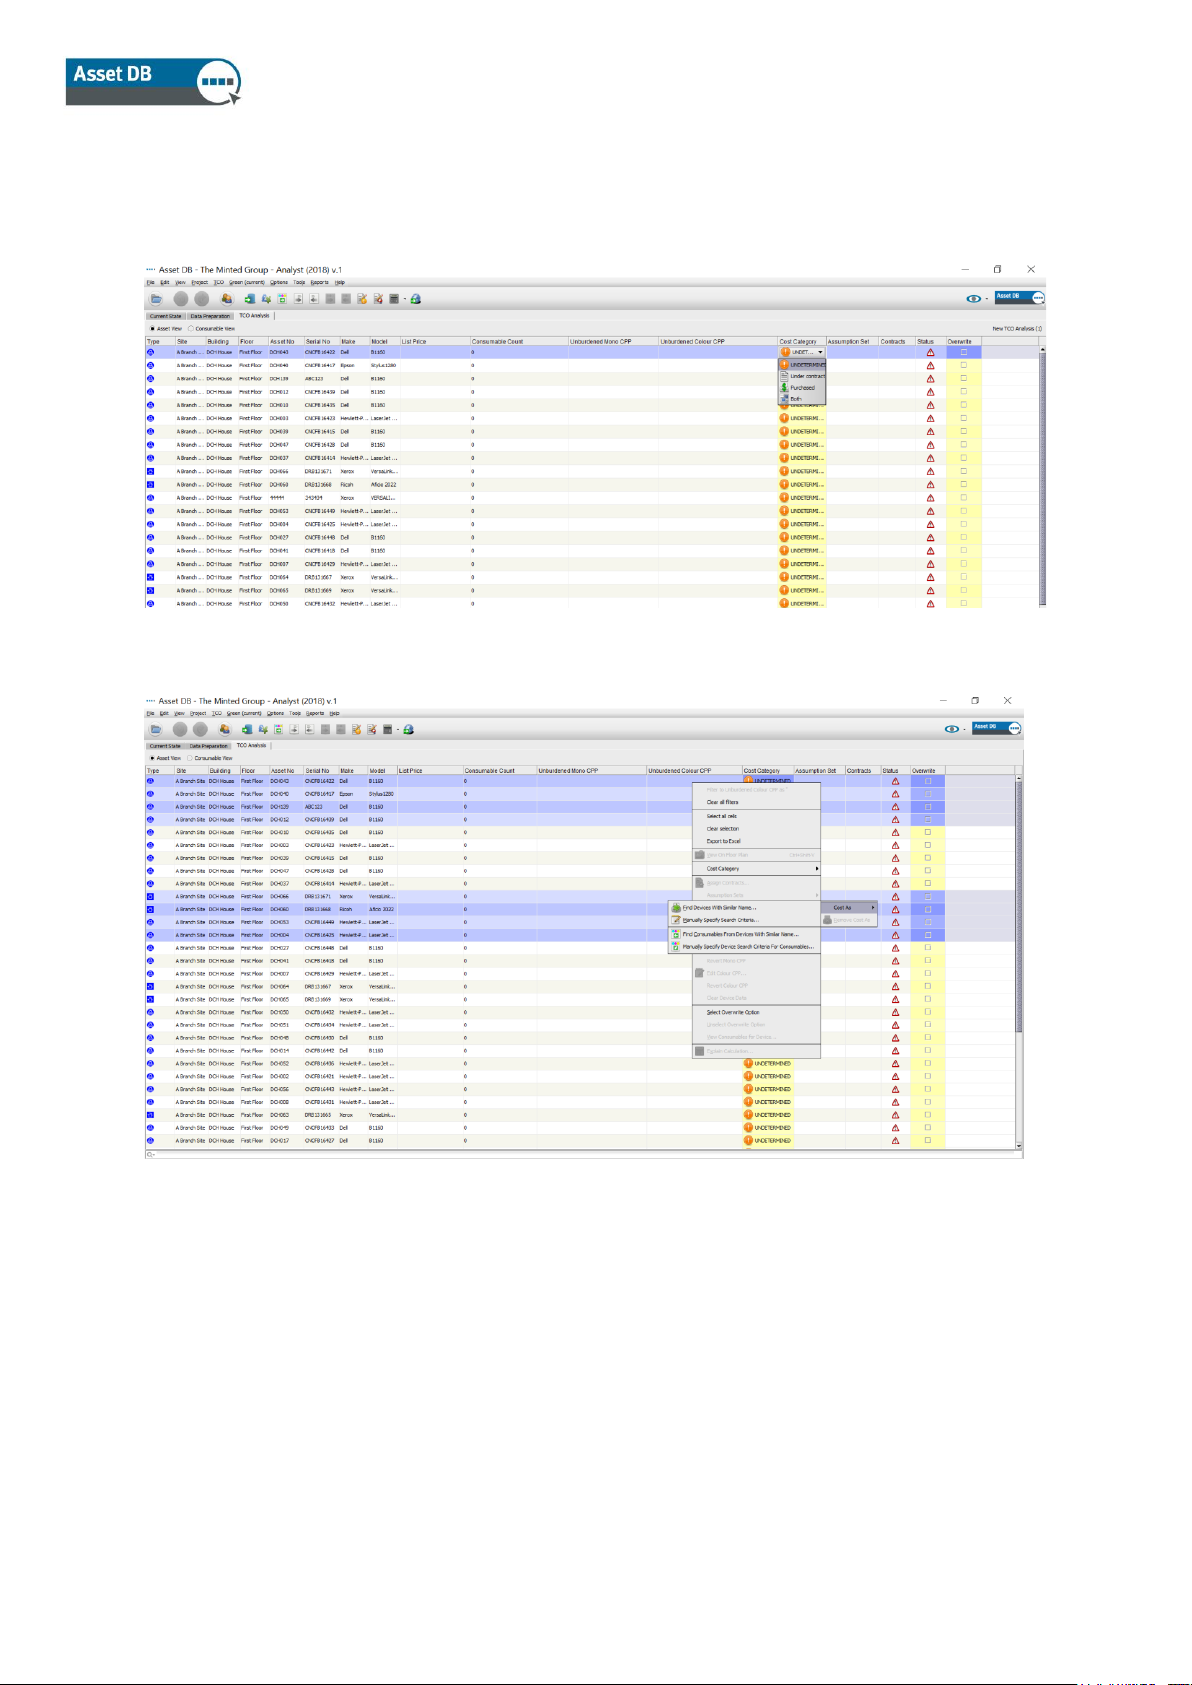
3.2 Assign a TCO Category Status to each printing asset
The first step is to decide how you want to perform the cost calculation on each print enabled
device in the project. To assign a cost category, you can either left-click in the relevant cell in the
Cost Category column to bring up options or you can click and drag to select multiple devices
Page 16
Analyst User Manual
- 14 - Asset DB v4.8.1
from the list, right-click one of the selected assets and use the ‘Cost Category’ option to select a
category.
Figure 14. Assign a cost category to devices individually
Figure 15. Assign a cost category to multiple devices
Page 17
Analyst User Manual
- 15 - Asset DB v4.8.1
The available Cost Categories are:
▪ Under Contract : Device is subject to an agreement with a lease provider or
vendor.
▪ Purchased : Device has no other on-going cost associated with it.
▪ Both : Applies where a printer has been purchased but there is also a
contract associated with it.
Top tip: Sort data alphabetically by clicking different column headers. You can then select
multiple devices at one time and apply the same ‘Cost Category’ status allocation to the group.
You can also filter the TCO categories by clicking the filter symbol to the right of the column
header and clicking the tick boxes.
Once a Category Status has been selected this will be shown in the ‘Cost Category’ column.
Hovering over the red warning triangle in the ‘Status’ column will display what information is still
required before the TCO calculation can be performed.
3.3 Fetch Pricing and Yield Data
The next step is to fetch pricing and consumable information on all devices so that all the
relevant data is available for an accurate TCO calculation. This step can be performed by clicking
the ‘Fetch Data’ button . Once this has been done, you will see how many assets data was
found for.
Note: if you use a proxy server to access the Internet you will need to enter your proxy server
details via the main menu at Options > General Options… Asset DB Cloud.
Once the data has been collected, it will be displayed on the screen as per Figure 16 below.
Page 18

Analyst User Manual
- 16 - Asset DB v4.8.1
Figure 16. Asset View after TCO data has been collected
When moving to the consumable view via the radio button, you can see the full details of the
consumables.
Figure 17. Consumables View after TCO data has been collected
Keep in mind that if you did not use the drop down menus to select your device in the current
state, the TCO data might not be pulled in automatically. The name of the device must match
exactly with the name of the device in the database in order to pull in the data. If it does not,
follow the directions below to perform a ‘Cost As.’
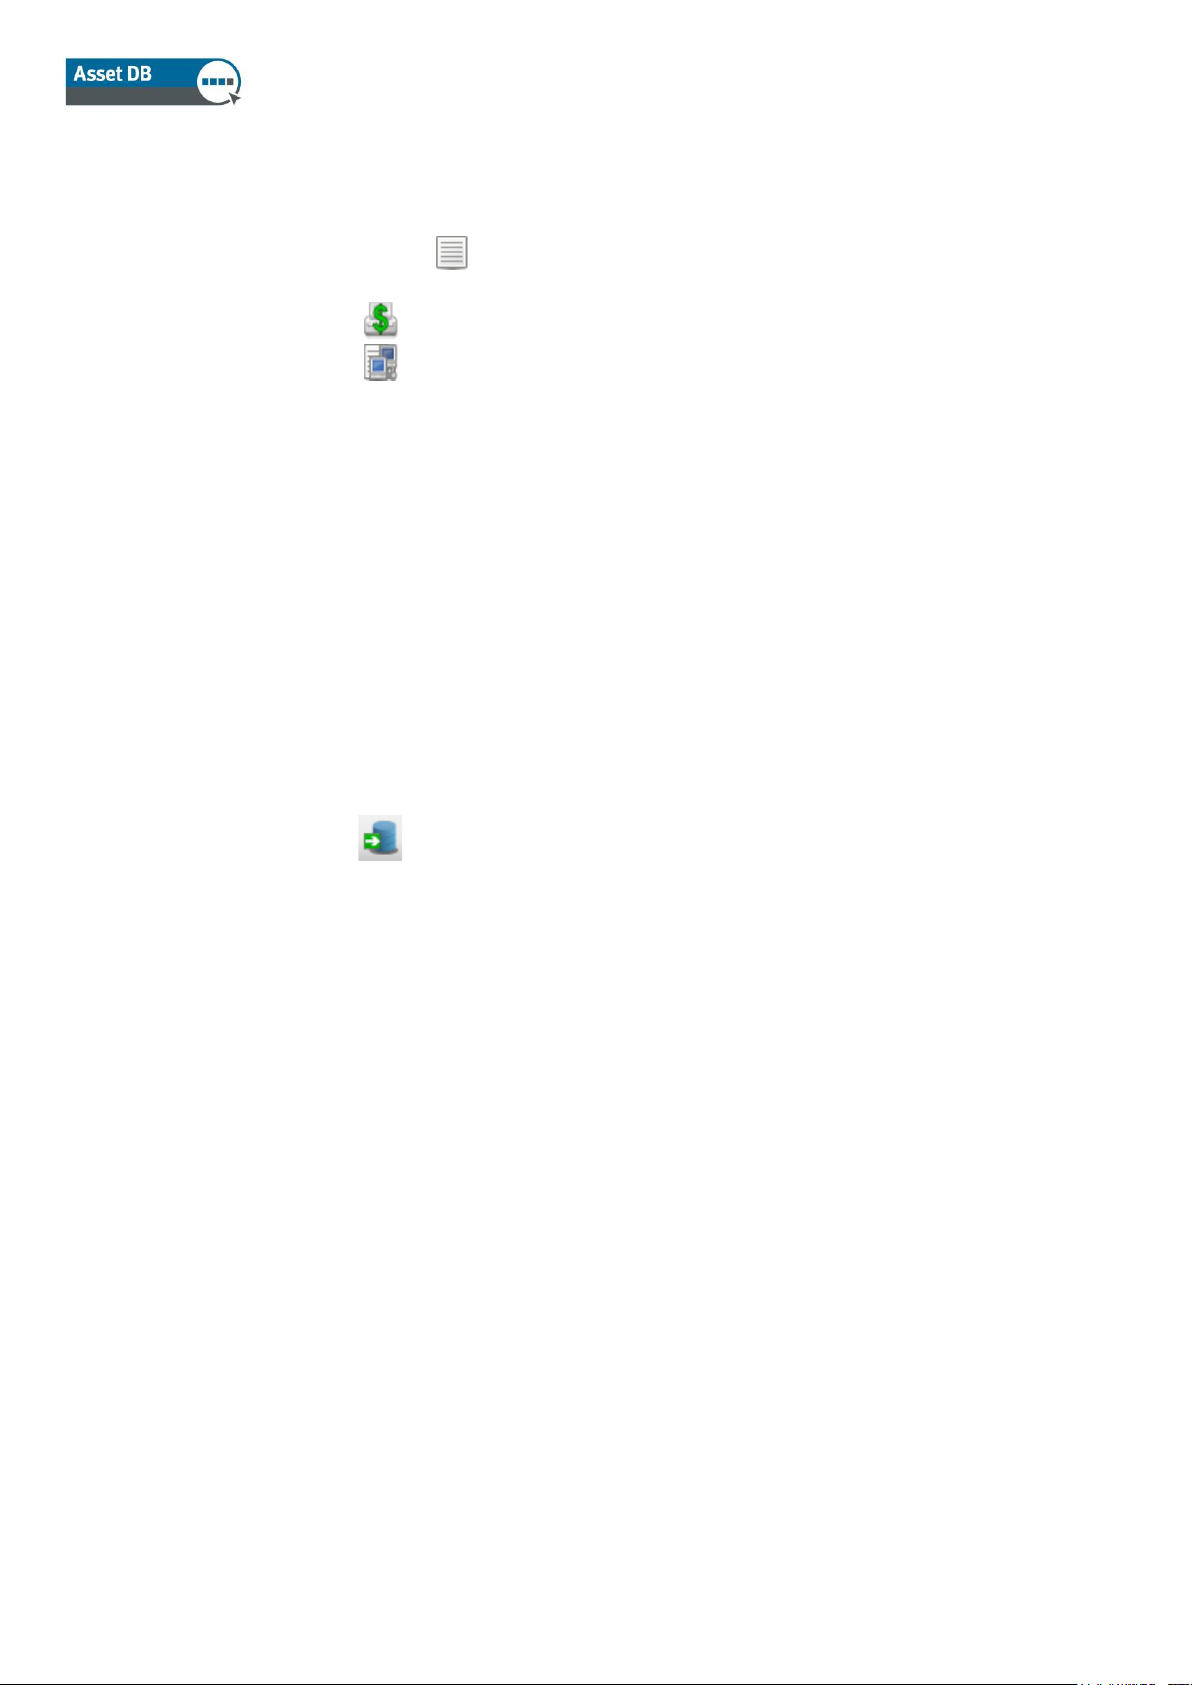
If list prices or consumable data do not exist on the TCO Server, then a warning symbol will
appear in the ‘Status’ column. In this circumstance, the ‘Cost As’ function can be used. This is a
right-click function and requires you to remain online in order to retrieve a list of similar models
from the hosted server from which you can select a comparable model whose price you can use
instead.
Page 19

Analyst User Manual
- 17 - Asset DB v4.8.1
Figure 18. Cost As function
Once the ‘Cost As’ model has been selected, the relevant model data will be fetched and a new
icon will appear in the ‘List Price’ column illustrating that a substitute model was used.
It is also possible to fetch consumables for a device without fetching the cost data. This can be
done by using the ‘Cost As’ function and choosing one of the ‘Cost As’ Find Consumables…’
options (see Figure 18).
If the Cost as function was previously used for a device in another project, Asset DB will
remember this and give the option to apply the same model and consumables for a device. You
can decide whether to apply this by selecting Yes or No in the Apply column or delete the
Page 20

Analyst User Manual
- 18 - Asset DB v4.8.1
association by clicking on the bin in the Delete column. Once the selections are made, click on
Fetch Cost As data to proceed.
Figure 19. Fetch Cost data for devices without data
3.4 Adding in Customer Cost Data
With the relevant printer data in hand, it is possible to send a list of the printers and their
consumables to the end user for their actual purchase costs to be added in. This can be done by
selecting the ‘Export Data’ button from within the different views (‘Asset View’ for hardware costs
and ‘Consumable View’ for the consumable costs) or via the main menu at TCO > Export > Asset
Data/Consumable Data.
Figure 20. Export TCO data
Page 21

Analyst User Manual
- 19 - Asset DB v4.8.1
The List price is displayed in an Excel spreadsheet and can be over-written. To import the new
information back in, click the Import Data button on either the Asset View or Consumable View or
use the main menu at TCO > Import > Asset Data/Consumable Data.
Once you have changed the prices, either manually or by import, the ‘List Price’ icon changes to
a notepad with a pen to show which items have been manually entered by the user or customer
for easy visual reference:
Figure 21. Manually entered price data
Note: Yield data is held in the database and will be used in the calculation but is not displayed in
the export, as this is proprietary information of the data provider.
3.5 Removing Consumables
The TCO server will provide all known OEM consumables associated with any device in the
project. Sometimes a consumable is not required; maybe it is rarely purchased, or the client uses
non-OEM parts (see Section 3.6 Local Consumables).
After downloading data from the TCO server, click to select the ‘Consumable View’ as shown in
Figure 22.
Figure 22. Consumables View
To deselect a consumable simply click in the ‘Use’ column next to the consumable you wish to
deselect. When the TCO is calculated, the consumable is ignored by Asset DB.
Page 22

Analyst User Manual
- 20 - Asset DB v4.8.1
3.6 Local Consumables
The TCO server provides access to tens of thousands of Original Equipment Manufacturer
(OEM) consumables. Alternatively, you may wish to use Non-OEM parts or add a consumable
that is not currently on the server. Consumables created manually in Asset DB are stored locally
and can be used in other projects.
To create a local consumable click the ‘Manage consumables for the TCO Analysis’ button
on the tool bar. Select the Edit Local Consumables tab and fill in the data for the consumable to
be added, as shown in Figure 23. Click ‘Create’ and the consumable will show in the ‘Available
Consumables’ table. Please note that all fields are required.
Figure 23. Manage Consumables
Select the ‘Assign Local Consumables’ tab. The list on the left shows the ‘Available
Consumables’. Select the consumable you want to use and click the green arrow to move it to
the ‘TCO Analysis Consumables.’
Page 23

Analyst User Manual
- 21 - Asset DB v4.8.1
Figure 24. Assigning Consumables to TCO Analysis
Once the consumable is in the TCO Analysis Consumables table, it will automatically appear in
the ‘Consumable View’ of the project as options to be used in the analysis.
Please note, as long as the local consumable works out cheaper than the OEM part, it will
automatically be selected. If you wish to force the use of this consumable irrespective of its price,
see Section 3.5 for how to deselect the OEM part.
Page 24

Analyst User Manual
- 22 - Asset DB v4.8.1
3.6.1. Using previously created local consumables
As you build a local consumable database, you will want to use that data for other projects.
When downloading data from the server you will see the option as shown below to use local
consumables. Please select this if you wish to have them available for use. (Note: Only exact
model matches will display).
Figure 25. Use local consumables option
3.6.2. Managing Consumables
The ‘Manage consumables for the TCO Analysis’ button can also be used to compare and
copy consumables from one devices to another. Going to the Manage All Consumables tab
enables you to compare consumables from different devices.
Figure 26. Manage All Consumables
Having a device selected in the top half, the Consumables table on the right shows the
consumables connected to this device.
Page 25

Analyst User Manual
- 23 - Asset DB v4.8.1
Selecting a device in the Compare Device table shows the connected consumables on the
Compare Consumables table.
Selecting a consumable from one the two tables on the right allows you to copy the consumable
up or down, hence associating it with a different device.
3.7 View Devices for Consumables
If you wish to see which devices use a specific consumable, right-click on ‘Consumable’ and
select ‘View Devices for Consumable.’
Figure 27. Devices which use consumable
3.8 Setting up contracts
At the same time as sending the customer the hardware and consumables list, it might also be
possible to request contract information for both the printers and the MFDs. If the customer is
unwilling to provide contract information, benchmark cost data can be used in this step instead.
There are four types of contract that can be associated with a device:
Page 26

Analyst User Manual
- 24 - Asset DB v4.8.1
a. A lease or rental contract in the form of a one to one relationship or several devices
within the one lease contract.
b. A cost per click contract applying a fee per page or click printed/copied.
c. A cost per click contract for tri-colour devices, applying a different fee per page or
per click printed/copied according to the level of colour.
d. Another support cost contract covering all other types of cost such as an annual
maintenance contract for printers or soft costs like Helpdesk calls.
Since one device or brand of devices may have some, or all, of the above contract types
associated with them, contracts are created within groups (see Figure 28 below).
Figure 28. Setting up Contract Groups
The expectation is that contract groups will be set up by brand or perhaps by brand category
such as HP Mono Printers or Lexmark Colour Printers. You can create a contract group by
clicking on the paper ‘Contract’ icon (shown above, next to the green waste bin). If the contracts
all terminate at the same time then this can be added in here. Otherwise, the individual contract
dates can be added in the ‘Contracts’ tab.
Page 27

Analyst User Manual
- 25 - Asset DB v4.8.1
3.8.1. Setting up a Lease or Rental contract
Move from the ‘Contract Group’ tab to the ‘Contracts’ tab where a new screen will appear as
shown in Figure 29. The ‘Lease Contract’ tab requires a number of key areas to be completed:
• From the drop down list, select the Contract Group that you want the lease to belong
to.
• Click on the ‘Create a New Lease Contract’ button to start entering new contract
information.
• Give the contract name as much detail as possible to make it easily identifiable later
on when you will assign it to a device.
• Enter the contract number.
• Enter a lease cost and the time period that the lease payment represents (e.g.
monthly/quarterly/annual).
• Enter the contract start and end date, which will be useful for early termination fee
calculations.
• Enter the number of devices associated with the contract. The TCO calculator will
divide the lease payment by the number of devices to come up with an individual
device hardware cost.
Figure 29. Creating a lease contract
Page 28

Analyst User Manual
- 26 - Asset DB v4.8.1
3.8.2. Setting up a Cost per Click Contract
Creating a ‘Cost per Click’ contract is much the same as the lease one, enter key
information from a click contract name to any minimum monthly volumes.
Figure 30. Setting up a Cost per Click contract
3.8.3. Setting up a Tri-Colour Cost per Click Contract
A ‘Tri-Colour Cost per Click’ contract is created in the same way as a ‘single-colour Cost per
Click’ contract. The only difference is that costs and minimum and maximum volumes can be
specified by colour level.
Page 29

Analyst User Manual
- 27 - Asset DB v4.8.1
Figure 31. Setting up a Tri-Colour Cost per Click contract
3.8.4. Other Support Cost contracts
The final contract type is for any other support costs that are attributed to a device or set of
devices. For MFDs, this might be a software support contract or a managed service fee, while for
printers it could be an annual maintenance fee. It is possible to have multiple ‘Other Support
Cost’ contracts such as ‘Mono Printer Maintenance’ and ‘Mono Printer Relocation fee’.
Figure 32. Setting up an Other Support Cost contract
As the ‘Other Support Cost’ contract allows for generic data entry, it can be used for soft costs as
well as hard costs; for example, an annual cost for raising and managing printer consumables
invoices.
Page 30

Analyst User Manual
- 28 - Asset DB v4.8.1
3.8.5. Exporting and importing contract data
It is also possible to export contract data to be sent to your customer for completion, similarly to
how cost and consumable data can be exported. Contract fees can then be completed in a
spreadsheet editor and imported into Asset DB. To do this, select menu option TCO > Export >
Contracts, and choose a location on your computer to save the .xls file generated.
Figure 33. Exporting contract data to spreadsheet for editing
You can then enter the values that you wish to use for lease, cost-per-click and other support
contracts into the table, save and import back to Asset DB via menu option TCO > Import >
Contracts.
You should always export a contract’s .xls-type file and fill in details for import rather than
creating your own spreadsheet with similar column headers and trying to import this.
Top tip: Create a contract of each type in Asset DB before you export the spreadsheet. This
way, you can see which columns in the file will need to be completed for each contract type.
3.9 Creating Assumption Sets
Now that all the known costs have been added into the TCO Tool, the last piece to define is the
assumptions to be applied to the variable cost elements in the TCO Calculation. The TCO Tool
applies an important area of flexibility in this step by allowing different Assumption Sets to be
used in order to compare and contrast the effect they have. For example, a Finance Director
might want a depreciation period-only approach to writing down hardware values while an IT
Director might want a Technology Refresh one.
Page 31

Analyst User Manual
- 29 - Asset DB v4.8.1
There are several assumptions to take into consideration, and putting in the correct values will
have a major impact on the accuracy of the final cost calculations for printers where the variable
elements are greater.
The Assumption fields to enter are:
▪ Write-down period - depreciation or technology refresh period.
▪ Toner wastage - the estimated percentage of toner left in a cartridge when the ‘Toner
Low’ warning comes on. Typically 10-15% depending on the manufacturer.
▪ Discount on hardware - the discount the TCO Tool will apply from the Retail/List Price
provided by hosted server download. This is for devices where the End User has not
been able to provide the specific price they paid for a purchased item.
▪ Discount on consumables - the discount the TCO Tool will apply from the Retail/List
Price provided by hosted server download. This is for consumable items where the
End User has not been able to provide the specific price they paid.
▪ Mono coverage- the average amount of toner coverage on the pages printed. The
average can vary from 3-11% across different departments with a company-wide
average of between 4-6% for mono. Colour coverage is added in the ‘Data
Preparation’ Tab; see section 1.2: Creating Volume Generation Assumptions.
▪ If the customer uses High Capacity cartridges this box should be ticked and if such a
cartridge type exists for a printer, the TCO Tool will then use this item.
Figure 34. Setting up Assumption Sets
Page 32

Analyst User Manual
- 30 - Asset DB v4.8.1
3.10 Assign Contracts and Assumption Sets
With all the costs and Assumption Sets created, the final step before running the calculation is to
assign the contracts and the relevant Assumption Sets to either a group of devices or a single
device as appropriate. Every device that has been purchased will need an assumption set
assigned to it, and every device that has been listed as ‘Under Contract’ will need at least one
contract assigned. Those devices categorised as ‘Both’ will need an assumption set and a
contract assigned to them.
Figure 35. Assigning an assumption
To assign an assumption set, right-click on the row in question, select Assumption Sets > Assign
Assumption Set, and the pop-up in Figure 35 appears. Select and assign the appropriate
Assumption Set and click ‘OK’.
To assign a contract is a similar process; right-click in the relevant row then select ‘Assign
Contracts’ and the following pop-up will appear:
Page 33

Analyst User Manual
- 31 - Asset DB v4.8.1
Figure 36. Assigning a contract
Select your contract group from the drop down at the top, then select the desired contract in the
‘Available’ list and click on the green arrow to move it to the ‘Assigned’ list. You can assign
multiple contracts at the same time.
Please note that a Tri-Colour Cost per Click contract can only be assigned to devices that have
been set as having three colour meter levels. This is determined in the Colour Meter Levels field
on the Specification tab of the Device Details panel in the Current State.
When a device has had the relevant Assumption Set and/or contracts assigned, the Red
Warning Triangle in the ‘Status’ column will change to a green tick to indicate a TCO Calculation
can now be performed. See Figure 37.
Figure 37. Ready to calculate screen
Top Tip: Hover over the red triangle to see what parts you still need to complete to make it
change to a green tick.
Page 34

Analyst User Manual
- 32 - Asset DB v4.8.1
3.11 Calculate the costs
Once all the costs and assumptions have been entered and assigned, the TCO Tool is ready to
calculate the costs and turn these into a cost per page. This function is carried out by clicking on
the calculator button . If you select ‘Calculate for All Assets’ the TCO will take all assets into
consideration. Should you only want to calculate it for a few selected devices, select the devices
in your Asset View first, and then click on the calculator button and select ‘Calculate for Selected
Assets’.
A pop-up will appear with a message on whether a complete calculation can be made as well as
if any volumes are missing; there is an additional ‘Calculate’ button to confirm the intention to
proceed. The TCO Tool will then report that a calculation has been completed and when you
close the pop-up, you will see that the ‘Unburdened Mono’ and ‘Colour CPP’ columns will be
populated with the actual running costs as shown in Figure 38 below:
Figure 38. Populated running costs
Tip: Be sure to right-click on a column header and choose ‘Clear All Filters’ before running the
TCO calculations to ensure you have not missed any devices that you may previously have
filtered out.
Should you need to rerun your TCO calculations please make sure you have ticked the Overwrite
box for your assets, before you calculate again. This ensures that the data you already have will
be overwritten by the new calculation.
3.12 Import and Export TCO Analyses
It is possible to export and import TCO analyses Via File > Export > TCO Analysis. The result is
a portable .tco file. If the associated project is synchronised to the Asset DB Cloud (explained in
the Auditor manual), the TCO analysis can then be reimported into any downloaded version of
that same project. This allows a handover of the TCO calculation where necessary.
Page 35

Analyst User Manual
- 33 - Asset DB v4.8.1
3.13 Move TCO data to the Current State in Asset DB
Once you are happy with your calculations, the TCO data can be pushed over to the Current
State of the Asset DB project. To do this, click to apply values from the TCO calculation to
assets in the current project, which will bring up a dialogue box as shown below.
Figure 39. Transfer cost data to the current view
Asset DB will then transfer the data across to the Financials tab in the Current State view. The
actual calculation behind the costs can be verified by right-clicking on an icon on the floor plan or
on a row in the table view and selecting Explain Calculation > TCO Analysis. The pop-up shown
in Figure 40 will appear. This Explanation window can also be exported into HTML format for use
in reports or presentations, etc.
Page 36

Analyst User Manual
- 34 - Asset DB v4.8.1
Figure 40. Show TCO Calculations pop-up
3.14 Confirm TCO costs
With all the costs populated, it is possible to check whether there are any anomalies. This can
either be done on screen or if a total figure for hardware and consumables costs is a better
starting point, then the full data can be exported by going to Project > Export > Asset DB Data.
The export then provides 16 additional fields with cost information. The definition for each TCO
column is as follows:
▪ Consumables Mono/Colour/Colour Level 1/Colour Level 2/Colour Level 3
CPP: the pure running costs per page without any hardware or other contract
information.
Page 37

Analyst User Manual
- 35 - Asset DB v4.8.1
▪ Total Mono/Colour CPP: these two columns give the total cost per page with all
costs included, such as depreciation or lease costs and all other recurring costs.
Useful for a true comparison between devices types (e.g. a printer vs. an MFD).
▪ Monthly Hardware Cost: the monthly depreciation or monthly equivalent lease
cost.
▪ Monthly Recurring Cost: the monthly cost of any recurring costs applied to a
device.
▪ Monthly Mono/Colour/ Level 1 Colour/Level 2 Colour/Level 3 Colour Costs:
these five columns give the actual total consumable costs per month for that
device (monthly volume x the CPP).
▪ Overall, Monthly/Annual Running Cost: these two columns give the sum of the
monthly/annual hardware, recurring and consumables costs.
4 Calculating CO2: The Green Calculator
The Asset DB Green Calculator enables the user to calculate, quickly and consistently, the
environmental impact of devices in a fraction of the time it takes to do this through MS Excel. It
speeds up data collation through access to a quality database provided by leading market
research company, Gap Intelligence, and an easy to use interface. The data supplied covers:
▪ Copy Speed Mono.
▪ Copy Speed Colour.
▪ Operating Power (Watts).
▪ Standby Power (Watts).
▪ Power Save (Watts).
All values are as quoted by the manufacturer. For errors or omissions, please contact us advising
of make, model, the value and the source of your data. All data can be updated manually where
required and variables like toner coverage, hours/days in a working week can all be adjusted
through a simple assumption set.
Using this tool the user will calculate total kW used, CO2 emissions, cost of power and the
number of trees consumed.
4.1 Starting a Green Calculation Analysis
Note: For a green calculation to work you will need to have monthly volumes generated (please
see Sections 0 & 2).
Start by opening the project that you wish to evaluate and clicking File > New > Green Analysis
(Current State).
Page 38

Analyst User Manual
- 36 - Asset DB v4.8.1
You will be presented with a new tabbed workspace called ‘Green Analysis (Current State)’,
which will show all the devices in a list ready for you to connect to the service and search for data
(see Figure 41).
Figure 41. Green tab
The first icon is the fetch data icon . Click the icon to connect to the server where the master
database of information is held.
Asset DB will search for the information for your devices. Asset DB requires the data to be
formatted correctly, which is why we advise that you use the make and model drop downs in the
details console. Once the search is complete, Asset DB will tell you how many devices for which
it has been able to ‘Fetch’ data.
Top Tip: If you do not use the drop downs to enter Make and Model you may not get information
back from the server in this first process.
4.2 Treat As
The device shown in Figure 42, an Epson Stylus1280 has not been found, so to locate this
device we click to highlight the device, then right-click and select Treat As > Find Devices with
Similar Name. Asset DB will search the database for all likely options and return them in a list as
shown below. As you can see, the device is in the list as Epson Stylus Photo 1280. Click to
select and click ‘OK’. This will apply these values to that device. If there are multiple devices not
found that have the same name, you only need to perform the Treat As procedure for one of
them and Asset DB will automatically match the rest of the same type of device.
Page 39

Analyst User Manual
- 37 - Asset DB v4.8.1
Figure 42. Treat As
Once the data has been returned, it can be exported as a .csv file and if required changes can be
made and imported back using the next two buttons on the Green tab console.
4.3 Assumptions
Just like the TCO tool, the Green Calculator requires assumptions to be created that will affect
the calculation. These elements include toner coverage, working hours and days, cost of
electricity and two assumptions that fill gaps in the data, standby and power save, were you can
use a percentage of the power in operation.
All of these factors will have an impact on the calculation and enable a credible calculation to be
performed with transparency of what assumptions were necessary to arrive at the final
calculation.
To start the assumptions dialogue, click and the Green Calculator Assumptions window
will appear. Click the button shown in Figure 43 to create a new assumption set.
Page 40

Analyst User Manual
- 38 - Asset DB v4.8.1
Figure 43. Green Calculator Assumption Sets
As with the TCO, you can manage factors like coverage, number of hours in a working week and
the cost of electricity, and apply assumptions to standby and power save where you do not have
the actual figures.
Make your selections and click ‘Close’. You can now assign your assumptions to your devices. In
Figure 44, all the devices have been selected in order to apply a single assumption set to them
all. Different assumptions sets can be applied to different groups of devices (e.g. to reflect the
set-up of different buildings). To assign the assumptions, right-click the mouse and select
Assumptions > Assign Assumption Set, and then select the assumption you want from the list
and click OK.
Page 41

Analyst User Manual
- 39 - Asset DB v4.8.1
Figure 44. Assigning Assumption Sets
4.4 Calculate
Figure 45. Calculation
Asset DB indicates when it is ready to calculate the environmental impact with green or amber
ticks in the Status column. An amber tick indicates that some data had to be manually added to
complete the data set. With ticks in the status column, we are ready to calculate our
environmental impact. Click the green foot button shown in Figure 45, if you select ‘Calculate for
All Assets’ the Green calculation will take all assets into consideration. Should you only want to
calculate it for a few selected devices, select the devices in your Green Analysis tab first, and
Page 42

Analyst User Manual
- 40 - Asset DB v4.8.1
then click on the green foot button and select ‘Calculate for Selected Assets’. Follow the
instructions and you will be presented with a summary (see Figure 46).
Figure 46. Calculation summary
The final step is to click the globe button to transfer this data to the Environmentals tab in
the Asset Details console in the Current State.
In the same way as for the TCO, you can verify the actual calculation behind the costs by rightclicking on an icon on the floor plan or on a row in the table view and selecting Explain
Calculation > Green Analysis (current state).
The information will also be summarised in the Print Assessment Summary report.
Should you need to rerun your Green calculations please make sure you have ticked the
Overwrite box for your assets, before you calculate again. This ensures that the data you already
have will be overwritten by the new calculation.
4.5 Import and Export Green Analyses
Green Analyses are also exportable in the same way as the TCO calculations. This is explained
in more detail in Section 3.12.
Page 43

Analyst User Manual
- 41 - Asset DB v4.8.1
5 User Data
Being able to visualise how a printing environment is being used is a powerful way of supporting
a design strategy and presenting and demonstrating document workflow arguments. To achieve
this, Asset DB can now import third party user data from programs such as Print Assessor 6 and
SafeCom, which is then visually represented as annotations around user and output device
icons.
5.1 Import User Data
To import a data file click ‘Project > Import > User Data >User Data’. Browse to the user data file
which must be a CSV (Comma Separated) file and click ‘Open’.
This will start the user data import process. The process is similar to the asset data import, where
you will match the fields in the import to the corresponding Asset DB Fields. Help windows at the
bottom will walk you through the process. Once the import is complete, click ‘Close’. Please note
that User Data files can be very large and the import process may take a few minutes.
Figure 47. User Data Visualization
Page 44

Analyst User Manual
- 42 - Asset DB v4.8.1
5.2 Mapping and Viewing
Asset DB will automatically map users to output assets via the IP address, where this is captured
in the User Data file. Directly connected devices will have to be mapped manually.
If the IP address is not included and the only printer identifier is the Print Queue name, there is a
special Asset DB export, which can be sent to the Client IT department. They can provide you
with the IP address that matches the Print Queue. The Client IT Manager will have easy access
to this table. Click Project > Export > User Data > Device IP Mappings, and give this file to the IT
manager who will be able to link the Print Queue to an IP address. This file can then be
reimported to provide the correct IP address mapping. Click Project > Import > User Data >
Device IP Mapping.
To map users, the best approach is to import user data before going on site to audit. The auditor
can then use the imported data to drop user icons on the floor plan as he or she comes across
them.
To see just the unmapped users or devices click either ‘Unmapped Users’ or ‘Unmapped
Devices’ tabs. These unmapped users and devices can also be seen shaded in pink in the users
and devices list. Unmapped devices/users can be added by selecting and clicking the
appropriate icon. You can add an unmapped user (highlighted in pink) to the floor plan by
selecting them from the table and clicking this button . You can also select multiple users
and map them as a group using the Add Group icon .
When adding a device it is important to select the correct asset type:
is printer is MFD and is a production device.
You can also map a device or person by linking user data to a device/person previously mapped.
Select the device/person icon that you have placed on the floor plan and then highlight the
device in the un-mapped users/devices list. Then click the following button to link the
user/device data to that icon. Un-mapping a device or user is simple, select the user or device
and click the un-map button.
Once users are mapped to devices, you will see the links as shown in Figure 48. The green line
indicates the link between the user and the device, while the circle around the user or device
represents the volume, split between colour (light red shade) and mono (light blue shade). To
see all the devices to which a user prints, simply click on the user in question.
Page 45

Analyst User Manual
- 43 - Asset DB v4.8.1
Figure 48. Visualisation of all users who print to a device
If a User prints to a device on another floor, it will be indicated by a green edge to the volume
circle. Hovering the cursor over the user will then bring up an image of the alternative floor to
which that user prints. The same applies to a device where a user prints to it from another floor.
To change the default columns shown, you click and select the columns you wish to
view. If you wish to import new data, you must first remove the old data. To do this click Options
> User Data Configuration, which will present a pop up window as seen in Figure 49. First, delete
all user data mappings and then delete all user data. You can now reimport user data.
Figure 49. User Data Configuration
Page 46

Analyst User Manual
- 44 - Asset DB v4.8.1
6 Analyst Features
6.1 Statistics
In addition to the basic statistics tab found in Auditor, Analyst has ‘Storage Statistics’, ‘Print
Statistics’ and ‘Space Utilisation’ options, which can be found in the View menu. Statistics are
displayed based on the level of the project you currently have highlighted - Project, Building,
Floor or Department.
These statistics panels can also be exported using the Export button or via a right-click menu into
HTML format.
Figure 50. Storage statistics
Figure 51. Print statistics
Page 47

Analyst User Manual
- 45 - Asset DB v4.8.1
Figure 52. Space utilisation
6.2 Highlight/Filter Assets Tool
Using the Highlight/Filter tool found under View > Highlight or Filter Assets, you are able to
uniquely create filters and display assets based on particular criteria. Figure 53 shows the
various options available to determine exactly which assets to highlight or filter.
Page 48

Analyst User Manual
- 46 - Asset DB v4.8.1
Figure 53. Edit Filter Criteria
Free text and tick
boxes for relevant
criteria
Select any field in
the Icon
Customisation
Choice of criteria
Set multiple filters
for one field
Insert an
additional
criterion
Page 49

Analyst User Manual
- 47 - Asset DB v4.8.1
Highlight styles include a large star surrounding the icon, a star next to the icon or a circle around
the icon. The highlight style is selected using the ‘Shape’ drop-down in Figure 54 along with the
colour, size and opacity of the highlight type. Each filter is also given a name that will appear in
the filters list along with an indication of the highlight style. Multiple highlights/filters can be
applied to the project at any one time and they can be toggled on and off in the filters list. .
Figure 54. Highlight/Filter Assets
Figure 55 shows a representation of each of the highlight styles available.
Figure 55. Asset Highlighting Options
Page 50

Analyst User Manual
- 48 - Asset DB v4.8.1
The highlight/filter tool can also be used to filter out particular assets by selecting the Hide radio
button.
6.3 Showing Distances around Icons
Distances around an icon can also be shown permanently on the floor plan. To activate this
feature go to View > Show Distances, and the pop-up in Figure 56 will be displayed.
Figure 56. Show Distances settings
For each attribute, you can determine a distance and a colour, which will then be displayed on
the floor plan. If multiple attributes from the same device will be used then the outline feature
may be a better visual indicator than a colour. This is particularly useful in the Solution Design
where a floor plan can be displayed with the distance colours to illustrate that all the users are
covered by a maximum walking distance parameter. See Figure 57.
Page 51

Analyst User Manual
- 49 - Asset DB v4.8.1
Figure 57. Asset Circulation Distances Displayed
The Asset tick box at the bottom enables the user to select a specific asset or icon to display
individually and separately from the others. To activate this feature, right-click the device in
question and select ‘Set Asset Distance’.
7 The Print Assessment Summary Report
Once calculated TCO and Green analyses have been performed and data transferred to the
current state, the Print Assessment Summary report will automatically include the TCO and
Green data.
The report can be generated by going to Reports > Run, in the top menu and selecting ‘Generate
Print Assessment Summary’. You can choose the language of the report and the parts of the
project you want to include in the report before clicking ‘Run’ to generate the report.
Page 52

Analyst User Manual
- 50 - Asset DB v4.8.1
Figure 58. Print Assessment Summary Report request
The report can be produced in Word, Excel, PowerPoint or PDF and this is determined by
changing the file type when you give the file a name and decide where to save it. All the charts
are generated from the data in the Asset DB project. Floor plans are also included based on what
is visible in Asset DB (e.g. whatever display options you have set up in Asset DB will show on the
plans in the report). Reports are currently available in the languages seen in Figure 58.
8 Portfolio
If you have finished working on an analysis and need to keep the data but no longer need to be
working on it day to day in Asset DB, it is possible to mass export/import Asset DB file types for
archiving purposes1. This will provide you with an .atc file you can save outside Asset DB and
allows you to then delete the local version to reduce clutter in the Open dialogue. It can also be
used as a means of sharing data with other users.
8.1 Exporting Portfolio
To export a portfolio, open the project for which you want to export any elements (it is not
necessary to open all of the elements; having the project open is enough), then go to File >
Export > Portfolio.
1
The export/import Portfolio functionality is not available with all licence types.
Page 53

Analyst User Manual
- 51 - Asset DB v4.8.1
Figure 59. Export Portfolio
You can then choose which elements you wish to export by ticking the box next to that element
in the list (see Figure 60).
Figure 60. Select elements to export
It is possible to export any or all of the elements this way in a single file. When it comes to
importing these back into Asset DB, you can either bring all the elements back in or choose
specific ones to import. You can also use this as a means of sharing project data with other
users.
8.2 Import Portfolio
To import a Portfolio file, go to File > Import > Portfolio and navigate to where you have saved
the file. Click to select the file and click ‘Open’ to have the option to choose which components
you wish to import. You can import some or all of the available components.
Page 54

Analyst User Manual
- 52 - Asset DB v4.8.1
Note: if you choose to import the project part of the portfolio and the project still exists in Asset
DB, this will create a copy of the project and import the other analysis components against that
copy, rather than against the original. If you wish to import the analyses against the original
project, make sure that you do not select the project, but just the analyses you wish to import.
This will import the analyses as copies against the original project.
 Loading...