


67 Series
Spectrophotometers
Operating Manual
670 00
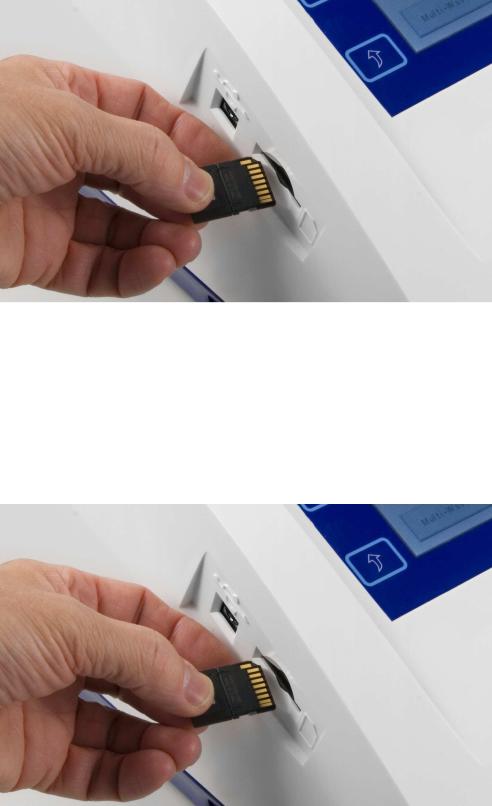
IMPORTANT
Please ensure the SD Card is fitted into the socket as detailed in the image below.
-------------------------------------------------------------------------------------------------------------------------
IMPORTANT
Please ensure the SD Card is fitted into the socket as detailed in the image below.

67 Series Spectrophotometer
PC Software
Installation
Insert the 67-Series Software Suite installation CD and select the 67-Series Software Suite icon to open the following screen. Selecting Next commences the installation. The installation can be aborted by selecting Cancel.
The default installation destination is C:\Program Files\Jenway\67-Series Software Suite\. To select the default destination select Next, to alter the destination select Browse. To review the disk space requirements select Disk Cost. The 67-Series Software Suite can be set up to be used by all users or a single user by checking the appropriate box. To progress the installation select Next, to return to the previous screen select Back, to exit the installation select Exit.
Select Next to commence the installation. To review or change any of the installation parameters select Back. To exit the installation at this stage select Cancel, the software will not be installed if you choose to exit.
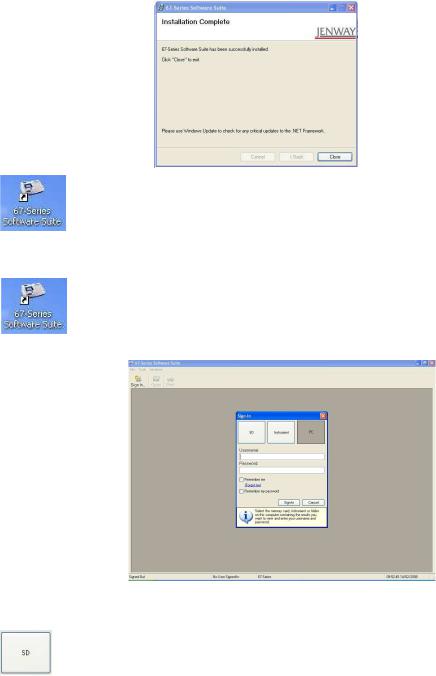
When the installation is complete select Close.
The 67-Series Software Suite icon is displayed on desktop
Getting Started
Ensure the PC and spectrophotometer are connected via the USB cable and select the 67-Series Software Suite desktop icon to open the 67-Series Software Suite main screen.
There are three options for accessing saved methods and data: SD, Instrument and PC.
SD allows the user to access methods and data saved on an SD or SD/USB card inserted in the PC.
Selecting SD allows the user to browse through the PC directory for the inserted SD or SD/USB card. Select the required folder, OK and Select SD card as your login source. Entering the Username, Password and selecting Sign-In accesses that specific users methods and data (the Username and Password that are required are the same as when logging into the instrument), the user or password can be saved by ticking the appropriate boxes. Highlighting the required method and selecting Open accesses the saved method.
Data processing for SD is detailed in the Data Processing section.

Note: If the selected location does not contain a valid SD card the error message This location does not contain a valid SD card will be displayed.
PC allows the user to access methods and data saved to a PC.
Selecting PC allows the user to browse through the PC directory for the desired folder. Select the required folder, OK and Select this folder as your login source. Entering the Username, Password and selecting Sign-In accesses that specific users methods and data (the Username and Password that are required are the same as when logging into the instrument), the user or password can be saved by ticking the appropriate boxes. Highlighting the required method and selecting Open accesses the saved method.
Data processing for PC is detailed in the Data Processing section.
Note: If the selected location does not contain a valid SD card the error message This location does not contain a valid copied SD card will be displayed.
Instrument allows the user to access data saved to either the internal memory of the spectrophotometer or a memory card inserted in the spectrophotometer.
Selecting Instrument allows the user to browse through data saved to either the internal memory of the spectrophotometer or a memory card inserted in the spectrophotometer. Select the Check for connected instrument (the default status is Disconnected), whilst searching the Check for connected instrument button updates to read Cancel and the status updates to Searching… when connected the status reads Connected. Choose the desired location of the files from the dropdown bar (the option for Inserted Memory Card is only available if an SD or SD/USB card is inserted in the spectrophotometer) and Select this location as your login source. Entering the Username and Password and Sign-In accesses that specific users methods and data (the Username and Password that are

required are the same as when logging into the instrument), the user or password can be saved by ticking the appropriate boxes. To access the required method highlight that line and select Open. Data processing for Instrument is detailed in the Data Processing section.
Note: Whenever the PC and spectrophotometer are communicating the spectrophotometer’s screen updates to show:
Data Processing
Data processing is the same for the SD, PC and Instrument options.
All available methods are displayed in the Open box. Highlighting the required method and selecting Open opens the method.
Once a method is opened further methods can be opened by selecting the open icon.
Note: Clicking on the column titles alters the order in which the methods are displayed. Method Name orders the methods alphabetically, Date orders the results in date order, Owner orders the methods by owner type, Method Type orders the methods alphabetically and Internal/Ext orders the methods by the order they appear on the spectrophotometer’s screen.
Photometrics
The photometrics screen displays two tabs Method and Results
The Method tab displays the Method Details, Accessories Used (if any) and Information of the photometric measurement (this information cannot be edited).
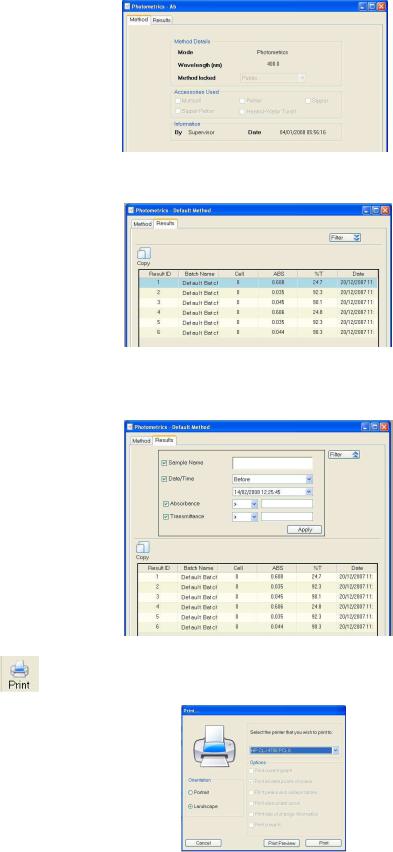
The Results tab displays a table of the all the results in the chosen method.
Selecting Filter displays a drop down allowing the results to be filtered by Sample Name, Date/Time, Absorbance or Transmittance values. After inputting the required filter parameters select Apply and the results table will be updated to include the filtered results.
Selecting the print icon opens the Print box. This allows the user to choose the printer, the orientation of the printout and gives the option of printing directly or viewing a Print Preview.

Selecting the copy icon allows the results to be pasted directly into other programmes (e.g. a spreadsheet) for further data manipulation or editing.
Spectrum Scanning
The spectrum screen displays two tabs Methods and Results.
The Method tab displays the Method Details, Accessories Used (if any) and Information of the spectrum scan (this information cannot be edited).
The Results tab displays a table of the all the results in the chosen method. The desired results can be opened by highlighting the required data line and selecting Open, the chosen spectrum is displayed.
Selecting the open icon displays a table of all of the results. Highlighting the desired result and selecting Open will overlay the chosen spectrum.
Holding the cursor over the spectrum trace or the data name will highlight the chosen spectrum and fade any other spectra.
To return to the original spectrum select the open icon and reselect the original data set.
Selecting the area under curve icon displays the following screen. Inputting the required wavelength limits and selecting Apply will calculate the area under the curve to both the tangent and the baseline.
Selecting the peaks and valleys icon displays the following screen. Selecting the required noise filter and Apply will display the both the wavelength values and the absorbances. These values can be displayed on the spectrum, in a table or both by selecting the appropriate boxes. Alternatively selecting a peak or valley with the cursor will manually label the wavelength and absorbance value.
To exit from the Peaks and Valleys screen select Close.
Selecting the zoom in icon displays the green ‘zoomarea’ on the spectrum. Placing this over the desired area and clicking the left mouse button will zoom in to the green highlighted area. This process can be repeated up to four times. Once zoomed in it is possible to return to the previous zoom level by selecting the zoom out icon.
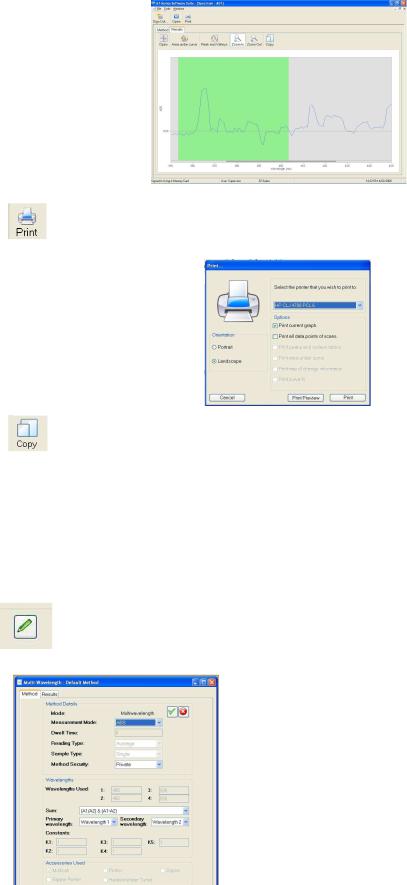
Selecting the print icon opens the Print box. This allows the user to choose the printer, the orientation of the printout, what data is displayed on the printout and gives the option of printing directly or viewing a Print Preview.
Selecting the copy icon allows the results to be pasted directly into other programmes (e.g. a spreadsheet) for further data manipulation or editing.
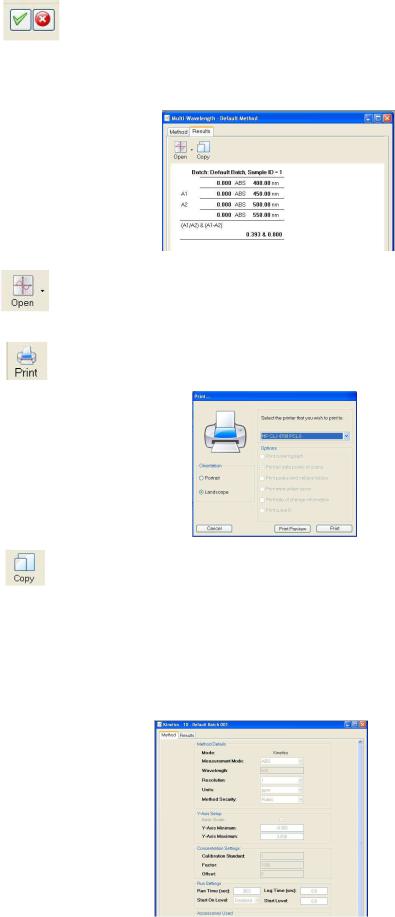
Multi-Wavelength
The multi-wavelength screen displays two tabs Methods and Results.
The Method tab displays the Method Details, Wavelengths, Accessories Used (if any) and
Information of the multi-wavelength measurement.
Selecting the edit sum icon allow the Measurement Mode, Method Security,
Sum, Primary and Secondary wavelengths to be edited.
Measurement Mode can be set as either %T or Absorbance. The Method Security can be set to
Private, Public or Read-Only. Sum can be altered to select one of the three available multi-wavelength equations and the Primary and Secondary Wavelengths can be altered to any recorded wavelength.
After inputting the required parameters select the tick icon to save the changes or the cross icon to cancel
The Results tab displays the data of the multi-wavelength measurement alongside the results of the Sum calculation.
Selecting the open icon allows access to the other results saved in the method.
Selecting the print icon opens the Print box. This allows the user to choose the printer, the orientation of the printout and gives the option of printing directly or viewing a Print Preview.
Selecting the copy icon allows the results to be pasted directly into other programmes (e.g. a spreadsheet) for further data manipulation or editing.
Kinetics
The kinetics screen displays two tabs Methods and Results.
The Method tab displays the Method Details, Y-Axis Set-up, Concentration Settings, Run Settings, Accessories Used (if any) and Information of the kinetics measurement.

The Results tab displays the chosen result.
Selecting the rate of change icon displays the following screen. Entering the required Start Time and End Time automatically updates the Measurement, Mean, X and Y calculations.
Alternatively holding down the left mouse button and dragging over the desired area edits the Start Time and End Time. To return to the original Result tab screen select Hide.
Selecting the zoom in icon displays the green ‘zoomarea’ on the spectrum. Placing this over the desired area and clicking the left mouse button will zoom in to the green highlighted area. This process can be repeated up to four times. Once zoomed in it is possible to return to the previous zoom level by selecting the zoom out icon.
Selecting the print icon opens the Print box. This allows the user to choose the printer, the orientation of the printout, what data is displayed on the printout and gives the option of printing directly or viewing a Print Preview.
Selecting the copy icon allows the results to be pasted directly into other programmes (e.g. a spreadsheet) for further data manipulation or editing.
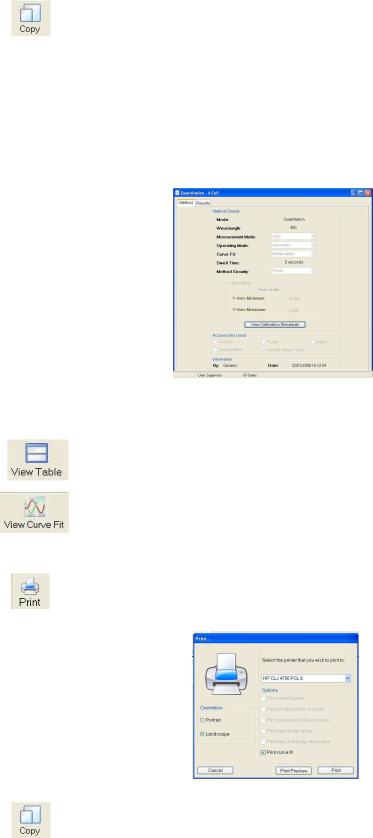
Quantitation
The quantitation screen displays two tabs Methods and Results.
The Method tab displays the Method Details, Y-Axis Set-up, Accessories Used (if any) and Information of the kinetics measurement. By clicking on View Calibration Standards the calibration standards used in the result are displayed.
The Results tab displays the calculated concentrations in a table or displays the curve fit.
Selecting the view table icon displays the calculated concentrations in a table
Selecting the view curve fit icon displays the curve fit.
Selecting the print icon opens the Print box. This allows the user to choose the printer, the orientation of the printout, what data is displayed on the printout and gives the option of printing directly or viewing a Print Preview.
Selecting the copy icon allows the results to be pasted directly into other programmes (e.g. a spreadsheet) for further data manipulation or editing.
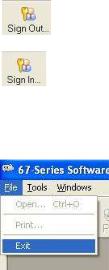
Signing Out & Logging In As A Different User
Once all of the required data processing has been completed select the sign out icon to return to the main 67-Series Software Suite screen.
Selecting the sign in icon opens the sign in dialogue box and allows other users to process their data (refer to the Getting Started section for sign in dialogue box details).
Exiting 67-Series Software Suite
Once all of the data has been processed select Exit from the File menu to exit the 67-Series Software Suite.

67 Series Spectrophotometers
Models 6700, 6705 & 6715
Operating Manual
670 005/REV D/11-11


Contents
|
|
Page |
Safety |
|
7 |
Guarantee |
8 |
|
Section 1 - Introduction |
|
|
1.1 |
Instrument Description |
9 |
1.2 |
Instrument Specifications |
10-11 |
1.3 |
Good Practice Guidelines |
11-12 |
Section 2 - Getting Started |
|
|
2.1 |
Unpacking |
13-14 |
2.2 |
Installation |
14-15 |
2.2.1 |
Location |
14 |
2.2.2 |
Supply voltage |
14 |
2.2.3 |
Mains connections |
14 |
2.2.4 |
Touch screen functions |
15 |
2.2.5 |
Toolbar icons |
16-20 |
2.2.6 |
Rear panel layout |
21 |
2.2.7 |
Power on and self tests |
22 |
Section 3 - Systems of Operation |
|
|
3.1 |
Multi-User and Free Operation |
23 |
3.2 |
Memory Structure |
23 |
3.2.1 |
Memory selection |
23 |
3.2.2 |
Memory Hierarchy |
24 |
3.3 |
Creating Methods |
24-25 |
3.4 |
File and Data Management |
25-26 |
Section 4 - Instrument Settings |
|
|
4.1 |
Menu Options |
27 |
4.2 |
Set Time & Date |
27 |
4.3 |
User Preferences |
27 |
4.3.1 |
Adjust User PIN |
28 |
4.3.2 |
Language |
28 |
4.3.3 |
Method View Settings |
28 |
4.3.4 |
Touch Screen Click |
29 |
4.3.5 |
Brightness |
29 |
4.3.6 |
Adjust Date & Time |
29 |
4.4 |
About |
30 |
4.5 |
Form Feed |
30 |
4.6 |
Administration Functions |
30 |
4.6.1 |
Instrument ID |
31 |
4.6.2 |
Screen Dump |
31 |
4.6.3 |
Modify Users |
31 |
4.6.3.1 |
Create New User |
32 |
4.6.3.2 |
Delete User |
32 |
4.6.3.3 |
Delete All Users |
32 |
4.6.3.4 |
Reset User PIN |
33 |
4.7 |
Memory Manager |
33 |
1

Section 5 - Photometrics Mode |
|
|
5.1 |
Principles of Measurement |
34 |
5.2 |
Free Operation |
34-37 |
|
Setting Method ID |
35 |
|
Setting Wavelength |
36 |
|
Setting Method Security |
36 |
|
Setting Batch ID |
36 |
|
Auto Log Settings… |
37 |
5.3 |
Logged In Measurement |
38-41 |
|
Creating a New Method |
39 |
|
Setting Method ID |
39 |
|
Setting Wavelength |
39 |
|
Setting Method Security |
40 |
|
Setting Batch ID |
40 |
|
Auto Log Settings… |
41 |
|
File & Data Management |
42-43 |
5.4 |
Performing Measurements – all users |
44 |
|
Zeroing the Instrument |
44 |
|
Measuring the Sample |
44 |
Section 6 - Spectrum Mode |
|
|
6.1 |
Principles of Measurement |
45 |
6.2 |
Free Operation |
45-52 |
|
Setting Method ID |
46 |
|
Selecting Measurement Mode |
46 |
|
Setting Wavelengths (Start & End) |
47 |
|
Selecting Plot Interval |
48 |
|
Setting Method Security |
49 |
|
Setting Additional Set-up Parameters using the Toolbar Icons |
49-52 |
|
Setting Analysis Points |
49 |
|
Setting Auto-Scale |
50 |
|
Selecting Plot Colour |
50 |
|
Selecting Axis Colour |
51 |
|
Setting Batch ID |
51 |
|
Setting Graph Data Points |
51 |
|
Selecting Printer Media |
52 |
|
Auto Log Settings… |
52 |
6.3 |
Logged In Measurement |
53-56 |
|
Creating a New Method |
54 |
|
Setting Method ID |
54 |
|
Selecting Measurement Mode |
54 |
|
Setting Wavelengths (Start & End) |
55 |
|
Selecting Plot Interval |
56 |
|
Setting Method Security |
56 |
|
Setting Additional Set-up Parameters using the Toolbar Icons |
57-60 |
|
Setting Analysis Points |
57 |
|
Setting Auto-Scale |
58 |
|
Selecting Plot Colour |
58 |
|
Selecting Axis Colour |
59 |
|
Setting Batch ID |
59 |
2
|
Setting Graph Data Points |
59 |
|
Selecting Printer Media |
60 |
|
Auto Log Settings… |
60 |
|
File & Data Management |
61-62 |
6.4 |
Performing Measurements – all users |
63-69 |
|
Performing a Scan |
63 |
|
Peforming a Baseline |
63 |
|
Scanning the Sample |
63-64 |
|
Analysing the Scan |
64-65 |
|
Area Under Curve |
65 |
|
Co-ordinate Tagging |
66 |
|
Auto Peak & Valley Tagging |
66-67 |
|
Obtaining Derivative Spectra |
67 |
|
Overlaying Scans |
68 |
|
Adding or Subtracting Spectra |
69 |
Section 7 - Multi-Wavelength Mode |
|
|
7.1 |
Principles of Measurement |
70 |
7.2 |
Free Operation |
70-75 |
|
Setting Method ID |
71 |
|
Selecting Measurement Mode |
72 |
|
Selecting Sample Style |
72 |
|
Setting Method Security |
72 |
|
Setting Wavelengths |
73 |
|
Calculations |
73 |
|
Sum |
73-74 |
|
Setting Batch ID |
74 |
|
Selecting Printer Media |
74 |
|
Auto Log Settings... |
75 |
7.3 |
Logged In Measurement |
76-83 |
|
Creating a New Method |
77 |
|
Setting Method ID |
77 |
|
Selecting Measurement Mode |
77 |
|
Selecting Sample Style |
78 |
|
Setting Method Security |
78 |
|
Setting Wavelengths |
79 |
|
Calculations |
79 |
|
Sum |
79-80 |
|
Setting Batch ID |
80 |
|
Selecting Printer Media |
80 |
|
Auto Log Settings… |
81 |
|
File & Data Management |
82-83 |
7.4 |
Performing Measurements – all users |
84 |
Section 8 - Kinetics Mode |
|
|
8.1 |
Principles of Measurement |
85 |
8.2 |
Free Operation |
85-93 |
|
Setting Method ID |
86 |
|
Setting Wavelength |
87 |
|
Selecting Measurement Mode |
87 |
|
Run Settings… |
87-89 |
3

|
Setting Run Time |
88 |
|
Setting Lag Time |
88 |
|
Setting Start On Level |
88 |
|
Setting Start Level |
89 |
|
Setting Method Security |
89 |
|
Standard |
89 |
|
Factor |
90 |
|
Selecting Resolution |
90 |
|
Selecting Units |
90 |
|
Setting Auto-Scale |
91 |
|
Selecting Axis Colour |
91 |
|
Setting Batch ID |
92 |
|
Setting Graph Data Points |
92 |
|
Selecting Printer Media |
92 |
|
Auto Log Settings… |
93 |
8.3 |
Logged In Measurement |
94-104 |
|
Creating a New Method |
95 |
|
Setting Method ID |
95 |
|
Setting Wavelength |
95 |
|
Selecting Measurement Mode |
96 |
|
Run Settings… |
96-97 |
|
Setting Run Time |
96 |
|
Setting Lag Time |
97 |
|
Setting Start On Level |
97 |
|
Setting Start Level |
97 |
|
Setting Method Security |
98 |
|
Setting Concentration Parameters |
98-99 |
|
Standard |
98 |
|
Factor |
99 |
|
Selecting Resolution |
99 |
|
Selecting Units |
99 |
|
Setting Auto-Scale |
100 |
|
Selecting Axis Colour |
100 |
|
Setting Batch ID |
101 |
|
Setting Graph Data Points |
101 |
|
Selecting Printer Media |
101 |
|
Auto Log Settings… |
102 |
|
File & Data Management |
103-104 |
8.4 |
Performing Measurements – all users |
105 |
Section 9 - Quantitation Mode |
|
|
9.1 |
Principles of Measurement |
106 |
9.2 |
Free Operation |
106-113 |
|
Setting method ID |
107 |
|
Selecting Measurement Mode |
108 |
|
Setting Wavelength |
108 |
|
Selecting Resolution |
108 |
|
Selecting Units |
109 |
|
Replicates Setup… |
109 |
|
Setting Method Security |
109 |
|
Selecting Calibration Standards |
110 |
4

|
Setting Curve Fit |
110 |
|
Setting Auto Scale |
111 |
|
Selecting Plot Colour |
111 |
|
Selecting Axis Colour |
112 |
|
Setting Batch ID |
112 |
|
Setting Graph Data Points |
112 |
|
Selecting Printer Media |
113 |
|
Auto Log Settings… |
113 |
9.3 |
Logged In Measurement |
114-123 |
|
Creating a New Method |
115 |
|
Setting Method ID |
115 |
|
Selecting Measurement Mode |
115 |
|
Setting Wavelength |
116 |
|
Selecting Resolution |
116 |
|
Selecting Units |
116 |
|
Replicates Setup… |
117 |
|
Setting Method Security |
117 |
|
Selecting Calibration Standards |
118 |
|
Setting Curve Fit |
118 |
|
Setting Auto Scale |
119 |
|
Selecting Plot Colour |
119 |
|
Selecting Axis Colour |
120 |
|
Setting Batch ID |
120 |
|
Setting Graph Data Points |
120 |
|
Selecting Printer Media |
121 |
|
Auto Log Settings… |
121 |
|
File & Data Management |
122-123 |
9.4 |
Performing Measurements – all users |
124 |
|
Post Quantitation Tools |
125 |
Section 10 - Fitting & Using Alternative Modules/Accessories |
|
|
10.1 |
Integral Printer Unit |
126 |
10.2 |
Cell Holder Modules |
127 |
10.3 |
Automatic 8 & 6 Cell Changer Modules |
128-132 |
10.4 |
Sipper Pump Module |
133-139 |
10.5 |
Peltier Module |
140-142 |
10.6 |
Sipper/Peltier Module |
143-151 |
Section 11 - Maintenance & Troubleshooting |
|
|
11.1 |
General |
152 |
11.2 |
Light Source Replacement |
152-155 |
|
Tungsten lamp – Model 6700 |
153 |
|
Flash lamp module – Models 6705/6715 |
154-155 |
SECTION 12 - Declaration of Conformity |
156-158 |
|
Glossary of Icons |
159-161 |
|
5

6

Safety
This is important information; please read carefully before installing or using this instrument.
1.The 67 Series Spectrophotometers are designed for operation by trained personnel who are aware of the principles and applications involved. For further help and advice please contact your local distributor, e-mail sales@jenway.com or visit www.jenway.com
2.The spectrophotometer is a sensitive electronic and optical instrument designed for use in a laboratory environment. Careful adherence to the installation instructions must be observed. If in doubt contact a relevant and competent authority for advice before proceeding.
3.In addition to observing the instructions detailed in the Operating Manual and Service Manual for this instrument all installation, operating and service personnel must be aware of, and employ, a safe system of work.
4.Voltage levels hazardous to life are present in this instrument, for personal safety only trained engineers aware of the risk and avoidance of electric shock should remove protective covers from the instrument.
5.This instrument is designed for minimal maintenance, which must be carried out carefully following the procedures detailed in this manual. All safety instructions in these procedures, as well as those defined locally for the area or environment where the work is being carried out must be observed.
6.Other than for those items defined in the maintenance procedures herein there are no user serviceable items in this instrument. Removal of covers and attempted adjustment or service by unqualified personnel will invalidate any warranty and incur additional charges for repair.
7.Reference should always be made to the Health and Safety Data for any chemicals or reagents used. All available information, advice and warnings on the handling, storage, use and disposal of such must be carefully observed. When not available this data must be requested from the supplier before proceeding in any way.
8.It is important that good laboratory practice is observed when handling samples, chemicals, reagents and ancillary equipment in order to carry out measurement and analysis with this instrument. Suitable safety and personal protective equipment must be used at all times.
9.If it is suspected that safety protection has been impaired in any way, the spectrophotometer must be made inoperative and secured against any intended operation. The fault condition must be reported to the appropriate servicing authority. In all such reports the model number and serial number of the spectrophotometer must be quoted.
7

Guarantee
Please read this important guarantee information:
Notwithstanding the description and specification(s) of the instruments contained in the Operating Manual, Jenway hereby reserves the right to make changes as it sees fit to the instruments or to any components of the instruments.
This Manual has been prepared solely for the convenience of Jenway customers and nothing in this Manual shall be taken as a warranty, condition or representation concerning the description, merchantability, fitness for purpose, or otherwise of the instruments or components.
The 67 Series spectrophotometers are guaranteed for a period of 3 years from the date of purchase.
Within this period we undertake to supply replacements free of charge for parts that may on examination prove to be defective, provided that the defect is not the result of misuse, accident or negligence.
On all correspondence, please quote the model and serial number in full and/or the sales order number.
Any instrument requiring service under this guarantee should be taken to the supplier through whom it was purchased, or, in the case of difficulty, it should be carefully packed in its original packaging and consigned, carriage paid, to us. Jenway takes no responsibility for returned goods damaged in transit.
Returned goods will not be processed without a Returns Authorisation Number.
Call the Service Administrator +44 (0) 1785 810475 for the relevant documentation.
Please write the Returns Number on the outside of any packaging and ensure that a copy of a Decontamination Certificate is visible.
Please register online www.jenway.com or complete and return the Registration Document by fax or mail.
The Guarantee will be rendered invalid if any specified non-serviceable parts within the instrument are tampered with (i.e. the monochromator).
8

Section 1 - Introduction
1.1Instrument Description
The 67 Series offer a range of unique features and functions to help in the management of methods and data at both individual and multi-user levels.
These units have a specially designed user interface based on a high quality, colour TFT LCD with touch screen technology and QWheel™ support to provide ease-of-use for all operations from set-up to measurement and data handling.
Five main measuring modes are available: Photometrics, Spectrum, Kinetics, Quantitation and
Multi-Wavelength.
The 67 Series have dual memory options that enable you to store settings and data to either internal memory or on a removable SD/Multi-Media memory card. By saving to the removable SD card all settings, methods and results specific to the user can be retained by the individual, offering additional security and allowing easy transfer of data to a PC for storage, manipulation or off-line review. The SD card can also be used in any similar model, giving complete flexibility to use any available instrument. A simple back-up procedure enables easy transfer of all information from the internal memory to the removable media while quickly enabling a group of instruments to be cloned with identical settings.
It is possible for any user to perform simple measurements (Free Operation) at any time, however, logging-in with your own PIN code will allow you to create methods, change settings or store results. Each method can be designated as Public (for open user access), Read-Only (available for all users as read-only information) or Personal (only accessed through your PIN code).
A number of sampling accessories are available as complete, easily interchangeable modules. These include a Sipper Pump, Sipper/Peltier, Automatic Cell Changer, plus a comprehensive range of passive cuvette and test tube holders, which can be fitted in the single cell holder accessory.
The PC Software supplied enables the transfer of data from the instrument or SD card to the PC with rapid copy and paste into spreadsheets or other computer programmes.
QWheel is a registered trademark of Quantum Research
9

1.2Instrument Specifications Technical Specification
|
6700 |
6705 |
6715 |
Light Source |
Tungsten Halogen |
Xenon |
Xenon |
Spectral Bandwidth |
4nm |
4nm |
1.5nm |
Stray Light |
<0.1% at 340nm |
<0.05% at 220nm <0.05% at 220nm |
|
Wavelength Range |
320-1100nm |
190-1100nm |
190-1100nm |
Common Specifications |
|
|
|
Optics |
Sealed, MgF Coated, Split Beam |
|
|
Wavelength Resolution |
0.1nm |
|
|
Wavelength Accuracy |
±1.0nm |
|
|
Wavelength Repeatability |
±0.2nm |
|
|
Photometric Ranges |
-0.300 to 3.000A & 0 to 199.9%T |
|
|
Photometric Resolution |
0.001A & 0.1%T |
|
|
Photometric Accuracy |
±0.005 at 1A |
|
|
Photometric Stability |
<0.001A per hour |
|
|
Quantitation Range |
-99999 to +99999 |
|
|
Number of Standards |
20 with up to 5 replicates of each |
|
|
Curve Fit Algorithms |
Linear, Quadratic and Cubic Functions |
|
|
Multi-wavelength Data Points |
Up to 4 wavelengths |
|
|
Calculations |
Difference and ratio |
|
|
Kinetics Time Limits |
30 to 9999 seconds |
|
|
Kinetics Calibration |
Standard or factor |
|
|
Scan Speed |
1500nm/minute at 0.1nm data steps |
|
|
Post Scan Analysis |
Peak/Valley pick, Peak Ratios, Area, Zoom, Wavelength Table, |
||
|
Derivatives, Smoothing |
|
|
Configuration |
Secure Multi-User and Free Access |
|
|
Number of Users |
10 + Supervisor |
|
|
Number of Methods |
>500 (on internal flash memory or removable media) |
||
Results Storage |
>500 (on internal flash memory or removable media) |
||
Removable Media |
MM/SD Memory Card or SD/USB memory card |
||
Interface |
USB, Centronics, Analogue |
|
|
PC Software |
Supplied on CD-ROM with USB interface cable |
||
Mains Supply |
100 to 230V ac 50 or 60Hz |
|
|
Sample Compartment |
150mm (max. height) x 130mm (w) x 210mm (d) |
||
Size |
490x390x220mm |
|
|
Weight |
7.5Kg |
|
|
10

Environmental Operating Conditions:
The 67 Series is designed to work safely under the following conditions:
Temperature |
15 to 40ºC |
Humidity |
0 to 90%RH |
Accessory Specifications |
|
Peltier |
|
Temperature Range: |
20 to 50° C or 68 to 122° F |
Temperature Resolution: |
0.1° C or 1° F |
Accuracy: |
±0.5° C |
Stability: |
±0.3° C |
Red/Green Window: |
±0.5° C |
Sipper Pump |
|
Modes: |
|
Continuous Aspiration |
Flow rate dependent on tube ID. |
|
(12ml/min with supplied tube) |
Timed aspiration |
sample/air-gap/wash |
sample volumes |
75µl min / 9.5ml max. |
segment run time |
48 secs max. |
Memory |
Non-volatile |
1.3Good Practice Guidelines
1.For optimum performance all spectrophotometers should be sited in a clean, dry, dust free atmosphere. When in use ambient temperature and light levels should remain as constant as possible.
2.Adherence to Standard Operating Procedures (SOP) and Good Laboratory Practice (GLP) should be monitored with regular calibration checks and a suitable Quality Control (QC) programme.
3.The sample chamber lid must be fully closed during measurement and before any readings are recorded or printed.
4.The correct selection of sample containers is imperative for accurate and reproducible results:
a)Check that the material of the sample container is compatible with the wavelengths to be used for measurement. In general glass can only be used down to 360nm or 320nm depending on quality. Standard plastic cuvettes can be used down to 320nm. Special UV versions can be used down to 260nm. Below this level quartz cuvettes must be used.
b)Plastic disposable cuvettes should be used ONCE only.
c)Glass cuvettes should be thoroughly cleaned after use. Discard when scratches become evident in optical surfaces.
d)Care should be taken when selecting semi-micro or micro cuvettes. The cuvette window on the inner chamber (the area filled with sample) must be wider than the aperture in the sample holder or light will reach the detector without passing through the sample. In this case, semi-micro or micro cuvettes with self-screening black surrounds must be used or alternative holders for these cuvettes fitted.
e)Glass test tubes and other sample tubes should be used with care. Where possible, matched tubes should be used and any index mark set to the correct position before measurements are made.
f)Ensure any sample containers used are compatible with the constituents of both the samples and standards they are to hold. Plastic cuvettes are not compatible with organic solvents.
11

g)All sample containers must be handled with care; by the top and non-optical surfaces only. Any finger marks evident must be removed using a suitable cleaning process.
h)Flow-through cuvettes must be selected with care and consideration for the sample type, sample volume, pumping system, rinse, sample and waste handling to be used.
5.Samples and standards should not be stored in open cuvettes or sample containers as evaporation will change the value and lead to staining of the walls which may be irreversible. If stored in stoppered and sealed cuvettes, they should be filled with little or no air space and the values regularly checked against a reference standard or quality control material.
6.Cold samples should be allowed to equilibrate to ambient temperature before measurement (unless a suitable temperature controlled sample holder is in use). Temperature change during measurement may cause air bubbles to form on the walls of the sample holder. This is a common cause of drift during measurement.
7.In the preparation of samples and standards high grade borosilicate glass and AR grade chemicals and reagents must be used. Good quality deionised water or other suitable solvent must be used for dissolving or diluting samples, chemicals and reagents.
8.All measurements require calibration to a blank, for maximum accuracy this should be prepared with care using the same deionised water or solvent used for dissolving or diluting the sample. Where reagents are added to the sample to produce a colour proportional to its concentration a ‘sample based’ blank should be used. In this case the blank should consist of the sample plus any reagents or chemicals to be used, except those that produce the colour to be measured.
9.Deviations from the Beer-Lambert Law may occur at high and low concentrations giving non-linear response during sample concentration measurements. For all new methods a linear range should be defined by the preparation of a calibration curve. The quantitation mode may be used to construct such a curve against which sample results are automatically measured.
10.Cuvettes and sample holders must be filled to a minimum level which covers the light path.
12
 Loading...