

Page 1

OPERATOR'S MANUAL
ELECTRONIC CHART
DISPLAY AND
INFORMATION SYSTEM
(ECDIS)
FMD-3200
FMD-3200-BB
Model
FMD-3300
www.furuno.com
Page 2

The paper used in this manual
9-52 Ashihara-cho,
A:APR
2012
.
E1:FEB.09, 2015
Pub. No.
(
)
Nishinomiya, 662-8580, JAPAN
is elemental chlorine free.
・FURUNO Authorized Distributor/Dealer
All rights reserved.
DAMI
FMD-3200/3200BB/3300
Printed in Japan
OME-44730-E1
0 0 0 1 7 6 1 2 5 1 4
Page 3

IMPORTANT NOTICES
General
• This manual has been authored with simplified grammar, to meet the needs of international users.
• The operator of this equipment must read and follow the descriptions in this manual. Wrong operation or maintenance can cancel the warranty or cause injury.
• Do not copy any part of this manual without written permission from FURUNO.
• If this manual is lost or worn, contact your dealer about replacement.
• The contents of this manual and equipment specifications can change without notice.
• The example screens (or illustrations) shown in this manual can be different from the screens you
see on your display. The screens you see depend on your system configuration and equipment
settings.
• Save this manual for future reference.
• Any modification of the equipment (including software) by persons not authorized by FURUNO will
cancel the warranty.
• All brand and product names are trademarks, registered trademarks or service marks of their respective holders.
• “C-MAP” means “C-MAP by Jeppesen” in this manual.
How to discard this product
Discard this product according to local regulations for the disposal of industrial waste. For disposal
in the USA, see the homepage of the Electronics Industries Alliance (http://www.eiae.org/) for the
correct method of disposal.
How to discard a used battery
Some FURUNO products have a battery(ies). To see if your product has a battery, see the chapter
on Maintenance. Follow the instructions below if a battery is used. Tape the + and - terminals of
battery before disposal to prevent fire, heat generation caused by short circuit.
In the European Union
The crossed-out trash can symbol indicates that all types of batteries
must not be discarded in standard trash, or at a trash site. Take the
used batteries to a battery collection site according to your national
legislation and the Batteries Directive 2006/66/EU.
In the USA
The Mobius loop symbol (three chasing arrows) indicates that Ni-Cd
and lead-acid rechargeable batteries must be recycled. Take the used
batteries to a battery collection site according to local laws.
In the other countries
Cd
PbNi-Cd
There are no international standards for the battery recycle symbol. The number of symbols can
increase when the other countries make their own recycle symbols in the future.
i
Page 4
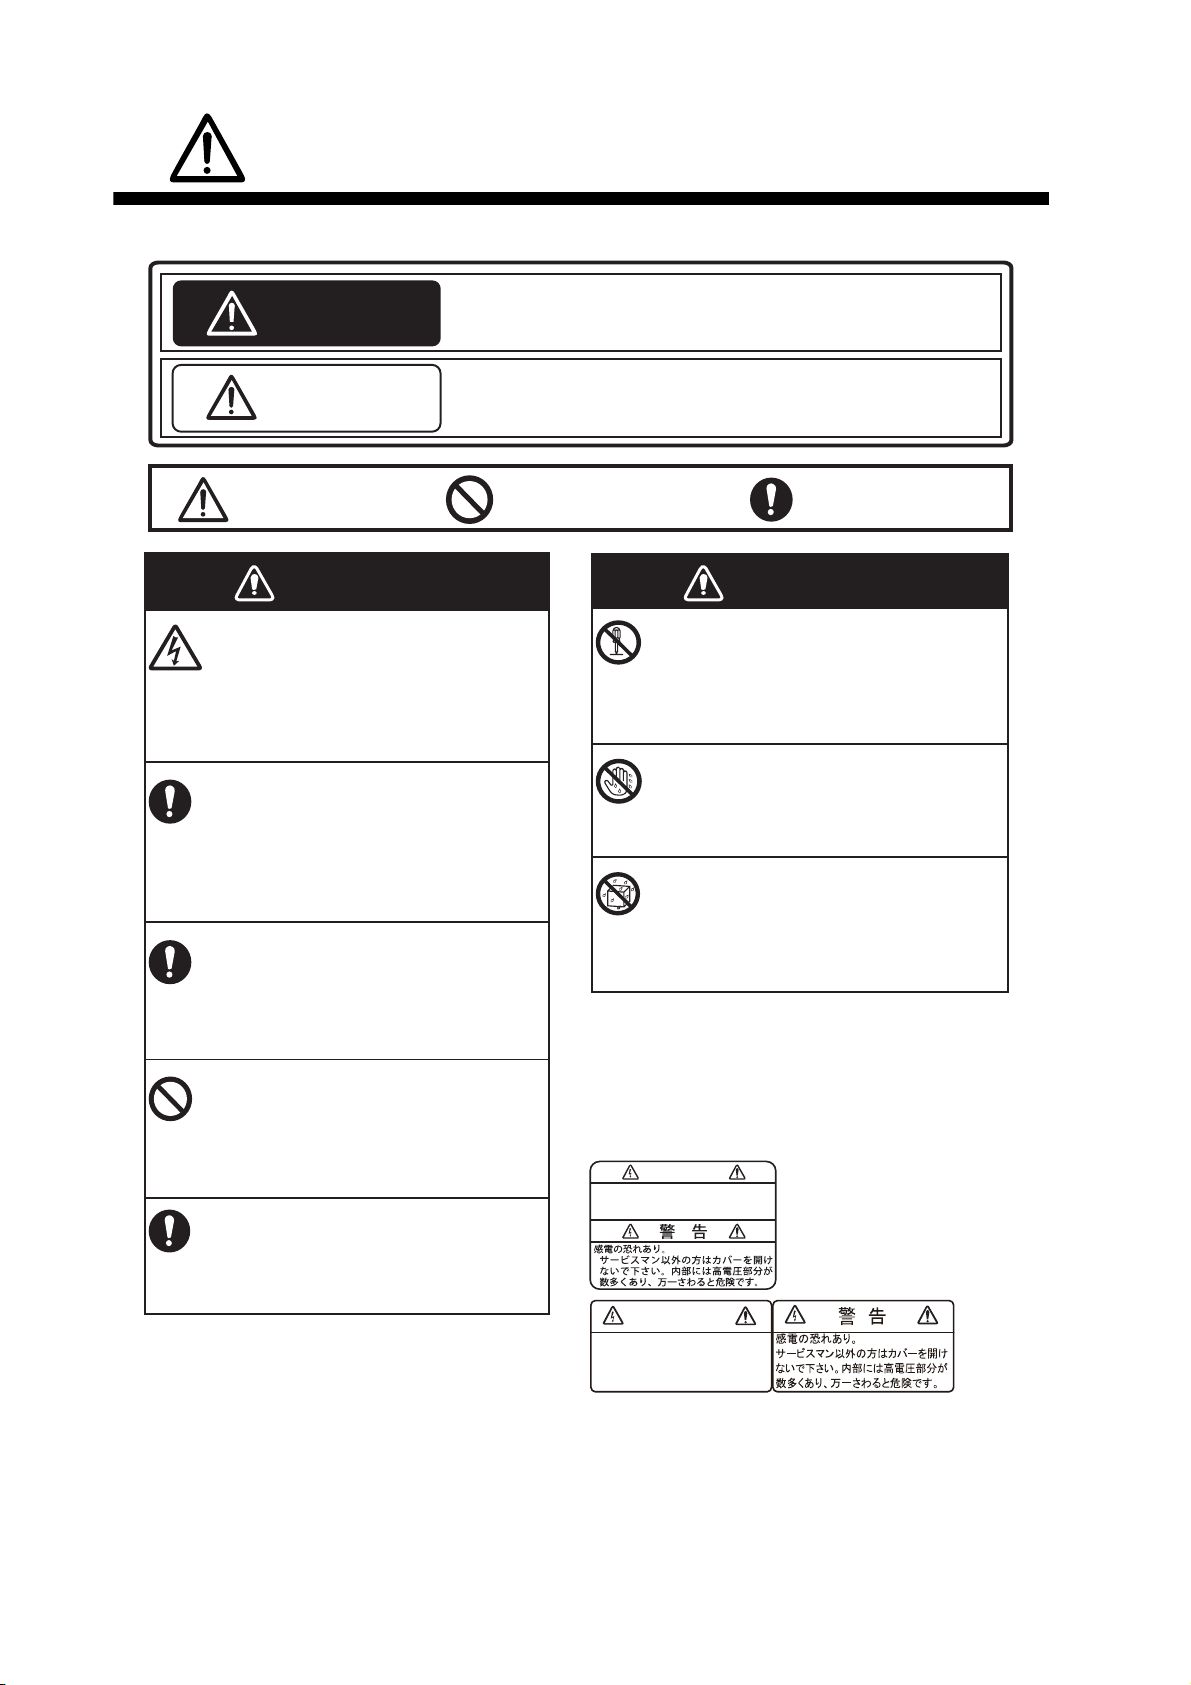
SAFETY INSTRUCTIONS
The operator must read the safety instructions before attempting to operate the equipment.
Indicates a potentially hazardous situation which, if not avoided,
WARNING
CAUTION
could result in death or serious injury.
Indicates a potentially hazardous situation which, if not avoided,
could result in minor or moderate injury.
Warning, Caution
Prohibitive Action
WARNING
Do not open the equipment.
This equipment uses high voltage that
can cause electrical shock.
Only qualified persons can work inside
the equipment.
Turn off power at switchboard if the
something is dropped inside the
equipment.
Fire or electrical shock can result if the
power remains on.
Turn off power at switchboard if the
equipment is emitting smoke or fire.
Fire or electrical shock can result if the
power remains on.
Do not place liquid filled containers
on the top of the equipment.
Fire or electrical shock can result if a
liquid spills into the equipment.
Use the correct fuse.
Use of a wrong fuse can cause fire
or damage the equipment.
Mandatory Action
WARNING
Do not dissassemble or modify the
equipment.
Fire, electrical shock or bodily injury can
result.
Do not operate the equipment with
wet hands.
Fire or electrical shock can result.
Keep the equipment away from areas
where contact with water is likely.
Fire or electrical shock can result if
water gets into the equipment.
Warning Label
Warning labels are attached to the Processor
Unit. Do not remove any label. If a label is
missing or damaged, contact a FURUNO
agent or dealer about replacement.
WARNING
To avoid electrical shock, do not
remove cover. No user-serviceable
parts inside.
WARNING
To avoid electrical shock,
do not remove cover.
No user-serviceable parts
inside.
Name: Warning Label (1)
Type: 86-003-1011-3
Code No.: 100-236-233-10
Name: Warning Label (2)
Type: 03-129-1001-3
Code No.: 100-236-743-10
ii
Page 5

TABLE OF CONTENTS
FOREWORD.................................................................................................................. xii
SYSTEM CONFIGURATION ........................................................................................xiv
1. INTRODUCTION.................................................................................................... 1-1
1.1 System Configuration ................................................................................................ 1-1
1.2 Processor Unit EC-3000............................................................................................ 1-1
1.3 How to Turn the Power On/Off .................................................................................. 1-2
1.4 The Standby Mode .................................................................................................... 1-2
1.5 ECDIS Control Unit RCU-024.................................................................................... 1-3
1.5.1 Control description......................................................................................... 1-3
1.6 Trackball Control Unit RCU-026 ................................................................................ 1-5
1.7 How to Select a Color Palette.................................................................................... 1-6
1.8 How to Adjust the Display Brilliance (FURUNO or Hatteland monitor)...................... 1-7
1.8.1 Manual brilliance adjustment......................................................................... 1-7
1.9 How to Select Sensor Settings .................................................................................. 1-8
1.10 How to Enter Ship Speed .......................................................................................... 1-9
1.11 How to Enter Heading ............................................................................................. 1-11
1.12 How to Mark MOB Position ..................................................................................... 1-12
1.13 How to Select Time Format, Set Local Time ........................................................... 1-13
1.14 How to Take a Screenshot of the Display ............................................................... 1-13
1.15 The Settings Menu .................................................................................................. 1-14
1.16 How to Manage User Profiles.................................................................................. 1-14
1.16.1 How to create a profile................................................................................. 1-14
1.16.2 How to disable a profile ............................................................................... 1-14
1.16.3 How to restore default settings to a profile .................................................. 1-14
1.16.4 How to activate a profile .............................................................................. 1-15
1.17 How to View ECDIS Software Version No., ECDIS System Information, and
Operator's Manual ................................................................................................... 1-15
1.18 Split Screen ............................................................................................................. 1-16
1.18.1 How to activate, deactivate the split screen ................................................ 1-16
1.18.2 Function availability ..................................................................................... 1-17
1.18.3 Split screen usage characteristics............................................................... 1-17
1.19 Tips.......................................................................................................................... 1-18
1.20 Printer Information ................................................................................................... 1-18
2. OPERATIONAL OVERVIEW................................................................................. 2-1
2.1 ECDIS Display........................................................................................................... 2-1
2.1.1 Electronic chart area...................................................................................... 2-2
2.1.2 Status bar ...................................................................................................... 2-4
2.1.3 InstantAccess bar.......................................................................................... 2-6
2.1.4 Sensor information box.................................................................................. 2-9
2.1.5 Own ship functions box ............................................................................... 2-10
2.1.6 Route information box ................................................................................. 2-11
2.1.7 Overlay/NAV Tools box ............................................................................... 2-12
2.1.8 Alert box ...................................................................................................... 2-12
2.1.9 Permanent warning box............................................................................... 2-12
2.1.10 EBL, VRM boxes ......................................................................................... 2-13
2.1.11 Context-sensitive menus ............................................................................. 2-13
2.1.12 How to enter alphanumeric data.................................................................. 2-14
2.2 How to Select the Operating Mode.......................................................................... 2-15
2.3 How to Select the ECDIS Operating Mode.............................................................. 2-16
2.4 How to Select the Chart Scale................................................................................. 2-16
iii
Page 6

TABLE OF CONTENTS
2.5 How to Select the Presentation Mode......................................................................2-17
2.6 Cursor Position Box .................................................................................................2-18
2.7 True Motion Reset.................................................................................................... 2-19
2.8 How to Control Route and User Charts in Voyage Navigation and
Voyage Planning Modes ..........................................................................................2-20
2.9 How to Use the VRM and EBL.................................................................................2-21
2.9.1 How to hide/show an EBL, VRM.................................................................. 2-21
2.9.2 How to measure the range and bearing....................................................... 2-21
2.9.3 How to select bearing reference ..................................................................2-21
2.9.4 EBL, VRM functions available with the context-sensitive menu...................2-22
2.10 Datum.......................................................................................................................2-23
2.10.1 General ........................................................................................................2-23
2.10.2 Paper charts.................................................................................................2-23
2.10.3 Electronic sea charts....................................................................................2-23
2.10.4 Positioning devices and datum ....................................................................2-23
2.10.5 ECDIS and datum ........................................................................................2-23
2.11 Set up Before Departure ..........................................................................................2-24
2.11.1 Updates before departure ............................................................................2-24
2.11.2 Create or update a route ..............................................................................2-24
2.11.3 How to check and prepare route to monitor .................................................2-26
2.11.4 Check configuration of navigation sensors ..................................................2-28
2.11.5 How to reset odometer and trip meter..........................................................2-29
3. HOW TO MANAGE CHARTS ............................................................................... 3-1
3.1 How to Install Public Keys for ENC Charts ................................................................3-1
3.2 How to Install ENC Licenses, Charts .........................................................................3-2
3.2.1 How to install an ENC license........................................................................ 3-2
3.2.2 How to install ENC charts ..............................................................................3-3
3.3 How to Install ARCS Licenses, Charts.......................................................................3-5
3.3.1 How to install an ARCS license......................................................................3-5
3.3.2 How to install ARCS charts ........................................................................... 3-6
3.4 How to Delete ENC, ARCS Licenses.........................................................................3-8
3.5 How to Read ENC Judgment Information ..................................................................3-8
3.6 How to Install C-MAP Charts .....................................................................................3-9
3.6.1 How to register the eToken............................................................................ 3-9
3.6.2 How to install the C-MAP database and licenses ..........................................3-9
3.6.3 How to generate, order and apply an update file ......................................... 3-12
3.7 How to Delete a C-MAP Database........................................................................... 3-13
3.8 How to Install C-MAP DL (Dynamic Licensing) Charts ............................................3-13
3.8.1 How to generate, order and apply an update file ......................................... 3-13
3.8.2 How to enable and set up the C-MAP DL .................................................... 3-14
3.9 How to Export a List of Charts .................................................................................3-14
3.10 How to Export a List of Specific Licenses ................................................................3-15
3.11 How to Show the ENC Permit, ARCS License......................................................... 3-15
3.12 How to Backup, Restore Licenses ...........................................................................3-15
3.13 How to View Permit Expiration Date ........................................................................3-16
3.14 How to Display Install/Update History ......................................................................3-17
3.15 Catalog of Chart Cells ..............................................................................................3-18
3.15.1 How to group chart cells...............................................................................3-20
3.15.2 How to view status of chart cells ..................................................................3-21
3.16 How to Open Charts................................................................................................. 3-22
3.17 How to Print Chart List, Cell Status List ...................................................................3-22
3.17.1 How to print the chart list..............................................................................3-22
3.17.2 How to print the cell status list......................................................................3-23
3.18 How to Delete Charts ...............................................................................................3-24
3.19 How to Show Publishers Notes for ENC Charts ......................................................3-24
iv
Page 7

TABLE OF CONTENTS
3.20 How to Find the Chart Type..................................................................................... 3-25
3.21 How to Update ENC, C-MAP Charts Manually........................................................ 3-25
3.21.1 How to insert update symbols ..................................................................... 3-26
3.21.2 How to delete update symbols .................................................................... 3-27
3.21.3 How to modify existing update symbols ...................................................... 3-27
3.22 How to Synchronize Chart Data .............................................................................. 3-28
3.22.1 How to select the units to synchronize ........................................................ 3-28
3.22.2 How to check synchronization status .......................................................... 3-29
3.22.3 Manual updates and synchronization.......................................................... 3-30
3.23 How to Reconvert All SENC Charts ........................................................................ 3-30
4. HOW TO CONTROL CHART OBJECTS ..............................................................4-1
4.1 How to Browse Your Charts ...................................................................................... 4-1
4.2 How to Control Visibility of Chart Objects.................................................................. 4-1
4.2.1 How to set value for shallow contour, safety depth, safety contour and
deep contour.................................................................................................. 4-1
4.2.2 Basic Setting menu........................................................................................ 4-3
4.2.3 Chart Display menu....................................................................................... 4-4
4.2.4 Display base.................................................................................................. 4-5
4.3 How to Control Visibility of Symbols, Features.......................................................... 4-5
4.3.1 General page................................................................................................. 4-5
4.3.2 Tracking page................................................................................................ 4-7
4.3.3 Route page.................................................................................................... 4-8
4.3.4 Mariner page ................................................................................................. 4-8
4.3.5 Targets page ................................................................................................. 4-9
4.4 Control of Predefined IMO Chart Display Settings .................................................. 4-10
5. VECTOR (S57) CHARTS....................................................................................... 5-1
5.1 Introduction to S57 Charts......................................................................................... 5-1
5.1.1 Definitions of terms........................................................................................ 5-2
5.1.2 Chart legend for S57 charts........................................................................... 5-2
5.1.3 Permanent warnings for S57 charts .............................................................. 5-3
5.2 Chart Viewing Dates and Seasonal Features of the S57 Chart ................................ 5-4
5.2.1 Introduction.................................................................................................... 5-4
5.2.2 How to approve and highlight S57 chart updates.......................................... 5-4
5.2.3 How to set Display date and Approved until dates........................................ 5-5
5.2.4 About chart viewing date dependency of S57 standard ................................ 5-5
5.3 Symbology Used in S57 Charts................................................................................. 5-6
5.3.1 Presentation library used for S57 chart features ........................................... 5-6
5.4 How to Find Information about S57 Chart Objects .................................................... 5-6
5.5 Admiralty Information Overlay (AIO).......................................................................... 5-8
5.5.1 Installation ..................................................................................................... 5-8
5.5.2 How to display the AIO.................................................................................. 5-8
5.5.3 Catalog of AIO cells....................................................................................... 5-9
5.5.4 How to find AIO chart object information..................................................... 5-10
5.5.5 How to select the information to display...................................................... 5-11
6. RASTER (ARCS) CHARTS ................................................................................... 6-1
6.1 ARCS Charts ............................................................................................................. 6-1
6.1.1 Chart legend of ARCS chart.......................................................................... 6-1
6.2 Datum and ARCS Charts .......................................................................................... 6-5
6.3 Permanent Warnings of ARCS.................................................................................. 6-5
6.4 ARCS Subscriptions .................................................................................................. 6-6
6.4.1 ARCS Navigator ............................................................................................ 6-6
6.4.2 ARCS license information.............................................................................. 6-6
v
Page 8

TABLE OF CONTENTS
7. C-MAP CHARTS ................................................................................................... 7-1
7.1 C-MAP Cartographic Service .....................................................................................7-1
7.2 How to Register the System at C-MAP Norway.........................................................7-1
7.3 How to Order Charts ..................................................................................................7-1
7.4 How to Apply for Licenses.......................................................................................... 7-1
7.5 Troubleshooting .........................................................................................................7-2
7.6 Chart Subscription Services.......................................................................................7-2
7.6.1 C-MAP Dynamic Licensing (DL) service........................................................ 7-2
7.6.2 What is ENC delivery? ................................................................................... 7-2
7.7 Chart Display.............................................................................................................. 7-3
7.7.1 Introduction ....................................................................................................7-3
7.8 Permanent Warnings .................................................................................................7-4
8. CHART ALERTS................................................................................................... 8-1
8.1 Chart Alerts ................................................................................................................8-2
8.1.1 How to set safety contour...............................................................................8-2
8.1.2 How to select objects used in chart alerts...................................................... 8-3
8.2 How to Activate Own Ship Check ..............................................................................8-4
8.3 Route Planning........................................................................................................... 8-5
8.3.1 Chart alerts for route planning........................................................................8-5
8.4 Route Monitoring........................................................................................................8-7
9. ROUTES................................................................................................................ 9-1
9.1 Route Planning Overview........................................................................................... 9-1
9.2 Main Menu for Route Planning................................................................................... 9-2
9.3 How to Create a New Route ......................................................................................9-2
9.3.1 How to use the Waypoints page ....................................................................9-4
9.3.2 How to use the User Chart page.................................................................... 9-5
9.3.3 How to use the Optimize page....................................................................... 9-6
9.3.4 How to use the Alert Parameters page .......................................................... 9-7
9.3.5 How to use the Check Results page.............................................................. 9-8
9.4 How to Modify an Existing Route ...............................................................................9-9
9.4.1 How to change waypoint position...................................................................9-9
9.4.2 How to change other waypoint data............................................................... 9-9
9.4.3 How to add a new waypoint at the end of a route.......................................... 9-9
9.4.4 How insert a waypoint ................................................................................. 9-10
9.4.5 How to delete a waypoint............................................................................. 9-10
9.4.6 Geometry check of route.............................................................................. 9-10
9.5 SAR Operations .......................................................................................................9-11
9.6 Route Bank ..............................................................................................................9-14
9.7 Route Optimization................................................................................................... 9-15
9.7.1 Available route optimization strategies.........................................................9-15
9.7.2 How to optimize a route ...............................................................................9-16
9.7.3 How to plan a speed profile..........................................................................9-17
9.8 How to Import Routes ..............................................................................................9-18
9.8.1 How to import FMD-3xx0, FCR-2xx9 route data.......................................... 9-18
9.8.2 How to import FEA-2x07 route data ............................................................ 9-18
9.8.3 How to import csv, ASCII format route data................................................. 9-19
9.9 How to Export Route Data .......................................................................................9-19
9.9.1 How to export FMD-3xx0 route data ............................................................ 9-19
9.9.2 How to export route data in FEA-2x07, csv, ASCII format........................... 9-20
9.10 How to Delete Routes ..............................................................................................9-20
9.11 Reports.....................................................................................................................9-21
vi
Page 9

TABLE OF CONTENTS
10. USER CHARTS ...................................................................................................10-1
10.1 Introduction.............................................................................................................. 10-1
10.1.1 Objects of user charts.................................................................................. 10-1
10.2 How to Create a User Chart .................................................................................... 10-2
10.3 How to Import a User Chart Created with ECDIS FEA-2x07................................... 10-6
10.4 How to Edit Objects on a User Chart....................................................................... 10-7
10.4.1 How to edit objects on the chart area.......................................................... 10-7
10.4.2 How to edit objects from the User Chart dialog box .................................... 10-7
10.5 How to Delete Objects from a User Chart ............................................................... 10-8
10.6 How to Select the User Chart Objects to Display ................................................... 10-8
10.7 How to Delete User Charts...................................................................................... 10-9
10.8 User Chart Reports.................................................................................................. 10-9
11. HOW TO MONITOR ROUTES.............................................................................11-1
11.1 How to Start Route Monitoring ................................................................................ 11-1
11.2 How to Stop Monitoring a Route (Manual, Automatic) ............................................ 11-3
11.3 How to Select What Parts of a Route to Display ..................................................... 11-3
11.4 How to View Waypoint Information.......................................................................... 11-4
11.5 How to View User Chart Information ....................................................................... 11-5
11.6 How to Change Monitored Route to Planned Route ............................................... 11-5
11.7 How to Use Instant Track to Return to or Deviate from Monitored Route ............... 11-6
11.7.1 Safe off track mode ..................................................................................... 11-6
11.7.2 Back to track mode...................................................................................... 11-7
11.7.3 Instant track messages................................................................................ 11-9
11.7.4 Instant track details.................................................................................... 11-10
11.7.5 How to monitor, stop monitoring an instant track route ............................. 11-10
11.7.6 How to return to a monitored route when following an instant track
route (safe off track mode only)................................................................. 11-12
11.7.7 Button label and equipment state.............................................................. 11-13
11.8 How to Share Route During Route Monitoring ...................................................... 11-14
12. NAVIGATION TOOLS .........................................................................................12-1
12.1 How to Access the Nav Tools in the Overlay/NAV Tools Box ................................. 12-1
12.2 Parallel Index (PI) Lines .......................................................................................... 12-2
12.2.1 How to activate, deactivate PI lines............................................................. 12-2
12.2.2 PI line bearing reference ............................................................................. 12-2
12.2.3 Number of PI lines to display....................................................................... 12-2
12.2.4 PI line mode................................................................................................. 12-2
12.2.5 How to adjust PI line orientation, PI line interval ......................................... 12-3
12.2.6 How to reset the PI lines.............................................................................. 12-3
12.2.7 How to adjust PI line length......................................................................... 12-4
12.3 Check Area.............................................................................................................. 12-5
12.4 Ring ......................................................................................................................... 12-5
12.5 Predictor .................................................................................................................. 12-6
12.6 Anchor Watch .......................................................................................................... 12-7
12.7 UKC (Under Keel Clearance) .................................................................................. 12-8
12.7.1 UKC overview.............................................................................................. 12-8
12.7.2 How to set UKC........................................................................................... 12-8
12.7.3 UKC window................................................................................................ 12-9
12.8 Divider ................................................................................................................... 12-10
12.8.1 How to use the divider............................................................................... 12-10
12.8.2 Usage characteristics, limitations .............................................................. 12-11
12.8.3 How to deactivate and erase the divider ................................................... 12-11
vii
Page 10

TABLE OF CONTENTS
13. TRACKED TARGET (TT) FUNCTIONS.............................................................. 13-1
13.1 How to Show, Hide TT .............................................................................................13-1
13.2 TT Symbols and TT Attributes .................................................................................13-2
13.2.1 TT symbols...................................................................................................13-2
13.2.2 TT symbol color and size .............................................................................13-2
13.3 TT CPA/TCPA Alarm ...............................................................................................13-3
13.3.1 How to set the CPA and TCPA limits, enable, disable the alarm.................13-3
13.4 Lost TT Alarm........................................................................................................... 13-3
13.4.1 How to enable, disable the lost TT alarm.....................................................13-3
13.4.2 How to set the lost TT alarm filter ................................................................13-4
13.5 How to Set Vector Length and Vector Motion ..........................................................13-4
13.6 How to Display TT Data ...........................................................................................13-6
13.6.1 How to display target data for individual TT .................................................13-6
13.7 Displaying Past Positions of TT ...............................................................................13-7
13.7.1 How to enable/disable the past position display, select past
position reference.........................................................................................13-7
13.7.2 Past position point attributes ........................................................................13-7
13.8 TT Source ................................................................................................................13-8
14. AIS TARGET FUNCTIONS................................................................................. 14-1
14.1 Introduction ..............................................................................................................14-1
14.2 AIS Symbols............................................................................................................. 14-2
14.3 Voyage Data ............................................................................................................14-4
14.4 How to Show, Hide AIS Targets............................................................................... 14-5
14.5 How to Filter AIS Targets .........................................................................................14-6
14.6 AIS CPA/TCPA Alarm ..............................................................................................14-6
14.7 Automatic Activation of Sleeping Targets ................................................................14-8
14.7.1 Enabling, disabling automatic activation of sleeping targets........................14-8
14.7.2 Conditions for automatic activation of sleeping targets................................14-8
14.8 How to Sleep All Activated Targets..........................................................................14-9
14.9 AIS Lost Target Alarm..............................................................................................14-9
14.9.1 How to enable, disable the AIS lost target alarm .........................................14-9
14.9.2 How to set the AIS lost target alarm filter...................................................14-10
14.10Vector Length, Vector Stabilization in True Motion Mode .....................................14-10
14.11How to Display AIS Target Data............................................................................14-11
14.12How to Display AIS Target Past Positions.............................................................14-13
14.12.1How to enable/disable the past position display, set past
position reference.......................................................................................14-13
14.13How to Display Own Ship Data .............................................................................14-13
15. AIS SAFETY, NAVTEX MESSAGES.................................................................. 15-1
15.1 AIS Safety Messages...............................................................................................15-1
15.1.1 How to send an AIS safety message ...........................................................15-1
15.1.2 How to manage received and sent AIS safety messages............................15-2
15.2 Navtex Messages..................................................................................................... 15-3
15.2.1 How to receive Navtex messages................................................................15-4
15.2.2 How to manage received Navtex messages................................................15-5
16. RADAR OVERLAY ............................................................................................. 16-1
16.1 Introduction ..............................................................................................................16-1
16.2 How to Setup the Radar Overlay .............................................................................16-2
16.3 Error Between Radar Echo Image and Chart ..........................................................16-3
16.4 Error Sources for Radar Echo Image and TT Mismatch ..........................................16-4
viii
Page 11

TABLE OF CONTENTS
17. WEATHER OVERLAY.........................................................................................17-1
17.1 What is the Weather Overlay?................................................................................. 17-1
17.2 How to Activate, Deactivate the Weather Overlay................................................... 17-1
17.3 How to Select, Playback a Weather Data File......................................................... 17-2
17.4 How to Set up the Weather Overlay ........................................................................ 17-3
17.5 Weather Overlay Examples..................................................................................... 17-5
17.5.1 Wind display ................................................................................................ 17-5
17.5.2 Temperature display.................................................................................... 17-6
17.5.3 Cloud coverage display ............................................................................... 17-6
17.5.4 Precipitation rate display ............................................................................. 17-6
17.5.5 Waves display ............................................................................................. 17-7
17.5.6 Ocean current display.................................................................................. 17-7
17.6 Weather Spot Information........................................................................................ 17-8
17.7 Summary of Weather Overlay Viewability, Operability and Operating Mode .......... 17-8
18. NAVIGATION SENSORS ....................................................................................18-1
18.1 CCRS ...................................................................................................................... 18-1
18.2 How to Select Navigation Sensors .......................................................................... 18-2
18.2.1 Sensors menu description........................................................................... 18-2
18.3 Source of Position ................................................................................................... 18-5
18.4 CCRP, System, Primary, Secondary and Pivot Positions of Own Ship................... 18-6
18.5 Source of Navigation Data....................................................................................... 18-7
18.6 Switching of Sensor and Indication ......................................................................... 18-9
18.7 Filter Status ............................................................................................................. 18-9
18.8 Position Alignment................................................................................................. 18-11
18.8.1 How to align position ................................................................................. 18-11
18.8.2 How to cancel position alignment.............................................................. 18-11
18.9 Wind Sensor .......................................................................................................... 18-12
18.10Depth Sensor........................................................................................................ 18-13
19. RECORDING, PLAYBACK FUNCTIONS............................................................19-1
19.1 How to Record User, Position Events ..................................................................... 19-1
19.1.1 User events ................................................................................................. 19-1
19.1.2 Position events ............................................................................................ 19-2
19.2 Details Log............................................................................................................... 19-5
19.3 Voyage Log ............................................................................................................. 19-6
19.3.1 How to set conditions for voyage logging.................................................... 19-7
19.4 Chart Usage Log ..................................................................................................... 19-8
19.5 Danger Targets Log................................................................................................. 19-9
19.5.1 How to set the conditions for logging danger targets ................................ 19-10
19.6 How to Playback the Log....................................................................................... 19-11
20. ALERTS ...............................................................................................................20-1
20.1 What is an Alert? ..................................................................................................... 20-1
20.2 Alert Box .................................................................................................................. 20-2
20.3 How to Temporarily Silence the Buzzer for an Alarm or Warning ........................... 20-5
20.4 How to Acknowledge an Alarm or Warning ............................................................. 20-5
20.5 Alert List................................................................................................................... 20-6
20.6 Alert Log .................................................................................................................. 20-8
20.7 Alert Reception from Connected Sensors ............................................................... 20-8
20.8 List of Alerts............................................................................................................. 20-9
21. PARAMETERS ....................................................................................................21-1
21.1 Ship and Route Parameters .................................................................................... 21-1
21.2 Forwarding Distances.............................................................................................. 21-2
ix
Page 12

TABLE OF CONTENTS
21.3 Cost Parameters ......................................................................................................21-3
21.4 Instant Track Parameters.........................................................................................21-4
22. CONNING AND MINI CONNING DISPLAYS ..................................................... 22-1
22.1 Conning Display .......................................................................................................22-1
22.2 Mini Conning Display ...............................................................................................22-9
23. SETTINGS MENU ............................................................................................... 23-1
23.1 How to Access the Settings Menu ...........................................................................23-1
23.2 File Export ................................................................................................................23-2
23.3 File Import ................................................................................................................23-3
23.4 File Maintenance......................................................................................................23-4
23.5 Self Test ...................................................................................................................23-5
23.6 Data Sharing ............................................................................................................23-6
23.7 Customize ................................................................................................................23-7
23.8 Display Test .............................................................................................................23-8
23.9 Keyboard Test..........................................................................................................23-9
23.10Screenshots...........................................................................................................23-11
23.10.1How to export screenshots......................................................................... 23-12
23.10.2How to delete screenshots.........................................................................23-12
23.11User Default...........................................................................................................23-13
23.12CCRP ....................................................................................................................23-14
24. MAINTENANCE AND TROUBLESHOOTING.................................................... 24-1
24.1 Maintenance............................................................................................................. 24-1
24.2 How to Replace the Fuse.........................................................................................24-2
24.3 Trackball Maintenance .............................................................................................24-3
24.4 How to Clean the Filter in the Processor Unit ..........................................................24-3
24.5 Troubleshooting .......................................................................................................24-4
24.6 Consumable Parts.................................................................................................... 24-5
24.7 Color Differentiation Test for S57 Charts .................................................................24-6
25. ALERT MANAGEMENT SYSTEM (option) ....................................................... 25-1
25.1 What is an Alert Management System (AMS)?........................................................ 25-1
25.2 System Configuration...............................................................................................25-1
25.3 Alert Definition, Priority and Category of Alerts........................................................25-1
25.4 Alert Category and Alert acknowledgement From Connected Equipment, AMS .....25-3
25.5 How to Acknowledge an Alert, Stop the Buzzer From the AMS ..............................25-3
25.6 About the ALR and ACK Sentences ........................................................................25-3
25.7 How an Alert is Transferred to the BNWAS .............................................................25-5
25.8 Change of Priority for Unacknowledged Warning ...................................................25-6
25.9 How to Temporarily Silence the Buzzer ...................................................................25-6
25.10Buzzer Patterns .......................................................................................................25-6
25.11Alert Priority, Alert State ..........................................................................................25-7
25.12Alert Icons................................................................................................................25-8
25.13AMS Mode Operations ............................................................................................25-9
25.13.1How to select the AMS mode.......................................................................25-9
25.13.2AMS mode windows................................................................................... 25-10
26. AUTOPILOT OPERATIONS ............................................................................... 26-1
26.1 Configuration............................................................................................................26-1
26.2 Controls....................................................................................................................26-2
26.2.1 EMRI FAP-2000 ...........................................................................................26-2
26.2.2 EMRI FAP-3000 ...........................................................................................26-4
26.2.3 TOKYO KEIKI PR-6000 ...............................................................................26-5
26.2.4 YOKOGAWA PT-500A.................................................................................26-9
x
Page 13

TABLE OF CONTENTS
26.3 Steering Modes ..................................................................................................... 26-10
26.3.1 EMRI FAP-2000, FAP-3000 ...................................................................... 26-10
26.3.2 TOKYO KEIKI PR-6000, YOKOGAWA PT-500A ...................................... 26-11
26.3.3 Summary of steering modes...................................................................... 26-13
26.4 Autopilot Functions at the ECDIS .......................................................................... 26-14
26.5 How to Select the ECDIS to Control the Autopilot................................................. 26-15
26.6 How to Activate, Deactivate the Track Control System (TCS) from the ECDIS .... 26-16
26.6.1 How to activate the TCS............................................................................ 26-16
26.6.2 How to deactivate the TCS........................................................................ 26-16
26.7 Route Steering Related Indications, Alerts and Messages Generated by ECDIS 26-17
26.7.1 Route steering related information in Route Information box .................... 26-17
26.7.2 Alerts and messages when precondition for route steering are
not complete.............................................................................................. 26-18
26.7.3 Alerts given when approaching a waypoint ............................................... 26-20
26.7.4 Other route steering indications and alerts................................................ 26-22
26.8 Route Steering Operations .................................................................................... 26-23
26.8.1 How to stop or change a pre-enabled turn in route steering ..................... 26-23
26.8.2 Collision avoidance maneuver in route steering........................................ 26-24
26.9 Steering Performance............................................................................................ 26-24
26.9.1 Expected steering performance for going ahead....................................... 26-24
26.9.2 Expected steering performance for turns .................................................. 26-25
26.9.3 Expected steering performance under critical failure ................................ 26-26
APPENDIX 1 MENU TREE .......................................................................................AP-1
APPENDIX 2 ABBREVIATIONS, SYMBOLS...........................................................AP-5
APPENDIX 3 DIGITAL INTERFACE ......................................................................AP-18
APPENDIX 4 DATA COLOR AND MEANING........................................................AP-31
APPENDIX 5 ALERT LIST ...................................................................................... AP-33
SPECIFICATIONS ..................................................................................................... SP-1
INDEX ......................................................................................................................... IN-1
xi
Page 14

FOREWORD
Congratulations on your choice of the FURUNO ECDIS (Electronic Chart Display and Information
System) FMD-3200, FMD-3200-BB, FMD-3300. We are confident you will see why the FURUNO
name has become synonymous with quality and reliability.
Since 1948, FURUNO Electric Company has enjoyed an enviable reputation for innovative and
dependable marine electronics equipment. This dedication to excellence is furthered by our extensive global network of agents and dealers.
This equipment is designed and constructed to meet the rigorous demands of the marine environment. However, no machine can perform its intended function unless installed, operated and
maintained properly. Please carefully read and follow the recommended procedures for operation
and maintenance.
Features
The FMD-3000 series ECDIS is the product of FURUNO’s extensive experience in computer technology and marine electronics. The ECDIS displays electronic charts, nav lines, TT data, AIS targets and other navigation data on a high-resolution 19-inch (FMD-3200) or 23.1-inch display
(FMD-3300). The FMD-3200-BB is supplied without a monitor, permitting use of the commercial
monitor of your choice.
The main features of this ECDIS series are
• Complies with IMO MSC.232(82), IMO A.694(17), IEC 61174 Ed. 3, IEC 61162-1 Ed. 4 2010-11,
IEC 61162-2 Ed. 1, IEC 62288, IEC 60945 Ed. 4.
• Continuous monitoring of ship’s position through multi-sensor Kalman filter processing using GPS,
DGPS, SDME.
• Route planning and route monitoring facilities.
• Radar image can be overlaid on electronic charts. (Requires FURUNO FAR-2xx7 or FCR-2xx9 series radar.)
• Grounding warnings, safe depth contours.
• Chart database loaded and updated using DVD ROMs or CD ROMs.
• Target data from TT (Tracked Target) and AIS transponder to aid in collision avoidance.
Standards Used in this Manual
• The keys and controls of the ECDIS Control Unit RCU-024 are shown in bold face; for example,
the ENTER key.
• The buttons on the InstantAccess bar and Status bar and menu items are shown in brackets; for
example, the [PLAN] button.
• Context-sensitive menus are available with many buttons and boxes and objects within the display
area. Right-click those items to display the related context-sensitive menu.
• Unless noted otherwise, "click" means to push the left button on a trackball module (in order to do
a function).
• There are two types of Control Units: ECDIS Control Unit RCU-024 (alphabet keyboard, controls,
trackball module) and Trackball Control Unit RCU-026 (trackball module only). Unless noted otherwise, "Control Unit" refers to the RCU-024.
• "Keyboard" refers to the alphabet keyboard of the ECDIS Control Unit RCU-024.
• The system can be operated with the controls of the ECDIS Control Unit or a trackball module. The
descriptions in this manual use the trackball module.
• The color mentioned in this manual are the default colors. Your colors may vary.
xii
Page 15

Program No.
ECDIS: 2450074-01.xx, Conning: 2450079-01.xx (xx is version no.)
Data protection scheme
FOREWORD
Product
FMD-3xx0 01.xx IEC 61174
Software
Version
Testing
Std.
Ed.3
Elec. Nav.
Chart (ENC)
S-57 Ed. 3.1,
S-57 Ed.
3.1.1, and S57 Maint.
Doc. (Cumulative) No. 8
Raster
Nav. Chart
(RNC)
S-61 Ed.1.0 S-52 PresLib
ECDIS
Presentation
Library
Ed.3.4
Data
Protection
Scheme
S-63
Ed.1.1.1
Virus Prevention
The ECDIS is not equipped with a virus checker. The ECDIS operates in real time; therefore, having a virus checker that periodically checks the equipment for viruses would increase the processing load, which can affect operation. However, you can avoid viruses by following the instructions
in this section.
When you update a chart
The PC and medium (USB flash memory, etc.) used to download and store an update for an existing chart or a new chart may be infected with a virus. Check the PC and the medium for viruses
with a commercial virus checker - BEFORE you connect them to the ECDIS. Be sure the virus
checker contains the latest virus definition files.
Network connection
The ECDIS receives and displays information from various navigation equipment and radar via a
LAN. A PC and other equipment connected to a network can carry viruses. To prevent the introduction of a virus to the LAN, DO NOT connect the ECDIS or HUB to an external network, including other shipboard LAN.
Do not install 3rd party programs in the ECDIS
Do not install any 3rd party software.
Open source software
This product includes software to be licensed under the GNU General Public License (GPL), GNU
Lesser General Public License (LGPL), BSD, Apache, MIT and others. The program(s) is/are free
software(s), and you can copy it and/or redistribute it and/or modify it under the terms of the GPL
or LGPL as published by the Free Software Foundation. Please access to the following URL if you
need source codes: https://www.furuno.co.jp/cgi/cnt_oss_e01.cgi.
This product uses the software module that was developed by the Independent JPEG Group.
Reverse engineering
Reverse engineering (reverse assemble, reverse compiler) of the software of this equipment is
strictly prohibited.
xiii
Page 16
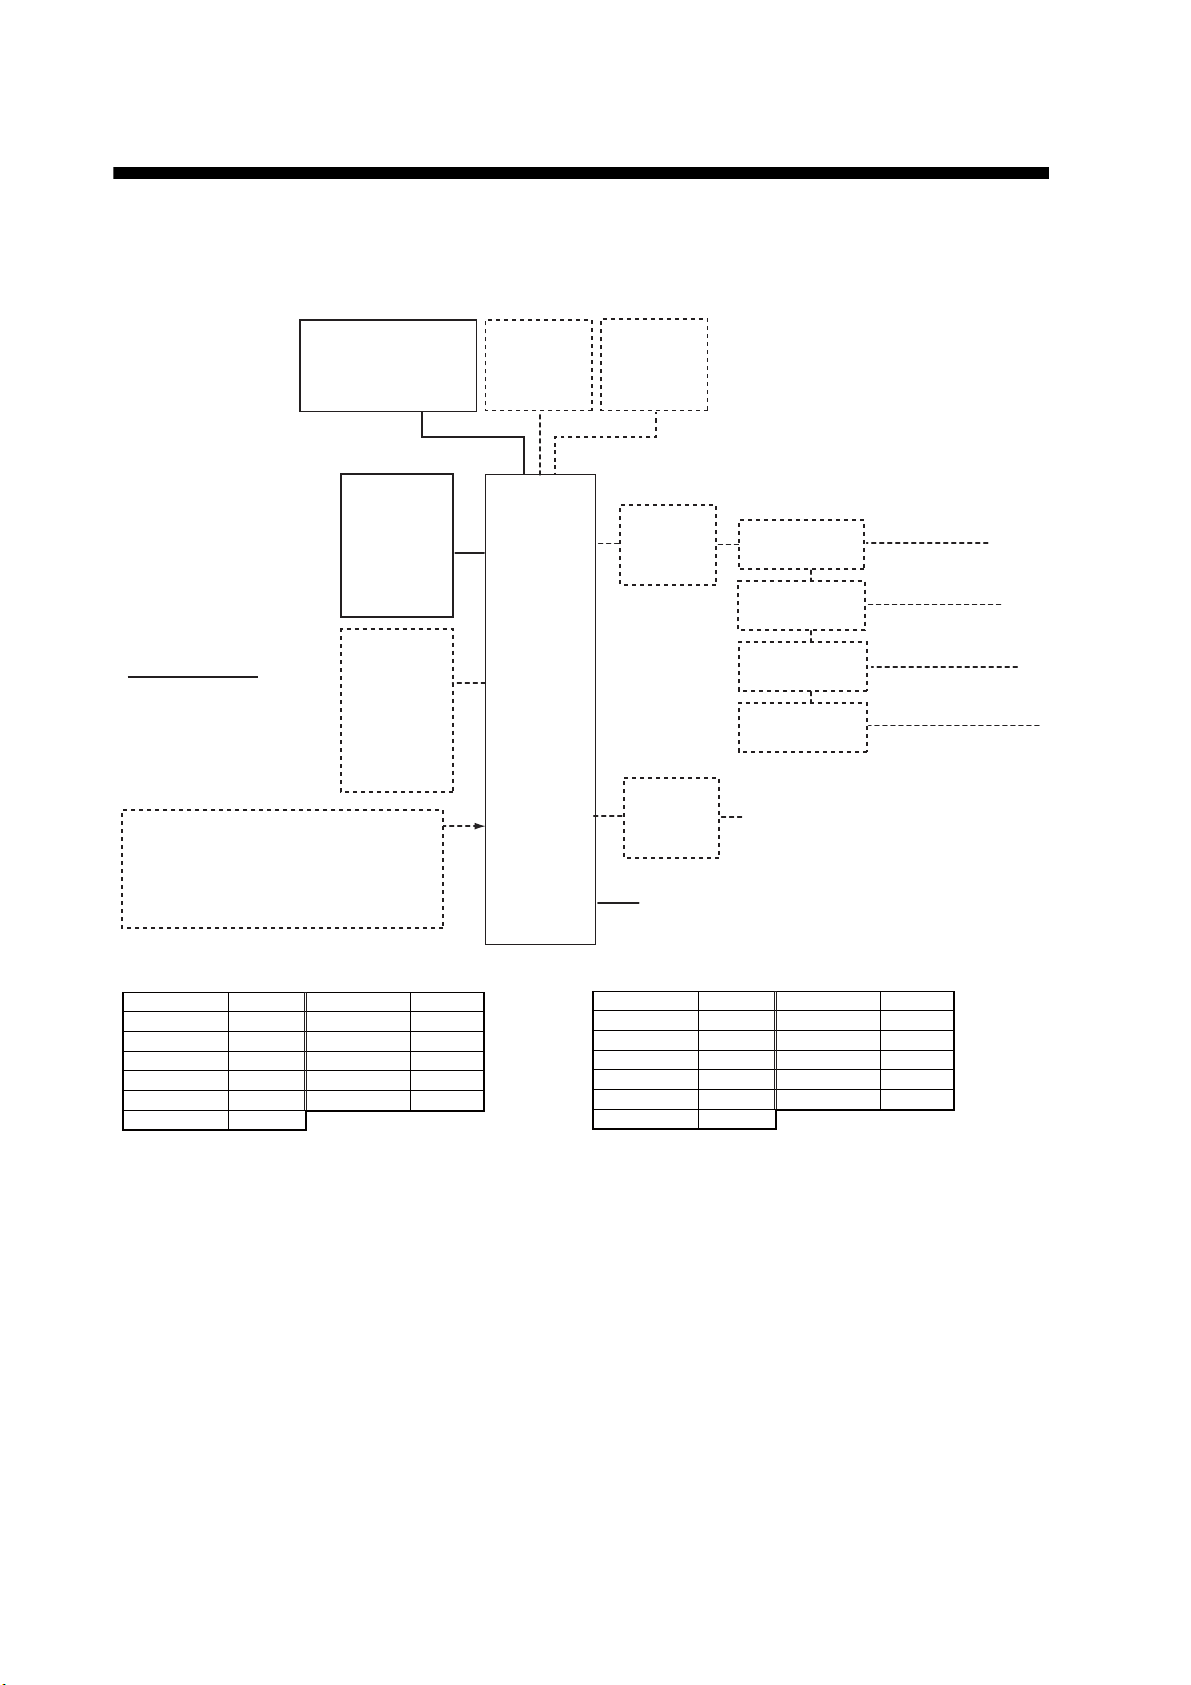
SYSTEM CONFIGURATION
Single workstation
Main Monitor Sub Monitor
Monitor Unit
MU-190
MU-231
HD26T21-MMD-MA4-FAGA
Monitor Unit
MU-190
MU-231
ECDIS
Control Unit
RCU-024
or
Trackball
Control Unit
RCU-026
ECDIS
Category of units
All units protected
from the weather.
Dashed lines indicate
optional or local supply
equipment.
Control Unit
RCU-024
or
Trackball
Control Unit
RCU-026
(Max. 2)
EC-3000
PROCESSOR
IF Signal:
- Serial Interface x2 (IEC 61162-1/2)
- Serial Interface x6 (IEC 61162-1)
- Digital Out x6
(power fail/system fail/ NO x2, NC x2)
- Digital In (ack in)
Note: The following monitors are
available with the FMD-3200-BB:
Model Maker Model Maker
MU-190 FURUNO JH23T12FUD Hatteland
MU-231 FURUNO JH23T14FUD Hatteland
MU-201CE FURUNO HD24T21MMD Hatteland
MU-231CE FURUNO JH26T11MMD Hatteland
JH19T14FUD Hatteland HD26T21MMD Hatteland
JH20T17FUD Hatteland
For information about a Hatteland monitor, see its
Operator’s Manual.
UNIT
Conning
Monitor
Monitor Unit
MU-190
MU-231
Switching
Hub
HUB-100
Sensor Adapter
MC-3000S
Sensor Adapter
Serial interface
Analog interface
MC-3010A
Sensor Adapter
Digital IN interface
MC-3020D
Sensor Adapter
Digital OUT interface
MC-3030D
Intelligent
Hub
HUB-3000
Gateway network equipment
(radar, ECDIS, etc.)
100-115/
220-230 VAC,
1ø, 50/60 Hz
Monitor viewing distance (m):
Model
MU-190 1.0138 JH23T12FUD 1.0138
MU-231 1.0138 JH23T14FUD 1.0138
MU-201CE 1.0759 HD24T21MMD 0.9517
MU-231CE 1.0138 JH26T11MMD 0.9879
JH19T14FUD 1.0138 HD26T21MMD 0.9879
JH20T17FUD 0.8793
Viewing Dist.
Model
Viewing Dist.
xiv
Page 17
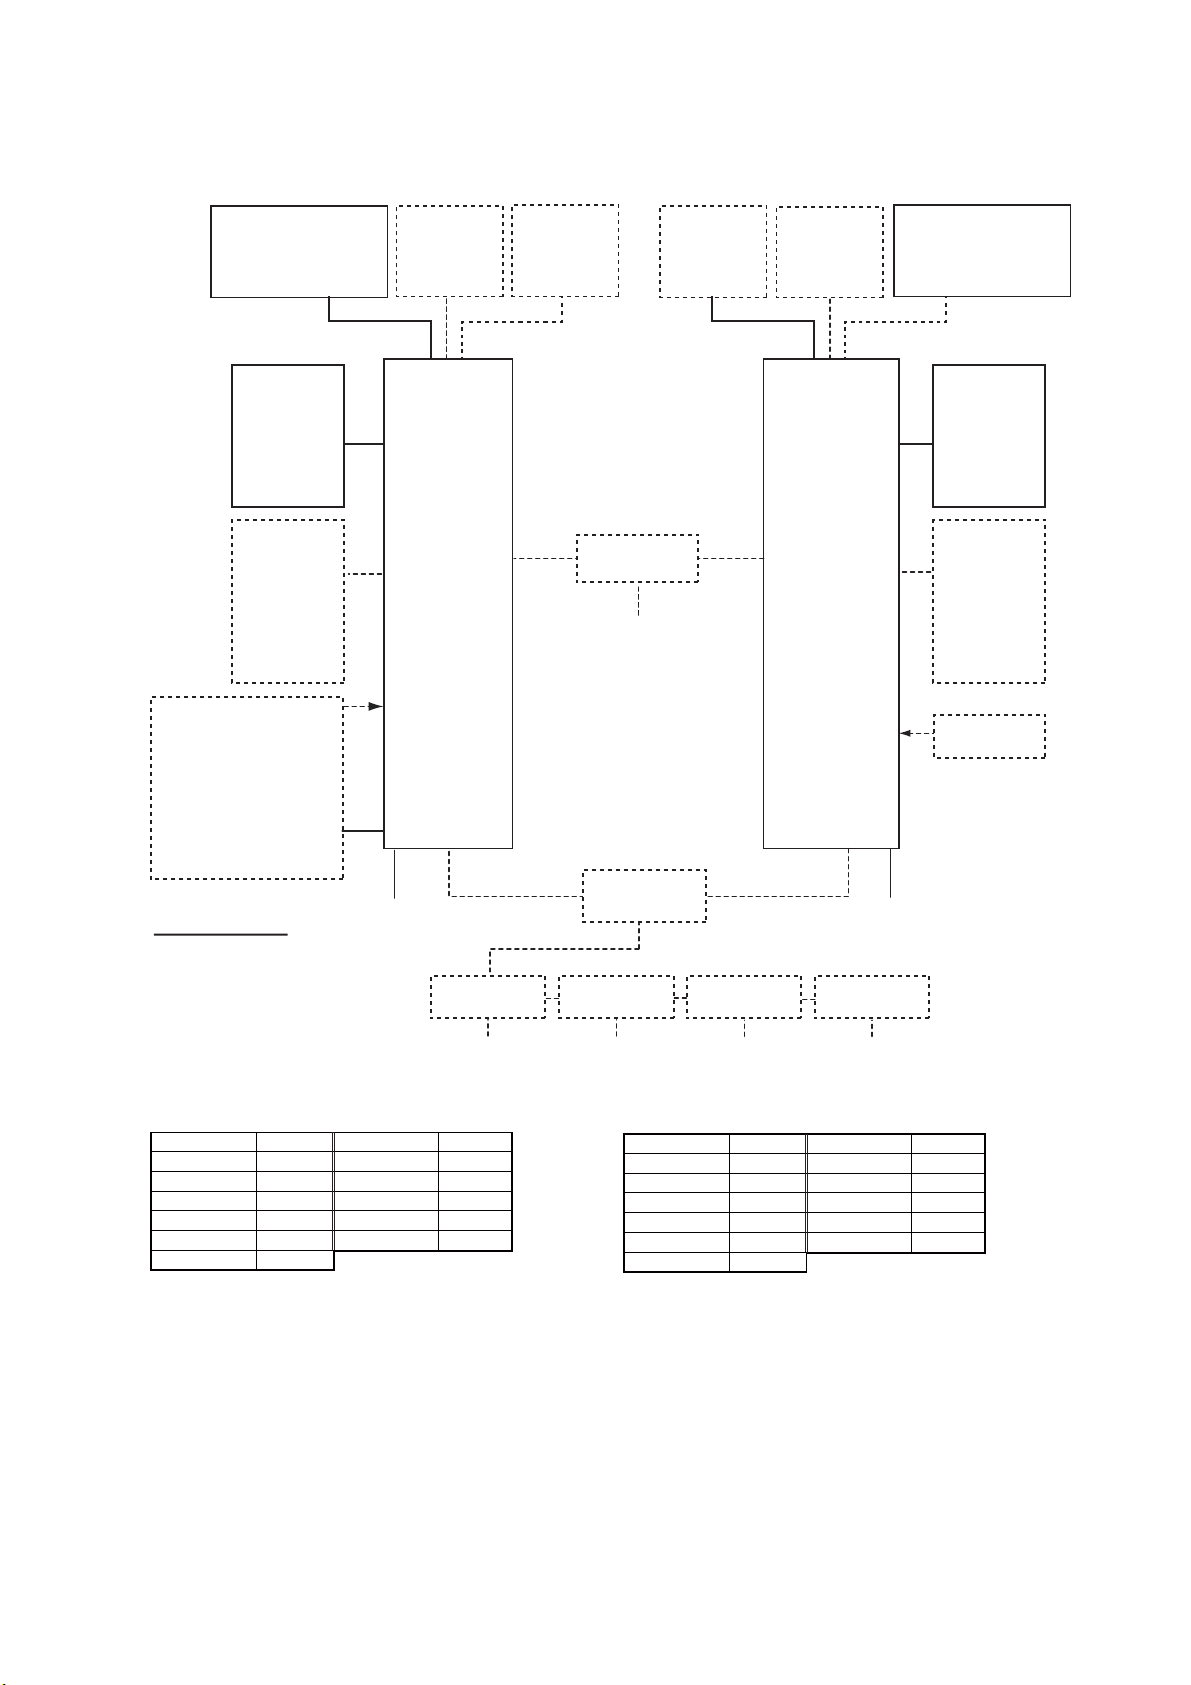
Multiple workstation
SYSTEM CONFIGURATION
Main Monitor Sub Monitor
Monitor Unit
MU-190
MU-231
HD26T21-MMD-MA4-FAGA
Monitor Unit
MU-190
MU-231
Conning
Monitor
Monitor Unit
MU-190
MU-231
ECDIS
Control Unit
RCU-024
or
Trackball
Control Unit
RCU-026
ECDIS
Control Unit
RCU-024
or
Trackball
Control Unit
RCU-026
EC-3000
PROCESSOR
UNIT
(Max. 2)
IF Signal:
- Serial Interface x2
(IEC 61162-1/2)
- Serial Interface x6
(IEC 61162-1)
- Digital Out x6
(power fail/system fail/
NO x2, NC x2)
- Digital In (ack in)
100-115/
220-230 VAC,
1ø, 50/60 Hz
Category of units
All units protected
from the weather.
Dashed lines indicate
optional or local supply
100-115/
220-230 VAC,
1ø, 50/60 Hz
Sensor Adapter
MC-3000S
equipment.
Serial
interface
Note: The following monitors are
available with the FMD-3200-BB:
Model Maker Model Maker
MU-190 FURUNO JH23T12FUD Hatteland
MU-231 FURUNO JH23T14FUD Hatteland
MU-201CE FURUNO HD24T21MMD Hatteland
MU-231CE FURUNO JH26T11MMD Hatteland
JH19T14FUD Hatteland HD26T21MMD Hatteland
JH20T17FUD Hatteland
For information about a Hatteland monitor, see its
Operator’s Manual.
Conning
Monitor
Monitor Unit
Intelligent Hub
HUB-3000
Gateway network
equipment
(radar, ECDIS, etc.)
Switching Hub
HUB-100
Sensor Adapter
MC-3010A
Analog
interface
* Monitor viewing distance (m):
Model
MU-190 1.0138 JH23T12FUD 1.0138
MU-231 1.0138 JH23T14FUD 1.0138
MU-201CE 1.0759 HD24T21MMD 0.9517
MU-231CE 1.0138 JH26T11MMD 0.9879
JH19T14FUD 1.0138 HD26T21MMD 0.9879
JH20T17FUD 0.8793
Main Monitor
Monitor Unit
MU-190
MU-231
HD26T21-MMD-MA4-FAGA
MU-190
MU-231
Sub Monitor
Monitor Unit
MU-190
MU-231
ECDIS
Control Unit
RCU-024
or
Trackball
Control Unit
RCU-026
ECDIS
Control Unit
RCU-024
EC-3000
PROCESSOR
UNIT
or
Trackball
Control Unit
RCU-026
(Max. 2)
IF Signal:
(Same as left.)
100-115/
220-230 VAC,
1ø, 50/60 Hz
Sensor Adapter
MC-3020D
Digital IN
interface
Viewing Dist.
Sensor Adapter
MC-3030D
Digital OUT
interface
Model
Viewing Dist.
xv
Page 18

SYSTEM CONFIGURATION
This page is intentionally left blank.
xvi
Page 19
1. INTRODUCTION
1.1 System Configuration
This ECDIS series is comprised of the components shown in the illustration on the
System Configuration page.
The Processor Unit is connected to various sensors, and performs navigation calculations, route planning and route monitoring. The Sensor Adapters interface between
the Processor Unit and external equipment.
The operator controls the ECDIS with the ECDIS Control Unit RCU-024 or the Trackball Control Unit RCU-026. Both units are equipped with a trackball module (trackball,
right and left mouse buttons and a scrollwheel). The RCU-024 is additionally equipped
with an alphabet keyboard. All functions of the ECDIS can be accessed from the trackball module.
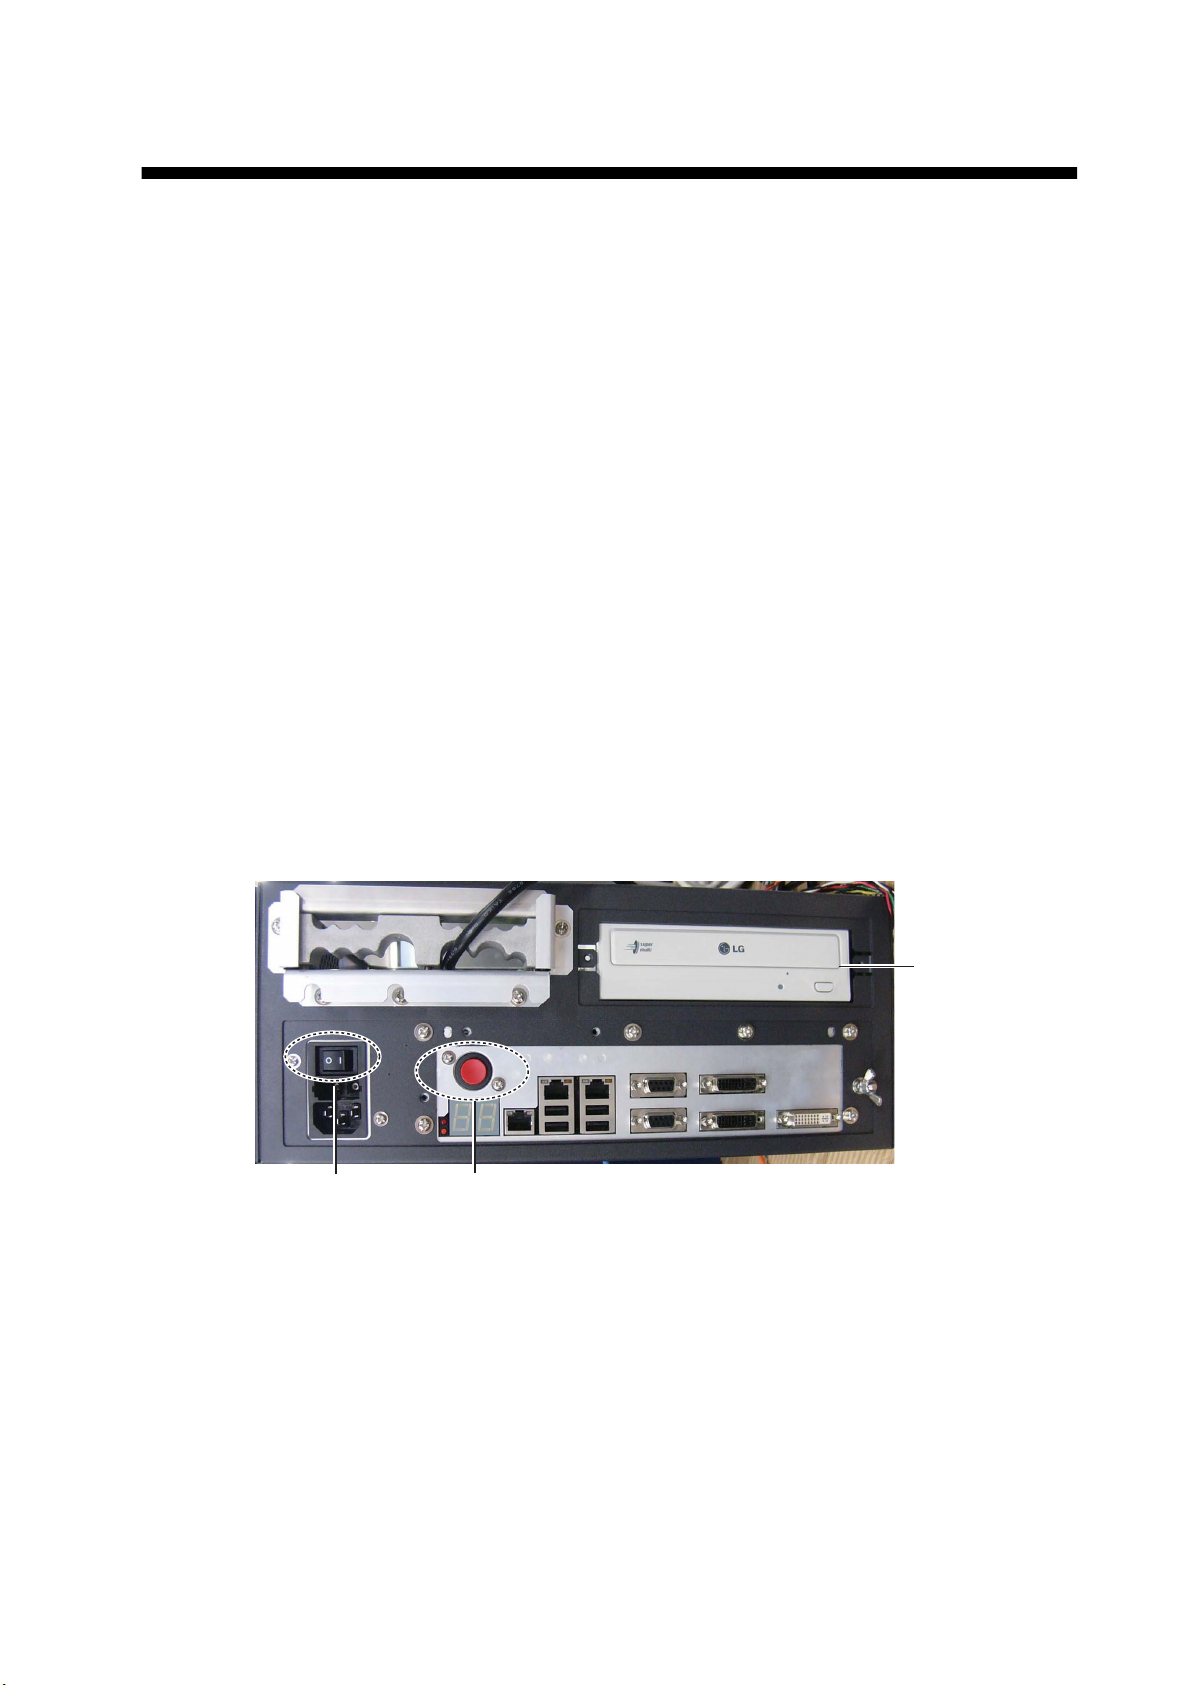
1.2 Processor Unit EC-3000
The Processor Unit is the heart of the ECDIS system, and is mainly responsible for the
chart management, route planning and route navigation.
The Processor Unit has two power switches. The Mains switch controls the power
from the switchboard, and the Power switch controls the power to the ECDIS system.
DVD
drive
Mains switch
Note 1: Do not operate the system with a medium inserted in the DVD drive when its
use is not required, to prevent damage to the drive and medium. After use of a medium
is completed, remove the medium from the drive and store it in its case.
Power switch
Note 2: To keep the system stable, restart the unit at least once every two weeks.
Note 3: Close the lid of the DVD drive when the drive is not in use.
Note 4: The DVD ROM provided with this equipment contains the ECDIS program.
Store the DVD in a place where the temperature and humidity are moderate. The recommended storage temperature is -10°C(50°F) to 40°C(104°F).
1-1
Page 20
1. INTRODUCTION
1.3 How to Turn the Power On/Off
Normally, leave the power switches at the front of the Processor Unit on and control
the power with the power key on a Control Unit (RCU-024, RCU-026). The Monitor
Unit is powered independently.
How to power the system
Push the Mains switch on the Processor Unit for the "I" position. Turn on the power
switch on the Processor Unit or the power key on the Control Unit. The start-up display
appears on the monitor.
Note: If the ambient temperature is less than 0°C (32°F) when the power is applied,
nothing appears on the display. This is because the heater is warming the Processor
Unit. The display appears after the Processor Unit becomes warm, in approx. two minutes.
How to power off the system
Press the power switch on the Processor Unit or the power key on the Control Unit.
Then, push the Mains switch for the "O" position.
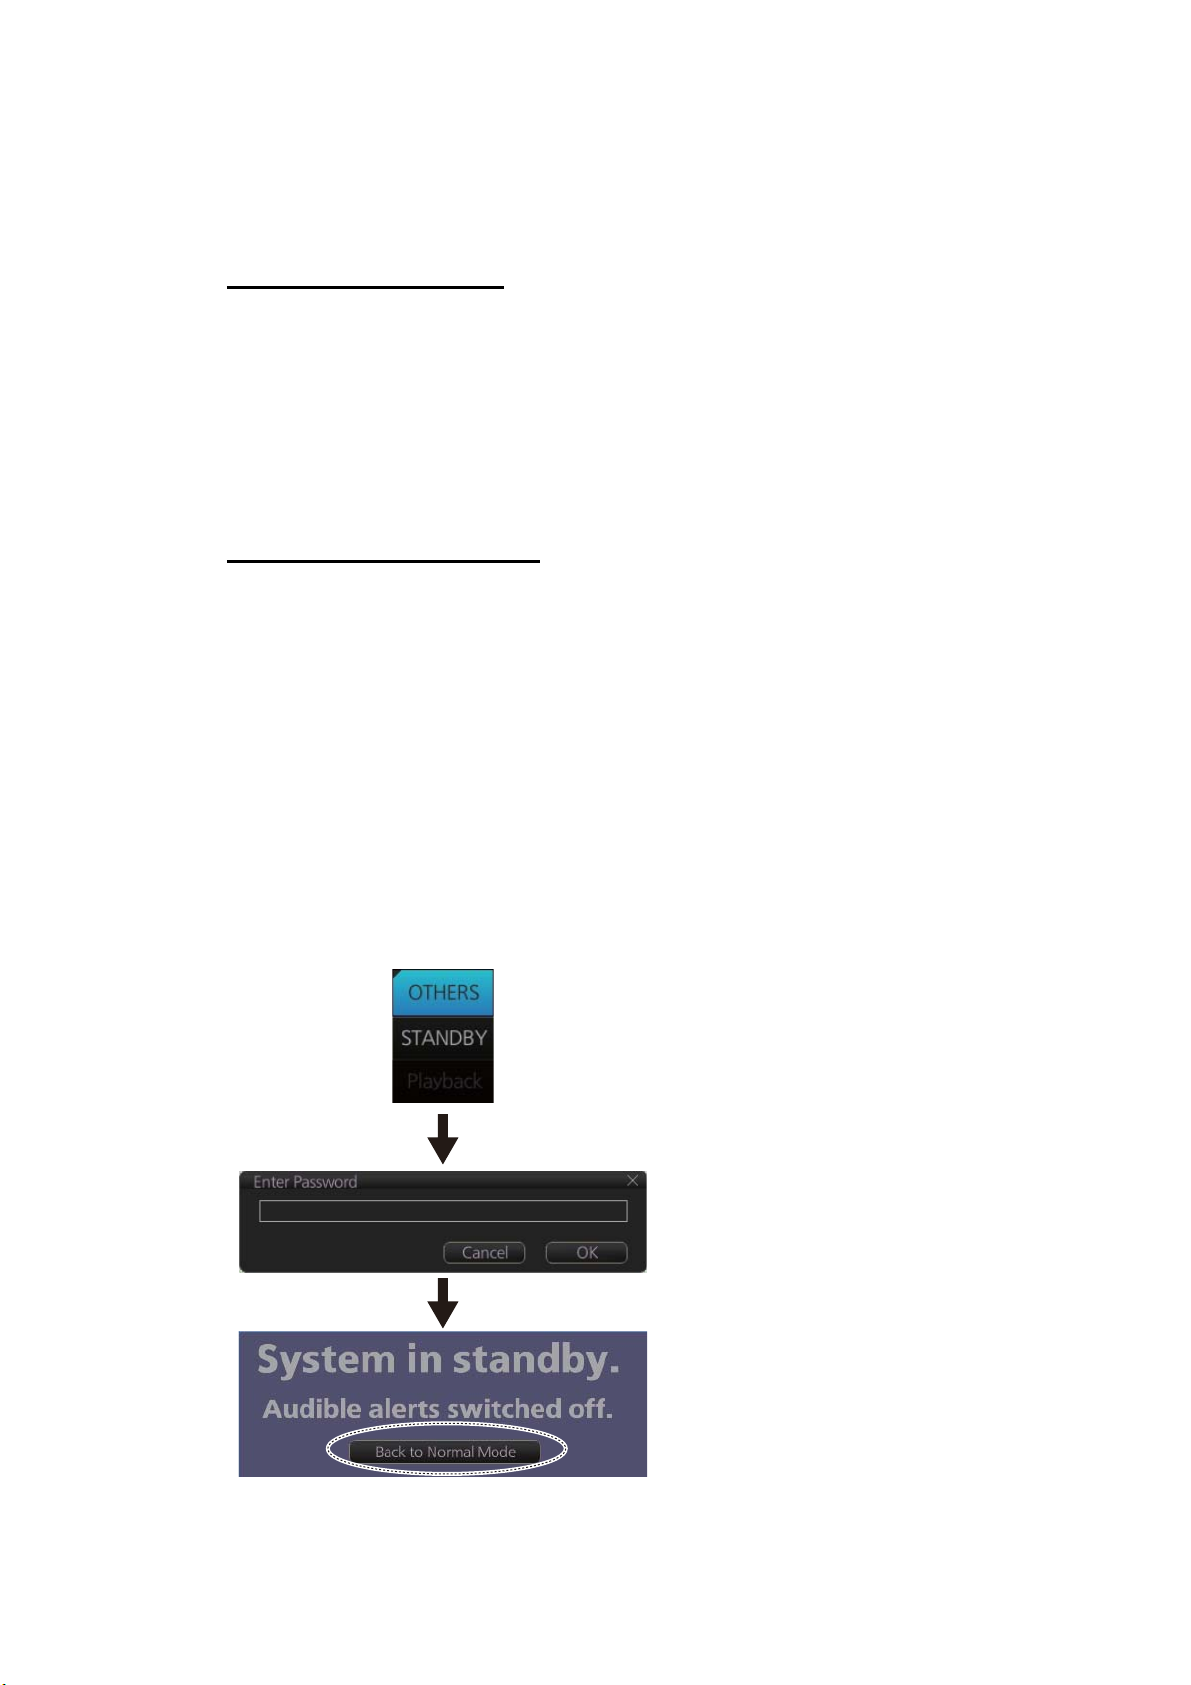
1.4 The Standby Mode
The standby mode, which requires a password to activate, deactivates the audio
alarms from the ECDIS. Use this mode when the ECDIS is not required, like in a harbor.
To go to the standby mode, first click the [OTHERS] button on the Status bar then click
[STANDBY]. Have the holder of the password enter the password then click the [OK]
button.
Click OTHERS,
STANDBY.
Playback
Enter password;
click OK button.
1-2
Click to return to normal operation.
To return to normal operation, click [Back to Normal Mode].
Page 21
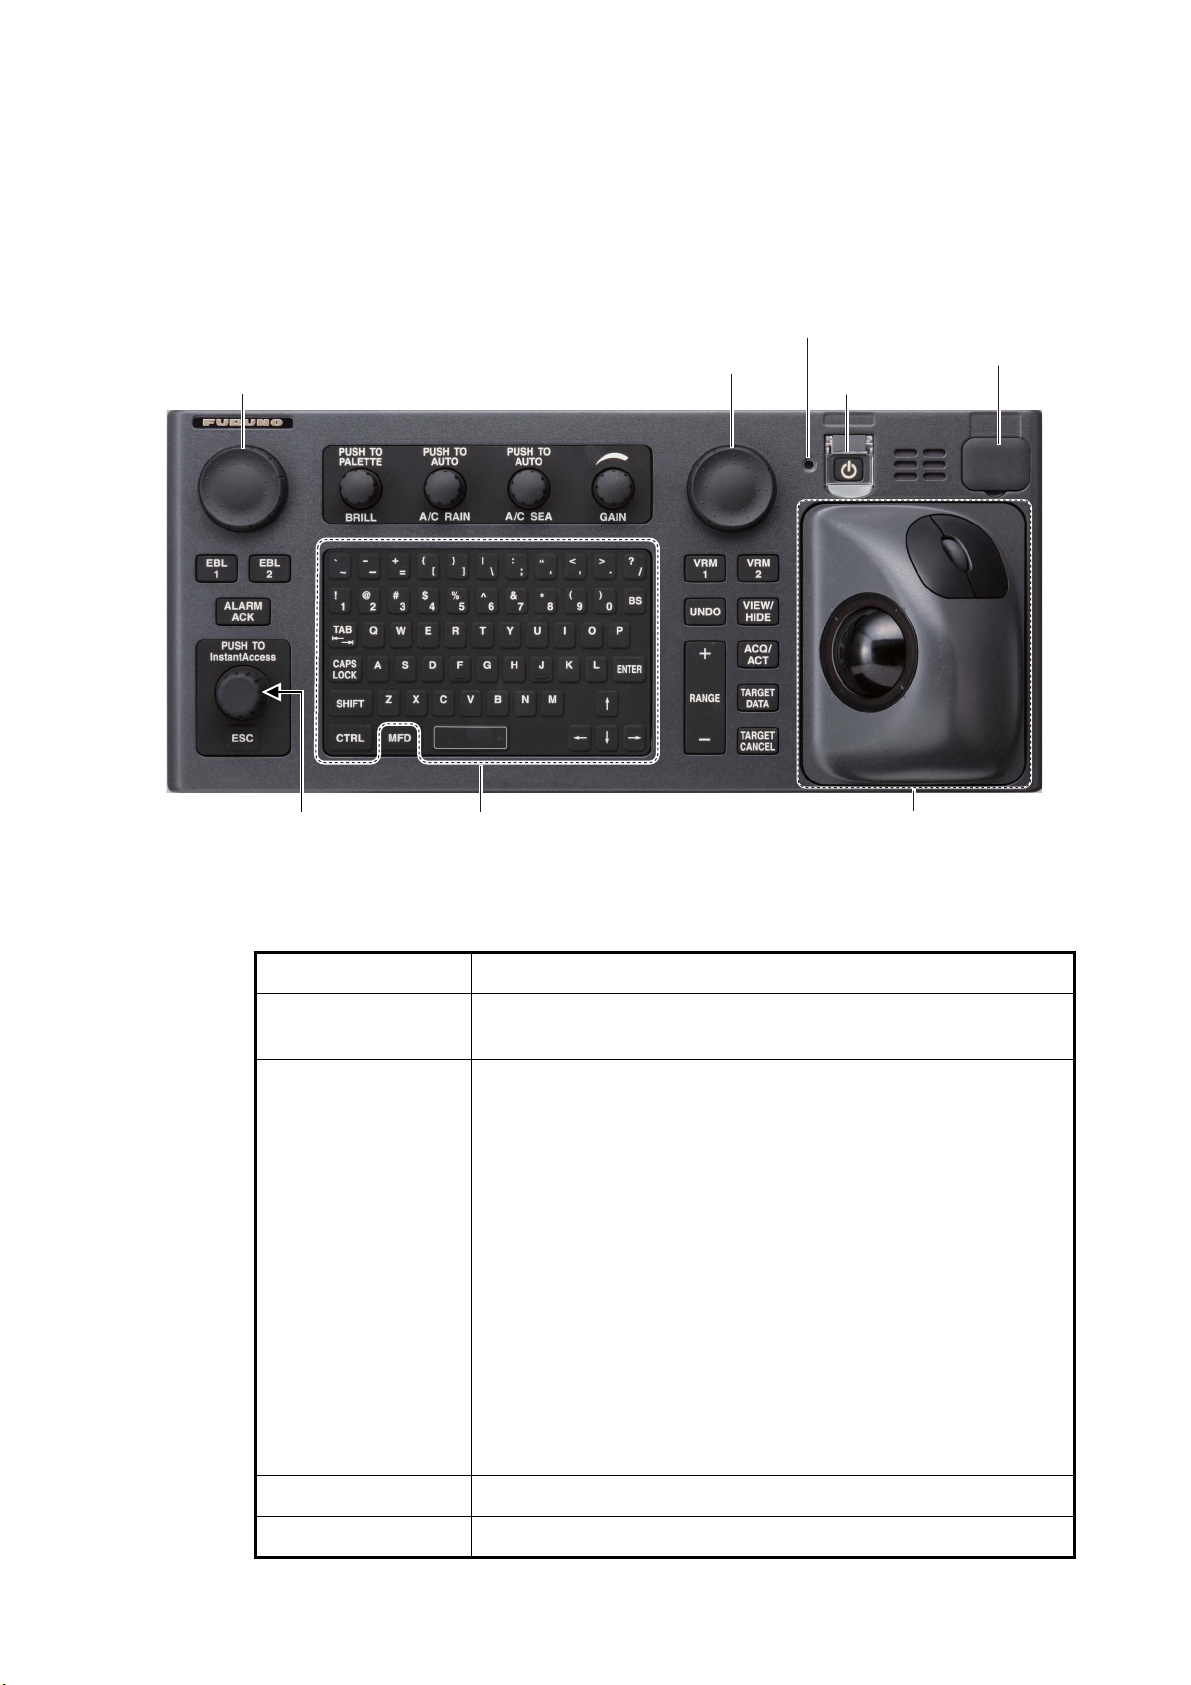
1.5 ECDIS Control Unit RCU-024
The RCU-024 consists of controls, keys, alphabet keyboard and trackball module
(trackball, scrollwheel and left and right mouse buttons). The trackball module functions like a PC mouse. The operator rolls the trackball and operates the left and right
mouse buttons and the scrollwheel to do various functions.
Rotary encoder
for EBL
Rotary encoder
for VRM
1. INTRODUCTION
Status LED
USB port
POWER key
InstantAccess
knob
Keyboard
1.5.1 Control description
Key Description
POWER key Turns the system on or off. (With a FURUNO or Hatteland mon-
itor unit, the monitor is also turned on or off with this key.)
Status LED The color and state of the LED change according to system or
alert status.
Green, lighting: Normal operation status; no alerts generated.
Red, lighting: Acknowledged alert (but not rectified) or SYS-
TEM FAIL. SYSTEM FAIL occurs when there is trouble in the
Processor Unit or communication failure between the Processor
Unit and an ECDIS Control Unit. Each Control Unit detects trouble and its lamp flashes in red and the buzzer sounds. If this
condition occurs at the No. 1 ECDIS Control Unit, the SYSTEM
FAIL signal is output.
Red, flashing rapidly: Alert not acknowledged nor rectified.
Red, flashing slowly: Alert not acknowledged but rectified.
OFF: The heater on the CPU board is on, because the ambient
temperature is not at least 0°C. The heater takes about two minutes to warm the equipment. The LED lights green after the
heater goes off.
Trackball module
EBL rotary encoder Adjusts active EBL.
EBL 1 Activates or deactivates EBL 1.
1-3
Page 22

1. INTRODUCTION
EBL 2 Activates or deactivates EBL 2.
ALARM ACK Alert acknowledgement for alerts generated by chart, naviga-
Key Description
tion, etc.
InstantAccess knob,
ESC key
BRILL Rotate: Adjusts the brilliance of a FURUNO or Hatteland moni-
A/C RAIN No use.
A/C SEA No use.
GAIN No use.
Alphabet keyboard Enter alphanumeric data. The CTRL key has no function.
VRM rotary encoder Adjusts active VRM.
MFD Switches between the ECDIS and CONNING modes.
VRM 1 Activates or deactivates VRM1.
VRM 2 Activates or deactivates VRM2.
UNDO Undo the last operation, when creating a route or user chart.
Selects and processes the functions on the InstantAccess bar.
Rotate: Selects item.
Push: Confirms selection.
ESC key: Goes back one step in the current operating se-
quence on the InstantAccess bar.
tor.
Push: Selects a color palette.
VIEW/HIDE Shows or hides the Instant Access bar, [Route Information] box,
VRMs, EBLs, [Overlay/NAV Tools] box.
RANGE Selects the display scale.
ACQ/ACT Activates cursor-selected sleeping AIS target.
TARGET DATA Displays detailed target data for selected TT, AIS target.
TARGET CANCEL Sleeps cursor-selected activated AIS target.
USB port For connection of USB flash memory (FAT16 or FAT32 format
only). Do not connect a USB HDD or PC keyboard. The DVD
drive (Maker: TEAC, Type: PU-DRV10) is for chart updates.
Trackball module See the description in section 1.6.
1-4
Page 23
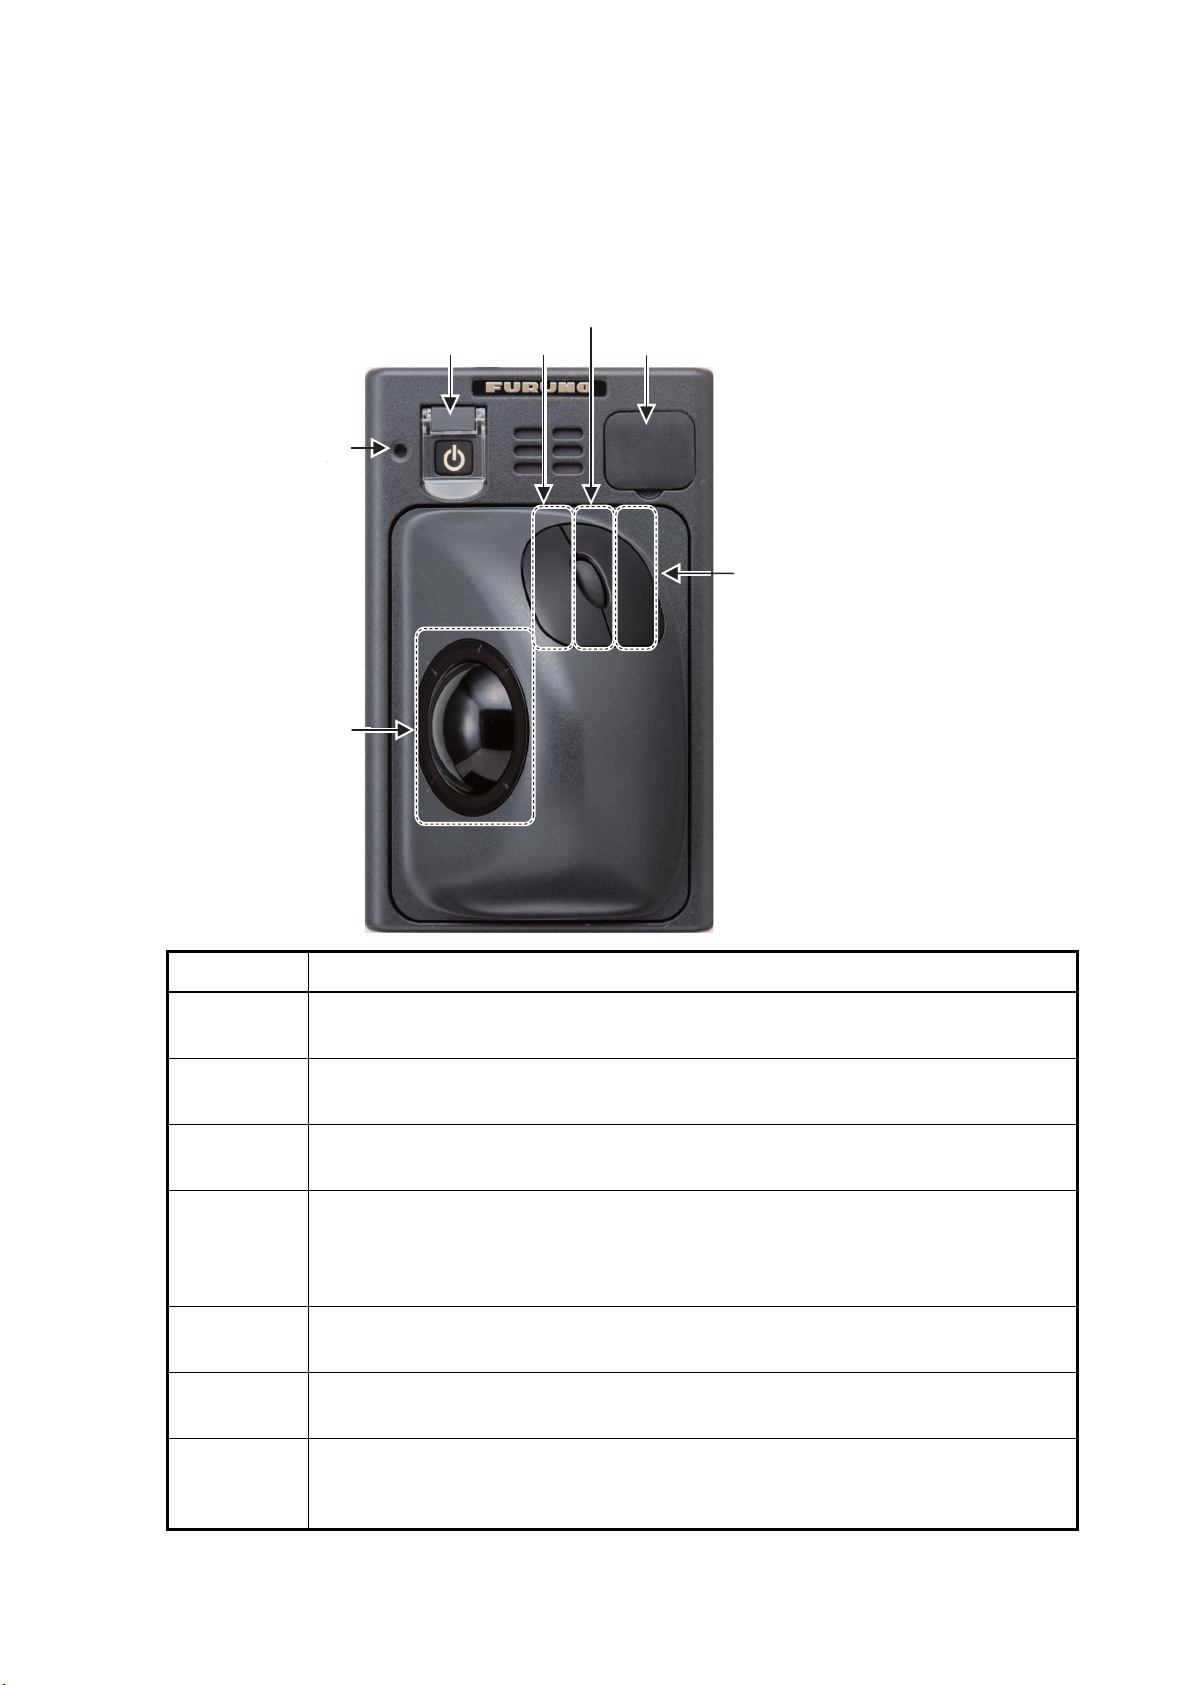
1.6 Trackball Control Unit RCU-026
The RCU-026 has a power key, a trackball module (trackball, scrollwheel and left and
right mouse buttons), a status LED, and a USB port. The trackball module functions
like a PC mouse; the user rolls the trackball and operates the left and right buttons and
the scrollwheel to do various functions.
1. INTRODUCTION
Status
LED
Trackball
Power
key
Left
button
Scrollwheel
USB port
Right
button
Control Description
Power key Turns the system on or off. (With a FURUNO or Hatteland monitor unit, the mon-
itor is also turned on/off with this key.)
Status
LED
Left
button
Scrollwheel • Select options.
Right
button
Trackball • Moves the cursor.
USB port For connection of USB flash memory (FAT16 or FAT32 format). Do not connect a
The color and state of the LED change according to system or alert status. See
the LED status description on page 1-3.
• Does the operation related to the object selected.
• Confirms the operation done for the object selected.
• Selects chart scale.
• Sets numeric data.
The scrollwheel does not have a “push” function.
• Displays context-sensitive menu when cursor is put in the display area.
• Cancels operation done on the object selected.
• Selects an object.
USB HDD or PC keyboard. The DVD drive (Maker: TEAC, Type: PU-DRV10) is
for chart updates.
1-5
Page 24
1. INTRODUCTION
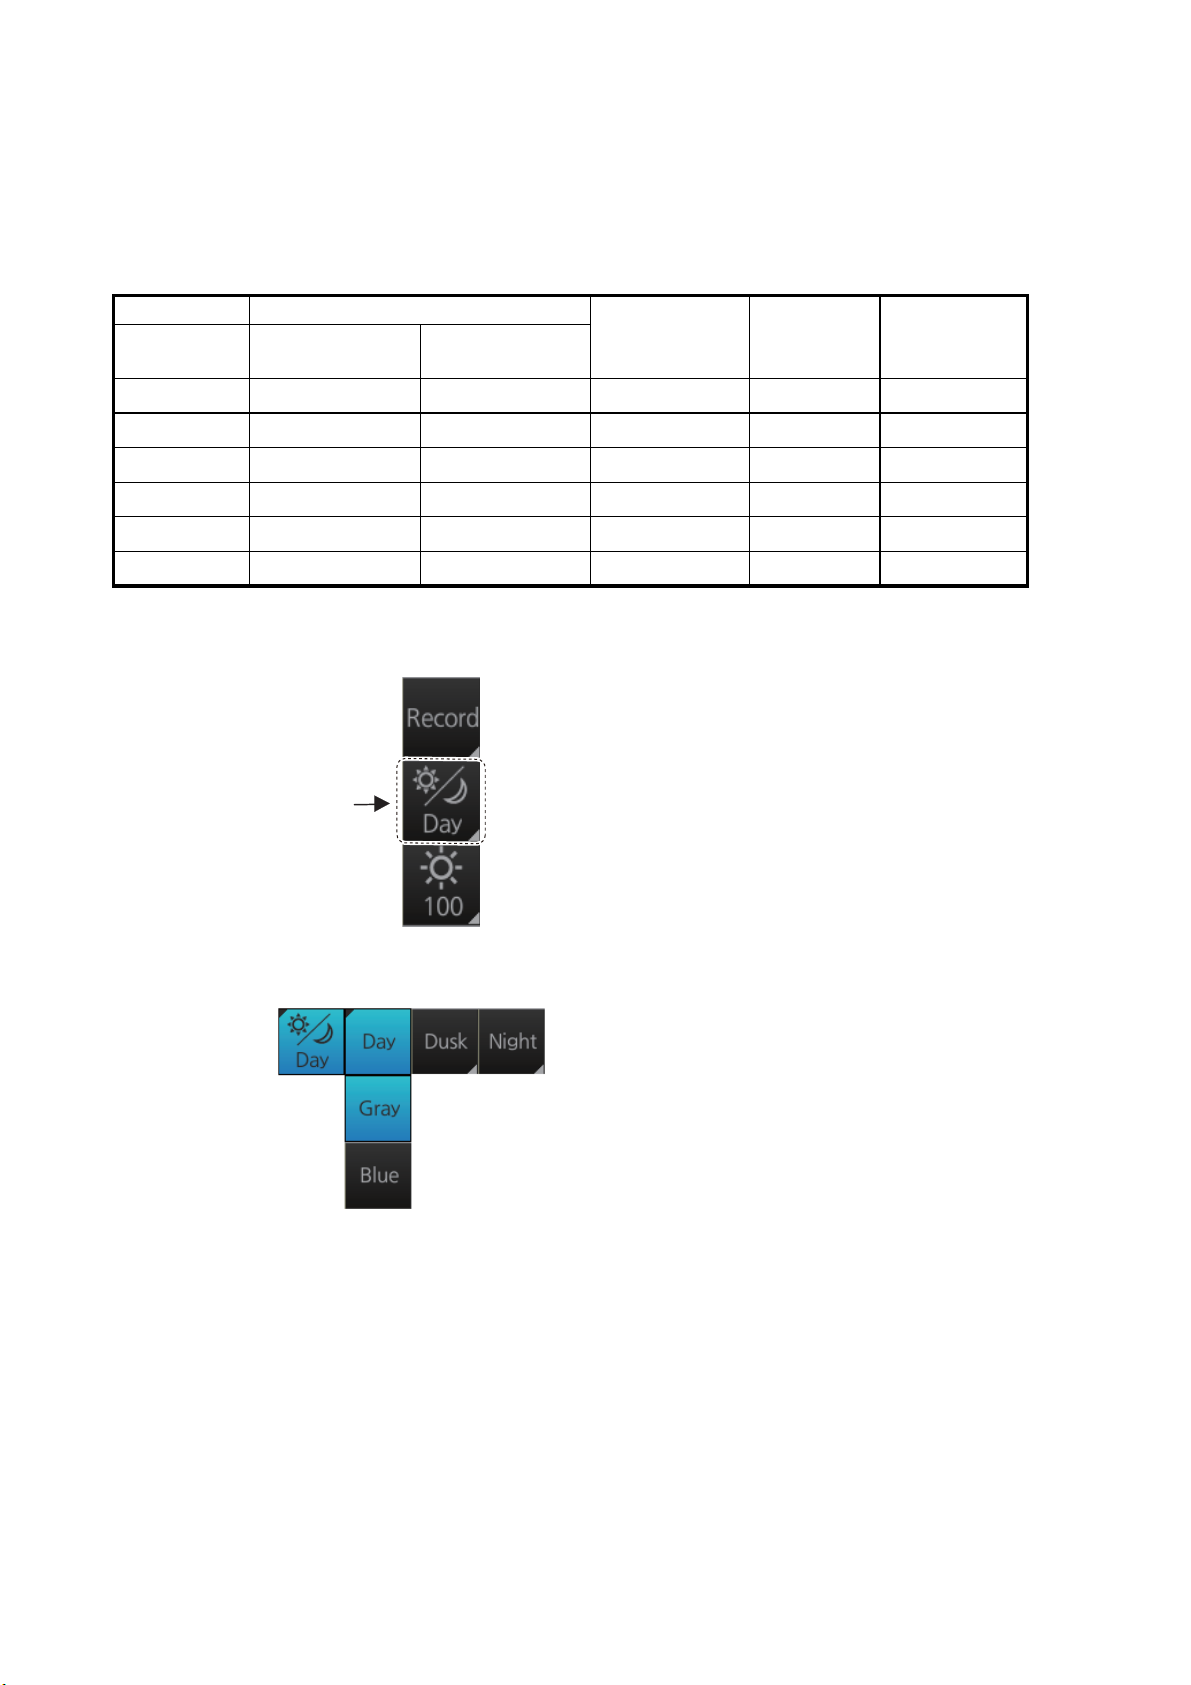
1.7 How to Select a Color Palette
The system provides three sets of color and brilliance sets (palette), day, dusk and
night, to match any ambient lighting condition. The default specifications of each set
are as shown in the table below. The panel dimmer setting is automatically changed,
and the number of steps depends on the color palette selected.
Palette Brilliance
19”
display unit
Day-gray
Day-blue
Dusk-gray
Dusk-blue
Night-gray
Night-blue
110 cd/m
110 cd/m
50 cd/m
50 cd/m
5 cd/m
5 cd/m
2
2
2
2
2
2
To select a palette, do the following:
1. Click the [Palette] button.
[Palette]
button
23”
display unit
120 cd/m
120 cd/m
50 cd/m
50 cd/m
5 cd/m
5 cd/m
2
2
2
2
2
2
Panel dimmer
(step)
Text
color
15 White Gray
15 White Blue
7 Light gray Dark gray
7 Light gray Dark blue
3 Orange Dark gray
3 Light gray Dark blue
Background
color
2. Select [Day], [Dusk] or [Night] as appropriate. For example, select [Day] to show
its options.
3. Click the palette desired.
Note 1: A palette can also be selected by pushing the BRILL control on the Control
Unit.
Note 2: If the display cannot be seen when switching from a Night to Day palette, push
and hold the right button (approx. 2 seconds) to switch to the dusk-gray mode.
Note 3: The color palette setting may not get synchronized among ECDIS units selected for synchronization if a unit is being booted during the selection of the color palette. If this occurs, wait until all ECDIS units selected for synchronization have booted
then reselect required color palette.
1-6
Page 25
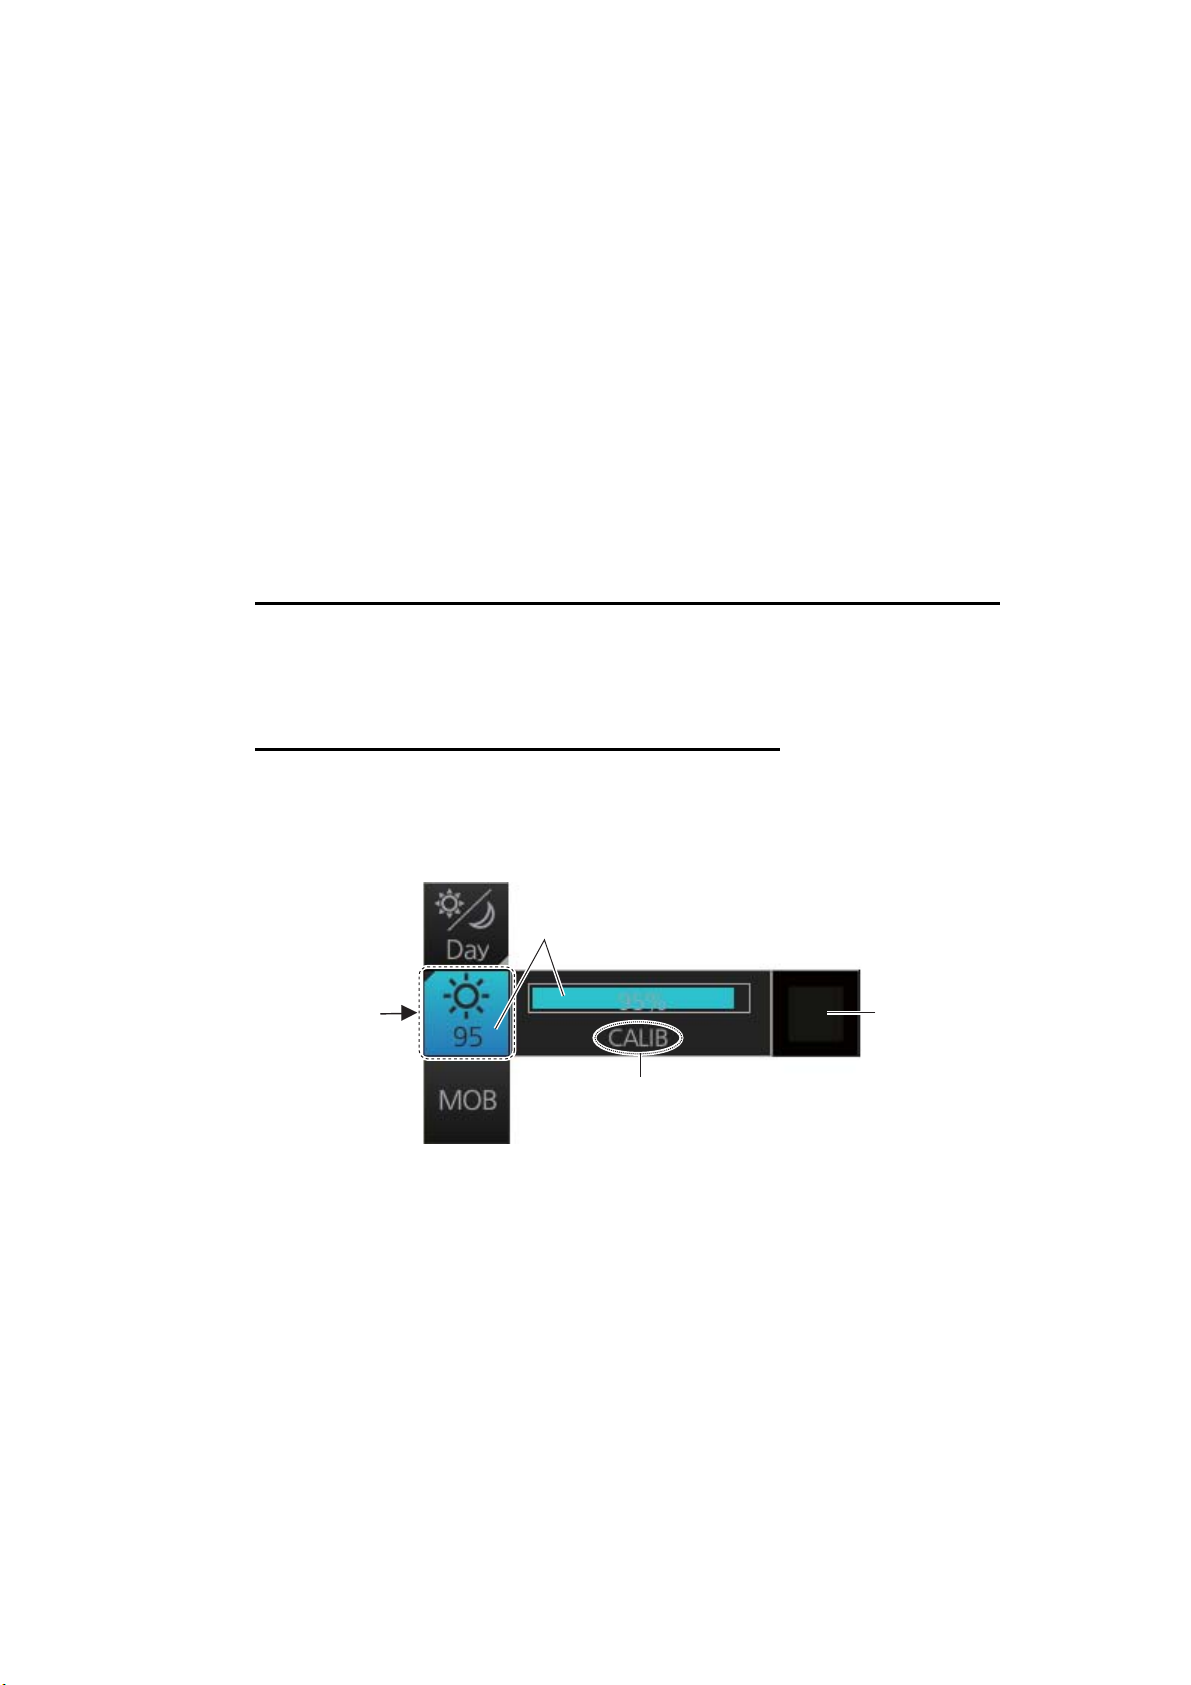
1. INTRODUCTION
1.8 How to Adjust the Display Brilliance (FURUNO or
Hatteland monitor)
The brilliance setting is defined according to the color palette setting. However, manual adjustment of the brilliance is also possible.
Note 1: The brilliance of only the FURUNO or Hatteland monitor can be adjusted from
the Control Unit. Use a serial cable for brilliance adjustment to make the connection
between the Processor Unit and the Control Unit.
Note 2: For how to adjust display brilliance from the Hatteland monitor, see its operator’s manual.
Note 3: Improper brilliance may affect the visibility of information, especially on the
night display.
1.8.1 Manual brilliance adjustment
Manual adjustment with the BRILL control on the ECDIS control unit
Operate the BRILL control to adjust brilliance. Turn it clockwise to increase the brilliance; counterclockwise to decrease the brilliance. Watch the brilliance level indication on the [BRILL] button (see the illustration below) to see the current brilliance level.
Manual adjustment with the InstantAccess knob
1. Push the InstantAccess knob.
2. Rotate the knob to select the [BRILL] button then push the knob to show the bril-
liance adjustment window.
Current brilliance level
[BRILL]
button
Calibration state
(CALIB or UNCALIB)
3. Push the knob, rotate the knob to set the brilliance then push the knob to confirm
the setting. The calibration state indication changes to "UNCALIB".
4. Rotate the knob to select the [CALIB] button then push the knob to calibrate the
brilliance. The calibration state indication changes to "CALIB".
[CALIB]
button
1-7
Page 26
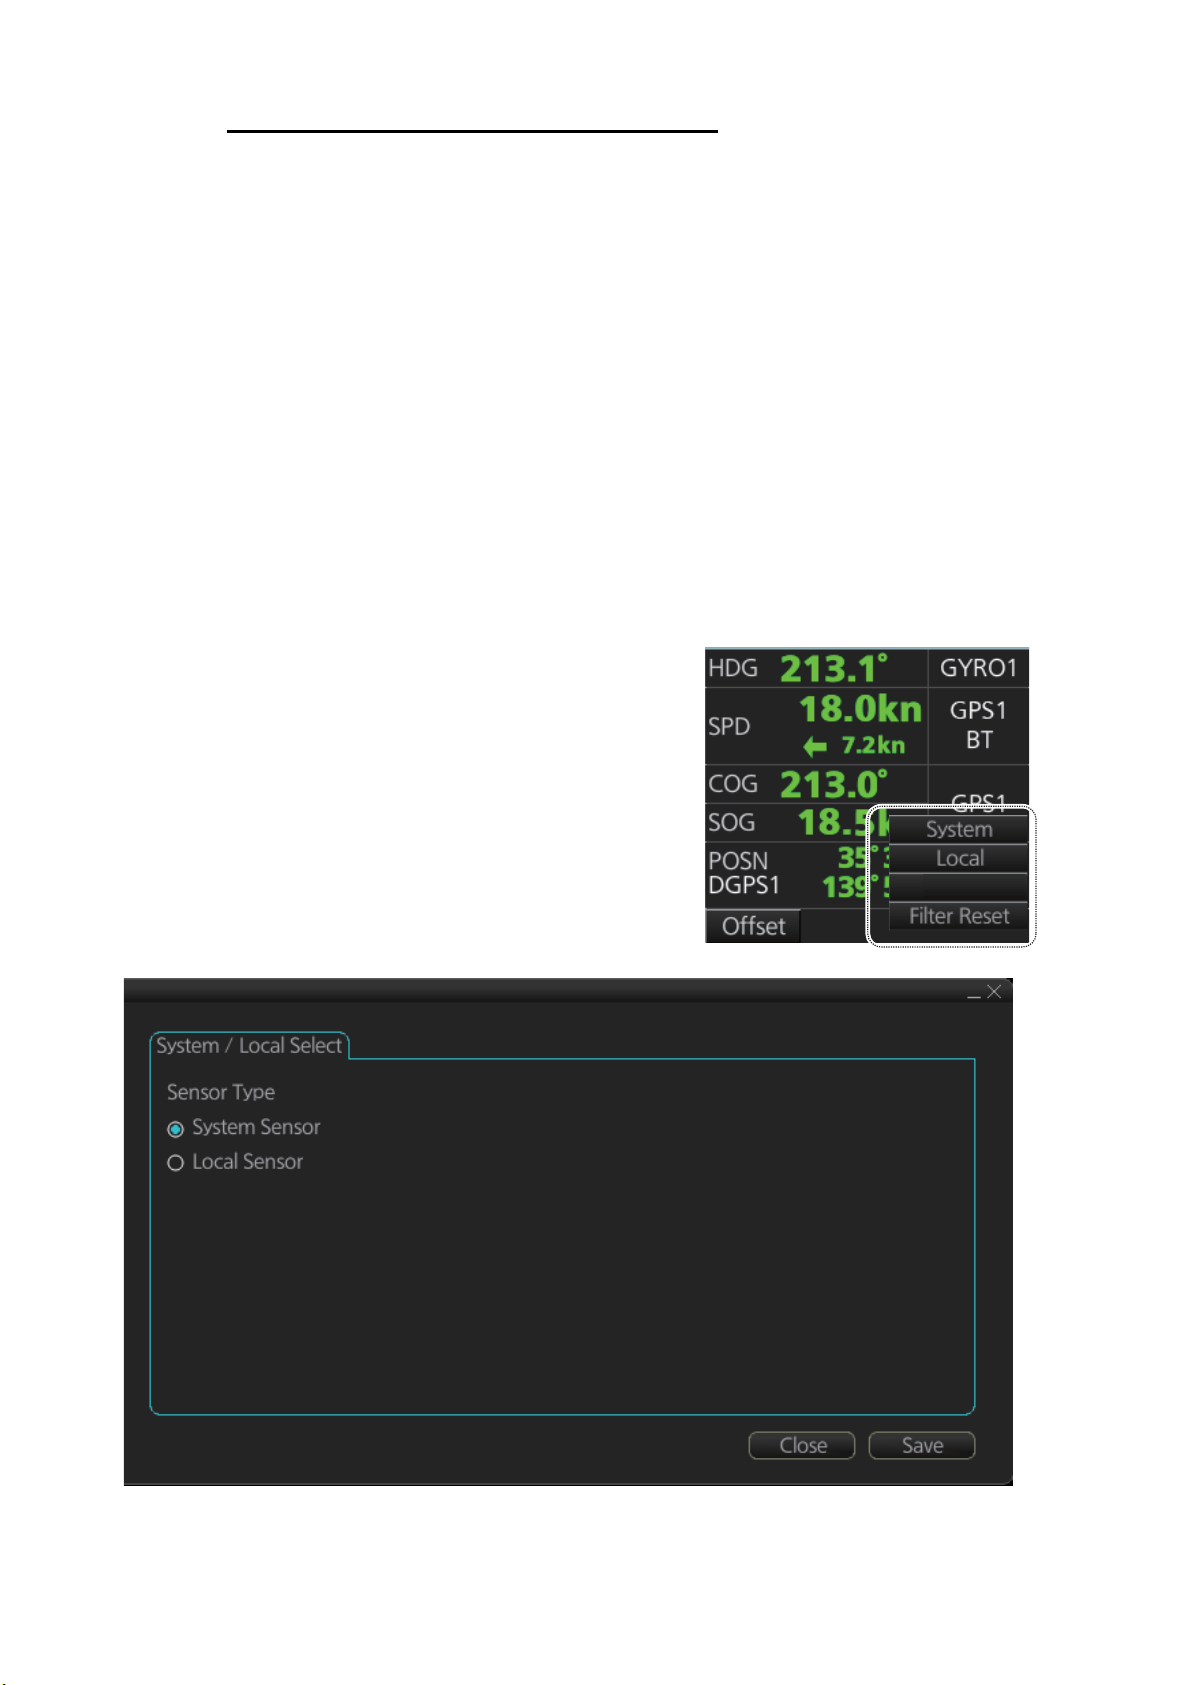
1. INTRODUCTION
Manual adjustment with the trackball module
1. Click the [BRILL] button on the InstantAccess bar to show the brilliance adjustment window.
2. For coarse adjustment, put the cursor on a location within the slider bar area
then push the left button. For fine adjustment, put the cursor on the end of the
slider bar and roll the trackball while holding down the left button.
3. Release the left button to confirm setting. The calibration state indication changes
to "UNCALIB".
4. Click the [CALIB] button to calibrate the brilliance. The calibration state indication
changes to "CALIB".
1.9 How to Select Sensor Settings
This ECDIS system accepts navigation data input two ways: System or Local. System
shares sensor data among multiple ECDIS in network. Sensor priority is also commonly shared among the ECDIS. Local selects a sensor outside the network.
1. Right-click anywhere in the [Sensor information] box to show the context-sensitive
menu.
2. Click [Local] or [System] as applicable.
Note: Sensor system can also be selected
from the menu. Open the menu and click
[System/Local Select] on the [Sensor]
menu. Click the circle next to [System Sensor] or [Local Sensor] as appropriate then
click the [Save] button.
Open MENU
1-8
Page 27
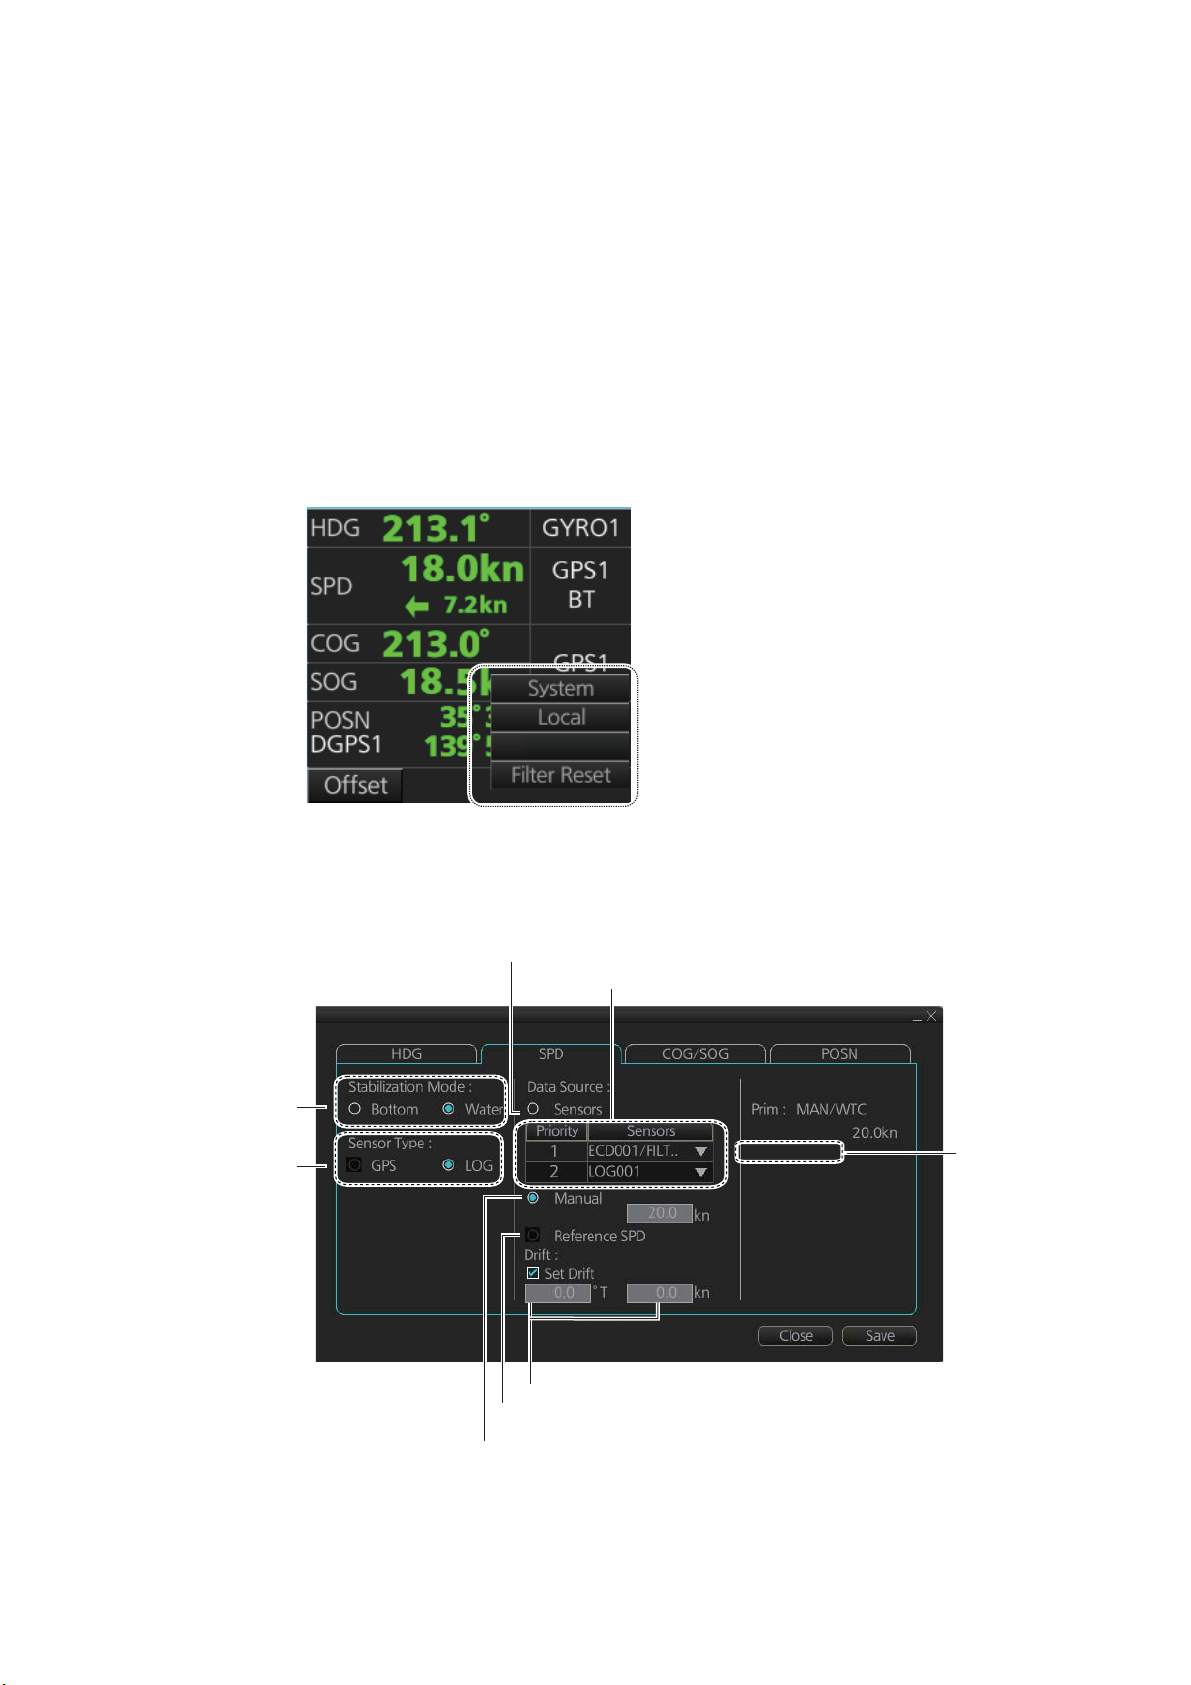
1.10 How to Enter Ship Speed
The speed can be entered from a log (STW) or GPS (SOG), or manually on the menu.
Note that FURUNO GPS Navigator GP-150 provides both COG and SOG.
Speed data is checked for integrity (see section 18.7 for details), and the data is
judged as Passed, Doubtful or Failed. The results of the check appear on the [SPD]
page, shown below. (The results do not appear when the TCS is engaged.)
Passed (green): Data is available for comparison and data is normal.
Doubtful (yellow): Data is not available for comparison, but data is normal.
Failed (red): Data may or may not be available for comparison, and data is abnormal.
1. Right-click anywhere in the [Own ship information] box to show the context-sensitive menu.
1. INTRODUCTION
2. Click [Open MENU].
3. Click [System Sensor Settings] or [Local System Settings] as applicable.
4. Click the [SPD] tab.
Stablilization
mode
LOG/GPS
selection
Open MENU
Fill circle for automatic speed input
Speed sensor list
SPD:
Integrity: Passed
Integrity
check
result
Set course and speed of drift
Check to use radar as source for speed and course
Fill circle for manual speed input
SPD page, local sensor
1-9
Page 28
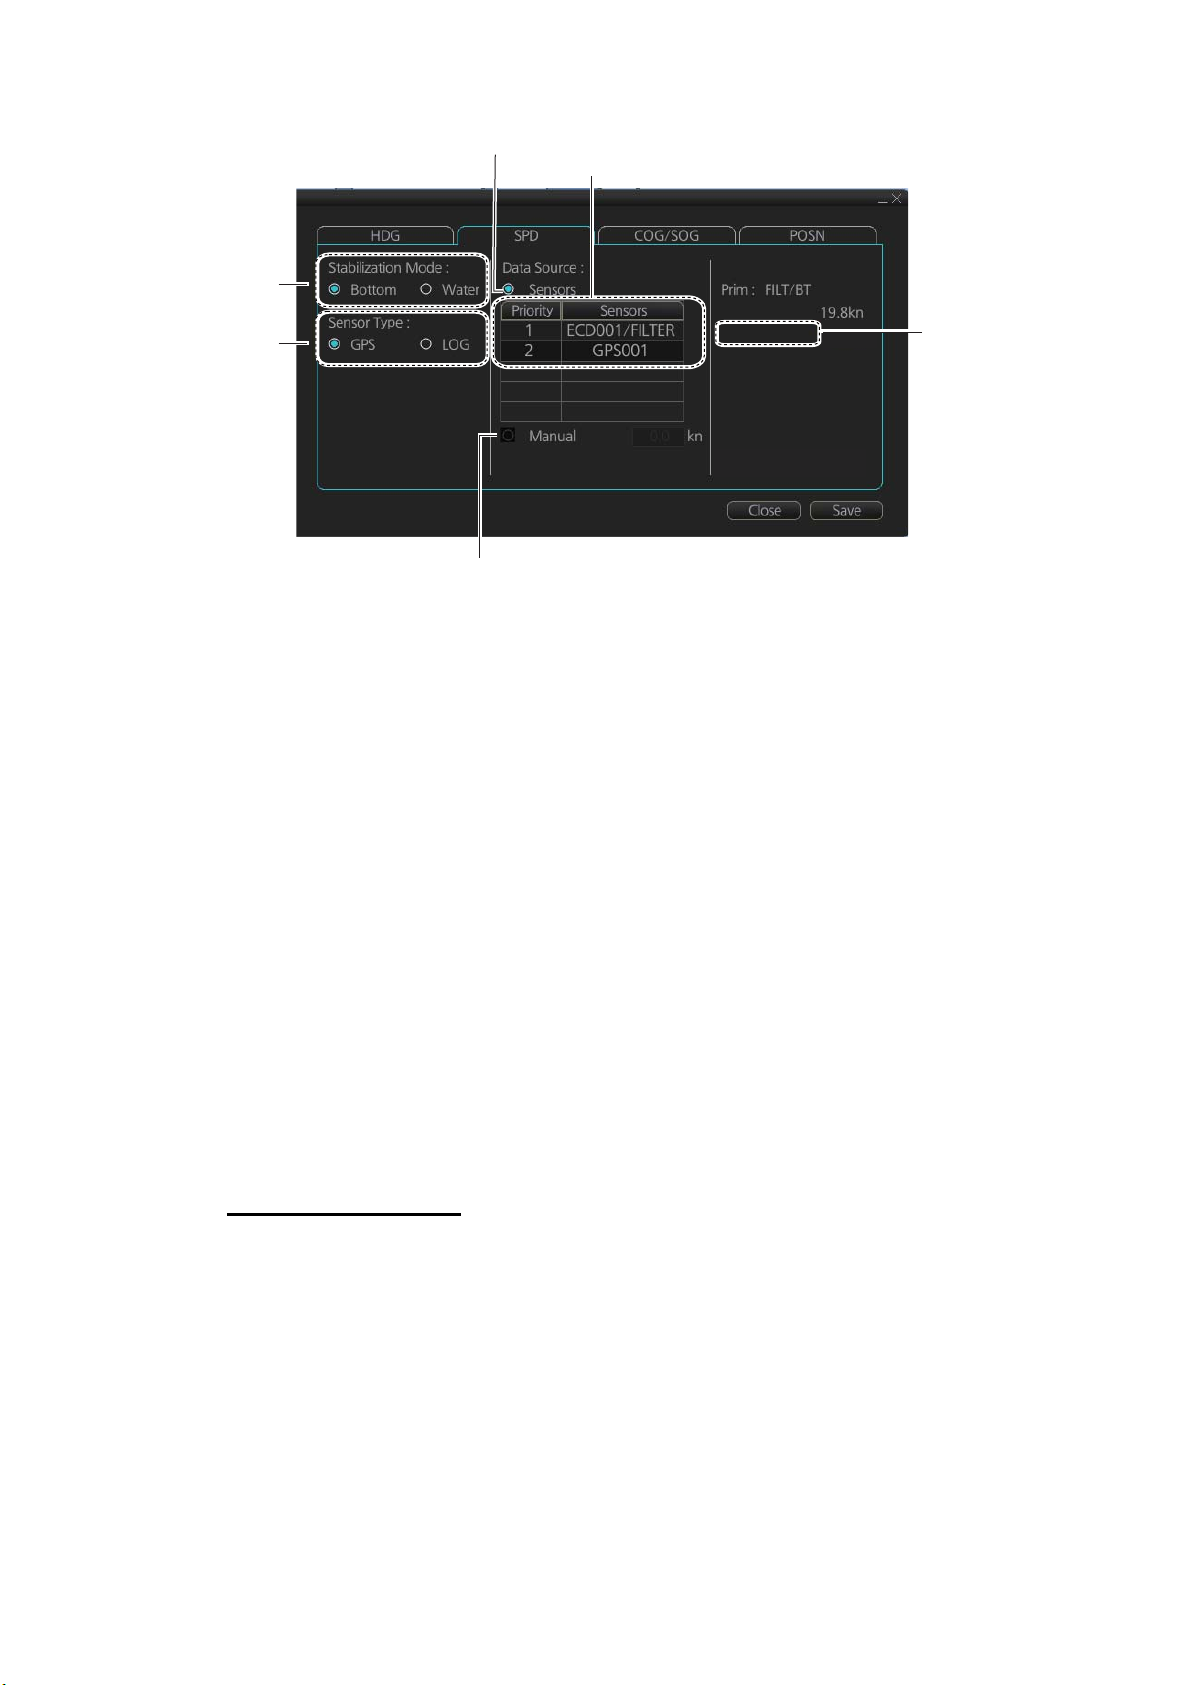
1. INTRODUCTION
Stablilization
mode
LOG/GPS
selection
Check for automatic speed input
Speed sensor list
Check for manual speed input
SPD page, system sensor
SPD:
Integrity: Passed
Integrity
check
result
5. For automatic input, follow the procedure below. For manual input, go to step
6.
1) Check [Sensors].
2) Set the priority for the speed sensors in case of Local sensor. Click the triangle
on the Priority1 line to select the sensor to be the Priority1 sensor. Do the
same for the Priority2. Only one sensor can be Priority1; all others are priority
2. If a speed sensor is changed from Priority2 to Priority1, then that sensor previously selected to Priority1 is then automatically selected to Priority2 state.
3) Check [LOG] or [GPS] at [Sensor Type] as appropriate.
4) Select [Bottom] or [Water] at [Stabilization Mode]. Select [Bottom] if GPS is the
source of speed data, or [Water] if a speed log is the source of speed data.
5) Go to step 7.
6. For manual input, set the stabilization mode for [Water] and check [Manual]. Enter
the speed, using the scrollwheel or software keyboard.
Note: For set and drift, see page 18-3.
7. Click the [Save] button to save settings then click the [Close] button to close the
menu.
Notes on speed input
1-10
• Be sure not to select a LOG option when a speed log is not connected. If the log
signal is lost, the GPS sensor is used. In the event of GPS loss, the SPD is shown
as "**.* kn".
• The SPD is shown as "**.* kn", and the label "LOG" is erased if no log signal is pres-
ent for a certain amount of time. The timeout varies according to ship.
• If SOG is changed to STW, the label "LOG" (in orange) appears. If log signal is lost
"LOG" is colored yellow.
• A single-axis water log cannot measure speed when the wind is coming from the
leeway direction.
Page 29
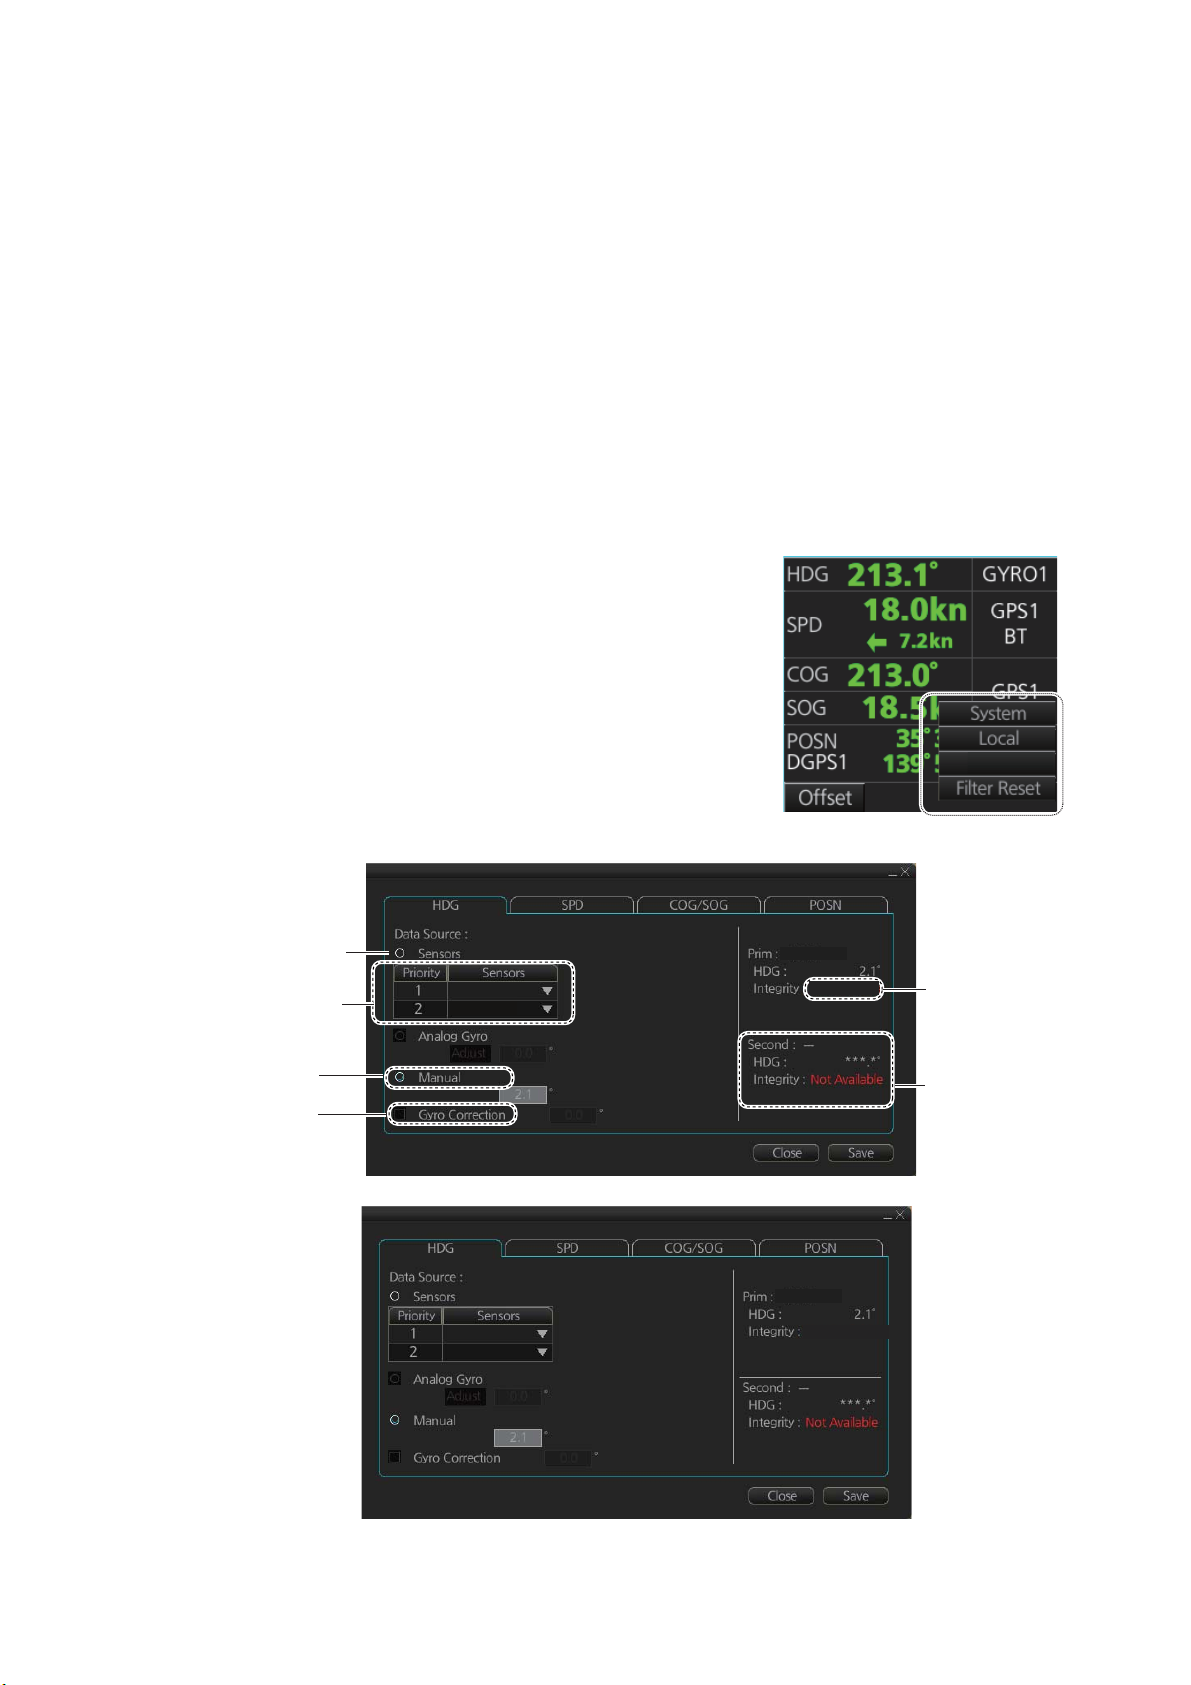
1.11 How to Enter Heading
Heading can be entered manually or automatically. Heading data is checked for integrity (see section 18.7 for details), and the data is judged as [Passed], [Doubtful] or
[Failed]. The integrity check results appear on the [HDG] page, shown below. (The results do not appears when the TCS is engaged.)
Passed (green): Data is available for comparison and data is normal.
Doubtful (yellow): Data is not available for comparison, but data is normal.
Failed (red): Data may or may not be available for comparison, and data is abnormal.
Note: If there is only one gyro connected to the ECDIS, heading data is compared to
COG from GPS. When the speed is five knots or less, and COG is unstable when it is
compared to heading data, the message “Doubtful” appears for heading data. When
the ship’s speed becomes greater than 10 knots and COG stabilizes, the message
disappears after a short while.
1. Right-click anywhere in the [Own ship information] box to show the context-sensitive menu.
2. Click [Open MENU].
1. INTRODUCTION
3. Click [System Sensor Settings] or [Local System
Settings] as applicable.
4. Click the [HDG] tab.
Fill circle for automatic
heading input
Sensor list
Fill circle for
manual heading
Fill circle for
gyro correction
GYO001
GYO002
Local sensor settings
GYRO1
Doubtful
Open MENU
Integrity
check
result
Second shows
Integrity as
“Not available”
when only one
gyrocompass
is connected.
GYO001
GYO002
GYRO1
Doubtful
System sensor settings
1-11
Page 30
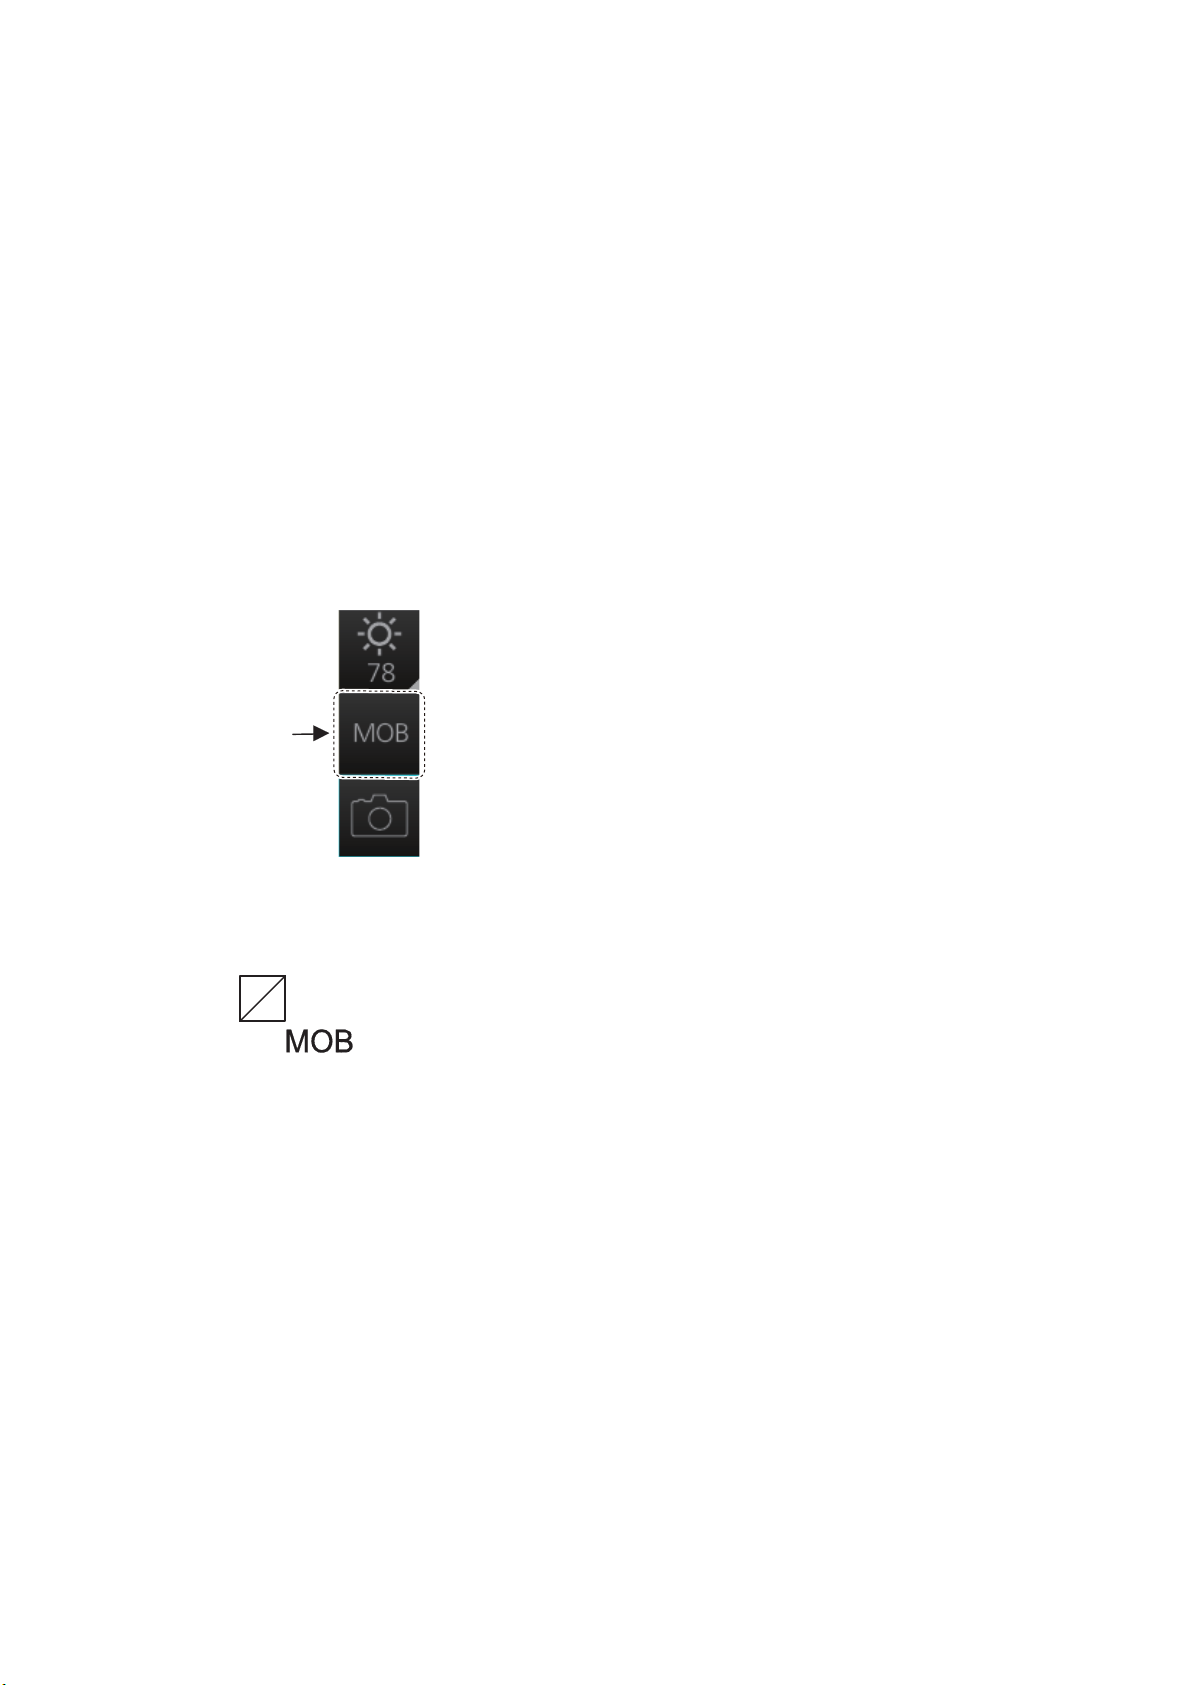
1. INTRODUCTION
5. For automatic input follow the procedure below. For manual input go to step 6.
1) Check [Sensors].
2) For local system settings, set the priority for each sensor connected, referring to
section 1.10.
3) Go to step 7.
Note: For the local sensor, an offset can be applied to the gyro reading if it is
wrong. Check [Gyro Correction], then spin the scrollwheel to set the offset.
6. For manual input, check [Manual]. Enter heading by spinning the scrollwheel or
entering numeric data with the keyboard on the Control Unit.
7. Click the [Save] button to save settings then click the [Close] button to close the
menu.
1.12 How to Mark MOB Position
Use the MOB (man overboard) feature to mark the position of man overboard on the
display screen. Access the [MOB] button (in any mode) on the InstantAccess bar.
[MOB]
button
The MOB mark (orange) instantly appears at the system position when the button is
operated.
Up to 100 MOB marks can be saved. When the capacity for MOB marks is reached,
the oldest mark is automatically erased to make room for the latest.
To hide an MOB mark, get into the Navigation voyage mode (NAVI) or Voyage planning mode (PLAN), right-click the mark to show the context-sensitive menu then select
[Hide MOB].
Exercise caution when using this feature in strong tide or current. The person will not
be at the MOB position for a very long time.
1-12
Page 31

1. INTRODUCTION
1.13 How to Select Time Format, Set Local Time
A GPS navigator feeds time and date data (ZDA sentence) to the ECDIS and they appear on the Status bar. Neither the time nor the date can be adjusted, however you
can select between UTC time (default) and local time. You can switch between the local time and the UTC time by left-clicking the Current time format indication.
Note: The date and time are yellow when the ZDA sentence is lost.
Current time format
Left click: Switch between
local and UTC times
Right click: Adjust local time
To set the local time, enter the time difference between the local time and the UTC
time as shown below.
1. Right-click the Current time format indication to show the context-sensitive menu
then click [Adjust Local Time] to display the [Local Time Adjust] dialog box.
2. Enter the time difference between the local time and the UTC time, in hours and
minutes. Use the button on the left to select the time offset direction. Select "+" if
the local time is ahead of the UTC time, or "-" if it is behind the UTC time.
Time
1.14 How to Take a Screenshot of the Display
Click the [Capture] button on the InstantAccess bar to take a screenshot and save it
to the SSD (Solid State Drive). You can save a maximum of 100 screenshots. When
the memory for screenshots becomes full, you cannot take any more screenshots. In
this case, delete unnecessary screenshots. You cannot take a screenshot when a
menu or a dialog box is open. Screenshots can be copied to a USB flash memory. For
how to process screenshots, see section 23.10.
[Capture]
button
1-13
Page 32

1. INTRODUCTION
1.15 The Settings Menu
The [Settings] button gives you access to the user profiles and the [Settings] menu.
The [Settings] menu has facilities for screenshot management, file management, diagnostic tests and customizing. See chapter 23.
[Settings]
button
1.16 How to Manage User Profiles
Ten sets of [Chart Display], [Symbol Display] and [Chart Alert] menu settings can be
stored in user profiles for later retrieval.
1.16.1 How to create a profile
1. Set the [Chart Display], [Symbol Display] and [Chart
Alert] menus as desired.
2. Click [ ] on the Status bar then click [Manage Profile].
3. Select a profile number from the “Profile” drop-down
list.
Note: Profiles 06-10 are disabled in the default setting. To enable a disabled profile, select the profile
to enable from the “Profile” drop-down list then uncheck [Disable this profile].
4. Click [Save Current Settings].
1.16.2 How to disable a profile
Select the profile to disable from the “Profile” drop-down list then check [Disable this
profile]. Profile 01 cannot be disabled.
1.16.3 How to restore default settings to a profile
Select the applicable profile from the “Profile” drop-down list then click [Restore Default Settings].
1-14
Page 33

1. INTRODUCTION
1.16.4 How to activate a profile
Click [ ] on the Status bar then click the profile number to activate.
Profiles
(enabled)
1.17 How to View ECDIS Software Version No., ECDIS
System Information, and Operator's Manual
You can show ECDIS program no., ECDIS
system information, and the operator's manual. Click the [?] button on the Status bar then
select [Manual] to show the operator's manual, or [About] to show ECDIS and system related information.
On the [About] screen, click the [Version] tab
to show the ECDIS software version no., conning software version no., S52 presentation library version, ENC user permit no., and C-MAP SDK software version no. Click
the [System 1] tab to show ECDIS system information: CPU type, RAM capacity, SSD
free/SSD capacity, Equipment ID and dongle information. [Function] shows the system’s capabilities. The [System 2] tab shows the startup time of the current session.
The information shown may be different than what appears on your display.
*
* Actual number appears.
Version and ID nos. subject to change.
ecdis,conning,ams
1-15
Page 34

1. INTRODUCTION
1.18 Split Screen
You can split the screen in two, horizontally or vertically, in the Voyage navigation
mode.
1.18.1 How to activate, deactivate the split screen
To activate the split screen or return to the full screen, click the [DISP] and [TWO
DISP] buttons on the InstantAccess bar to show the choices for screen division. Click
the screen division desired.
Full screen
Vertical split
screen
Horizontal split
screen
The example below shows the vertical split screen. The active display can be switched
by clicking an [ACTIVE] button at the top of the display. The dividing line between the
main and sub views cannot be moved.
Click ACTIVE button to
switch active display.
MAIN
VIEW
SUB
VIEW
Dividing line
1-16
Page 35

1.18.2 Function availability
Item
AIS target Yes Yes Yes Yes
Anchor watch Yes Yes Yes No
Chart display Yes Yes Yes No
Danger highlight Yes Yes Yes No
Divider Yes Yes Yes No
EBL, VRM Yes Yes Yes Yes
Parallel index lines Yes Yes Yes Yes
Radar overlay Yes No Yes -
Range rings Yes Yes Yes No
TT Yes Yes Yes Yes
1. INTRODUCTION
Viewable Operable
Main Sub Main Sub
Weather overlay Yes No Yes -
1.18.3 Split screen usage characteristics
• If the sub view is not displayed correctly, restore the full screen display then try to activate the split screen again.
• The display may not be updated when switching to the Voyage planning mode. If this
occurs, switch to the Voyage navigation mode, restore the split screen display then return to the Voyage planning mode.
• The own ship mark may not appear at the screen center when releasing the split
screen display. If this occurs, click the indication "TM/CU Reset" at the top right position on the screen to show the own ship mark at the screen center.
• The TM reset feature only works on the active display. To return the own ship mark to
the screen center, click the indication [TM/CU Reset] at the top right position on the
screen.
• The sub view can use a location and chart scale different from the main view.
• The chart scale related messages (overscale, larger ENC available, etc.), which appear beneath the chart scale indication, show only on the main view.
CAUTION
Changes to settings, including safety features such as safety contour, are only reflected on the main view when the split
screen is in use.
For that reason use caution when observing
the sub view.
1-17
Page 36

1. INTRODUCTION
1.19 Tips
This ECDIS provides operational tips for the display area and the InstantAccess bar.
To get a tip, simply put the cursor on an object. The tip appears to the right of the object. For example, put the cursor on the [BRILL] button on the InstantAccess bar. The
tip "Adjust brilliance" appears.
1.20 Printer Information
A Hewlett Packard (HP) printer may be connected to the system to print ENC Publisher's Notes, reports, logs, etc. The available HP printers are Officejet Pro 8000, Officejet Pro 8100 and Officejet 100 Mobile. No other makes or models are permitted.
Tip
1-18
Page 37

2. OPERATIONAL OVERVIEW
A
2.1 ECDIS Display
The ECDIS (Electronic Chart Display and Information Systems) screen is divided into
several areas, as illustrated below. (The illustration shows the layout for the FURUNOmonitor. The layout may be slightly different with the Hatteland monitor.)
Status bar
Instant
ccess
bar
Chart scale/presentation mode
Instant
box
Track
EBL1 box, EBL2 box
Cursor position
box
Electronic chart area
Permanent
warning box
TC:
TC: MANUAL
VRM1 box, VRM2 box
Sensor
information
box
Own ship
functions
box
Route
information
box
Overlay/
NAV Tools
box
Alert
box
• The Status bar provides for selection of operating mode, chart format, IMO chart display;
one-click restoration of IMO standard display, etc.
• The Sensor information box displays ship's speed, course and position and selects sensors.
• The Own ship functions box applies offset to the chart; changes geodetic data system, and
provides true motion reset.
• The Route information box shows route and waypoint data, when a route is selected for
navigation.
• The Overlay/NAV Tools box provides for setup of the radar overlay and navigation-related
functions.
• The Alert box shows operational and system alert messages.
• The VRM boxes measure the range to an object.
• The Permanent warning box displays chart-related warning messages.
• The EBL boxes measure the bearing to an object.
• The InstantAccess bar provides quick access to functions such as brilliance adjustment,
display palette and the menu. The contents change according to the ECDIS mode selected.
• The Chart scale/presentation mode box selects the chart scale and presentation mode.
• The Cursor position box shows the latitude and longitude position of the cursor and the
TTG to the cursor.
• The Electronic chart area shows the ECDIS chart.
2-1
Page 38

2. OPERATIONAL OVERVIEW
2.1.1 Electronic chart area
The ECDIS can use the following types of charts:
• S-57 (IHO)
• S-63 (IHO) (S-63 encrypted)
• ARCS (UKHO)
• CM-ENC (C-MAP by Jeppesen)
• CM-93/3 (C-MAP by Jeppesen)
The following information can also be displayed:
• Cursor (moved by trackball)
• Planned route
• EBL (Electronic Bearing Line) and VRM (Variable Range Marker)
• Radar image
• Own ship symbol with speed vector
• TT (Tracked Target, acquired from radar)
• AIS target
Electronic charts in ECDIS
The electronic navigational charts are displayed in the electronic chart area. There are
two kinds of electronic navigational charts available for use in the ECDIS:
• S57ed3 ENC or CM-93 (vector format)
• ARCS (raster format)
The ECDIS combines chart and navigational information. It should be noted that modern navigation systems (e.g., differential GPS) may offer more accurate positioning
than what was used to position some of the surveys from which the electronic navigational chart was derived.
S57 vector format
ECDIS is compatible with S57
Ed.3 ENC format charts. ENC
charts are converted to SENC
for use with ECDIS.
The details for the chart are displayed in the electronic chart
area and these can be modified.
You can change the chart scale
with the ZOOM IN and ZOOM
OUT functions, and the scale
range is 1:1,000 - 1:70,000,000.
2-2
Page 39

2. OPERATIONAL OVERVIEW
CM-93 vector format
The CM-93 charts require a contract with applicable provider. These charts are from
a private source and they cannot be used as a substitute for paper charts under any
condition. To emphasize this point these charts are called "Non-ENC" charts in this
manual. Note that some eToken dongles from the FEA-2xx7 can be used. These are
labeled “JeT FURUNO XXXXX”.
This ECDIS accepts the following C-MAP chart types: CM-ENC, Professional, Professional+ and Jeppesen Primary ECDIS Service.
C-MAP produced official ENC chart that complies with the IHO's (International Hydrographic Organization's) S-57 Edition 3 product specification. When used in an ECDIS,
the ENC data improves the safety of navigation at sea.
ARCS raster format
ARCS charts are digital reproductions of British Admiralty (BA) paper charts. They retain the same standards of accuracy, reliability and clarity as paper charts.
Zooming into the ARCS chart can be useful for magnifying a complex detail, however
this decreases the density of the data displayed, and can give a false impression of
the distance from danger.
2-3
Page 40

2. OPERATIONAL OVERVIEW
2.1.2 Status bar
The Status bar mainly provides for selection of operating mode, chart type and IMO
chart display setting.
NAVI
No. Button Description
1 Operating mode Selects the operating mode, ECDIS or conning. (If the conning display
is fed to a separate monitor, only ECDIS is available; the button is inop-
erative.)
2 NAVI Selects the Voyage navigation mode.
3 CHARTS Goes to the Chart maintenance mode.
4 PLAN Selects the Voyage planning mode.
5 OTHERS • Sets system in standby.
• Plays back log data (AMS connection must be off).
6 CHART ONLY Shows only the chart, when the left button is pressed and held down.
7 STD DISP Restores the IMO standard display instantly.
8 Chart priority Selects chart priority when both vector or raster are available.
9 Chart database Selects the pre-defined presentations of ENC content: IMO BASE, IMO
STD or IMO ALL. CUSTOM appears when the symbols selected or deselected on the [Chart Display] menu do not match the preset conditions
for IMO BASE, IMO STD or IMO ALL.
10 Displays the operator's manual, ECDIS program no. and system info.
11 Manages user profiles; opens the Settings menu.
12 Date • Displays the date.
• Selects the time to use, local or UTC.
• Sets the time difference between local and UTC (to use local time).
13 Time Shows the time, UTC or local.
14 Rotates clockwise if the system is working properly. If it is not spinning
the system is not working. Shortly after it stops spinning the buzzer
sounds. Reset the power to restore normal operation.
2-4
Page 41
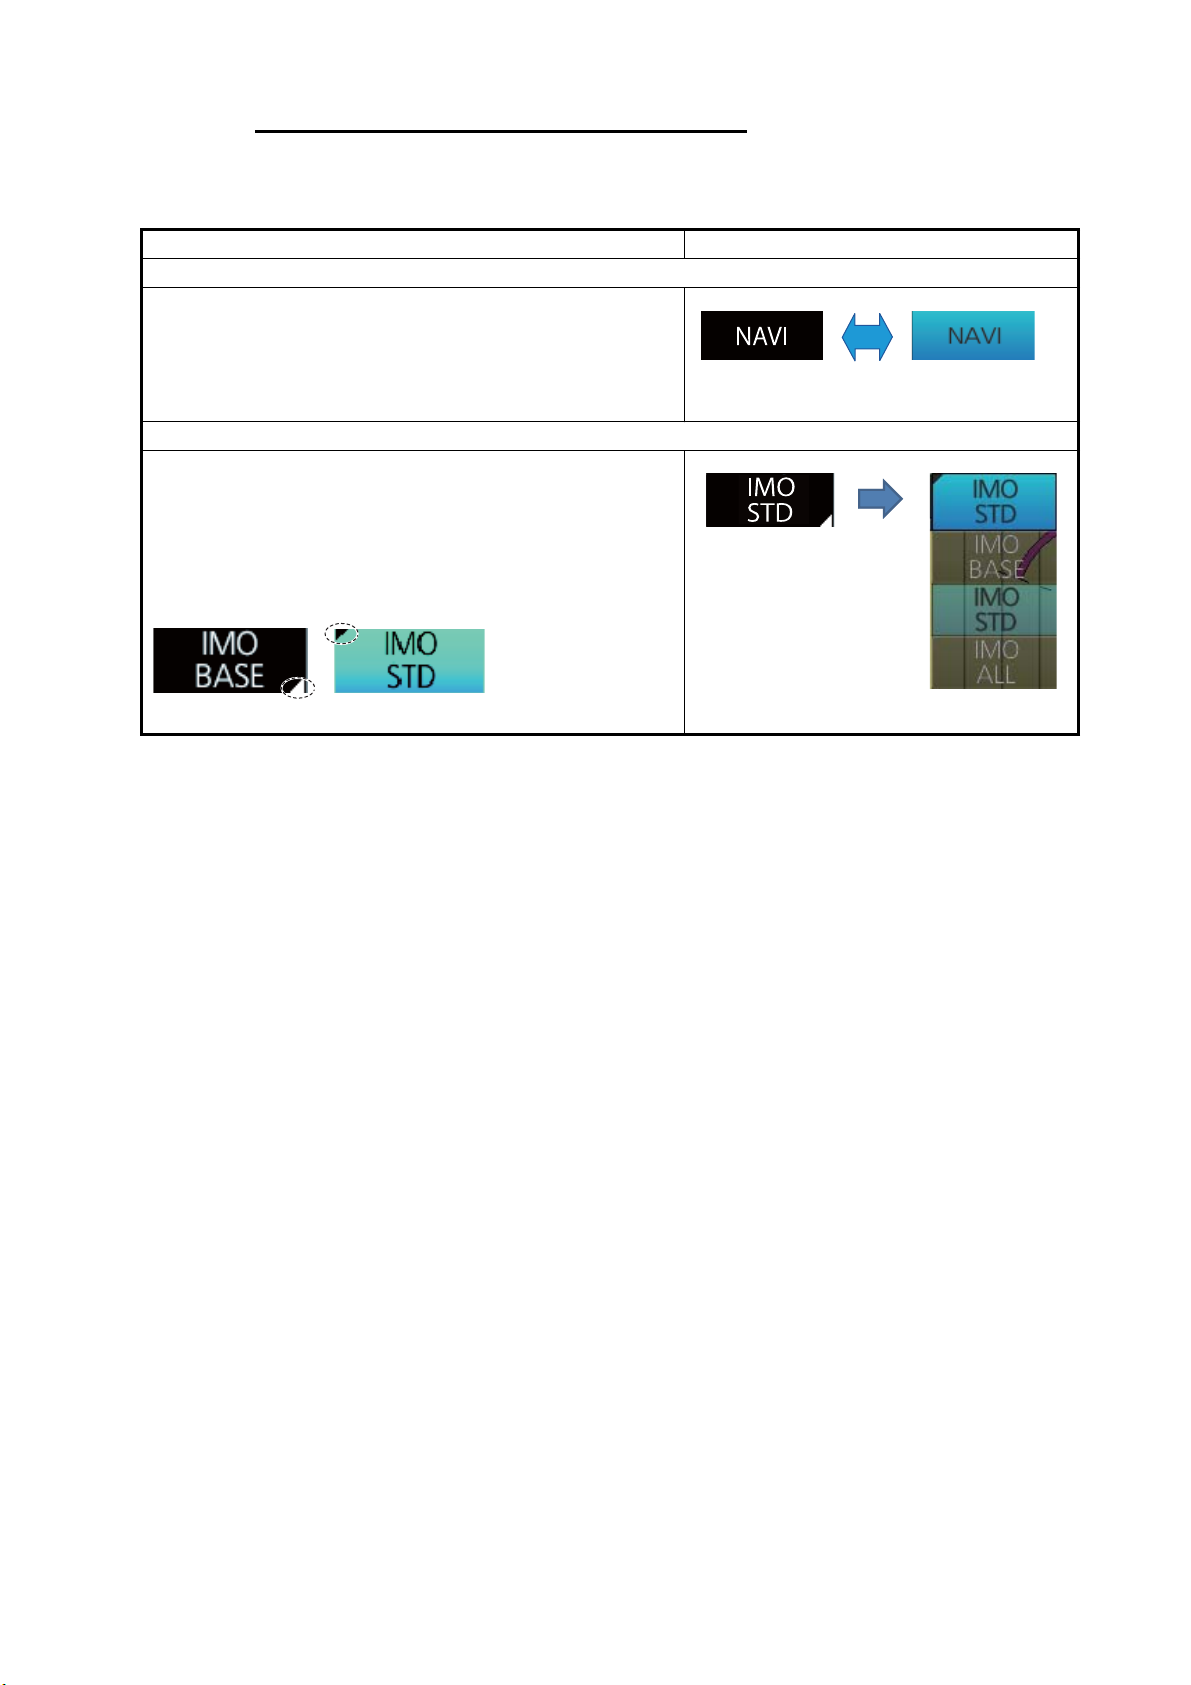
How to operate the buttons on the Status bar
There are two types of buttons on the Status bar: Toggle button and Drop-down list
button. You operate the buttons with the trackball module.
Button type Operating procedure
Toggle button
A toggle button alternately selects one of two functions
assigned to a button. The background color of a toggle
button is light-blue when the button’s function is enabled;
gray (default color) when disabled. The [NAVI] button is
an example of a toggle button.
Drop-down list button
A drop-down list button provides a drop-down list from
which to select an option related to the label on the button. The [Chart Database] button is an example of a dropdown list button. See the right figure. A drop-down list
button has a list status indicator whose position changes
according to list status.
2. OPERATIONAL OVERVIEW
OFF
(gray)
Click
button.
Click
button.
(light-blue)
ON
List closed List opened
2-5
Page 42

2. OPERATIONAL OVERVIEW
2.1.3 InstantAccess bar
The InstantAccess bar contains all the operating functions related to the selected ECDIS mode (Voyage planning, Voyage navigation and Chart maintenance). The bar is
divided into two sections, upper and lower. The buttons in the upper section change
according to the mode selected. The buttons in the lower section are static in all
modes. A button with a triangle mark at its bottom right corner indicates a button with
multiple functions.
[NAVI] button
activated
Instant
Track
[CHARTS] button
activated
[PLAN] button
activated
Voyage navigation
mode bar
2-6
Chart maintenance
mode bar
Voyage planning
mode bar
Page 43

2. OPERATIONAL OVERVIEW
Button Description
Voyage navigation mode bar
Minimizes the InstantAccess bar. To restore the maxi-
mized bar, click anywhere on the minimized bar.
Click
arrow
Click
anywhere
on the
minimized
bar
Route Route functions: select route, deselect route, move route to plan, monitor route.
Processes AIS Safety and Navtex messages. If you have un-
S
read Navtex or Safety messages, the icon changes as shown
N
right; “S” for unread Safety, “N” for unread Navtex, “S/N” for
unread Safety and Navtex.
Manual Update Shows the menu for manual update of chart objects.
Mini Conning Shows, hides the mini conning display.
Activates or deactivates the weather overlay.
Instant Track Creates a temporary track to return to or make a temporary detour from the mon-
itored course.
TCS Controls for use with specific Autopilots (see chapter 26). TCS Setting* has two
buttons for selection of steering mode, Go AW and Go SEA. TCS State shows or
hides the [Track Control Status] window.
*Not shown with Autopilot FAP-2000.
Chart maintenance mode bar
Minimizes the InstantAccess bar.
AUTO Load Automatically loads and installs ENC charts.
Manage Charts Deletes charts; installs charts manually.
Cell Status Finds cell status.
License Enters license information.
Public Key Shows the current public key. The public key changes each time a new one is
installed.
System Functions for chart synchronization. Sync Config selects the ECDIS units to syn-
chronize. Sync Status checks synchronization status. Reconvert reconverts out-
dated SENC charts to the corresponding current ones.
Voyage planning mode bar
Minimizes the InstantAccess bar.
Planning Creates routes and user charts.
Report Displays route and user chart reports.
Guide Box Shows or hides the guide box, which provides range and bearing measurement
between waypoints when creating a route.
Manage
Data
Manages routes and user charts. Route imports, exports, deletes routes. User
Chart deletes user charts. Data Import imports routes and user charts.
2-7
Page 44

2. OPERATIONAL OVERVIEW
Button Description
Common bar
Chart INFO Provides chart information. Chart Legend shows chart legend, in the Voyage
planning and Voyage navigation modes. Viewing Dates sets Display date and
Approved until dates. Chart 1 displays an overview of the ECDIS chart symbols.
DISP SET shows the [Basic Setting] dialog box, [Chart Display] menu, [Symbol Display]
menu, [Chart Alert] dialog box. TWO DISP splits the screen in two, vertically or
horizontally, in the Voyage navigation mode. AIO shows, hides the AIO overlay.
Keyboard shows, hides the software keyboard.
Record Displays Chart log (ENC, ARCS, C-MAP), Event log (user event, POSN event)*,
NAV log (Voyage, Details, Chart Usage), Target log (Danger Target).
*Voyage navigation and Voyage planning modes
Selects a color palette, day, dusk or night.
Adjusts the brilliance of a FURUNO or Hatteland monitor unit.
MOB Inscribes the MOB (ManOverBoard) mark.
Takes a screenshot.
Restores the previous condition in route and user chart creation.
How to operate the buttons on the InstantAccess bar
The InstantAccess bar has four types of buttons: toggle button, drop-down list button,
slider bar button, and specialty button. (The MOB, Capture and Undo buttons are specialty buttons that provide a single-action function.) The buttons can be operated with
the trackball module or the InstantAccess knob. This section shows you how to operate the buttons with the InstantAccess knob.
Toggle button Drop-down list button Slider bar button
[Palette] button
OFF
(gray)
ON
(light-blue)
Palette
choices
1. Push the InstantAccess knob to enable its use with the InstantAccess bar.
2-8
2. Rotate the InstantAccess knob to select a button. The background color of the
button selected is light blue.
3. Do one of the following depending on button type.
1) Toggle button: Push the knob to select setting.
2) Drop-down list button or slider bar: Rotate the knob to select an item or ad-
just the slider bar. Push the knob to confirm your selection or setting.
Note 1: You can use the ESC key to go back one step in the current operating
sequence.
Note 2: The InstantAccess knob only adjusts the slider bar on the
InstantAccess bar.
Page 45

2.1.4 Sensor information box
The sensor information box displays ship's heading, speed, course over the ground,
speed over the ground and position. When the user-selected sensor fails, the system
automatically selects another sensor. When this occurs, the color of the sensor name
changes from green to yellow. See the table below.
The digital indications and sensor names are
colored according to sensor state. See the
table below.
• HDG: Heading and its source.
• SPD: Longitudinal speed and its source.
The direction of transverse speed is indicated with arrows, , Starboard, , Port.
• COG: Course over ground and its source.
• SOG: Speed over ground and its source.
• POSN: Latitude and longitude position of
own ship and its source.
Note: The position source shall meet the requirements of IMO MSC.112(73).
2. OPERATIONAL OVERVIEW
Color of nav data indications and sensor name
The color of the nav data indications and sensor name change according to the state
of the sensor data. The table shown below provides basic information. For detailed information, see Appendix 4. When no sensor data is received, the sensor source indication is blank.
Nav data indication
Color of nav data
indication
Green White Sensor is normal.
Yellow White Validity of data is low or offset
is applied.
Red Red Validity of data is critically low.
Color of
sensor name
State
Green, data shown
with asterisks
(***.*)
Yellow Yellow Data is input manually (dead
No display Data is not being received.
reckoning).
2-9
Page 46

2. OPERATIONAL OVERVIEW
2.1.5 Own ship functions box
The own ship functions box shows information about own ship, enables offset, and does
TM reset.
Offset button
WGS84 button
RNC info
appears here.
• [Offset] button: See section 18.8.1. This button is only operative in the Voyage navigation mode.
• [WGS84] button: Convert position data between
datum; go to selected position on the current
chart. Click the button to show the dialog box below. To convert a position from one datum to another, select the datum source at the [Source] pulldown list and enter position. Select the datum to
convert to at the [Converted] pull-down list then
click the button. The position on the chart selected is shown below the [Converted] pull-down list.
To go to a position, click a [Go To] button.
• ENC info: ENC chart info appears here.
No indication: ENC chart is currently displayed.
"ENC data available": Currently, RNC chart is
shown, but ENC chart is available.
"Non-ENC data": Non-official ENC material, in yellow characters. See section 3.20.
• RNC info: "RNC data" appears (in yellow) when raster chart is in use.
• TM/CU status:
"TM/CU Reset": True motion reset is active. (Chart is stationary and own ship moves
on the chart.)
"TM Reset off": When dragging the chart; true motion is OFF. To restart true motion,
click the indication,
"Ship off screen": Ship is out of the display area.
ENC info
appears here.
TM/CU status
2-10
Page 47

2.1.6 Route information box
Asterisks appear in data locations when no route
is selected for navigation.
• Route: Name of monitored route
• Plan Speed: Planned speed to approach "To
WPT".
• Plan Course: Planned course between previous WPT and "To WPT".
• Course to Steer: Calculated set course to follow the monitored route, including off track, drift
and gyro error compensations.
• CH Limit: Planned width of channel to approach
"To WPT".
• Off Track: Perpendicular distance the ship is
from the intended track.
• TC: Track Control System status. No indication
if TCS is disengaged from the ECDIS.
• To WPT: The waypoint that the ship is approaching.
• DIST to WOP (Wheel Over Point): Distance to
the point where rudder order for course change
at "To WPT" is given.
• Time to Go: Time to go to WOP (hh:mm:ss).
• Turn RAD: Planned turning radius at "To WPT".
• Turn Rate: Calculated rate of turn that is based
on current speed and planned turning radius.
• Next WPT: The WPT following the "To WPT".
• Next Course: Next course (in degrees).
2. OPERATIONAL OVERVIEW
Minimize button
TC: MANUAL
Course to steer
Course to steer: 110°
Planned course: 90°
No current Current present
WOL
WOL
Course to steer: 120°
Planned course: 90°
Current
2-11
Page 48

2. OPERATIONAL OVERVIEW
2.1.7 Overlay/NAV Tools box
The Overlay/NAV Tools box sets up
the following:
• TT/AIS
• Echo (radar overlay)
• Parallel index lines
• Range rings
• Predictor (predicts ship’s future
movements)
• Under the keel clearance graphic
• Anchor watch
• Check area
See chapter 13 and 14 for TT/AIS descriptions. Refer to section 16.2 for the
radar overlay.
2.1.8 Alert box
The [Alert] box shows operational and system
alert messages, with alert ID no. and alert message. See chapter 20.
Page name
Minimize button
Page
selection
buttons
2.1.9 Permanent warning box
The permanent warning box displays chart-related
warning messages. The box cannot be closed or minimized.
2-12
Page 49

2.1.10 EBL, VRM boxes
The EBL measures the bearing to an object, and the VRM measures the range to an
object. See section 2.9.
2.1.11 Context-sensitive menus
Context-sensitive menus are available at the locations shown below. Right-click the
applicable area then select the appropriate item from the menu. The availability of the
context-sensitive menu depends on the mode in use, as shown in the table below.
2. OPERATIONAL OVERVIEW
Cursor info
display
Chart scale
Instant
Track
Electronic chart area
EBL reference
Item Functions
TC: MANUAL
TC:
ROT:
VRM
reference
Alert list,
Alert log
Mode and availability
NAVI CHART PLAN
Sensor
selection
Route selection,
route information
TT/AIS
page
Chart scale Drop-down list of chart scales. Yes Yes Yes
Cursor info display Switch cursor displays. Yes Yes Yes
Sensor selection Select sensors. Yes Yes Yes
Route selection, route
information
Select route; unselect route;
move route to plan; show
Yes No No
route info.
TT, AIS page Access TT, AIS functions. Yes Yes Yes
Alert list, Alert log Open alert list, alert log. Yes Yes Yes
VRM reference Select VRM reference; offset
Yes Yes Yes
(heading or north).
EBL reference Select EBL reference; offset
Yes Yes Yes
(heading or north).
Electronic chart area Ship offcenter; object info; ra-
Yes No Yes
dar info erase; chart legend;
manual update*; divider, hide
MOB, weather info**
*NAVI only **Available when weather overlay is active.
2-13
Page 50

2. OPERATIONAL OVERVIEW
2.1.12 How to enter alphanumeric data
On some screens it is necessary to enter alphanumeric data. The data can be input
three ways: keyboard of the Control Unit, software keyboard or trackball.
Alphanumeric data entry from the keyboard of the Control Unit
1. Click the input box.
Cursor
Input box example
2. Press appropriate keys and press the ENTER key.
Key Function Keyboard
TAB Move the selection cursor.
CAPS LOCK Switch between upper case
and lower case alphabet.
SHIFT Turn caps lock on and off
with the CAPS LOCK key.
BS Erase the character left of
the cursor.
ENTER Terminate keyboard input;
insert line feed.
, ,, Move cursor in direction of
arrow.
Spacebar Insert a space
CTRL No use.
Space bar
Alphanumeric data entry from the software keyboard
A software keyboard is also available for entry of alphanumeric data. Do as follows to
use the software keyboard. Display the keyboard before opening menus.
1. On the InstantAccess bar, press the [DISP], [ ] and [ON] buttons to show the
software keyboard. The [BS], [Enter], [], [],[ ], [] and [Spacebar] on the keyboard function the same as those keys on the keyboard of the Control Unit.
Space bar
2-14
Page 51

2. OPERATIONAL OVERVIEW
2. To switch between the alphabet keyboard and symbols keyboard, click the [!$&]
key.
Alphabet keyboard
3. Click the input box.
4. Click appropriate keys and finally click the [Enter] key.
To erase the software keyboard, click the X button at the top right corner of the keyboard.
Symbols keyboard
Alphanumeric data entry with the trackball module
The trackball module can also be used to enter alphanumeric data.
1. Put the cursor in the input box. Up and down arrows
appear at the right side of the box.
2. Enter data by one of the methods shown below.
• Spin the scrollwheel to set data. Upward to decrease the value; downward to
increase the value.
Note: The incrementing direction can be changed with [Wheel rotation] in the
[Customize] menu of the [Settings] menu.
• Click to increase the value; to decrease the value.
How to enter latitude and longitude data with the trackball module
The trackball module can also be used to enter latitude and longitude data.
1. Put the cursor in the input box. A selection cursor (lightblue) appears.
2. Enter data by spinning the scrollwheel.
3. To switch coordinate between N and S and vice versa,
put the cursor at the right edge of the input box. Dual arrows appear
4. Click to switch the coordinates. The method to switch E to W and vice versa is the
same.
2.2 How to Select the Operating Mode
Click the [Display Mode] button at the far left side of the Status
bar to select the operating mode, [ECDIS], [CONNING] or
AMS (option). [ECDIS] displays electronic charts. [CONNING]
display provides comprehensive navigation displays such as
wind direction and rudder angle, in analog and digital formats.
(Note that this button is inoperative if the conning display is fed
to another monitor.) See section 22.1. [AMS] opens the Alert
Management System. See Chapter 25.
Selection cursor
[Display Mode] button
2-15
Page 52

2. OPERATIONAL OVERVIEW
2.3 How to Select the ECDIS Operating Mode
The ECDIS has three operating modes: Voyage navigation, Chart maintenance, and
Voyage planning. Select the mode from the Status bar with the [PLAN], [CHARTS]
and [NAVI] buttons. The background of the button of the active mode is blue.
For Voyage navigation
mode
For Voyage planning
mode
ECDIS
For Chart maintenance
mode
Note 1: When switching between the Voyage navigation and Chart maintenance
modes it may take several minutes to read the chart database when using C-MAP
charts or there are many charts installed.
Note 2: If the equipment accepts no key operation after switching to the Chart maintenance mode, reset the power.
2.4 How to Select the Chart Scale
When you open a chart it is displayed with the default scale, called the compilation
scale. To change the chart scale, do one of the procedures shown below. The scale
range is 1:1,000 to 1:70,000,000.
• Click the chart scale selection buttons in the Chart scale/presentation mode box.
• Right-click anywhere inside the Chart scale/presentation mode to show a dropdown list of chart scales.
• Put the cursor anywhere on the chart and spin the scrollwheel.
Chart scale indication
Chart
related message
Note: When the radar overlay is active the chart scale is shown in nautical miles (NM).
The table below lists the chart related messages and their meanings.
Message Meaning Remarks
Display date is not current Displayed date is not the current
date.
Non-ENC data ENC non-compatible chart in use.
Large scale ENC available Larger scale available at current
position (TM reset ON) or cursor
location (TM reset OFF).
Overscale Scale too large.
Chart scale
selection buttons
2-16
Page 53

2. OPERATIONAL OVERVIEW
Message Meaning Remarks
RNC data RNC chart in use. ARCS only
Larger RNC available Larger RNC is available. ARCS only
Underscale Scale too small. ARCS only
ENC data available ENC data available for current
area.
WGS shift undefined WGS shift is not defined. ARCS only
RM(OFF) Relative motion off.
2.5 How to Select the Presentation Mode
The presentation mode is available in North-up TM, North-up RM, Course-up TM,
Course-up RM, Route-up RM and Head-up RM. To select a presentation mode, click
the presentation mode indication to cycle through the presentation mode choices, or
click the triangle to show the drop-down list of presentation modes.
ARCS only
Presentation mode
Click to show drop-down list of
presentation mode choices
2-17
Page 54

2. OPERATIONAL OVERVIEW
2.6 Cursor Position Box
The Cursor position box shows
• Cursor position in latitude and longitude
• Time to go to the cursor position
• The bearing (True or Relative) and range to the cursor position, or x-y coordinates
of cursor position. Click the bearing and range or x-y coordinates indication to
switch the display, in the sequence shown below.
Cursor position, Time to go
to cursor position
Bearing(T) and range to cursor position
Bearing(R) and range to cursor position
x-y coordinates of cursor position
2-18
Page 55

2.7 True Motion Reset
In the true motion mode, the chart is stationary and own ship moves on the screen.
With TM reset active, own ship moves until it reaches the true motion reset borderline(s), then the chart is redrawn and own ship jumps back to an opposite position on
screen based on its course. (This resetting can also be done manually by clicking the
[TM/CU Reset] button.) When the TM reset function is active, "TM/CU Reset" appears
at the right side of the display.
TM reset borderline setting
(Ring does not appear on the display.)
OWN SHIP
2. OPERATIONAL OVERVIEW
OWN SHIP
TM
Reset
How to enable, disable automatic TM reset
To enable automatic TM reset, click the [TM Reset off] indication at the right side of
the display to show [TM/CU Reset].
Click
When the TM reset is disabled, change the chart scale with the scrollwheel and scroll
the chart by drag and drop. The own ship information box shows [TM Reset off]. When
own ship moves off the screen the box shows [Ship off screen].
How to set the true motion reset borderline
You can set the limit for TM reset (in percentage) on the [Basic Setting] page. See
section 4.2.2.
2-19
Page 56

2. OPERATIONAL OVERVIEW
2.8 How to Control Route and User Charts in Voyage
Navigation and Voyage Planning Modes
Click for Voyage navigation mode Click for Voyage planning mode
Functions in Voyage navigation mode Functions in Voyage planning mode
Click the appropriate chart mode button [PLAN] or [NAVI] at the top of the display to
go to respective mode. For the Voyage navigation mode, click the [Route] button then
click the button corresponding to the action to take. For the Voyage planning mode,
click the [Planning] button followed by the [Route] button to select a route, or [User
Chart] button to select a user chart.
Voyage navigation mode functions Voyage planning mode functions
Select: Selects the route to use in the Voy-
age navigation mode.
Unselect: Deselects active route. User Chart: Shows the [User Chart] dialog
Move to Plan: Moves active route to Voy-
age planning mode.
Route INFO: Shows the [Route Information] dialog box.
Route: Shows the [Route Plan] dialog box
to create or edit a route.
box to create or edit a user chart.
2-20
Page 57

2.9 How to Use the VRM and EBL
The VRM measures the range to an object and the EBL measures the bearing to an
object. There are two each of VRMs and EBLs. The lengths of the dashes on the EBL2
and VRM2 are longer than those of the EBL1 and VRM1 to distinguish them. The color
of the VRMs and EBLs is orange.
VRM1
EBL2
VRM2
EBL1
2. OPERATIONAL OVERVIEW
TT
EBL no.
240.8°
EBL bearing
EBL On/Off
T
EBL reference
VRM no.
VRM range
2.9.1 How to hide/show an EBL, VRM
Control Unit: Push EBL or VRM key to hide or show respective marker.
Trackball: Click the arrow on an EBL or VRM box to hide the respective marker. To
redisplay the marker, click the minimized box.
2.9.2 How to measure the range and bearing
Range: Put the cursor on the VRM then drag the cursor until the VRM is on the inner
edge of the object.
Bearing: Put the cursor on the EBL then drag the cursor until the EBL bisects the object.
VRM On/Off
2.9.3 How to select bearing reference
The EBL bearing reference can be true or relative. Click the EBL reference indication
to display T (True) or R (Relative).
2-21
Page 58

2. OPERATIONAL OVERVIEW
2.9.4 EBL, VRM functions available with the context-sensitive menu
The EBLs and VRMs have additional functions that are accessed from the contextsensitive menu. Right-click any VRM or EBL box to show the context-sensitive menu.
Function Description
Centered Centers the origin of the EBL and VRM on the current position.
Ground Anchors the EBL and VRM to ground; neither the EBL or VRM move
with ship's movement.
Offset HDG
Offset North
Drag and drop EBL, VRM
on desired location.
Drag and drop EBL, VRM
on desired location.
Select
[Offset
HDG].
When vessel changes course, the
EBL, VRM move so that the angle (D)
to their centers stays fixed.
Select
[Offset
North].
The EBL, VRM move to keep the
angle from North to the center of the
EBL, VRM, even if the vessel
changes course. The distance to the
center of the EBL, VRM is fixed.
2-22
Page 59

2.10 Datum
2.10.1 General
Datum is a mathematical model of the earth based on which a sea chart is produced.
If the datum of a position sensor and that of a sea chart are different, a transformation
has to be made somewhere in the system. Not doing so can result in errors of several
sea miles. The difference between two datum is never constant, but depends on position. This means that the difference between WGS-84 and local datum, generally
used in paper charts, is not generally valid with electronic sea charts.
2.10.2 Paper charts
Datum used in paper charts have been traditionally national datum for historical reasons. Many paper charts do not have a marked datum, therefore compatibility with
electronic charts may be complicated. In some paper charts, the correction terms are
printed in lieu of datum, for correction of the WGS-84 system satellite locations. The
correction terms are usable but only with the paper chart in question.
2. OPERATIONAL OVERVIEW
2.10.3 Electronic sea charts
• The ENC vector material has to be produced by a National Hydrographic Office in
the WGS-84 datum.
• The ARCS (raster) material includes polynomials for each chart, making it possible
for the ECS system to solve the difference between the WGS-84 datum and the local datum with an accuracy sufficient for authority responsibility. In some charts, the
mentioned difference is not known with sufficient accuracy, resulting in displaying a
message in the Cursor position box when displayed in ARCS compatible systems.
2.10.4 Positioning devices and datum
In early days of electronic positioning devices, datum received little attention because
the commonly used systems utilized special charts (like Decca charts). Later on, data
output was added to these systems, but still no attention was paid to datum and the
position errors were considered as an inaccuracy of the system. With the spread of
the GPS, however, datum has become better known. An accurate position is of no value if co-ordinates are in a wrong datum. GPS satellites utilize the WGS-84 datum.
2.10.5 ECDIS and datum
The ECDIS uses ENC material, produced to standards using WGS-84 datum. Positioning devices connected to the ECDIS must work in the WGS-84 datum. IMO requires that the ECDIS must give an alert if the datum of a positioning device is not the
WGS-84.
2-23
Page 60

2. OPERATIONAL OVERVIEW
2.11 Set up Before Departure
2.11.1 Updates before departure
Update chart material
Update your chart material before embarking on a new voyage. See section 3.21.
Display and approve dates for charts and manual updates
Note: It is very important that you set the Display and Approve dates for charts as the
current date.
There may be features that require chart viewing dates or seasonal dates in charts.
Accordingly, if you have not set Display and Approve dates as the current date there
is a possibility that you can get a wrong presentation or some feature may be absent.
See section 5.2.
Create or update user chart, Notes
If necessary, create a new user chart and Notes or modify existing ones. See
chapter 10.
Chart alert calculation
Set chart alert areas suitable for your coming voyage, on the [Check Area] page in the
[Overlay/NAV Tools] box. See section 8.2.
2.11.2 Create or update a route
Create a new route or modify an existing one. See chapter 9.
2-24
Check your route against chart alerts
Before you sail your route, you should always check your route against chart alerts.
This is important because your S57 charts and manual updates may contain chart
viewing dates information. You can check chart alerts from the [Check Results] page
on the [Route Plan] dialog box.
The following information is stored with the monitoring route plan:
Page 61

2. OPERATIONAL OVERVIEW
Conditions for chart alerts during route monitoring, which includes safety contour
and other chart alerts, on the [Alert Parameters] page of the [Route Plan] dialog
box.
Route Bank
Name of the user chart to be used during route monitoring together with this
planned route, on the [User Chart] page of the [Route Plan] dialog box.
Name of the Notes to be used during route monitoring together with this planned
route, on the [User Chart] dialog box.
Check in Notes column indicates Notes is used with route monitoring and planned route
2-25
Page 62

2. OPERATIONAL OVERVIEW
Recalculate timetable and ETA values
Timetable and ETA values can be recalculated from the [Optimize] page in the [Route
Plan] dialog box. Minimally set ETD to equal departure time, and set optimization values.
Route Bank
2.11.3 How to check and prepare route to monitor
Select a route for the voyage: In the Voyage navigation mode, click the [Route] button
followed by the [Select] button, or right-click the route indication in the [Route Information] box (right edge of screen) then select [Select Route]. See chapter 11.
Note: A route cannot be opened if its planned settings are different from its navigation
settings. The reason is given on the [Select Route] dialog box. In this case, open the
route in the Voyage planning mode and click the [Check Route] button, on the [Alert
Parameters] page. Adjust the route as necessary.
The To WPT can be selected, however WPT 01 cannot be selected.
2-26
Page 63

2. OPERATIONAL OVERVIEW
Select confirm conditions of the route plan
Check the setting on the [Chart Alert] dialog box; click the [DISP], [SET] and [Chart
Alert] buttons to show that dialog box.
Planned user chart, Notes
To check what planned user chart is selected, open the [Route Information] dialog box
and click the [User Chart] tab. The name of the user chart(s) to be used is in the
[Linked User Chart] window.
2-27
Page 64

2. OPERATIONAL OVERVIEW
2.11.4 Check configuration of navigation sensors
You can check the configuration of your navigation sensors in the [System Sensor
Settings] page and [Local System Settings] page in the [Sensor] menu.
Check speed settings ([SPD] page)
Open the menu and click the [SPD] tab in the [System Sensor Settings] page or [Local
System Settings] page. The user can select navigation sensors for use in navigation
and view their current values.
SPD:
Integrity: Passed
SPD page, local sensor
SPD:
Integrity: Passed
SPD page, system sensor
If there is no value shown for a sensor, this means that the sensor is not valid. Note
that the content of these pages depends on the sensors that are in use on the ship.
The content of the display changes with sensor.
Note that manual speed should only be used in an emergency, when no other speed
reference is available. Remember that position sensors are also available as speed
sources.
2-28
Page 65

2. OPERATIONAL OVERVIEW
Check position sensors (POSN page)
Open the menu and click the [POSN] tab in the [System Sensor Settings] page or [Local System Settings] page. The [Prim] and [Second] labels indicate the type of the position sensor. (In the figure below the [Prim] label shows FILT). [Prim] and [Second]
indicate sensor status and priority.
FILT
LAT:
LON:
Integrity: Passed
LAT:
LON:
Integrity: Not Available
35°15.743’N
139°50.064’E
Second shows Integrity as “Not available” when
only one position-fixing equipment is connected.
Only one sensor can be Primary1 while the others are Primary2 or off position. After
a sensor is turned off, its status is changed to Primary2 state. When a position sensor
state is changed to Primary1 and another sensor was Primary1, the sensor formerly
primary1 becomes Primary2.
Select the Primary1 navigation sensor as the sensor that is considered to be most accurate and reliable. Set all other navigation sensors as Primary2.
2.11.5 How to reset odometer and trip meter
To reset the odometer and/or trip meter do as follows:
1. Open the menu and select the [Voyage] menu from the [NAVI Log] menu.
2. Click one of the following buttons as appropriate.
Reset Trip: Reset the trip distance (ground and water).
Reset All: Reset both the odometer and the trip meter (ground and water).
3. Click the [Close] button to finish.
2-29
Page 66

2. OPERATIONAL OVERVIEW
This page is intentionally left blank.
2-30
Page 67

3. HOW TO MANAGE CHARTS
This chapter mainly shows you how to install the public keys, licenses and charts,
manually update chart objects, and synchronize charts. All chart-related operations
begin from the Chart maintenance mode, which you access by clicking the [CHARTS]
button on the Status bar.
Note 1: Charts, routes and user charts are shared with other FMD-3xx0, FCR-2xx9
and FAR-3x00 units, via LAN. Data is shared automatically; no operation is required.
Note 2: Chart processing (installation, deletion, etc.) may take several minutes depending on the number of charts to be processed.
Note 3: If, when attempting to install charts, nothing appears on the display at the start
of the procedure, reset the power and try again.
Note 4: If installation of AVCS charts stops, the message "Chart installation has
stopped. Run the installation again. Installation will continue from the chart not yet installed." appears. This does not indicate completion of the installation. Restart the installation. The installation resumes from the chart not yet installed.
This message may also appear when installing CM-ENC, C-MAP Professional and
C-MAP Professional+ charts if the user does not confirm completion of the installation
within approx. one hour. (Installation window remains on the screen.) However, this is
not an indication of failed installation.
Note 5: When installing the AVCS LargeMedia, the message "No connection to dongle" may appear in the [Error/Warning Guidance] window at the completion of the installation. If this occurs, reinstall the media.
3.1 How to Install Public Keys for ENC Charts
Public keys authenticate the source and integrity of the ENC chart materials used in
this chart system. Before you install a new ENC chart, confirm that the corresponding
public key is installed.
1. Set the medium (DVD, USB flash memory, etc.) that contains the public key. (The
IHO public key is preinstalled.)
2. Get into the Chart maintenance mode then click the [Public Key] button on the
InstantAccess bar.
3. Click the [Load New Key] button to show the [Open File] dialog box.
4. Find the .pub file then click the [Open] button. The [Public Key] dialog box reap-
pears.
3-1
Page 68

3. HOW TO MANAGE CHARTS
5. Click the [Display Content] button on the [Public Key] dialog box to show the display contents.
Public Key content
//BIG p
FCA6 82SE8E12CABA26EFCCF7110E526D
B078B05EDECBCD1EB4A208F3AE1617AE
01F35B91A47E6DF63413C5E12ED08998
CD132ACD50D99151BDC43EE735792E17
//BIGq
FCA6 82SE8E12CABA26EFCCF7110E526D
B078B05EDECBCD1EB4A208F3AE1617AE
01F35B91A47E6DF63413C5E12ED08998
CD132ACD50D99151BDC43EE735792E17
6. To accept the contents, click the [Activate] button on the [Public Key] dialog box.
3.2 How to Install ENC Licenses, Charts
Install your ENC licenses and charts, in that order.
3.2.1 How to install an ENC license
Automatic installation
1. Set the medium (DVD, USB flash memory, etc.) that contains the ENC license.
2. Get into the Chart maintenance mode then click the [License] button on the
InstantAccess bar to show the [Licenses] dialog box.
3. Click the [Install Licenses] button.
3-2
4. Select the medium that contains the license then click the [Open] button.
Page 69

3. HOW TO MANAGE CHARTS
5. Find the license (permit.txt) then click the [OK] button to install the license.
The [Licenses] dialog box then shows cell name, date of expiration, data server
name and subscription type of the license.
31 Sep 2015
31 Sep 2015
31 Sep 2015
31 Sep 2015
31 Sep 2015
31 Sep 2015
31 Sep 2015
31 Sep 2015
31 Sep 2015
31 Sep 2015
6. Click the [Close] button to finish.
Manual installation
If you do not have the medium which has your ENC license, you can enter the license
number manually.
1. Click the [CHARTS] button on the Status bar to go the Chart maintenance mode,
then click the [License] button on the InstantAccess bar.
2. Click the [Input Manually] button to show the [Input License Manually] box.
3. Select the type [ENC/ARCS] at the bottom of the screen.
4. Enter the license number(s) then click the [OK] button.
3.2.2 How to install ENC charts
When you install charts from a medium, the system first loads a catalog, which stores
certain information into your SSD such as cell IDs, their position, and edition number,
from the install medium. Then, the system asks which charts you want to install from
the chosen medium. After building the catalog, you can view the contents of it by clicking the [Cell Status] button.
Note: Do not cancel the installation (with the [Cancel] button) while it is in progress.
Cancellation automatically resets the power, stopping the installation. If the power is
reset, try to install the charts again. If the installation fails, reset the power and try
again.
1. Set the medium that contains the ENC charts.
2. Get into the Chart maintenance mode then click the [AUTO Load] button on the
InstantAccess bar. A prompt informs you that it may take a while to do the installation and are you sure to continue. Click the [OK] button to continue. A message
3-3
Page 70

3. HOW TO MANAGE CHARTS
informs you that the system is searching the medium (in the figure below the medium is a DVD) for chart data.
The results of the search are displayed, an example of which is shown below. To
cancel the installation, click the [Cancel] button.
3. Click the [OK] button to install the charts. The [Install chart data] window appears
and shows the percentage of completion, with digital and analog indications.
To show details during the installation, click the [Show detail] button.
3-4
To close the [Message] window, click the [Hide detail] button.
Page 71

3. HOW TO MANAGE CHARTS
4. When the installation is
completed, information
about the installation appears in the [Error/Warning/Guidance] window.
Click the [Confirm] button
to finish.
5. If applicable, set the next
sequential medium and
repeat steps 2-4 to install
the next charts.
Note 1: When many charts
are installed, the ECDIS
checks for error in the installed chart data at the next power up. This is not an indication of malfunction.
Note 2: Previous versions of charts cannot be displayed if installed after installing the
latest versions.
100%
3.3 How to Install ARCS Licenses, Charts
3.3.1 How to install an ARCS license
An ARCS license can be installed automatically or manually. The procedure which follows is for automatic installation. For manual installation, see "Manual
installation" on page 3-3.
Note: Do not cancel the installation (with the [Cancel] button) while it is in progress.
Cancellation automatically resets the power, stopping the installation. If the power is
reset, try to install the charts again. If the installation fails, reset the power and try
again.
1. Insert the medium (DVD, USB flash memory, etc.) that contains the ARCS license.
2. Get into the Chart maintenance mode then click the [License] button on the
InstantAccess bar to show the [Licenses] dialog box.
3-5
Page 72

3. HOW TO MANAGE CHARTS
3. Click the [Install Licenses] button.
4. Find the medium that contains the license then click the [Open] button.
5. Click the [OK] button to install the license.
4937 31 Mar 2015 N
3249 31 Mar 2015 N
4937 31 Mar 2015 N
1473 31 Mar 2015 N
2376 31 Mar 2015 N
4173 31 Mar 2015 N
6. Click the [Close] button to finish.
3.3.2 How to install ARCS charts
When you install charts from a medium, the system first loads a catalog, which stores
certain information into your SSD such as cell IDs, their position, and edition number,
from the install medium. Then, the system asks which charts you want to install from
the chosen medium. After building the catalog, you can view the contents of it by clicking the [Cell Status] button.
Note: Do not cancel the installation (with the [Cancel] button) of a chart while it is in
progress. Cancellation will automatically reset the power, stopping the installation. If
this occurs, try to install the chart again. If the installation fails, reset the power and try
again.
1. Set the medium that contains the ARCS charts.
ARCS License
Delete Licenses
Export List
3-6
2. Get into the Chart maintenance mode then click the [AUTO Load] button on the
InstantAccess bar. A prompt informs you that it may take a while to do the installation and are you sure to continue. Click the [OK] button. A message informs you
Page 73

3. HOW TO MANAGE CHARTS
that the system is searching the medium (in the figure below the medium is a
DVD) for chart data.
The results of the search are displayed, an example of which is shown below. To
cancel the search, click the [Cancel] button.
3. Click the [OK] button to install the charts. The [Install chart data] window appears
and shows the percentage of completion, with digital and analog indications.
To show details during the installation, click the [Show detail] button.
To close the [Message] window, click the [Hide detail] button.
3-7
Page 74

3. HOW TO MANAGE CHARTS
4. When the installation is completed, information about the installation appears in
the [Error/Warning/Guidance] window. Click the [Confirm] button to finish.
5. If applicable, set the next sequential medium then repeat steps 2-4 to install the
next charts.
Note 1: When many charts are installed, the ECDIS checks for error in the installed
data at the next power up. This is not an indication of malfunction.
Note 2: If, after installation, no ARCS chart appears, delete all ARCS charts and then
reinstall them.
3-8
Page 75

3. HOW TO MANAGE CHARTS
3.4 How to Delete ENC, ARCS Licenses
1. Get into the Chart maintenance mode.
2. Click the [License] button on the InstantAccess bar.
3. Click the [ENC] or [ARCS] tab as appropriate to show a list of licenses.
31 Sep 2015
31 Sep 2015
31 Sep 2015
31 Sep 2015
31 Sep 2015
31 Sep 2015
31 Sep 2015
31 Sep 2015
31 Sep 2015
31 Sep 2015
4. Put a checkmark next to the license(s) to delete.
5. Click the [Delete Licenses] button to delete the license(s) selected.
3.5 How to Read ENC Judgment Information
You can find out if your installed ENC charts are official or unofficial, with the [Producer
Code] button in the [Licenses] dialog box. The following functions use this feature.
• [Filter] window (see section 3.15) can show or hide official or
unofficial charts.
• .Chart judgment is shown for unofficial charts on the [Check Results] of the [Route
Plan] dialog box (see section 9.3.5) if the corresponding alert check is active.
1. In the Chart maintenance mode, click the [License] button to show the [Licenses]
dialog box.
2. Click the [ENC] tab.
3. Click the [Producer Code] button.
Official:
Official
Unofficial
4. Select the judgment information file then click the [Open] button.
3-9
Page 76

3. HOW TO MANAGE CHARTS
3.6 How to Install C-MAP Charts
Synchronize chart data before you install C-MAP charts, grouping the ECDIS units to
synchronize, otherwise the chart data cannot be shared. See the procedure in
section 3.22.1 for how to synchronize chart data. If C-MAP charts are not synchronized after installation, delete all C-MAP charts, and do the above procedure again.
3.6.1 How to register the eToken
The eToken is a hardware mechanism (installed inside the PCU) used for password
authentication. Registration of the eToken is required only once, before you install the
C-MAP database.
1. Get into the Chart maintenance mode then click the [License] button on the
InstantAccess bar to show the [Licenses] dialog box.
2. Click the [C-MAP] tab to the show the [Licenses] dialog box for C-MAP.
E-mail size
1MB▼
3. Click the [C-MAP Setup] button.
4. You are asked if you are sure to continue; click the [OK] button to continue and
register the eToken.
Note 1: "CMAP: No connection to eToken" disappears from the Permanent warning
box after completion of the registration.
Note 2: You can show your CMAP system ID by clicking the
[C-MAP System ID] button on
C-MAP system ID
appears here.
the [Licenses] dialog box for CMAP.
3.6.2 How to install the C-MAP database and licenses
When you install the C-MAP database from a medium, all data is saved to the SSD.
Note 1: If several ECDIS units are installed, synchronize C-MAP charts among the
units
after you have installed the database.
3-10
Note 2: The installation of a chart cannot be cancelled while it is in progress. If you get
an error message, try to install the charts again.
Note 3: Disable the Chart Alert function at the [Check Area] page of the [NAV Tools]
box (see section 8.2) before removing any C-MAP charts.
Note 4: The C-MAP database in the units selected for synchronization are synchronized upon the successful completion of the database installation.
Page 77

3. HOW TO MANAGE CHARTS
How to install the C-MAP database
1. Insert the medium that contains the C-MAP database.
2. Get into the Chart maintenance mode then click the [AUTO Load] button on the
InstantAccess bar.
The [Install chart data] window appears and shows the percentage of completion,
with digital and analog indication.
To show details during the installation, click the [Show detail] button.
To close the [Message] window, click the [Hide detail] button.
3. When the installation is completed, information about the chart database installed
appears in the [Error/Warning/Guidance] window. Click the [Confirm] button to finish.
4. If applicable, set the next sequential medium and repeat steps 2-3 to install the
next databases.
Note 1: If, after installation, C-MAP Pro+ charts do not appear, delete all corresponding charts and then reinstall them.
3-11
Page 78

3. HOW TO MANAGE CHARTS
Note 2: Synchronization is not done for charts which could not be installed successfully. Reinstall failed charts.
How to install C-MAP licenses
A C-MAP license file is normally installed automatically. Manual installation is also
available.
Automatic installation:
1. Set the medium (DVD, USB flash memory, etc.) that contains the C-MAP license.
2. Get into the Chart maintenance mode then click the [License] button on the
InstantAccess bar.
3. Click the [Install Licenses] button.
4. Select the medium that contains the license then click the [Open] button.
5. Click the [OK] button to install the license.
6. Click the [Close] button to finish.
Manual installation:
1. Click the [CHARTS] button on the Status bar to go the Chart maintenance mode,
then click the [License] button on the InstantAccess bar.
2. Click the [Input Manually] button to
show the [Input License Manually]
box.
3. Select the type [C-MAP] at the bottom of the window.
4. Enter the [Database name] and
[Collection name] information as
shown in the
table below. Enter the names exactly as shown to ensure correct installation.
Database name Collection name
Chart type
Professional:
Professional+:
CM-ENC:
JeppesenPRIMAR:
Name to enter
World
Professional+
ENC
JeppesenPRIMAR
Enter the contracted zone number according to chart
type as follows:
Professional/Professional+: Enter “Zone *” (without quotations)
Ex. Zone 0
CM-ENC/JeppesenPRIMAR: Enter “Zone * ENC”
(without quotations)
Ex. Zone 0 ENC
*=Zone no.
3-12
5. Enter the license (max. 16 characters) in the bottommost window.
6. Click the [OK] button to finish.
Page 79

3. HOW TO MANAGE CHARTS
3.6.3 How to generate, order and apply an update file
How to generate and order an update file
To update the C-MAP chart database, you have to generate an update file, and e-mail
the file directly to C-MAP. The update file defines coverage of charts you can display
on your chart radar.
1. Connect a USB flash memory to the USB port on the Control Unit.
2. Get into the Chart maintenance mode then click the [License] button on the
InstantAccess bar.
3. Click the [C-MAP] tab to show the [Licenses] dialog box for C-MAP.
4. From the [E-mail Size] drop-down list, select the size of the update file. The choices are [100KB], [200KB], [300KB], [400KB], [500KB], [750KB], [1MB], [2MB],
[3MB], [4MB], [10MB], [Unlimited]. This is the size of the data file in an e-mail. The
file may be sent in pieces depending of the size selected.
5. Click the [Order Update File] button. A file name (C-MAP system ID and chart
type) is automatically created, with the extension .ord.
6. Select the USB flash memory.
7. Click the [Save] button to save the order file to the USB flash memory.
8. Send the order file to updates@c-map.no.
Within a few minutes you will receive a file that includes the terms for using the chart
service and the chart updates. Save the file to a USB flash memory and apply it as
shown in the next section.
How to apply the update file
1. Insert the USB flash memory that contains the update file (.ans extension) into the
USB port on the Control Unit.
2. Get into the Chart maintenance mode then click the [License] button on the
InstantAccess bar.
3. Click the [C-MAP] tab to show the [Licenses] dialog box for C-MAP.
4. Click the [Update from File] button.
5. Find the update file on the USB flash memory then click the [Open] button.
3-13
Page 80

3. HOW TO MANAGE CHARTS
3.7 How to Delete a C-MAP Database
1. Get into the Chart maintenance mode then click the [License] button on the
InstantAccess bar.
2. Click the [C-MAP] tab to show the [Licenses] dialog box for C-MAP.
3. Select the database to delete with the [Database] pull-down list.
4. Click the [Delete Database] button.
3.8 How to Install C-MAP DL (Dynamic Licensing)
Charts
Register the eToken if it has not already been registered. See section 3.6.1.
3.8.1 How to generate, order and apply an update file
How to generate and order an update file
To update the C-MAP chart database, you have to create an update file, and
e-mail the file directly to C-MAP. The update file defines coverage of charts you can
display on your ECDIS.
1. Insert a USB flash memory to the USB port on the Control Unit.
2. Get into the Chart maintenance mode then click the [License] button on the
InstantAccess bar.
3. Click the [C-MAP] tab to show the [Licenses] dialog box for C-MAP.
4. Click the [Order Update File] button. A file name (C-MAP system ID and chart
type) is automatically created, with the extension .ord.
5. Select the USB flash memory.
6. Click the [Save] button to save the order file to the USB flash memory.
7. Send the order file to updates@c-map.no.
Within a few minutes you will receive a file that includes the terms for using the chart
service and the chart updates. Save the file to a USB flash memory and apply it as
shown in the next section.
How to apply the update file
1. Insert the USB flash memory that contains the update file (.ans extension) into the
USB port on the Control Unit.
3-14
2. Get into the Chart maintenance mode then click the [License] button on the
InstantAccess bar.
3. Click the [C-MAP] tab to show the [Licenses] dialog box for C-MAP.
4. Click the [Update from File] button.
5. Find the update file on the USB flash memory then click the [Open] button.
Note: If the .ans file does not update the status of all shared C-MAP DL charts, reset
the power of all Processor Units.
Page 81

3.8.2 How to enable and set up the C-MAP DL
1. Get into the Chart maintenance mode then click the [License] button on the
InstantAccess bar.
2. Click the [C-MAP DL] tab to show the [Licenses] dialog box for C-MAP DL.
C1210011 ENC 01 Jun 2012 Unissued
3. Check [Enable Dynamic License] to enable the dynamic licensing.
You now have access to all the charts contained within the selected subscription
zones - both already licensed charts and new charts.
Settings, indications on the Licenses dialog box for C-MAP DL
3. HOW TO MANAGE CHARTS
• Set your annual credit limit with [Credit Limit]. A permanent warning is given if your
credit goes below this value. A new chart cannot be enabled if it causes the credit
to go below this value.
• [Credit Rest] shows the amount of credit remaining and is updated each time you
receive a confirmation answer for your request via e-mail.
• [Next Report Date] is the date when the next report should be sent to Jeppesen. If
charts are not reported before the mandatory report date, access to all non-reported
charts is discontinued and can be resumed only after the confirmation answer allowing use of the charts is received via e-mail.
• [Confirmation Date] is the date when you receive the confirmation answer for your
request via e-mail.
• [Confirm before open new chart], if checked, a confirmation window asks for con-
firmation before opening charts that require issuing a new license. A chart denied is
added to the list of protected charts, so the confirmation request will not be repeated
for that chart. Those charts cannot be opened until they are removed from the list
of protected charts.
• [Protected], if checked, shows the protected charts in the cell list. To remove a
chart from protection, select it then click the [Release] button. Then, when an attempt is made to open that chart, the confirmation window appears. Note that multiple confirmation windows open when releasing multiple charts from protection.
3.9 How to Export a List of Charts
Get into the Chart maintenance mode, click the [Manage Charts] button on the
InstantAccess bar to show the [Manage Charts] dialog box. Check the charts to add
to the list. Click the [Export List] button to export the checked charts to a USB flash
memory, in .txt format.
3-15
Page 82

3. HOW TO MANAGE CHARTS
3.10 How to Export a List of Specific Licenses
You can export a list of your ENC, ARCS or C-MAP (excluding C-MAP DL) licenses
to a USB flash memory, in .txt format.
1. Set a USB flash memory in the USB port on the Control Unit.
2. Get into the Chart maintenance mode then click the [License] button.
3. Click the [ENC], [ARCS] or [C-MAP] tab.
4. Click the [Export List] button.
5. Change the file name at [File Name] if desired.
6. Select the USB flash memory then click the [Save] button.
7. Click the [OK] button to finish.
3.11 How to Show the ENC Permit, ARCS License
1. Get into the Chart maintenance mode then click the [License] button.
2. Click the [ENC] or [ARCS] tab as applicable.
3. Click the [ENC User Permit] or [ARCS Licenses] button as applicable to show permit or license.
4. Click the [OK] button to finish.
3.12 How to Backup, Restore Licenses
You can make backup copies of your ENC, ARCS and AVCS (AIO) licenses and save
them to a USB flash memory. If re-installation of the licenses becomes necessary, you
can reinstall them from the USB flash memory. The backup and restore functions are
not available with C-MAP charts.
3-16
To backup licenses:
1. Insert a USB flash memory into the USB port on the Control Unit.
2. Get into the Chart maintenance mode then click the [License] button on the
InstantAccess bar to show the [Licenses] dialog box.
3. Click the [Backup Licenses] button.
4. Select the USB flash memory then click the [OK] button to save the licenses.
Page 83

3. HOW TO MANAGE CHARTS
To restore licenses:
1. Insert the USB flash memory that has the licenses into the USB port on the Control
Unit.
2. Get into the Chart maintenance mode then click the [License] button on the
InstantAccess bar to show the [Licenses] dialog box.
3. Click the [Restore Licenses] button.
4. Select the licenses from the USB flash memory then click the [OK] button.
3.13 How to View Permit Expiration Date
Permits are used to control the right to use chart data in the ECDIS. A permit is connected to the edition of a chart. Permits are issued in two different types:
• Subscription permit: This type of permit includes updates for subsequent 3, 6, 9 or
12 months.
• One-Off permit: This type of permit includes only updates up to the issue date of the
permit.
The expiry date of a permit controls the loading of Base charts and their updates to
the chart. The system will warn you when you are installing charts or updates that are
issued less than 30 days before the expiration date of a permit. If a permit has expired,
it is impossible to install a chart or its update that was issued after the expiration date
of the permit. The user has a right to view a chart forever, except C-MAP charts that
have viewing periods which end two months after the expiry date of the license. If the
charts are not updated regularly it will not complete the requirements for having up-todate charts. To view the permit status of a chart, click the [License] button on the
InstantAccess bar and then click the applicable "chart" tab ([ENC], [ARCS], [C-MAP]
or [C-MAP DL]).
The example below shows the status of ENC charts. The expiration date of each cell
appears in the [Expires] window.
Subscription warnings for RENC
If you have at least one subscription-type permit, the system will automatically warn
you about the expiration date of your subscription license, in the Permanent warning
box.
Note: If you change service provider for some reason, it is recommended that you remove all the charts from the ECDIS before installing new charts of new service provider.
3-17
Page 84

3. HOW TO MANAGE CHARTS
3.14 How to Display Install/Update History
You can see a history of chart installations and updates. On the InstantAccess bar,
click the [Record] and [Chart Log] buttons followed by the [ENC], [ARCS] or [C-MAP]
button. The example below shows the install/update history for ENC charts.
You can filter the log with [Period Covered (UTC)]. Enter the period to display then
click the [Set Period] button. Click the [Clear Period] button to display all entries. The
[Refresh] button updates the list. [Print Text] prints hard copy of the history.
The [Find] button searches required text string as follows:
1) Click the [Find] button to show the [Find text] box.
Input box
Find
Enter text in box and
[Find] button appears.
2) Click the input box then enter the text to search.
3) Select the search direction with the up or down radio button.
4) Click the [Find] button. The first matching text is highlighted in yellow at the top of
the screen.
3-18
5) To continue the search click the [Find] button. To cancel the search, click the [Cancel] button.
Page 85

3.15 Catalog of Chart Cells
A catalog is used to view graphical coverage of the charts stored in your SSD, available in a named "medium". Available charts are displayed using their limits of charts.
Note that sometimes the real coverage of the charts may be considerably less than
the declared limits of it.
To display the catalog, get into the Chart maintenance mode then click the [Manage
Charts] button on the InstantAccess bar. The [Filter] window lets you choose what to
display. Check or uncheck items as appropriate.
3. HOW TO MANAGE CHARTS
yes
yes
yes
yes
yes
yes
yes
yes
yes
yes
Filter
window
Not up-to-date
10
1) Chart Type
ENC: Display ENC charts.
ARCS: Display ARCS charts.
C-MAP: Display C-MAP charts.
2) Availability
Display available or unavailable charts.
3-19
Page 86

3. HOW TO MANAGE CHARTS
3) License
Valid: Cell with valid license.
Missing/Expired: Cell with missing or expired license.
Valid + Missing/Expired: Display cell regardless of license.
Uncheck both: Hide all cells.
4) Dynamic License
Display DL or non-DL C-MAP charts.
5) C-MAP Collections
A collection is a pre-defined dataset, the contents of which can be defined by zone,
individual chart or any of those combinations. Applicable to C-MAP charts also.
6) Official
Display official or unofficial charts.
7) Up-to-date
Display charts which are or are not up to date.
8) Purpose
Display chart according to its purpose - Overview, General, Coastal, AIO,
Approach, Harbor, Berthing.
9) Group
See the next section for how to group charts.
10)Route
Show or hide chart area with route.
11)Chart boundary boxes
Define the area covered by a chart and are color-coded according license and permit status.
12) Line color legend
The line color legend provides information about license validity.
Color Message
Green License ok, chart is up-to-date
Yellow DL issued, not reported
Orange License ok, chart is not up-to-date
Magenta License available, chart not installed
Red Not available or expired
Blue Canceled chart
3-20
Page 87
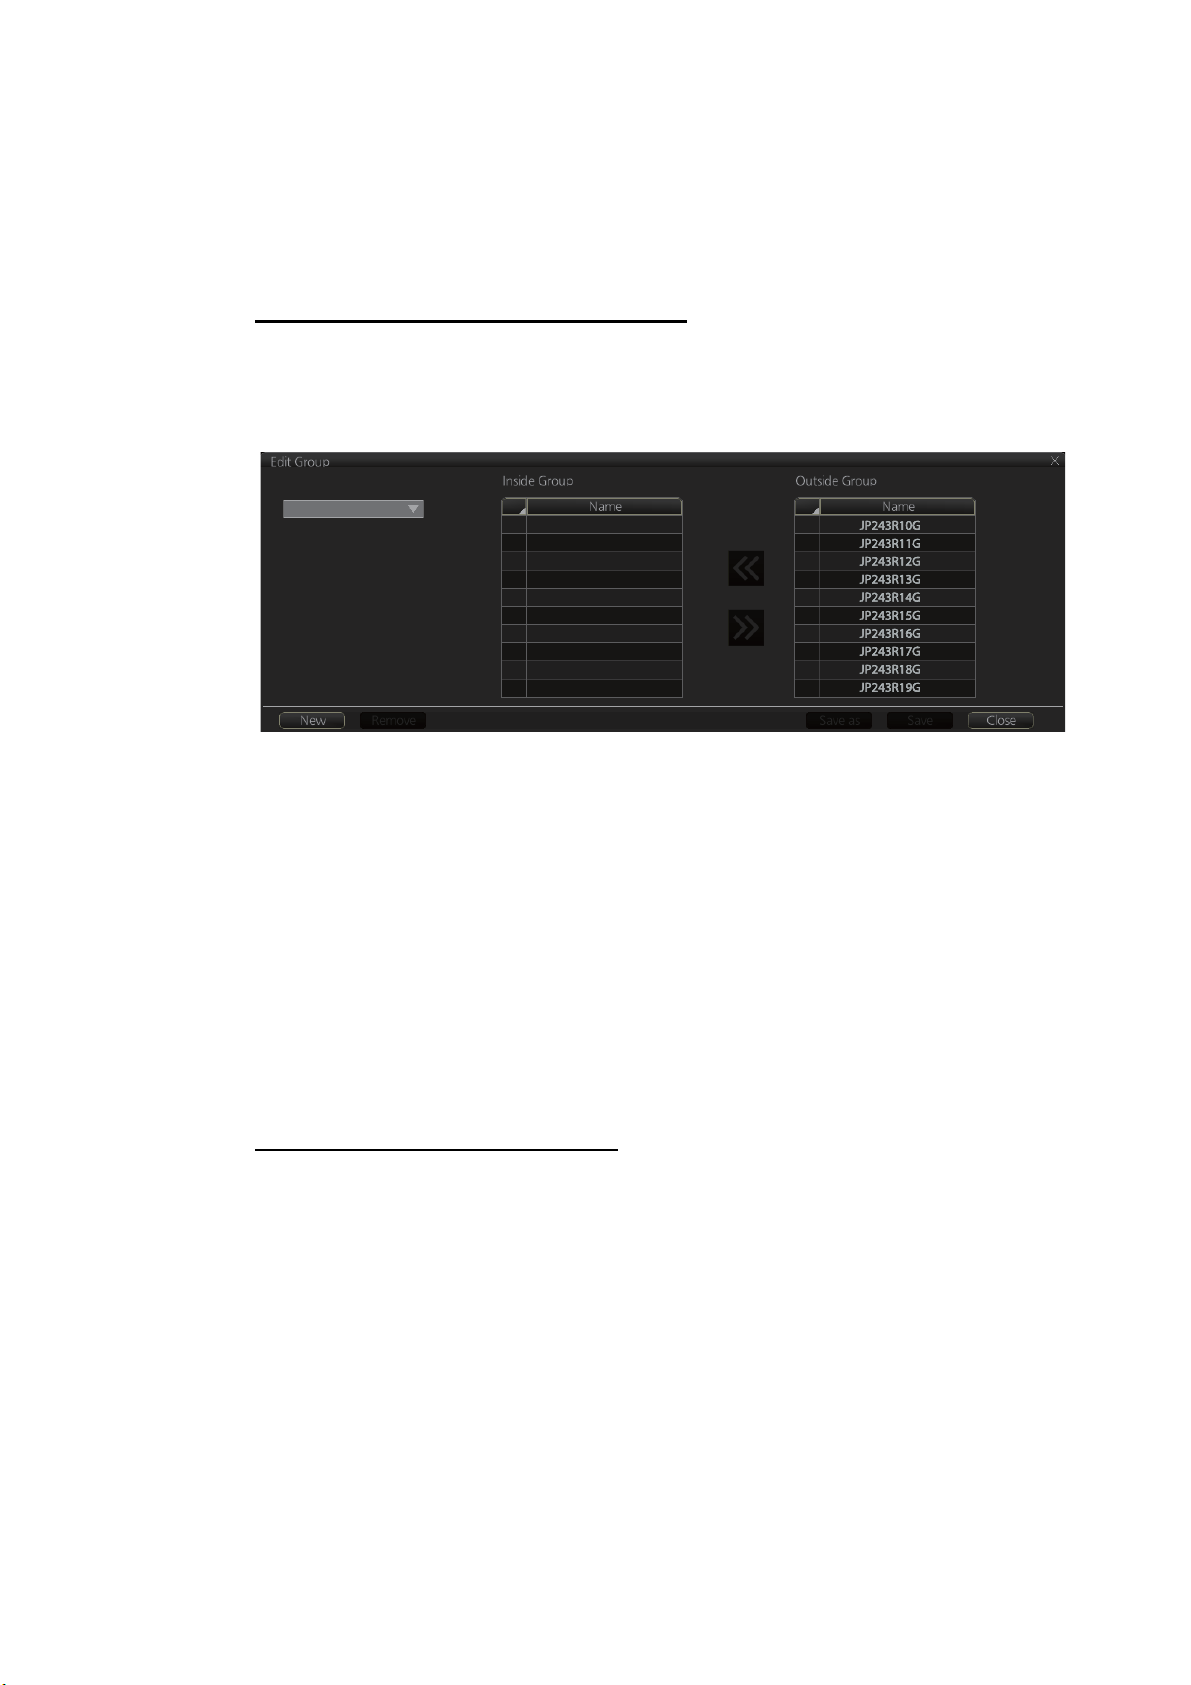
3.15.1 How to group chart cells
You can define groups of like-format chart cells. This means you can collect related
charts, for example, all cells that cover a route from Liverpool to New York or all cells
available from a National Hydrographic Office.
You can make a group and define charts from the [Edit Group] dialog box.
How to make a new group of chart cells
1. In the Chart maintenance mode, click the [Manage Charts] button on the
InstantAccess bar.
2. Click the [Edit] button in the [Filter] window to show the [Edit Group] dialog box.
Group Name:
3. HOW TO MANAGE CHARTS
3. Click the [New] button.
4. In the [Outside Group] window, click the box to the left of the chart cell you want
to add to the group to show a checkmark. (A context-sensitive menu with "Select
all" and "Deselect all" functions is available by right-clicking the box to the left of
[Name], in either window.)
5. After you have selected the cells to add to the group, click the << button to move
the names of the selected cells to the [Inside Group] window. If you want to remove a chart from the group, select it then click the >> button.
6. Click the [Save] button.
7. Enter a name for the group, using the keyboard on the Control Unit or software
keyboard, then click the [OK] button.
8. Click the [Close] button to finish.
How to edit a group of chart cells
You can edit a group of chart cells from a group as follows:
1. In the Chart maintenance mode, click the [Manage Charts] button on the
InstantAccess bar to show the [Filter] window.
2. Click the [Edit] button.
3. At the item [Group Name], select the name of the group with the pull-down list.
4. In the [Inside Group] window, click the box to the left of the chart cell you want to
remove from the group to show a checkmark. (A context-sensitive menu with "Select all" and "Deselect all" functions is available by right-clicking the box to the left
of [Name].)
5. After you have selected the charts to remove to the group, click the >> button to
remove the selected charts cells from the group.
6. Click the [Save] button to finish.
3-21
Page 88

3. HOW TO MANAGE CHARTS
How to delete a group of chart cells
You can delete group of chart cells as follows:
1. In the Chart maintenance mode, click the [Manage Charts] button on the
InstantAccess bar to show the [Filter] window.
2. Click the [Edit] button.
3. Select the name of the group with the pull-down list at the item [Group Name].
4. Click the [Remove] button.
5. Click the [OK] button.
6. Click the [Close] button.
How to select the group to view
In the Chart maintenance mode, click the [Manage Charts] button on the
InstantAccess bar to show the [Filter] window. Check [Group] then select the group to
view from the pull-down list at [Group].
3.15.2 How to view status of chart cells
The [Cell Status] dialog box shows the status of the chart cells stored in the system.
To show this dialog box, get into the Chart maintenance mode then click the [Cell Status] button on the InstantAccess bar.
• Type: Type of chart cell, ENC, C-MAP or ARCS.
• Chart Name: Chart name
• Data Server: The name of the data server where the chart was downloaded from.
• Edition/Issued Date: Edition no. and issued date of the chart cell.
• Update: Num/Date: No. and date of the update of the chart cell.
3-22
• Updated: [yes] is shown if the cell is up-to-date, [no] if the cell is not up-to-date.
Page 89

3. HOW TO MANAGE CHARTS
3.16 How to Open Charts
In the Chart maintenance mode, click the [Manage Charts] button on the
InstantAccess bar to display the dialog box shown below. Select the chart to open
then click the [Open Chart] button.
3.17 How to Print Chart List, Cell Status List
3.17.1 How to print the chart list
1. In the Chart maintenance mode, click the [Manage Charts] button on the
InstantAccess bar to show the [Manage Charts] dialog box.
2. Check the charts to print.
3. On the [Filter] window, check the information to print.
4. Click the [Print List] button to print. (If you have selected more than 30 charts, the
message "The number of pages is 1. Do you want to continue?." appears. Click
the [OK] button to continue, or the [Cancel] button to escape.)
3-23
Page 90

3. HOW TO MANAGE CHARTS
Description of chart list printout
Item Description
Ship Name Name of ship
IMO Number Ship’s IMO number
Call Sign Ship’s call sign
MMSI Ship’s MMSI number
Printing Date Date list printed
Data Location Location of charts; normally “Internal”.
Filter Settings of the items in the [Filter] window.
Status Summary [yes]: charts with yes status/total number of charts
[no]: charts with no status/total number of charts
3.17.2 How to print the cell status list
1. In the Chart maintenance mode, click the [Cell Status] button on the
InstantAccess bar to show the [Cell Status] dialog box.
2. On the [Filter] window, check the information to print.
3. Check the charts to print on the [Cell Status] dialog box.
4. Click the [Print List] button to print. (If you have selected more than 30 charts, the
message "The number of pages is 1 Do you want to continue?." appears. Click
the [OK] button to continue, or the [Cancel] button to escape.)
Description of cell status printout
Item Description
Ship Name Name of ship
IMO Number Ship’s IMO number
Call Sign Ship’s call sign
MMSI Ship’s MMSI number
Printing Date Date list printed
Filter Settings of the items in the [Filter] window.
Status Summary [yes]: charts with yes status/total number of charts
[no]: charts with no status/total number of charts
3-24
Page 91

3. HOW TO MANAGE CHARTS
3.18 How to Delete Charts
Click the [Manage Charts] button to show the [Manage Charts] dialog box. Click the
block to the left of the chart to remove to show a checkmark. A context-sensitive menu
with "Select all" and "Deselect all" functions is available by right-clicking the block to
the left of "Type". Click the [Delete Charts] button to delete the charts selected.
3.19 How to Show Publishers Notes for ENC Charts
You should read the text file associated with each catalog, which you can view when
installing a chart from a medium. Click the [Note] button in the [Manage Charts] dialog
box. You can print a hard copy with the [Print Text] button.
3-25
Page 92

3. HOW TO MANAGE CHARTS
3.20 How to Find the Chart Type
The electronic chart system can display more than one ENC chart cell at a time. This
feature is called multi-cell display. If one ENC chart cell does not cover the whole display, the system opens more ENC chart cells for display, if appropriate cells for the
displayed area are available. The Own ship functions box shows information about
ENC chart cells displayed on the electronic chart display area. When automatic TM
reset is active, the information is displayed with reference to your ship's position. If TM
reset is OFF, the information is displayed with reference to current cursor position.
ENC info
appears here.
Chart type indication
No indication (Official ENC chart)
“Non-ENC data” (Unofficial ENC chart, indication in yellow)
“ENC data available” (Currently, RNC chart is in use, but
ENC material is available. Indication shown in yellow.)
3.21 How to Update ENC, C-MAP Charts Manually
Manual update may include deleting an already existing object, modifying a position
or other characteristics of an already existing object or inserting of a new object. In this
system, manual updates are stored in a common database.
Mariners cannot permanently remove any of the official objects from the chart display.
If a mariner needs to make obsolete any of the official objects he “deletes” them. Then,
in practice, the deleted objects are still visible, but a diagonal line on the object indicates it is a deleted object.
However, a mariner can remove objects that he has inserted himself.
Note that the manual updates have no automatic connection to any automatic update
received later for charts. If a manual update itself became obsolete, because the official chart has been updated to include the update defined as a manual update, the
mariner must himself delete the obsolete manual update in question.
The system records complete usage of manual updates. All deletions, modifications
and insertions are recorded and time stamped. If the mariner wishes to see what kind
of manual updates he had in the past, for example, two weeks ago, he uses Update
History to specify the relevant date range. For information on how to set Display date
and Approved until dates, see section 5.2.3.
3-26
Note: Do not manually update charts while charts are being synchronized. Wait until
synchronization is completed.
Page 93

3.21.1 How to insert update symbols
An update symbol can be added as shown in the procedure below.
Note 1: If the system freezes when updating the drawing type [area], reset the power.
Note 2: An update symbol that straddles the international date line cannot be edited.
In this case, insert the same symbol on each side of the line.
1. Go to the Voyage navigation mode.
2. Click the [Manual Update] button on the InstantAccess bar to open the [Manual
Update] dialog box.
3. Click the [Planning] tab.
3. HOW TO MANAGE CHARTS
4. Click the [Add] button.
Note: This window can also be shown from the context-sensitive menu. Right-click the display area then
select [Manual Update] and [Add New].
5. Use the [Drawing Type] pull-down list to select drawing type: point, line or area.
6. Click desired object.
7. Put the cursor on the location where to insert the symbol then left click. The [Manual Update] dialog box
shows:
- Object
- Drawing type
- Display until date*
* Set as desired; default setting is three months from date of entry.
8. You can add a comment related to a manual update object in the [Description]
box.
3-27
Page 94

3. HOW TO MANAGE CHARTS
9. To add textual information to an attribute, select the attribute from the [Attributes]
window then add text in the [Edit Attribute’s Value] window.
10. Click the [Commit] button to add all selected objects to the chart.
Note: A manual update object is displayed until the Display until date entered for it has
passed. If the object remains on the screen after the Display Until date has passed,
do some operation on the screen to refresh the screen to erase the object.
3.21.2 How to delete update symbols
Manually entered update symbols cannot be deleted until the “Display Until” date arrives or is changed. However, you can mark the symbol to indicate that it can be ignored.
1. Put the cursor on the symbol then right click to show the context-sensitive menu.
2. Select [Manual Update] and [Delete].
The symbol is marked with a diagonal line.
Note: A symbol can also be deleted from the [Manual Update] dialog box. Follow
steps 1 and 2 in section 3.21.1, click the [List] tab, select the symbol to delete then
click the [Delete] button.
3.21.3 How to modify existing update symbols
The position, Display until date and description of an update symbol can be modified.
A symbol that is marked as “deleted” cannot be modified.
1. Follow steps 1-2 in section 3.21.1 to display the [Manual Update] dialog box.
2. Click the [List] tab.
3. Select the object to modify then click the [Modify] button. The [Planning] dialog
box appears.
4. Modify the object referring to steps 8 and 9 in section 3.21.1.
3-28
5. Click the [Commit] button.
Page 95

3.22 How to Synchronize Chart Data
This section shows you how to synchronize chart data between FMD-3xx0 and FCR2xx9 units, so that all units share the same chart data. Synchronization can be done
automatically or manually (see section 3.22.2), however all units selected for synchronization must be powered to complete the synchronization. Synchronization includes
the following actions:
• Synchronize public keys
• Synchronize chart permits and licenses
• Synchronize chart data
• Synchronize manual updates
Note 1: Before synchronizing chart data, confirm that all units selected for synchronization are powered. (Do not turn off a unit during synchronizing.) If a unit is turned off
during the synchronizing, do the following on the unit which contains the medium:
• Open the [Sync Status] dialog box then click the [Disable Sync] button to disable
synchronization. Power all units registered for synchronization, then click the [Urge
Sync] button on the [Sync Status] dialog box on the unit containing the media to
forcibly synchronize.
3. HOW TO MANAGE CHARTS
• Make a group of all the units currently powered, referring to section 3.22.1, and register the group with [Grouped with This Unit]. Reset the power on all units selected
for synchronization.
Note 2: C-MAP charts are not automatically synchronized. C-MAP charts are only
synchronized immediately after installing or updating the C-MAP database. If the system has several FMDs, make a group of associated units before you install C-MAP
charts.
3.22.1 How to select the units to synchronize
Do as follows to select the units to synchronize.
1. Get into the Chart maintenance mode. On the InstantAccess bar, click [System]
followed by [Sync Config] to show the [Sync Config] dialog box.
[Grouped with This Unit]: This window shows the units currently selected for
synchronization.
[Not Synchronize with This Unit]: This windows shows the units not selected for
synchronization.
3-29
Page 96

3. HOW TO MANAGE CHARTS
2. To select a unit for synchronization: Put a checkmark next to the unit’s name
in the [Not Synchronize with This Unit] window then click the << button. That unit’s
name is moved to the [Grouped with This Unit] window.
To deselect a unit from synchronization: Put a checkmark next to the unit’s
name in the [Grouped with This Unit] window then click the >> button. That unit’s
name is moved to the [Not Synchronize with This Unit] window.
To deselect all units, click the [Reset All] button.
3. Click the [Save] button to finish.
4. Restart the power on applicable units to apply synchronization configuration
changes.
3.22.2 How to check synchronization status
You can check chart synchronization status on the [Sync Status] dialog box. Chart
synchronization operations also
are available from this dialog
box. Normally, chart synchronization is done automatically, according to the sync settings on
the [Sync Config] dialog box.
Use the [Sync Status] dialog
box to manually synchronize
chart data when there is network failure, for example.
Get into the Chart maintenance mode. On the InstantAccess bar, click [System] followed by [Sync Status] to show the [Sync Status] dialog box.
[Current Status]: Displays current synchronization status. The table below shows all
the synchronization status messages.
Sync status Meaning
disabled Synchronization is disabled.
must receive This ECDIS will receive chart data from another FMD-3xx0 or
FCR-2xx9 series.
must send This ECDIS will send chart data to another FMD-3xx0 or FCR-2xx9
series.
none No synchronization task ready.
[Update] button: Click this button to update [Current Status].
[Enable Sync] button: Enables synchronization. You are asked, "Do you want to en-
able sync?" Click the [OK] button to enable synchronization. Synchronization is always enabled when ECDIS starts. A progress bar indicates progress in
synchronization. The bar is erased within five minutes after completion of synchronization.
[Disable Sync] button: Disables synchronization function temporarily. Use this feature to enable chart administration in case of network failure, for example. You are
asked, "Do you want to disable sync?" Click the [OK] button to temporarily disable synchronization.
3-30
Page 97

Note 1: In normal operation do not disable synchronization. If you accidentally disable
synchronization, try to synchronize by clicking the [Enable Sync] button. If that does
not work, reset the power of all units selected for synchronization then click the [Urge
Sync] button to synchronize.
Note 2: With synchronization disabled, the message "Synchronization disabled" may
appear twice when installing a license. This does not affect installation of a license.
[Urge Sync] button: Does immediate synchronization. You are asked, "Chart data in
other units will be overwritten by this unit. Do you wish to continue?" Click the [OK]
button to synchronize. If synchronization is not successful, restart applicable units and
try again.
[Reset Status] button: Reset synchronization status to recover from synchronization
status conflict. You are asked, "Do you want to reset sync status? This unit may be
synchronized from the other unit." Click the [OK] button to reset.
3.22.3 Manual updates and synchronization
If you are synchronizing multiple FMD-3xx0 units while manual updating is being done
on one of the units, the message “File not found” may appear, meaning the manual
update data was deleted. if this occurs, follow the procedure below to synchronize the
FMD-3xx0 units. The procedure uses ECD001 and ECD002 as an example.
3. HOW TO MANAGE CHARTS
1. At the ECD001, get into the Chart maintenance mode, then click [System] and
[Sync Config] on the InstantAccess bar.
2. Add ECD002 to [Grouped with This Unit] then click the [Save] button.
3. Reset the power on the ECD001 and ECD002.
4. At the ECD001, get into the Chart maintenance mode, then click the [System] and
[Sync Status] buttons on InstantAccess bar to show the [Sync Status] dialog box.
5. Click the [Urge Sync] button to synchronize charts between ECD001 and
ECD002.
6. To confirm synchronization, do as follows:
1) At the ECD001, get into the Voyage navigation mode then click the Manual
Update button on the Instant Access bar.
2) Click the [Planning] tab followed by the [Add] button.
3) Insert an object at the ECD001.
4) At the ECD002, move the cursor or change the chart scale. Confirm that the
chart is updated.
3.23 How to Reconvert All SENC Charts
If you unintentionally installed outdated SENC charts, you can reconvert those charts
to the latest SENC charts. Get into the Chart maintenance mode, click the [System]
and [Reconvert] buttons on the InstantAccess bar to reconvert all your SENC charts.
Note: All manual updates are removed in the reconversion.
3-31
Page 98

3. HOW TO MANAGE CHARTS
This page is intentionally left blank.
3-32
Page 99

4. HOW TO CONTROL CHART
OBJECTS
This chapter provides the information necessary for controlling chart features.
4.1 How to Browse Your Charts
You can view your charts using different positions and different scales. The basic tools
for browsing charts are the RANGE key, chart offcenter, and scroll.
RANGE - and RANGE + change the chart scale. (The scrollwheel also can change
the chart scale. Spin to change.) If true motion reset is active, ZOOM IN and ZOOM
OUT keep the relative position of your ship with respect to the display. If true motion
reset is off, ZOOM IN and ZOOM OUT keep the relative position pointed by the cursor
with respect to the display. The system automatically chooses next larger or smaller
scale. If a chart with larger compilation scale is available at your current viewing position, the message "Larger Scale ENC Available" appears.
The own ship position can be easily relocated to the screen center in the Navigation
voyage and Navigation planning modes. Further, in the Navigation voyage mode, the
own ship position can be put at the cursor position.
To move the own ship mark to the screen center, put the cursor in the chart area
and right click [Ship on center]. To move the own ship mark to a location, right-click
the position on the chart where to put the own ship mark then right click [Ship off center].
([Ship off center] is not available in the Voyage planning mode.)
To scroll your chart, simply drag and drop.
4.2 How to Control Visibility of Chart Objects
The [Chart Display] menu has several pages of chart features that you may show or
hide as appropriate. To display this menu, click the [DISP], [SET] and [Chart DISP]
menu on the InstantAccess bar.
4.2.1 How to set value for shallow contour, safety depth, safety contour and deep contour
You can set values for Shallow Contour, Safety Depth, Safety Contour and Deep Contour, on the [Chart Alert] dialog box (sequence: [DISP], [SET], [Chart Alert]). Colors
used for depth presentation on the electronic chart are controlled by setting values for
Shallow Contour, Safety Depth, Safety Contour and Deep Contour. Soundings on the
electronic chart, which are equal to or less than the value of Safety Depth, are highlighted. See the illustrations on the next page for multi-color presentation and two-color presentation. Selection of multi- and two-color presentations can be done by
selecting from the list box of "Depths" on the [Chart] page of [Basic Setting] menu.
Note: The shallow contour cannot be set higher than the safety contour.
4-1
Page 100

4. HOW TO CONTROL CHART OBJECTS
MULTI-COLOR presentation
Chart zero
Shallow contour
Safety contour (input value)
Safety contour (exisiting in ENC)
Deep contour
Non-navigable area
Navigable area
In the multi-color presentation four colors are used for depths. If the value entered as
the safety contour does not exist in the electronic chart, the system automatically selects the next available deeper depth contour as the safety contour. For example, the
input value is 8 m, but there is no 8 m depth contour in the electronic chart. Then, the
system automatically selects the next available deeper depth contour (10 m) as the
safety contour. The depth contour value of 10 m is used as the safety contour in the
electronic chart.
The shallow contour shows visual color change inside an unsafe water area. An unsafe water area is all areas shallower than the "safety contour". Set the value for the
shallow contour less than the value of the safety contour.
TWO-COLOR presentation
Chart zero
Shallow contour
Safety contour (input value)
Safety contour (exisiting in ENC)
4-2
Deep contour
Non-navigable area
Navigable area
In the two-color presentation, unsafe water is shown in blue and safe water is shown
in white. The safety contour is used to qualify unsafe water (depth shallower than safety contour) and safe water (depths deeper than safety contour).
If the value entered as the safety contour does not exist in the electronic chart, the system automatically selects the next deeper available depth contour as the safety contour, the same as with the multi-color presentation.
 Loading...