

Page 1
nualoSpectrometer® basic
EN) manual
Register your instrument!
www.eppendorf.com/myeppendorf
Eppendorf BioSpectrometer® basic
Operating manual
Page 2

Copyright © 2014 Eppendorf AG, Hamburg. No part of this publication may be reproduced without the
prior permission of the copyright owner.
Trademarks
®
Eppendorf
and the Eppendorf logo, Eppendorf BioSpectrometer®, Eppendorf SpectraZoom,® and UVette®
are registered trademarks of Eppendorf AG, Hamburg, Germany.
®
is a registered trademark of GE Healthcare UK Ltd., Buckinghamshire, UK.
Cy
®
Hellma
Trademarks are not marked in all cases with ™ or
is a registered trademark of Hellma GmbH & Co. KG, Müllheim, Germany.
®
in this manual.
This product is manufactured under license to issued U.S. Patent No. 6,122,052.
Protected by U.S. Patent No. 8,464,171.
6135 900.050-03/052014
Page 3

Table of contents
Eppendorf BioSpectrometer
®
basic
English (EN)
Table of contents
1 Operating instructions . . . . . . . . . . . . . . . . . . . . . . . . . . . . . . . . . . . . . . . . . . . . . . . . . . . . . . . . . . . . . . 7
1.1 Using this manual . . . . . . . . . . . . . . . . . . . . . . . . . . . . . . . . . . . . . . . . . . . . . . . . . . . . . . . . . . . . . 7
1.2 Danger symbols and danger levels . . . . . . . . . . . . . . . . . . . . . . . . . . . . . . . . . . . . . . . . . . . . . . . . 7
1.2.1 Danger symbols. . . . . . . . . . . . . . . . . . . . . . . . . . . . . . . . . . . . . . . . . . . . . . . . . . . . . . . . 7
1.2.2 Danger levels. . . . . . . . . . . . . . . . . . . . . . . . . . . . . . . . . . . . . . . . . . . . . . . . . . . . . . . . . . 7
1.3 Symbols used . . . . . . . . . . . . . . . . . . . . . . . . . . . . . . . . . . . . . . . . . . . . . . . . . . . . . . . . . . . . . . . . 8
1.4 Abbreviations used . . . . . . . . . . . . . . . . . . . . . . . . . . . . . . . . . . . . . . . . . . . . . . . . . . . . . . . . . . . . 9
2 Product description . . . . . . . . . . . . . . . . . . . . . . . . . . . . . . . . . . . . . . . . . . . . . . . . . . . . . . . . . . . . . . . 11
2.1 Main illustration . . . . . . . . . . . . . . . . . . . . . . . . . . . . . . . . . . . . . . . . . . . . . . . . . . . . . . . . . . . . . 11
2.2 Delivery package. . . . . . . . . . . . . . . . . . . . . . . . . . . . . . . . . . . . . . . . . . . . . . . . . . . . . . . . . . . . . 11
2.3 Features. . . . . . . . . . . . . . . . . . . . . . . . . . . . . . . . . . . . . . . . . . . . . . . . . . . . . . . . . . . . . . . . . . . . 12
2.3.1 Methods . . . . . . . . . . . . . . . . . . . . . . . . . . . . . . . . . . . . . . . . . . . . . . . . . . . . . . . . . . . . 12
2.3.2 Operation. . . . . . . . . . . . . . . . . . . . . . . . . . . . . . . . . . . . . . . . . . . . . . . . . . . . . . . . . . . . 12
2.3.3 Result output . . . . . . . . . . . . . . . . . . . . . . . . . . . . . . . . . . . . . . . . . . . . . . . . . . . . . . . . . 12
2.3.4 Device self test . . . . . . . . . . . . . . . . . . . . . . . . . . . . . . . . . . . . . . . . . . . . . . . . . . . . . . . 12
3
3 Safety. . . . . . . . . . . . . . . . . . . . . . . . . . . . . . . . . . . . . . . . . . . . . . . . . . . . . . . . . . . . . . . . . . . . . . . . . . . 13
3.1 Intended use . . . . . . . . . . . . . . . . . . . . . . . . . . . . . . . . . . . . . . . . . . . . . . . . . . . . . . . . . . . . . . . . 13
3.2 User profile . . . . . . . . . . . . . . . . . . . . . . . . . . . . . . . . . . . . . . . . . . . . . . . . . . . . . . . . . . . . . . . . . 13
3.3 Warnings for intended use . . . . . . . . . . . . . . . . . . . . . . . . . . . . . . . . . . . . . . . . . . . . . . . . . . . . . 13
3.3.1 Personal injury . . . . . . . . . . . . . . . . . . . . . . . . . . . . . . . . . . . . . . . . . . . . . . . . . . . . . . . 13
3.3.2 Damage to device . . . . . . . . . . . . . . . . . . . . . . . . . . . . . . . . . . . . . . . . . . . . . . . . . . . . . 14
3.4 Information on product liability . . . . . . . . . . . . . . . . . . . . . . . . . . . . . . . . . . . . . . . . . . . . . . . . . 15
3.5 Safety instructions located on the device . . . . . . . . . . . . . . . . . . . . . . . . . . . . . . . . . . . . . . . . . . 16
4 Installation . . . . . . . . . . . . . . . . . . . . . . . . . . . . . . . . . . . . . . . . . . . . . . . . . . . . . . . . . . . . . . . . . . . . . . 17
4.1 Preparing installation . . . . . . . . . . . . . . . . . . . . . . . . . . . . . . . . . . . . . . . . . . . . . . . . . . . . . . . . . 17
4.2 Selecting the location . . . . . . . . . . . . . . . . . . . . . . . . . . . . . . . . . . . . . . . . . . . . . . . . . . . . . . . . . 17
4.3 Connecting the device to the mains . . . . . . . . . . . . . . . . . . . . . . . . . . . . . . . . . . . . . . . . . . . . . . 17
4.4 Connecting the printer . . . . . . . . . . . . . . . . . . . . . . . . . . . . . . . . . . . . . . . . . . . . . . . . . . . . . . . . 17
4.4.1 Thermal printer DPU-S445 . . . . . . . . . . . . . . . . . . . . . . . . . . . . . . . . . . . . . . . . . . . . . . 17
4.4.2 Thermal printer DPU-414 . . . . . . . . . . . . . . . . . . . . . . . . . . . . . . . . . . . . . . . . . . . . . . . 18
4.5 Connecting PC or USB stick for data export. . . . . . . . . . . . . . . . . . . . . . . . . . . . . . . . . . . . . . . . 19
5 Operation. . . . . . . . . . . . . . . . . . . . . . . . . . . . . . . . . . . . . . . . . . . . . . . . . . . . . . . . . . . . . . . . . . . . . . . . 21
5.1 Overview of operating controls . . . . . . . . . . . . . . . . . . . . . . . . . . . . . . . . . . . . . . . . . . . . . . . . . . 21
5.1.1 Entering text . . . . . . . . . . . . . . . . . . . . . . . . . . . . . . . . . . . . . . . . . . . . . . . . . . . . . . . . . 23
5.2 Inserting the cuvette . . . . . . . . . . . . . . . . . . . . . . . . . . . . . . . . . . . . . . . . . . . . . . . . . . . . . . . . . . 24
5.3 Summary of the measuring procedure . . . . . . . . . . . . . . . . . . . . . . . . . . . . . . . . . . . . . . . . . . . . 25
5.3.1 Preparing the measurement . . . . . . . . . . . . . . . . . . . . . . . . . . . . . . . . . . . . . . . . . . . . . 25
5.3.2 Measuring procedure . . . . . . . . . . . . . . . . . . . . . . . . . . . . . . . . . . . . . . . . . . . . . . . . . . 25
5.3.3 Important measurement instructions . . . . . . . . . . . . . . . . . . . . . . . . . . . . . . . . . . . . . . 29
Page 4

Table of contents
Eppendorf BioSpectrometer
4
®
basic
English (EN)
6 Methods. . . . . . . . . . . . . . . . . . . . . . . . . . . . . . . . . . . . . . . . . . . . . . . . . . . . . . . . . . . . . . . . . . . . . . . . . 31
6.1 Selecting a method . . . . . . . . . . . . . . . . . . . . . . . . . . . . . . . . . . . . . . . . . . . . . . . . . . . . . . . . . . . 31
6.2 Photometry method description . . . . . . . . . . . . . . . . . . . . . . . . . . . . . . . . . . . . . . . . . . . . . . . . . 32
6.2.1 Absorbance method group . . . . . . . . . . . . . . . . . . . . . . . . . . . . . . . . . . . . . . . . . . . . . . 32
6.2.2 Routine method group . . . . . . . . . . . . . . . . . . . . . . . . . . . . . . . . . . . . . . . . . . . . . . . . . 33
6.2.3 Basic method group . . . . . . . . . . . . . . . . . . . . . . . . . . . . . . . . . . . . . . . . . . . . . . . . . . . 34
6.2.4 Advanced method group . . . . . . . . . . . . . . . . . . . . . . . . . . . . . . . . . . . . . . . . . . . . . . . . 35
6.3 Method parameters. . . . . . . . . . . . . . . . . . . . . . . . . . . . . . . . . . . . . . . . . . . . . . . . . . . . . . . . . . . 35
6.4 Method procedure. . . . . . . . . . . . . . . . . . . . . . . . . . . . . . . . . . . . . . . . . . . . . . . . . . . . . . . . . . . . 40
6.4.1 Check parameters . . . . . . . . . . . . . . . . . . . . . . . . . . . . . . . . . . . . . . . . . . . . . . . . . . . . . 41
6.4.2 Measure standards . . . . . . . . . . . . . . . . . . . . . . . . . . . . . . . . . . . . . . . . . . . . . . . . . . . . 42
6.4.3 Measure samples. . . . . . . . . . . . . . . . . . . . . . . . . . . . . . . . . . . . . . . . . . . . . . . . . . . . . . 43
6.4.4 Measure samples: Results displays . . . . . . . . . . . . . . . . . . . . . . . . . . . . . . . . . . . . . . . . 45
6.4.5 Process results . . . . . . . . . . . . . . . . . . . . . . . . . . . . . . . . . . . . . . . . . . . . . . . . . . . . . . . 50
6.4.6 Process results: Options . . . . . . . . . . . . . . . . . . . . . . . . . . . . . . . . . . . . . . . . . . . . . . . . 52
6.4.7 Print & export . . . . . . . . . . . . . . . . . . . . . . . . . . . . . . . . . . . . . . . . . . . . . . . . . . . . . . . . 55
6.4.8 Finish the series of measurements . . . . . . . . . . . . . . . . . . . . . . . . . . . . . . . . . . . . . . . . 57
7 Functions. . . . . . . . . . . . . . . . . . . . . . . . . . . . . . . . . . . . . . . . . . . . . . . . . . . . . . . . . . . . . . . . . . . . . . . . 59
7.1 Functions of the User main group . . . . . . . . . . . . . . . . . . . . . . . . . . . . . . . . . . . . . . . . . . . . . . . 59
7.1.1 Results memory. . . . . . . . . . . . . . . . . . . . . . . . . . . . . . . . . . . . . . . . . . . . . . . . . . . . . . . 60
7.1.2 General method parameters . . . . . . . . . . . . . . . . . . . . . . . . . . . . . . . . . . . . . . . . . . . . . 61
7.1.3 Absorbance spectra library . . . . . . . . . . . . . . . . . . . . . . . . . . . . . . . . . . . . . . . . . . . . . . 64
7.1.4 Device settings . . . . . . . . . . . . . . . . . . . . . . . . . . . . . . . . . . . . . . . . . . . . . . . . . . . . . . . 64
7.1.5 Device calibration . . . . . . . . . . . . . . . . . . . . . . . . . . . . . . . . . . . . . . . . . . . . . . . . . . . . . 64
7.1.6 Info . . . . . . . . . . . . . . . . . . . . . . . . . . . . . . . . . . . . . . . . . . . . . . . . . . . . . . . . . . . . . . . . 65
8 Maintenance . . . . . . . . . . . . . . . . . . . . . . . . . . . . . . . . . . . . . . . . . . . . . . . . . . . . . . . . . . . . . . . . . . . . . 67
8.1 Cleaning . . . . . . . . . . . . . . . . . . . . . . . . . . . . . . . . . . . . . . . . . . . . . . . . . . . . . . . . . . . . . . . . . . . 67
8.1.1 Cleaning the cuvette shaft cover . . . . . . . . . . . . . . . . . . . . . . . . . . . . . . . . . . . . . . . . . . 68
8.2 Disinfection/Decontamination. . . . . . . . . . . . . . . . . . . . . . . . . . . . . . . . . . . . . . . . . . . . . . . . . . . 69
8.3 Checking the device . . . . . . . . . . . . . . . . . . . . . . . . . . . . . . . . . . . . . . . . . . . . . . . . . . . . . . . . . . 69
8.3.1 Checking the spectrometer unit . . . . . . . . . . . . . . . . . . . . . . . . . . . . . . . . . . . . . . . . . . 69
8.3.2 Device self-test . . . . . . . . . . . . . . . . . . . . . . . . . . . . . . . . . . . . . . . . . . . . . . . . . . . . . . . 73
8.4 Replacing fuses . . . . . . . . . . . . . . . . . . . . . . . . . . . . . . . . . . . . . . . . . . . . . . . . . . . . . . . . . . . . . . 73
8.5 Decontamination before shipment . . . . . . . . . . . . . . . . . . . . . . . . . . . . . . . . . . . . . . . . . . . . . . . 74
9 Troubleshooting . . . . . . . . . . . . . . . . . . . . . . . . . . . . . . . . . . . . . . . . . . . . . . . . . . . . . . . . . . . . . . . . . . 75
9.1 General errors . . . . . . . . . . . . . . . . . . . . . . . . . . . . . . . . . . . . . . . . . . . . . . . . . . . . . . . . . . . . . . . 75
9.2 Error messages . . . . . . . . . . . . . . . . . . . . . . . . . . . . . . . . . . . . . . . . . . . . . . . . . . . . . . . . . . . . . . 76
9.3 Result flags . . . . . . . . . . . . . . . . . . . . . . . . . . . . . . . . . . . . . . . . . . . . . . . . . . . . . . . . . . . . . . . . . 79
10 Transport, storage and disposal . . . . . . . . . . . . . . . . . . . . . . . . . . . . . . . . . . . . . . . . . . . . . . . . . . . . . 83
10.1 Transport. . . . . . . . . . . . . . . . . . . . . . . . . . . . . . . . . . . . . . . . . . . . . . . . . . . . . . . . . . . . . . . . . . . 83
10.2 Storage . . . . . . . . . . . . . . . . . . . . . . . . . . . . . . . . . . . . . . . . . . . . . . . . . . . . . . . . . . . . . . . . . . . . 83
10.3 Disposal. . . . . . . . . . . . . . . . . . . . . . . . . . . . . . . . . . . . . . . . . . . . . . . . . . . . . . . . . . . . . . . . . . . . 83
Page 5

Table of contents
Eppendorf BioSpectrometer
®
basic
English (EN)
11 Technical data. . . . . . . . . . . . . . . . . . . . . . . . . . . . . . . . . . . . . . . . . . . . . . . . . . . . . . . . . . . . . . . . . . . . 85
11.1 Power supply. . . . . . . . . . . . . . . . . . . . . . . . . . . . . . . . . . . . . . . . . . . . . . . . . . . . . . . . . . . . . . . . 85
11.2 Ambient conditions . . . . . . . . . . . . . . . . . . . . . . . . . . . . . . . . . . . . . . . . . . . . . . . . . . . . . . . . . . . 85
11.3 Weight/dimensions . . . . . . . . . . . . . . . . . . . . . . . . . . . . . . . . . . . . . . . . . . . . . . . . . . . . . . . . . . . 85
11.4 Photometric properties . . . . . . . . . . . . . . . . . . . . . . . . . . . . . . . . . . . . . . . . . . . . . . . . . . . . . . . . 86
11.5 Further technical parameters . . . . . . . . . . . . . . . . . . . . . . . . . . . . . . . . . . . . . . . . . . . . . . . . . . . 86
11.6 Application parameters . . . . . . . . . . . . . . . . . . . . . . . . . . . . . . . . . . . . . . . . . . . . . . . . . . . . . . . . 87
12 Evaluation procedure . . . . . . . . . . . . . . . . . . . . . . . . . . . . . . . . . . . . . . . . . . . . . . . . . . . . . . . . . . . . . . 89
12.1 Absorbance values . . . . . . . . . . . . . . . . . . . . . . . . . . . . . . . . . . . . . . . . . . . . . . . . . . . . . . . . . . . 89
12.1.1 Blank . . . . . . . . . . . . . . . . . . . . . . . . . . . . . . . . . . . . . . . . . . . . . . . . . . . . . . . . . . . . . . . 89
12.1.2 Background correction . . . . . . . . . . . . . . . . . . . . . . . . . . . . . . . . . . . . . . . . . . . . . . . . . 89
12.1.3 Cuvette correction . . . . . . . . . . . . . . . . . . . . . . . . . . . . . . . . . . . . . . . . . . . . . . . . . . . . . 90
12.2 Evaluation with factor or standard . . . . . . . . . . . . . . . . . . . . . . . . . . . . . . . . . . . . . . . . . . . . . . . 91
12.3 Evaluation with standard curve/line . . . . . . . . . . . . . . . . . . . . . . . . . . . . . . . . . . . . . . . . . . . . . . 91
12.4 Dilution . . . . . . . . . . . . . . . . . . . . . . . . . . . . . . . . . . . . . . . . . . . . . . . . . . . . . . . . . . . . . . . . . . . . 92
12.5 Special evaluation procedures for nucleic acids and protein UV . . . . . . . . . . . . . . . . . . . . . . . . 93
12.5.1 Correction A
and correction A
260
. . . . . . . . . . . . . . . . . . . . . . . . . . . . . . . . . . . . . . . 93
280
12.5.2 Ratios A260/A280 and A260/A230. . . . . . . . . . . . . . . . . . . . . . . . . . . . . . . . . . . . . . . . . 93
12.5.3 Conversion to molar concentrations and nucleic acid quantities . . . . . . . . . . . . . . . . . 94
12.5.4 Calculating the factor for protein in "General Method Parameter" . . . . . . . . . . . . . . . 95
12.6 Special evaluation procedures for the dye methods. . . . . . . . . . . . . . . . . . . . . . . . . . . . . . . . . . 95
12.6.1 Calculating the factor for the dye from the absorbance coefficient . . . . . . . . . . . . . . . 95
12.6.2 Calculation of the FOI . . . . . . . . . . . . . . . . . . . . . . . . . . . . . . . . . . . . . . . . . . . . . . . . . . 96
12.6.3 Conversion to amounts of dye. . . . . . . . . . . . . . . . . . . . . . . . . . . . . . . . . . . . . . . . . . . . 96
12.7 Dual wavelength . . . . . . . . . . . . . . . . . . . . . . . . . . . . . . . . . . . . . . . . . . . . . . . . . . . . . . . . . . . . . 97
5
13 Ordering information . . . . . . . . . . . . . . . . . . . . . . . . . . . . . . . . . . . . . . . . . . . . . . . . . . . . . . . . . . . . . . 99
Certificates . . . . . . . . . . . . . . . . . . . . . . . . . . . . . . . . . . . . . . . . . . . . . . . . . . . . . . . . . . . . . . . . . . . . . 101
Page 6

Table of contents
Eppendorf BioSpectrometer
6
English (EN)
®
basic
Page 7
Operating instructions
Eppendorf BioSpectrometer
®
basic
English (EN)
1 Operating instructions
1.1 Using this manual
Read this operating manual completely before using the device for the first time. Also observe the
instructions for use of the accessories.
This operating manual is part of the product. Thus, it must always be easily accessible.
Enclose this operating manual when transferring the device to third parties.
You will find the current version of the operating manual for all available languages on our webpage
www.eppendorf.com.
under
1.2 Danger symbols and danger levels
The safety instructions of this operating manual indicate the following danger symbols and danger levels:
7
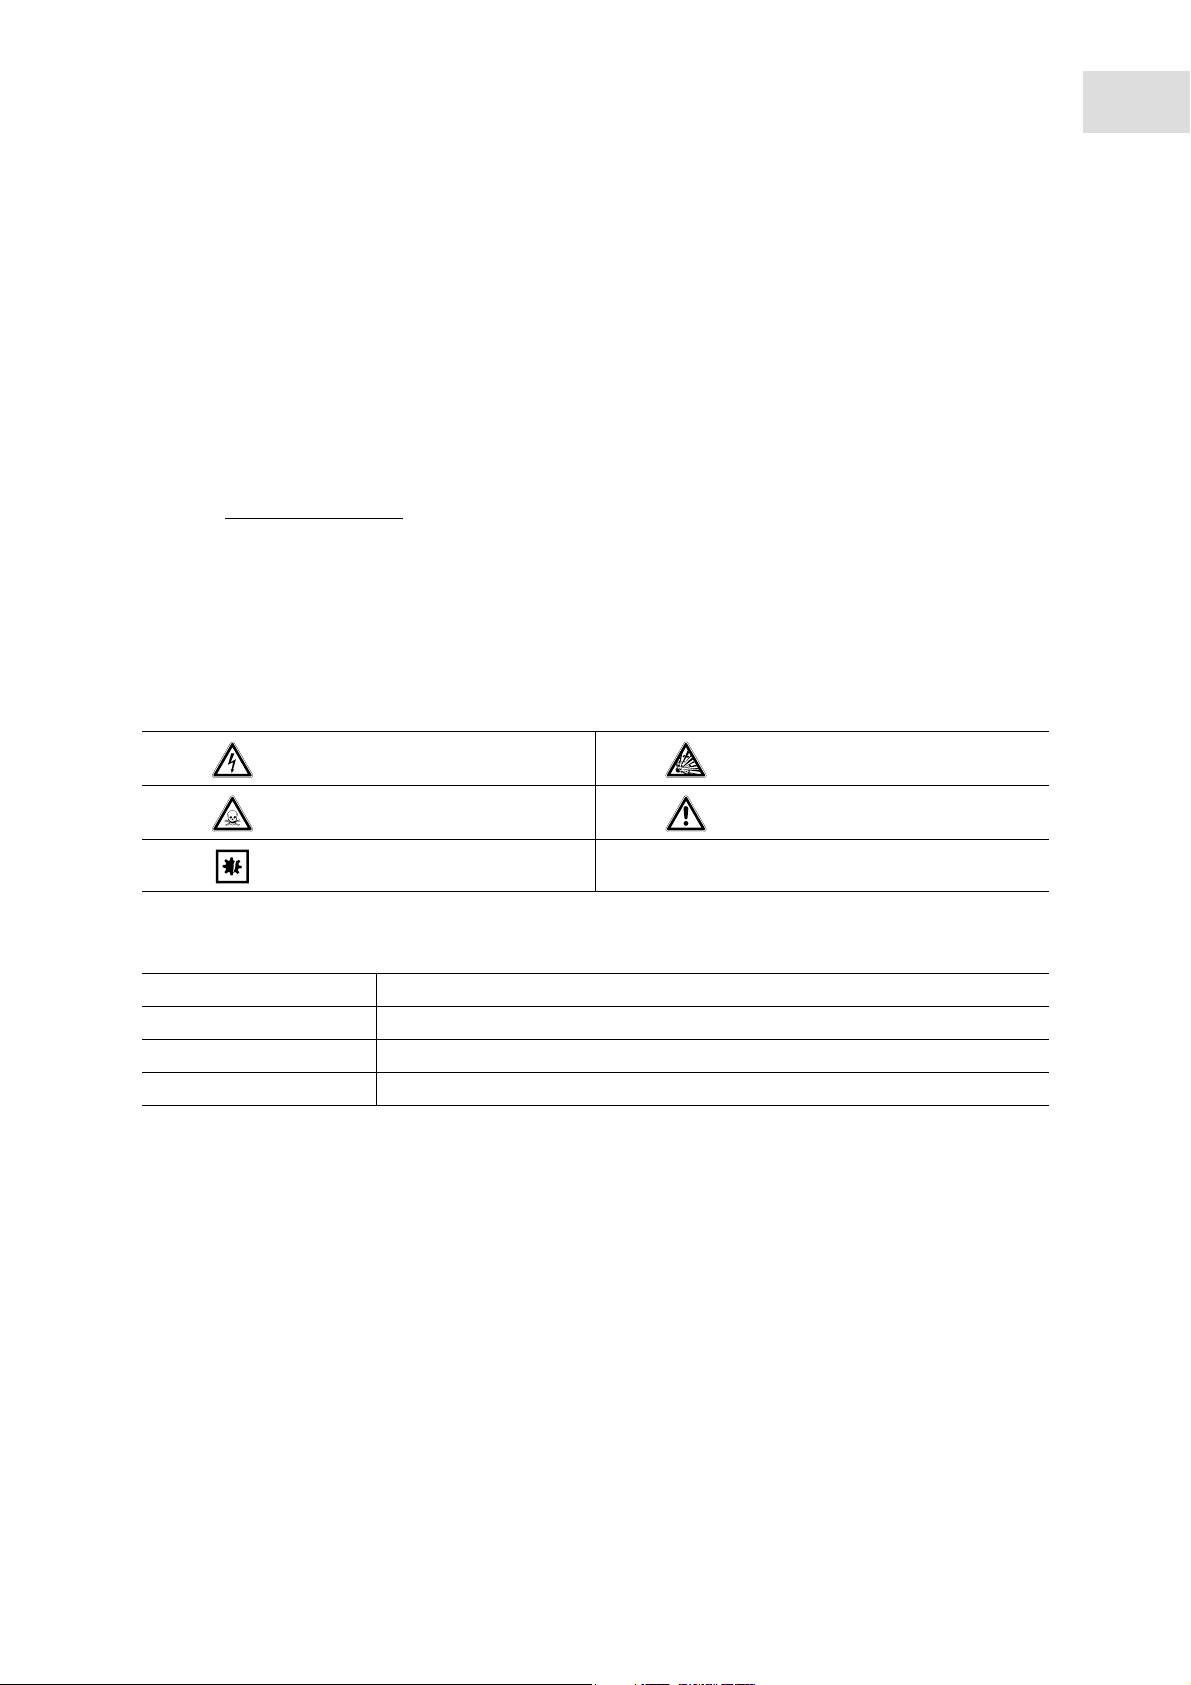
1.2.1 Danger symbols
Electric shock Explosion
Toxic substances Hazard point
Material damage
1.2.2 Danger levels
DANGER Will lead to severe injuries or death.
WARNING May lead to severe injuries or death.
CAUTION May lead to light to moderate injuries.
NOTICE May lead to material damage.
Page 8
Operating instructions
Eppendorf BioSpectrometer
8
English (EN)
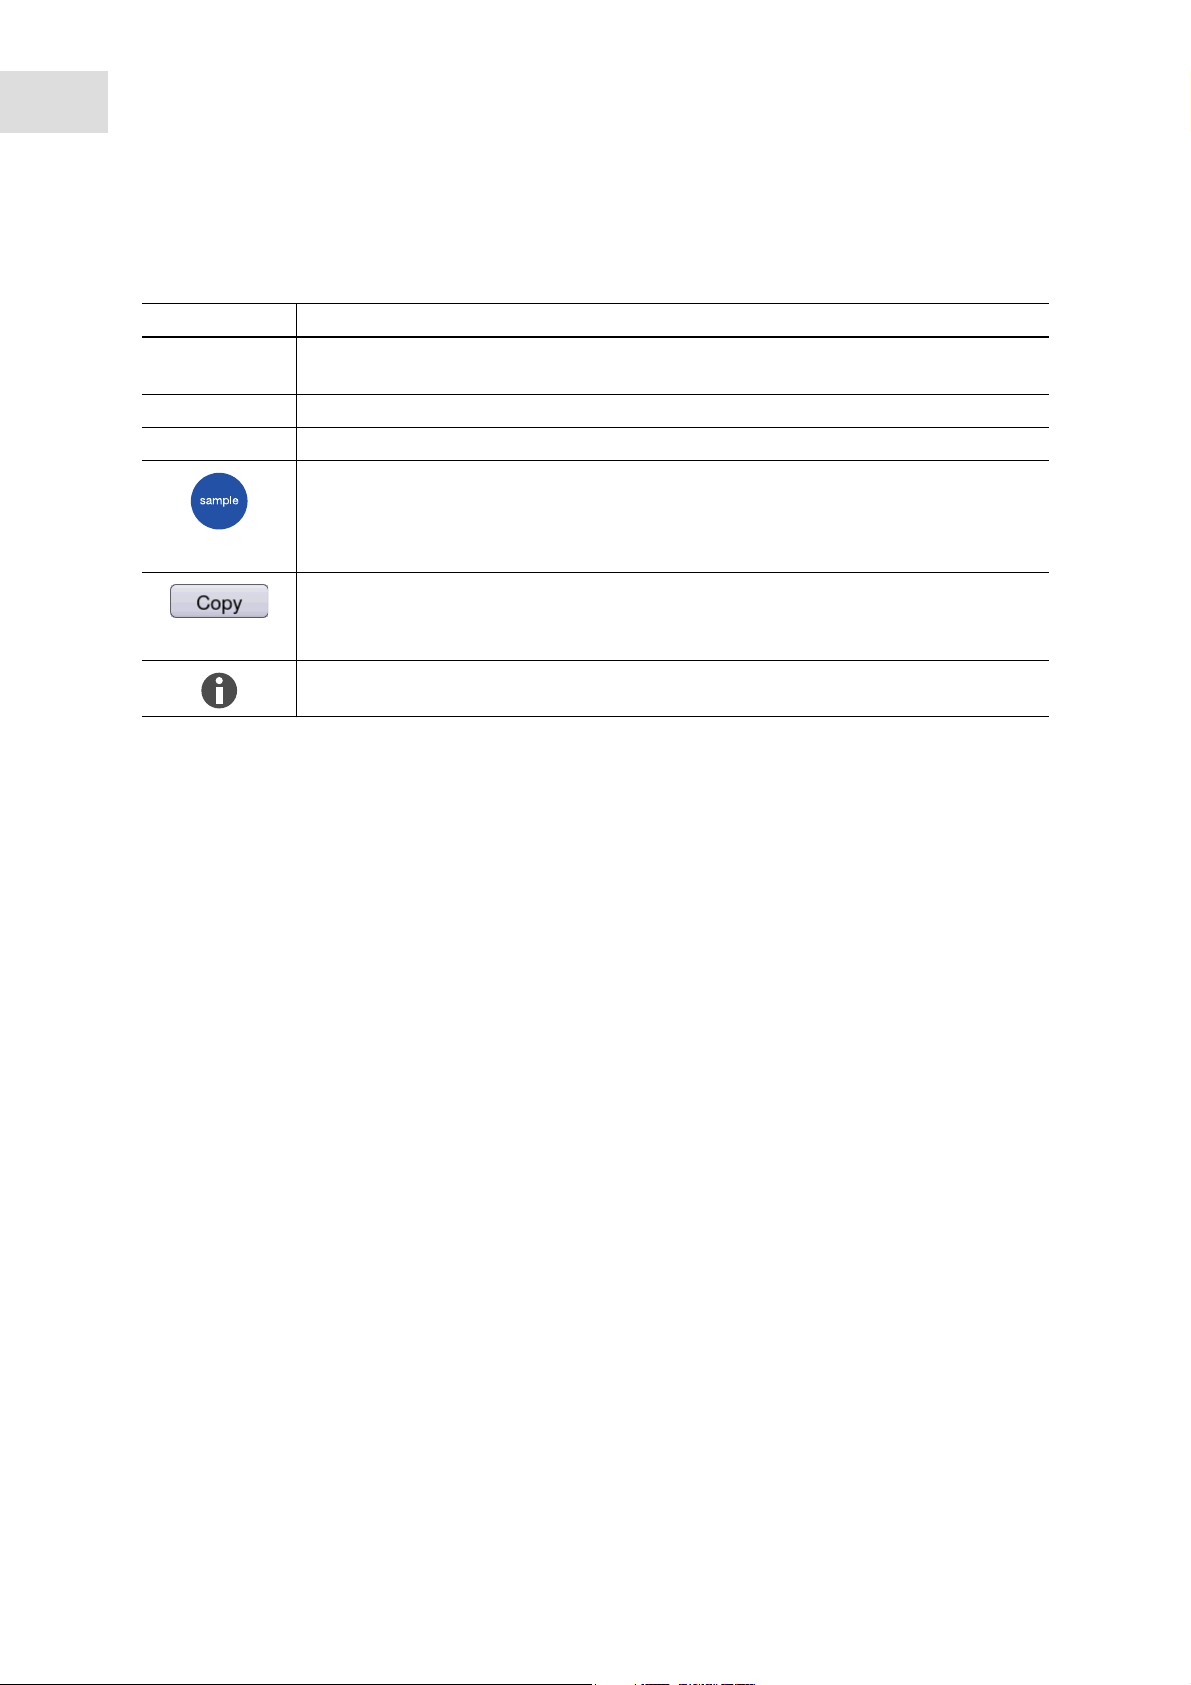
1.3 Symbols used
Depiction Meaning
1.
2.
Actions without a specified order
• List
or sample
or [Copy]
®
basic
Actions in the specified order
Press this key to perform the described action.
Press this softkey to perform the described action.
Additional information
Page 9

Operating instructions
Eppendorf BioSpectrometer
English (EN)
1.4 Abbreviations used
A
Absorbance
DNA
Deoxyribonucleic acid
dsDNA
Double-stranded DNA
Dye methods
Methods for dye labels group for measuring dyed biomolecules
FOI
Frequency of Incorporation: measure for the amount of dye molecules in relation to the amount of
nucleotides in dyed biomolecules
®
basic
9
M
mol/L (molar)
OD600
Optical density at a wavelength of 600 nm
RNA
Ribonucleic acid
ssDNA
Single-stranded DNA
UV
Ultraviolet radiation
Vis
Visible light
CV
Coefficient of variation (standard deviation/average value) in percent
Page 10

10
Operating instructions
Eppendorf BioSpectrometer
English (EN)
®
basic
Page 11
2 Product description
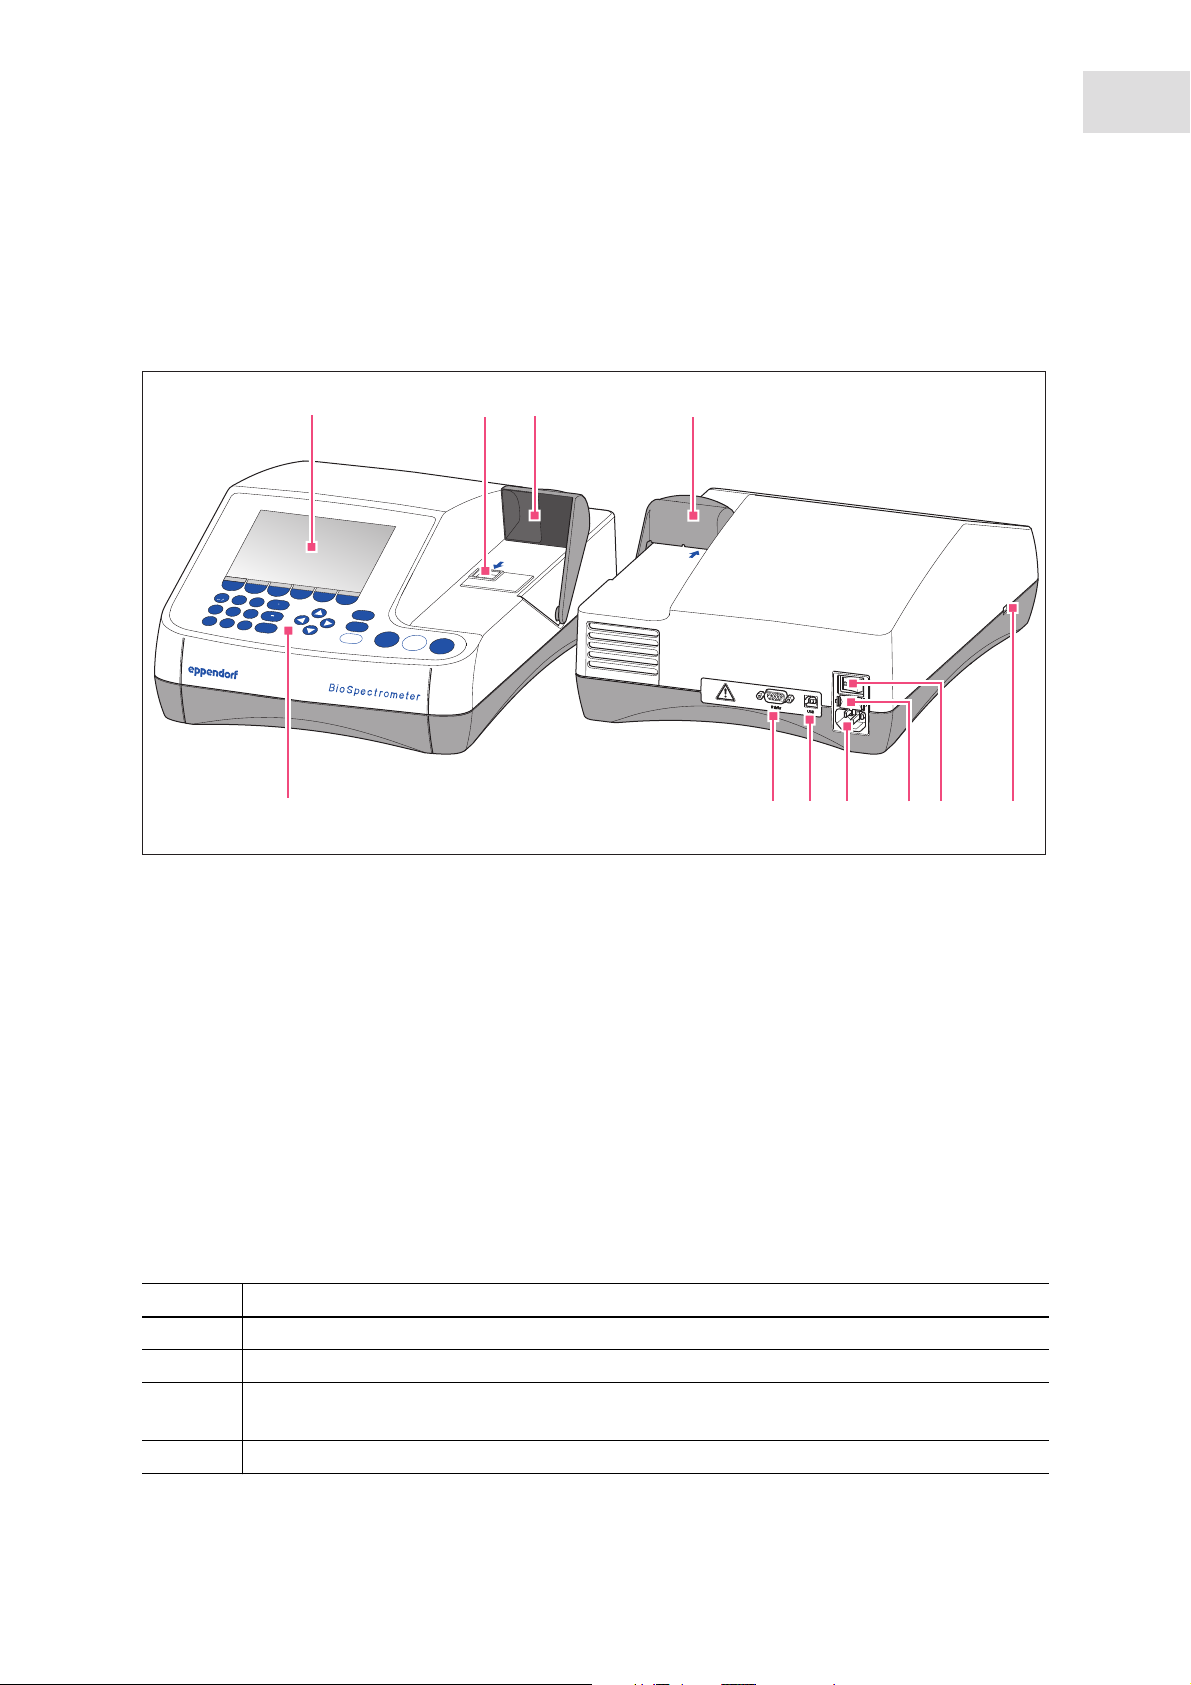
2.1 Main illustration
Abb. 2-1: Front and rear view
Product description
Eppendorf BioSpectrometer
English (EN)
®
basic
11
1
1
2
3
abc
def
method
4
5
ghi
6
jkl
mno
function
7
pqrs
8
9
tuv
0
wxyz
µ %
exit
delete
standard
enter
10
Fig. 2-1: Front and rear view
1 Display
2 Cuvette shaft
3
2 3
absorbance
height
8.5 mm
blank
sample
absorbance
8
9
7
5
6
4
6 Fuse holder
7 Mains/power connection
3 Cuvette shaft cover
4 USB port for USB stick and printer
5 Mains/power switch
8 USB port for PC
9 Connection for RS-232 printer
10 Operating controls
The name plate is located at the rear left on the bottom of the device.
2.2 Delivery package
Quantity Description
1 BioSpectrometer basic
1 Power cord
4 4 UVettes
Original Eppendorf plastic cuvette, individually packaged, PCR clean, protein-free
1 Operating manual, in multiple languages
Page 12

12
Product description
Eppendorf BioSpectrometer
English (EN)
®
basic
2.3 Features
The BioSpectrometer basic is a UV/Vis spectrophotometer for measuring liquids in cuvettes in a
wavelength range of 200 nm to 830 nm. It is intended for use in development and research in the fields of
molecular biology, biotechnology, biochemistry and cell biology. Glass and plastic cuvettes in a volume
range of 1 μL to 3000 μL can be used.
2.3.1 Methods
Numerous methods for concentration determination of nucleic acids, proteins, and dye-marked nucleic
acids and proteins, and the OD 600 method for determining bacterial density via turbidity measurement,
are already preprogrammed. Furthermore, method templates for various measurement and evaluation
procedures (single and multiple wavelength measurements, taking spectra, evaluations with factor,
standard and standard curve) are preprogrammed. It is possible to create individual methods on the basis
of the preprogrammed methods and templates. The templates in the Absorbance method group can be
used to quickly measure absorbances or spectra without an additional evaluation.
2.3.2 Operation
The preprogrammed methods and templates are combined into clearly arranged groups from which the
desired method can be quickly selected. After calling up the method, you are guided through the
measuring procedure in clear steps. A help box in the display provides hints upon request. The 3 round
measuring keys (standard, blank, sample) allow users to quickly start a measurement.
2.3.3 Result output
The BioSpectrometer basic outputs the results using the device display and a printer available from
Eppendorf. With a USB connection, you can transfer result data from the device to a USB stick, a printer or
directly to a PC.
2.3.4 Device self test
The device automatically tests the function of the spectrometer unit right after it has been switched on.
Access the Device calibration function for a more comprehensive test (see Device self-test on p. 73).
Page 13
Safety
Eppendorf BioSpectrometer
®
basic
English (EN)
3 Safety
3.1 Intended use
The BioSpectrometer basic is to be used in molecular biology, biochemistry and cell biology research
laboratories. The BioSpectrometer basic is exclusively intended for use indoors. All country-specific safety
requirements for operating electrical equipment in the laboratory must be observed.
The BioSpectrometer basic is used for photometric concentration determination of analytes in liquids and
recording of absorbance wavelength spectra in cuvettes.
Only use Eppendorf accessories or accessories recommended by Eppendorf.
3.2 User profile
The device and accessories may only be operated by trained and skilled personnel.
13
Before using the device, read the operating manual carefully and familiarize yourself with the device's
mode of operation.
3.3 Warnings for intended use
3.3.1 Personal injury
DANGER! Electric shock as a result of penetration of liquid.
Switch off the device and disconnect the power plug before starting cleaning or
disinfection work.
Do not allow any liquids to penetrate the inside of the housing.
Do not spray clean/spray disinfect the housing.
Only plug the device back in if it is completely dry, both inside and outside.
DANGER! Risk of explosion.
Do not operate the device in areas where work is completed with explosive substances.
Do not use this device to process any explosive or highly reactive substances.
Do not use this device for processing any substances which could generate an explosive
atmosphere.
WARNING! Electric shock due to damage to device or mains cable.
Only switch on the device if the device and mains cable are undamaged.
Only use devices that have been properly installed or repaired.
In case of danger, disconnect the device from the mains supply by pulling the power plug
from the device or the mains socket or, by using the isolating device intended for this
purpose (e.g., emergency stop switch in the laboratory).
Page 14
14
Safety
Eppendorf BioSpectrometer
English (EN)
WARNING! Damage due to UV radiation.
Microliter cuvettes, e.g., Hellma® TrayCell (or microliter cuvettes with a similar design) divert
the radiation from the light source within the cuvette so the radiation can escape upward
when the lid is not closed.
Before starting a measurement, ensure that the lid on the microliter cuvette is not open.
WARNING! Damage to health from toxic, radioactive or aggressive chemicals as well as
infectious liquids and pathogenic germs.
Observe the national regulations for handling these substances, the biological security
level of your laboratory, the material safety data sheets and the manufacturer's application
notes.
Wear personal protective equipment.
For comprehensive regulations about handling germs or biological material of risk group II
or higher, please refer to the "Laboratory Biosafety Manual" (source: World Health
Organization, Laboratory Biosafety Manual, in its respectively current valid version).
®
basic
WARNING! Damage to health due to contaminated device and accessories.
Decontaminate the device and the accessories before storage and shipping.
CAUTION! Poor safety due to incorrect accessories and spare parts.
The use of accessories and spare parts other than those recommended by Eppendorf may
impair the safety, functioning and precision of the device. Eppendorf cannot be held liable or
accept any liability for damage resulting from the use of incorrect or non-recommended
accessories and spare parts, or from the improper use of such equipment.
Only use accessories and original spare parts recommended by Eppendorf.
3.3.2 Damage to device
NOTICE! Damage from the use of aggressive chemicals.
Do not use any aggressive chemicals on the device or its accessories, such as strong and
weak bases, strong acids, acetone, formaldehyde, halogenated hydrocarbons or phenol.
If the device has been contaminated by aggressive chemicals, immediately clean it by
means of a mild cleaning agent.
NOTICE! Damage to the device from fumigating with aggressive chemicals.
Do not use fumigation to disinfect the device.
NOTICE! Corrosion from aggressive cleaning agents and disinfectants.
Do not use corrosive cleaning agents, aggressive solvents or abrasive polishes.
Do not incubate the accessories in aggressive cleaning agents or disinfectants for a longer
period of time.
Page 15

Safety
Eppendorf BioSpectrometer
NOTICE! Damage to electronic components due to condensation.
Condensate can form in the device after it has been moved from a cool environment to a
warmer environment.
®
basic
English (EN)
After installing the device, wait at least for 3 h. Only then connect the device to the mains.
NOTICE! Function impairment due to mechanical damage.
After mechanical damage to the device, ensure that the measuring and evaluation
functions of the device are operating correctly by completing an inspection.
NOTICE! Damage from overheating.
Do not install the device near to any heat sources (e.g., heating, drying cabinet).
Do not expose the device to direct sunlight.
Ensure unobstructed air circulation. Keep free a clearance of at least 5 cm around all
ventilation grilles.
15
NOTICE! Material damage from incorrect use.
Only use the product for its intended purpose as described in the operating manual.
Ensure adequate material resistance when using chemical substances.
In case of doubt, contact the manufacturer of this product.
NOTICE! Damage as a result of incorrect packing.
Eppendorf AG is not liable for damage caused by improper packing.
The device may only be stored and transported in its original packaging.
NOTICE! Damage due to improper cleaning of the cuvette shaft.
Only clean the cuvette shaft using a moist cotton swab (see Cleaning on p. 67).
Do not allow any liquid to enter the cuvette shaft.
Do not reach with your fingers into the cuvette shaft.
3.4 Information on product liability
In the following cases, the designated protection of the device may be compromised. Liability for any
resulting property damage or personal injury is then transferred to the operator:
• The device is not used in accordance with the operating manual.
• The device is used outside of its intended use.
• The device is used with accessories or consumables which are not recommended by Eppendorf.
• The device is maintained or repaired by people not authorized by Eppendorf.
• The user makes unauthorized changes to the device.
Page 16
16
Safety
Eppendorf BioSpectrometer
®
basic
English (EN)
3.5 Safety instructions located on the device
Depiction Meaning Location
Hazard point
Follow the operating manual.
Rear side of the device
Gerät nach dem Öffnen
justieren!
Adjust device after
opening!
The device needs to be readjusted
after it has been opened.
Do not open the device.
Bottom of the device
Page 17

Installation
Eppendorf BioSpectrometer
®
English (EN)
4 Installation
4.1 Preparing installation
Keep the transport carton and the packing material for subsequent safe transport or storage.
Check the completeness of the delivery using the information in the delivery package (see Delivery
package on p. 11).
Check all parts for any transport damage.
4.2 Selecting the location
Select the location for the BioSpectrometer basic according to the following criteria:
• 2 grounded sockets for the BioSpectrometer basic and for the printer.
• Solid laboratory bench with horizontal work surface
Space requirement of the device: 50 cm (with printer: 75 cm) width, 50 cm depth.
• Temperature: 15°C to 35°C.
• Avoid temperature fluctuations (e.g, caused by open windows).
• Avoid direct sunlight.
• Humidity: 25% to 70% relative humidity.
basic
17
Ensure that no objects (e.g., loose sheets, notebooks) that could impede the flow of air are
positioned under the device.
4.3 Connecting the device to the mains
1. Place the BioSpectrometer basic on a suitable work surface.
2. Verify that the mains/power supply voltage and mains/power frequency match the information on the
name plate.
3. Connect the device to the mains/power line and switch it on with the power switch.
4. Remove the protective film from the display.
4.4 Connecting the printer
4.4.1 Thermal printer DPU-S445
Prerequisites
Software version 3.4.4.0 or higher is installed on the device.
Connect the thermal printer DPU-S445 to the USB port for printers.
1. Connect the printer cable with the USB port for printers 4 (see Main illustration on p. 11).
2. Connect the printer cable with the printer.
3. Connect the printer to the mains/power line using the supplied mains/power adaptor and mains/power
cord (printer accessory) and switch it on.
For information on the printer, refer to the operating manual of the printer.
Page 18

18
Installation
Eppendorf BioSpectrometer
®
basic
English (EN)
4.4.2 Thermal printer DPU-414
Connect the thermal printer DPU-414 to the serial printer connection.
1. Connect the printer cable to the serial printer connection 9 and tighten the locking screws.(see Main
illustration on p. 11).
2. Connect the printer cable to the printer and tighten the locking screws as well.
3. Connect the printer to the mains/power line using the supplied mains/power adaptor and mains/power
cord (printer accessory) and switch it on.
Information about modifying printer settings can be found in the operating manual for the printer.
The DIP switches are preset for the BioSpectrometer basic according to the following table.
Tab. 4-1: Setting the DIP SW for the thermal printer
DIP SW-1 Meaning
1 (OFF) Input = Serial
2 (ON) Printing Speed = High
3 (ON) Auto Loading = ON
4 (OFF) Auto LF = OFF
5 (ON) Setting Command = Enable
6 (OFF) Printing
7 (ON) Density
8 (ON) = 100%
DIP SW-2 Meaning
1 (ON) Printing Columns = 40
2 (ON) User Font Back-up = ON
3 (ON) Character Select = Normal
4 (ON) Zero = Normal
5 (ON) International
6 (ON) Character
7 (ON) Set
8 (OFF) = U.S.
DIP SW-3 Meaning
1 (ON) Data Length = 8 bits
2 (ON) Parity Setting = NO
3 (ON) Parity Condition = Odd
4 (OFF) Busy Control = XON/XOFF
5 (OFF) Baud
6 (ON) Rate
7 (ON) Select
8 (ON) = 9600 bps
Page 19
Installation
Eppendorf BioSpectrometer
®
basic
English (EN)
4.5 Connecting PC or USB stick for data export
You can connect a FAT 32-formatted USB stick to the USB port 4 (see Main illustration on p. 11).
Alternatively, you can connect the device for the data export directly to a PC by using a USB cable:
Prerequisites
• PC with Windows, version XP, SP2 or higher version.
• USB cable with a type A and type B plug each.
Connect the device to the PC by using the USB cable on the USB port 8 (see Main illustration on p. 11).
• You do not need any special PC software for the data transmission: the transferred data
packets are recognized by the PC like a USB stick as a removable medium. For viewing the
data, you only need to open the registered data packet.
• The transmission of data to the USB stick or to the PC is started after completing the series
of measurement in the print & export (see Print & export on p. 55) method step.
19
Page 20

20
Installation
Eppendorf BioSpectrometer
English (EN)
®
basic
Page 21
5 Operation
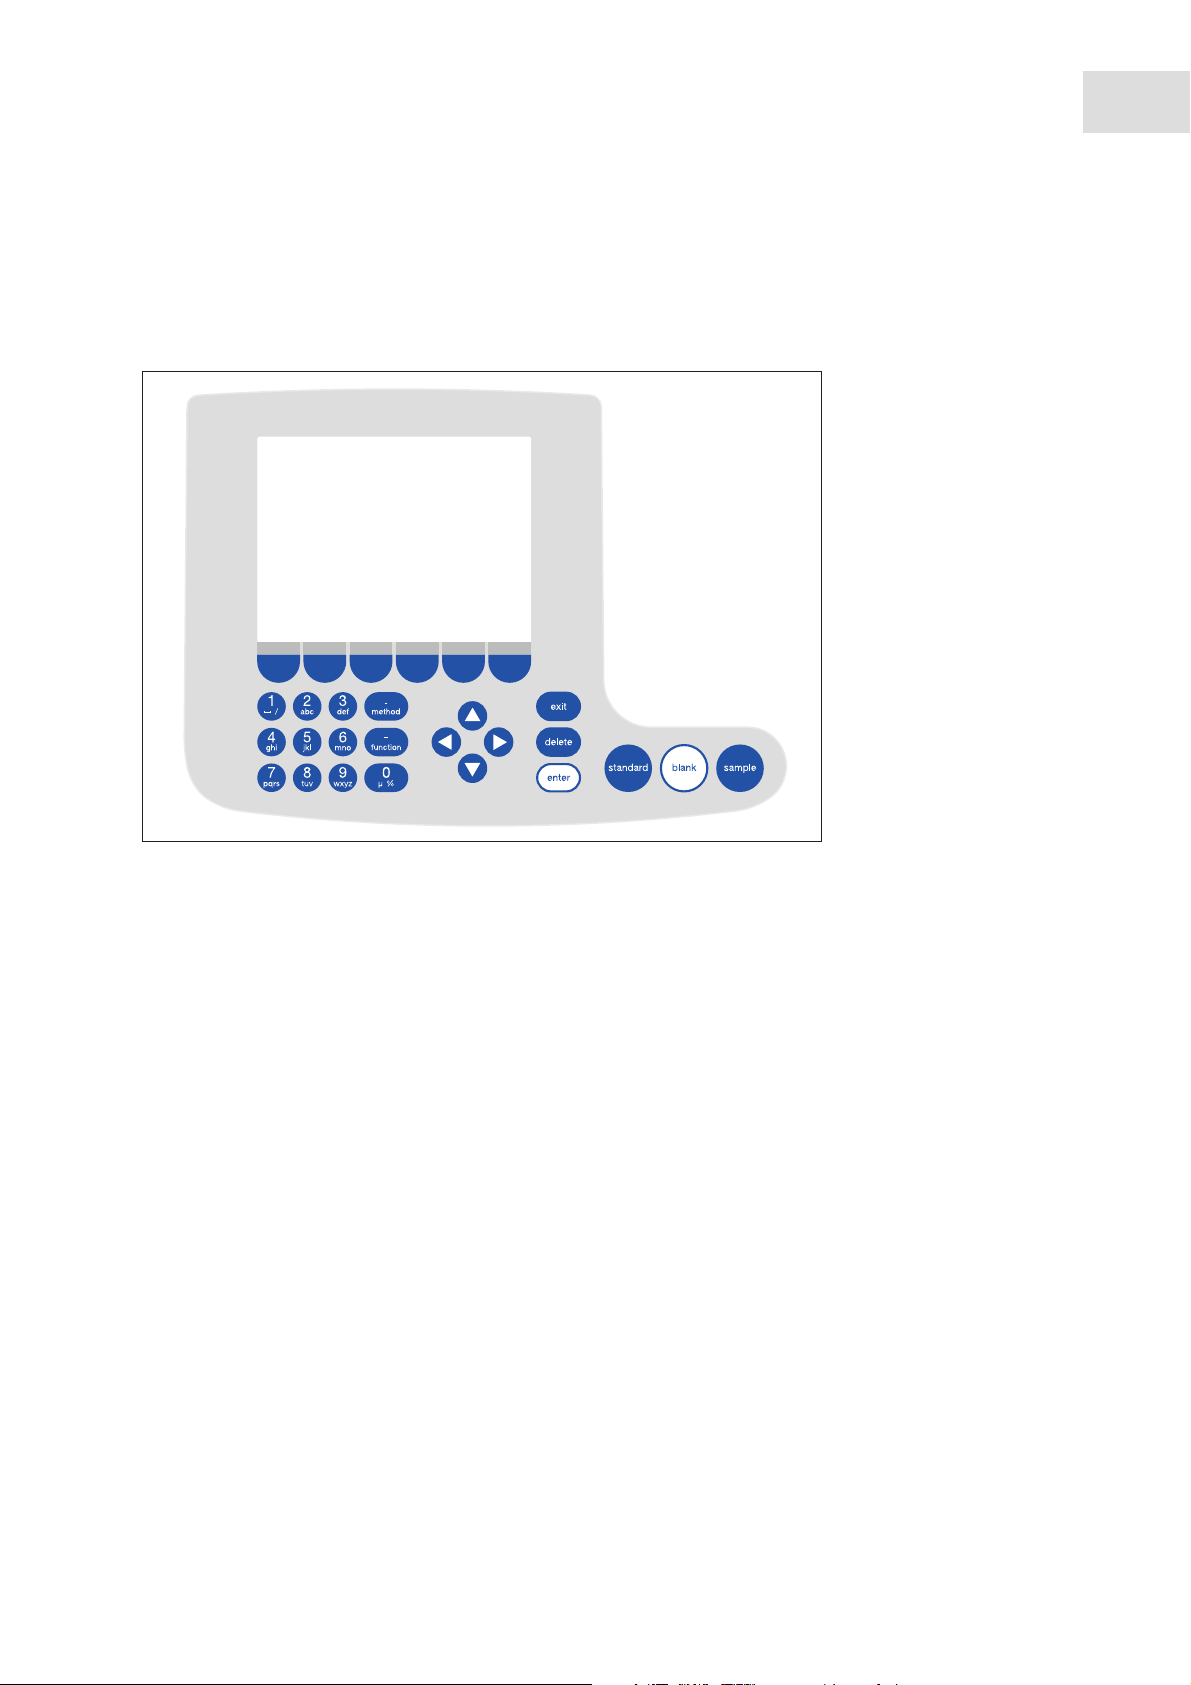
5.1 Overview of operating controls
Abb. 5-1: Control panel of the BioSpectrometer basic
Operation
Eppendorf BioSpectrometer
English (EN)
®
basic
21
Fig. 5-1: Control panel of the BioSpectrometer basic
Page 22
22
Operation
Eppendorf BioSpectrometer
®
basic
English (EN)
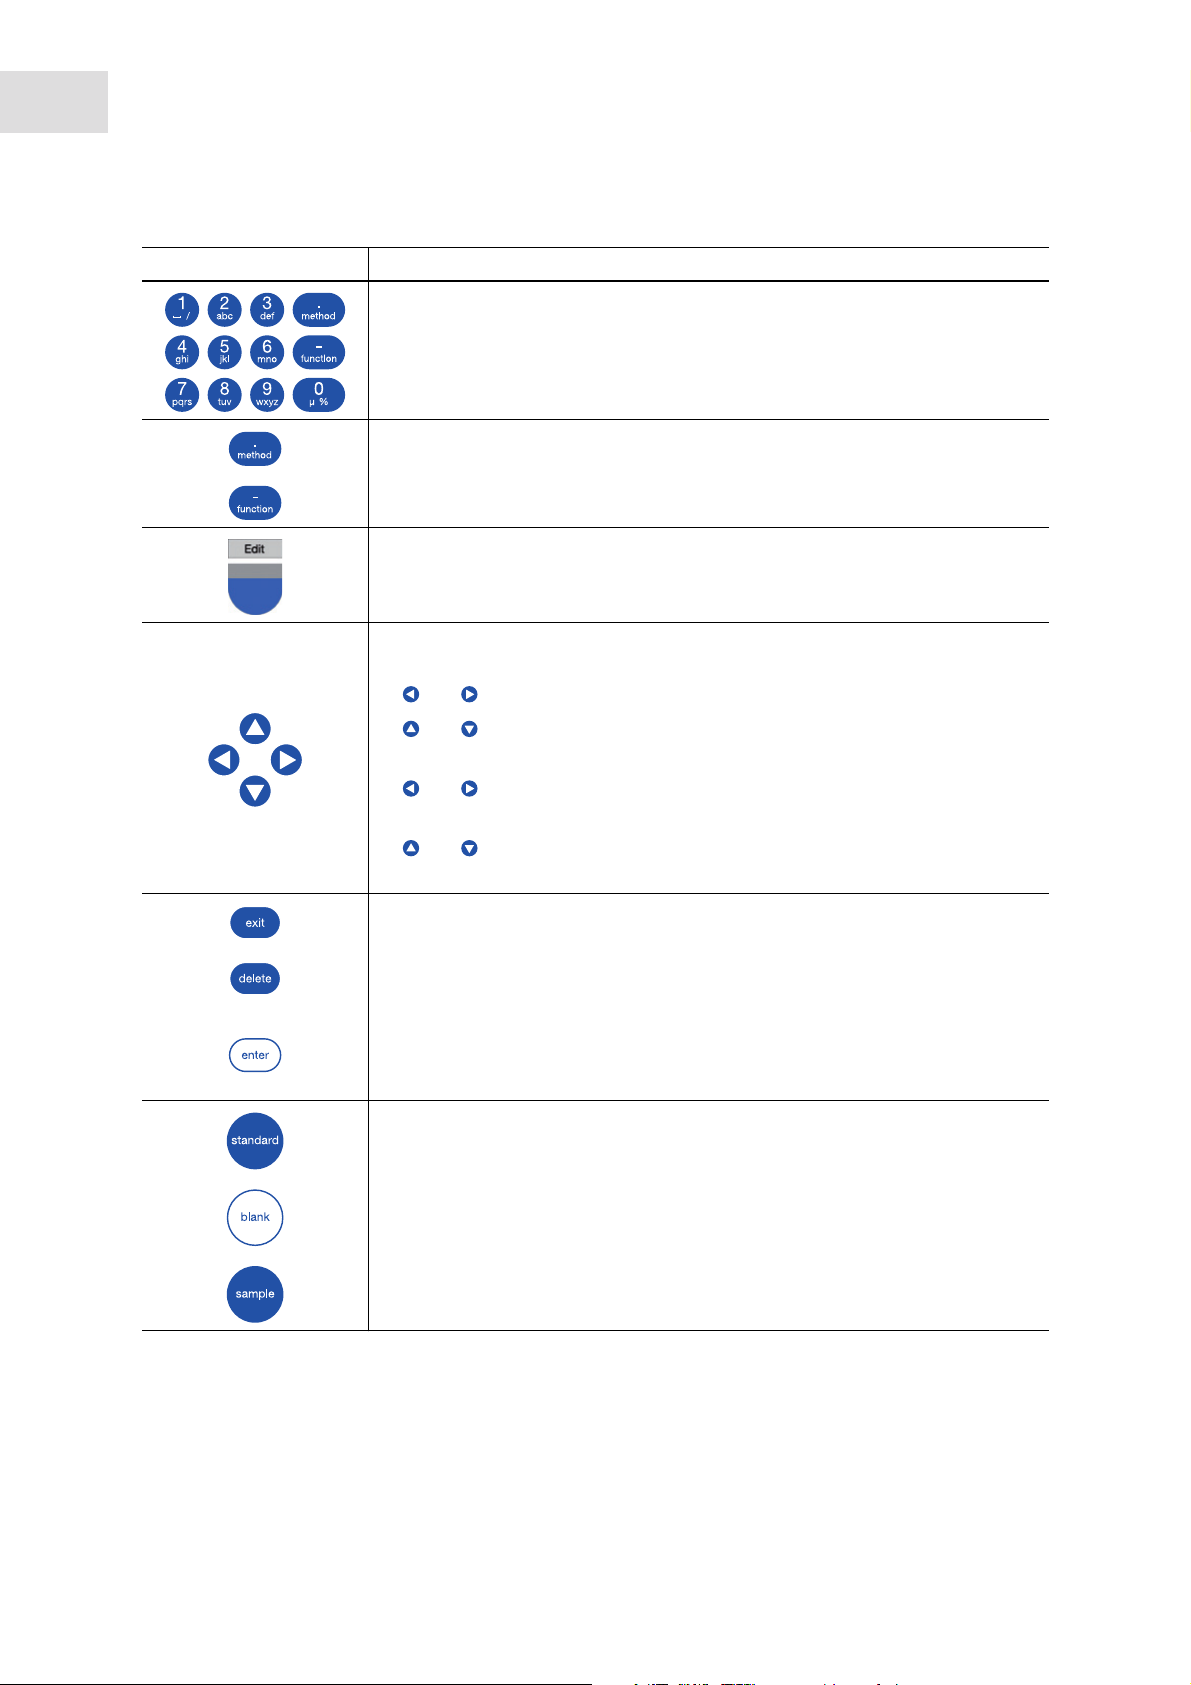
Key: Function
Keypad: Enter digits and text.
Keys 1 to 9 as well as 0: When entering text, next to numbers you also can
enter letters and special characters by pressing the key several times.
Alternatively, you can switch to a displayed keyboard with the [Keyboard] key.
Outside of entry fields: Call up method selection.
Outside of entry fields: Call up function selection.
Softkey: Select functions.
The key assignment changes along with the software dialog. The current
function is displayed directly above the key on the display.
Move the cursor to the left, right, up, down.
• Navigation between input fields.
• and keys inside an entry field: Navigate within the character string.
• and keys in a result display: Navigate between the sample results of
the series of measurement.
• and keys within a graph: Navigate on the x-axis of the graph, e.g. for
displaying the wavelength-dependent absorbance values in a scan.
and keys in an absorbance wavelength spectrum: Change image
section (SpectraZoom procedure) (see Tab. on p. 52).
Exit the current selection for the next higher level.
Delete entry. Within a sequence of signs, the sign on the left of the cursor is
deleted
• Call up selected method or function.
• Open the selection list.
• Confirm entry or selection.
Start standard measurement.
Start blank measurement.
Start sample measurement.
Page 23
Operation
Eppendorf BioSpectrometer
®
basic
English (EN)
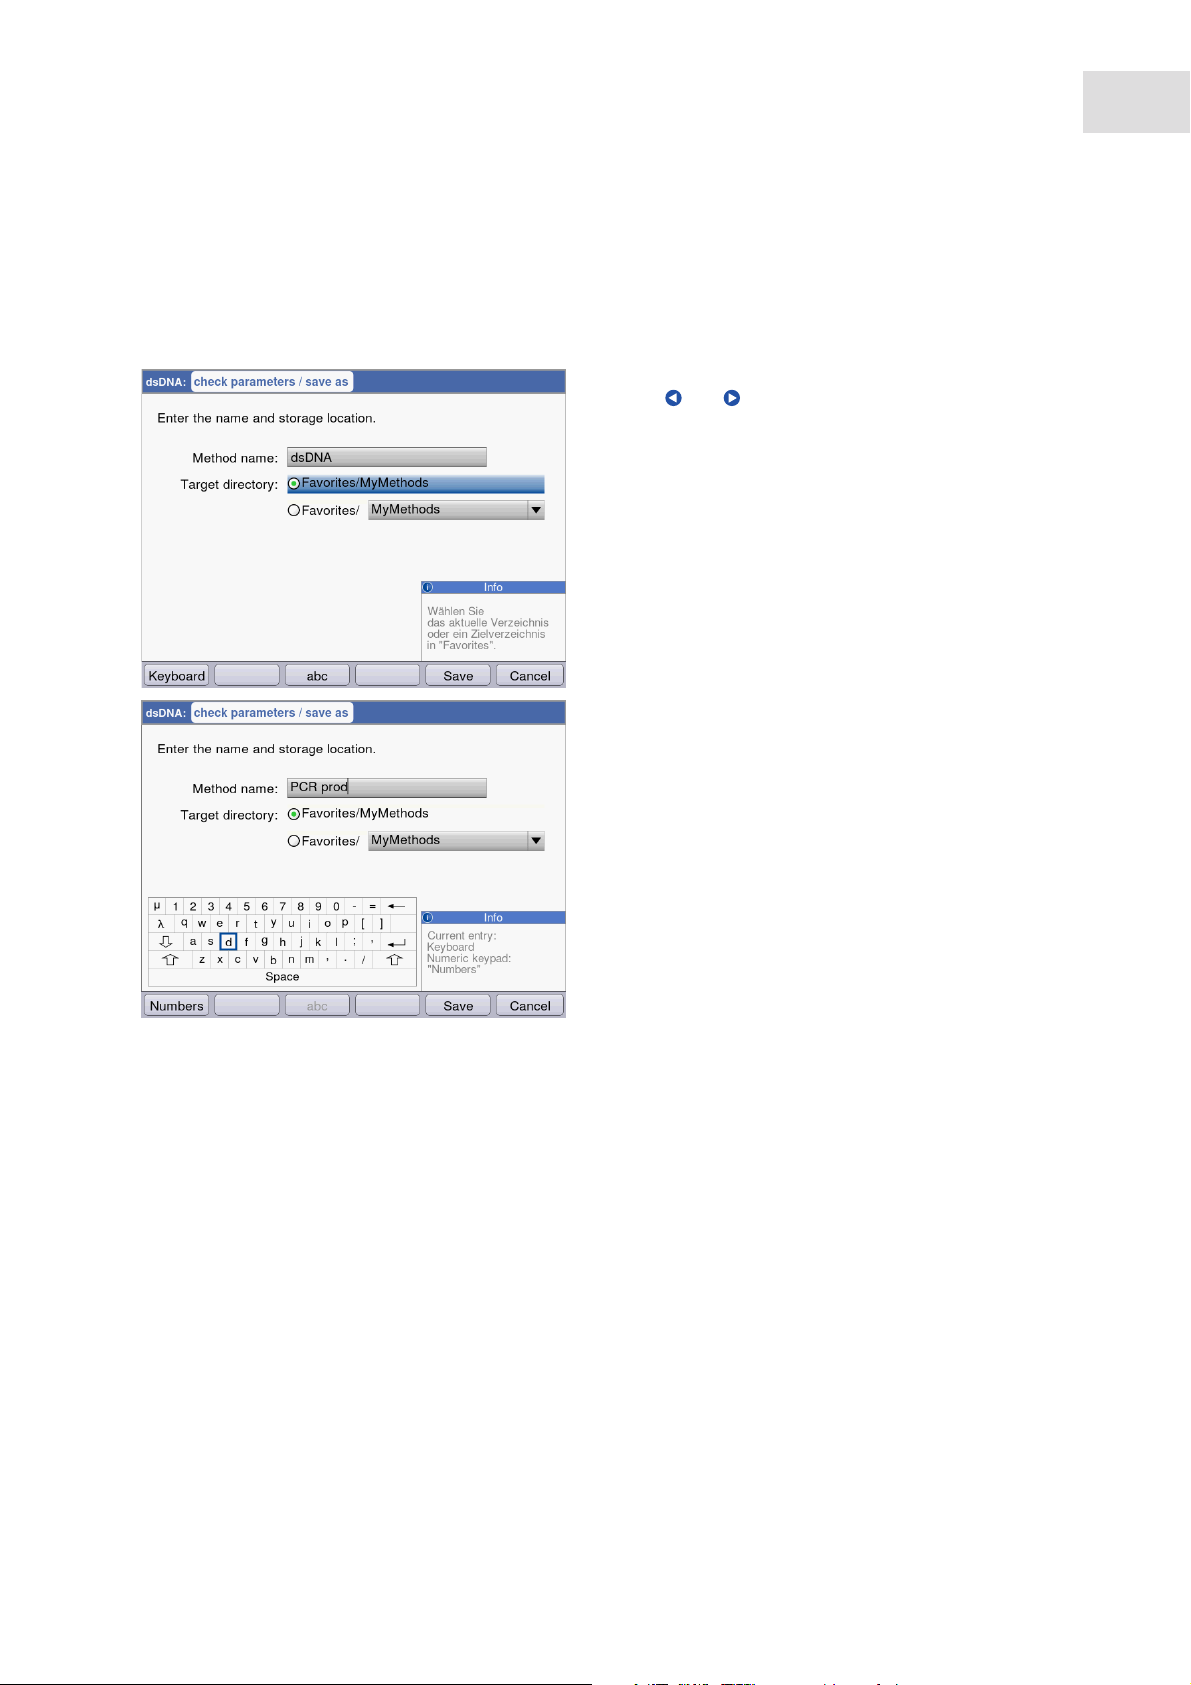
5.1.1 Entering text
You can enter texts when assigning method names and result units. Restriction: Only digits, letters and the
underscore "_" are allowed for method names.
Entry via keyboard:
Use the and cursor keys to navigate within the
entry field and to change single positions in the
name.
Softkeys:
• [Keyboard]: Display keyboard.
• [abc]: Change between upper and lower case
letters when making entries with the keypad.
• [Save]: Save entered text.
• [Cancel]: Cancel text input.
23
Entry via the displayed keyboard:
Use the cursor keys to select the displayed signs and
respectively confirm your selection with the enter
key. As for a PC key pad, you can use the "Shift"
resp. the "Caps Lock" key for changing the
capitalization for the next entry or for all following
entries.
Softkeys:
• [Numbers]: Switch to entry using the keyboard.
• [Save]: Save entered text.
• [Cancel]: Cancel text input.
Page 24
24
Operation
Eppendorf BioSpectrometer
®
basic
English (EN)
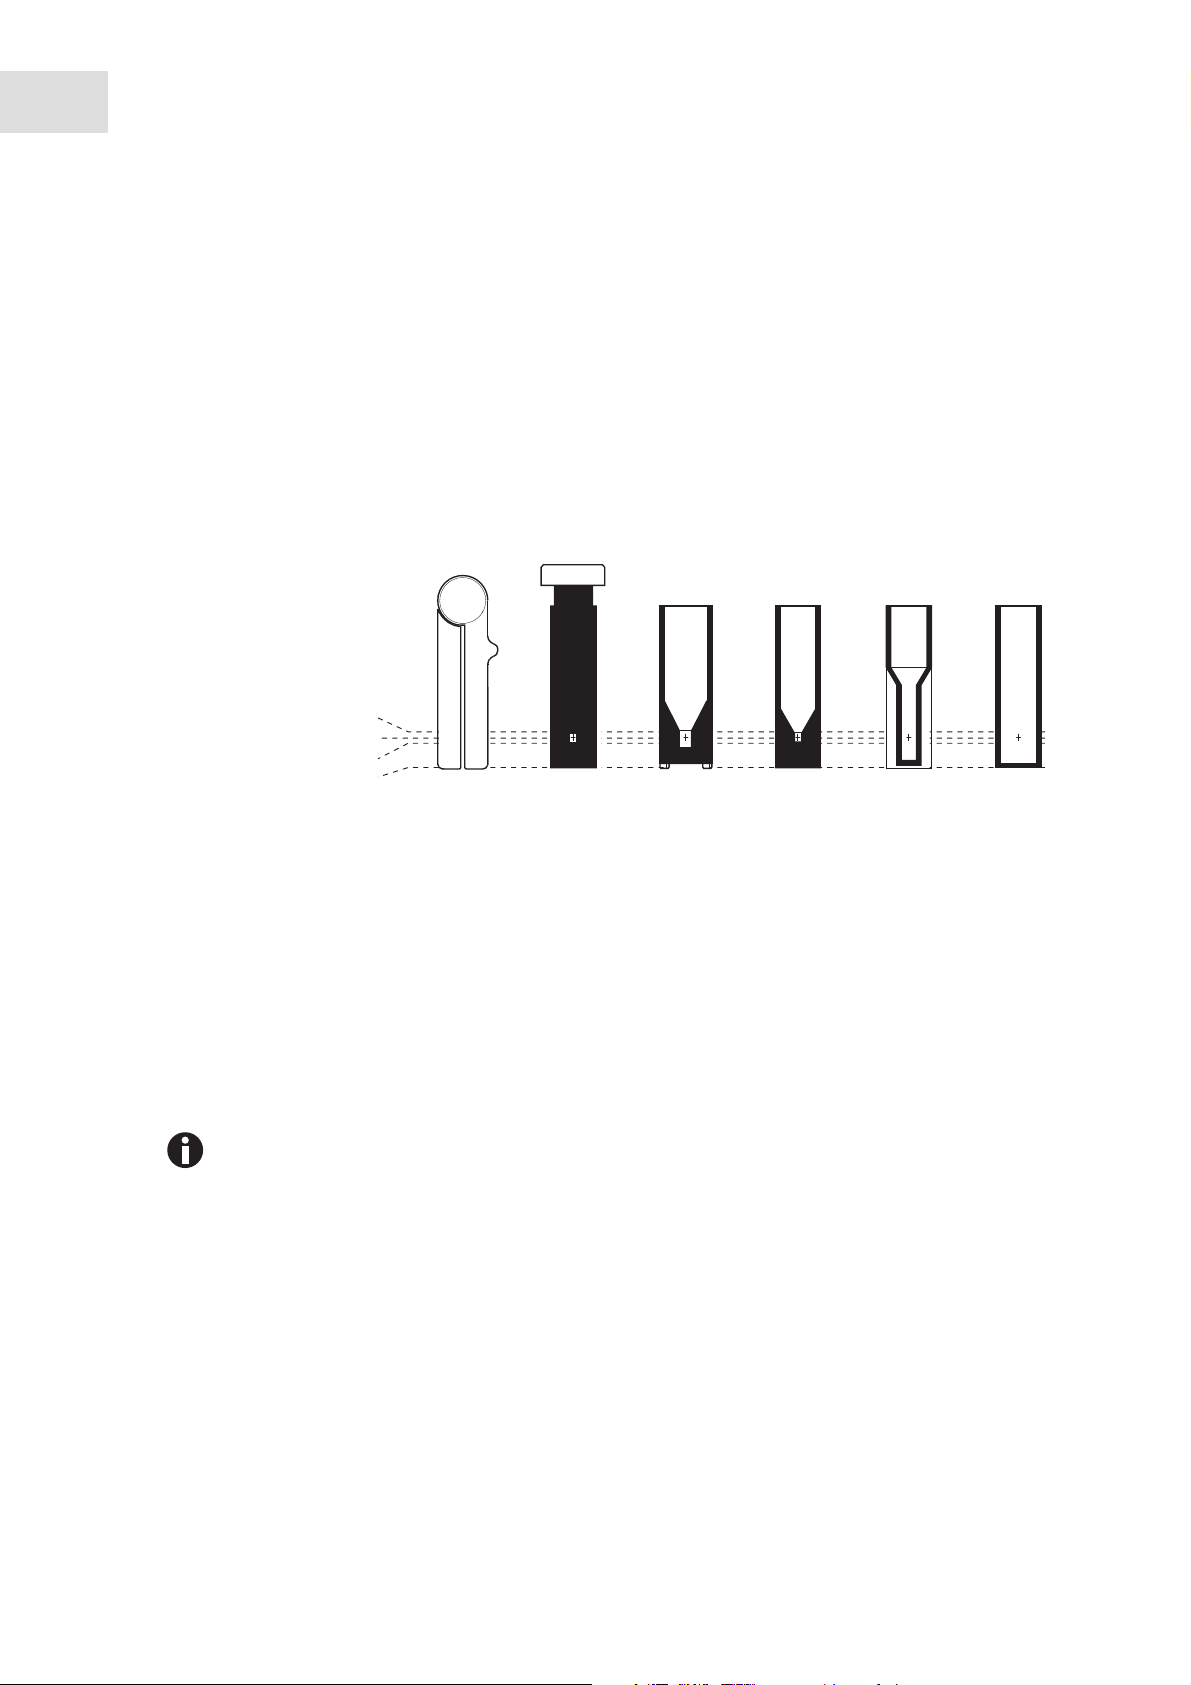
5.2 Inserting the cuvette
Standard rectangular glass or plastic cuvettes can be inserted in the cuvette shaft:
• External dimensions: 12.5 mm × 12.5 mm
• Height of light path: 8.5 mm higher than cuvette base
• Total height: min. 36 mm
The cuvettes must be optically transparent for the respective measuring wavelength. For measurements in
the UV range, Eppendorf offers the plastic cuvette UVette which is transparent for wavelengths of 220 nm
and higher and therefore also is suitable for measuring nucleic acids.
Cuvettes
Basic area 12.5 mm × 12.5 mm
Min. overall height 36 mm
Min. filling level 10 mm
Light path 8.5 mm
Max. height of base 7 mm
0 mm
Min. volume Photometry
Eppendorf
µCuvette G1.0
See manufacturer
information
®
Hellma
See manufacturer
* or similar microliter cuvette
TrayCell *
information
®
50 µL 70 µL 400 µL 1000 µL
Prerequisites
• The cuvette is free from contamination by dust or fingerprints and free from scratches.
• The cuvette shaft is free from particles, dust and liquid.
• The measuring volume in the cuvette is sufficient. Ensure that the minimum measuring volume has
been reached.
• The measuring solution is free from particles and bubbles.
• The cuvette temperature is above the temperature of the dew point that applies for the ambient
conditions (humidity and temperature).
MacroSemi-microUltra-microUVette
The direction of the light path is marked with an arrow on the housing.
1. Position the cuvette so that the optical window of the cuvette is pointing towards the direction of the
light path.
2. When inserting the cuvette, press it completely to the bottom against the slight resistance.
Page 25
Operation
Eppendorf BioSpectrometer
®
basic
English (EN)
5.3 Summary of the measuring procedure
5.3.1 Preparing the measurement
1. Switch on the device and, if required, the printer.
The device performs a self test (taking approx. 1 minute) and displays the method selection.
2. Make ready the cuvettes for the measurements (see Inserting the cuvette on p. 24).
3. Prepare the measuring solutions for measuring the blank values, if required, also the standards and the
samples.
4. Open the cover of the cuvette shaft. The cover can remain open during the measurements.
You should not use any measuring solution for standards and samples with a lower
absorbance than 0.02 to 0.03 A (e.g. dsDNA concentration between 1.0 and 1.5 μg/mL). The
detection limit of the device may be significantly lower, nevertheless, the impact of
disturbances from the measuring solutions (particles, bubbles, turbidity) on the reliability of
the result is very high for these low absorbance values.
25
5.3.2 Measuring procedure
5.3.2.1 Selecting a method
Use the cursor keys to select the desired
method and call up the method with the enter
key.
For an overview and a detailed description of the
methods, refer to the next chapter (see Methods on
p. 31).
Wizard: The wizard at the top of the display will
take you through the method procedure
step-by-step.
Help box: You will receive help texts in the lower
right of the display during each step of the
procedure.
Softkeys: The [< Back] and [Next >] softkeys allow
you to move between method steps in the wizard.
Page 26
26
Operation
Eppendorf BioSpectrometer
English (EN)
®
basic
5.3.2.2 Checking parameters
5.3.2.3 Measuring the blank and standards
Check the parameter setting. The [Page dn] and
[Page up] softkeys allow you to call up the
parameter list pages. You can modify and save
parameters using [Edit].
For evaluations without standards (e.g. DNA measurements), this method step is omitted.
1. Start by measuring a blank (blank key).
2. Then measure all standards one by one
(standard key).
The display always marks the standard that is to be
measured next. Use the [Graph] resp. [Table]
softkey to change the result view.
Press [Next] to accept the evaluation calculated
from the standard results.
Page 27
5.3.2.4 Measuring samples
5.3.2.5 Finalizing the method
Operation
Eppendorf BioSpectrometer
®
basic
English (EN)
The sample key is used for measuring your
samples consecutively.
Blank results will remain saved for the duration of
one series of measurement. However, a new blank
measurement always is possible. (The adjacent
figure shows a measuring procedure with
evaluation via the standard curve and, in addition
to the sample result, the graph of the standard
evaluation.)
27
5.3.2.6 Optional: process results
1. Press [Finish], to complete the measuring series
and return to the method selection.
2. After all measurements have been completed,
switch off the device and close the cuvette shaft
cover to protect the cuvette shaft from
contamination.
For some methods, you can postprocess the results
in the process results method step. For example,
you can use the SpectraZoom zoom function in the
spectra.
Use the and cursor keys for selecting
systematically any results of the series of
measurement for postprocessing.
Page 28
28
Operation
Eppendorf BioSpectrometer
®
basic
English (EN)
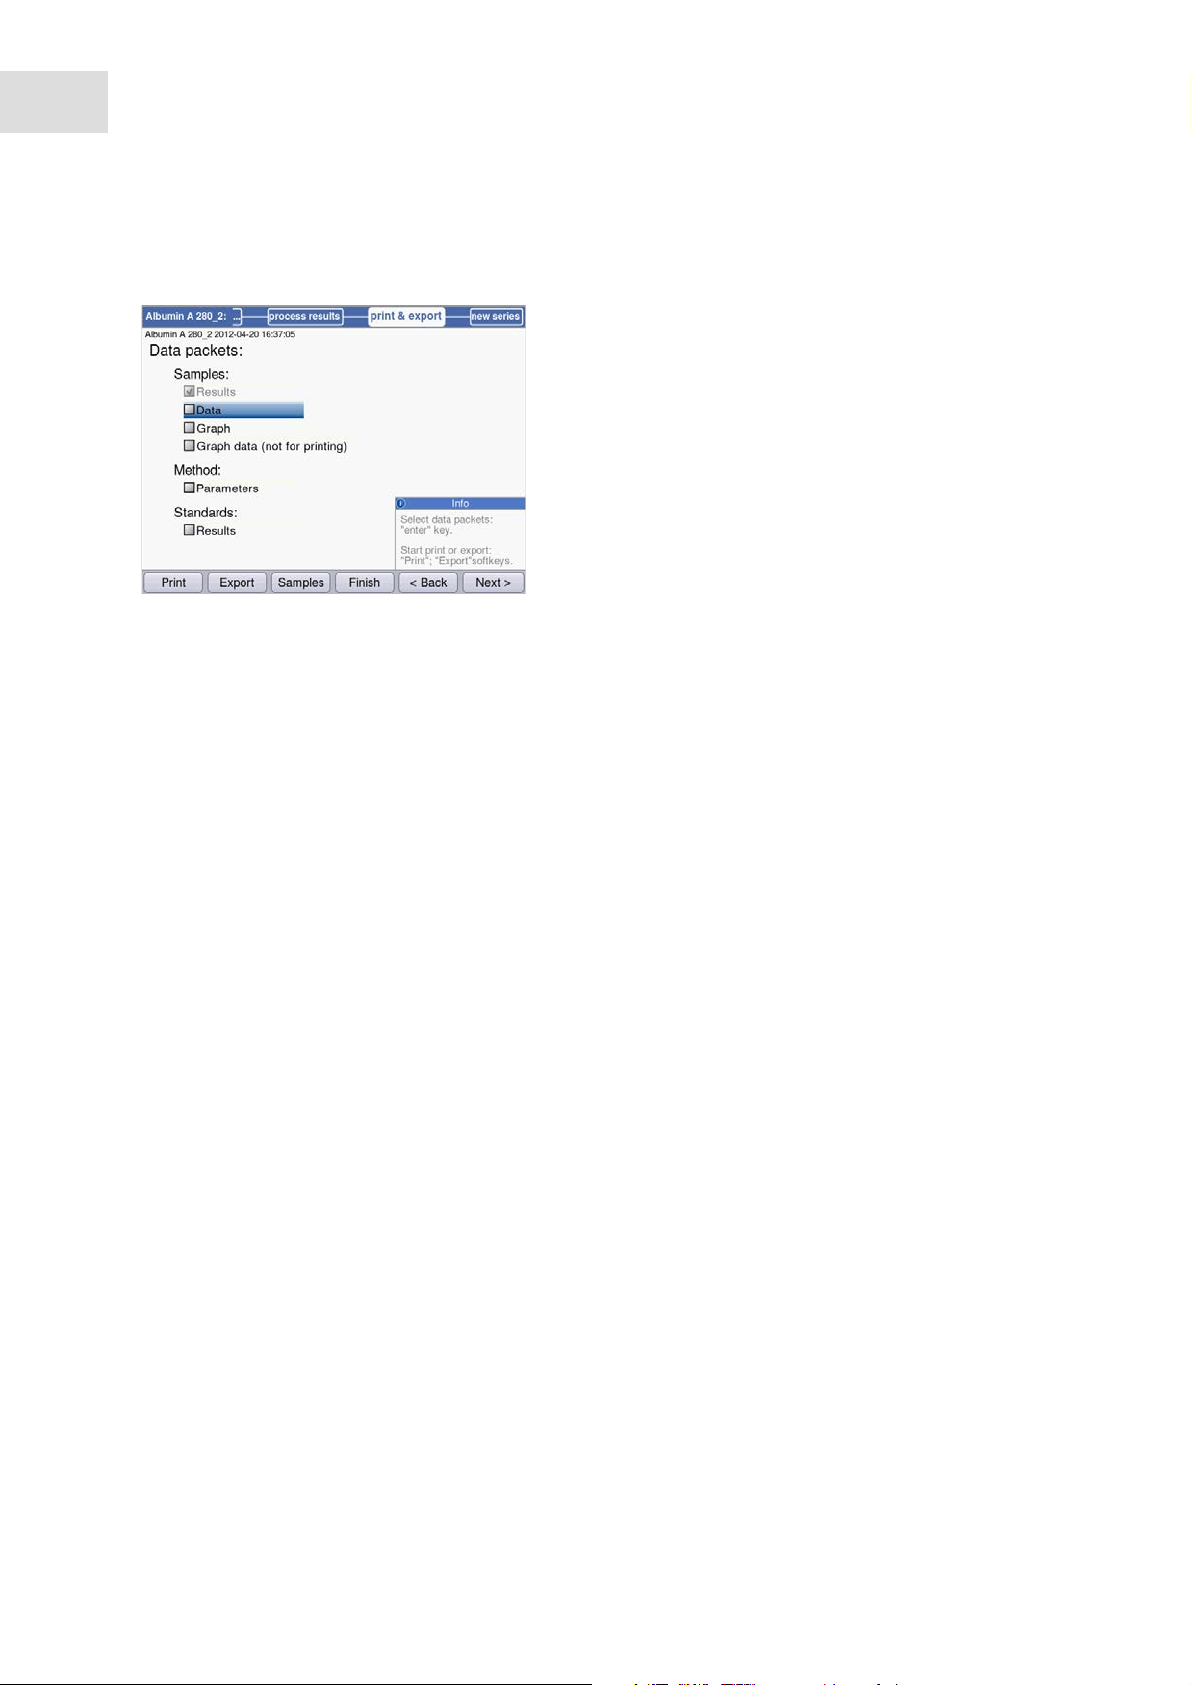
5.3.2.7 Printing and exporting
1. Compose data packets for all samples or for
selected samples.
2. Print the data, save them to a USB stick or
transfer them to a PC via a USB cable.
Page 29

5.3.3 Important measurement instructions
Check for each measurement:
• For plastic cuvettes: How many consecutive measurements can be reliably carried out in
the cuvette?
• Measure the cuvette blank value before the sample or standard measurements in order to
compensate the cuvette blank value in addition to the reagent blank.
• Blank results remain saved for one measuring series, but a new blank result measurement
can be performed at any time, even between sample measurements.
• The displayed absorbance values always correspond to the directly measured values. The
dilution or cuvette factor as well as background absorbances only will be incorporated for
the following result calculation (see Absorbance values on p. 89).
• The measuring result is typically displayed 2 to 3 seconds after a measurement has been
started. If (for high absorbance values) only a low quantity of light reaches the receiving
part, the measuring time automatically can be extended to 9 seconds in order to increase
the precision of the measurement.
• Observe that the measured absorbance values do not exceed the upper limit of the
photometric measuring range. In this case, reject the measuring result. The upper limit of
the photometric measuring range does not only depend on the wavelength (see
Photometric properties on p. 86) but also on the cuvette blank. Ultra-micro cuvettes with a
small diaphragm, such as TrayCell (Hellma), may have a cuvette blank of approx. A = 1.
The available photometric measuring range is reduced by this amount. You can estimate
the cuvette blank by measuring the cuvette filled with demineralized water as a sample in
comparison with the empty cuvette shaft as a blank. The cuvette blank of the Eppendorf
μCuvette G1.0 is negligible (approximately A = 0).
• After the measurement, remove the measuring solution completely before filling in the
next measuring solution in order to minimize carry-over. If a carry-over from one sample to
the next sample can be expected due to a high concentration difference, rinse the cuvette
between the measurements.
• If the temperature between the lamp and the ambience differs, photometric drift may
occur. Therefore a device from a colder ambience first has to be adjusted to the ambient
temperature.
Avoid quick changes of temperature. Carry out a new blank measurement for a long series
of measurements or measurements over a long period of time.
Operation
Eppendorf BioSpectrometer
English (EN)
®
basic
29
Page 30

30
Operation
Eppendorf BioSpectrometer
English (EN)
®
basic
Page 31

Methods
Eppendorf BioSpectrometer
®
basic
English (EN)
6 Methods
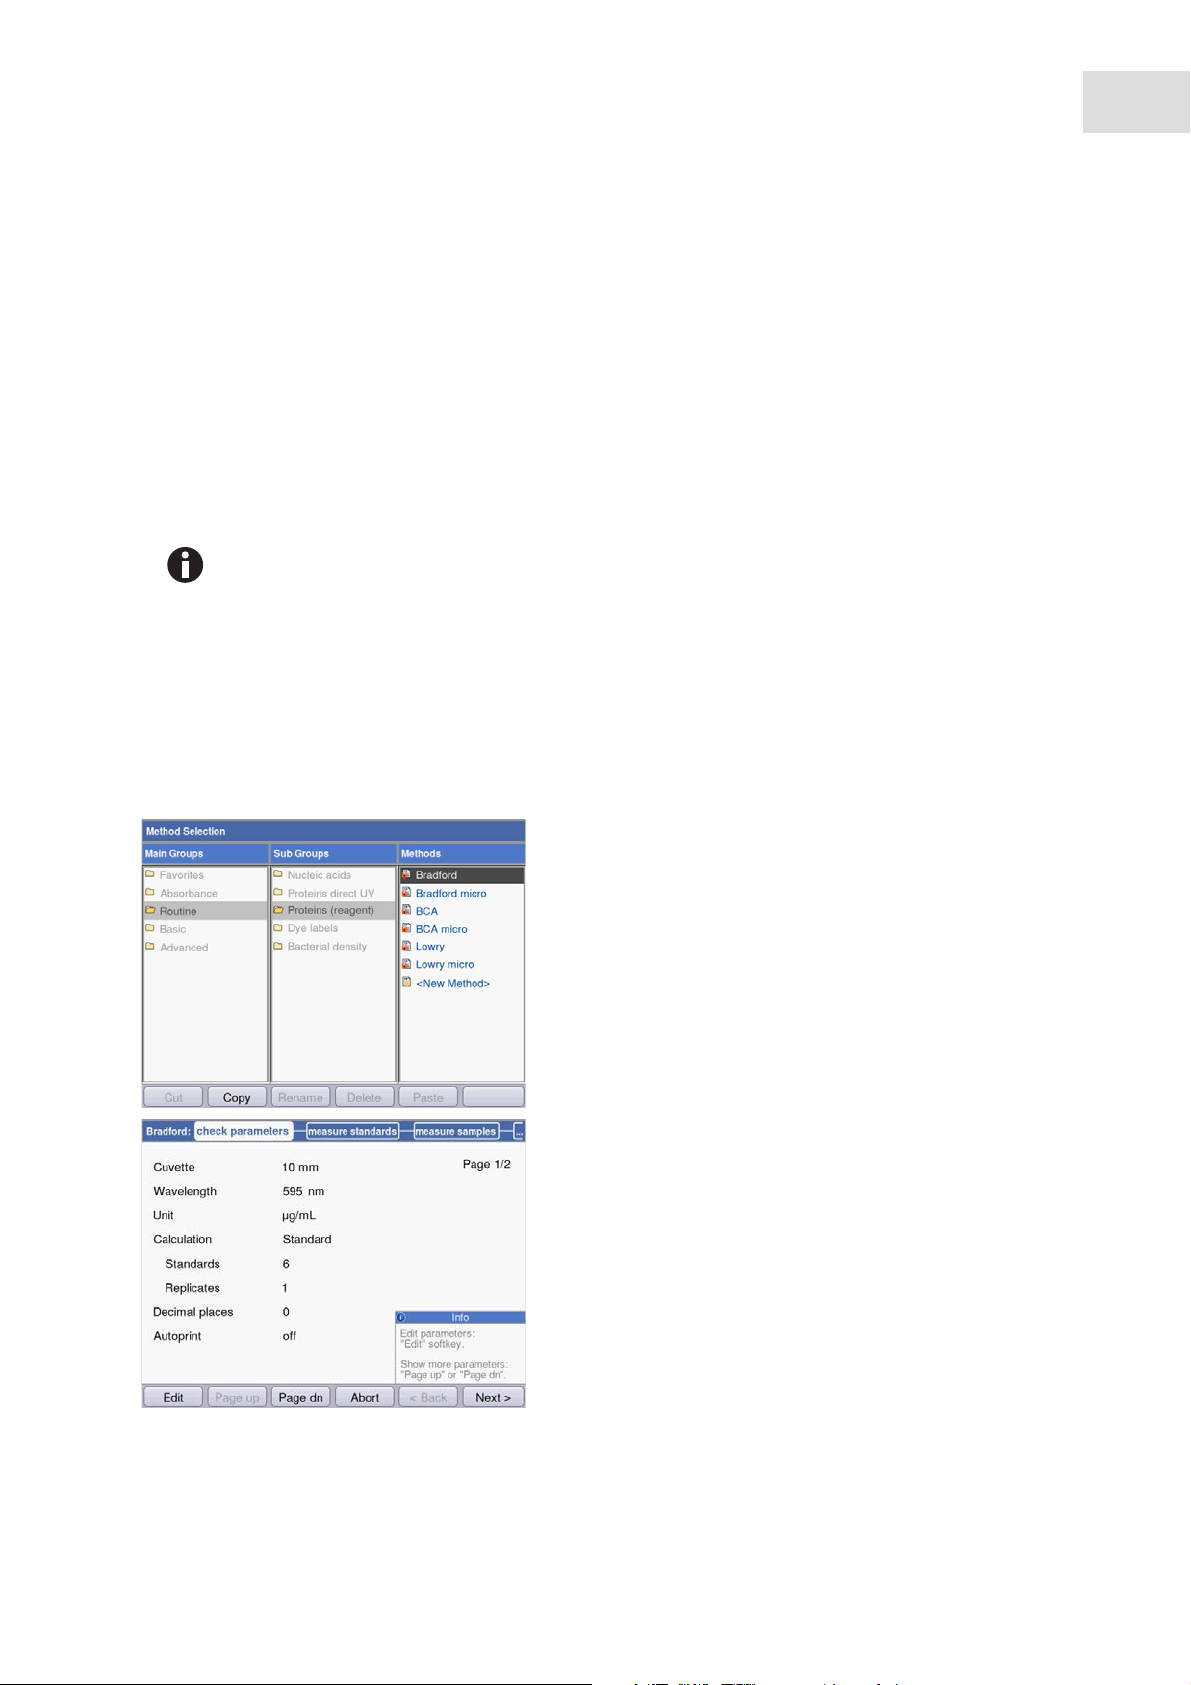
6.1 Selecting a method
Methods and method templates are delivered preprogrammed. The methods are organized in main groups
and subgroups.
31
Write-protected methods The most important methods in molecular biology.
Parameters can be modified, but the modified parameters
must be saved under a new method name.
Non-write-protected methods You can change parameters any number of times and start
the measurement right after saving.
New methods ("templates") Each method group contains a template which is
preprogrammed with complete parameter sets to facilitate
the programming of new methods. The parameters can be
changed and saved under new names any number of times.
To call a method, first use the cursor keys to select the main group, subgroup and the method.
Confirm each with enter.
Tab. 6-1: Photometric methods
Absorbance Methods for fast, simple absorbance measurements without additional evaluations
Routine Frequently used molecular biology methods. The methods are preprogrammed.
However, the parameters can be modified if saved under a new name.
Basic Methods for the evaluation of absorbance measurements with factor, standard or
standard curve/line.
Advanced Methods for the evaluation of two wavelength measuring methods.
Favorites In Favorites, you can set up your own folders using <New folder>, and copy your
frequently used methods to this folder in order to quickly access them when needed.
You can create new methods in all folders using <New Method>.
In Favorites, you can create your own folders (e.g., to allocate folders to specific people), and rename and
delete the folders.
Page 32

32
Methods
Eppendorf BioSpectrometer
English (EN)
Tab. 6-2: Softkeys in method selection
[Cut] and [Paste] Cut and paste methods.
[Copy] and [Paste] Copy and paste methods.
[Delete] Delete methods.
[Rename] Rename methods.
Copied or cut methods can be added to a different folder under Favorites, or added to the original folder
under a new name. Use the cursor keys to navigate to the Methods column of the desired folder and press
[paste] for adding the method.
®
basic
6.2 Photometry method description
The preprogrammed methods and method templates are described in this section.
6.2.1 Absorbance method group
Single λ
• Absorbance measurement on a wavelength.
• No subsequent evaluation.
Multi λ
• Absorbance measurement at two to six wavelengths.
• No subsequent evaluation.
Scan
• Absorbance wavelength spectra measurement via a defined wavelength range.
• Display of wavelength and absorbance in the spectrum by navigation with a wavelength cursor.
• The spectra section can be modified using 3 different zoom variants.
• Peak detection possible.
Page 33

Methods
Eppendorf BioSpectrometer
®
basic
English (EN)
6.2.2 Routine method group
The methods for the Routine group are preprogrammed as fixed methods. Therefore, a new method name
is required after the method parameters in the fixed preprogrammed methods have been modified.
Nucleic acids
• Determination of the concentration of nucleic acids through measurement at 260 nm and evaluation via
factor.
• Various nucleic acid methods, such as dsDNA or RNA, are preprogrammed. The parameters vary
according to the factor.
• Preprogrammed method for microliter cuvettes: Measuring DNA in sample volumes within the
microliter range with 1 mm light path (with microliter cuvettes as Eppendorf μCuvette G1.0 or Hellma
TrayCell).
• Additional information on the purity of the measured nucleic acid: Ratios A260/A280, ratios A260/A230,
absorbance wavelength spectrum of nucleic acid, absorbance of the background wavelength (preset:
320 nm; the absorbance of the pure nucleic acid should be close to zero here).
• Partial turbidity correction can be performed via the Background parameter.
• Concentrations can be converted to molar concentrations and (after the sample volume has been
entered) to nucleic acid quantities (process results method step).
®
33
Proteins direct UV
• Determination of the concentration of proteins via measurement at 280 nm and factor or standard
evaluation.
• Preprogrammed methods for direct absorbance output as a result (Protein A 280) and for evaluation via
albumin-specific absorbance coefficients (Albumin A 280).
• Preprogrammed method for microliter cuvettes: Measuring protein in sample volumes in the microliter
®
range with 1 mm light path (with microliter cuvettes as Eppendorf μCuvette G1.0 or Hellma
TrayCell).
• Additional information on the purity of the measured protein: Absorbance of the background
wavelength (preset: 320 nm; the absorbance of the pure protein should be close to zero here).
• Partial turbidity correction can be performed via the Background parameter.
• When programming the methods, the corresponding factor is imported through the simple selection of
the protein from a predefined list. The factors are separately defined in the functions of the Gen.
method param. group. Various proteins are preprogrammed in Gen. method param.; additional
proteins can be added.
Proteins (with reagent)
• Concentration determination of proteins via measurement according to color reactions and evaluation
using standards or factors (typical: evaluation with standard curve).
• The Bradford, Bradford micro, Lowry, Lowry micro, BCA and BCA micro methods are already
preprogrammed. According to the reagent manufacturer, the "Curve fit" (standard curve type) must be
changed as necessary.
Page 34

34
Methods
Eppendorf BioSpectrometer
®
basic
English (EN)
Dye labels
• For dye-labeled biomolecules: Concentration determination of the biomolecule (nucleic acid or protein)
via measurement at 260 or 280 nm and measurement of the dye in one measuring procedure.
• Evaluation with factor. In addition to the biomolecule, up to two dyes can be measured at the same time
as two different wavelengths.
• Additional: evaluation of the frequency of incorporation (FOI) of the dye. Selection between two
different FOI calculation procedures.
• Already preprogrammed methods: ssDNA, labeled with Cy 3 or Cy 5.
• Correction of the influence of the dye spectrum on the accuracy of the biomolecule measurement is
possible.
• Partial turbidity correction can be performed via the Background parameter.
• Additional information on the purity of the measured materials: Ratios A260/A280 and ratios A260/A230
(ratio values only for nucleic acids), absorbance wavelength spectrum.
• When the methods are programmed, various associated parameters, such as wavelengths and
evaluation factors, are imported by simply selecting the biomolecule and the dye from predetermined
lists. These parameters are separately defined in the functions of the Gen. method param. group.
Various nucleic acids, proteins and dyes are preprogrammed in Gen. method param.. You may add
further nucleic acids, proteins and dyes.
• Only for labeled nucleic acids: Concentrations can be converted to molar concentrations and (after the
sample volume has been entered) to nucleic acid and dye quantities (process results method step).
Bacterial density
• Turbidity measurement to determine the bacteria density.
• Measurement at 600 nm is already preprogrammed.
• Additional information: absorbance wavelength spectrum.
6.2.3 Basic method group
Factor, standard
• Measurement on a wavelength and factor or standard evaluation.
• Methods for factor and standard evaluation are preprogrammed.
Calibration curve
• Measurement on a wavelength and subsequent evaluation with a series of 2 to 12 standards.
• You can select between different evaluation procedures ("Curve fit") as linear regression, non-linear
regression.
• Graphical and tabular display of the standard results.
• The last saved standard evaluation can be used.
• A method for standard curve evaluation is preprogrammed.
Page 35

Methods
Eppendorf BioSpectrometer
®
basic
English (EN)
6.2.4 Advanced method group
Dual wavelength
• Measurement at two wavelengths and evaluation of the measured absorbance values via two basic
formulas (subtraction, division)
• Variants of the basic formulas can be defined.
• The result can be evaluated with a factor, with a standard or with a standard series.
• Methods are preprogrammed for calculation, subtraction and division, and subsequent factor
evaluation.
6.3 Method parameters
This chapter illustrates the parameters for programming the methods. The order of the parameters in the
device display may slightly differ from the order in the table in order to display the parameters more clearly.
The table displays all parameters available for the various methods. Only a small portion of these
parameters are required for the corresponding method and will be shown in the display.
35
Parameter Entry Explanation
Cuvette Selection:
10 | 5 | 2 | 1 | 0.5 | 0.2 |
0.1 mm
No. of
wavelengths
Wavelength Value input:
Value input:
Range: 2 to 6.
Measurement
wavelength in nm.
Range: 200 to 830 nm.
Optical path length of the cuvette. The device always
automatically converts absorbance values to the 10 mm path
length of a standard cuvette (see Absorbance values on p. 89).
Therefore, there is no need to change factors such as "50" for
the calculation of dsDNA concentrations when modifying the
Cuvette parameter.
Only for the Multi λ method group.
Number of wavelengths at which the measurement is to be
performed.
Measurement wavelength: The concentration is calculated
based on the absorbance measured with this wavelength.
For the Multi λ and Dual wavelength method groups, enter
more than one wavelength. For some method groups (e.g.,
Nucleic acids and Proteins direct UV), the wavelengths are
preprogrammed.
For the Dye labels method group the measuring wavelengths
are not entered into the method procedure one by one. They are
automatically imported simply by selecting the biomolecule and
dye from the General Method Parameters function.
Page 36

36
Methods
Eppendorf BioSpectrometer
®
basic
English (EN)
Parameter Entry Explanation
Unit Selection:
mg/mL | μg/mL | ng/
mL | pg/mL | μg/μL |
Unit for the concentration result.
In the preprogrammed methods of the Routine group, the
selection is restricted to units that are useful for these methods.
mg/dL | μmol/mL |
nmol/mL | pmol/mL |
pmol/μL | U | U/mL |
U/L | % | Abs | A/min
In addition, further
units are freely
programmable in the
General Method
Parameters/Units
function. Max. 7 digits.
Formula type Selection:
division | subtraction
Only for the Dual wavelength method group.
Formula type for calculating the absorbances at the two
measurement wavelengths prior to evaluation with factor or
standard.
Formula: a Value input:
Value for a in the
evaluation formula.
Only for the Dual wavelength method group.
Value for a in the formulas: [(a*A1) / (b*A2)] * c + d and [(a*A1) -
(b*A2)] * c + d.
Limit: max. of 5 digits
including decimal
point.
Formula: b Value input:
Value for b in the
evaluation formula.
Only for the Dual wavelength method group.
Value for b in the formulas: [(a*A1) / (b*A2)] * c + d and [(a*A1) -
(b*A2)] * c + d.
Limit: max. of 5 digits
including decimal
point.
Formula: c Value input:
Value for c in the
evaluation formula.
Only for the Dual wavelength method group.
Value for c in the formulas: [(a*A1) / (b*A2)] * c + d and [(a*A1) -
(b*A2)] * c + d.
Limit: max. of 5 digits
including decimal
point.
Formula: d Value input:
Value for d in the
evaluation formula.
Only for the Dual wavelength method group.
Value for d in the formulas: [(a*A1) / (b*A2)] * c + d and [(a*A1) -
(b*A2)] * c + d.
Limit: max. of 5 digits
including decimal
point.
Calculation Selection:
factor | standard
Evaluation procedure for the calculation of the sample
concentration from the measured absorbance.
Page 37

Parameter Entry Explanation
Factor Value input:
Factor.
Limit: max. of 6 digits
including decimal
point.
Factor for converting absorbance values into the concentration.
Negative factors can also be entered for the following method
groups: Dual wavelength, Factor.
For the Dye labels method group the factors are not entered
into the method procedure individually. They are automatically
imported simply by selecting the biomolecule and dye from the
General Method Parameters function.
Protein Selection:
List of protein types
which are stored in the
General Method
Only for the Dye labels and Proteins direct UV method groups.
When selecting the protein, the corresponding Factor
parameter programmed in the General Method Parameters/
Proteins function also will be imported from that function.
Parameters/Proteins
function.
Standards Value input:
Number of standards.
Range: 1 to 12.
Number of different standard concentrations for the evaluation
with standards.
For some methods the range for the number of standards is
restricted to a smaller range than 1 to 12.
Replicates Value input:
Number of replicates
Number of repeated measurements for the various standard
concentrations.
per standard.
Range: 1 to 3.
Std. conc. Value input:
Concentration values
Based on the number of standards, this parameter is available
for all standards (e.g.,: std. conc. 1, std. conc. 2, ...).
of the standards.
Limit: max. of 6 digits
including decimal
point.
Decimal places Value input:
Number of decimal
Number of decimal points for the calculated concentration
result.
points for the result.
Range: 0 to 3.
Dye 1 Selection:
List of dyes that are
stored in the General
Method Parameters/
Dyes function.
Only for the Dye labels method group.
When the dye is selected, the parameters programmed in the
General Method Parameters/Dyes function, which correspond
to the dye, are also imported: factor, wavelength and, if
necessary, correction factors for the measurement at 260 or
280 nm (see the description of the following parameter).
Methods
Eppendorf BioSpectrometer
English (EN)
®
basic
37
Page 38

38
Methods
Eppendorf BioSpectrometer
®
basic
English (EN)
Parameter Entry Explanation
Correct A260 1 Selection:
on | off
Only for the Dye labels method group.
Correction of the influence of the dye spectrum on the
absorbance with the measuring wavelength of the biomolecule
(260 nm or 280 nm). Some of the dye spectra have a low
absorbance at 260 and 280 nm. These absorbances distort the
calculations for the nucleic acids or the proteins of these
methods. To minimize the distortion correction factors are used,
as long as these are known for the corresponding dyes. When
the parameter is switched on, the correction factor is imported
from the General Method Parameters/Dyes function.
Correct A 280 1 Selection:
on | off
Only for the Dye labels method group.
For an explanation see the description of the Correct A260 1
parameter above.
Dye 2 active Selection:
on | off
Only for the Dye labels method group.
Option to measure a second dye at the same time. Application:
Labeling a biomolecule with two dyes.
Dye 2 Selection:
List of dyes that are
Only for the Dye labels method group when measuring 2 dyes.
Selection of the second dye (see Dye 1 parameter).
stored in the General
Method Parameters/
Dyes function.
Correct A260 2 Selection:
on | off
Correct A280 2 Selection:
on | off
Show scan Selection:
on | off
Start λ Value input:
Only for the Dye labels method group when measuring 2 dyes.
Analog to parameter Correct A260 1.
Only for the Dye labels method group when measuring 2 dyes.
Analog to parameter Correct A280 1.
Display of a scan (absorbance wavelength graph) in addition to
the result of the sample measurement.
Starting wavelength for recording the scan.
Wavelength in nm.
Range: 200 to 830 nm.
Stop λ Value input:
Stopping wavelength for recording the scan.
Wavelength in nm.
Range: 200 to 830 nm.
Value must be higher
than the value for Start
λ.
A260/A280 Selection:
on | off
Only for nucleic acids.
Display of the A260/A280 ratio in addition to the result of the
sample measurement.
A260/A230 Selection:
on | off
Only for nucleic acids.
Display of the A260/A230 ratio in addition to the result of the
sample measurement.
Page 39

Parameter Entry Explanation
FOI Selection:
none | dye/kb | pmole/
μg
Only for the Dye labels method group.
Display of the FOI in addition to the result of the sample
measurement.
The FOI (frequency of incorporation) is a measure for the
number of dye molecules per nucleic acid molecule that are
integrated into the nucleic acid. Units are "dye/kb" (dye
molecules per 1000 bases) or "pmole/μg" (pmol dye per μg
nucleic acid). "None": no FOI calculation.
Background Selection:
on | off
Prior to the calculation of the results of a sample the absorbance
of a background wavelength, during which the analyte to be
measured should exhibit the absorbance value zero, is
subtracted from the absorbance of the measuring wavelength.
Frequent application: Partial correction of turbidity for
measurement of nucleic acids (background wavelength in this
case: 320 nm or 340 nm).
Wavelength Wavelength in nm.
Range: 200 to 830 nm.
Wavelength at which the background is to be measured. The
analyte to be measured should have the absorbance value zero
in pure form here.
Background for
dyes
Selection:
on | off
Only for the Dye labels method group.
Application of the background correction to the measurement of
a dye (see Background parameter).
Wavelength Wavelength in nm.
Range: 200 to 830 nm.
Only for the Dye labels method group.
Wavelength at which the background for the dye is to be
measured. The pure, not contaminated dye to be measured
should have the absorbance value zero for this wavelength.
Autoprint Selection:
on | off
Printing a measuring result immediately following measurement
with the thermal printer.
Only the main result data will be printed. To output detailed
data, the required data packets can be compiled and printed in
the print & export method step at the end of a measuring
series.
Methods
Eppendorf BioSpectrometer
English (EN)
®
basic
39
Page 40

40
Methods
Eppendorf BioSpectrometer
English (EN)
®
basic
6.4 Method procedure
Wizard: the wizard at the top of the display will take
you through the method procedure. The currently
active method step is highlighted.
A method procedure is composed of a maximum of 5 steps. The currently active step is highlighted visually.
After the last step, print & export, of a measuring series, the start of a new measuring series is offered as a
next step. It once again starts with the sample measurement.
Method step Explanation
Check parameters Check method parameters. Carry out changes if required.
Measure standards Only for methods with standard evaluation:
Measure and evaluate standards. Alternatively, the last saved standard
evaluation can be used.
Measure samples Measuring samples
Process results Only for some methods: postprocess results, e.g. zoom scan graphs.
Print & export Assemble data packets for printing or exporting the data.
Use the [Next >] and [< Back] softkeys to navigate between method steps. With [Abort] and [Finish] you can
cancel or finish the measuring procedure. The name of this softkey changes from [Abort] to [Finish] after
the first sample measurement.
Page 41

6.4.1 Check parameters
Methods
Eppendorf BioSpectrometer
®
basic
41
English (EN)
Softkeys
• [Page dn] and [Page up]: Change between 1 to 3
parameter list pages.
• [Edit]: Switch to the parameter edit mode.
Editing mode for parameters:
Modified parameters are marked with a red star until
the modification has been saved.
Softkeys
• [Save] and [Save as]: Save changes. When using
[Save as] you have to rename the method. This is
always the case when modifying the methods
preprogrammed by Eppendorf in the Routine
group.
• [Cancel]: Exit the edit mode without saving
changes.
Saving the method under a new name:
You can save the method in the same folder from
which you called up the method or in any folder in
the Favorites method group.
The name (maximum 20 letters) can be entered
using a displayed keyboard ([Keyboard] softkey) or
directly using the keyboard (see Entering text on
p. 23).
After saving you will return to the check parameters
display.
Page 42

42
Methods
Eppendorf BioSpectrometer
®
basic
English (EN)
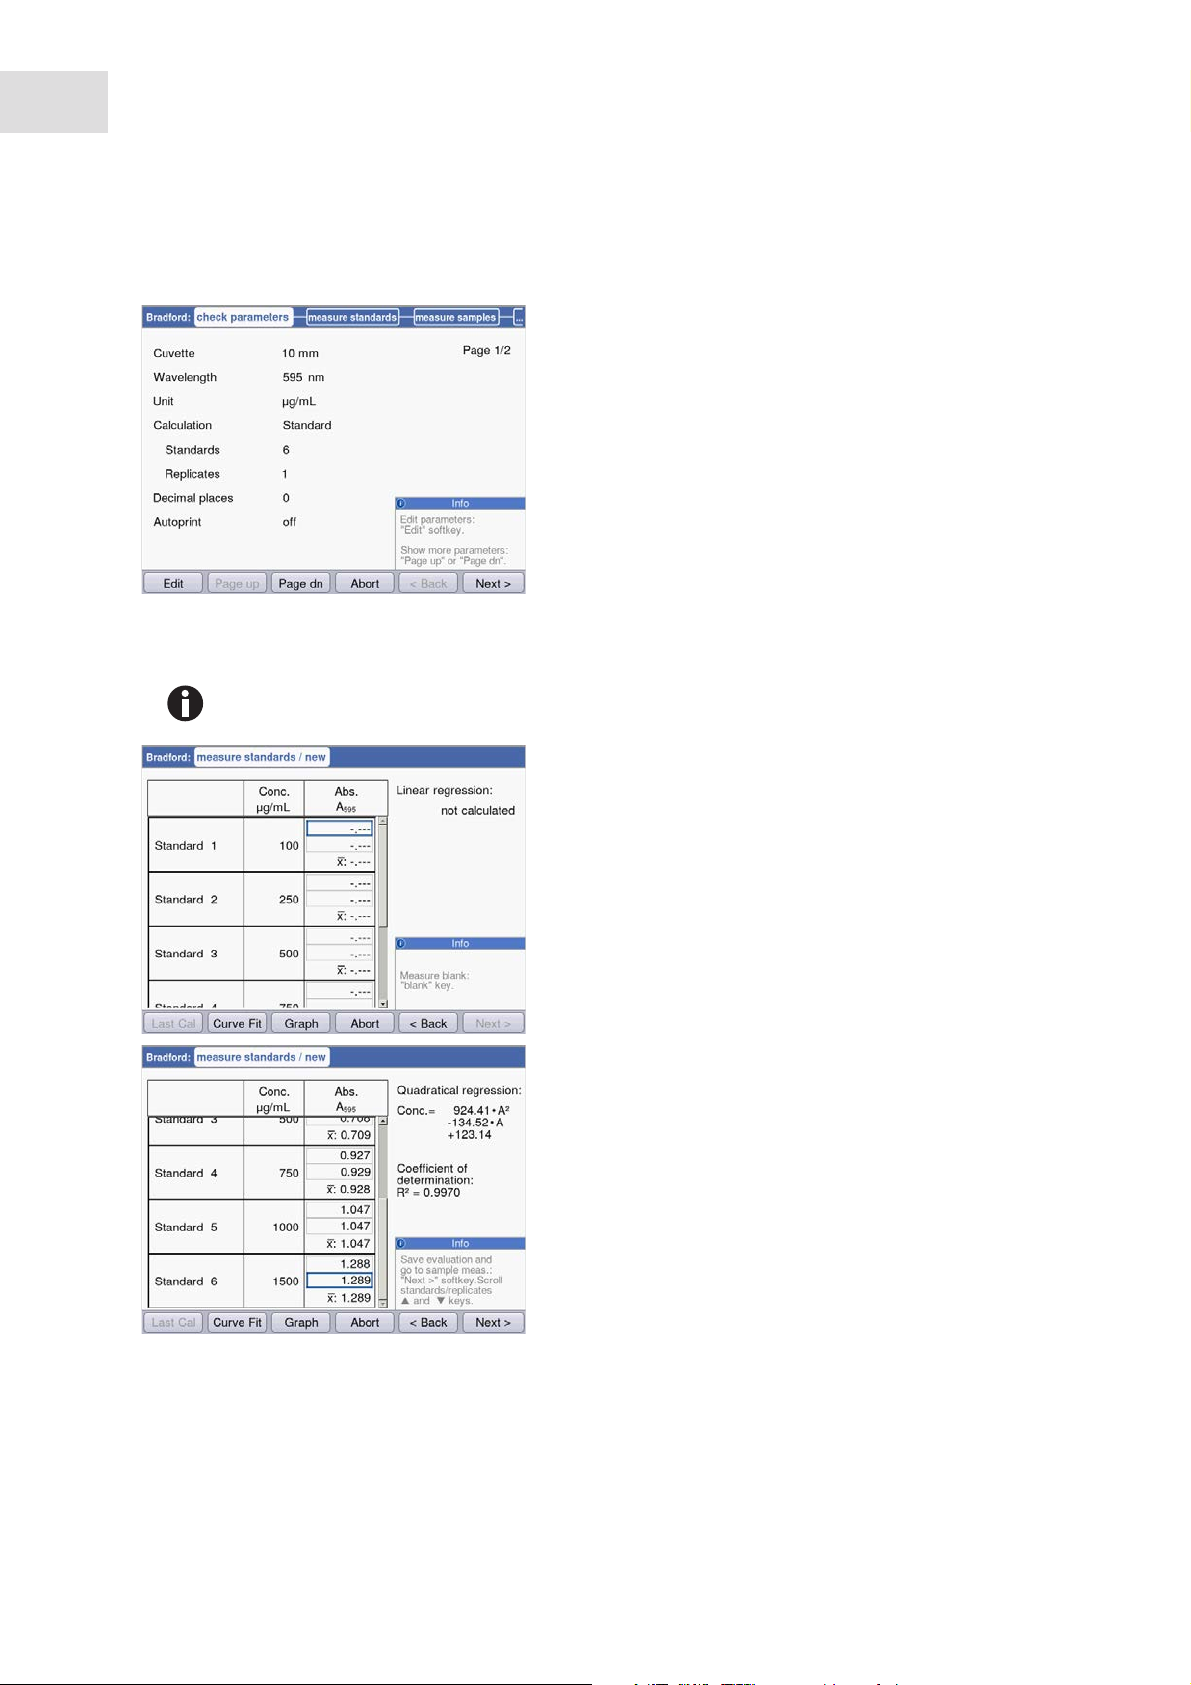
6.4.2 Measure standards
The first standard to be measured is marked on the
display. After the blank value (blank key) measure all
standards (standard key) one by one.
When measuring more than one replicate per
standard, the average value for each standard is
calculated and displayed automatically.
By using the and cursor keys, you also can
select certain standards for measurement. Individual
standards can be remeasured as well.
Softkeys
• [Last cal]: Call up the last saved standard evaluation for this method in order to use it for sample
measurements.
• [Curve fit]: Select the procedure for the standard evaluation. If the result has not been saved, the
method can also be entered later. Instructions for selecting the evaluation procedure can be found in
the Evaluation procedure chapter (see Evaluation with standard curve/line on p. 91).
• [Graph]: Switch to the graphic display of the standard results.
As soon as the minimum number of results for the
evaluation with the selected method (curve fit) is
available, the evaluation result will be shown on the
right side of the display. You can now save the
evaluation and switch to sample measurements via
the [Next >] key.
Graphical view of the standard evaluation.
With the and cursor keys, you navigate between
the standards to view the results. With more than one
replicate per standard, you can switch between the
replicate results using and . You can also select
individual standards from the graphical display and
measure or remeasure them.
Softkeys
• [Table]: Switch to the table display of the standard results.
• [Next >]: Save the standard evaluation and switch to the sample measurement.
Page 43

Methods
Eppendorf BioSpectrometer
®
basic
English (EN)
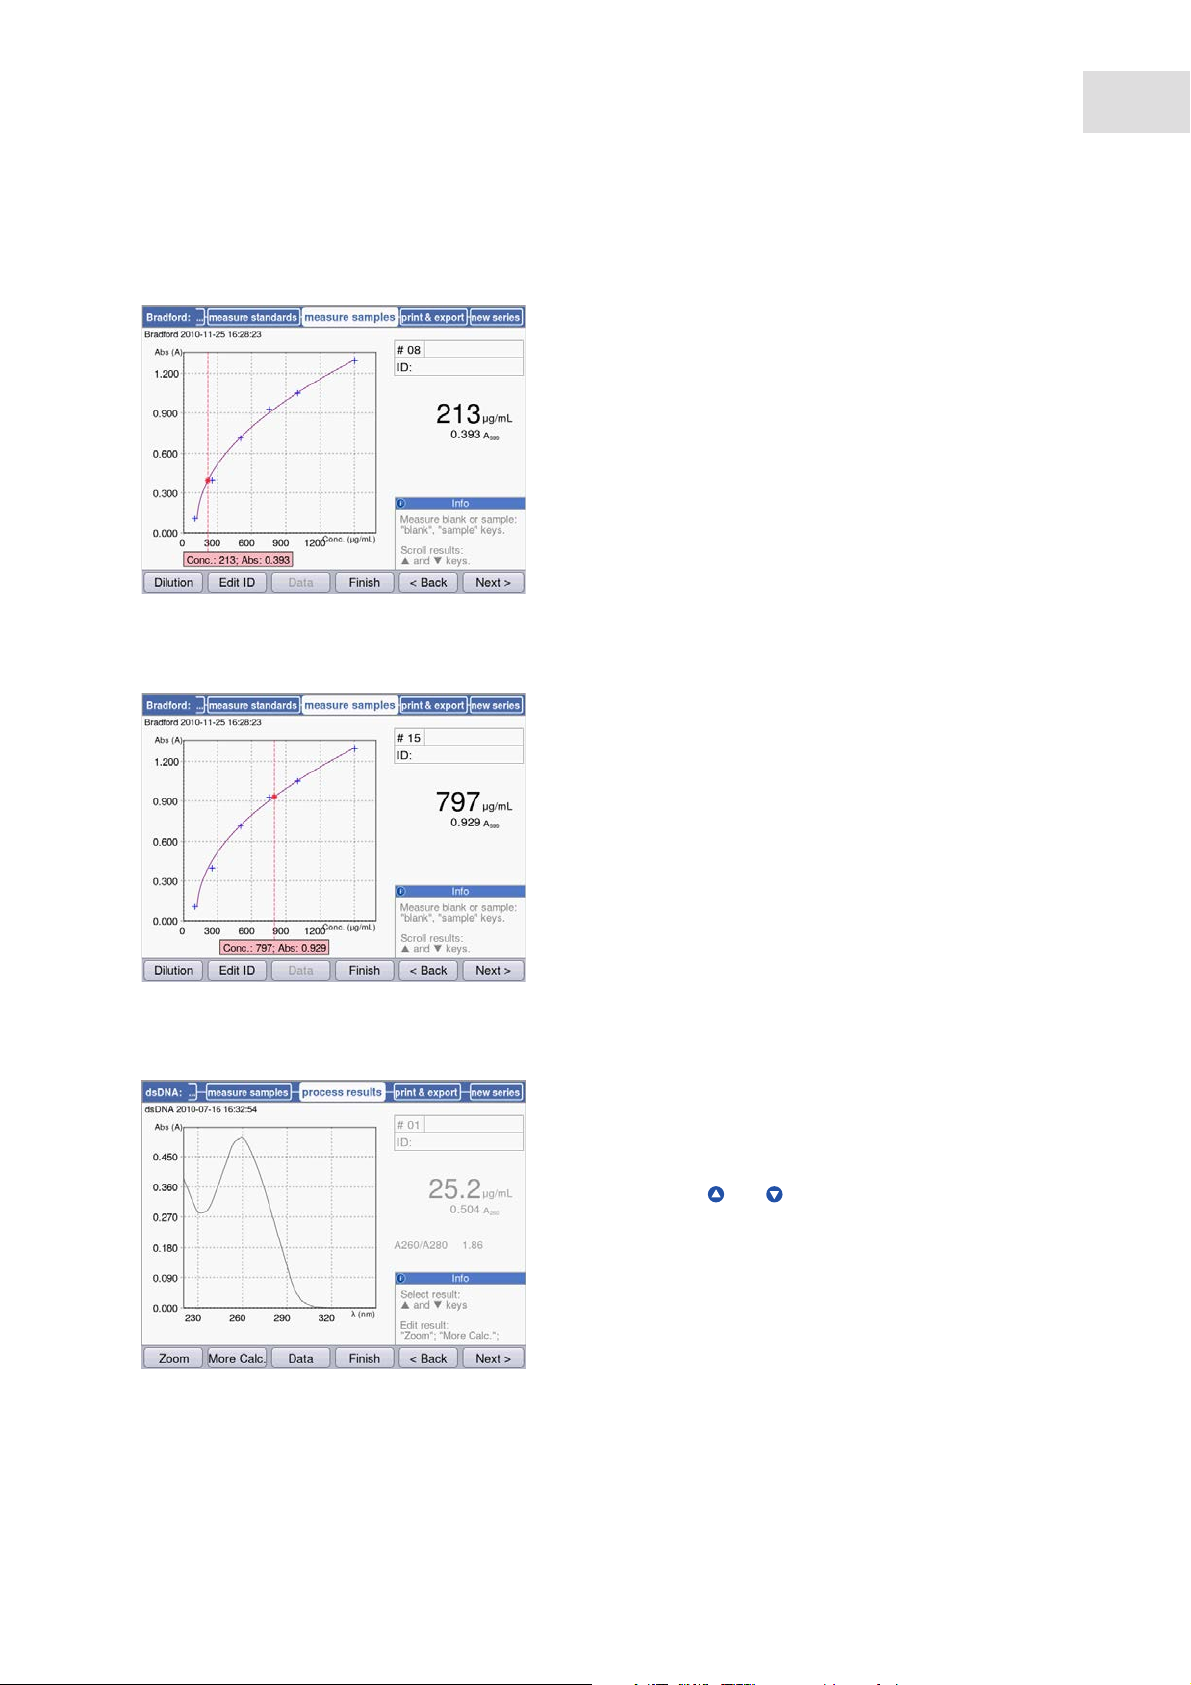
6.4.3 Measure samples
The sample key is used for measuring your samples consecutively. Blank results remain saved for one
measuring series, but a new blank result measurement can be performed at any time. With the and
keys you can navigate between the sample results that have been achieved in the measuring series up to
this point.
Results display:
• The concentration result (6 digits with floating
point) is clearly emphasized.
• With graphic: Result to the right of the display.
• Without graphic: Result in the middle of the
display.
• In addition to the result, the basic absorbance
value is shown at a smaller scale.
43
Additional data
• Upper right; first row:
Sample number: Counted sequentially and reset to "1" for each new series of measurements.
Sample dilution (if provided)
• Upper right; second row:
Sample identification (ID) (if provided)
• Top left:
File name with which the data in the print and export method step can be exported as Excel file (see
p. 55).
Softkeys
• [Dilution]: Enter sample dilution.
• [Edit ID]: Enter sample ID
• [Data]: Display additional result data (not available with all methods).
• [Finish]: End series of measurements and return to method selection.
The displayed absorbance values always correspond to the directly measured values. The
dilution or cuvette factor as well as background absorbances will be incorporated for the
following result calculation (see Absorbance values on p. 89).
Page 44
44
Methods
Eppendorf BioSpectrometer
®
basic
English (EN)
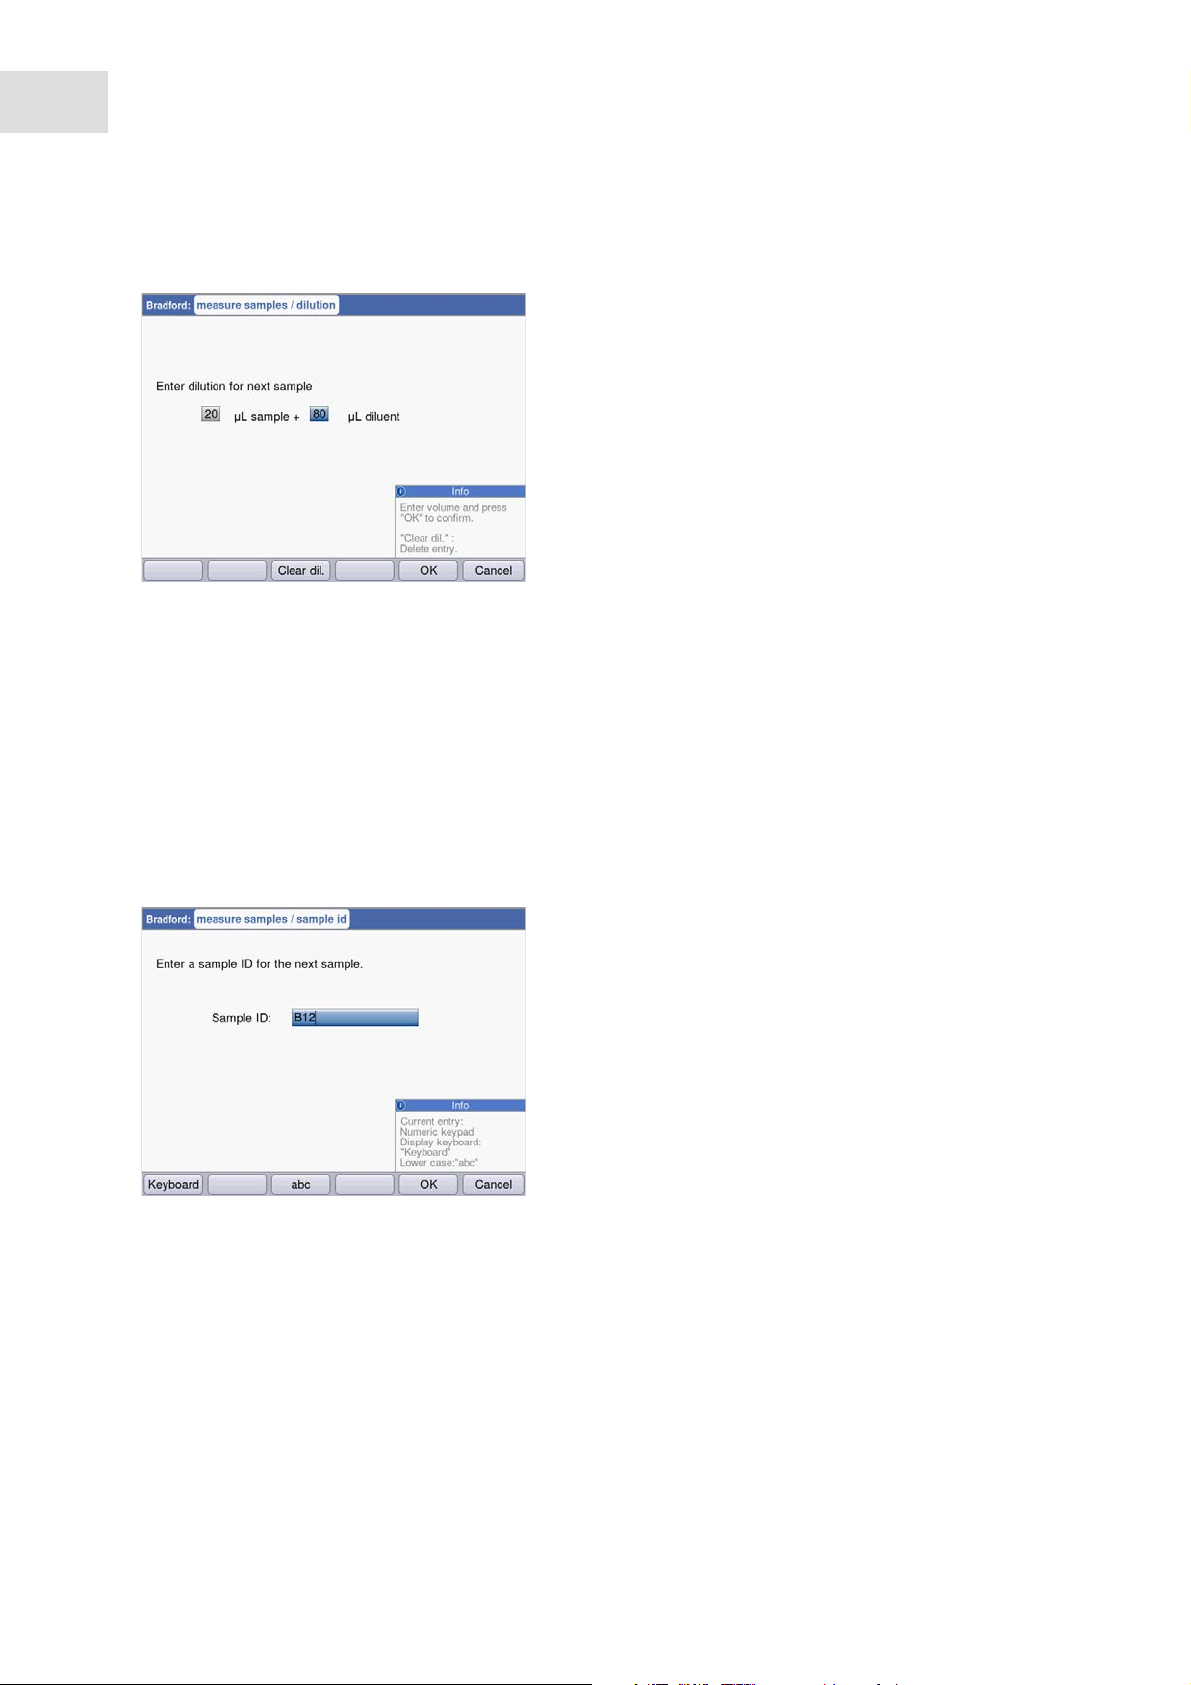
Enter dilution
The [Dilution] softkey is activated after the blank
(blank key) has been measured.
1. Press the [Dilution] softkey.
2. Enter the volumes for the sample (up to 3 digits)
and for the dilution buffer (up to 4 digits).
The device will multiply the following sample results
by the calculated dilution factor.
Softkeys
• [Clear dil.]: Delete values for sample dilution.
• [OK]: Confirm sample dilution and return to sample measurement.
• [Cancel]: Cancel entry and return to sample measurement.
The dilution is used for all following sample results until it is changed by a new entry.
Enter sample ID
The ID will be applied to the following sample result. When an ID is being entered the last entered ID will
be displayed as a default template to allow the quick entry of IDs with a consecutive structure. A single ID
can only be assigned once for the same measuring series.
1. Press the [Edit ID] softkey.
2. Enter the sample ID (up to 12 digits).
Alternatives for character input:
• Keypad: If the key is pressed several times in a
row, the possible entries for this key will be
shown consecutively.
• Display keyboard with softkey [Keyboard]: Select
character with the cursor keys and confirm with
enter.
Softkeys
• [Keyboard]: Display keyboard.
• [abc]: Change between upper and lower case letters when making entries with the keypad.
• [OK]: Confirm ID entry and return to sample measurement.
• [Cancel]: Cancel entry and return to sample measurement.
Page 45

Result image with dilution and ID
6.4.4 Measure samples: Results displays
Eppendorf BioSpectrometer
Result image with dilution and sample ID
Methods
®
basic
English (EN)
45
This section contains a display of typical results displays for all method groups and an overview of
additional results data, which can be accessed using the [Data] softkey.
Method group Results display Explanation
Absorbance main group
Single λ Results display:
• Absorbance at the measuring
wavelength
• Only for dilution or with cuvettes
other than 10 mm: additional
display of the absorbance value
before the conversion.
Multi λ Results display:
• Absorbance values at the
wavelengths
Additional data ([Data] softkey):
• Only for dilution or with cuvettes
other than 10 mm: absorbance
value before the conversion.
Page 46

46
Methods
Eppendorf BioSpectrometer
®
basic
English (EN)
Method group Results display Explanation
Scan Results display:
• Scan (graph with absorbance
wavelength display)
• Navigate between the measuring
points in the graph with and .
Routine main group
Nucleic acids Results display:
• Concentration result with
absorbance at the measuring
wavelength
• If activated in the parameters:
Ratios A260/A280
• If activated in the parameters:
Scan.
Navigate between the measuring
points on the graph which are used
for the result calculation with
and .
Additional data ([Data] softkey):.
If the corresponding parameters have
been activated:
• Absorbance value for 280 nm.
• Ratios A260/A230 and absorbance
value for 230 nm.
• Absorbance value for the
background wavelength.
Page 47

Eppendorf BioSpectrometer
Method group Results display Explanation
Proteins direct
UV
Results display:
• Concentration result with
absorbance at the measuring
wavelength
• If activated in the parameters:
Scan.
Navigate between the measuring
points on the graph which are used
for the result calculation with
and .
Additional data ([Data] softkey):.
If the corresponding parameters have
been activated:
• Absorbance value for 260 nm.
• Absorbance value for the
background wavelength.
Proteins (with
reagent)
Results display:
• Concentration result with
absorbance at the measuring
wavelength.
• For evaluation with standard
series: graph of the standard
evaluation with plotted sample
result.
Methods
®
basic
English (EN)
47
Page 48

48
Methods
Eppendorf BioSpectrometer
®
basic
English (EN)
Method group Results display Explanation
Dye labels Results display:
• Concentration results with
absorbance at the measuring
wavelength of the biomolecule.
• If activated in the parameters:
Scan.
Navigate between the measuring
points in the graph with and .
Additional data ([Data] softkey):.
If the corresponding parameters have
been activated:
• Ratios A260/A280 and A260/A230.
• Absorbance values for 280 nm and
230 nm and for the measuring
wavelength of the dye.
• FOI value.
• Absorbance values for the
background wavelengths.
Ratios and FOI are not displayed for
the measurement of the dye-labeled
proteins.
Bacterial density Results display:
• Calculated result with absorbance
at the measuring wavelength.
• If activated in the parameters:
Scan.
Navigate between the measuring
points in the graph with and .
Basic main group
Factor, standard Analog to Protein direct UV (see above) Results display:
• Concentration result with
absorbance at the measuring
wavelength.
Calibration curve Analog to Proteins (with reagent) (see above) Results display:
• Concentration result with
absorbance at the measuring
wavelength.
• Graph of the standard evaluation
with plotted sample result.
Page 49

Eppendorf BioSpectrometer
Method group Results display Explanation
Advanced main group
Dual wavelength Results display:
• Concentration result: calculated
from A
calc.
evaluation.
• A
: calculated using the
calc.
formula, defined in the parameters,
created from the absorbances
measured on both wavelengths.
• Absorbance values that were
measured at the two measuring
wavelengths.
Additional data ([Data] softkey):.
If the corresponding parameters have
been activated:
• Absorbance value for the
background wavelength.
Methods
®
basic
English (EN)
with factor or standard
49
Page 50

50
Methods
Eppendorf BioSpectrometer
®
basic
English (EN)
6.4.5 Process results
The sample measurement is followed by two optional steps in the method sequence: process results and
print & export.
In the process results step, you can postprocess the results for some methods. Example: Changing the
spectra section of a scan.
As for the result display, you can navigate between the sample results of the measurement series with the
and cursor keys and select results for postprocessing.
Tab. 6-3: Options: Overview
Option Explanation Available in methods
Zoom Change the axis limit of the absorbance
wavelength graph to limit the view to
enlarged sections of the graph.
More calculations Convert concentration results into molar
concentrations and (after entering the
volume) into total amounts.
Peak detection Identifying peaks in absorbance wavelength
spectra.
Generally, all methods for which the
Scan parameter is offered and has
been activated.
• Multi λ
• Scan
• Nucleic acids
• Proteins direct UV
• Dye labels
• Bacterial density
• Dual wavelength
• Nucleic acids
• Dye labels (with nucleic acids as
biomolecule)
• Scan
Options for postprocessing are presented on the two
softkeys at left. In this example: [Zoom] and [More
Calculations].
Page 51

Methods
Eppendorf BioSpectrometer
®
basic
English (EN)
After changes have been made, you can exit the
current mode using the two softkeys at right:
• [Save]: Save changes and return to the process
results method step.
• [Cancel]: Cancel and return to the process results
method step.
After the changes have been saved you can apply
them to all samples of the measuring series with
[Yes].
51
Page 52

52
Methods
Eppendorf BioSpectrometer
®
basic
English (EN)
6.4.6 Process results: Options
Zoom
Press the [Zoom] softkey and select one of the following versions.
Variant [spectra]:
• Cursor keys and : Move the wavelength
cursor. It determines the zoom center above the
x-axis.
• Cursor keys and : Gradually zoom in and out
of the displayed section of the x-axis using the
SpectraZoom procedure.
The shown section of the y-axis is automatically
adjusted with each step so that maximum and
minimum of the data to be displayed make
optimum use of the section.
Variant [spectra-0]:
Same as the [spectra] variant, with one exception:
The lower limit of the displayed section of the y-axis
always equals "0 A".
Variant [free]:
User-defined values for interval limits can be entered
for both axes.
Navigation between the entry fields by means of the
cursor keys ( , , ).
For all 3 versions, the [reset zoom] softkey will bring you back to the original display of the spectrum.
Page 53

More calculations
Press the [More calc.] softkey.
Methods
Eppendorf BioSpectrometer
®
English (EN)
Nucleic acids method group:
• After the molar mass has been entered (in base/
base pairs or in kDa): Convert the concentration
result to the molar concentration.
• After the sample volume has been entered:
Calculate the total amount in the sample.
Dye labels method group:
Nucleic acid:
• After the molar mass has been entered (in base/
base pairs or in kDa): Convert the concentration
result to the molar concentration.
• After the sample volume has been entered:
Calculate the total amount in the sample.
basic
53
Dye:
• After entering the volume of the sample:
Calculate the total amount in the sample.
• For dsDNA the calculation of the molar concentration is based on the assumption of a
double-stranded nucleic acid. For the ssDNA, RNA and Oligo methods, a single-stranded
nucleic acid is assumed.
• For methods which have been reprogrammed via <New Method> in the Routine main
group, Nucleic acids method group, always double-stranded nucleic acids are assumed
for calculating the molar concentration.
Page 54

54
Methods
Eppendorf BioSpectrometer
®
basic
English (EN)
Peak detection
Press the [Peaks] softkey. For the peak detection you can alternate between two criteria:
• λ grid: Evaluation grid on the wavelength scale for the peak detection (e.g., 10 nm).
10 nm example: The spectra section from -5 nm to +5 nm is evaluated in relation to the peak to be
detected.
• Min. Δ Abs: Minimum difference between the peak to be detected and the lowest absorbance in the
evaluation grid. No absorbance value in the grid may be higher than the value of the peak at any given
time (e.g.: 0.5).
Examples:
λ grid: 100 nm, min. Δ Abs: 0.050:
The peak is not detected because the λ grid is too
large: The absorbance values on the left edge of the
grid are higher than the absorbance of the peak.
λ grid: 20 nm, min. Δ Abs: 0.200:
The peak is not detected because the predetermined
value for min. Δ abs is too high. The difference of the
absorbance of the peak and the lowest absorbance in
the grid is less than 0.2 A.
λ grid: 20 nm, min. Δ Abs: 0.050:
The peak is detected.
Page 55

Methods
Eppendorf BioSpectrometer
®
basic
English (EN)
6.4.7 Print & export
In the last optional method step, you can assemble data packets for all samples of a series of
measurements, or selected samples of a series of measurements, for printing to the printer, export to a USB
stick or export to a PC using a USB cable.
Select data packets
• Use the cursor keys for navigating and confirm
with enter.
Softkeys
• [Print]: Start printing.
• [Export]: Start export.
• [Sample]: Select individual sample results.
55
Select samples
• Press the [Samples] softkey to call up the sample
selection.
• Use the cursor keys for navigating and confirm
with enter.
Softkeys
• [Select all]: Select all samples
• [De-Sel. all]: Cancel selection.
Data export
The data will be transferred as Excel files (.xls) and can be read with Excel versions Excel 97 and later. For
each of the selected data packets, a worksheet is created in Excel. The file name consists of the method
name, the time and the date of the measuring series.
Select export version
If no USB stick is connected, the first variant cannot
be selected.
Page 56

56
Methods
Eppendorf BioSpectrometer
®
basic
English (EN)
Export to USB stick
1. Connect a FAT 32-formatted USB stick to the USB port 4 (see Main illustration on p. 11).
2. Start with [Export] "export to an external storage medium".
Export to PC
Requirement for the PC operating system: Windows XP, SP2 or a higher version.
1. Connect the device to the PC by using the USB cable on the USB port 8 (see Main illustration on p. 11).
2. Prior to beginning a new export make sure that any data that has been exported previously has been
saved to the PC hard drive. Otherwise, the new export will overwrite the data.
3. Start with [Export] "export to PC".
4. The exported data packet will be displayed on your PC as a removable medium named "eppendorf".
Open the Excel file on this drive and save it to the hard drive.
Page 57

Methods
Eppendorf BioSpectrometer
®
English (EN)
Select data packets
Results Primary result data; cannot be selected because they are always transferred.
Data Additional results data that are displayed during the measurement using the
[Data] softkey.
Graph Absorbance-wavelength-spectrum.
Graph data The basic numeric data for the graph.
"export only": Only available for export, i.e., not for printing.
Parameters Method parameters
Standards/results Results data of the standard evaluation.
Standards/graph (Only for standard evaluations with several standards:) absorbance
concentration graph.
Based on the method and parameter setting, only the available data packets are presented.
basic
57
6.4.8 Finish the series of measurements
After the print & export method step has been finished, you can start a new series of measurements using
the selected method or select a new method.
Finish the series of measurements and start a new series of measurements
• [Next >] softkey: Call up new series method step
• [New] softkey: Call up measure samples method
step and start a new series of measurements.
Finish the series of measurements and select a new method
• [Finish] softkey: Close the series of measurements and call up the method selection.
Page 58

58
Methods
Eppendorf BioSpectrometer
English (EN)
®
basic
Page 59

Functions
Eppendorf BioSpectrometer
®
basic
English (EN)
7 Functions
7.1 Functions of the User main group
With the function key or the [Function] softkey, you reach a menu containing functions like device settings
or calling up saved results.
The functions are structured in 3 columns analog to the method selection. The functions in the User main
group are accessible to you. As for the method selection, you navigate with the cursor keys for selecting
first the desired subgroup and then the desired function in the right column. Press enter to open the
function.
59
[Info] softkey: call up the firmware version and serial number of the BioSpectrometer basic.
Tab. 7-1: Overview of the functions
Subgroup Explanation
Results memory Displays saved results.
The results can be accessed structured according to methods and
measuring series and can be printed and exported directly from the
memory.
General method parameters Parameters which are used for different methods in common are stored
centrally in the Functions area.
Here it is possible to edit (change or create anew) these parameters. In
the Check parameters method step, the comprehensive parameters can
be easily selected using drop-down menus.
• Proteins, nucleic acids, dyes include parameters that are directly
applied for methods of the Dye labels and Proteins direct UV groups.
• Units: Units for concentration results which can be used for many
methods.
Absorbance spectra library Absorbance wavelength spectra of important substances, e.g., DNA.
The spectra serve as information and can be used for comparison to a
spectrum of a sample result.
Device settings Editable device settings, e.g., language.
Device calibration • Option for checking the spectrophotometer; An Eppendorf filter set is
required for this.
Info Open Source Licenses and information on registered trademarks.
Page 60

60
Functions
Eppendorf BioSpectrometer
English (EN)
7.1.1 Results memory
®
basic
In the right column, select the method for which
you would like to call up saved results.
Confirm with enter.
Select the desired series of measurement with
the cursor keys.
Confirm with enter.
As in the method procedure, you can also
successively switch between the display of the
parameters, standards, sample results and, finally,
the data packets for print and export.
The assignment of the softkeys matches the
assignment in the method procedure.
Page 61

7.1.2 General method parameters
Functions
Eppendorf BioSpectrometer
®
basic
English (EN)
If you would like to print or export results,
select the data packets.
The procedure for print and export and the
meaning of the function keys corresponds to the
print & export method step.
In the right column, select the parameter group
for which you would like to edit parameters.
Confirm with enter.
61
Softkeys
• [Edit]: Edit selected parameter group.
• [New]: Create new parameter group.
• [Delete]: Delete selected parameter group.
• [OK]: Return to the function selection.
In this example, parameter groups are summarized
for various dyes (dye components for the dye
methods) and stored under a name. With this
name, the required parameter group can be
imported into the method program during the
editing of a dye method.
Display:
• Left: Name of the dye. Select via and .
• Right: corresponding parameters
Page 62

62
Functions
Eppendorf BioSpectrometer
®
basic
English (EN)
To edit a parameter group, use and to
select the parameter which you would like to
edit.
Confirm with enter.
Softkeys
• [OK]: Save entry and return to the parameter group selection.
• [Cancel]: Return to the parameter group selection without making any changes.
When programming a method of the Dye labels or Proteins direct UV method groups, you can access the
entries in General Method Parameter:
Select the name of the dye to import the
corresponding parameter group into the method
program. By using the "edit" selection of the
"Nucleic acid" parameter, you also can get directly
to the General Method Parameter function and
view and edit the parameters.
Page 63

Functions
Eppendorf BioSpectrometer
®
basic
English (EN)
Tab. 7-2: Parameter in General Method Parameter
Parameter Explanation
Proteins These parameters are loaded into the method parameters when a protein
is selected during the programming of a method in the Dye labels and
Proteins direct UV groups.
• Protein name
• Factor
•A
0.1%
In order to define a factor for calculating the concentration on the basis of
the absorbance, enter the following data in addition to the name and
wavelength:
Factor or A
or absorbance coefficient and molar mass.
0.1%
• Ext.coeff.
• Molecular mass
Nucleic acids These parameters are loaded into the method parameters when a nucleic
acid is selected during the programming of a method in the Dye labels
group.
• NA name
• Factor
• Double-stranded
The factor is used to calculate the concentration on the basis of the
absorbance.
The double-stranded parameter affects the calculation of the molar
nucleic acid concentration. (see Conversion to molar concentrations and
nucleic acid quantities on p. 94)
Dyes These parameters are loaded into the method parameters when a dye is
selected during the programming of a method in the Dye labels group.
• Dye name
• Wavelength
• Ext.coeff.
• Factor
• Corr. A260
• Corr. A280
In order to define a factor for calculating the concentration on the basis of
the absorbance, enter the following data in addition to the name:
Factor or absorbance coefficient.
The correction factors for the absorbance values at 260 or 280 nm are
used when the correction function in the method parameters is active. For
more details, refer to the chapter on evaluation (see Correction A
correction A
on p. 93).
280
260
and
Units You can select a unit from all available units when programming method
parameters.
• Unit Entering a unit that has not yet been programmed for the concentration
result.
63
• Specifications for proteins which are not preset at the factory can be determined in the
expasy database: http://www.expasy.org/tools/protparam.html.
• A table with A
Science (1995), 4: 2411–2423 (Table 5). The A
return the required A
values for many proteins can also be found in: C.N.Pace et al., Protein
1%
values must be multiplied by 0.1 to
1%
values.
0.1%
Page 64

64
Functions
Eppendorf BioSpectrometer
English (EN)
®
basic
7.1.3 Absorbance spectra library
In the right column, you select the spectrum which
you would like to call up and confirm with enter.
Softkeys
• [Export] and [Print]: Export to a USB stick or
print to a PC using a USB cable (see Print &
export on p. 55).
• [OK]: Return to the function selection.
7.1.4 Device settings
The following settings can be modified:
• Language: German, English, French, Spanish,
Italian.
• Date and time.
• Frequency of the automatic self test of the
device after switching on.
Softkeys
• [Save]: Save changes and return to the function
selection.
• [Cancel]: Return to the parameter group
selection without making any changes.
7.1.5 Device calibration
Information on checking the device is provided separately (see Checking the device on p. 69).
Page 65

7.1.6 Info
Functions
Eppendorf BioSpectrometer
English (EN)
The Copyright menu item contains license
information on the Open Source software.
®
basic
65
Page 66

66
Functions
Eppendorf BioSpectrometer
English (EN)
®
basic
Page 67

8 Maintenance
8.1 Cleaning
DANGER! Electric shock as a result of penetration of liquid.
Switch off the device and disconnect the power plug before starting cleaning or
disinfection work.
Do not allow any liquids to penetrate the inside of the housing.
Do not spray clean/spray disinfect the housing.
Only plug the device back in if it is completely dry, both inside and outside.
NOTICE! Corrosion from aggressive cleaning agents and disinfectants.
Do not use corrosive cleaning agents, aggressive solvents or abrasive polishes.
Do not incubate the accessories in aggressive cleaning agents or disinfectants for a longer
period of time.
Maintenance
Eppendorf BioSpectrometer
English (EN)
®
basic
67
1. Wipe down the surfaces with a cloth moistened with a mild cleaning agent.
Cleaning the cuvette shaft
2. The cuvette shaft may only be cleaned with a lint-free cotton swab that has been dampened with ethanol
or isopropanol. Prevent liquid from entering the cuvette shaft. If the shaft needed to be dampened with
water to remove contamination, follow this up by cleaning the shaft with a cotton swab dampened with
ethanol or isopropanol to accelerate the drying process.
Page 68

68
Maintenance
Eppendorf BioSpectrometer
English (EN)
®
basic
8.1.1 Cleaning the cuvette shaft cover
If you would like not only to clean the directly accessible surface of the cuvette shaft cover, you can remove
the cover.
Do not soak the cuvette shaft cover in cleaning agent.
Clean the cuvette shaft cover as described.
1. Lift the cuvette shaft cover with one hand.
2. With the other hand, hold the cover at the height
of the locking pin and pull the cover to the right
until the locking pin has been removed.
• Pull the cover to the right at a 90 degree angle.
3. Clean the cover with a cloth or lint-free cotton swab dampened with a mild cleaning agent.
4. Slide the locking pin back into the housing as far as it will go.
The locking pin has completely disappeared in the housing.
When the photometer is not being used, close the cuvette shaft using the blue cuvette shaft
cover to protect it from dust and other contamination.
Page 69

Maintenance
Eppendorf BioSpectrometer
®
basic
English (EN)
8.2 Disinfection/Decontamination
DANGER! Electric shock as a result of penetration of liquid.
Switch off the device and disconnect the power plug before starting cleaning or
disinfection work.
Do not allow any liquids to penetrate the inside of the housing.
Do not spray clean/spray disinfect the housing.
Only plug the device back in if it is completely dry, both inside and outside.
1. Clean the device with a mild cleaning agent before the disinfection (see Cleaning on p. 67).
2. Choose a disinfection method which corresponds to the legal regulations and guidelines in place for
your range of application.
3. For example use alcohol (ethanol, isopropanol) or other alcoholic disinfectants.
4. Wipe the surfaces with a cloth which you have moisturized with a disinfectant.
5. If the cuvette shaft cover needs to be removed for the disinfection, proceed as follows for the diassembly
and assembly (see Cleaning the cuvette shaft cover on p. 68).
6. You can use spray disinfection to disinfect the disassembled cuvette shaft cover.
69
8.3 Checking the device
Requirements
• Observe the ambient conditions (see Ambient conditions on p. 85).
• Carry out an inspection at approx. 20 °C. Avoid temperature variations (e.g, due to opened windows).
• The filter may only be removed from the filter box for a short period of time, and the filter surfaces must
be protected from contamination or damage.
• Protect the filter from dust, heat, liquids and aggressive vapors.
• The filter is inserted so that the label, with the name of the filter, points toward the detector.
When the spectrometer unit is checked: label points forward.
• The cuvette shaft is free from contamination.
8.3.1 Checking the spectrometer unit
Eppendorf offers a filter kit (BioSpectrometer reference filter kit) for checking the photometric accuracy
and wavelength systematic error. The kit contains one blank filter (A0) and three filters (A1, A2 and A3) for
checking the photometric accuracy, and 3 filters for checking the wavelength systematic error in the range
of 260 nm to 800 nm. The filter absorbances are measured against blank filter A0. In addition to
information on accuracy, you also obtain information on precision: average value and variation coefficient
(CV value) are calculated from the sets of 15 measurements per wavelength.
For the measurement, place the blank filters (for blank measurement) and sample filters into the cuvette
shaft, using the same procedure as with cuvettes. The absorbance values measured for the test filters will
be compared to the permitted range of values. For the individual filters, the limit values for the permitted
area are printed in a table in the lid of the filter box.
Please connect the Eppendorf thermal printer if you would like to document the values.
Page 70

70
Maintenance
Eppendorf BioSpectrometer
English (EN)
Abb. 8-1: Inside of the filter box lid (sample)
®
basic
Fig. 8-1: Inside of the filter box lid (sample)
Page 71

8.3.1.1 Checking photometric accuracy
Maintenance
Eppendorf BioSpectrometer
®
basic
English (EN)
1. Select the Spectrometer unit function in the
Device calibration group and confirm your
selection with enter.
2. Select whether you want to check the wavelength
systematic error or photometric accuracy, and
confirm with enter. Press [Next >] to switch to
the measurement.
71
3. Follow the instructions on the device display and
start by measuring the A0 blank filter, and then
the first test filter A1.
The device measures the test filter 15 times at 9
wavelengths, and then shows the average value
and the VC values for the series of measurements
for all 9 wavelengths.
Page 72

72
Maintenance
Eppendorf BioSpectrometer
English (EN)
®
basic
4. Results display after measuring a test filter for
testing photometric accuracy.
Measure the other two test filters A2 and A3.
5. Results display after measuring all 3 test filters
for testing the photometric accuracy.
With the and keys, you can view the results
for the different test filters again. Press [Finish] to
complete the test.
6. Compare the average values and CV values to the
supplied table.
If the measured values do not agree with the
permitted range of values, contact Eppendorf
Service.
Have the filter recertified by Eppendorf Service after 2 years.
8.3.1.2 Checking wavelength systematic error
To check the wavelength systematic error, proceed as follows: Measure the 3 test filters at the
corresponding wavelength.
Page 73

Maintenance
Eppendorf BioSpectrometer
®
basic
English (EN)
8.3.2 Device self-test
The frequency of the automatic self-test (approx. 1 minute) can be set using the Device settings function
(see Device settings on p. 64). The factory setting for Self-test interval is "Weekly".
The self-test checks the following:
• Verification of the detector
– Determination of the random error across the entire available spectrum
• Verification of the light source
– Verification of the maximum available energy of the light source and quality of the light transmission
through the device
– Determination of the signal random error at the reference sensor
– Determination of the signal level at the reference sensor
– Separate determination of light intensity in UV range
• Determination of the systematic and random error of the wavelength
– Position of an intensity peak in the UV range of the spectrum
– Precision of the position of an intensity peak in the UV range of the spectrum
73
Select the Perform self-test function in the Device calibration group and confirm with enter.
At the end of the self-test, the display shows the message PASSED.
If the display shows the message FAILED, the self-test has failed. If this error cannot be corrected (see
Error messages on p. 76), contact Eppendorf Service.
8.4 Replacing fuses
DANGER! Electric shock.
Switch off the device and disconnect the power plug before starting maintenance or
cleaning work.
The fuse holder is located between the mains connection socket and the mains power switch.
1
1. Disconnect the power plug.
2. Press the upper and lower end of the plastic springs 1 together and pull the fuse holder 2 fully out.
3. Replace faulty fuses and reinsert the fuse holder. Make sure that the guiding rail 3 is positioned
correctly.
2
3
Page 74

74
Maintenance
Eppendorf BioSpectrometer
English (EN)
®
basic
8.5 Decontamination before shipment
If you are shipping the device to the authorized Technical Service for repairs or to your authorized dealer
for disposal please note the following:
WARNING! Risk to health from contaminated device
1. Follow the instructions in the decontamination certificate. You find it as a PDF file on our
website (
2. Decontaminate all the parts you would like to dispatch.
3. Include the fully completed decontamination certificate in the package.
www.eppendorf.com/decontamination).
Page 75

9 Troubleshooting
9.1 General errors
Error Possible cause Remedy
Measuring results
are imprecise.
The measuring
results are not
correct.
• Reagent is past its shelf life.
• Reagent has not been
prepared properly.
• Pipetting is not correct.
• Incubation procedure
before measurement is
incorrect.
• The cuvette is
contaminated.
• The cuvette is not filled
completely with measuring
solution, and it contains
bubbles.
• Turbidity of the measuring
solution.
• Spectrophotometer is
drifting.
• Cuvette shaft is dirty.
• The method has not been
programmed correctly.
• The standard solution has
not been prepared correctly.
• The absorbance of the
reagent is drifting.
• The cuvette is not
positioned correctly.
Ensure that the reagent is still within its shelf life
and properly prepared.
Use clean demineralized water of adequate quality
for preparation if required.
Ensure that the pipette is calibrated and that
pipetting is being performed correctly.
If the method procedure requires incubation
before the measurement, ensure that the
temperature and time for incubation are correctly
observed.
Clean and rinse the cuvette. When replacing a
cuvette, pay attention that the optical window of
the cuvette remains clean and that you do not
touch it with your fingers.
If the cuvette window has become soiled from
fingerprints, wipe it clean using a lint-free lab
cloth soaked in ethanol or isopropanol.
Ensure that the required minimum volume of the
cuvette for a measurement is reached and that no
bubbles are in the measuring solution.
Centrifuge the turbid measuring solutions
containing particles and use the clear supernatant.
Contact Eppendorf Service.
Observe the ambient conditions.
Prevent temperature changes.
Clean the cuvette shaft.
Ensure that the method parameters are entered
correctly.
Ensure that the correct standard is used and that
the measuring solution for the standard is
prepared correctly.
For instable reagent absorbance and end point
methods: When measuring a long series of
samples, measure the reagent blank value not only
at the beginning but also during the sample series.
If the reagent blank value drifts strongly, the
reagent is not appropriate for error-free
measurements and has to be replaced by a new
reagent.
Position the cuvette in the cuvette shaft so that the
optical window points towards the direction of the
light path.
Photometry light path: from back to front
Troubleshooting
Eppendorf BioSpectrometer
English (EN)
®
basic
75
Page 76

76
Troubleshooting
Eppendorf BioSpectrometer
English (EN)
®
basic
9.2 Error messages
You can exit device displays with error messages using the [OK] softkey.
System errors require an evaluation by the Technical Service. These errors are shown in English (System
error …). Please contact Technical Service in these cases. Other error messages, for which you can carry
out troubleshooting measures, are illustrated in the table below.
Problem Cause Solution
Self test failed. • Cuvette shaft cover was open during
self test.
• The cuvette shaft was not empty
during the self test.
• Device is faulty. Contact Eppendorf Service.
File export failed. During data export:
• USB stick improperly formatted or
faulty.
• USB stick removed from the device
too early (during the export).
Failed to initialize
printer.
Blank
measurement: An
intensity on a pixel
that influences the
main, auxiliary or
scan wavelength is
too low.
The entered name
is not valid.
A method (or
folder, dye, protein,
nucleic acid, or
unit) with this name
already exists.
• Printer not connected or switched off.
• Printer not configured correctly.
• The absorbance of the blank solution
used for the blank measurement is too
high.
• Incorrect or turbid blank solution.
• For scans: Wavelength range is too
large, because the sample is very
strongly absorbed in part of the
wavelength range.
• Error when entering the name.
Different causes are possible. For the
precise cause please see the
information in the help box.
• The name under which the method
was saved has already been used for a
different method in the same folder.
• The message also appears after
editing names already given to a
folder or to a nucleic acid (dye,
protein, concentration unit) (under
General Method Parameter).
Repeat the self test with empty
cuvette shaft and the cuvette shaft
cover closed.
Reformat or replace the USB stick.
Reconnect the USB stick and repeat
the export.
Connect the printer and switch it on.
Reconfigure the printer.
For a correct configuration of the printer
settings refer to the installation
description (see Connecting the printer on
p. 17).
Check the blank solution and
remeasure the blank if required.
For scans: Match the wavelength
range to the sample spectrum.
See information in the help box.
Assign a different name.
Page 77

Problem Cause Solution
The following
parameter values
are not defined in
General Method
Parameter:
The value of the
parameter marked
with * is not defined
in the Gen. Param.
Please correct the
parameter.
Invalid zoom
interval.
The entered
standard
concentrations are
not monotonically
increasing resp.
monotonically
falling. Correct the
standard
concentrations.
At least two of the
entered standard
concentrations are
identical. Correct
the standard
concentrations.
The measured
values are not
strictly
monotonous!
The ID cannot be
set.
The dilution cannot
be set.
• When opening a method with
parameters which access General
Method Parameter, the system
determined that at least one
parameter (dye, nucleic acid, protein,
unit) does not exist there anymore, so
probably has been deleted.
This error message appears when editing
method parameters.
• Parameter in General Method
Parameter is not defined.
During the Zoom process with free entry
of limits ([Free]) softkey):
• The zoom area is below the lower
limit.
• See the error text.
• See the error text.
• Error when measuring a standard
series: The measured absorbance
values of the standard series are not
continuously increasing or
decreasing.
• Error when entering the sample ID.
Different causes are possible. For the
precise cause please see the
information in the help box.
• Error when entering the dilution.
Different causes are possible. For the
precise cause please see the
information in the help box.
Select a different parameter from the
existing list. If necessary, program a
new list entry in General Method
Parameter in order to be able to use it
when programming a method.
Select a different parameter from the
existing list. If necessary, program a
new list entry in General Method
Parameter in order to be able to use it
when programming a method.
Enter the values so that the interval
does not fall below the range limits of
0.02 A and 10 nm.
Enter the standard concentrations so
that the first standard receives the
lowest concentration and the other
standard concentrations form an
increasing sequence.
Enter the standard concentrations so
that the first standard receives the
lowest concentration and the other
standard concentrations form an
increasing sequence.
Repeat the standard measurements or
delete the single, incorrectly
measured standard result.
See information in the help box.
See information in the help box.
Troubleshooting
Eppendorf BioSpectrometer
English (EN)
®
basic
77
Page 78

78
Troubleshooting
Eppendorf BioSpectrometer
®
basic
English (EN)
Problem Cause Solution
Calculation not
possible because of
division by zero.
Absorbance result
or Formula "b"
• An absorbance result was divided by
a "zero" value during the evaluation
of a Division type method (Dual
wavelength method group). This is
not mathematically permissible.
Check the reagents and samples used
and repeat the measurement.
Do not enter "zero" as a value for the
Formula b parameter.
parameter is zero.
There is only one
measurement left to
• The number of measurements in one
measuring series is limited to 99.
Start a new series of measurement
after maximally 99 measurements.
be performed in
this series of
measurement.
The maximum
number of
measurements
within one series of
measurements has
been reached.
Invalid zoom
interval!
Error in the process results method step
in the Zoom mode.
Please observe the stated limits in the
zoom procedure.
Permissible zoom range for the
wavelength scale:
• Wavelength interval at least 10 nm
• Entries for wavelengths only within
the range programmed in the
parameters for the method.
Permissible zoom range for the
absorbance scale:
• Absorbance interval at least 0.02 A
• Upper and lower limit for absorbance
interval +3 A or –3 A
Page 79

Troubleshooting
Eppendorf BioSpectrometer
®
basic
English (EN)
9.3 Result flags
Warnings and error messages for results are displayed in the bottom right of the help box. The header bar
of the Help box is highlighted yellow for warnings and red for error messages.
Warnings: Decide whether the result is useful for you while taking the displayed warning into
consideration.
Error messages: No result is displayed; the reason is shown in the error message.
Problem Cause Solution
The standard curve
is not monotone.
Please select
another Curve Fit.
Some absorbance
values for
secondary
wavelengths are too
high or are not
displayed.
The result is
outside the range of
the standard
concentrations.
The coefficient of
determination is
<0.8.
• No usable result was returned during
the evaluation of a standard curve
using the "spline interpolation",
"quadratic regression" or "cubic
regression" Curve Fit procedures.
• For at least one secondary
wavelength, the absorbance exceeded
the measuring range.
• Secondary wavelengths are not
needed for calculating the
concentration result. They are used
for different purposes. For example,
dsDNA method: absorbance at
280 nm for the calculation of ratios
260/280.
• Turbidity of the measuring solution
• Measurements at the limits of the
photometric measuring range.
• For methods with evaluation via
standard curves (nonlinear evaluation
method): The sample result is up to
5 % outside of the standard
concentration range.
• For methods with evaluation of
standard series via the regression
procedure: The coefficient of
determination for the regression
evaluation indicates a significant
deviation of the measuring points
from the regression line.
• Turbidity of the measuring solution.
• Measurements at the limits of the
photometric measuring range.
Select a different Curve Fit
procedure.
If the absorbance values of the
secondary wavelengths are relevant:
Dilute the sample or remove the
turbidity via centrifugation and repeat
the measurement.
Accept the measurement result, or
remeasure the sample under
conditions under which the result is
within the range of the standard
concentrations (dilute sample or
modify standard concentrations and
remeasure).
Accept the result of the standard
evaluation or remeasure the
standards.
Make sure the measuring solutions
are clear.
79
Page 80

80
Troubleshooting
Eppendorf BioSpectrometer
English (EN)
Problem Cause Solution
The coefficient of
determination for
the regression
evaluation of the
standard series is <
0.8.
Scan: Some of the
measured
absorbances are
too high and are
not displayed.
Absorbance at the
measuring
wavelength is too
high.
The calculated
result is negative.
At least one of the
results is negative.
The result has more
than 6 pre-decimal
places.
The result is more
than 5 % outside of
the standard
concentration
range.
®
basic
• For methods with evaluation of
standard series via the regression
procedure: If the regression
evaluation for the standard series was
nonlinear, but the standard evaluation
was accepted by the user, a warning
appears after samples have been
measured.
• For at least one scan wavelength, the
absorbance exceeded the measuring
range.
• Turbidity of the measuring solution.
• Measurements at the limits of the
photometric measuring range.
• Turbidity of the measuring solution.
• Optical surfaces of the cuvette are
soiled.
• Cuvette has been inserted into the
cuvette shaft facing the wrong
direction.
• Too high absorbance of measuring
solution.
• Measuring solution not prepared
correctly.
• The incorrect factor has been entered
(wrong algebraic sign).
• For methods with several results (e.g.,
Dye labels).
• Measuring solution not prepared
correctly.
• The incorrect factor has been entered
(wrong algebraic sign).
• Very high sample concentration.
• Concentration unit does not match
the expected range of the sample
concentrations.
• For methods with evaluation via
standard curves (nonlinear evaluation
method):
The sample result is more than 5 %
outside of the standard concentration
range.
Use the sample results with the
reservation mentioned or repeat the
measurement of the standard series
and samples.
If the non-displayed areas of the scan
are relevant: Dilute the sample or
remove the dilution via centrifugation
and repeat the measurement.
Measure again considering the
possible causes.
Measure again considering the
possible causes.
Measure again considering the
possible causes.
Dilute sample and measure again.
Change the concentration unit
(Parameter Unit) and measure again.
Remeasure the sample under
conditions under which the result is
within the range of the standard
concentrations (dilute sample, modify
standard concentrations and
remeasure).
Page 81

Problem Cause Solution
• Calculation not
possible
because of
division by zero.
Absorbance
result is zero.
• Calculation
error. Division
• The evaluation required dividing by
an absorbance result with the value of
"zero". This is not mathematically
permissible.
Examples: Calculation of a factor at
one-point calibration; calculation of a
260/280 ratio with nucleic acid
measurements.
Check the reagents and samples used
and repeat the measurement.
by zero.
Calculation not
possible because of
division by zero.
Absorbance result
or parameter
• An absorbance result was divided by
a "zero" value during the evaluation
of a Division type method (Dual
wavelength method group). This is
not mathematically permissible.
Check the reagents and samples used
and repeat the measurement.
Do not enter "zero" as a value for the
Formula b parameter.
formula b is zero.
Troubleshooting
Eppendorf BioSpectrometer
English (EN)
®
basic
81
Page 82

82
Troubleshooting
Eppendorf BioSpectrometer
English (EN)
®
basic
Page 83

Transport, storage and disposal
Eppendorf BioSpectrometer
English (EN)
10 Transport, storage and disposal
10.1 Transport
Use the original packaging for transport.
Air temperature Relative humidity Atmospheric pressure
General transport -25 °C – 60 °C 10 % – 95 %30 kPa – 106 kPa
Air freight -40 °C – 55 °C 10 % – 95 %30 kPa – 106 kPa
10.2 Storage
Air temperature Relative humidity Atmospheric pressure
In transport packaging -25 °C – 55 °C 25 % – 75 %70 kPa – 106 kPa
Without transport
packaging
-5 °C – 45 °C 25 % – 75 %70 kPa – 106 kPa
®
basic
83
10.3 Disposal
In case the product is to be disposed of, the relevant legal regulations are to be observed.
Information on the disposal of electrical and electronic devices in the European Community:
Within the European Community, the disposal of electrical devices is regulated by national regulations
based on EU Directive 2012/19/EU pertaining to waste electrical and electronic equipment (WEEE).
According to these regulations, any devices supplied after August 13, 2005, in the business-to-business
sphere, to which this product is assigned, may no longer be disposed of in municipal or domestic waste. To
document this, they have been marked with the following identification:
Because disposal regulations may differ from one country to another within the EU, please contact your
supplier if necessary.
In Germany, this is mandatory from March 23, 2006. From this date, the manufacturer has to offer a
suitable method of return for all devices supplied after August 13, 2005. For all devices supplied before
August 13, 2005, the last user is responsible for the correct disposal.
Page 84

84
Transport, storage and disposal
Eppendorf BioSpectrometer
®
basic
English (EN)
Page 85

Technical data
Eppendorf BioSpectrometer
®
basic
English (EN)
85
11 Technical data
11.1 Power supply
Power supply 100 V to 240 V ±10 %, 50 Hz to 60 Hz
Overvoltage category II
Degree of pollution 2
Power consumption Maximum power consumption according to name plate: 25 W
Approx. 15 W during operation
Approx. 5 W with the display dimmed
Permitted mains interruption Approx. 10 ms at 90 V
Approx. 20 ms at 230 V
Protection class I
Fuses T 2.5 A/250 V, 5 mm × 20 mm (2 pcs.)
11.2 Ambient conditions
Operation Ambient temperature: 15°C to 35°C
Rel. humidity: 25% to 70%
Air pressure: 86 kPa to 106 kPa
Air pressure Use up to an altitude of 2000 m above MSL
Do not expose to direct sunlight.
11.3 Weight/dimensions
Weight 5 kg
Dimensions Width: 295 mm
Depth: 400 mm
Height:150 mm
Space required Width: 500 mm (with thermal printer: 750 mm)
Depth: 500 mm
Page 86

86
Technical data
Eppendorf BioSpectrometer
English (EN)
®
basic
11.4 Photometric properties
Measuring principle Single beam absorption spectrophotometer with reference beam
Light source Xenon flash lamp
Monochromator Holographic aberration-corrected concave grating
Beam receiver CMOS photodiode array
Wavelengths 200 nm to 830 nm
Wavelength selection Method-dependent, freely selectable
Spectral bandwidth ≤ 4 nm
Smallest step size 1 nm
Systematic wavelength error ±1 nm
Random wavelength error ≤ 0.5 nm
Photometric measuring range 0 A to 3.0 A at 260 nm
Reading accuracy ΔA = 0.001
Random photometric error ≤ 0.002 at A = 0
≤ 0.005 (0.5 %) at A = 1
Systematic photometric error ±1 % at A = 1
Stray light component < 0.05 %
11.5 Further technical parameters
Cuvette material For measurements in the UV:
Quartz glass or UV transparent plastic (Eppendorf UVette, 220 nm
to 1600 nm)
For measurements in the visible range:
Glass or plastic material
Cuvette shaft 12.5 mm × 12.5 mm, untempered
Overall cuvette height Min. 36 mm
Height of the light beam in the cuvette 8.5 mm
Key pad 22 foil keys
6 foil keys as softkeys
Result output Absorbance, concentration, scan (absorbance wavelength
spectrum)
Additional, method-dependent data (ratio, FOI, background
absorbances)
Display VGA TFT display 5.7”
Operator guidance language English, French, Spanish, Italian, German
Interfaces USB master: for USB stick and thermal printer DPU-S445
USB slave for connecting to a PC
Serial interface RS 232: for thermal printer DPU-414
Connected devices must meet the safety requirements specified in
IEC 60950-1.
Page 87

Technical data
Eppendorf BioSpectrometer
®
basic
English (EN)
11.6 Application parameters
Methods Preprogrammed and freely programmable methods for all measuring
and evaluation procedures:
• Absorbance measurements with one or more wavelengths, scans
• Nucleic acids and proteins, OD600, dye methods (parallel
measurement of biomolecule and dye marking)
• Methods with evaluation via factor, standard and standard series
• Dual wavelength procedure with subtraction and division
evaluation
Method-dependent evaluation Absorbance, concentration via factor and standard.
Concentration via standard series:
• Linear regression
• Nonlinear regression (2nd and 3rd degree polynoms)
• Spline evaluation
• Linear interpolation (point-to-point evaluation)
87
Absorbance calculations via subtraction and division
Additional data for nucleic acids: Ratios 260/280 and 260/230; molar
concentration, total yield
Additional data for dye methods: FOI (frequency of incorporation,
labeling density)
Scans: zoom, peak evaluation
Method memory >100 method programs
Measured value memory and
calibration memory
Memory for >1 000 results with all data of the results evaluation and
standard evaluation, sample number, sample name, date and used
parameter set of the method program.
(The number of saved results depends on the number of saved
methods.)
Page 88

88
Technical data
Eppendorf BioSpectrometer
English (EN)
®
basic
Page 89

Evaluation procedure
Eppendorf BioSpectrometer
English (EN)
12 Evaluation procedure
This chapter describes the evaluation procedures available in the method programs as well as the
calculation of a dilution using the device software.
When comparing the measuring results to the results of other photometers/
spectrophotometers, note that the values may be dependent on the bandwidth of the devices.
In the following cases the differences may be significant:
• The absorbance spectrum shows a narrow peak in the measurement wavelength.
• The measurement is carried out not at the maximum but at the edge of a peak.
Therefore, check the accuracy of the methods by measuring standards.
12.1 Absorbance values
®
basic
89
Absorbance values are displayed as A
(XXX represents the wavelength). These displays always match
XXX
the directly measured values, i.e., without corrections, which are incorporated in the final evaluation, e.g.,
corrections for optical path lengths of the cuvette, or background corrections.
12.1.1 Blank
All absorbance values are always related to the last measured blank (blank). Therefore, a blank
measurement is compulsory at the start of every series of measurements and can be completed at any time
during a series of measurements. Ideally, the blank measurement should be able to compensate for any
influences on the absorbance value of the measuring solution. The blank should therefore be measured
with the same buffer that was used for the sample measurement and the same cuvette that was used to
measure the sample value – unless the cuvettes used for the blank and sample measurements are optically
aligned and thus have the same absorbance value at the measuring wavelength.
12.1.2 Background correction
Main application: Partial correction of distortions of the absorbance for nucleic acid measurements due to
turbidity in the measuring solution. For example, the absorbance at 320 nm, which should be approx. 0 A
with pure nucleic acids, is subtracted from the absorbance at 260 nm, (the measuring wavelength for
nucleic acids).
AAA
,
BkgrXXXcorrBkgrXXX
A
XXX, corrBkgr
A
= measured absorbance at a wavelength of XXX nm.
XXX
A
= measured absorbance at the background wavelength.
Bkgr
= calculated corrected absorbance at a wavelength of XXX nm.
Page 90

90
Evaluation procedure
Eppendorf BioSpectrometer
®
basic
English (EN)
12.1.3 Cuvette correction
All absorbance values which are used for result calculation are standardized to the cuvette layer thickness
of 10 mm. If a cuvette with a different path length is used, this path length must be defined in the cuvette
parameter. In this case, the measured absorbances are corrected to match measuring results with a cuvette
layer thickness of 10 mm before converting them to sample results.
This correction is applied to:
• Methods with evaluation by factor.
• Methods of the Absorbance group, for which only absorbance values are output
The correction is not applied to:
• Methods with evaluation by standards, as we presume that standards and samples are measured in
cuvettes of the same layer thickness.
• Calculations with division: Division method (Dual wavelength method group) and calculation of ratios
such as A
260/A280
(for nucleic acid measurements).
AA
u
XXXcorrCuvXXX10,
Cuv
A
XXX, corrCuv
A
= measured absorbance at a wavelength of XXX nm.
XXX
= calculated corrected absorbance at a wavelength of XXX nm.
Cuv = path length of the cuvette.
Page 91

Evaluation procedure
Eppendorf BioSpectrometer
®
basic
English (EN)
12.2 Evaluation with factor or standard
FAC u
C = calculated concentration.
A = absorbance.
F = factor.
The factor is programmed in the parameter list and can be modified. It always relates to an optical path
length of the cuvette of 10 mm. If you change the Cuvette parameter the device will take the modification
into account when calculating the results. Therefore you do not need to change the factor for the
evaluation.
If, on the other hand, you modify the concentration unit, you have to ensure that the factor is adjusted for
the selected unit.
The factor is either entered directly as a parameter during the "Factor" evaluation procedure or calculated
during the "Standard" evaluation procedure (evaluation with a standard concentration):
91
C
S
F
A
S
F = calculated factor
= concentration of the standard (enter as parameter).
C
S
A
= measured absorbance of the standard.
S
If multiple measurement (2 or 3 replicates) has been programmed for the standard, the average value is
calculated from the measured absorbance values and inserted as A
.
S
12.3 Evaluation with standard curve/line
If evaluations are made with more than one standard, the following evaluation procedures for the standard
curve/line can be selected with the [Curve fit] in the measure standards/new method step:
Evaluation procedure Description Minimum required number
of standard points
Linear interpolation Linear point-to-point connection in the
absorbance concentration graph of the standard
evaluation.
Linear regression Polynome regression for first degree polynomial. 3 standards minimum.
Quadratical regression Polynome regression for second degree
polynomial.
Cubical regression Polynome regression for third degree polynomial. 5 standards minimum.
Spline interpolation Interpolation via natural cubic splines. 3 standards minimum.
2 standards minimum.
4 standards minimum.
For the regression procedure, one can select that the regression line (regression curve) goes through the
zero point.
Page 92

92
Evaluation procedure
Eppendorf BioSpectrometer
English (EN)
• Use the "linear regression" procedure for calibration lines.
• With curvilinear gradients, test which evaluation procedure (quadratic regression, cubic
regression, spline interpolation) produces the function that is most suitable to the standard
evaluation. Spline interpolation connects the measuring points by cubic polynomials,
whereas the regression methods position a quadratic or cubic function between the
measuring points in such a way, that the smallest possible deviation from the function
results for the measuring points.
• Aside from the calculated regression equation, the regression method also displays the
coefficient of determination as a measure for the scattering of the measuring points around
the calculated function. At a value of < 0.8 for the coefficient of determination the result is
issued with a warning.
• If the first standard hat a concentration of "0", select the setting in which the regression
line (regression curve) goes through the zero point.
• If none of the procedures recommended for curvilinear gradients produce satisfactory
results, select the "linear interpolation" procedure.
®
basic
12.4 Dilution
In the measure samples method step. entered dilutions are considered in the result calculation:
C
V
V
= result converted using the dilution factor
Dil, corr
= volume of the sample in the measuring solution
S
= volume of the diluent in the measuring solution
Dil
Page 93

Evaluation procedure
Eppendorf BioSpectrometer
®
basic
English (EN)
12.5 Special evaluation procedures for nucleic acids and protein UV
This section covers the evaluation of nucleic acids or proteins in the Nucleic acids and Proteins direct UV
method groups, as well as the corresponding biomolecular components in the Dye labels method group.
93
12.5.1 Correction A
and correction A
260
280
Application: correction of the influence of dye absorbance on the nucleic acid or protein absorbance at 260
and 280 nm for the methods of the Dye labels group.
The application of the evaluation procedure can be activated in the parameters Correct A260 or Correct
A280.
ACFAA u
,
A
XXX, corr
A
XXX
= calculated corrected absorbance for a wavelength of 260 nm or 280 nm
= measured absorbance for a wavelength of 260 nm or 280 nm
YYYXXXcorrXXX
CF = correction factor for a wavelength of 260 nm or 280 nm (the correction factors for 260 nm and 280 nm
are both dye-specific and are programmed in General Method Parameter: Dyes in the Functions area).
= measured absorbance at the dye wavelength.
A
YYY
The absorbance values displayed in the results are the directly measured, not the corrected
absorbance values.
12.5.2 Ratios A260/A280 and A260/A230.
Application: Information on the purity of the measured nucleic acid. Application of the evaluation
procedure can be activated in the A260/280 or A260/A230 parameters.
"Ratio" refers to the quotients of the measured absorbances at the listed wavelengths.
Literature values for ratio values with pure nucleic acids:
A260/A280
• DNA: 1.8 to 1.9
• RNA: 1.9 to 2.0
(Current Protocols in Molecular Biology, 1994)
A260/A230
For the ratios A260/A230, different information can be found in the literature for pure nucleic acids:
• DNA: 2.3 to 2.5
(The Nucleic Acids, 1955)
• DNA: 1.9
(Current Protocols in Molecular Biology, 1994)
The values are highly dependent on the pH value. Therefore, nucleic acids should not be measured in
water, but in a buffer with a pH of 7 to 7.2 (e.g., TE buffer).
Page 94

94
Evaluation procedure
Eppendorf BioSpectrometer
English (EN)
®
basic
12.5.3 Conversion to molar concentrations and nucleic acid quantities
The conversion only can be applied to nucleic acids and dye methods with nucleic acids as biomolecule
components. It is realized in the process results/More calculations method step.
12.5.3.1 Calculation of amount
Application: calculating the amount (mass) of nucleic acid in the total sample volume.
M = calculated total amount (mass) of nucleic acid in the sample tube. Unit: μg.
C = nucleic acid concentration calculated from the measurement. Unit: μg/mL or ng/μL.
= total volume of the sample in the sample tube. Enter this value in More calculations. Unit: μL.
V
S, total
12.5.3.2 Calculation of the molar concentration
Application: calculation of the molar concentration of the nucleic acid from the mass concentration and
relative molar mass. The molar mass is either entered directly or calculated by the device from the entered
number of bases or base pairs per nucleic acid molecule.
3
C
C
Mol
= calculated molar concentration of the nucleic acid. Unit: pmol/mL.
C
Mol
C = nucleic acid concentration calculated from the measurement. Unit: μg/mL or ng/μL.
MM = relative molar mass. Unit: kDa
If the number of bases or base pairs per nucleic acid molecule are entered in More calculations instead of
the relative molar mass, the MM is calculated from the number of the bases or base pairs:
For dsDNA:
For ssDNA, RNA, Oligo:
10u
MM
MM = calculated relative molar mass; unit: kDa
bp = entered number of base pairs per molecule
b = entered number of bases per molecule
Page 95

Evaluation procedure
H
Eppendorf BioSpectrometer
• For dsDNA the calculation of the molar concentration is based on the assumption of a
double-stranded nucleic acid. For the ssDNA, RNA and Oligo methods, a single-stranded
nucleic acid is assumed.
• For methods which have been reprogrammed via <New Method> in the Routine main
group, Nucleic acids method group, always double-stranded nucleic acids are assumed
for calculating the molar concentration.
®
basic
English (EN)
12.5.4 Calculating the factor for protein in "General Method Parameter"
This section only covers the calculation of the protein components in the Dye labels and Proteins direct
UV method groups. For these method groups, the protein component is selected in the parameters (see
Method parameters on p. 35). The protein component is assigned a factor that will be entered in the
General Method Parameter/Proteins function for each protein. Alternatively, A
coefficient plus the molar mass of the protein can be entered instead of the factor. In this case, the factor is
calculated as follows:
or the absorbance
0.1%
95
F
F = factor for the protein; unit: g/L.
A
When entering the molar absorbance coefficient and the relative molar mass of the protein A
calculated on this basis:
A
ε
P
MM
1
P
A
%1.0
= absorbance of the protein at a concentration of 0.1 % (1 g/L).
0.1%
P
%1.0
MM
P
= molar absorbance coefficient of the protein; unit: cm-1M-1.
= relative molar mass of the protein; unit: Da (entry in General Method Parameter in kDa).
P
0.1%
can be
12.6 Special evaluation procedures for the dye methods
12.6.1 Calculating the factor for the dye from the absorbance coefficient
For the dye methods the concentration of the dye is calculated using a factor from the measured
absorbance (see Evaluation with factor or standard on p. 91). The factor is entered for each dye in the
General Method Parameter/Dyes function. Alternatively, you can enter the absorbance coefficient. In this
case, the factor is calculated as follows:
6
Dye
10
H
Dye
-1M-1
F
F = factor for the dye; unit: pmol/μL.
ε = absorbance coefficient for the dye, unit: cm
Page 96

96
Evaluation procedure
Eppendorf BioSpectrometer
English (EN)
®
basic
12.6.2 Calculation of the FOI
As a value for the ratio of dye molecules to the number of nucleotides in the nucleic acid the frequency of
incorporation (FOI) is calculated and displayed for the dye methods. The calculation can be selected for two
different result units:
MOLECULE dye/kb unit
6
MMA
u
10
FOI
pmole/μg DNA (or RNA) unit
YYY
u
H
Dye
nt
FA
u
NAXXX
A
FOI
YYY
u
H
= absorbance of the dye.
A
YYY
A
= absorbance of the nucleic acid.
XXX
MM
= average molar mass of the nucleotides: 330 g/mol.
nt
F
= factor for calculating the nucleic acid
NA
= absorbance coefficient for the dye, unit: cm-1M
ε
dye
10
9
FA
u
NAXXXDye
-1
12.6.3 Conversion to amounts of dye
The quantity (dimensions) of dye in the entire sample volume is calculated in the process results/More
calculations method step.
VCM
u
totalP
,
M = calculated total amount (mass) of dye in the sample tube. Unit: pmol.
C = dye concentration calculated from the measurement. Unit: pmol/μL.
V
= total volume of the sample in the sample tube; entered by the user under More calculations. Unit:
S, total
μL.
Page 97

Evaluation procedure
Eppendorf BioSpectrometer
®
basic
English (EN)
12.7 Dual wavelength
For methods of the Dual Wavelength group absorbances that were measured at two wavelengths can be
calculated with each other before the calculated absorbance is evaluated further with the factor or
standard.
To determine the calculated absorbance a division or subtraction evaluation can be defined in the
parameters:
Aa
u
A
calc
calc
, A2 = measured absorbance.
A
1
a, b, c, d = factors that are entered in the parameters. Negative figures may also be entered.
1
Ab
u
2
>@
dc
u
dcAbAaA
uuu
21
97
Page 98

98
Evaluation procedure
Eppendorf BioSpectrometer
English (EN)
®
basic
Page 99

13 Ordering information
Ordering information
Eppendorf BioSpectrometer
English (EN)
®
basic
99
Order no.
(International)
6135 000.009 – 230 V / 50 – 60 Hz, mains/power plug Europe, more types of
6135 000.017 6135000017 120 V / 50 – 60 Hz, mains/power plug North America
6135 928.001 6135928001 Filter set for checking photometric precision und wavelength
6138 000.018 6138000018 Eppendorf microvolume measuring cell for Eppendorf
6135 011.000 230 V, EU
6135 010.004 6135010004 115 V/110V, USA, JP
6135 012.007 230 V, UK
0013 021.566 952010409 5 rolls
0030 106.300 952010051 50 - 2 000 μL, 80 pieces, individually packaged
0030 106.318 952010069 50 - 2 000 μL, 200 pieces, reclosable box
0030 079.345 0030079345 10 × 100 pieces
0030 079.353 0030079353 10 × 100 pieces
4308 078.006 940001102 for 16 cuvettes
Order no. (North
America)
Description
Eppendorf BioSpectrometer basic
mains/power connection available
BioSpectrometer reference filter set
accuracy (according to NIST)
Eppendorf μCuvette G1.0
BioPhotometer and BioSpectrometer
Thermal Printer DPU-S445
including power supply and printer cable
Thermo paper
Eppendorf UVette 220 nm – 1 600 nm
Original Eppendorf plastic cuvette, PCR clean, Protein-free
Eppendorf UVette routine pack 220 nm – 1 600 nm
Eppendorf Quality
Eppendorf macro Vis Cuvettes
Eppendorf semi-micro Vis Cuvettes
Cuvette stand
Page 100

100
Ordering information
Eppendorf BioSpectrometer
English (EN)
®
basic
 Loading...