

Page 1

ualPlateReader AF2200
E
Register your instrument!
www.eppendorf.com/myeppendorf
N)manual
Eppendorf® PlateReader AF2200
Software manual
Version 1.0.4
Page 2

©
Copyright
2013 Eppendorf AG, Hamburg. No part of this publication may be reproduced without the prior
permission of the copyright owner.
Trademarks
Eppendorf
Microsoft
®
and the Eppendorf Logo are registered trademarks of Eppendorf AG, Hamburg, Germany.
®
, Windows® and Excel® are registered trademarks of Microsoft Corporation, Redmond, WA,
USA.
Pentium
PicoGreen
®
is a registered trademark of Intel Corporation, Santa Clara, CA, USA.
®
, RiboGreen®, OliGreen® and NanoOrange® are registered trademarks of Molecular Probes,
Inc., Eugene, OR, USA.
®
Apo-ONE
Corning
Greiner
und CellTiter-Blue® are registered trademarks of Promega Corporation, Madison, WI, USA.
®
is a registered trademark of Corning Incorporated, New York, NY, USA.
®
and μClear® are registered trademarks of Greiner Labortechnik GmbH, Frickenhausen, Germany.
Lumox™ is a trademark of Greiner Bio-One GmbH, Frickenhausen, Germany.
Nunclon
®
is a registered trademark of Nunc A/S, Roskilde, Denmark.
LumiNunc™ und FluoroNunc™ are trademarks of, Nunc A/S, Roskilde, Denmark.
Trademarks are not marked in all cases with ™ or
6141 905.200-01/022013
®
in this manual.
Page 3

Table of contents
®
Eppendorf
PlateReader AF2200
English (EN)
Table of contents
1 Operating instructions . . . . . . . . . . . . . . . . . . . . . . . . . . . . . . . . . . . . . . . . . . . . . . . . . . . . . . . . . . . . . . 5
1.1 Using this manual . . . . . . . . . . . . . . . . . . . . . . . . . . . . . . . . . . . . . . . . . . . . . . . . . . . . . . . . . . . . . 5
1.2 Danger symbols and danger levels . . . . . . . . . . . . . . . . . . . . . . . . . . . . . . . . . . . . . . . . . . . . . . . . 5
1.2.1 Danger symbols . . . . . . . . . . . . . . . . . . . . . . . . . . . . . . . . . . . . . . . . . . . . . . . . . . . . . . . 5
1.2.2 Danger levels. . . . . . . . . . . . . . . . . . . . . . . . . . . . . . . . . . . . . . . . . . . . . . . . . . . . . . . . . . 5
1.3 Symbols used . . . . . . . . . . . . . . . . . . . . . . . . . . . . . . . . . . . . . . . . . . . . . . . . . . . . . . . . . . . . . . . . 6
2 Product description . . . . . . . . . . . . . . . . . . . . . . . . . . . . . . . . . . . . . . . . . . . . . . . . . . . . . . . . . . . . . . . . 7
2.1 Area of Application . . . . . . . . . . . . . . . . . . . . . . . . . . . . . . . . . . . . . . . . . . . . . . . . . . . . . . . . . . . . 7
2.2 System requirements . . . . . . . . . . . . . . . . . . . . . . . . . . . . . . . . . . . . . . . . . . . . . . . . . . . . . . . . . . 7
2.3 CE Declaration for Europe . . . . . . . . . . . . . . . . . . . . . . . . . . . . . . . . . . . . . . . . . . . . . . . . . . . . . . 8
3 Installation . . . . . . . . . . . . . . . . . . . . . . . . . . . . . . . . . . . . . . . . . . . . . . . . . . . . . . . . . . . . . . . . . . . . . . . 9
3.1 Install software . . . . . . . . . . . . . . . . . . . . . . . . . . . . . . . . . . . . . . . . . . . . . . . . . . . . . . . . . . . . . . . 9
3.2 Starting PlateReader AF 2200. . . . . . . . . . . . . . . . . . . . . . . . . . . . . . . . . . . . . . . . . . . . . . . . . . . 12
3.2.1 Connected Instrument. . . . . . . . . . . . . . . . . . . . . . . . . . . . . . . . . . . . . . . . . . . . . . . . . . 12
3.2.2 Simulated Instrument . . . . . . . . . . . . . . . . . . . . . . . . . . . . . . . . . . . . . . . . . . . . . . . . . . 12
3
4 Overview . . . . . . . . . . . . . . . . . . . . . . . . . . . . . . . . . . . . . . . . . . . . . . . . . . . . . . . . . . . . . . . . . . . . . . . . 13
4.1 Main Window . . . . . . . . . . . . . . . . . . . . . . . . . . . . . . . . . . . . . . . . . . . . . . . . . . . . . . . . . . . . . . . 13
4.2 Explorer bar . . . . . . . . . . . . . . . . . . . . . . . . . . . . . . . . . . . . . . . . . . . . . . . . . . . . . . . . . . . . . . . . 14
4.3 Workflow Pane . . . . . . . . . . . . . . . . . . . . . . . . . . . . . . . . . . . . . . . . . . . . . . . . . . . . . . . . . . . . . . 24
4.4 Info bar . . . . . . . . . . . . . . . . . . . . . . . . . . . . . . . . . . . . . . . . . . . . . . . . . . . . . . . . . . . . . . . . . . . . 25
4.5 Menu Bar. . . . . . . . . . . . . . . . . . . . . . . . . . . . . . . . . . . . . . . . . . . . . . . . . . . . . . . . . . . . . . . . . . . 26
4.5.1 File Menu . . . . . . . . . . . . . . . . . . . . . . . . . . . . . . . . . . . . . . . . . . . . . . . . . . . . . . . . . . . 26
4.5.2 Edit Menu . . . . . . . . . . . . . . . . . . . . . . . . . . . . . . . . . . . . . . . . . . . . . . . . . . . . . . . . . . . 27
4.5.3 View Menu . . . . . . . . . . . . . . . . . . . . . . . . . . . . . . . . . . . . . . . . . . . . . . . . . . . . . . . . . . 28
4.5.4 Instrument Menu. . . . . . . . . . . . . . . . . . . . . . . . . . . . . . . . . . . . . . . . . . . . . . . . . . . . . . 28
4.5.5 Settings Menu . . . . . . . . . . . . . . . . . . . . . . . . . . . . . . . . . . . . . . . . . . . . . . . . . . . . . . . . 29
4.6 Plate List . . . . . . . . . . . . . . . . . . . . . . . . . . . . . . . . . . . . . . . . . . . . . . . . . . . . . . . . . . . . . . . . . . . 36
5 Defining measurements . . . . . . . . . . . . . . . . . . . . . . . . . . . . . . . . . . . . . . . . . . . . . . . . . . . . . . . . . . . . 41
5.1 Plate Size – Pattern . . . . . . . . . . . . . . . . . . . . . . . . . . . . . . . . . . . . . . . . . . . . . . . . . . . . . . . . . . . 41
5.2 Defining Endpoint Measurements . . . . . . . . . . . . . . . . . . . . . . . . . . . . . . . . . . . . . . . . . . . . . . . 42
5.3 Defining Multimode Measurements . . . . . . . . . . . . . . . . . . . . . . . . . . . . . . . . . . . . . . . . . . . . . . 44
5.4 Defining Kinetic Measurements . . . . . . . . . . . . . . . . . . . . . . . . . . . . . . . . . . . . . . . . . . . . . . . . . 47
5.5 Indenting and Releasing Program Elements . . . . . . . . . . . . . . . . . . . . . . . . . . . . . . . . . . . . . . . 49
Page 4

Table of contents
®
4
Eppendorf
PlateReader AF2200
English (EN)
6 Predefined methods . . . . . . . . . . . . . . . . . . . . . . . . . . . . . . . . . . . . . . . . . . . . . . . . . . . . . . . . . . . . . . . 53
6.1 Method selection. . . . . . . . . . . . . . . . . . . . . . . . . . . . . . . . . . . . . . . . . . . . . . . . . . . . . . . . . . . . . 53
6.2 Method description . . . . . . . . . . . . . . . . . . . . . . . . . . . . . . . . . . . . . . . . . . . . . . . . . . . . . . . . . . . 54
6.2.1 Nucleic acid quantification (UV 260 nm microvolume) . . . . . . . . . . . . . . . . . . . . . . . . 54
6.2.2 Nucleic acid quantification (UV 260 nm with factor) . . . . . . . . . . . . . . . . . . . . . . . . . . 54
6.2.3 Nucleic acid quantification (UV 260 nm with standards) . . . . . . . . . . . . . . . . . . . . . . . 56
6.2.4 Nucleic acid quantification (Fluorescence 485/535 nm with standards) . . . . . . . . . . . 59
6.2.5 Protein quantification BCA, Bradford, Lowry . . . . . . . . . . . . . . . . . . . . . . . . . . . . . . . . 61
6.2.6 Protein quantification (NanoOrange 485/595 nm with standards) . . . . . . . . . . . . . . . . 63
6.2.7 Cell viability (CellTiter-Blue Assay). . . . . . . . . . . . . . . . . . . . . . . . . . . . . . . . . . . . . . . . 65
6.2.8 Cell viability (Apo-ONE Caspase-3/7 Assay) . . . . . . . . . . . . . . . . . . . . . . . . . . . . . . . . . 67
6.3 Method (measurement) parameters . . . . . . . . . . . . . . . . . . . . . . . . . . . . . . . . . . . . . . . . . . . . . . 69
6.4 Method results . . . . . . . . . . . . . . . . . . . . . . . . . . . . . . . . . . . . . . . . . . . . . . . . . . . . . . . . . . . . . . 69
6.4.1 Contents of the raw data sheet . . . . . . . . . . . . . . . . . . . . . . . . . . . . . . . . . . . . . . . . . . . 69
6.4.2 Contents of the blanking sheet (factor methods only) . . . . . . . . . . . . . . . . . . . . . . . . . 70
6.4.3 Content of the results sheet . . . . . . . . . . . . . . . . . . . . . . . . . . . . . . . . . . . . . . . . . . . . . 71
7 Troubleshooting . . . . . . . . . . . . . . . . . . . . . . . . . . . . . . . . . . . . . . . . . . . . . . . . . . . . . . . . . . . . . . . . . . 73
7.1 General Troubleshooting. . . . . . . . . . . . . . . . . . . . . . . . . . . . . . . . . . . . . . . . . . . . . . . . . . . . . . . 73
7.2 Troubleshooting Absorbance mode . . . . . . . . . . . . . . . . . . . . . . . . . . . . . . . . . . . . . . . . . . . . . . 73
7.3 Troubleshooting Fluorescence mode . . . . . . . . . . . . . . . . . . . . . . . . . . . . . . . . . . . . . . . . . . . . . 74
7.4 Save method scripts . . . . . . . . . . . . . . . . . . . . . . . . . . . . . . . . . . . . . . . . . . . . . . . . . . . . . . . . . . 74
7.5 Save method results . . . . . . . . . . . . . . . . . . . . . . . . . . . . . . . . . . . . . . . . . . . . . . . . . . . . . . . . . . 74
8 Evaluation procedure . . . . . . . . . . . . . . . . . . . . . . . . . . . . . . . . . . . . . . . . . . . . . . . . . . . . . . . . . . . . . . 75
8.1 Nucleic acid quantification UV 260 nm with factor . . . . . . . . . . . . . . . . . . . . . . . . . . . . . . . . . . 75
8.2 Nucleic acid and Protein quantification with standards . . . . . . . . . . . . . . . . . . . . . . . . . . . . . . . 75
8.3 Protein quantification Nano Orange 485/595 nm with standards . . . . . . . . . . . . . . . . . . . . . . . 75
8.4 Cell viability CellTiter-Blue Assay, Cell viability Apo-ONE Caspase-3/7 Assay . . . . . . . . . . . . . 75
Page 5

Operating instructions
®
Eppendorf
PlateReader AF2200
English (EN)
1 Operating instructions
1.1 Using this manual
Read this operating manual completely before using the device for the first time. Please also note the
operating instructions for the accessories, if applicable.
This operating manual is part of the product. Thus, it must always be easily accessible.
Enclose this operating manual when transferring the device to third parties.
If this manual is lost, please request another one. For the current version, please refer to our webpage
www.eppendorf.com/worldwide
(international) or www.eppendorfna.com (North America).
1.2 Danger symbols and danger levels
The safety instructions in this manual appear with the following danger symbols and danger levels:
5
1.2.1 Danger symbols
Biohazard Explosion
Electric shock Toxic substances
Hazard point Material damage
1.2.2 Danger levels
DANGER Will lead to severe injuries or death.
WARN ING May lead to severe injuries or death.
CAUTION May lead to light to moderate injuries.
NOTICE May lead to material damage.
Page 6

Operating instructions
Eppendorf
6
English (EN)
®
PlateReader AF2200
1.3 Symbols used
Symbol Meaning
Handling
1.
2.
• List
Text Name of fields in the software
Actions in the specified order
Useful information
Page 7

Product description
®
Eppendorf
PlateReader AF2200
English (EN)
2 Product description
2.1 Area of Application
The Software is an easy-to-use and flexible tool, which gives the user complete control over the Eppendorf
PlateReader AF2200.
The Software presents the raw data for further use in Excel, offering excellent features for research
purposes.
2.2 System requirements
To install the software, the system must meet the following minimum requirements:
Component Minimum Recommended
7
Computer Windows XP (32-bit):
Windows-compatible computer
with a Pentium-compatible
processor, 1 GHz
Windows Vista (32-bit):
Windows-compatible computer
with a Pentium-compatible
processor, 1 GHz
Windows 7 (32- or 64-bit):
Windows-compatible computer
with a Pentium-compatible
processor, 1 GHz
Operating system Windows XP (32-bit) SP3
Windows Vista (32-bit)
Windows 7 (32-bit)
Windows 7 (64-bit)
Memory Windows XP: 512 MB RAM
Windows Vista (32-bit): 1 GB
RAM
Windows 7 (32-bit): 1 GB RAM
Windows 7 (64-bit): 2 GB RAM
2 GHz (dual-core)
2 GHz (dual-core)
2 GHz (dual-core)
Windows XP (32-bit) SP3
1 GB RAM
2 GB RAM
2 GB RAM
3 GB RAM
Memory requirements 700 MB RAM 1 GB RAM
Monitor Super VGA Graphics 1280 x 1024
Screen resolution 1024 x 768 -
Color depth 256 -
Mouse Microsoft-compatible mouse or
similar device
-
Page 8

Product description
Eppendorf
8
English (EN)
Component Minimum Recommended
Communication 1x USB 2.0 2x USB 2.0
®
PlateReader AF2200
1x RS232 (serial)
Drive, graphic card 1xCD-ROM drive
Windows Vista:
DirectX 9 graphic and 32 MB
graphics memory (for Home Basic
version)
DirectX 9 graphic and 128 MB
graphics memory with WDDM
support for all other versions.
Windows 7:
DirectX 9 graphic with WDDM
driver 1.0 or higher.
.NET Microsoft .NET Framework 2.0
If this version is not available, it
will be installed by the installation
and update program using any
available installation of the .NET
Framework.
Windows Installer 3.1
If this version is not available, it
will be installed by the installation
and update program.
Microsoft Excel Excel 2002 (only compatible for
script-based messages without
data reduction). Excel 2002 is not
compatible for methods.
Excel 2003, 2007 and 2010
(32-bit)
The Starter Edition is not
supported.
-
-
-
-
2.3 CE Declaration for Europe
PlateReader AF2200 Software is not a CE-marked product. Therefore no CE declaration for Europe is
available.
Page 9

3 Installation
3.1 Install software
You must have administrator rights to install the software.
Install the software before connecting the PlateReader AF2200 to the computer.
®
Eppendorf
1. Insert the CD with the software into the CD-ROM
drive.
2. Start the installation by executing the Setup file.
PlateReader AF2200
Installation
English (EN)
9
3. Press the OK button to continue the installation.
4. Press the Next button to continue the installation.
The Next button can be used to confirm the current installation step and continue the
installation.
The Back button brings you back to the previous installation step.
The Cancel button can be used to abort the installation.
Page 10

10
Installation
Eppendorf
®
English (EN)
PlateReader AF2200
5. Define the user.
6. Select language.
7. Define the installation directory.
Page 11

®
Eppendorf
PlateReader AF2200
English (EN)
8. Press the Install button to confirm the settings
and start the installation.
9. Press the Finish button to complete the
installation.
Installation
11
The PlateReader AF2200 can now be connected to the computer.
Page 12

12
Installation
Eppendorf
English (EN)
®
PlateReader AF2200
3.2 Starting PlateReader AF 2200
The Software can be used either with a connected instrument or in simulation mode.
3.2.1 Connected Instrument
Install the software before connecting the instrument to the computer.
1. Connect the instrument to your computer and switch the instrument on.
2. Start the program by selecting Programs > Eppendorf > PlateReader AF2200 from the Windows Start
menu.
3. The following dialog box appears:
4. Select the instrument name in the dialog box.
5. Click the Button OK to start the software.
3.2.2 Simulated Instrument
1. Start the program by selecting Programs > Eppendorf > PlateReader AF2200 from the Windows Start
menu.
2. The following dialog box appears:
3. Select the checkbox Show simulated instruments.
4. Select the demo instrument to connect to from the Instrument Name list.
5. Click the Button OK to start the software.
Page 13

Overview
1
2
3
456
English (EN)
Eppendorf
®
PlateReader AF2200
4Overview
4.1 Main Window
The main window of the software is used to set up workflows. Each workflow is easily created by dragging
and dropping the process steps into a sequence according to the application. The application workflow is
then visible to the user in the workflow pane and can be saved for future use.
Each process step, that is each program element, can be copied and pasted and moved to the desired
position in the workflow.
Data can be exported easily to Windows compatible formats (Excel).
Start the software and connect an instrument as described in the previous chapter or select the simulation
mode. The Software main window appears.
13
1Menu bar
2Workflow pane
3Info bar
4 Controls
5 Status bar
6Explorer bar
Page 14

14
Overview
Eppendorf
English (EN)
®
PlateReader AF2200
4.2 Explorer bar
The Explorer bar is divided into different sections. Each section contains program elements used to create
an individual workflow.
1. Create a workflow either by double-clicking the selected program element or by dragging and dropping
it into the workflow pane.
The following program elements are available:
Methods Eppendorf prdefined methods
Labware Plate
Pattern
Well
Mode Absorbance
Fluorescence Intensity
Actions Temperature
Shaking
Move Plate
Kinetic Kinetic Cycle
Kinetic Condition
Miscellaneous Comment
User Intervention
Wait for Temperature
Wait Time
Incubation
4.2.1 Labware
Plate
The Plate program element is used to select a plate format from the Plate definition drop-down list.
For accurate measurements it is essential that plate and pattern selected in the software
correspond to the plate and the pattern you use for measuring.
1. Click Details to see further information on the selected plate.
2. If a plate with cover is used, select the Plate with cover checkbox.
3. The measurement will automatically measure all selected wells of the plate. If you want to measure a
specific well or a range of wells, click the link Pattern in the lower right corner.
Page 15

®
Eppendorf
PlateReader AF2200
English (EN)
4. Under Details it is possible to apply a filter so that only certain plate definition files are shown.
Pattern
The Pattern program element is displayed according to the selected plate format (number of wells).
1. To measure individual wells, click the desired well or to measure a range of wells drag a frame around
the desired range.
Overview
15
Independent Pattern
1. Clicking on Zoom, the plate preview can be zoomed and independent parts of the plate can be selected
2. A second range of wells can be selected by pressing the Control key on the keyboard and dragging a
frame over the wells to be selected.
Page 16
16
Overview
®
Eppendorf
PlateReader AF2200
English (EN)
Well
Use the Well program element to perform measurements well by well. Without this program element, all
measurement steps are done plate-wise.
4.2.2 Mode
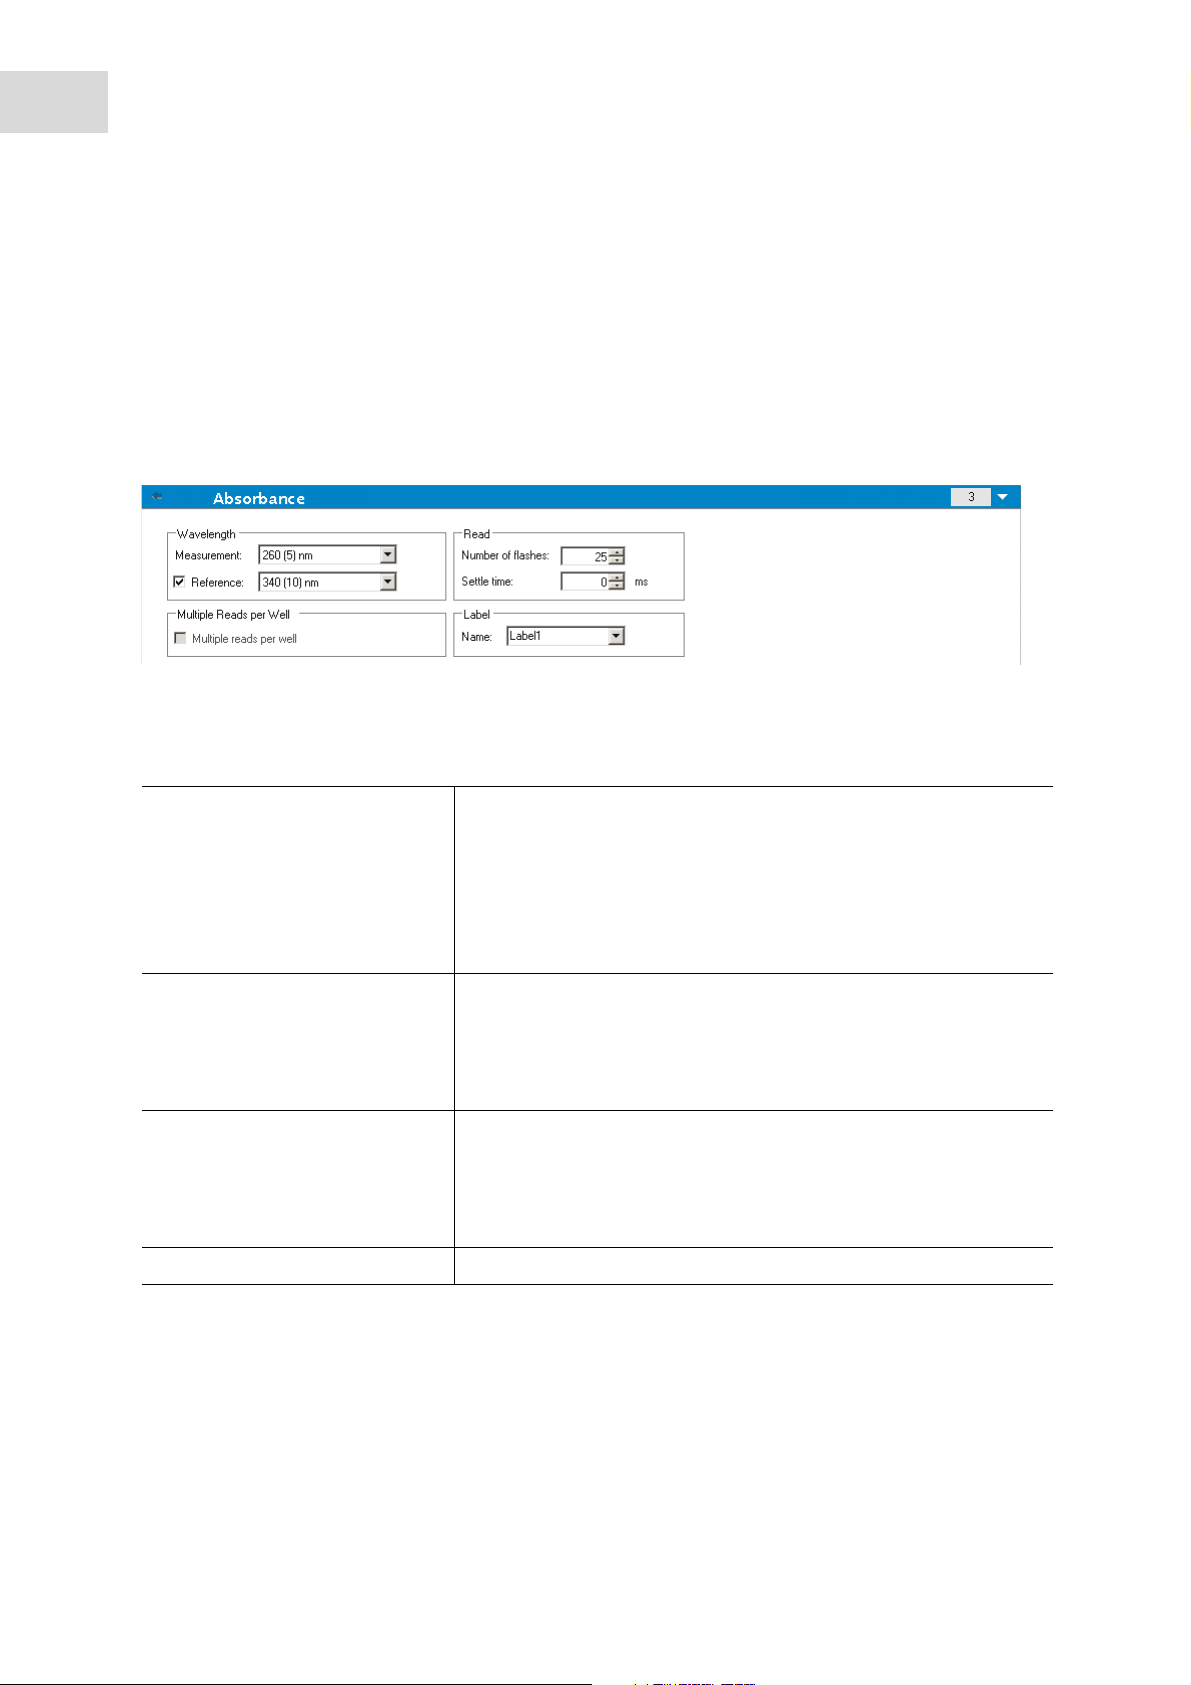
Absorbance
The Absorbance program element is used to perform absorbance measurements.
1. Enter or select the respective parameters:
Wavelength Specify a measurement wavelength.
The Reference wavelength may be selected to correct for flash
variations.
Two drop-down lists display the available measurement and
reference filter wavelengths, according to the inserted absorbance
filter slide. If the drop-down lists are empty, the absorbance filter
either has not been inserted into the reader or has not been defined.
Read Specify a certain Number of flashes and, if required, a Settle time
before the next measurement. The number of flashes is selectable
from 1 – 100.
Settle time: Enter a value to specify the time between the movement
of the plate carrier to the measurement position and the first flash.
Flashes In order to obtain a good measurement precision it is recommended
to perform absorbance measurements with the number of flashes
that is set as a default value for the respective instrument. On-the-fly
measurements with one flash per well are possible with all plate
types.
Measurement Enter a measurement name.
Page 17

®
Eppendorf
PlateReader AF2200
English (EN)
Fluorescence Intensity
The Fluorescence Intensity program element contains fields for the selection of excitation and emission
wavelength, top or bottom reading mode, integration and lag time, flash number and gain settings. A
checkbox for multiple reads per well gives access to additional function.
Overview
17
The following are the Fluorescence Intensity parameters:
Wavelength and Bandwidth Specify an Excitation and an Emission wavelength.
Two drop-down lists display the available measurement filter
wavelengths.
If the spin box of fixed values is empty, the excitation and emission
filters have not been inserted into the reader or have not been
defined.
The bandwidth is specific for every used filter and needs to be
defined together with the central filter wavelength.
Read Specify a certain Number of flashes and, if required, a Settle time
before the next measurement. The number of flashes is selectable
from 1 – 100.
Settle time: Enter a value to specify the time between the movement
of the plate carrier to the measurement position and the first flash.
Flashes In order to obtain a good measurement precision it is recommended
to perform fluorescence measurements with the number of flashes
that is set as a default value for the respective instrument. On-the-fly
measurements with one flash per well are possible with all plate
types.
Mode Select Top or Bottom.
Measurement Enter a measurement name
Page 18

18
Overview
®
Eppendorf
PlateReader AF2200
English (EN)
Gain The gain is an amplification factor for the photomultiplier tube (PMT)
and may be set by selecting one of the following modes:
Manual gain: user-defined gain value (valid range: 1-255)
Optimal gain: calculated automatically by the instrument according
to the highest signal within the selected well range in order to avoid
OVER. Optimal gain determination is performed in a
pre-measurement. It is recommended to use the optimal gain
function for all applications that produce results with unknown RFU
values.
Calculated from well: determines the optimal gain for the selected
well. The resulting gain value is applied to all other wells within the
selected well range.
Extended dynamic range: The extended dynamic range option is an
automatic gain function that serves to optimally adjust the gain
setting for both very high and very low signals on a microplate within
one single measurement. By selecting "extended dynamic range",
the measurement is done in two consecutive parts, one with a high
and one with a low gain. The results of both measurements are
automatically correlated and displayed within one single data set.
For measurements in combination with the Extended dynamic range function, a very high gain
value in the first measurement can result in OVER values in the second measurement. When
only very high and very low signal intensities are detected within the measured well range, the
new gain value is calculated on the basis of the very low values, in certain cases this can lead
to OVER for the entire second measurement.
Integration/Lag time Integration time: duration of signal recording per well (valid range:
20-2000 μs).
Lag time: time between flash and the start of signal integration.
While lag time is an optional function, the integration time is a
mandatory parameter for defining the duration of signal recording.
The default values for standard fluorescence intensity measurements
are 0 μs lag time and 20 μs integration time.
Page 19
®
Eppendorf
PlateReader AF2200
English (EN)
Multiple Reads per Well
The software allows the user to define multiple reads per well (MRW) in Absorbance, Fluorescence top and
Fluorescence bottom mode.
The MRW feature is not available for well wise measurements.
The Reference wavelength on the absorbance program element is not selectable in combination with
multiple reads per well.
The multiple reads per well function can be activated on an absorbance or fluorescence intensity program
element by selecting the Multiple reads per well check box.
Overview
19
More details on defining parameters for multiple reads per well, are available in the Operating
Manual of the Eppendorf PlateReader AF2200.
The multiple reads per well function is available for plate formats with up to 384 wells.
4.2.3 Actions
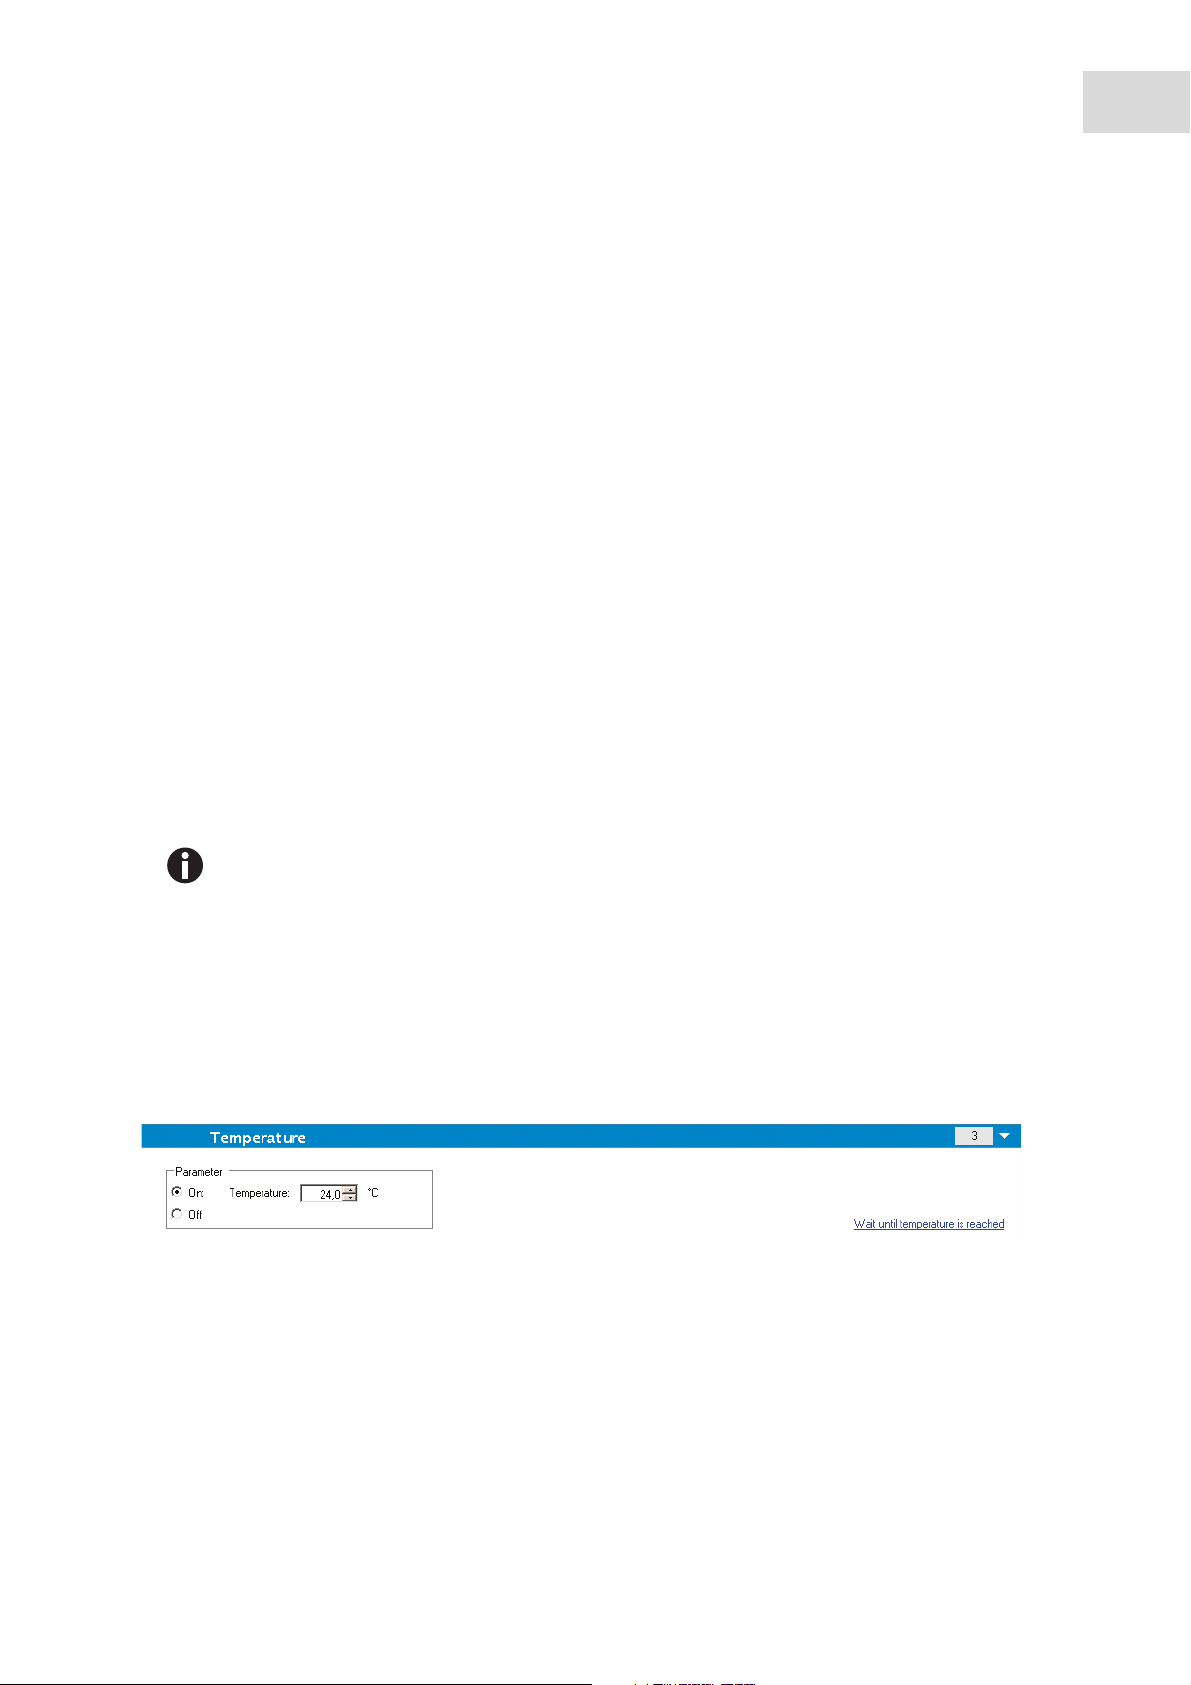
Tem perature
1. Select the Temperature program element to enter a certain target temperature.
2. Select On to enter a target temperature value.
3. Click on the link Wait until temperature is reached to define the Minimum and/or Maximum temperature
values. The heating of the instrument starts when clicking the Start button.
4. For pre-heating the instrument, select Heating in the Instrument menu and click the On button.
The measurement only starts if the current instrument temperature is within the specified range (see
Miscellaneous on p. 21).
Page 20
20
Overview
®
Eppendorf
PlateReader AF2200
English (EN)
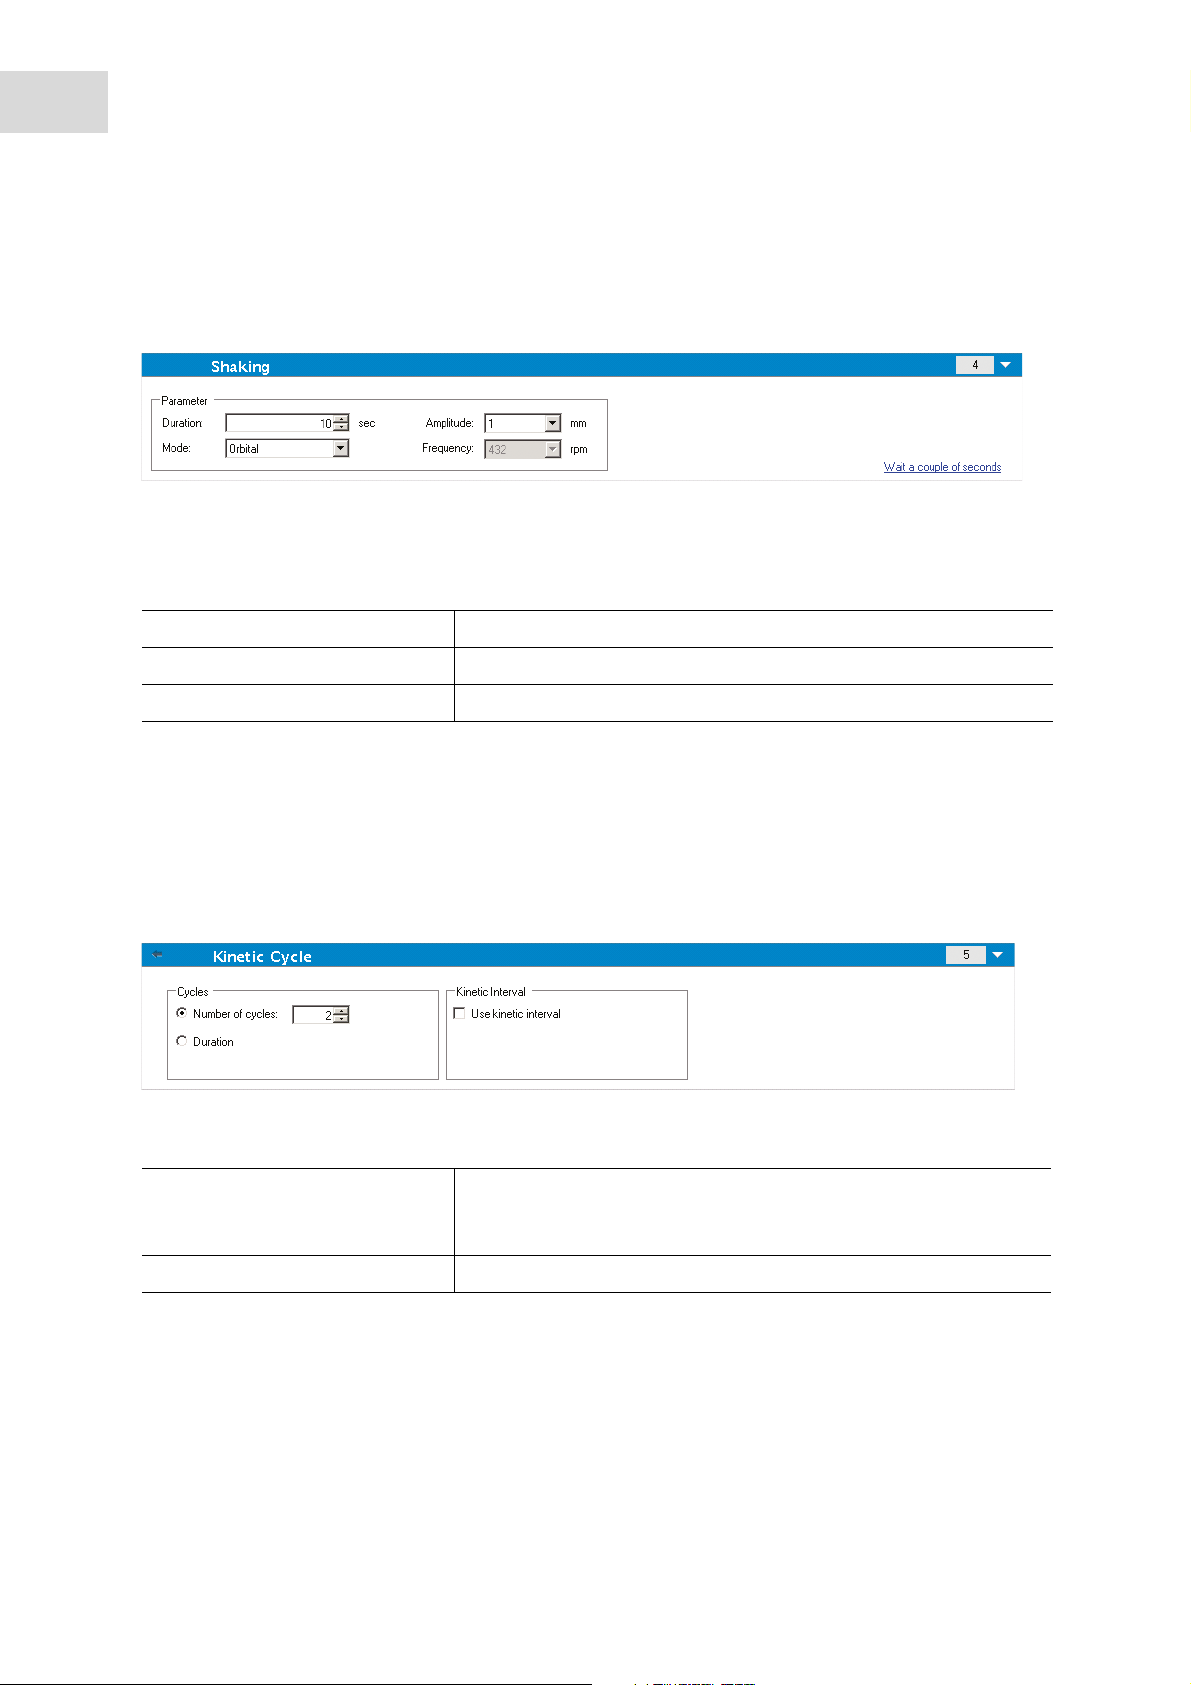
Shaking
1. Select the Shaking program element if the plate is to be shaken, either before the measurement or
between kinetic cycles.
2. Enter the respective parameters (see Parameter list).
3. Clicking the link Wait a couple of seconds inserts a new program element (see Miscellaneous on p. 21).
Tab. 4-1: Parameter list
Duration Enter the duration of the shaking process.
Mode Select between the options Linear and Orbital.
Amplitude Enter the required Amplitude value from the drop-down list.
4.2.4 Kinetic
Kinetic Cycle
Use the program element Kinetic Cycle to perform several consecutive measurements, which may be
executed in certain intervals.
1. Enter the respective parameters:
Cycles Number of cycles: Enter a number or click the up or down arrows for
the number of actual measurement steps (2 – 1000 cycles)
Duration: Enter the duration, format hh:mm:ss.
Kinetic Interval Use kinetic interval: Enter the time interval (hh:mm:ss or ms).
Plate-wise kinetic measurements
Each cycle of the kinetic measurement is performed on all selected wells. Plate-wise kinetic measurements
may contain a maximum of ten independent measurement stripes that do not need to be of the same
measurement type.
Page 21
®
Eppendorf
PlateReader AF2200
English (EN)
Well-wise kinetic measurements
All cycles of the kinetic measurement are first performed in one well before continuing to the next well.
Well-wise kinetic measurements may be composed of a maximum of four measurement stripes of the same
type, e.g., four absorbance stripes.
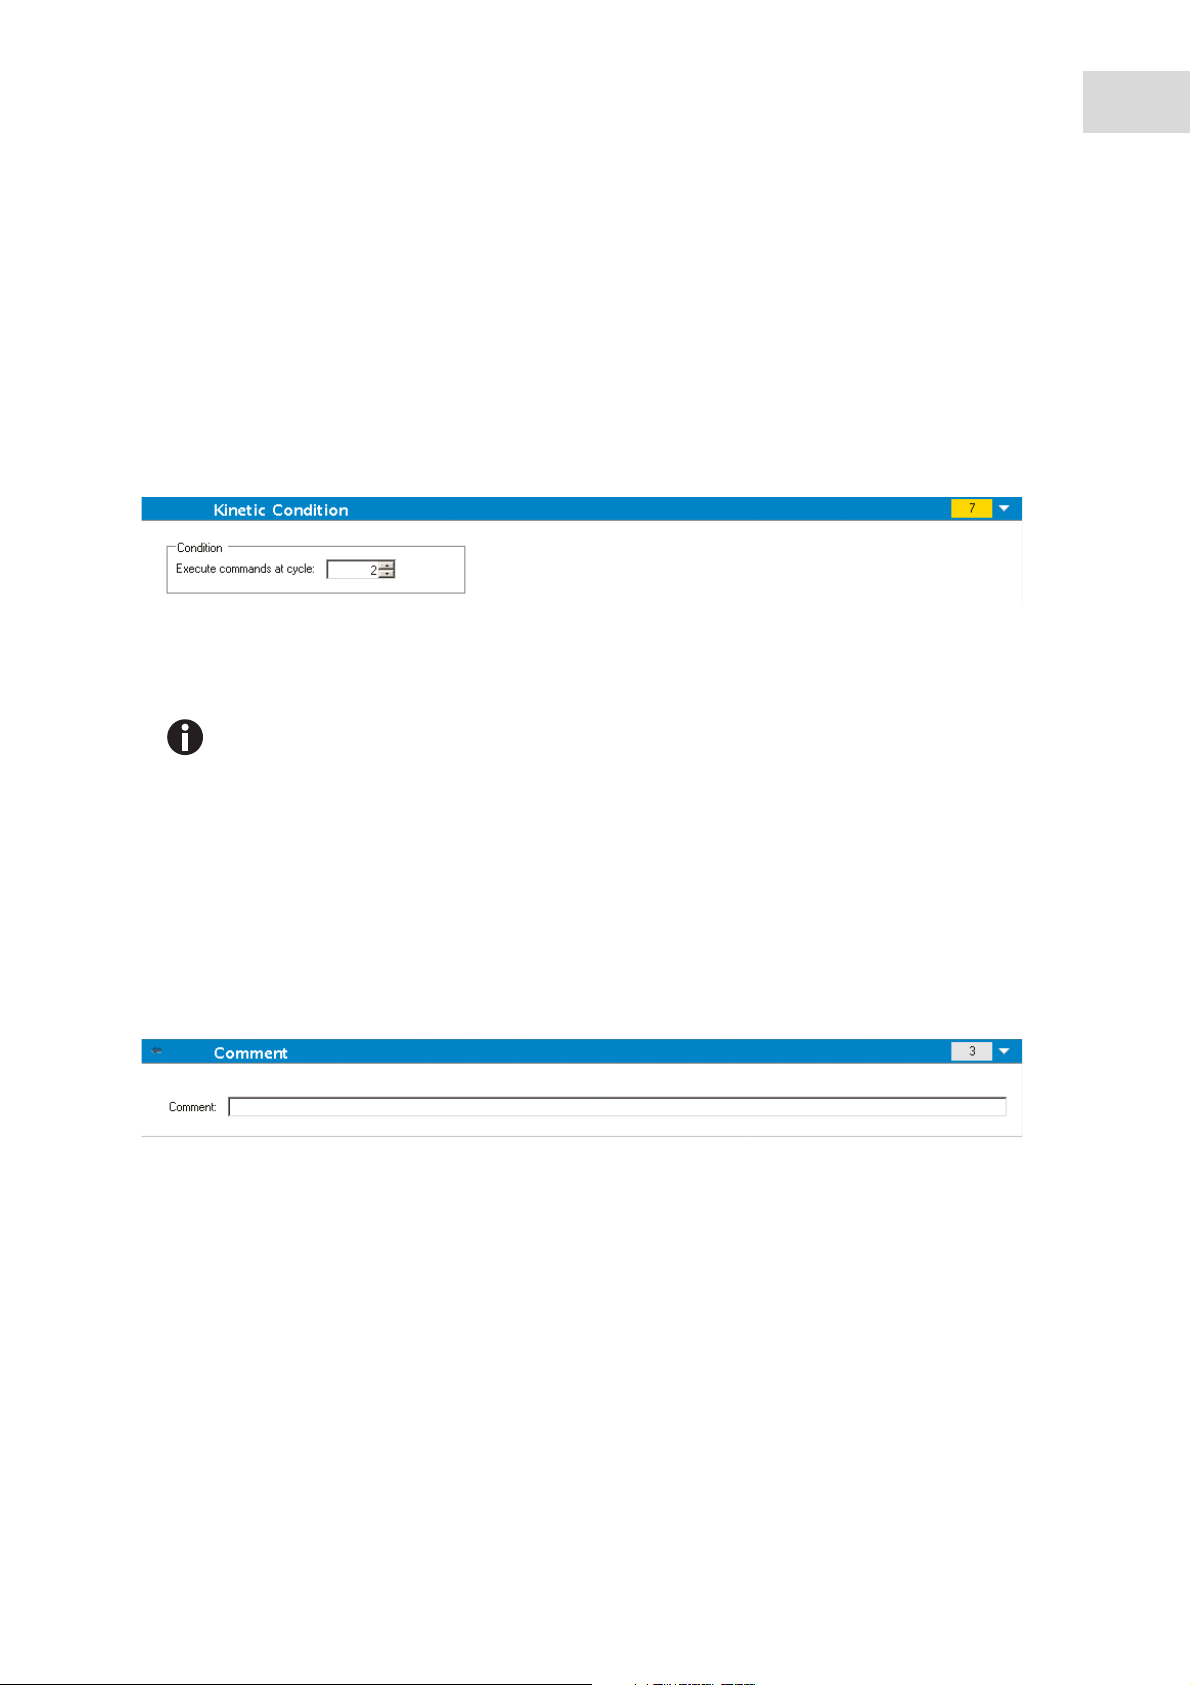
Kinetic Condition
Use the Kinetic Condition program element to define which actions should be executed at a certain cycle.
If 3 is entered for Execute command at cycle within a kinetic measurement containing, e.g. a Shake step,
shaking is performed only at cycle 3.
Overview
21
Kinetic conditions should be inserted right after a Kinetic Cycle program element in order to
ensure optimal result reproducibility.
Users are advised to set up suitable scripts prior to the measurements and to use the same
script for all similar kinetic measurements in order to obtain comparable results.
4.2.5 Miscellaneous
Comment
Use the program element Comment to enter a remark or statement for the current measurement in the text
field. This text is shown together with the measurement in the Excel output sheet.
Page 22
22
Overview
®
Eppendorf
PlateReader AF2200
English (EN)
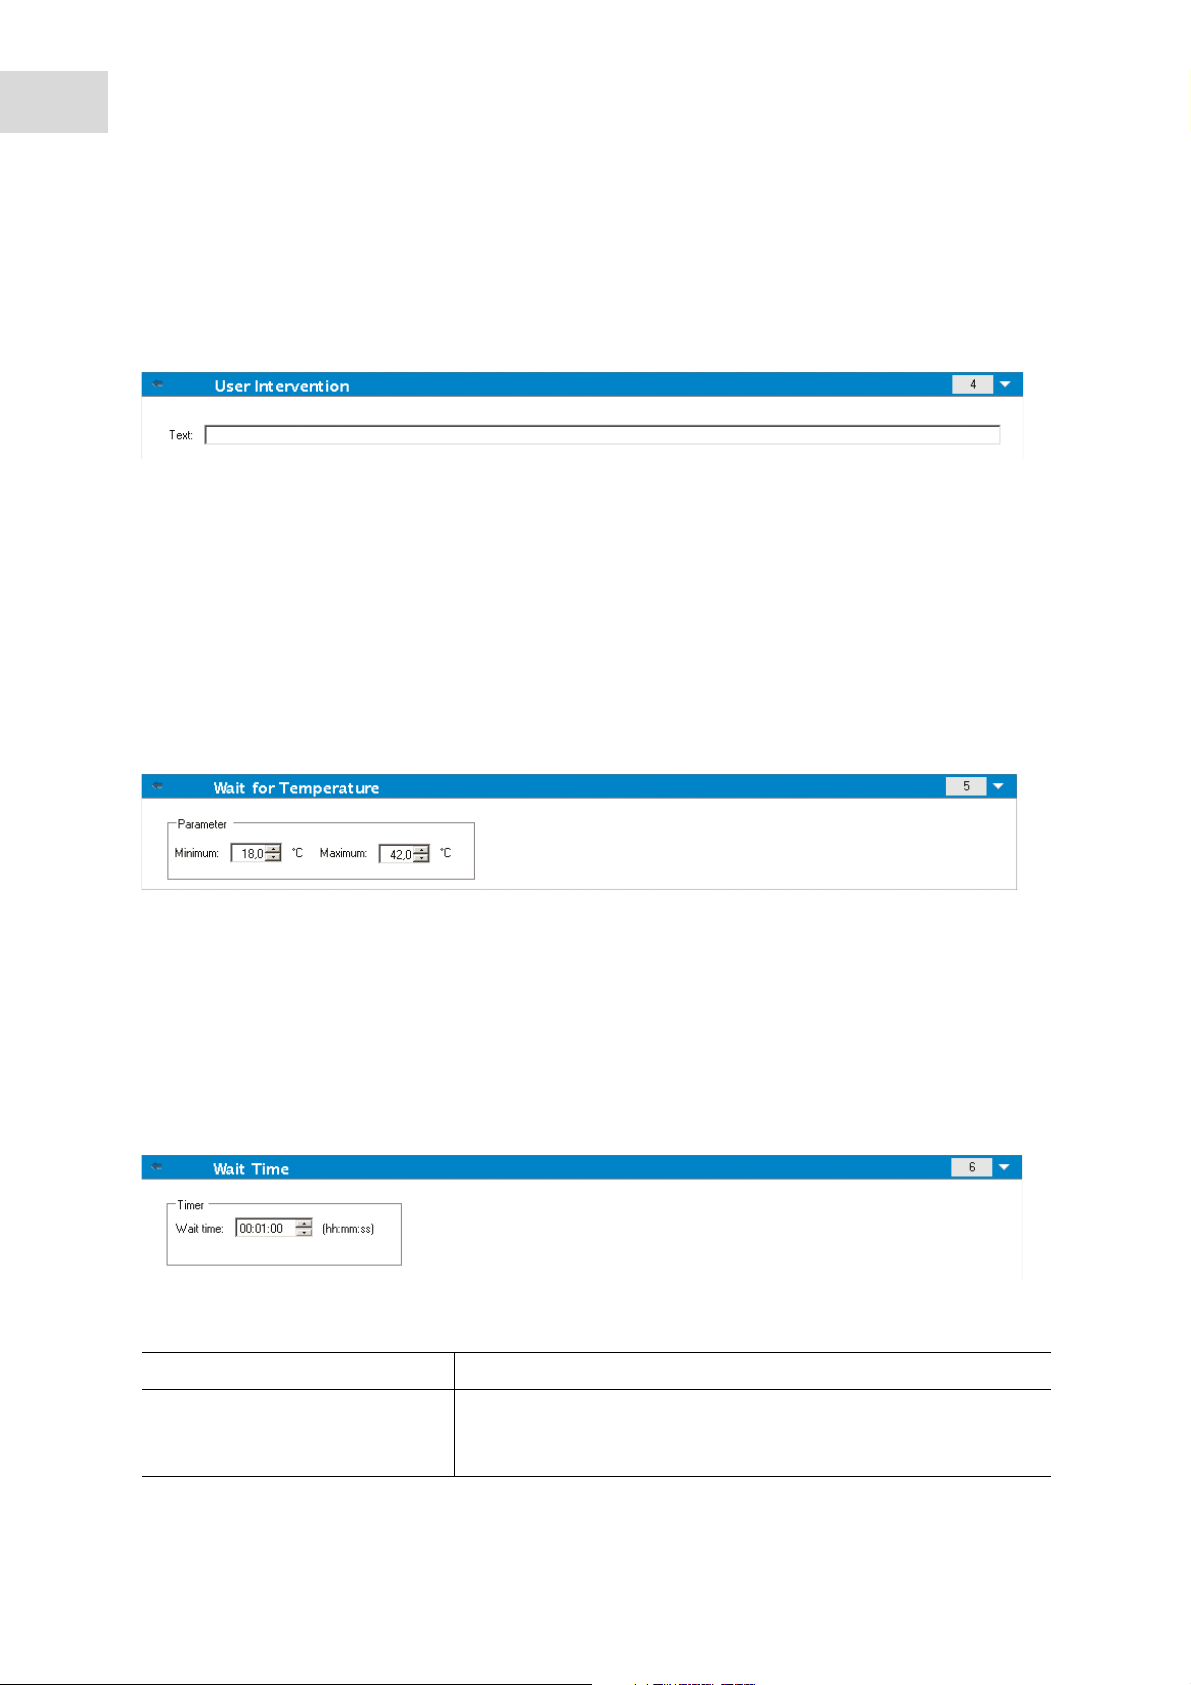
User Intervention
The User Intervention program element informs the operator of the instrument to execute a definite action
during the workflow at a certain time.
If for example the Move Plate program element is used to move the plate out to perform a certain action,
then the entered text should inform the operator to perform these actions. A dialog box shows the message
and the measurement process stops until OK is clicked.
If the plate should be moved in after pipetting for example, then the text Move Plate In informs the operator
to move the plate in after pipetting to continue the workflow.
Wait for Temperature
Use the program element Wait for Temperature to define a valid temperature range for the assay.
This is typically used after a Temperature program element
Wait Time
Use the Wait Time program element to define a certain waiting period before the next step within a
workflow is executed.
In the Wait time field enter the required time.
1. Enter the respective parameters:
Timer Enter the Wait time (hh:mm:ss)
Options Ignore wait at last kinetic cycle: When the program step Wait Time is
the last action within a kinetic run, the wait time will be ignored in
the last cycle.
Page 23

®
Eppendorf
PlateReader AF2200
English (EN)
Incubation
Incubation is always done at the heating position to ensure inside the instrument proper temperature
distribution.
Incubation can consist of shaking and waiting steps (up to 2 shaking steps and up to 2 waiting steps are
allowed in any combination).
The Remaining Wait step waits until the overall incubation time is over (including shaking and waiting
times).
The incubation program element is typically used to perform shaking and waiting at a certain temperature
for a certain time.
Overview
23
1. Enter the appropriate parameters for incubation:
Incubation time Enter the total time (min. 5 s)
Actions Available actions: Shaking, Wait Time
2 wait and 2 shaking actions are allowed. Select actions by
double-clicking or use the arrow keys.
Organize actions by using the up/down keys.
Remaining Wait Time: mandatory, cannot be deleted or edited
(duration 3 s)
Page 24
24
Overview
Eppendorf
English (EN)
®
PlateReader AF2200
4.3 Workflow Pane
The main window in the software is the Workflow pane, where the measurement script is visible and where
parameters are defined and edited.
There are two ways to insert a program element from the Explorer bar into the Workflow pane.
1. Select a program element from the Explorer bar; by double-clicking it, it is inserted into the Workflow
pane directly after the previous program element.
2. Click the program element in the Explorer bar and drag it into the Workflow pane to the respective
position.
The program elements are numbered according to their sequence.
Once a program element has been inserted into the Workflow pane, settings and parameters for this
element can be entered or edited.
Single program elements inside the Workflow pane can be collapsed to display the most important
information or expanded to access all editable functions.
3. Click one of the triangles next to the title of the program element, or , to switch between the two view
modes.
By default, the software starts with the Plate element in the Workflow pane. This can be modified in the
Settings menu > User Settings.
Currently selected program elements within the Workflow pane are displayed with a blue heading.
If a program element contains errors or is invalid within the current workflow, the element will
be flagged with an error mark and the number of the element is highlighted in red. In the
Status bar, the number of Errors appears in red. In the Info bar detailed information on the
error is displayed. If the workflow contains errors, the measurement script can neither be
saved nor started.
It is recommended to always save the workflow before starting a measurement. You can define this feature
as default in the Settings menu > User Settings > Options.
Select Save the script before it is started.
Page 25

®
Eppendorf
PlateReader AF2200
English (EN)
4.3.1 Hierarchy of Elements
The hierarchy of elements in the Workflow pane is as follows:
•Plate
•Pattern
•Well
Any desired measurement step can be inserted directly after a plate, a pattern or a well element.
Arrows placed on the left side of the program elements header to release or indent it.
Other elements from the Explorer bar can be inserted into the hierarchy of a workflow as follows:
Overview
25
The first Pattern element is inserted directly after the Plate element; then all subsequent Pattern elements
can be inserted.
Well elements can only be inserted directly after a Pattern or a Plate element.
Only measurement steps of the same mode (e.g. absorbance only with different wavelengths) are allowed
within one well element.
Kinetic steps are possible within a Plate, Pattern or Well element.
User Intervention, Comment, Wait Time and Wait until temperature is reached steps are possible within a
Plate, Pattern or Well element.
4.4 Info bar
The Info bar on the right side of the screen displays information that is relevant for the currently selected
program element. Any warnings and errors are shown.
Page 26

26
Overview
Eppendorf
English (EN)
®
PlateReader AF2200
4.5 Menu Bar
4.5.1 File Menu
New This command opens a new measurement workflow. If an empty
document is to be opened, you will be asked to save the current
workflow.
• Click Yes to save the current workflow.
• Click No to create a new workflow without saving the previous
one.
• Click Cancel to leave the dialog box.
Open This command opens an existing PlateReader AF2200 Software
workflow (*.mdfx) from the selected folder. If you want to open an
existing workflow while another one is still open, you will be asked if
you want to save the workflow.
• Click Yes to save the current workflow to a certain destination.
• Click No to create a new workflow without saving the previous
one.
• Click Cancel to leave the dialog box.
Open from Method By default this file is empty. The user could save Eppendorf
predefined methods in this file.
Open from Template Templates are predefined scripts that are similar to common
PlateReader AF2200 Software scripts, but contain some additional
information, e.g. a short description of the measurement parameters.
Templates may be assigned to distinct groups and may be annotated
individually.
The User settings dialog contains a checkbox that can be used to
open the Open from template dialog directly after starting the
software by default or hide it by default.
Open from Template
All templates are designed as example scripts for common applications.
It is the responsibility of the user to validate all parameters for the purpose of the particular
application before using a template.
Page 27

Properties
®
Eppendorf
PlateReader AF2200
Possibilty to save information for a script or a method.
Overview
27
English (EN)
Save This command saves the current script.
Save As… This command saves the current workflow under a different name.
List of most recently used script
files
A list of the most recently saved workflow files is displayed. Define
how many files are to be included in this list in the Settings menu >
User settings.
Exit This command exits and closes the program. If you are still
connected to an instrument, you will be asked if you want to
disconnect and to close the program.
• Click Yes if you want to exit or click No if you want to return to
the program.
4.5.2 Edit Menu
Cut This command cuts the selected program element, which can be
pasted again.
Copy This command copies the selected program element.
Paste This command pastes the selected program element.
Delete This command deletes the selected program element.
Release Strip This command releases the selected program element.
Indent Strip This command indents the selected program element.
Select All This command selects all program elements in the workflow pane.
Page 28

28
Overview
Eppendorf
English (EN)
®
PlateReader AF2200
4.5.3 View Menu
Status bar This command shows or hides the status bar (located at the bottom of
the window).
Collapse All This command collapses all program elements in the workflow pane
to view only one line of text.
Expand All This command expands all program elements in the workflow pane
to extended view and shows all visible parameters.
4.5.4 Instrument Menu
Disconnect / Connect This toggle command connects or disconnects an instrument to or
from the PlateReader AF2200 Software. To connect to an instrument
select the instrument name from the list.
Start This command starts the measurement process. If the measurement
is started, a small window informs that the measurement is in
progress. Excel opens automatically and the results are displayed in
a worksheet.
Movements
Plate: Move Plate in and out
Filterslide: Move Filter out
Page 29

®
Eppendorf
PlateReader AF2200
English (EN)
Heating This command is used to set the target temperature of the
instrument manually.
• Select or enter the Target temperature and click Set and On to
start instrument heating.
•Click the Read button to display the current temperature inside
the instrument or click the Auto check box to have it read
automatically.
•Click Off to stop heating.
• Click the down button to display the heating graph and
click the up button to hide it.
• Click the close button to exit the Heating dialog box.
Overview
29
Properties Select Properties to set a new alias name for the instrument.
Enter a new name in the New Alias field and click Set Alias to
confirm.
These settings take effect after restarting the software.
4.5.5 Settings Menu
Filter Definitions
Measurement Mode Select the appropriate filter position and enter the new wavelength,
bandwidth, and measurement mode for each new filter.
Choose from the dropdown list:
• FI for fluorescence intensity,
• ABS for absorbance measurements, and
• Empty for filter-free positions.
Wavelength Enter the filter wavelength.
For fluorescence intensity measurements, set the filter wavelength
within the allowed range of the instrument.
Absorbance filters are definable between 230 and 1000 nm
(Excitation only).
Bandwidth Enter the bandwidth (nm) of the filter.
Description This field can be used for individual user remarks about the filter,
e.g. filter name, application, etc.
Page 30

30
Overview
®
Eppendorf
PlateReader AF2200
English (EN)
Filter Definitions
Purchase Date This option enables the user to enter the purchase or installation
date of the filter.
Flash Counter The flash counter monitors the number of flashes through a filter.
The flash counter number provides the user only with additional
information about the filter in use.
• For a new filter, set the counter to 0.
• For a previously used filter, enter the last collected flash number
if the number is available.
The flash counter number is saved together with other information
about the filter on the filter slide microchip. If you replace a filter,
this information will be lost unless the last filter flash number is
manually documented by the user.
• Confirm the new filter values by clicking Save.
• Close the Filter Definition dialog and the system is ready to
perform measurements with the new filters.
Refer to the Operating Manual of the connected instrument for
further details and examples.
Page 31

®
Eppendorf
PlateReader AF2200
English (EN)
Plate Definition
This command allows you to choose a plate file from the drop-down list of available plates. The plate
definition files contain all relevant parameters of a specific plate type, e.g. coordinates of measurement
points, number of columns, number of rows, well form, well diameter, plate height, plate height with
cover…).
A graphic element at the bottom of the dialog visualizes the parameter which is currently defined.
Plate Definition Menu
Overview
31
Define a new Plate:
To create a custom plate definition file, you need the technical data of your plate. These are provided by the
manufacturer of the plate. Open the plate definition menu and choose one plate from the list as a template.
Enter general data, plate geometry data and well geometry data of the new plate.
Click Save As to save the selected plate definition as a *.pdfx-file.
Plate list (see Plate List on p. 36)
Page 32

32
Overview
®
Eppendorf
PlateReader AF2200
English (EN)
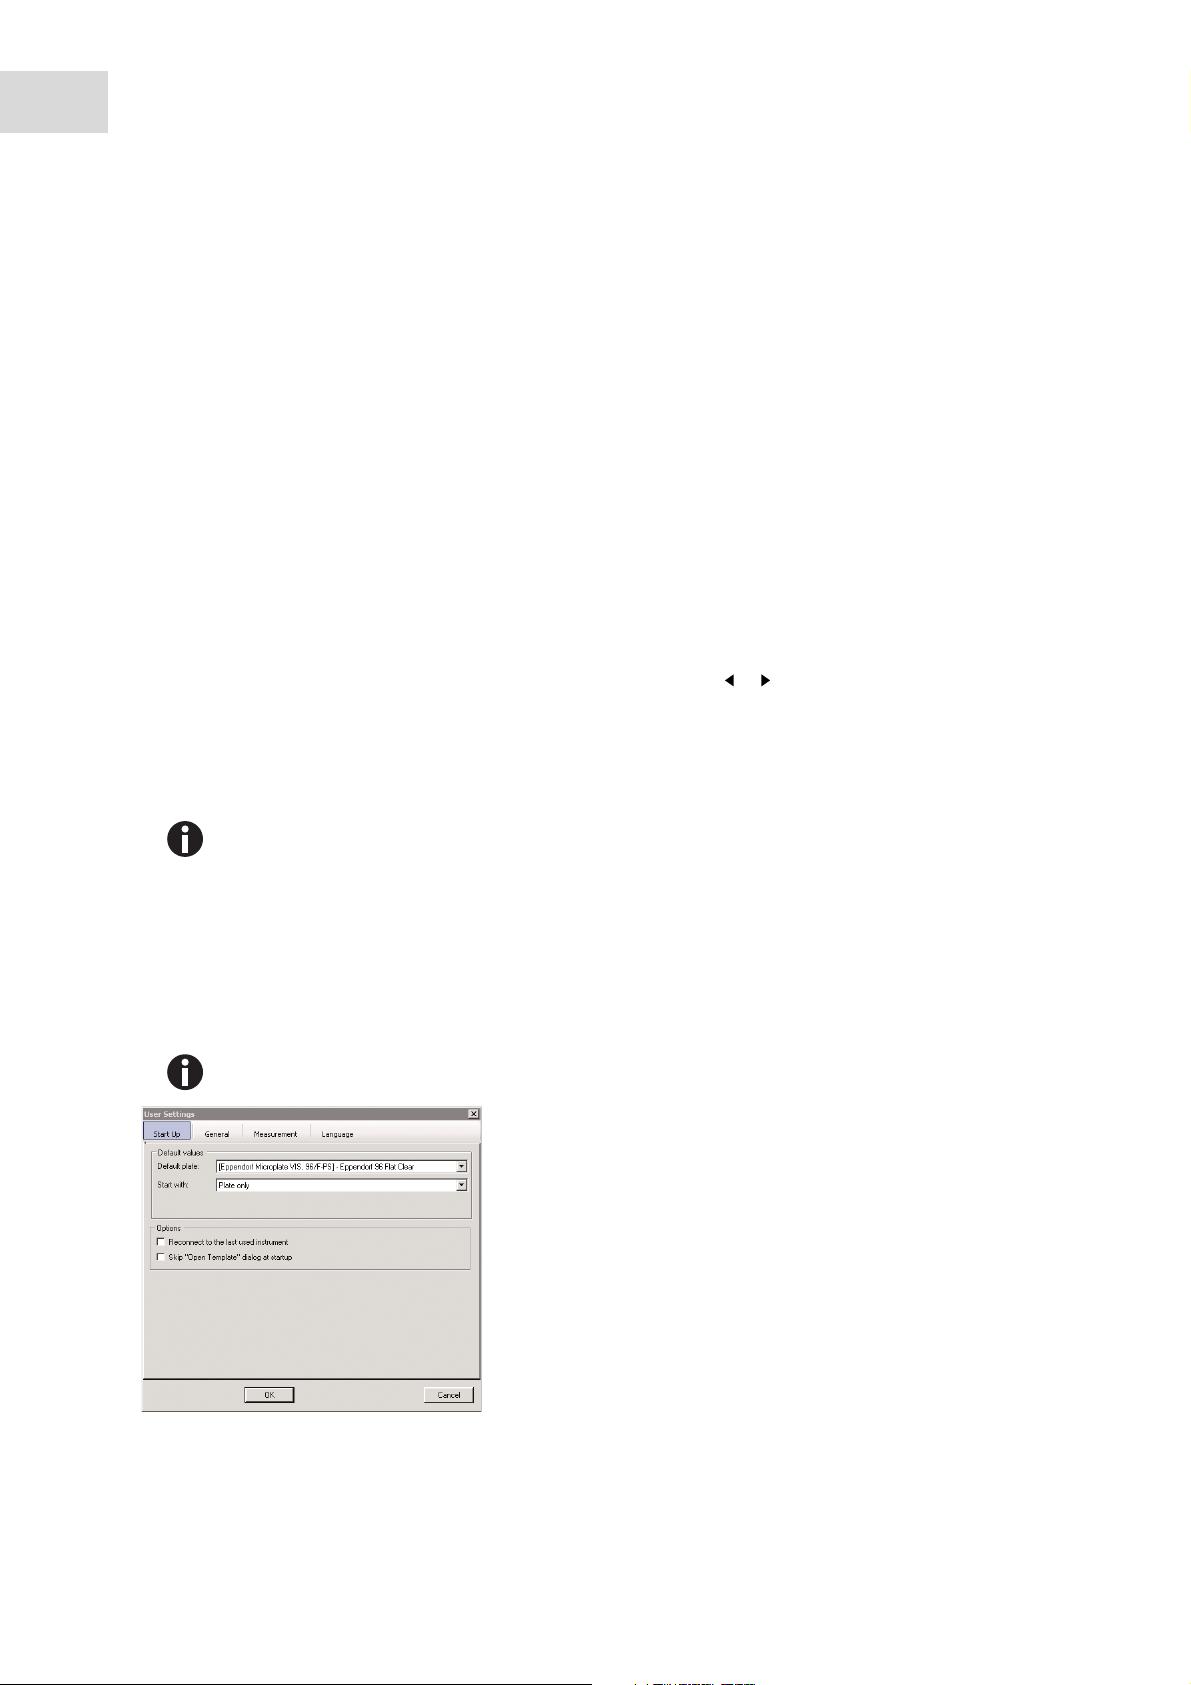
User Settings
User Settings - Tab Start Up
Behavior at start up can be set.
1. Select a default plate.
2. Determine if the workflow pane should start with an empty workflow, plate only, or plate and part of
plate.
3. Select whether the last used instrument should be reconnected
4. Select whether the Open Template dialog at startup should be skipped.
User Settings - Tab General
General options can be set.
1. Ask to save the workflow (when changed) before the measurement starts.
2. Determine if the software window should be minimized while the measurement is performed.
3. Determine the length of the list of recently used plate files (combo box for plate selection in the plate
program element).
4. Determine how many recently used workflow files are to be listed in the file menu.
User Settings - Tab Measurement
1. Certain measurement settings can be saved as default settings.
2. Absorbance: Select default number of flashes.
3. Fluorescence: Select default number of flashes and default value for manual gain.
4. Regressionskoefficient predefined methods: Set required value for R2.
Page 33

®
Eppendorf
PlateReader AF2200
English (EN)
User Settings - Tab Language
1. Select the language of the PlateReader AF2200 Software
2. Click OK to save your settings or click Cancel to leave the dialog box without saving any changes
Data Presentation
This command offers the following tabs to determine the output settings of the measured results in Excel.
Overview
33
Data Presentation - General
Destination: Select between New workbook, New worksheet, Use previous worksheet, Use existing
workbook or Use XML Output.
• If New workbook is selected, a new workbook is opened every time a measurement script is performed.
•If New worksheet is selected, a new worksheet of the existing workbook is created. If no workbook is
open a new one is created.
•If Use existing workbook is selected, a workbook and a worksheet must be selected. First select the
workbook (an Excel file), and then select the sheet the results should be placed into.
•If Use previous worksheet is selected, data are written in the same worksheet underneath the previous
measured data.
•If Use XML Output is selected, Data are put out in XML. You have to define the XML-path.
The default output of Eppendorf predefined methods is New Workbook. This cannot be
changed.
Page 34

34
Overview
®
Eppendorf
PlateReader AF2200
English (EN)
View Mode: Select between Matrix and List.
•If Matrix is selected, the data alignment corresponds to a microplate; times per well cannot be
displayed. Not relevant for kinetic result presentation.
•If List is selected, choose between: Align, Rotation, Display Times.
Show: Select between All and Measured.
•If All is selected, the whole plate geometry, including all possible rows and columns, is displayed.
•If Measured is selected, only the results of the measured wells are displayed.
Align: Select between A1A2 or A1B1.
•If A1A2 is selected, the results are arranged in rows (of the microplate).
•If A1B1 is selected, the results are arranged in columns (of the microplate).
Rotation: Select between Columnwise or Rowwise.
•If Columnwise is selected, the results are displayed in a column (in the Excel sheet).
•If Rowwise is selected, the results are displayed in a row (in the Excel sheet).
Display Times: Select between No time or Time per well.
If No Time is selected, only the values are displayed.
If Time per well is selected, a timespan for each value is displayed.
Data Presentation - Kinetic
Rotation: Select between Columnwise or Rowwise.
If Columnwise is selected, the results are displayed in a column (in the Excel sheet). •
If Rowwise is selected, the results are displayed in a row (in the Excel sheet).
Align: Select between A1A2 and A1B1.
If A1A2 is selected, the results are arranged in rows (of the microplate).
If A1B1 is selected, the results are arranged in columns (of the microplate).
Display Times: Select between Time per cycle and Time per well.
If Time per cycle
If Ti
me per well is selected, a timespan for every well is displayed.
is selected, a timespan per cycle is displayed.
Page 35

®
Eppendorf
PlateReader AF2200
English (EN)
Data Presentation - Eppendorf μPlate G 0.5
Show Raw Data: Select the Show Raw Data box to display the raw measurement values of a Nucleic Acid
Quantification measurement.
Exception History
The Exception History dialog box shows a list of exceptions (instrument errors, software failures) with date
and time.
Every time an exception occurs and an error box is displayed, all relevant information is collected and
saved in a zip-file. Each of these zip-files leads to an entry in this list.
Relevant information is: The error message and number, communication log-files and system information
(like operating system version, free amount of disc space).
Every entry (which corresponds with a zip-file) can be saved as a separate file to a user-defined location
using the floppy disc symbol at the lower left corner of the dialog box.
Overview
35
This information is helpful to the customer support or help desk to track problems.
Save Error Log
Warnings or Errors could be saved as logfiles.
Page 36

36
Overview
Eppendorf
English (EN)
®
PlateReader AF2200
4.6 Plate List
Order No. Manufacturer Number of
Wells
351155,
351156,
351157, 351158
351161,
351162,
351163, 351164
3631 Corning 96 Flat Black Clear Bottom
3880 Corning 96 Flat Black Half Area / Clear
3694 Corning 96 Flat Black Half Area
3679 Corning 96 Flat Clear Half Area / UV
3635 Corning 96 Flat Clear UV
3632 Corning 96 Flat White Clear Bottom
3883 Corning 96 Flat White Half Area / Clear
3693 Corning 96 Flat White Half Area
BD Falcon 24 Flat Clear/ Black FluoroBlok
BD Falcon 96 Flat Clear/ Black HTS FluoroBlok
Bottom Shape Color Additional
Information
Bottom
Bottom
3711 Corning 384 Flat Black Clear Bottom
3675 Corning 384 Flat Clear UV
3706 Corning 384 Flat White Clear Bottom
3335, 3506,
3516, 3471
3336, 3512,
3513
3337, 3524,
3526, 3527,
3473
3548 Corning 48 Flat Clear -
3650, 3915,
3916, 3925,
3991
Corning 6 Flat Clear -
Corning 12 Flat Clear -
Corning 24 Flat Clear -
Corning 96 Flat Black -
Page 37

Eppendorf
®
PlateReader AF2200
English (EN)
Overview
37
Order No. Manufacturer Number of
Bottom Shape Color Additional
Wells
2503, 2507,
Corning 96 Flat Clear 2509, 3300,
3361, 3370,
3474, 3585,
3590, 3591,
3595, 3598,
3599, 3628,
3641, 9017,
9018
3690, 3695,
Corning 96 Flat Clear Half Area
3696, 3697
3362, 3596,
Corning 96 Flat White 3600, 3912,
3917, 3922
3359, 3365 Corning 96 Round Clear -
3655, 3711 Corning 384 Flat Black -
3540, 3544,
Corning 384 Flat Black Low Volume
3820, 3821,
3821BC
Information
3640, 3680,
Corning 384 Flat Clear 3700, 3701,
3702
3576, 3653,
Corning 384 Flat White 3703
3824, 3824BC Corning 384 Flat White Low Volume
3677, 3676,
Corning 384 Round Black 3678
3673, 3674 Corning 384 Round White -
657 160, 657
Greiner 6 Flat Clear 185
665 180, 665
Greiner 12 Flat Clear 102
662 160, 662
Greiner 24 Flat Clear 102
677 180, 677
Greiner 48 Flat Clear 102
655 079, 655
Greiner 96 Flat Black Chimney
086, 655 077,
655 076
Page 38

38
Overview
Eppendorf
®
English (EN)
PlateReader AF2200
Order No. Manufacturer Number of
Wells
685 077, 675
Greiner 96 Flat Black Half Area
076, 675 097,
675 096
655 101, 655
Greiner 96 Flat Clear 161
675 161, 675
Greiner 96 Flat Clear Half Area
101, 675 801
655 073, 655
Greiner 96 Flat White Chimney
083, 655 074,
655 075
675 074, 675
Greiner 96 Flat White Half Area
075, 675 094,
675 095
650 101, 650
Greiner 96 U Clear 161, 650 160,
650 180, 650
185
651 101, 651
Greiner 96 V Clear 161, 651 160,
651 180
Bottom Shape Color Additional
Information
781 079, 781
Greiner 384 Flat Black 086, 781 077,
781 076, 781
094, 781 095
781 062, 781
Greiner 384 Flat Clear 101, 781 162,
781 185, 781
186, 781 165,
781 182
781 073, 781
Greiner 384 Flat White 080, 781 074,
781 075, 781
097, 781 096
784 209 Greiner 384 V Black Small Volume
784 201 Greiner 384 V Clear Small Volume
784 207 Greiner 384 V White Small Volume
96000014,
96110024
96000024,
96120096
Greiner 24 Flat Black Lumox
Multiwell
Greiner 96 Flat Black Lumox
Multiwell
Page 39

Eppendorf
®
PlateReader AF2200
English (EN)
Overview
39
Order No. Manufacturer Number of
Wells
96000034,
Greiner 384 Flat Black Lumox
96130384
137 101, 137
Nunclon 96 Flat Black 103, 237 105,
237 107, 237
108, 437 111,
437 112
137 101, 137
Nunclon 96 Flat Black Luminunc
103, 237 105,
237 107, 237
108, 437 111,
437 112
439 454, 442
Nunclon 96 Flat Clear 404, 475 094,
269 620, 269
787
136 101, 136
Nunclon 96 Flat White 102, 236 105,
236 107, 236
108, 436 110,
436 111
Bottom Shape Color Additional
Information
Multiwell
FluoroNunc
136 101, 136
Nunclon 96 Flat White Luminunc
102, 236 105,
236 107, 236
108, 436 110,
436 111
143 761, 163
Nunclon 96 U Clear 320, 262 170,
262 162, 475
434, 449 824
264 556, 164
Nunclon 384 Flat Black 564, 460 518
242 765, 242
Nunclon 384 Flat Clear 757, 164 688,
464 718, 265
196
264 572, 164
Nunclon 384 Flat White 610, 460 372
0030 601.700 Eppendorf 96 Flat Black -
0030 601.807 Eppendorf 96 U Black -
0030 601.904 Eppendorf 96 V Black -
FluoroNunc
Page 40

40
Overview
Eppendorf
®
English (EN)
PlateReader AF2200
Order No. Manufacturer Number of
Wells
Bottom Shape Color Additional
Information
0030 621.905 Eppendorf 384 V Black -
0030 601.475 Eppendorf 96 Flat White -
0030 601.572 Eppendorf 96 U White -
0030 601.670 Eppendorf 96 V White -
0030 621.670 Eppendorf 384 V White -
0030 730.020 Eppendorf 96 F Clear VIS
0030 741.048 Eppendorf 96 F Clear UV-VIS
0030 730.119 Eppendorf 96 F Clear Cell Culture
0030 741.013 Eppendorf 96 F Black Clear Bottom,
CellCulture
0030 128.800 Eppendorf 96 V Black Wells twin.tec PCR
0030 128.818 Eppendorf 384 V Black Wells twin.tec PCR
0030 132505 Eppendorf 96 V White Wells twin.tec PCR
0030 132.734 Eppendorf 384 V White Wells twin.tec PCR
Page 41

Defining measurements
®
Eppendorf
PlateReader AF2200
English (EN)
5 Defining measurements
The following chapter describes some examples to illustrate the definition of different measurements.
5.1 Plate Size – Pattern
1. Use the Plate program element in the workflow pane to choose a plate format.
2. Select the desired plate format from the Plate definition drop-down list (e.g. Eppendorf 96 Flat Clear
UV-VIS)
3. To measure a particular well or a range of wells on the plate click the link Pattern.
4. In the Pattern program element click the desired well or drag a frame over the range of desired wells
(e.g. A1 to E6). The selected wells are displayed in blue; unselected appear in grey.
41
Wells can be selected by dragging a frame over the plate. Further ranges can be selected by holding
down the Ctrl key on the keyboard and dragging another frame around the wells to be selected.
5. By clicking on Zoom the plate is zoomed in; well selection can be done also in the zoomed window.
Page 42

42
Defining measurements
Eppendorf
English (EN)
®
PlateReader AF2200
5.2 Defining Endpoint Measurements
The following example describes an Absorbance Endpoint Measurement in all wells of a 96 well plate.
Select a 96 well plate (e.g. Eppendorf 96 Flat Clear UV-VIS) from the Plate definition drop-down list. If
the Pattern program element is not visible, click the link Pattern. It is recommended to use the Pattern
program element in every workflow, even if all wells are measured.
Double-click the Absorbance program element from the Explorer bar, and define the Workflow as
follows:
• Wavelength/Measurement: 462 nm
•Read/Number of reads/flashes: 25 (per well)
• Settle time (time between moving the plate and starting the measurement): 0 ms
Page 43

Defining measurements
®
Eppendorf
PlateReader AF2200
English (EN)
If the plate shall be moved out of the instrument after measurement, insert a Move Plate program
element and select the Out radio button.
43
If a Move Plate program element is not defined after the measurement, the plate will stay inside the
instrument until Move Plate Out is clicked.
After finishing the definition as described above start the measurement by clicking the Start button on
the right side beneath the Info bar.
When clicking the Start button, Excel opens automatically and the results are displayed in a worksheet.
Page 44

44
Defining measurements
Eppendorf
English (EN)
®
PlateReader AF2200
5.3 Defining Multimode Measurements
Multimode measurements are measurements with multiple consecutive reading modes, e.g. with multiple
absorbance and fluorescence measurements or with mixed measurements.
The following example describes the definition of a Multimode measurement in a 96 well plate.
Measurement 1 – Absorbance 462 nm in all wells
1. Select a 96 well plate (e.g. Eppendorf 96 Flat Clear UV-VIS) from the Plate definition drop-down list.
2. Select all wells in the Pattern.
3. Insert the Absorbance program element from the Explorer bar, and define as follows:
• Wavelength/Measurement: 462 nm
• Read/Number of reads: 25
Page 45

Defining measurements
®
Eppendorf
PlateReader AF2200
English (EN)
Measurement 2 – Fluorescence 485/535 nm in all wells
1. Insert the Fluorescence Intensity program element from the Explorer bar and define as follows:
• Wavelength/Excitation: 485 nm
• Wavelength/Emission: 535 nm
• Read/Number of reads: 25
•Gain: Optimal
45
Page 46

46
Defining measurements
®
Eppendorf
PlateReader AF2200
English (EN)
Measurement 3 – Fluorescence 360/465 nm in all wells
1. Insert a second Fluorescence Intensity program element from the Explorer bar and define as follows:
• Wavelength/Excitation: 360 nm
• Wavelength/Emission: 465 nm
• Read/Number of reads: 25
•Gain: Optimal
2. After finishing the definition as described above start the measurement by clicking the Start button on
the right side beneath the Info bar.
When clicking the Start button, Excel opens automatically and the raw data are displayed in a
worksheet.
Page 47

Defining measurements
®
Eppendorf
PlateReader AF2200
English (EN)
5.4 Defining Kinetic Measurements
The following example describes a kinetic measurement of a 96 well plate.
Select the 96 well plate (e.g. Eppendorf 96 Flat Clear UV-VIS) from the Plate definition drop-down list,
and select all wells in the Pattern program element.
47
Double-click the Kinetic Cycle program element and define as follows:
• Cycles/Number of cycles: 50
• Kinetic Interval (intervals between measurements): Select Use kinetic interval and enter: 2 minutes
30 seconds.
Double-click the Absorbance program element and define as follows:
• Wavelength/Measurement: 462 nm
• Read/Number of reads: 25
Page 48

48
Defining measurements
®
Eppendorf
PlateReader AF2200
English (EN)
After finishing the definition as described above start the measurement by clicking the Start button on
the right side beneath the Info bar.
When clicking the Start button, Excel opens automatically and the raw data are displayed in a
worksheet.
Page 49

Defining measurements
®
Eppendorf
PlateReader AF2200
English (EN)
5.5 Indenting and Releasing Program Elements
The decision to indent or release a program element will modify the workflow of the instrument during
measurements.
The actions of all program elements with the same indentation are performed sequentially. The only
dependence between these program elements is that the next action starts directly after the previous action
is finished.
A program element that is indented more than the previous program element shows dependence between
the two program elements. This means the parameters defined in the first program element are also active
for the second (indented) program element.
The following is an example of how to define a Multimode kinetic with two Absorbance measurements. The
example shows that the two Absorbance program elements depend on the Kinetic Cycle program element,
which depends on the Pattern program element, which depends on the Plate program element.
49
Define the parameters for an example as follows:
• Plate: 96 well plate, e.g. Eppendorf 96 Flat Clear UV-VIS
• Kinetik Cycle/Number of cycles: 50
• Absorbance/Wavelength: 260 nm
•Number of reads: 25
• Measurement Name: 260
• Second Absorbance/Wavelength: 280 nm
•Number of reads: 25
• Measurement Name: 280
Page 50

50
Defining measurements
®
Eppendorf
PlateReader AF2200
English (EN)
The Workflow pane appears as shown in the screenshot.
The above definition results in the following workflow.
The Absorbance of all wells of a 96 well plate is first measured at 260 nm and then at 280 nm. Both
Absorbance measurements are performed in 5 kinetic cycles.
Indenting the second Absorbance program elements on a level with Kinetic Cycle item changes the
workflow.
Select the second Absorbance program element and click on the arrow in the left side of the program
element header.
Page 51

Defining measurements
Eppendorf
®
PlateReader AF2200
English (EN)
51
In this workflow, an Absorbance Kinetic measurement with 5 cycles is done first at 260 nm; finished this
loop, Absorbance Endpoint measurement at 280 nm is performed.
Ways to Indent or Release Script Elements
Select a program element from the Workflow pane.
Click Edit and Indent Stripe/Release Stripe
Use the arrow buttons in the header of the program element to release or indent the selected element.
Click the right mouse button and click Release or Indent.
Page 52

52
Defining measurements
®
Eppendorf
PlateReader AF2200
English (EN)
Page 53

Predefined methods
®
Eppendorf
PlateReader AF2200
English (EN)
6 Predefined methods
6.1 Method selection
Frequently-used methods in molecular and cell biology are provided as predefined methods. To load a
method, select the required method from the upper left "Methods" section of the Explorer bar either by
double-clicking the method or by dragging and dropping the method into the Workflow pane.
Abb. 6-1: Overview of predefined methods
53
Fig. 6-1: Overview of predefined methods
The following predefined methods are provided:
Nucleic acid quantification
• UV 260 nm microvolume
• UV 260 nm with factor
• UV 260 nm with standards
• Fluorescence 485/535 nm with standards
Protein quantification
• BCA 562 (600) nm with standards
• Bradford 595 (600) nm with standards
• Lowry 750 (600) nm with standards
• Nano Orange 485/595 nm with standards
Cell viability
• CellTiter-Blue Assay
• Apo-ONE Caspase-3/7 Assay
Page 54

54
Predefined methods
Eppendorf
English (EN)
®
PlateReader AF2200
6.2 Method description
6.2.1 Nucleic acid quantification (UV 260 nm microvolume)
This method is restricted to the Eppendorf μPlate G0.5.
For microvolume measurements with the μPlate G0.5 please refer to the dedicated manual.
6.2.2 Nucleic acid quantification (UV 260 nm with factor)
Introduction
The most common technique for measuring nucleic acid concentration is based on measuring the
absorbance at 260 nm. According to the Lambert-Beer law, the amount of absorbed light is proportional to
the concentration of the sample and to the path length of the light passing through a sample.
A = ε * d * c
AAbsorbance, OD
ε Extinction Coefficient
d Distance (path length in cm)
c Concentration
Wavelength 260 nm
Sample Type dsDNA ssDNA RNA
average extinction
coefficient ε [μg/mL]
concentration [μg/ml] at
A =1,0 and d = 1,0
For the Eppendorf Microplate UV-VIS, 96/F the path lengths of 100, 150, 200, 250 and 300 μL per well have
been determined. Thus, the nucleic acid concentration can easily be calculated.
To assess the purity of the nucleic acid sample, an additional "Ratio" measurement at 280 nm may be
performed to indicate the presence of proteins or organic compounds in the sample. For pure DNA, a 260/
280 ratio between 1.8 - 1.9 is acceptable; for pure RNA, a 260/280 ratio of approximately 2.0 is acceptable.
0,02 0,027 0,025
50 33 40
Page 55

Predefined methods
®
Eppendorf
PlateReader AF2200
English (EN)
Default measurement parameters
• Measurement wavelength: 260 (5) nm
• Ratio wavelength (for purity check with 260/280 ratio): 280 (5) nm, optional
• Background wavelength (for correction of turbidity): 340 (10) nm, optional
•Number of flashes: 25
• Settle time: 0 ms
• Plate definition: Eppendorf Microplate UV-VIS, 96/F
The method is restricted to Eppendorf Microplate UV-VIS, 96/F. The pathlengths are
determined for aquaeus buffer. For accurate results the meniscus of the sample has to be flat.
This method does not work for samples solved or diluted in detergent.
User defined method parameters
• The measurement is performed at 260 nm with default measurement parameters.
• For a ratio measurement, select the Ratio wavelength 280 nm check box.
• For a background measurement, select the Background wavelength 340 nm check box.
• Ratio wavelength and background wavelength may also be combined.
• Define the number of blank replicates (possible number: 1–8).
• Define the number of samples (max. 95, depends on number of blank replicates).
• Select the type of sample under Sample type (possible selection: dsDNA, ssDNA, RNA).
• Select your sample volume under Sample volume (possible selection: 100; 150; 200; 250; 300 μL).
• Define the unit (possible selection: μg/mL or ng/μL).
• Check if entered parameters are correct.
• Required plate layout: Pipette in a vertical order, starting with blanks at position A1. Samples are
pipetted in subsequent wells.
• Press Start.
• For method results and data evaluation principle see chapter method results and evaluation procedure.
55
Page 56

56
Predefined methods
®
Eppendorf
PlateReader AF2200
English (EN)
Plate layout
Abb. 6-2: Method strip: Nuclei c acid quantif ication (UV 2 60 nm with fac tor)
Fig. 6-2: Method strip: Nucleic acid quantification (UV 260 nm with factor)
The selected number of blanks and samples are shown in the plate view on the right side of the method
strip.
6.2.3 Nucleic acid quantification (UV 260 nm with standards)
Introduction
The most common technique for determining the concentration of a nucleic acid sample is based on
measuring the absorbance at 260 nm. By using two or more nucleic acid standards of known
concentrations, the nucleic acid concentrations of unknown samples can be obtained.
Default measurement parameters
• Measurement wavelength: 260 (5) nm
•Number of flashes: 25
• Settle time: 0 ms
• Plate definition: Eppendorf Microplate UV-VIS, 96/F or comparable plates
The method is restricted to 96-well UV transparent microplates.
Page 57

Predefined methods
®
Eppendorf
PlateReader AF2200
English (EN)
User defined method parameters
• The measurement is performed at 260 nm with default measurement parameters.
• Define the number of blank replicates (possible number: 1 – 8).
• Define the number of standards (possible number: 2 – 12).
• Define number of standard replicates (possible number: 1 – 8).
• Define the concentrations of each standard (Press triangle button to open the menu).
• Define the number of samples (max. 93, depends on number of blanks and standards).
• Define the unit of your concentration.
• Check if entered parameters are correct.
• Required plate layout: Pipette in a vertical order, starting with blanks at position A1. Standards are
pipetted in subsequent wells, samples must be placed in the following wells.
• Press Start.
• For method results and data evaluation principle see chapter method results and evaluation procedure
57
Page 58

58
Predefined methods
®
Eppendorf
PlateReader AF2200
English (EN)
Plate layout
Abb. 6-3: Method strip: Nucleic acid quantification (UV 260 nm with standards)
Fig. 6-3: Method strip: Nucleic acid quantification (UV 260 nm with standards)
The selected number of blanks, standards and samples are shown in the plate view on the right side of the
method strip.
Page 59

Predefined methods
®
Eppendorf
PlateReader AF2200
English (EN)
6.2.4 Nucleic acid quantification (Fluorescence 485/535 nm with standards)
Introduction
PicoGreen is a highly sensitive fluorescent nucleic acid stain for the quantitation of double-stranded
(ds)DNA in solution. The measured fluorescence intensity signal is directly proportional to the amount of
dsDNA present in the sample.
RiboGreen is one of the most sensitive stains for the detection and quantitation of RNA in solution. The
measured fluorescence intensity signal is directly proportional to the amount of RNA present in the sample.
By using two or more nucleic acid standards of known concentrations, the nucleic acid concentrations of
unknown samples can be obtained.
Default measurement parameters
• Excitation wavelength: 485 (20) nm
• Emission wavelength: 535 (25) nm
•Number of flashes: 25
• Settle time: 0 ms
•Mode: Top
• Lag time: 0 μs
• Integration: 20 μs
• Gain: ‘optimal’
• Plate definition: Eppendorf Microplate 96/U-PP, black or comparable plates
59
The method is restricted to 96-well microplates.
User defined method parameters
• The measurement is performed at 485/535 nm with default measurement parameters.
• Define the number of blank replicates (possible number: 1 – 8).
• Define the number of standards (possible number: 2 – 12).
• Define number of standard replicates (possible number: 1 – 8).
• Define the concentrations of each standard (Press triangle button to open the menu).
• Define the number of samples (max. 93, depends on number of blanks and standards).
• Define the unit of your concentration.
• Check if entered parameters are correct.
• Required plate layout: Pipette in a vertical order, starting with blanks at position A1. Standards are
pipetted in subsequent wells, samples must be placed in the following wells.
• Press Start.
• For method results and data evaluation principle see chapter method results and evaluation procedure.
Page 60

60
Predefined methods
®
Eppendorf
PlateReader AF2200
English (EN)
Plate layout
Abb. 6-4: Method strip: Nu cleic acid quantif ication (Fluorescence 485/535 nm with st andards)
Fig. 6-4: Method strip: Nucleic acid quantification (Fluorescence 485/535 nm with standards)
The selected number of blanks, standards and samples are shown in the plate view on the right side of the
method strip.
Page 61

Predefined methods
®
Eppendorf
PlateReader AF2200
English (EN)
6.2.5 Protein quantification BCA, Bradford, Lowry
BCA 562 (600) nm with standards, Bradford 595 (600) nm with standards, Lowry 750 (600) nm with
standards
Introduction
The BCA Protein Assay uses bicinchoninic acid (BCA) for colorimetric quantification of total protein in a
sample. The method is based on the reduction of Cu2+ to Cu1+ by protein in an alkaline medium. Cu1+
complexes with BCA, forming a colored water-soluble chelate with an absorption maximum at 562 nm.
The Bradford assay is a colorimetric assay based on an absorbance shift of the Coomassie Brilliant Blue
G-250 dye. Under acidic conditions, the green form of the dye is converted into its blue form, which binds
to the protein being assayed. In this process, the absorbance maximum of the dye is shifted from 465 nm to
595 nm.
The Lowry Assay is a colorimetric assay for the quantification of soluble protein. The protein complexes
with cupric sulfate and tartrate in an alkaline solution and reduces the Folin-Ciocalteu reagent. The reaction
product is blue-colored and water-soluble, with an absorption maximum between 500 and 800 nm.
61
By using two or more protein standards of known concentrations, the protein concentrations of unknown
samples can be obtained.
Using the Eppendorf preconfigured UV/Vis filter slide these methods are measured at 600nm.
As for BCA the absorbance at 600nm is merely half as big as in the BCA absorbance maximum
at 562nm the results of the lower concentrations are slightly inaccurate in comparison to a
measurement at 562nm. The absorbance maxima of Lowry and Bradford are close to 600nm.
Therefore the results of these methods are not restricted by a measurement wavelength of
600nm.
Default measurement parameters
• Measurement wavelength BCA: 562 (600) (10) nm
• Measurement wavelength Bradford: 595 (600) (10) nm
• Measurement wavelength Lowry: 750 (600) (10) nm
•Number of flashes: 25
• Settle time: 0 ms
• Plate definition: Eppendorf Microplate VIS, 96/F-PS or comparable plates
The method is restricted to transparent 96-well microplates.
Page 62

62
Predefined methods
®
Eppendorf
PlateReader AF2200
English (EN)
User defined method parameters
• Using the predefined UV/Vis filter slide the measurement is performed at 600 nm with default
measurement parameters.
• Define the number of blank replicates (possible number: 1 – 8).
• Define the number of standards (possible number: 2 – 12).
• Define number of standard replicates (possible number: 1 – 8).
• Define the concentrations of each standard (Press triangle button to open the menu).
• Define the number of samples (max. 93, depends on number of blanks and standards).
• Define the unit of your concentration.
• Check if entered parameters are correct.
• Required plate layout: Pipette in a vertical order, starting with blanks at position A1. Standards are
pipetted in subsequent wells, samples must be placed in the following wells.
• Press Start.
• For method results and data evaluation principle see chapter method results and evaluation procedure.
Plate layout
Abb. 6-5: Method strip: Protein quant ification (BCA 562 (600) nm wit h standards)
Fig. 6-5: Method strip: Protein quantification (BCA 562 (600) nm with standards)
The selected number of blanks, standards and samples are shown in the plate view.
Page 63

Predefined methods
®
Eppendorf
PlateReader AF2200
English (EN)
6.2.6 Protein quantification (NanoOrange 485/595 nm with standards)
Introduction
NanoOrange (Molecular Probes) is a highly sensitive fluorescent stain for protein quantification in solution.
The reagent is virtually non-fluorescent in aqueous solution, but when bound to proteins undergoes a
strong fluorescence enhancement with a broad excitation peak centered at app. 470 nm and a broad
emission peak centered at app. 570 nm.
By using three or more protein standards of known concentrations, the protein concentrations of unknown
samples can be obtained.
Default measurement parameters
• Excitation wavelength: 485 (20) nm
• Emission wavelength: 595 (25) nm
•Number of flashes: 25
• Settle time: 0 ms
•Mode: Top
• Lag time: 0 μs
• Integration: 20 μs
• Gain: "optimal"
• Plate definition: Eppendorf Microplate 96/U-PP, black" or comparable plates
63
The method is restricted to 96-well microplates.
User defined method parameters
• The measurement is performed at 485 / 595 nm with default method parameters.
• Define the number of blank replicates (possible number: 1 – 8).
• Define the number of standards (possible number: 3 – 12).
• Define number of standard replicates (possible number: 1 – 8).
• Define the concentrations of each standard (Press triangle button to open the menu).
• Define the number of samples (max. 92, depends on number of blanks and standards).
• Define the unit of your concentration.
• Check if entered parameters are correct.
• Required plate layout: Pipette in a vertical order, starting with blanks at position A1. Standards are
pipetted in subsequent wells, samples must be placed in the following wells.
• Press Start.
• For method results and data evaluation principle see chapter method results and evaluation procedure.
Page 64

64
Predefined methods
®
Eppendorf
PlateReader AF2200
English (EN)
Plate layout
Abb. 6-6: Method strip: Pr otein quantificatio n (NanoOrange 485/59 5 nm with standard s)
Fig. 6-6: Method strip: Protein quantification (NanoOrange 485/595 nm with standards)
The selected number of blanks, standards and samples are shown in the plate view on the right side of the
method strip.
Page 65

Predefined methods
®
Eppendorf
PlateReader AF2200
English (EN)
6.2.7 Cell viability (CellTiter-Blue Assay)
Introduction
The CellTiter-Blue Cell Viability Assay provides a homogeneous, fluorometric method for monitoring cell
viability. The assay is based on the ability of living cells to convert a redox dye (resazurin) into a fluorescent
end product (resorufin). Nonviable cells rapidly lose metabolic capacity and thus do not generate a
fluorescent signal.
Default measurement parameters
• Excitation wavelength: 535 (25) nm
• Emission wavelength: 595 (35) nm
•Number of flashes: 25
• Settle time: 0 ms
•Mode: Top
• Lag time: 0 μs
• Integration: 20 μs
• Gain: "optimal"
• Plate definition: Eppendorf Cell Culture Plate 96/F, black/clear" or comparable plates
65
The method is restricted to 96-well microplates.
Because of faster evaporation the wells lying on the outer sides of the plate are not included in
the evaluation.
Please fill them with buffer or distilled water.
User defined method parameters
• The measurement is performed at 535 / 595 nm with default measurement parameters.
• Define the number of blank replicates (possible number: 1 – 6).
• Define the number of control replicates (possible number: 1 – 6).
• Define number of samples and sample replicates (max. 58, depends on number of blanks and controls).
• Define appropriate sample identifier (default settings are ID_1, ID_2, ..).
• Check if entered parameters are correct.
• Required plate layout: Outer wells are left empty by default. Pipette in a vertical order, starting with
blanks at position B2, controls are pipetted in subsequent wells, samples must be placed in the
following wells.
• Press Start.
• For method results and data evaluation principle see chapter method results and evaluation procedure.
Page 66

66
Predefined methods
®
Eppendorf
PlateReader AF2200
English (EN)
Plate layout
Abb. 6-7: Method strip: Cell viability (CellTiter-Blue Assay)
Fig. 6-7: Method strip: Cell viability (CellTiter-Blue Assay)
The selected number of blanks, controls and samples are shown in the plate view on the right side of the
method strip.
Page 67

Predefined methods
®
Eppendorf
PlateReader AF2200
English (EN)
6.2.8 Cell viability (Apo-ONE Caspase-3/7 Assay)
Introduction
The Apo-ONE Homogeneous Caspase-3/7 Assay provides a homogenous fluorometric method for
monitoring apoptosis in mammalian cells. The assay is based on the measurement of the activities of the
proteases caspase-3 and -7 in the process of apoptosis. A pro-fluorescent substrate becomes fluorescent
after cleavage by the activated caspases.
Default measurement parameters
• Excitation wavelength: 485 (25) nm
• Emission wavelength: 535 (35) nm
•Number of flashes: 25
• Settle time: 0 ms
•Mode: Top
• Lag time: 0 μs
• Integration: 20 μs
• Gain: "optimal"
• Plate definition: Eppendorf Cell Culture Plate 96/F, black/clear" or comparable plates
67
The method is restricted to 96-well microplates.
Because of faster evaporation the wells lying on the outer sides of the plate are not included in
the evaluation.
Please fill them with buffer or distilled water.
User defined method parameters
• The measurement is performed at 485 / 535 nm with default measurement parameters.
• Define the number of blank replicates (possible number: 1 – 6).
• Define the number of control replicates (possible number: 1 – 6).
• Define number of samples and sample replicates (max. 58, depends on number of blanks and controls).
• Define appropriate sample identifier (default settings are ID_1, ID_2, ..).
• Check if entered parameters are correct.
• Required plate layout: Outer wells are left empty by default. Pipette in a vertical order, starting with
blanks at position B2, controls are pipetted in subsequent wells, samples must be placed in the
following wells.
• Press Start.
• For method results and data evaluation principle see chapter method results and evaluation procedure.
Page 68

68
Predefined methods
®
Eppendorf
PlateReader AF2200
English (EN)
Plate layout
Abb. 6-8: Method strip: Cell viability (Apo-ONE Caspase-3/7 Assay)
Fig. 6-8: Method strip: Cell viability (Apo-ONE Caspase-3/7 Assay)
The selected number of blanks, controls and samples are shown in the plate view on the right side of the
method strip.
Page 69

Predefined methods
®
Eppendorf
PlateReader AF2200
English (EN)
6.3 Method (measurement) parameters
The methods were created with default measurement parameter sets which are listed in the method
descriptions.
In some cases it may be necessary to change parameter settings in order to reach optimal results.
6.4 Method results
As the measurement is performed, an Excel Workbook opens automatically. It consists of a raw data sheet,
a blanking sheet (factor methods only) and a results sheet.
If there is no extra blanking sheet the blanking is done within the results sheet.
6.4.1 Contents of the raw data sheet
69
Raw data and measurement parameters PlateReader AF2200.
Abb. 6-9: : Raw data sheet
Fig. 6-9: : Raw data sheet
Page 70

70
Predefined methods
®
Eppendorf
PlateReader AF2200
English (EN)
6.4.2 Contents of the blanking sheet (factor methods only)
Blanking results and all other intermediate results.
Abb. 6-10: Blanking sheet
Fig. 6-10: Blanking sheet
Page 71

Eppendorf
6.4.3 Content of the results sheet
The structure of the results sheet depends on the method. Default contents are:
•method parameters
• plate layout with sample IDs
• raw data, blanked raw data and sample results
• method specific calculations
• standard methods contain standard results incl. standard curve graph
• cell viability methods contain a bar chart which shows a result overview
The sample IDs in the plate layout are alterable. When changing the sample IDs in the plate
layout, the sample IDs in the sample results table are changed automatically.
Abb. 6-11: Results sheet
Predefined methods
®
PlateReader AF2200
English (EN)
71
Fig. 6-11: Results sheet
Page 72

72
Predefined methods
®
Eppendorf
PlateReader AF2200
English (EN)
Page 73

Troubleshooting
d
®
Eppendorf
PlateReader AF2200
English (EN)
7 Troubleshooting
7.1 General Troubleshooting
If you don’t meet your expected measurement results please check the following:
• The volumes of all measured wells are homogeneous. Uniformity of pathlength [d] is essential for
reliable measurements.
Identical volumes of different fluid types and buffers may have different pathlengths.
• The homogeneity of your samples is given:
The bottom of the wells must be entirely covered with fluid.
73
Precipitation and irregular colour product distribution have to be avoided.
Buffers which have massive meniscus effects shouldn’t be used.
7.2 Troubleshooting Absorbance mode
Warning / error Consequences Remedy
Sample data out of
min-max-range of standard values
Correlation coefficient <
user input
At least one sample is out of
measurement range.
At least one standard is out of
measurement range.
Corresponding sample results are
marked red in the results table.
Sample results are not calculated. Check input of standard
Raw data of the samples are
displayed as OVER, sample results
are not calculated.
Raw data are displayed as OVER,
standard curve is not calculated.
Dilute sample or modify standard
concentrations and remeasure.
concentrations and remeasure.
Check concentrations of standard
solutions and remeasure
Reduce your required value of R
in the User Settings Dialog of the
software and remeasure.
Dilute sample and remeasure.
Dilute standard solution and
remeasure.
2
Page 74

74
Trou bleshooting
Eppendorf
English (EN)
®
PlateReader AF2200
7.3 Troubleshooting Fluorescence mode
Warning / error Consequences Remedy
Sample data out of
min-max-range of standard
values.
Correlation coefficient of standard
curve < user input.
At least one sample is out of
measurement range.
At least one sample is out of
measurement range.
Calculation Error Standard curve is not calculated Define standard concentrations in
Corresponding sample results are
marked red in the results table.
Sample results are not calculated. Check input of standard
Raw data of the samples are
displayed as OVER, sample results
are not calculated.
Raw data are displayed as OVER,
standard curve is not calculated.
Dilute sample or modify standard
concentrations and remeasure.
concentrations and remeasure.
Check concentrations of standard
solutions and remeasure
Reduce your required value of R
in the User Settings Dialog of the
software and remeasure.
Check gain settings and
remeasure.
Dilute sample and remeasure.
Check gain settings and
remeasure.
Dilute standard and remeasure.
the method stripe of the software
and remeasure.
7.4 Save method scripts
2
Predefined methods, with the exception of Nucleic acid quantification (UV 260 nm microvolume), may be
modified by the user and saved under another name (Save-as functionality) in the directory:
• Win XP: C:\ Documents and Settings\All Users\Documents\Eppendorf\Methods
• Win 7: C:\Users\Public\Documents\Eppendorf\Methods
These methods can be loaded for further measurements by selecting Open from method from the File menu.
7.5 Save method results
After performing a measurement using a predefined method, the results are automatically saved in the
following directory:
• Win XP: C:\ Documents and Settings\All Users\Documents\Eppendorf\Results
• Win 7: C:\Users\Public\Documents\Eppendorf\Results
Page 75

Evaluation procedure
®
Eppendorf
PlateReader AF2200
English (EN)
8 Evaluation procedure
8.1 Nucleic acid quantification UV 260 nm with factor
Sample results [Unit] = absorbance * factor sample type * correction factor pathlength
8.2 Nucleic acid and Protein quantification with standards
(Nucleic acid quantification UV 260 nm with standards, Protein quantification UV 280 nm with standards,
Nucleic acid quantification Fluorescence 485/535 nm with standards, Protein quantification BCA 562 (600)
nm with standards, Protein quantification Bradford 595 (600) nm with standards, Protein quantification
Lowry 750 (600) nm with standards)
75
Sample results are calculated using the curve-fitting model "linear regression". The limit of R
determined by the user. The user can change the limit for R
2
in the User Settings Dialog of the PlateReader
2
is
AF2200 Software.
8.3 Protein quantification Nano Orange 485/595 nm with standards
Sample results are calculated using the curve-fitting model "polynomial 2nd order regression" is used. The
user can change the limit for R
2
in the User Settings Dialog of the PlateReader AF2200 Software.
8.4 Cell viability CellTiter-Blue Assay, Cell viability Apo-ONE Caspase-3/7 Assay
Abb. 8-1: Results table cell viability
Fig. 8-1: Results table cell viability
Page 76

76
Evaluation procedure
®
Eppendorf
PlateReader AF2200
English (EN)
Average raw data
Average value of control replicates / blank replicates / sample replicates in RFU
SD raw data
Standard deviation of control replicates / blank replicates / sample replicates in RFU
SD [%] raw data
Standard deviation of control replicates / blank replicates / sample replicates in %
Average blanked
Average value blanked = Average value of control replicates / sample replicates – average value of blank
replicates in RFU
SD blanked
Calculation of blanked standard deviation
atadknalbrawSDsamplerawdataSDDSdeknalb+=
22
% Gauss
Calculation of Gauss error.
%001* ( sampleDSdeknalb
ssuaGrorre +
1
controlblankedaverage
22
controlDSdeknalb
(
sampleblankedaverage
controlblankedaverage
% of control CellTiter-Blue Assay
Calculation of sample viability:
average viability of control replicates – average viability of blank replicates = 100%
2
22
average viability of sample replicates - average viability of blanks replicates = x%
% of control Apo-ONE Caspase-3/7 Assay
Calculation of caspase activity:
average caspase activity of control replicates – average caspase activity of blank replicates = 100%
average caspase activity of sample replicates - average caspase activity of blank replicates = x%
Page 77

Page 78

Evaluate your manual
Give us your feedback.
www.eppendorf.com/manualfeedback
Your local distributor: www.eppendorf.com/worldwide
Eppendorf AG
www.eppendorf.com
· Hamburg · Germany · Tel: +49 40 538 01-0
 Loading...