

Page 1
QX200™ Droplet Reader and
QuantaSoft™ Software
Instruction Manual
Catalog #186-4001, 186-4003
Page 2

Page 3

Preface
Bio-Rad Technical Support
For help and technical advice, please contact the Bio-Rad Technical Support department. In the United
States, the Technical Support department is open Monday–Friday, 5:00 AM–5:00 PM, Pacific time.
Phone: 1-800-424-6723
Fax: 1-510-741-5802
Email: LSG_TechServ_US@bio-rad.com (for U.S. and international customers)
Online technical support and worldwide contact information are available at www.consult.bio-rad.com.
Legal Notices
No part of this publication may be reproduced or transmitted in any form or by any means, electronic or
mechanical, including photocopy, recording, or any information storage or retrieval system, without permission
in writing from Bio-Rad Laboratories.
Bio-Rad reserves the right to modify its products and services at any time. This instruction manual is subject
to change without notice. Although prepared to ensure accuracy, Bio-Rad assumes no liability for errors, or for
any damages resulting from the application or use of this information.
Excel and Microsoft are trademarks of Microsoft Corporation. FAM and VIC are trademarks of Applera
Corporation. TaqMan is a trademark of Roche Molecular Systems, Inc. twin.tec is a trademark of Eppendorf AG.
EvaGreen is a trademark of Biotium, Inc. Bio-Rad Laboratories, Inc. is licensed by Biotium, Inc. to sell reagents
containing EvaGreen dye for use in real-time PCR, for research purposes only.
Bio-Rad’s thermal cyclers and real-time thermal cyclers are covered by one or more of the following U.S.
patents or their foreign counterparts owned by Eppendorf AG: U.S. Patent Numbers 6,767,512 and 7,074,367.
This product and/or its use is covered by claims of U.S. patents, and/or pending U.S. and non-U.S. patent
applications owned by or under license to Bio-Rad Laboratories, Inc. Purchase of the product includes a
limited, non-transferable right under such intellectual property for use of the product for internal research
purposes only. No rights are granted for diagnostic uses. No rights are granted for use of the product for
commercial applications of any kind, including but not limited to manufacturing, quality control, or commercial
services, such as contract services or fee for services. Information concerning a license for such uses can be
obtained from Bio-Rad Laboratories. It is the responsibility of the purchaser/end user to acquire any additional
intellectual property rights that may be required.
Practice of the polymerase chain reaction (PCR) may require a license.
Copyright © 2013 by Bio-Rad Laboratories, Inc. All rights reserved.
QX200 Droplet Reader and QuantaSoft Software Instruction Manual | i
Page 4
Preface
Safety and Regulatory Compliance
This instrument has been tested and found to be in compliance with all applicable requirements of the
following safety and electromagnetic standards:
IEC 61010-1:2001 (2nd ed.), EN61010-1:2001 (2nd ed). Electrical Equipment for Measurement, Control, and
Laboratory Use — Part 1: General requirements
EN 61326-1:2006 (Class A). Electrical equipment for measurement, control, and laboratory use. EMC
requirements, Part 1: General requirements
This equipment generates, uses, and can radiate radiofrequency energy and, if not installed and used in
accordance with the instruction manual, may cause harmful interference to radio communications. Operation
of this equipment in a residential area is likely to cause harmful interference, in which case the user will be
required to correct the interference at his own expense.
The CE mark indicates that the manufacturer ensures the product conforms with the essential
requirements of the applicable EC directives.
The CSA mark indicates that a product, process, or service has been tested to a Canadian or
U.S. standard and it meets the requirements of the applicable CSA standard.
This equipment has been tested and found to comply with the limits for a Class A digital
device pursuant to Part 15 of the FCC Rules. These limits are designed to provide reasonable
protection against harmful interference when the equipment is operated in a commercial
environment.
The Waste Electrical and Electronic Equipment Directive symbol indicates that when the
end-user wishes to discard this product, it must be sent to separate collection facilities for
recovery and recycling.
Instrument Safety Warnings
Alteration of this instrument voids the warranty and safety certification and creates a potential safety hazard.
This instrument is intended for laboratory use only. Bio-Rad Laboratories is not responsible for any injury
or damage caused by use of this instrument for purposes other than those for which it is intended, or by
modifications of the instrument not performed by Bio-Rad Laboratories or an authorized agent. Follow the
safety specifications listed here and throughout this manual. Use only the power cord supplied with the
instrument, using only the plug adaptor that corresponds to the electrical outlets in your region. Use of
unapproved supermixes may harm the instrument and voids the warranty.
QX200 Droplet Reader and QuantaSoft Software Instruction Manualii |
Page 5

PrefacePreface
PPE (Personal Protective Equipment) Training
Proper use of gloves is recommended with use of oils and sample plates. OSHA requirements for PPE are set
forth in the Code of Federal Regulations (CFR) at 29 CFR 1910.132 (General requirements); 29 CFR 1910.138
(Hand protection); 29 CFR 1926.95 (Criteria for standard personal protective equipment). Any gloves with
impaired protective ability should be discarded and replaced. Consider the toxicity of the chemicals and
factors such as duration of exposure, storage, and temperature when deciding to reuse chemically exposed
gloves. Features to aid glove selection for handling of machines, assays, oils, and cleaning solvents:
Butyl gloves are made of a synthetic rubber and protect against peroxide, hydrofluoric acid, strong bases,
alcohols, aldehydes, and ketones
Natural (latex) rubber gloves are comfortable to wear and feature outstanding tensile strength, elasticity, and
temperature resistance
Neoprene gloves are made of synthetic rubber and offer good pliability, finger dexterity, high density, and
tear resistance; they protect against alcohols, organic acids, and alkalis
Nitrile gloves are made of copolymer and provide protection from chlorinated solvents such as trichloroethylene
and tetrachloroethene; they offer protection when working with oils, greases, acids, and caustic substances
QX200 Droplet Reader and QuantaSoft Software Instruction Manual | iii
Page 6

Preface
QX200 Droplet Reader and QuantaSoft Software Instruction Manualiv |
Page 7

Contents
Chapter 1 QX200™ Droplet Digital™ PCR System 1
1.1 Introduction
1
.2 System Components
1
.3 Droplet Digital PCR Workflow 4
1.4 System Setup and General Operation Instructions
1
2
4
C
hapter 2 Using the QX200 Droplet Reader
C
hapter 3 Using QuantaSoft
3.1 Setup
3.1.1 Using the Well Editor
™
Software 9
1
1
3.1.2 Using the Experiment Editor 12
3.1.3 Using the Advanced Options
3.2 Run
1
1
3.3 Analyze 14
3.3.1 Viewing Channel Data (1D Amplitude)
3.3.2 Viewing Clustering Plots (2D Amplitude)
3.3.3 Viewing Concentration Data (Concentration)
1
1
1
3.3.4 Viewing Copy Number Data (Copy Number) 19
3.3.5 Viewing Ratio Data (Ratio)
3.3.6 Viewing Events
Chapter 4 Specifications and Maintenance
4.1 Specifications
4.2 Maintenance
4.2.1 General Maintenance Procedures
4.2.2 Replacing Droplet Reader Oil and Removing Waste
Appendix A Ordering Information
2
2
2
2
2
2
2
23
5
0
1
3
3
6
8
9
0
0
1
1
2
2
2
QX200 Droplet Reader and QuantaSoft Software Instruction Manual | v
Page 8

QX200 Droplet Reader and QuantaSoft Software Instruction Manualvi |
Page 9

QX200™ Droplet Digital™
1
PCR System
1.1 Introduction
The QX200 Droplet Digital PCR (ddPCR™) system performs accurate and
precise digital PCR. The system consists of two instruments, the QX200 droplet
generator and the QX200 droplet reader, and their associated consumables.
The QX200 droplet generator partitions samples into 20,000 nanoliter-sized
droplets and, after PCR on a thermal cycler, droplets from each sample are
analyzed individually on the QX200 droplet reader. PCR-positive and PCRnegative droplets are counted to provide absolute quantification of target DNA
in digital form. Alternatively, amplified products can be extracted from droplets
following PCR for downstream applications, such as sequencing or cloning.
The ddPCR system lets you:
Detect rare DNA target copies with unmatched sensitivity
Determine copy number variation with unrivaled accuracy
Measure gene expression levels with precision
Applications and uses include:
Copy number variation
Rare sequence detection
Gene expression analysis
Next-generation sequencing (NGS)
library quantification
Viral load determination
For instructions on use of the QX200 droplet generator, please refer to the QX200
Droplet Generator Instruction Manual (bulletin 10031907).
QX200 Droplet Reader and QuantaSoft Software Instruction Manual | 1
Single cell gene expression analysis
Absolute quantification
Rare mutant detection
miRNA analysis
NGS sample preparation
GMO detection
Page 10
Chapter 1 QX200 Droplet Digital PCR System
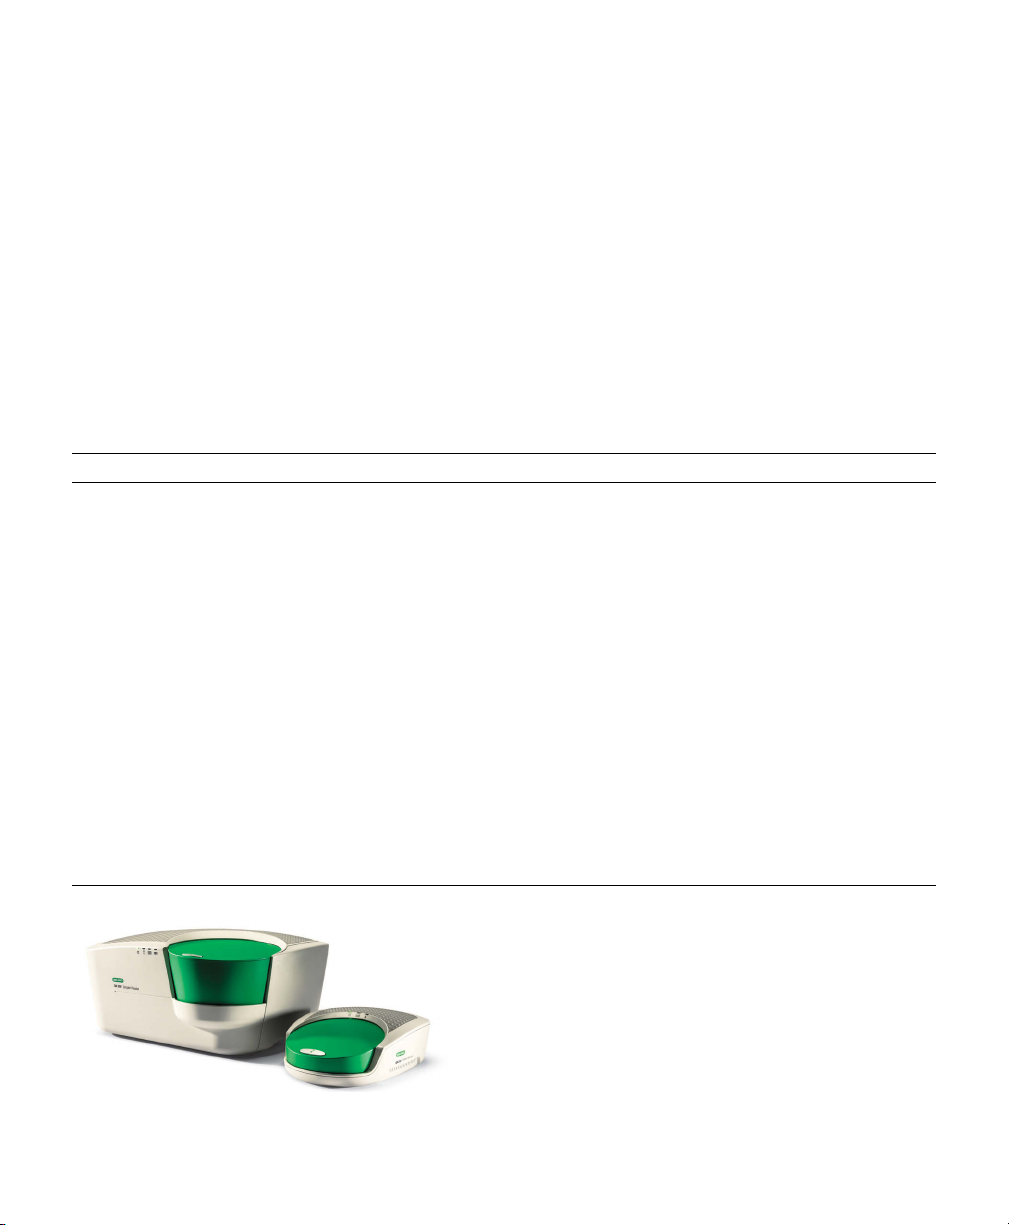
1.2 System Components
The system consists of two instruments and associated software, consumables, and reagents (Table 1.1):
QX200 droplet generator — utilizes proprietary reagents and microfluidics to partition samples into 20,000
nanoliter-sized droplets
QX200 droplet reader — following PCR amplification of the nucleic acid target in the droplets, this
instrument analyzes each droplet individually using a two-color detection system (set to detect FAM and
either VIC, HEX, or EvaGreen); PCR-positive and PCR-negative droplets are counted to provide absolute
quantification of target DNA in digital form using QuantaSoft
Additional materials required for performing ddPCR are listed in Table 1.2.
Table 1.1. QX200 Droplet Digital PCR system components. Items shipped with the QX200 ddPCR system
(catalog #186-4001). Catalog # refers to replacement items (quantities may be different).
Component Description Catalog #
X200 droplet generator
Q
QX200 droplet generator
™
DG8
droplet generator Microfluidic cartridge used to mix sample and oil to 186-4008
I
cartridges and gaskets (24) generate droplets; gaskets seal the cartridge to
prevent evaporation and apply pressure required
for droplet formation
Droplet generator cartridge
older
h
t
P
Power cord Connects QX200 droplet generator to power source Call technical support
nstrument used for droplet generation
ositions and holds the droplet generator cartridge in
he instrument for droplet generation
™
software
1
1
86-4002
86-3051
QX200 droplet reader
QX200 droplet reader
I
Laptop PC and QuantaSoft software
a
Droplet reader plate holders (2)
USB 2.0 cable
C
Power cord
QX200 Droplet Digital PCR system. Left, QX200 droplet reader. Right, Q X200 droplet generator.
QX200 Droplet Reader and QuantaSoft Software Instruction Manual2 |
nstrument used for droplet reading, data collection
onnects to QX200 droplet reader for data collection
C
nd analysis
P
osition 96-well PCR plate in the droplet reader
onnects QX200 droplet reader to PC
onnects QX200 droplet reader to power source
C
C
1
C
86-4003
86-3007
1
10-10608
5
all technical support
all technical support
Page 11

Chapter 1 QX200 Droplet Digital PCR System
Table 1.2. Additional materials required.
Component
Q
X200 droplet generator
R
ecommended
C
atalog # and Supplier
Reagents for probe detection
PCR supermix
d
dPCR supermix for probes
D
O
roplet PCR supermix
ne-Step RT-ddPCR supermix for probes
1
1
1
86-3010, 186-3026, 186-3027,
1
86-3028
86-3023, 186-3024, 186-3025
86-3021, 186-3022
Droplet generator oil Droplet generator oil for probes 186-3030, 186-3005
Control
d
dPCR buffer control kit for probes
1
86-3052
Reagents for EvaGreen detection
PCR supermix
™
Q
X200
ddPCR™ EvaGreen® supermix 186-4033, 186-4034, 186-4035,
186-4036
Droplet generator oil
X200 droplet generator oil for EvaGreen dye
Q
86-4005, 186-4006
1
Control QX200 buffer control kit for EvaGreen dye 186-4052
Consumables and other materials
Pipets 20 μl pipet for sample loading Rainin L-20
5
8
0 μl pipet for droplet transfer
-channel, 200 μl pipet for oil
R
ainin L-50, L8-50
ainin L8-200
R
Pipet tips Filtered Rainin GP-L10F, GP-L200F
96-well PCR plates
win.tec semi-skirted 96-well plate
t
ppendorf 951020362
E
Reagent trough Any
F
oil plate seals
P
ierceable foil plate seals
1
81-4040
Plate sealer PX1™ PCR plate sealer 181-4000
8-cap strips
ny
A
QX200 droplet reader
Droplet reader oil
D
roplet reader oil
1
86-3031, 186-3004
Droplet reader waste bottle Empty waste bottle N/A
Page 12

Chapter 1 QX200 Droplet Digital PCR System
1.3 Droplet Digital PCR Workflow
Droplet Digital PCR involves the following steps (4.5–5.5 hours for the complete workflow):
Prepare PCR-ready samples — combine nucleic acid sample (DNA or RNA), primers, and probes (FAM,
VIC, or HEX) or intercalating dye (EvaGreen) with Bio-Rad ddPCR supermix (see Table 1.2)
Make droplets — load 20 μl of the ddPCR reaction into the DG8 droplet generator cartridge, then load the
cartridge into the QX200 droplet generator to partition the sample into droplets. The QX200 droplet generator
uses microfluidics to combine oil and aqueous sample to generate the nanoliter-sized droplets required for
ddPCR analysis. It processes up to eight samples at a time in about 2 minutes
Perform PCR — pipet droplets from the cartridge to a 96-well PCR plate and seal the plate with foil using a
PX1 plate sealer (see Table 1.2). Perform PCR to end point (~40 cycles) using a thermal cycler
Read droplets — load the plate into the QX200 droplet reader and start your run. The droplet reader sips each
sample, singulates the droplets, and streams them in single file past a two-color detector. The detector reads the
droplets to determine which contain a target (+) and which do not (–)
If reading or quantifying droplets and recovering material from droplets in parallel, prepare two sets of
reactions, one for each application. For example, a set of eight wells in a single DG8 cartridge can be
generated: four of these will be read after thermal cycling, and four will not be read
Analyze results — the droplet reader connects to a laptop computer running QuantaSoft software. The
software provides a complete set of tools for setting up and naming samples, running and controlling
the instrument, and analyzing results. It also reads the positive and negative droplets in each sample and
plots the fluorescence droplet by droplet. The fraction of positive droplets in a sample determines the
concentration of target in copies/μl
The QX200 ddPCR system is compatible with hydrolysis probe (TaqMan) chemistry and can detect up to two
probes at a time (FAM/VIC or FAM/HEX), using a dye deconvolution matrix in the software to ensure target
specificity. It is also compatible with EvaGreen chemistry. Use only the approved Bio-Rad supermixes listed in
Table 1.2 with this system; using unapproved supermixes may harm the instrument and voids the warranty.
1.4 System Setup and General Operation Instructions
Connect the QX200 droplet generator and QX200 droplet reader to a power source using the power cords
provided. Leave 10" (5 cm) clear space behind and 5" (2.5 cm) clear to the right and left of each instrument
for proper ventilation
Connect the QX200 droplet reader to the laptop PC using the USB 2.0 cord provided. QuantaSoft software
is preinstalled on the laptop
Power on the QX200 droplet reader using the switch at the back. The status indicator turns solid green to
indicate power is on. The QX200 droplet generator is powered on by plugging it into a power source
The droplet reader requires droplet reader oil (catalog #186-3004). Please refer to Section 4.2.2 for
instructions on replacing droplet reader oil
QX200 Droplet Reader and QuantaSoft Software Instruction Manual4 |
Page 13

Using the QX200™
2
Table 2.1. Status indicator lights on the QX200 droplet reader.
Solid green Power on Bottle levels OK* Plate in place Run complete
Flashing green
Droplet Reader
1. Power on the QX200 droplet reader using the switch at the back. Allow
it to warm up for 30 min, then switch on the PC and launch QuantaSoft
software.
2. Check the indicator lights on the front of the droplet reader (Table 2.1). The
first two lights at left should be solid green, indicating power is on, there is
sufficient oil in the designated oil reservoir, and there is <700 ml in the waste
bottle. If the lights are flashing amber, the run cannot be started; clean out
the waste bottle or replace the oil (see Section 4.2.2).
—
il <30% or waste >70%**
O
—
un in progress
R
™
Flashing amber
Off
* There is suf ficient oil and room in the waste bottle to run 96 wells.
** The run can be started if <96 wells are run (for example, only 19% oil is required for 24 wells); if there is not enough oil
for the run, the software will not allow you to start the run.
*** The software will not allow you to start the run.
—
ower off
P
il <10% or waste >90%***
O
—
QX200 Droplet Reader and QuantaSoft Software Instruction Manual | 5
—
o plate
N
rror during run
E
dle
I
Page 14

Chapter 2 Using the QX200 Droplet Reader
3. Place the 96-well PCR plate into the plate holder:
a. Place the 96-well PCR plate containing the amplified droplets into the base of the plate holder. Well A1
of the PCR plate must be in the top left position.
b. Move the release tabs of the top of the plate holder into the “up” position and place the top on the PCR
plate. Firmly press both release tabs down to secure the PCR plate in the holder.
Top of plate holder
96-wel l PCR plate
Base of plate holder
Placing the 96-well plate into the plate holder.
Down Down
4. Press the button on the green lid to open the droplet reader. Load the plate holder into the droplet reader,
and press the button on the lid again to close the cover. Confirm the first three indicator lights are green
(Table 2.1).
Push to open/close
Placing the plate holder into the droplet reader.
QX200 Droplet Reader and QuantaSoft Software Instruction Manual6 |
Page 15

Chapter 2 Using the QX200 Droplet Reader
Correct
Correct and incorrect placement of the plate holder. Note the release tabs are in the “up” position in the incorrect placement at right.
Incorrect
5. In QuantaSoft software, click Setup in the left navigation bar to define your experiment (see Chapter 3),
then click Run. The run indicator light (far right) flashes green to indicate droplet reading is in progress.
6. When droplet reading is complete, all four indicator lights are solid green. Open the door and remove the
plate holder from the unit. Remove the 96-well PCR plate from the holder and discard it.
QX200 Droplet Reader and QuantaSoft Software Instruction Manual | 7
Page 16

Chapter 2 Using the QX200 Droplet Reader
QX200 Droplet Reader and QuantaSoft Software Instruction Manual8 |
Page 17

Using QuantaSoft™
3
Software
QuantaSoft software organizes and provides one-click access to the three main
steps of droplet analysis in the left navigation bar, moving you through the entire
workflow:
Setup — enter information about the samples, assays, and experiments
(see Section 3.1)
Run — start the run and control the instrument, if needed (see Section 3.2)
Analyze — compute nucleic acid concentration (see Sections 3.3 and 3.4)
QuantaSoft software uses the following file types:
Template (*.qlt) — user-defined plate layout settings (no data) for reading a
™
ddPCR
Raw data (*.qlb) — unprocessed data from each well in a ddPCR plate
Results (*.qlp) — user-defined plate layout settings and processed data for a
ddPCR plate
Comma-separated values (*.csv) — analyzed data in a format that can be
assessed using other programs, such as Microsoft Excel
plate
QX200 Droplet Reader and QuantaSoft Software Instruction Manual | 9
Page 18

Chapter 3 Using QuantaSoft Software
3.1 S etu p
File name
Load set tings and data from prev ious expe riments
Load or create a template (s ettings only)
Options for advanced data analysis and setup
Open experiment editor
Define experiment
settings
Start the run
View and analyze
data
Abor t run or exit
program
QuantaSoft software Setup interface. The plate map is a diagram of the wells in the 96-well plate and contains information about the
type of analysis, sample, and assay represented by that well. After a run, it also contains concentration data.
Instrument
maintenance options
(appear only when
connected to the
droplet reader)
Plate map
1. Click Setup to enter information about the samples, assays, and experiments.
To open saved details (settings and data) from another experiment,
click Plate > Load and select the file
To open a saved template for a plate map (settings only, no data),
click Template > Load and select the file
To create a new template, click Template > New
To overwrite the setup information for a plate that is open (experiment type and name, sample name, etc.),
click Template > Load. In the Load template window, click Overwrite.
2. Enter the file name, then use the well editor (see Section 3.1.1) and experiment editor (see Section 3.1.2) to
adjust the settings for your experiment. Click Options to access advanced options data analysis and setup
(see Section 3.1.3).
10 |
QX200 Droplet Reader and QuantaSoft Software Instruction Manual
Page 19

QX100 Droplet Reader and QuantaSoft Software Instruction Manual
Chapter 3 Using QuantaSoft Software
3.1.1 Using the Well Editor
Use the well editor to define the settings (samples, experiment type, and detection type) for the plate. Sample
and experiment types are color-coded and can be customized for easy reference in the plate map.
Reset — restore default settings
Apply — apply settings without exiting
well editor
Cance l — close without saving changes
OK — save changes and c lose well editor
Well editor. Settings for absolute quantification of two unknowns in a single sample are shown.
Unuse d — channel unused
Unknown — unknown experimental sample
Reference — reference gene or ta rget (requi red for CNV, RED, or ratio
calculations)
Positive — positive control
Negative — negative control
Blank — n o sample; us e for wells that will not be analyzed
Assay t ype options.
NTC — no-template control
1. To open the well editor, double-click on the well(s) you wish to edit. Selected wells are highlighted in gray,
and the well editor appears across the top of the interface.
To select multiple wells, hold Ctrl and select the wells
To select wells in a continuous series (horizontal or vertical), hold Shift and select the first and last wells
To select all wells in the plate, double-click in the top left corner of the plate
To select a row or column, double-click the letter or number for that row or column
2. In the Sample panel, enter the sample Name and select the Experiment from the drop-down menu. All
saved experiments appear in the drop-down menu, along with the option to add experiment... To create
or edit an experiment, use the experiment editor (see Section 3.1.2).
3. Select the Supermix from the drop-down menu (required; selection cannot be changed after data
collection).
4. Define Assay 1 (channel 1, the FAM channel) and Assay 2 (channel 2, the VIC or HEX channel). Assign
each assay a Name and sample Ty pe.
| 11
Page 20

Chapter 3 Using QuantaSoft Software Chapter 3 Using QuantaSoft Software
Settings appear in the Applied Well Settings box as you enter them. When you are done, click Apply or OK to
save the information. The settings appear in the well in the plate map.
Tips:
You can change the selected well using the plate map without exiting the well editor.
To append sample or assay names with numbers incrementally through selected wells, select
the Auto Inc check box next to Name.
Use standard Windows keyboard shortcuts for copying, pasting, and deleting selections (for
example, use Ctrl+c to copy a selection, Ctrl+z to undo an operation, etc.).
3.1.2 Using the Experiment Editor
Use the experiment editor to define the experiment type. To open the experiment editor, select Experiment
> add experiment... in the well editor or select New or Edit (double-click on an experiment name) in the
Experiments window under Setup. Three types of experiments are possible: Absolute Quantification (ABS),
Rare Event Detection (RED), and Copy Number Variation (CNV). A default list of experiments is supplied at
installation, but you can create and save custom experiments; upgrade installations will preserve current
experiment lists.
Settings are summarized in the Applied Well Settings box as you enter them. When you are done, click Apply
or OK to save the experiment information. The settings appear in the well in the plate map.
If the Sample Name, Experiment, Assay Name, and Assay Type all match across multiple wells, the software
can identify these as “merged” and provides an option to view merged data during analysis (see Section 3.3).
Click Apply or OK to save the information. The settings appear in the well in the plate map.
Copy num ber option s appear fo r CNV
experiments only
Customize the color codes for experiments (for
exampl e, by experim ent type, u ser, etc.)
Experiment editor. Options for a CNV experiment are shown.
12 |
QX200 Droplet Reader and QuantaSoft Software Instruction Manual
Page 21

Chapter 3 Using QuantaSoft Software
3.1.3 Using the Advanced Options
Click Options in the Setup window to see all advanced options for data collection and analysis.
Reproc ess data with a newer ver sion of the software
Export amplitude data for selected wells to a .csv file (one file for eac h well)
Selec t wells by row (checked) or by column (unchecked)
Set threshold display (color)
Advanced options.
3.2 Run
1. Click Run in the left navigation bar to start the run.
2. In the Run Options window, select the detection chemistry:
If a probe supermix is selected in the well editor, the probe dye sets appear. Select FAM/HEX or FAM/VIC
If an EvaGreen supermix is selected, the EvaGreen dye set appears; the screen confirms the number of
EvaGreen wells configured on the plate
Run options.
3. Up to 1 minute later, a green circle appears next to the abort button and flashes periodically to indicate the
run is in progress. Active and analyzed wells are also highlighted in green in the plate map.
4. As each well is analyzed, the data appear across the top navigation area. Once the run is complete, all
data are reanalyzed for the final data file.
QX200 Droplet Reader and QuantaSoft Software Instruction Manual
| 13
Page 22

Fill in Chapter Name Here on Master Page (33_man_left header/footer)
QX100 Droplet Generator Instruction Manual
Chapter 3 Using QuantaSoft Software
Channel 1 (FAM) fluorescence vs. event number Channel 2 (VIC or HEX) fluorescence vs. event number
Switch data views
(charts to larger
window)
Analyzed wells
Run indicator
Well data s tream
Inter face during an active run. Data for both detector channels are shown for the well being read.
Channel 1 histogram
(events vs. amplitude)
Channel 2 histogram (events vs.
amplitude)
Sample name
Experiment
Conc. channel 1 unknown
Conc. channel 2 unknown
3.3 Analyze
In the Setup window, load a plate (filename.qlp), then click Analyze to open and analyze the data. The data
analysis interface is separated into three windows:
Results table — summarizes results for wells selected in the well selector
Well selector — enables selection of wells for targeted analysis
Processed data/graphical display — allows visualization of graphical data from selected wells
14 | QX200 Droplet Reader and QuantaSoft Software Instruction Manual
Page 23

Results table Well selector
Y-axis display options
Copy gra ph to clipboard or print
Chapter 3 Using QuantaSoft SoftwareChapter 3 Using QuantaSoft Software
Graphical data
display
Data analysis interface. Data from a CNV analysis are shown.
View table in graphical display window
Export data to .csv file
Select data from detector channel(s) Toggle order in which channel data are displayed in the table
Results table options. Data from a CNV analysis are shown.
QX200 Droplet Reader and QuantaSoft Software Instruction Manual | 15
Status options:
OK — automatic analysis successful
CHECK — automatic analysis unsuccessful; to
view concentration, use manual analysis
tools
Multi — data autom atically analyze d as part of a
multi-well selection
Manual — droplets analyzed manually
Display replicates separately, as merged wells (if Sample Name, Experiment, and
Assay Name and Type all match across th e wells), or both
Page 24

Chapter 3 Using QuantaSoft Software
Channel 1 vs. channel 2 clustering plot
Channel data
Graphical data display options. A concentration plot from a CNV analysis is shown, with display options across the top.
Concentration data
Plot of rati o of unknown:reference (a /b or a/ [a+b])
Plot of measured copy numbers
Plot of # droplet events c ounted
3.3.1 Viewing Channel Data (1D Amplitude)
Click 1D Amplitude to visualize the data collected from each channel of selected wells. Use the radio buttons
to select the channels to be displayed. This tab also provides options for adjusting the thresholds used in
assigning positives and negatives for each channel.
When viewing a single well, change the threshold using one of the following options:
Use the single-well threshold tool . The assigned threshold appears as a horizontal pink line
-Or-
Enter threshold values in the Set Threshold field
When viewing multiple wells, change the thresholds as follows:
Use the single-well threshold tool to change the threshold in a single well. Vertical yellow lines in the
processed data plots show where droplet data from each well start and end, and the assigned threshold
appears as a horizontal pink line
Use the multi-well threshold tool to change the threshold in all the wells (appears as a pink line in the plots)
To manually set threshold values for single or multiple wells, enter the values in the Set Threshold field below
the plot and click Set Threshold or Enter
Click Auto Analyze to revert to automatic threshold settings and calculations. Threshold adjustments can also
be made in the 2D Amplitude clustering plots (see Section 3.3.2).
16 | QX200 Droplet Reader and QuantaSoft Software Instruction Manual
Page 25

Channel 1
fluorescence
amplitude vs.
event number
Reset automatic
threshold settings
Channel 2
fluorescence
amplitude vs.
event number
Channel selector
Channel 1 (FAM)
histogr am of events
vs. amplitude
Channel 2 (VIC or H EX)
histogr am of events vs.
amplitude
Threshold adjustment tool
(single well)
Threshold settings
Y-axis log scale toggl e
Viewing channel data for a single well. Processed data from both channels of a single well are shown. In channel 1, the single-well
threshold tool is enabled (the threshold is shown by the pink line and the value in the Set Threshold field).
Channel selector
Channel 1
fluorescence
amplitude vs.
event number
Reset automatic
threshold
settings
Channel 2
fluorescence
amplitude vs.
event number
Threshold adjustment tools
Threshold settings
Y-axis log scale toggl e
Channel 1 (FAM)
histogr am of events
vs. amplitude
Channel 2
(VIC or HEX)
histogr am of events
vs. amplitude
Viewing channel data for multiple wells. Processed data from both channels of multiple wells are shown. In channel 1, the single-well
threshold tool is enabled (the threshold is indicated by the pink line and the value in the Set Threshold field; the status of that well in the
results also shows Manual). In Channel 2, the multiple threshold tool is enabled.
| 17QX200 Droplet Reader and QuantaSoft Software Instruction Manual
Page 26

Chapter 3 Using QuantaSoft Software
3.3.2 Viewing Clustering Plots (2D Amplitude)
Click 2D Amplitude to view the channel 1 vs. channel 2 clustering plot and enable options for manually or
automatically adjusting the thresholds used in assigning positives and negatives for each detection channel.
To reset automatic thresholds for positives and negatives, click Auto Analyze
To manually assign thresholds:
– Use the thresholding crosshair to assign classification regions for the whole plot (this is the only option in
Heat Map mode)
– Use the ellipse, rectangle, or lasso threshold adjustment tool to classify a region of the plot. Click the tool,
then click the region type in the working cluster selector. Use the tool to select the region within the plot
Tip:
Mouse over any well in the well selector to preview data from that well in the clustering plot.
Display
multicolor
heat map
Ch1+/Ch2– Ch1+/Ch2+
Reset automatic
threshold settings
Threshold
adjustment tools
Working cluster
selector
Threshold settings
Ch1+/Ch2– Ch1+/Ch2+
Ch1–/Ch2– Ch1–/Ch2+
Ch1–/Ch2–
Ch1–/Ch2+
Ch2 threshold
Ch 1
threshold
Viewing clustering plots. Threshold adjustment options available in the clustering plot are shown. Threshold values are indicated by
the pink lines in the plot.
18 | QX200 Droplet Reader and QuantaSoft Software Instruction Manual
Page 27

Chapter 3 Using QuantaSoft Software
3.3.3 Viewing Concentration Data (Concentration)
Concentration data for each target appear in the wells in the plate map and are tabulated in the results table.
Click Concentration to visualize data in concentration plots. Use the radio buttons to select the channels
displayed. Error bars reflect total error or Poisson 95% confidence limits. These data can be exported for
analysis in other spreadsheet applications (for example, Microsoft Excel).
Select channel(s) to display
Y2 Axis options:
None — no Y2 axis
Ch2 — display Ch2 concentration
CNV — display copy number
(CNV ana lysis onl y)
Ratio(a/b) — ratio (a/b) of
unknown:reference
Fractional Abundance
(a/a+b) — ratio (a /[a+b]) of
unknown:reference; abundance
Inverse — inverse of ratio or
fractional abundance
Toggle y-ax is log scal e
Viewing concentration data. Data from absolute quantification are shown. Hover over data points to reveal well identity, concentration,
and Poisson confidence limits. Solid data points (shown) indicate merged data; open data points (not shown) indicate data from single
wells.
Display data from single wells, merged data, or both
Toggle x-axi s values an d well, name, or label dis play
3.3.4 Viewing Copy Number Data (Copy Number)
Click Copy Number to view copy number for selected wells/samples.
Toggle well, name, or label display
Viewing copy number data. Hover over data points to reveal well identity, concentration, and Poisson confidence limits. Solid data
points (not shown) indicate merged data; open data points (shown) indicate data from single wells.
| 19QX200 Droplet Reader and QuantaSoft Software Instruction Manual
Page 28

Chapter 3 Using QuantaSoft Software
3.3.5 Viewing Ratio Data (Ratio)
Click Ratio to view ratio data for selected wells/samples. Use the radio buttons to select a plot of the Ratio
(unkown:reference) or Fractional Abundance (% of sample); select Inverse to apply the inverse of either.
Selec t ratio or abu ndance pl ot, inverse
ratios
Toggle well, name, or label display
Viewing ratio data. Data from absolute quantification are shown. Hover over data points to reveal well identity, concentration, and Poisson
confidence limits. Select y log to convert the y-axis to logarithmic scale (shown). Solid data points (not shown) indicate merged data; open
data points (shown) indicate data from single wells.
3.3.6 Viewing Events
Click Events to view the number of droplet events counted for selected wells/samples. Use the radio buttons
to select the channels displayed. View positive, negative, or total droplet counts, or any combination of these.
Select channel(s) to display
Select events to display
Toggle well, name, or label display
Viewing event data. Data from absolute quantification are shown.
20 | QX200 Droplet Reader and QuantaSoft Software Instruction Manual
Page 29

4
Specifications and
Chapter Title Here
Maintenance
4.1 Specifications
11.5 inches
(292 mm)
26 inches
(660 mm)
Weight 56.6 lb. (26 kg)
Size (W x D x H)
Electrical requirements
Temperature
Altitude 0–6,560 ft (0–2,000 m)
Humidity
Pollution degree
Installation category
receptacle)
Ventilation requirements
QX200 Droplet Reader and QuantaSoft Software Instruction Manual | 21
2
6 x 20.5 x 11.5" (660 x 521 x 292 cm)
1
00–240 V, 50/60 Hz, 1 A; voltage fluctuations not to
exceed +10% of ratings
15–30 ºC
8
5% max (noncondensing)
2
(indoor use)
I
I (external power supply plugs into standard AC
5
" (12 cm) left and right of machine and 10" (25 cm)
behind should be unobstructed for proper ventilation
20.5 inches
(521 mm)
Page 30

Fill in Chapter Name Here on Master Page
QX100 Droplet Generator Instruction Manual
Chapter 4 Specifications and Maintenance
4.2 Maintenance
4.2.1 General Maintenance Procedures
Surfaces of the instrument may require general cleaning. Use deionized/distilled water for general wipe down
with a slightly dampened cloth. For decontamination, 10% bleach followed by 70% ethanol and/or deionized/
distilled water may be used. Do not use acetone or tap water.
Inspect equipment regularly for damaged external components or wiring. Do not use if damaged.
Apply standard MSDS (Material Safety Data Sheet) and OSHA practices when handling and disposing of
generated waste.
Bio-Rad droplet generation and reader fluids are based on fluorinated hydrocarbon chemistry and should be
disposed of in accordance with institutional, state, and local regulations. These nonflammable fluids are inert
and have low environmental impact and low toxicity. Collect waste in a polyethylene container and discard
within one month.
Droplets made with Bio-Rad master mix have antimicrobial properties, but microbial growth is possible.
The waste profile should contain the following: fluorinated hydrocarbons, water, fluorescent dye (from probes),
protein, and nucleic acids.
4.2.2 Replacing Droplet Reader Oil and Removing Waste
Replace the droplet reader oil and empty the waste receptacle as needed. Use the handle built into the side
compartment to slide the carriage out:
Use empty oil supply bottles as new waste bottles. Add 50 ml 10% bleach to the waste bottle to prevent
microbial growth, and place a label on the waste bottle at this time
Place the new bottle of oil in the oil position and screw the cap into place. In QuantaSoft™ software, under
Instrument Routines in the Setup window, click Prime to fill the lines with oil before the system is run
Replacing droplet reader oil and removing waste. Slide out the carriage containing the droplet reader oil and waste receptacle to
remove and replace the bottles (left). After replacing oil, click Prime (right) to fill the lines; other instrument maintenance routines are for
use by field specialists only.
QX200 Droplet Reader and QuantaSoft Software Instruction Manual22 |
Page 31

Appendix A
Ordering Information
QX200™ ddPCR™ System
Catalog # Description
186 -40 01
186 -40 02
186-4003
186 -40 07
186 -40 08 DG8 Cartridges for QX100
186-3009 DG8 Gaskets for QX100/QX200
186-3051 DG8 Cartridge Holder
510-10608 Droplet Reader Plate Holder
Q
Q
Q
D
™
X200
Droplet Digital™ PCR
System, includes droplet generator,
droplet reader, laptop computer,
software, associated component
consumables
X200 Droplet Generator, includes
droplet generator, 1 box of 24
cartridges, 1 pkg of 24 gaskets,
2 cartridge holders, 1 power cord
X200 Droplet Reader, includes
droplet reader, ddPCR manual, 2 plate
holders, USB cable, power cord
roplet Generator Cartridges and
Gaskets, includes 5 pkg of 24 DG8
cartridges, 5 pkg of 24 DG8 gaskets
™
/QX200
Droplet Generator, 1 pkg of 24
cartridges
Droplet Generator, 1 pkg of 24 gaskets
186-3030
186-3005
186 -40 05 Droplet Generator Oil for EvaGreen
186 -40 06
186-3031 Droplet Reader Oil, 1 x 1 L
186-3004
D
roplet Generator Oil for Probes,
2 x 7 ml
roplet Generator Oil for Probes,
D
10 x 7 ml
Dye, 2 x 7 ml
roplet Generator Oil for EvaGreen
D
Dye, 10 x 7 ml
roplet Reader Oil, 2 x 1 L
D
ddPCR Reagents
186-3026 ddPCR Supermix for Probes, 2 ml
(2 x 1 ml), 2x supermix
™
186-3010
186-3027 ddPCR Supermix for Probes, 25 ml
186-3028 ddPCR Supermix for Probes, 50 ml
186-3023 Droplet PCR Supermix, 2 ml (2 x 1 ml),
186-3024 Droplet PCR Supermix, 5 ml (5 x 1 ml),
186-3025 Droplet PCR Supermix, 25 ml (5 x 5 ml),
dPCR Supermix for Probes, 5 ml
d
(5 x 1 ml), 2x supermix
(5 x 5 ml), 2x supermix
(10 x 5 ml), 2x supermix
2x supermix
2x supermix
2x supermix
QX200 Droplet Reader and QuantaSoft Software Instruction Manual | 23
Page 32

Appendix A Ordering Information
186-3021
O
ne-Step RT-ddPCR Kit for Probes,
2 ml (2 x 1 ml), 200 x 20 µl reactions, 2x
RT-ddPCR mix, includes 1 manganese
acetate tube
186-3022
O
ne-Step RT-ddPCR Kit for Probes,
5 ml (5 x 1 ml), 500 x 20 µl reactions, 2x
RT-ddPCR mix, includes 2 manganese
acetate tubes
186-4033
Q
™
X200
ddPCR™ EvaGreen® Supermix,
2 ml (2 x 1 ml), 200 x 20 µl reactions
186-4034
Q
X200 ddPCR EvaGreen Supermix,
5 ml (5 x 1 ml), 500 x 20 µl reactions
186-4035
X200 ddPCR EvaGreen Supermix,
Q
25 ml (5 x 5 ml), 2,500 x 20 µl reactions
186-4036 QX200 ddPCR EvaGreen Supermix,
50 ml (10 x 5 ml), 5,000 x 20 µl
reactions
186-3052 ddPCR Buffer Control Kit for Probes,
2 x 4.5 ml bottles, 2x buffer
186 -4052
dPCR Buffer Control Kit for
d
EvaGreen, 2 x 4.5 ml bottles, 2x buffer
Thermal Cyclers and Plate Sealer
18 5 -119 6 C1000 Touch™ Thermal Cycler with
96-Well Fast Reaction Module,
includes C1000 Touch thermal cycler
chassis, 96-well fast reaction module,
USB flash drive
181-4000
P
™
X1
Plate Sealer, includes heat
sealing instrument, plate support block
that holds 96-well and 384-well plates,
sealing frame, power cord
QX200 Droplet Reader and QuantaSoft Software Instruction Manual24 |
Page 33

Page 34

Page 35

Page 36

Life Science
Group
Bio-Rad
Laboratories, Inc.
Web site www.bio-rad.com USA 800 424 6723 Australia 61 2 9914 2800 Austria 01 877 89 01 Belgium 09 38 5 55 11 Brazil 55 11 5044 56 99
Canada 905 364 3435 China 86 21 6169 850 0 Czech Republi c 420 241 430 532 Denmark 4 4 52 10 00 Finland 09 804 22 00
France 01 47 95 69 65 Germany 08 9 31 884 0 Greece 30 210 9532 220 Hong Kong 852 2789 3 300 Hungary 36 1 459 6100 India 91 124 4029300
Israel 03 963 6050 Italy 39 02 216091 Japan 03 6361 7000 Korea 82 2 3473 4460 Mexi co 52 555 488 7670 The Netherlands 0318 540666
New Zealand 64 9 415 2280 Norway 23 38 41 30 Poland 48 22 331 99 99 Portugal 351 21 472 7700 Russia 7 495 721 14 04
Singapore 65 6415 3188 South Africa 27 861 246 723 Spain 34 91 590 520 0 Sweden 08 555 12700 Switzerland 026 674 55 05
Taiwan 886 2 2578 7189 Thailand 800 88 22 88 United Kingdom 020 8328 20 00
13-1367 0713 Sig 121210031906 Rev A US/EG
 Loading...