

Page 1
Technical Data Sheet
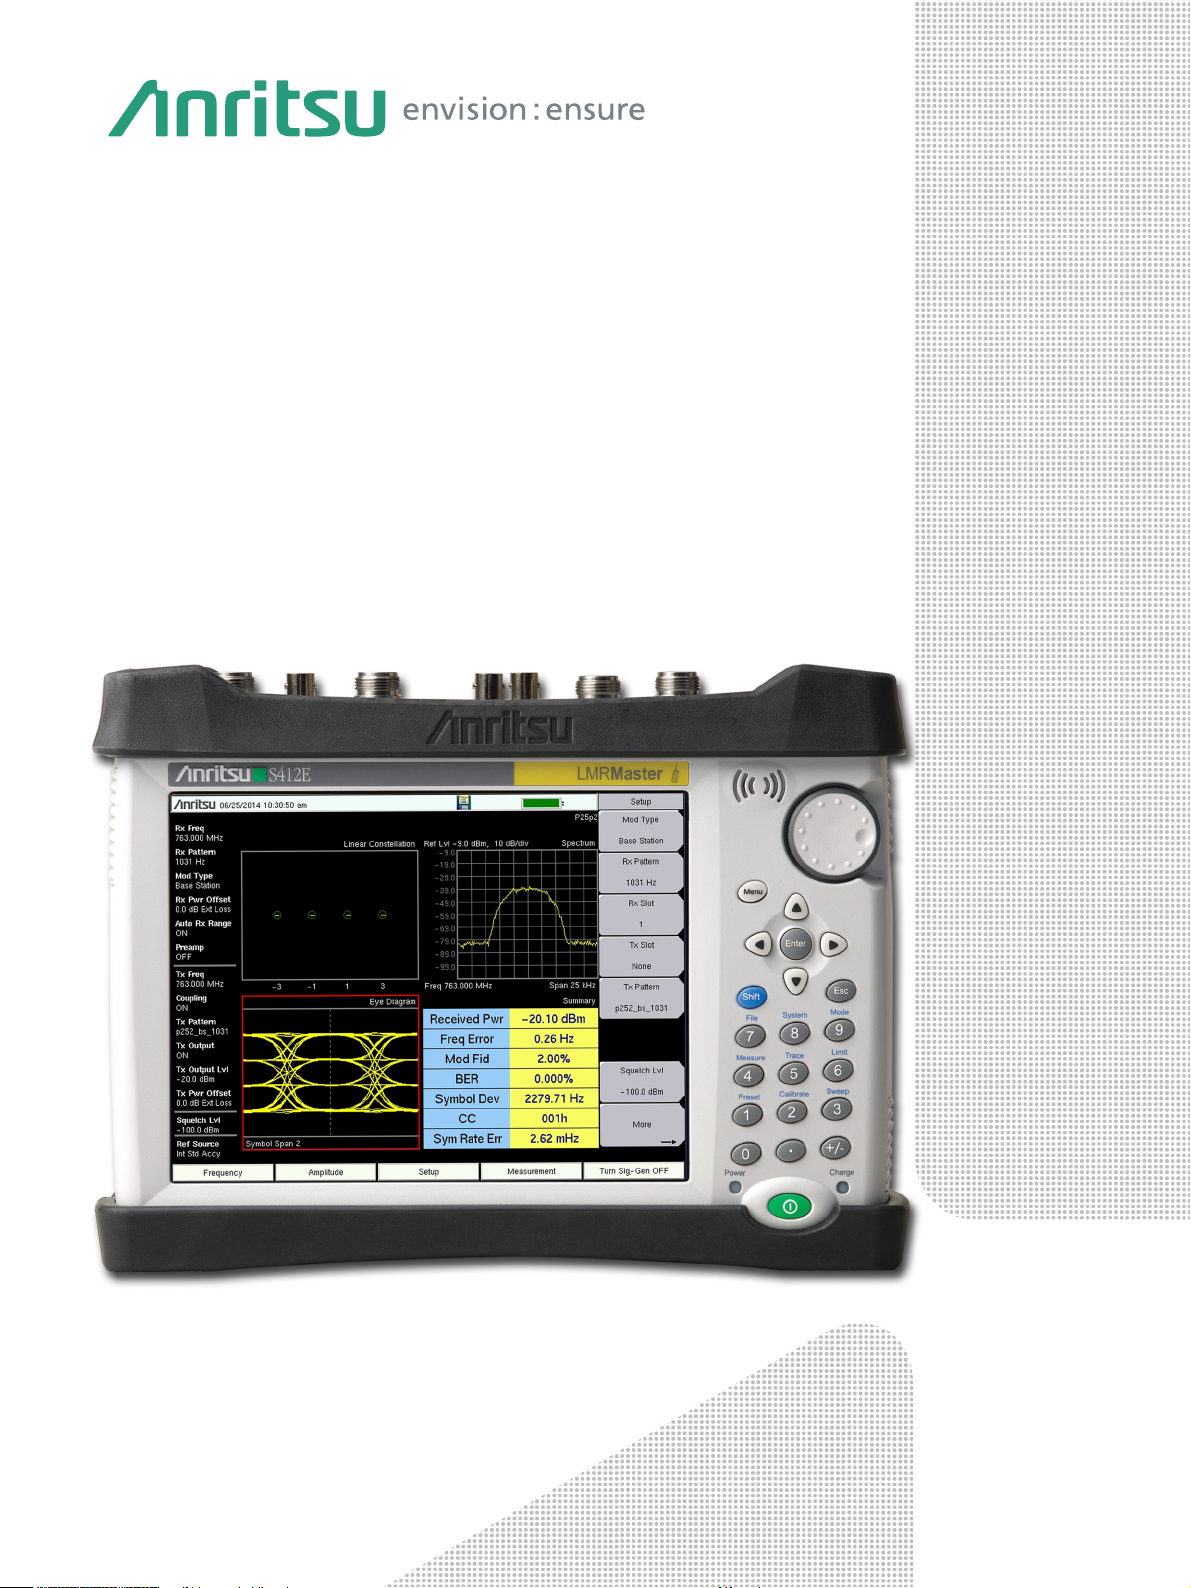
LMR Master
™
Land Mobile Radio Modulation and Signal Analyzer,
Vector Network Analyzer, and Spectrum Analyzer
S412E
9 kHz to 1.6 GHz Spectrum Analyzer
500 kHz to 1.6 GHz Vector Network Analyzer
Page 2
S412E Specifications
Introduction
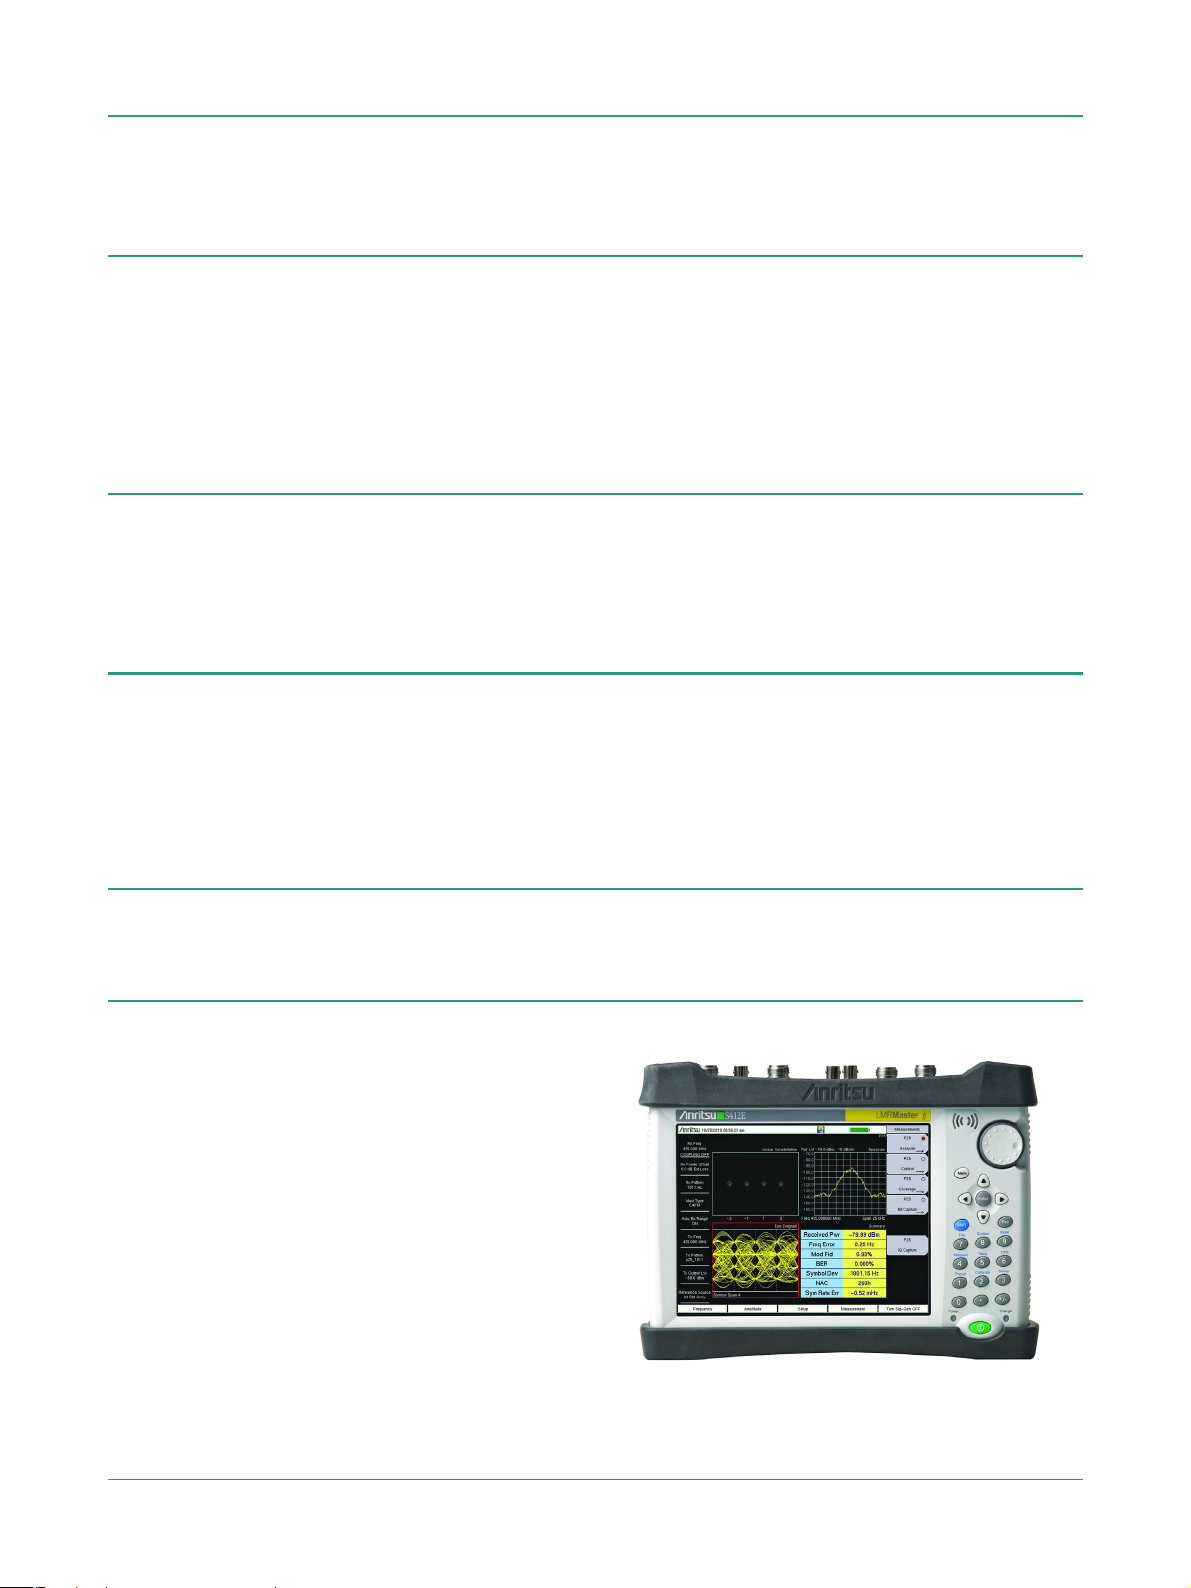
The S412E is Anritsu’s second generation solution for installing and maintaining public safety systems. Built on Anritsu’s
ninth generation handheld platform, the S412E combines a high performance receiver/spectrum analyzer with the world’s
most advanced handheld vector network analyzer plus a powerful vector signal generator with internally adjustable power
from 0 dBm to –130 dBm.
Land Mobile Radio Signal Analyzer Highlights
• Analyzes Narrowband FM analog systems
• Analyzes P25 (TIA-102.CAAA-C), P25 Phase 2 (TIA-102.CCAA),
DMR (MOTOTRBO™)
and TETRA digital systems
• 100 kHz to 1.6 GHz frequency coverage (Optional extension
to 6 GHz)
• Internal signal generator: 0.1 dB resolution, 0 dBm to
–130 dBm (spec to –120 dBm)
a. Supports those features compliant with the ETSI DMR standard.
a
, NXDN™, dPMR, PTC-ITCR, PTC-ACSES,
Spectrum Analyzer Highlights
• Measurements: Occupied Bandwidth, Channel Power,
ACPR, C/I, Coverage Mapping
• Interference Analyzer: Spectrogram, Signal Strength, RSSI,
Mapping
• 9 kHz to 1.6 GHz frequency coverage (Optional extension to
6GHz)
• 2.0 dB signal generator accuracy (typical)
• P25/P25p2, NXDN, and ETSI DMR BER test patterns
including 1011, 1031, and V.52/O.153
• Duplex test: Simultaneous analysis and generation of
analog or digital LMR signals
• Independent control of both receive/transmit frequencies
and test patterns
• TETRA Base Station Receiver Sensitivity Measurements
• Dynamic Range: > 95 dB in 10 Hz RBW
• DANL: –152 dBm in 10 Hz RBW
• Phase Noise: –100 dBc/Hz max @ 10 kHz offset at 1 GHz
• Frequency Accuracy: 120 ppb standard (25 °C ± 25 °C);
< 50 ppb after 3 minutes with GPS lock
• PIM Hunting
VNA Analyzer Highlights
• 1-path, 2-port Vector Network Analyzer (VNA) w/ quad trace
display
• 500 kHz to 1.6 GHz frequency coverage (Optional extension
to 6 GHz)
• Intuitive Graphical User Interface (GUI) with convenient
touchscreen
• VNA-quality error correction for directivity and source
match
Signal Generator Highlights
• 500 kHz to 1.6 GHz CW/FM/AM Modulation
• FM, 100 Hz to 10 kHz rate, adjustable deviation
• AM, 100 Hz to 10 kHz rate, adjustable depth
Capabilities and Functional Highlights
• Analog FM and digital LMR analyzer
• High accuracy internal power meter
• On-screen LMR Coverage Mapping (Outdoor and Indoor)
• GPS tagging of saved traces
• USB data transfer
• Complies with MIL-PRF-28800F Class 2 and MIL-STD-810G
• Certified for use in Explosive Atmosphere per
MIL-PRF-28800F 8.4 inch daylight-viewable TFT LCD color
resistive touchscreen – allows use while wearing gloves
• Touchscreen keyboard
• USB and Ethernet data transfer
• Web Remote Control
• Master Software Tools™
• 3 hour battery operation time
• Outstanding calibration stability, up to 16 hours
• Arbitrary data points up to 4001
• IF Bandwidth selections of 10 Hz to 100 kHz
• 100 dB transmission dynamic range
• 850 μs/data point sweep speed
• 0.1 dB resolution, 0 dBm to –130 dBm
• CW, FM with CTCSS/DCS/DTMF, FM with CTCSS/DCS/DTMF +
Tone Modulation, FM + Tone Modulation
LMR Master™ S412E featuring 8.4 inch Daylight Viewable Touchscreen
Compact Size: 273 mm x 199 mm x 91 mm, (10.7 in x 7.8 in x 3.6 in),
Lightweight: 3.6 kg, (7.9 lb)
2 of 40 PN: 11410-00486 Rev. AT S412E TDS
Page 3

Specifications S412E
Table of Contents
Spectrum Analyzer . . . . . . . . . . . . . . . . . . . . . . . . . . . . . . . . . . . . . . . . . . . . . . . . . . . . . . . . . . . . . . . . . . . . . . . . . . . . . 4
Vector Network Analyzer . . . . . . . . . . . . . . . . . . . . . . . . . . . . . . . . . . . . . . . . . . . . . . . . . . . . . . . . . . . . . . . . . . . . . . . . 6
Interference Analyzer (Option 25). . . . . . . . . . . . . . . . . . . . . . . . . . . . . . . . . . . . . . . . . . . . . . . . . . . . . . . . . . . . . . . . 11
Channel Scanner (Option 27) . . . . . . . . . . . . . . . . . . . . . . . . . . . . . . . . . . . . . . . . . . . . . . . . . . . . . . . . . . . . . . . . . . . . 11
GPS Receiver (Option 31) . . . . . . . . . . . . . . . . . . . . . . . . . . . . . . . . . . . . . . . . . . . . . . . . . . . . . . . . . . . . . . . . . . . . . . . 11
Ethernet Connectivity . . . . . . . . . . . . . . . . . . . . . . . . . . . . . . . . . . . . . . . . . . . . . . . . . . . . . . . . . . . . . . . . . . . . . . . . . .11
Coverage Mapping (Option 431) . . . . . . . . . . . . . . . . . . . . . . . . . . . . . . . . . . . . . . . . . . . . . . . . . . . . . . . . . . . . . . . . . 12
Electromagnetic Field Test (Option 444) . . . . . . . . . . . . . . . . . . . . . . . . . . . . . . . . . . . . . . . . . . . . . . . . . . . . . . . . . . 12
CW Signal Generator. . . . . . . . . . . . . . . . . . . . . . . . . . . . . . . . . . . . . . . . . . . . . . . . . . . . . . . . . . . . . . . . . . . . . . . . . . . 12
Internal Power Meter . . . . . . . . . . . . . . . . . . . . . . . . . . . . . . . . . . . . . . . . . . . . . . . . . . . . . . . . . . . . . . . . . . . . . . . . . . 13
High Accuracy Power Meter (Option 19) . . . . . . . . . . . . . . . . . . . . . . . . . . . . . . . . . . . . . . . . . . . . . . . . . . . . . . . . . . 13
NBFM Analyzer and Coverage Mapping . . . . . . . . . . . . . . . . . . . . . . . . . . . . . . . . . . . . . . . . . . . . . . . . . . . . . . . . . .14
P25/P25p2 Analyzer and P25/P25p2 Talk-Out Coverage (Options 521 and 522) . . . . . . . . . . . . . . . . . . . . . . . . 15
P25/P25p2 Signal Generator . . . . . . . . . . . . . . . . . . . . . . . . . . . . . . . . . . . . . . . . . . . . . . . . . . . . . . . . . . . . . . . . . . . .16
DMR (MOTOTRBO) Analyzer and DMR Talk-Out Coverage (Options 591 and 592) . . . . . . . . . . . . . . . . . . . . . . . 17
dPMR Analyzer (Options 573 and 572) . . . . . . . . . . . . . . . . . . . . . . . . . . . . . . . . . . . . . . . . . . . . . . . . . . . . . . . . . . . . 18
NXDN Analyzer and NXDN Talk-Out Coverage (Options 531 and 532) . . . . . . . . . . . . . . . . . . . . . . . . . . . . . . . . . 19
TETRA Analyzer and TETRA Coverage Mapping (Options 581 and 582) . . . . . . . . . . . . . . . . . . . . . . . . . . . . . . . . 20
PTC-ITCR Analyzer and PTC-ITCR Talk-Out Coverage (Options 721 and 722) . . . . . . . . . . . . . . . . . . . . . . . . . . .21
PTC-ACSES Analyzer and PTC ACSES Talk-Out Coverage (Options 731 and 733). . . . . . . . . . . . . . . . . . . . . . . . . 22
AM/FM/PM Signal Analyzers (Option 509) . . . . . . . . . . . . . . . . . . . . . . . . . . . . . . . . . . . . . . . . . . . . . . . . . . . . . . . . . 23
LTE Signal Analyzers (Options 541, 542, 546, and 886) . . . . . . . . . . . . . . . . . . . . . . . . . . . . . . . . . . . . . . . . . . . . . . 24
TDD LTE Signal Analyzers (Options 551, 552, and 556) . . . . . . . . . . . . . . . . . . . . . . . . . . . . . . . . . . . . . . . . . . . . . .25
GSM/GPRS/EDGE Measurements (Option 880). . . . . . . . . . . . . . . . . . . . . . . . . . . . . . . . . . . . . . . . . . . . . . . . . . . . . 26
IEEE 802.16 Fixed WiMAX Signal Analyzers (Options 46 and 47) . . . . . . . . . . . . . . . . . . . . . . . . . . . . . . . . . . . . . . 27
IEEE 802.16 Mobile WiMAX Signal Analyzers (Options 66, 67, and 37) . . . . . . . . . . . . . . . . . . . . . . . . . . . . . . . . .28
General Specifications . . . . . . . . . . . . . . . . . . . . . . . . . . . . . . . . . . . . . . . . . . . . . . . . . . . . . . . . . . . . . . . . . . . . . . . . . 29
Master Software Tools . . . . . . . . . . . . . . . . . . . . . . . . . . . . . . . . . . . . . . . . . . . . . . . . . . . . . . . . . . . . . . . . . . . . . . . . . 31
easyTest Tools™ . . . . . . . . . . . . . . . . . . . . . . . . . . . . . . . . . . . . . . . . . . . . . . . . . . . . . . . . . . . . . . . . . . . . . . . . . . . . . . . 31
Line Sweep Tools . . . . . . . . . . . . . . . . . . . . . . . . . . . . . . . . . . . . . . . . . . . . . . . . . . . . . . . . . . . . . . . . . . . . . . . . . . . . . .32
Web Remote Control. . . . . . . . . . . . . . . . . . . . . . . . . . . . . . . . . . . . . . . . . . . . . . . . . . . . . . . . . . . . . . . . . . . . . . . . . . . 32
Programmable Remote Control . . . . . . . . . . . . . . . . . . . . . . . . . . . . . . . . . . . . . . . . . . . . . . . . . . . . . . . . . . . . . . . . . 32
Ordering Information – Options . . . . . . . . . . . . . . . . . . . . . . . . . . . . . . . . . . . . . . . . . . . . . . . . . . . . . . . . . . . . . . . . .33
Standard Accessories . . . . . . . . . . . . . . . . . . . . . . . . . . . . . . . . . . . . . . . . . . . . . . . . . . . . . . . . . . . . . . . . . . . . . . . . . . 34
Manuals, Related Literature. . . . . . . . . . . . . . . . . . . . . . . . . . . . . . . . . . . . . . . . . . . . . . . . . . . . . . . . . . . . . . . . . . . . . 34
Troubleshooting Guides . . . . . . . . . . . . . . . . . . . . . . . . . . . . . . . . . . . . . . . . . . . . . . . . . . . . . . . . . . . . . . . . . . . . . . . . 34
Optional Accessories. . . . . . . . . . . . . . . . . . . . . . . . . . . . . . . . . . . . . . . . . . . . . . . . . . . . . . . . . . . . . . . . . . . . . . . . . . . 35
Definitions
Warm-Up Time After 15 minutes of warm-up time in VNA mode, where the instrument is left in the ON state.
Temperature Range Over the 23 °C ± 5 °C temperature range, unless otherwise noted.
Reference Signal When using internal reference signal.
Typical Performance Typical specifications that are not in parenthesis are not tested and not warranted. They are generally
Uncertainty A coverage factor of x1 is applied to the measurement uncertainties to facilitate comparison with other
Calibration Cycle Calibration is within the recommended 12 month period (residual specifications also require calibration kit
All specifications and characteristics apply to Revision 4 instruments under the following conditions, unless
otherwise noted:
representative of characteristic performance. Typical specifications in parenthesis () represent the mean
value of measured units and do not include any guard-bands or uncertainties. They are not warranted.
industry handheld analyzers.
calibration cycle adherence.)
All specifications subject to change without notice. For the most current data sheet, please visit the Anritsu
web site:
www.anritsu.com
S412E TDS PN: 11410-00486 Rev. AT 3 of 40
Page 4

S412E Specifications
Spectrum Analyzer
Measurements
Smart Measurements Field Strength (uses antenna calibration tables to measure dBm/m2 or dBmV/m)
Setup Parameters
Frequency Center/Start/Stop, Span, Frequency Step, Signal Standard, Channel #, Channel Increment
Amplitude Reference Level (RL), Scale, Attenuation Auto/Level, RL Offset, Pre-Amp On/Off, Detection
Bandwidth RBW, Auto RBW, VBW, Auto VBW, RBW/VBW, Span/RBW
Save-on-Event Crossing Limit Line, Sweep Complete, Save-then-Stop, Clear All
Delete Selected file or files from internal/external memory (USB)
Application Options Bias-Tee On/Off, Impedance (50
Occupied Bandwidth (measures 99% to 1% power channel of a signal)
Channel Power (measures the total power in a specified bandwidth)
ACPR (Adjacent Channel Power Ratio)
AM/FM/SSB Audio Demodulation (Wide/Narrow FM, AM, Upper/Lower SSB)
C/I (carrier-to-interference ratio)
Emission Mask
Coverage Mapping (requires option 431)
PIM Alert Application (available for download)
PIM Hunting
Span Span, Span Up/Down (1-2-5), Full Span, Zero Span, Last Span
File Save, Save-on-Event, Recall, Copy, Delete
Save Setups, Measurements, Screen Shots (JPEG), Limit Lines, Spurious Emission Mask
Recall Setups, Measurements, Limit Lines, Spurious Emission Mask
Copy Selected file or files to internal/external memory (USB)
Ω
, 75 Ω, Other)
Sweep Functions
Trace Functions
Trace A Operations Normal, Max Hold, Min Hold, Average, # of Averages, (always the live trace)
Trace B Operations A
Trace C Operations A
Marker Functions
Limit Line Functions
Limit Line Envelope Create Envelope, Update Amplitude, Points (41 max), Offset, Shape Square/Slope
Limit Line Advanced Type (Absolute/Relative), Mirror, Save/Recall
Frequency
Tuning Resolution 1 Hz
Frequency Reference Aging ± 1.0 ppm/year
Frequency Reference Accuracy ± 120 ppb (25 °C ± 25 °C) + aging, < 50 ppb + aging with GPS lock
Sweep Time Accuracy ± 2% in zero span
Sweep Single/Continuous, Manual Trigger, Reset, Detection, Minimum Sweep Time, Trigger Type
Detection Peak, RMS, Negative, Sample, Quasi-peak
Triggers Free Run, External, Video, Change Position, Manual
Traces Up to three Traces (A, B, C), View/Blank, Write/Hold, Trace A/B/C Operations
→
B, B ↔ C, Max Hold, Min Hold
→
C, B ↔ C, Max Hold, Min Hold, A – B → C, B – A → C, Relative Reference (dB), Scale
Markers Markers 1-6 each with a Delta Marker, or Marker 1 Reference with Six Delta Markers, Marker Table On/Off,
Marker Types Style (Fixed/Tracking), Noise Marker, Frequency Counter Marker, Marker Auto-Position Peak Search,
Marker Table 1-6 markers frequency and amplitude plus delta markers frequency offset and amplitude
Limit Lines Upper/Lower, On/Off, Edit, Move, Envelope, Advanced, Limit Alarm, Default Limit
Limit Line Edit Frequency, Amplitude, Add Point, Add Vertical, Delete Point, Next Point Left/Right
Limit Line Move To Current Center Frequency, By dB or Hz, To Marker 1, Offset from Marker 1
Frequency Range 9 kHz to 1.6 GHz, (6 GHz with Option 6)
Frequency Span 10 Hz to 1.6 GHz including zero span (10 Hz to 6 GHz with Option 6)
Sweep Time 100 ms min, 7
All Markers Off
Next Peak (Right/Left), Peak Threshold %, Set Marker to Channel, Marker Frequency to Center, Delta Marker
to Span, Marker to Reference Level
μ
s to 3600 seconds in zero span
Bandwidth
Resolution Bandwidth (RBW) 10 Hz to 3 MHz in 1–3 sequence ± 10% (1 MHz max in zero-span) (–3 dB bandwidth)
Video Bandwidth (VBW) 1 Hz to 3 MHz in 1–3 sequence (–3 dB bandwidth) (auto or manually selectable)
RBW with Quasi-Peak Detection 200 Hz, 9 kHz, 120 kHz (–6 dB bandwidth)
VBW with Quasi-Peak Detection Auto VBW is On, RBW/VBW = 1
4 of 40 PN: 11410-00486 Rev. AT S412E TDS
Page 5

Specifications S412E
Spectrum Analyzer
(Continued)
Spectral Purity
SSB Phase Noise @ 1 GHz –100 dBc/Hz, –110 dBc/Hz typical @ 10 kHz offset
–105 dBc/Hz, –112 dBc/Hz typical @ 100 kHz offset
–115 dBc/Hz, –121 dBc/Hz typical @ 1 MHz offset
Amplitude Ranges
Dynamic Range > 95 dB (2.4 GHz), 2/3 (TOI-DANL) in 10 Hz RBW
Measurement Range DANL to +26 dBm (≥ 50 MHz)
RF In Port Damage Level +33 dBm peak, ± 50 VDC, Maximum Continuous Input (
Display Range 1 to 15 dB/div in 1 dB steps, ten divisions displayed
Reference Level Range –150 dBm to +30 dBm
Attenuator Resolution 0 to 55 dB, 5.0 dB steps
Amplitude Units Log Scale Modes: dBW, dBm, dBμW, dBV, dBmV, dBμV, dBA, dBmA, dBμA
DANL to 0 dBm (< 50 MHz)
Linear Scale Modes: nV,
μ
V, mV, V, kV, nW, μW, mW, W, kW, nA, μA, mA, A
≥
10 dB attenuation)
Amplitude Accuracy
(Single sine wave, input power < Ref level and > DANL, Attenuation: Auto, Ambient: –10 °C to 50 °C after 30 minute warm-up)
9 kHz to 100 kHz ± 2.0 dB typical (Preamp Off)
> 100 kHz to 4.0 GHz ± 1.25 dB, ± 0.5 dB typical
> 4.0 GHz to 6 GHz ± 1.50 dB, ± 0.5 dB typical
Displayed Average Noise Level (DANL)
Preamp Off
(Reference Level –20 dBm)
(RBW = 1 Hz, 0 dB attenuation) Maximum Typical Maximum Typical
10 MHz to 2.4 GHz –141 dBm –146 dBm –157 dBm –162 dBm
> 2.4 GHz to 4 GHz –137 dBm –141 dBm –154 dBm –159 dBm
> 4 GHz to 5 GHz –134 dBm –138 dBm –150 dBm –155 dBm
> 5 GHz to 6 GHz –126 dBm –131 dBm –143 dBm –150 dBm
(RBW = 10 Hz, 0 dB attenuation)
10 MHz to 2.4 GHz –131 dBm –136 dBm –147 dBm –152 dBm
> 2.4 GHz to 4 GHz –127 dBm –131 dBm –144 dBm –149 dBm
> 4 GHz to 5 GHz –124 dBm –128 dBm –140 dBm –145 dBm
> 5 GHz to 6 GHz –116 dBm –121 dBm –133 dBm –140 dBm
Preamp On
(Reference Level –50 dBm)
Spurs
Residual Spurious < –90 dBm (RF input terminated, 0 dB input attenuation, > 10 MHz)
Input-Related Spurious < –75 dBc (0 dB attenuation, –30 dBm input, span < 1.7 GHz, carrier offset > 4.5 MHz)
Exceptions, typical < –70 dBc @ < 2.5 GHz with 2072.5 MHz Input
Third-Order Intercept (TOI)
800 MHz +16 dBm
2400 MHz +20 dBm
200 MHz to 2200 MHz +25 dBm typical
> 2.2 GHz to 5.0 GHz +28 dBm typical
> 5.0 GHz to 6.0 GHz +33 dBm typical
Second Harmonic Distortion
50 MHz –56 dBc
> 50 MHz to 200 MHz –60 dBc typical
> 200 MHz to 3000 MHz –70 dBc typical
VSWR
< –68 dBc @ F1 – 280 MHz with F1 Input
< –70 dBc @ F1 + 190.5 MHz with F1 Input
< –52 dBc @ 7349 – 2F2 MHz with F2 Input, where F2 < 2437.5 MHz
< –55 dBc @ 190.5 ± F1/2 MHz, F1 < 1 GHz
(Preamp Off, –20 dBm tones, 100 kHz apart, 10 dB attenuation)
(Preamp Off, 0 dB input attenuation, –30 dBm input)
2:1 typical
S412E TDS PN: 11410-00486 Rev. AT 5 of 40
Page 6
S412E Specifications
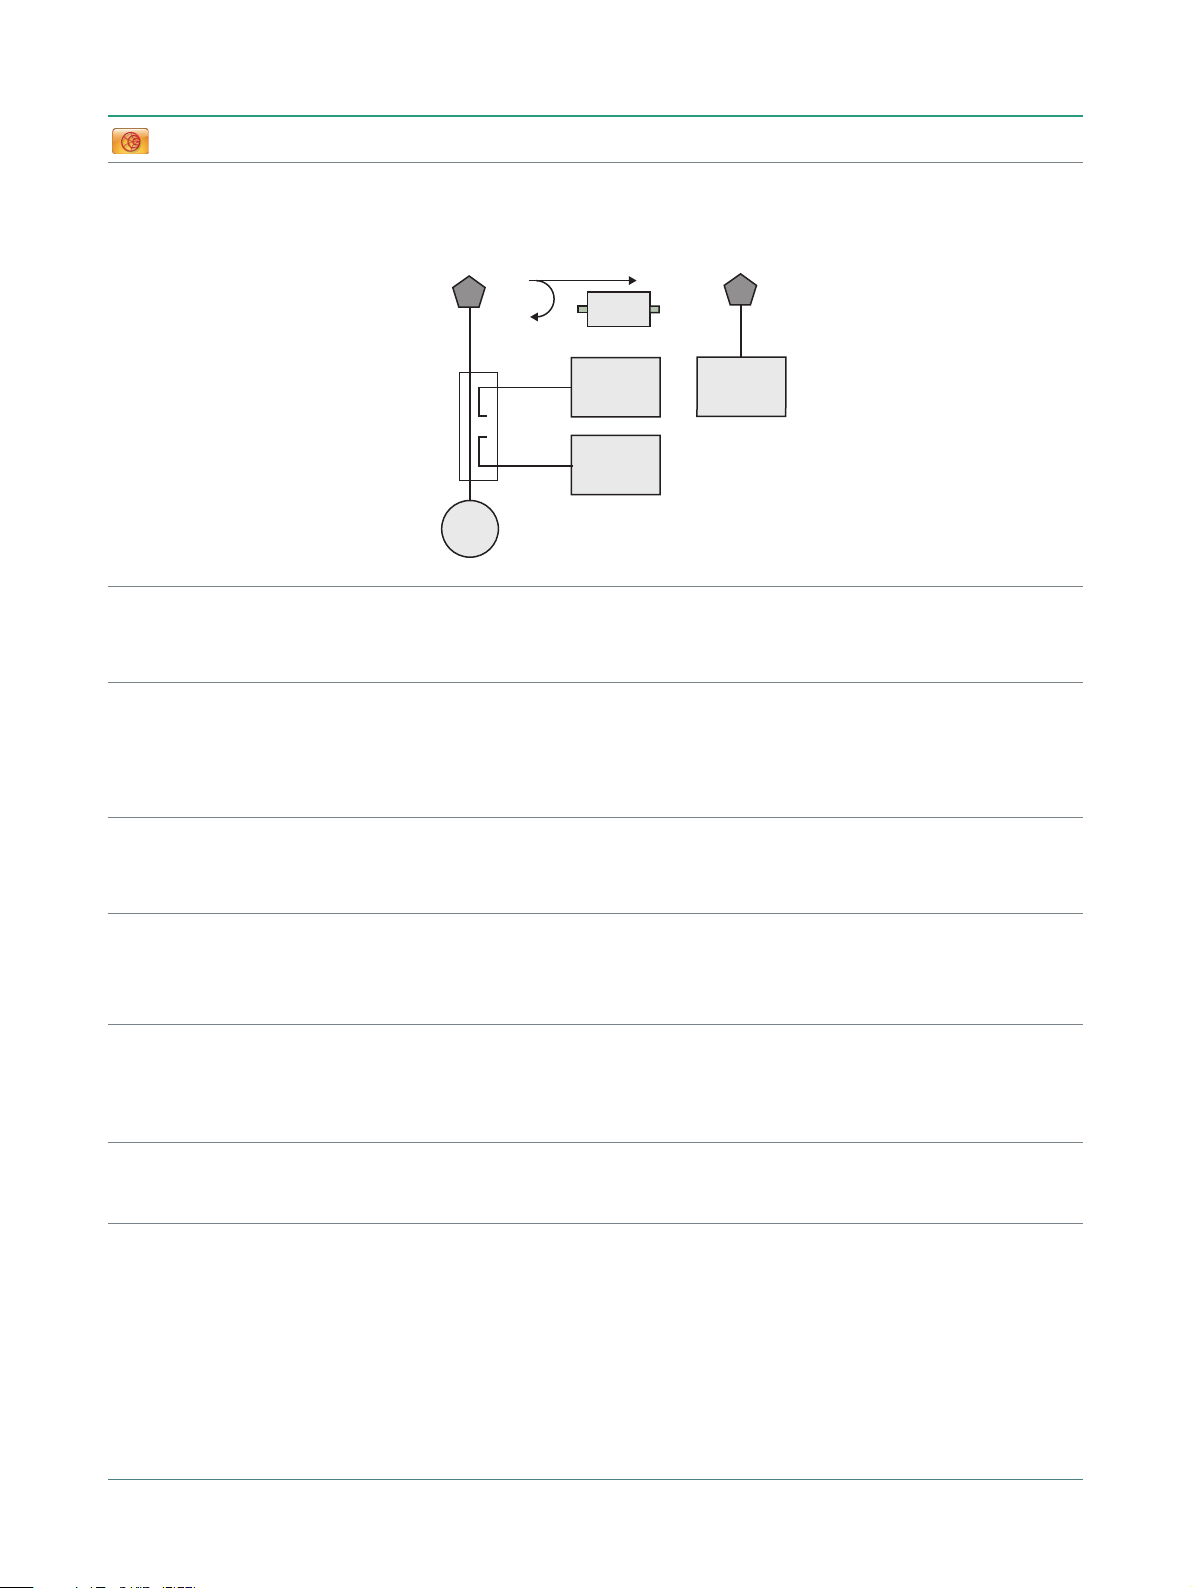
DUT
Reference
Receiver
Port 1
Bridge/
Coupler
Source
S
11
S
21
Port 2
VNA
Receiver
Port 2
VNA
Receiver
Port 1
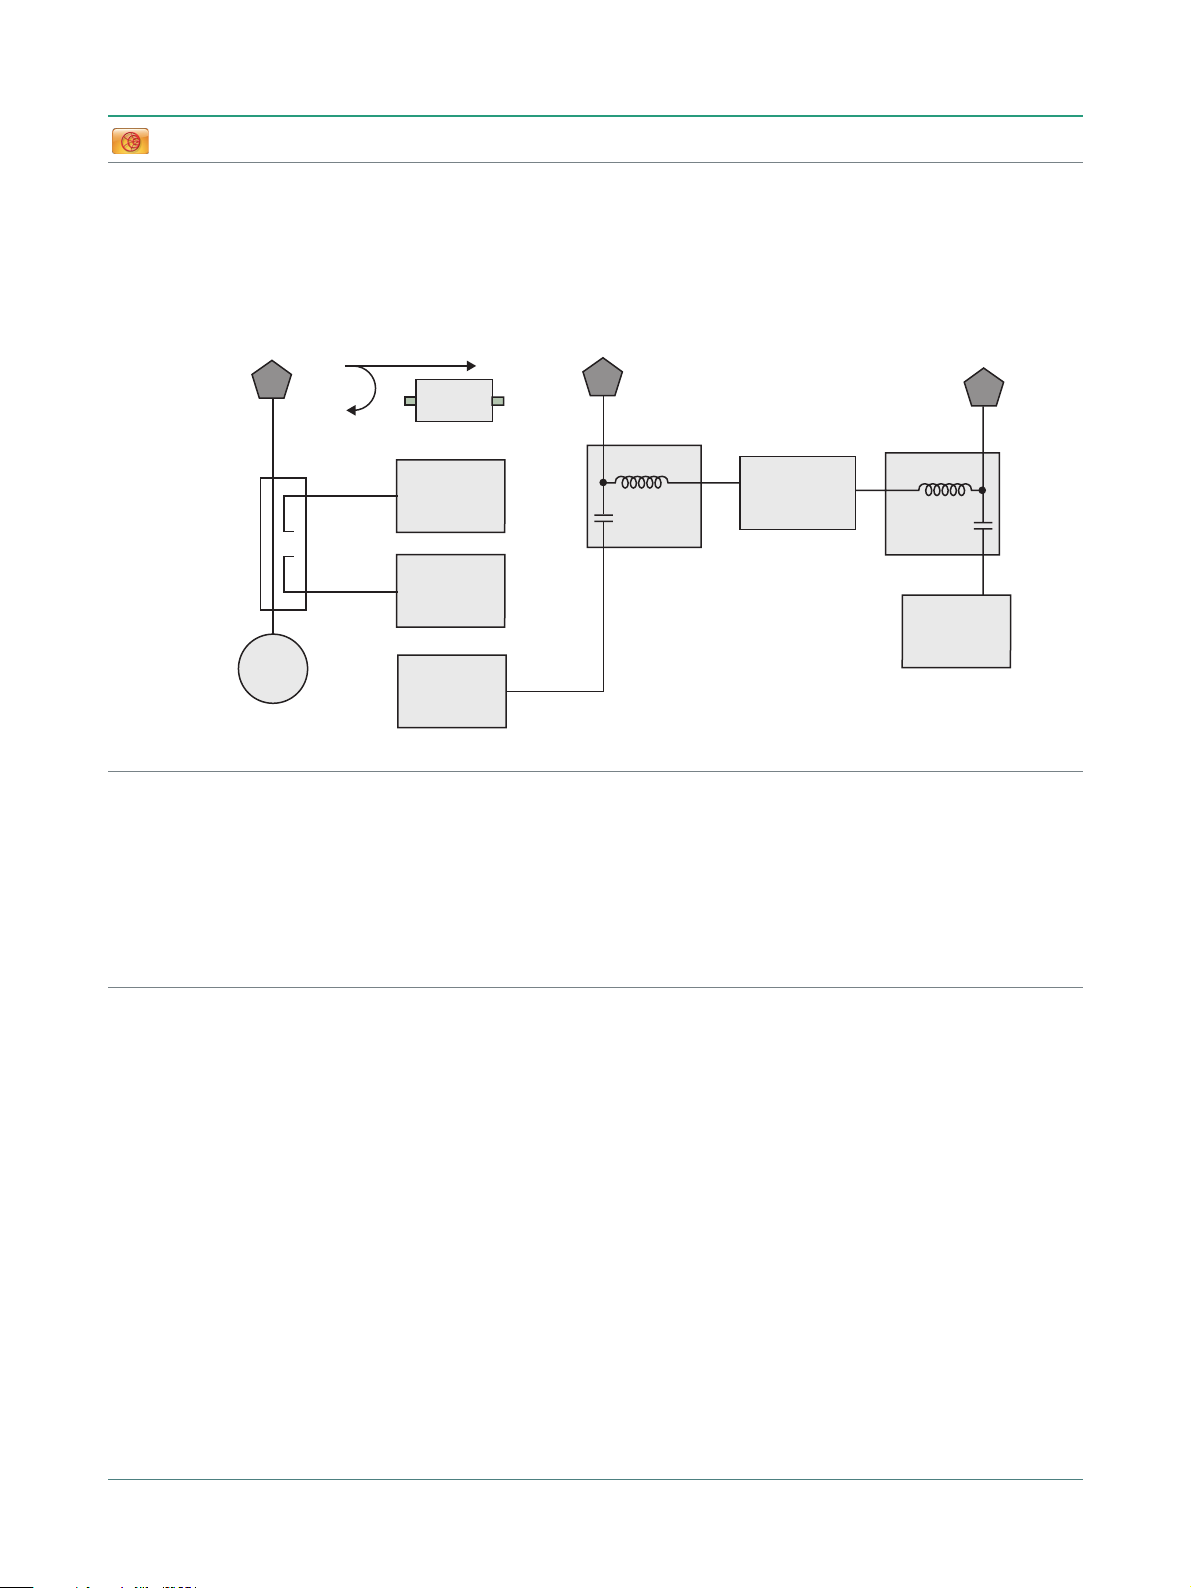
Vector Network Analyzer
Block Diagram
As shown in the following simplified block diagram, the LMR Master has a 2-port, 1-path architecture that automatically measures two S-parameters with
error-correction precision inherent to VNA operation. The magnitude and phase information gained from vector network data enables the LMR Master
to make significant error corrections and provide improved field measurements.
Frequency
Frequency Range 500 kHz to 1.6 GHz (500 kHz to 6.0 GHz with Option 16)
Frequency Accuracy 2.5 ppm
Frequency Resolution 1 Hz
Test Port Power
LMR Master supports selection of High, Default, or Low test port power. Changing power after calibration can degrade the calibrated performance.
Typical test port power by bands is shown in the following table.
Frequency Range High Port Power Default Port Power Low Port Power
500 kHz to ≤ 3 GHz +3 dBm –5 dBm –25 dBm
3 GHz to
(Typical)
≤
6 GHz 0 dBm –5 dBm –25 dBm
Transmission Dynamic Range
The transmission dynamic range (the difference between test port power and noise floor) using 10 Hz IF Bandwidth and High Port Power:
≤
2 MHz to
4 GHz to
Sweep Speed
The two-receiver architecture will simultaneously collect S
points, and single display is:
Noise Floor
(Typical)
Frequency Range 500 kHz to 6 GHz
Typical Sweep Speed 850
(Typical)
Temperature Stability
Frequency Range Magnitude (Typical) Phase (Typical)
500 kHz to 6 GHz 0.020 dB/ºC 0.200 deg/ºC
4 GHz 100 dB
≤
6 GHz 90 dB
and S11 in a single sweep. The typical sweep speed for IF Bandwidth of 100 Hz, 1001 data
21
μ
s / point
Frequency Range Typical Noise Floor
500 kHz to 3 GHz –100 dBm
3 GHz to 4 GHz –103 dBm
4 GHz to 6 GHz –93 dBm
(S11 or S21, Short, 23 ºC ± 5 ºC)
Interference Immunity
On-Channel +17 dBm at > 1.0 MHz from carrier frequency
On-Frequency 0 dBm within ± 10 kHz of the carrier frequency
6 of 40 PN: 11410-00486 Rev. AT S412E TDS
Page 7

Specifications S412E
Vector Network Analyzer
(Continued)
Measurements
Measurement Parameters S11, S21
Number of Traces Four: TR1, TR2, TR3, TR4
Trace Format Single, Dual, Tri, Quad. When used with Number of Traces, overlays are possible including a Single Format
Graph Types Log Magnitude, SWR, Phase, Real, Imaginary, Group Delay, Smith Chart, Log Mag/2 (1-Port Cable Loss),
Domains Frequency Domain, Distance Domain
Frequency Start Frequency, Stop Frequency, Center Frequency, Span
Distance Start Distance, Stop Distance
Frequency Sweep Type: Linear Single Sweep, Continuous
Data Points 2 to 4001 (arbitrary setting); data points can be reduced without recalibration.
Limit Lines Upper, Lower, 10 segmented Upper, 10 segmented Lower
Test Limits Pass/Fail for Upper, Pass/Fail for Lower, Limit Audible Alarm
Data Averaging Sweep-by-sweep
Smoothing 0 to 20 %
IF Bandwidth 10, 20, 50, 100, 200, 500, 1 k, 2 k, 5 k, 10 k, 20 k, 50 k, 100 k (Hz)
Reference Plane The reference planes of a calibration (or other normalization) can be changed by entering a line length.
Auto Reference Plane Extension Instead of manually entering a line length, this feature automatically adjusts phase shift from the current
Frequency Range Frequency range of the measurement can be narrowed (reduces number of data points) within the
Group Delay Aperture Defined as the frequency span over which the phase change is computed at a given frequency point. The
Group Delay Range < 180º of phase change within the aperture
Trace Memory A separate memory for each trace can be used to store measurement data for later display. The trace data
Trace Math Complex trace math operations of subtraction, addition, multiplication, or division are provided.
Number of Markers 12, arbitrary assignments to any trace
Marker Types Reference, Delta
Marker Readout Styles Log Mag, Cable Loss (Log Mag/2), Log Mag and Phase, Phase, Real and Imaginary, SWR, Impedance,
Marker Search Peak Search, Valley Search, Find Marker Value
Calibration Type Full S
Calibration Methods Short-Open-Load-Through (SOLT)
Calibration Standards’ Coefficients Coax: N-Connector, K-Connector, 7/16, TNC, SMA, and four User Defined
Cal Correction Toggle On/Off
Interpolation On/Off (Interpolation may be activated before or after calibration)
Impedance Conversion (Smith Chart) Support for 50 Ω and 75 Ω are provided.
Bias Tee Settings Internal, Off
Timebase Reference Internal
File Storage Types Measurement, Setup (with CAL), Setup (without CAL), S2P (Real/Imag), S2P (Lin Mag/Phase), S2P (Log
Languages English, French, German, Spanish, Chinese, Japanese, Korean, Italian, Russian, and Portuguese
with Four trace overlays.
Linear Polar, Log Polar, Real Impedance, Imaginary Impedance
Assumes no loss, flat magnitude, linear phase, and constant impedance.
calibration (or other normalization) to compensate for external cables (or test fixtures). Assumes no loss,
flat magnitude, linear phase, and constant impedance.
calibration range without recalibration. When Interpolation is On, narrowed frequency range will retain
original number of data points.
aperture can be changed without recalibration. The minimum aperture is the frequency range divided by
the number of points in calibration and can be increased to 20% of the frequency range.
can be saved and recalled.
Admittance, Normalized Impedance, Normalized Admittance, Polar Impedance, and Group Delay
, 1-Path, 2-Port (S11 and S21), Response S11, Response S
11
Units Meters, Feet
Mag/Phase), JPEG
21
S412E TDS PN: 11410-00486 Rev. AT 7 of 40
Page 8
S412E Specifications
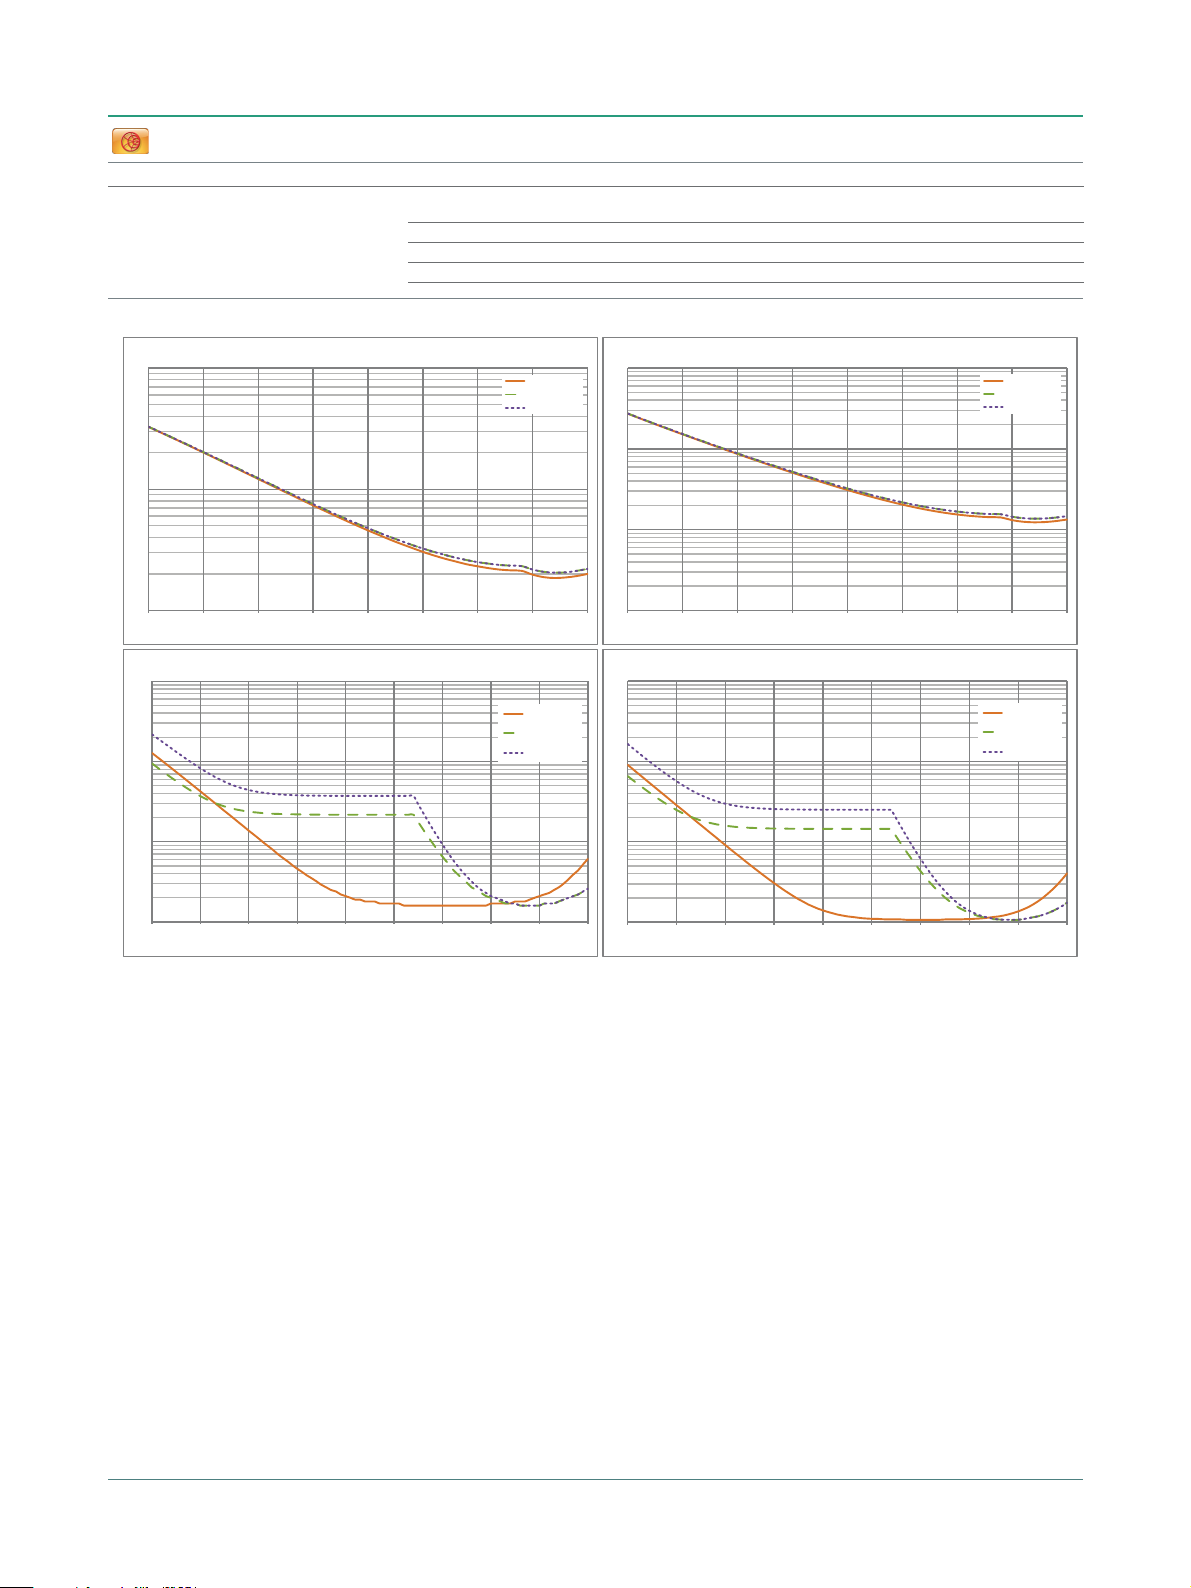
0.01
0.1
1
10
-90 -80 -70 -60 -50 -40 -30 -20 -10 0
Transmission Magnitude (dB)
Transmission Magnitude Uncertainty (dB)
2 MHz - 20 MHz
20 MHz - 3 GHz
3 GHz - 6 GHz
0.1
1
10
100
-90 -80 -70 -60 -50 -40 -30 -20 -10 0
Transmission Magnitude (dB)
Transmission Phase Uncertainty (degrees)
2 MHz - 20 MHz
20 MHz - 3 GHz
3 GHz - 6 GHz
0.1
1
10
-40 -35 -30 -25 -20 -15 -10 -5 0
Return Loss (dB)
Return Loss Magnitude Uncertainty (dB)
2 MHz - 20 MHz
20 MHz - 3 GHz
3 GHz - 6 GHz
0.1
1
10
100
-40 -35 -30 -25 -20 -15 -10 -5 0
Return Loss (dB)
Return Loss Phase Uncertainty (degrees)
2 MHz - 20 MHz
20 MHz - 3 GHz
3 GHz - 6 GHz
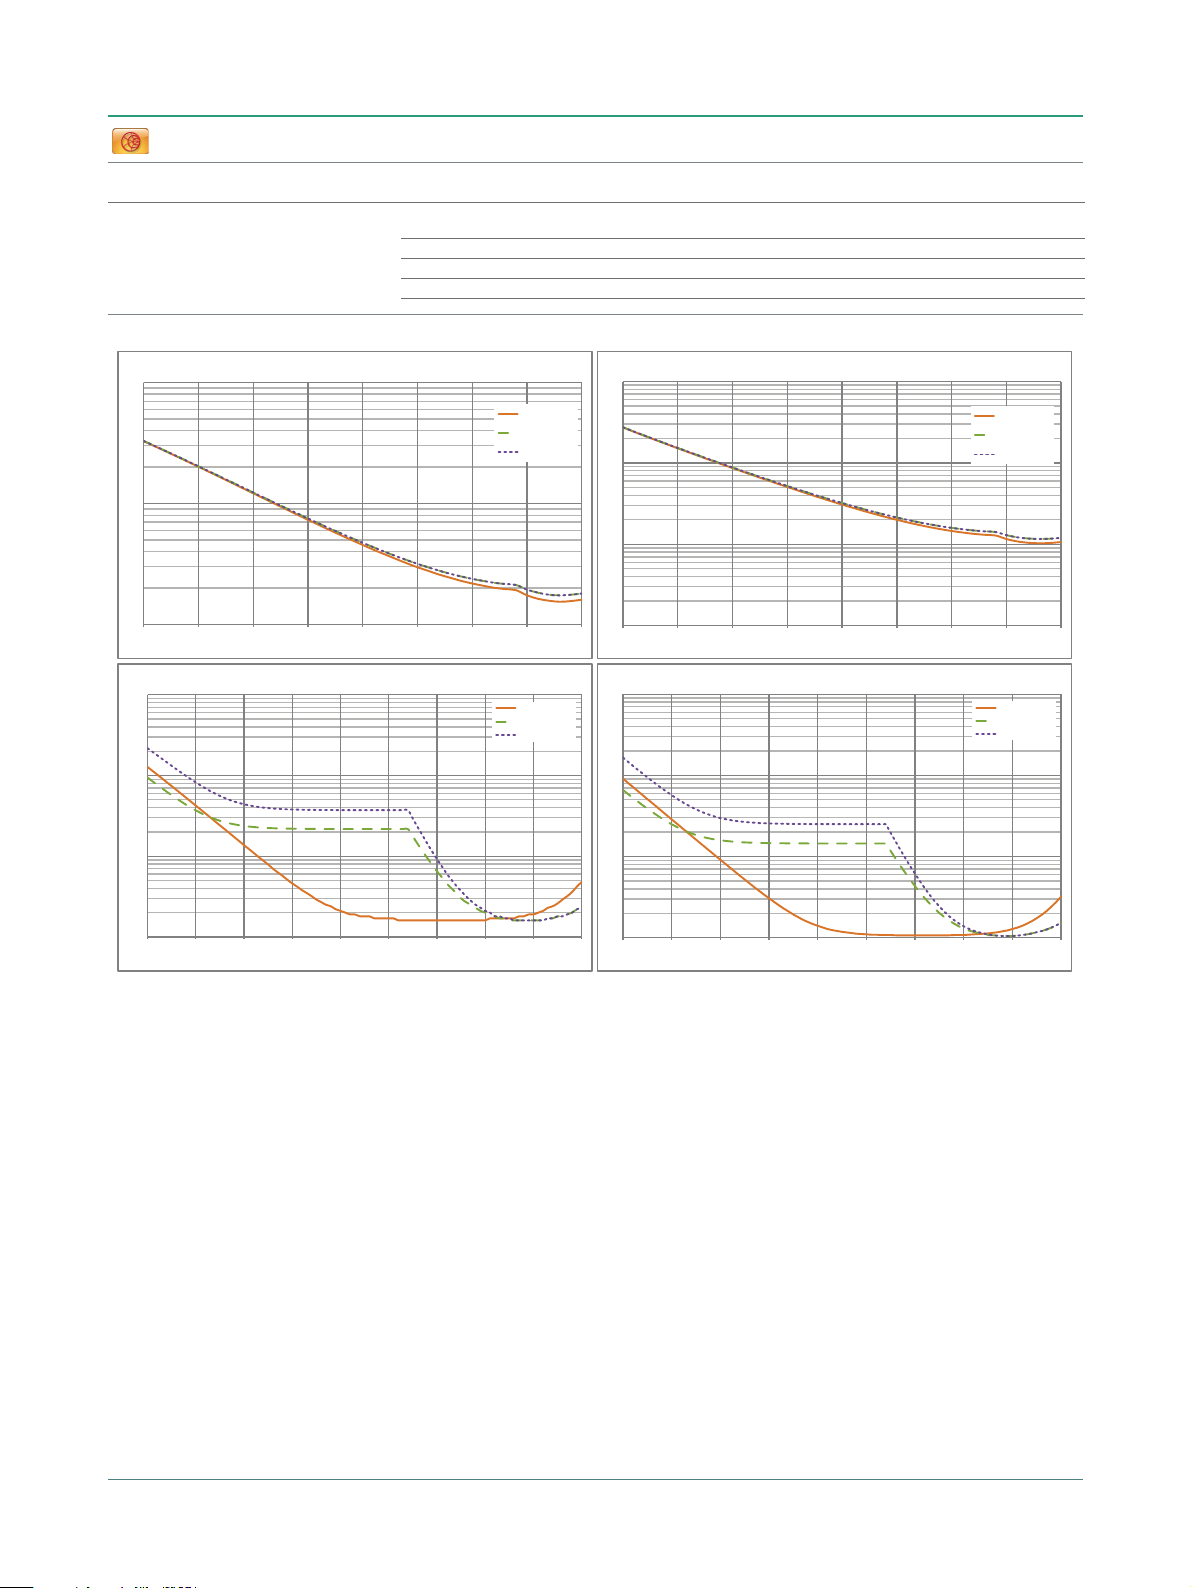
Vector Network Analyzer
(Continued)
Corrected System Measurement Accuracy1 — High Port Power, N-Type
Frequency Range
< 20 MHz ≥ 42 ≥ 30 ± 0.01 ± 0.01
20 MHz to < 3 GHz ≥ 42 ≥ 30 ± 0.05 ± 0.01
3GHz to 6GHz ≥ 42 ≥ 30 ± 0.05 ± 0.01
Corrected Measurement Uncertainty
Directivity
(dB)
(Transmission from Port 1 to Port 2)
Source Match
(dB)
(OSLN50A-8 or OSLNF50A-8, TOSLN50A-8 or TOSLNF50A-8)
Reflection Tracking
(dB)
Transmission
Tracking (dB)
1. Full 1-path, 2-port forward path calibration with isolation, high power, 10 Hz IFBW, no averaging, 10 minute warm-up.
OSLN50A-8, OSLNF50A-8, TOSLN50A-8, or TOSLNF50A-8 calibration kit. Reflection and Transmission Tracking are typical.
8 of 40 PN: 11410-00486 Rev. AT S412E TDS
Page 9
Specifications S412E
0.01
0.1
1
10
-90 -80 -70 -60 -50 -40 -30 -20 -10 0
Transmission Magnitude (dB)
Transmission Magnitude Uncertainty (dB)
2 MHz - 20 MHz
20 MHz - 3 GHz
3 GHz - 6 GHz
0.1
1
10
100
-90-80-70-60-50-40-30-20-10 0
Transmission Magnitude (dB)
Transmission Phase Uncertainty (degrees)
2 MHz - 20 MHz
20 MHz - 3 GHz
3 GHz - 6 GHz
0.1
1
10
-40 -35 -30 -25 -20 -15 -10 -5 0
Return Loss (dB)
Return Loss Magnitude Uncertainty (dB)
2 MHz - 20 MHz
20 MHz - 3 GHz
3 GHz - 6 GHz
0.1
1
10
100
-40 -35 -30 -25 -20 -15 -10 -5 0
Return Loss (dB)
Return Loss Phase Uncertainty (degrees)
2 MHz - 20 MHz
20 MHz - 3 GHz
3 GHz - 6 GHz
Vector Network Analyzer
Corrected System Measurement Accuracy1 — High Port Power, K-Type
and SMA connectors)
Frequency Range
(Continued)
Directivity
(dB)
Source Match
(dB)
< 20 MHz ≥ 42 ≥ 33 ± 0.01 ± 0.01
20 MHz to < 3 GHz ≥ 42 ≥ 33 ± 0.05 ± 0.01
3 GHz to 6 GHz ≥ 42 ≥ 33 ± 0.05 ± 0.01
Corrected Measurement Uncertainty
(Transmission from Port 1 to Port 2)
(OSLK50A-20 or TOSLKF50A-20. Compatible with 3.5 mm
Reflection Tracking
(dB)
Transmission Tracking
(dB)
1. Full 1-path, 2-port forward path calibration with isolation, high power, 10 Hz IFBW, no averaging, 10 minute warm-up.
TOSLK50A-20, TOSLKF50A-20 calibration kit. Reflection and Transmission Tracking are typical.
S412E TDS PN: 11410-00486 Rev. AT 9 of 40
Page 10
S412E Specifications
DUT
Reference
Receiver
Port 1
Bridge/
Coupler
Source
S
11
S
21
Internal
Bias Tee
SPA Input
Internal
Bias Tee
Internal Bias
+12 to +32 V
450 mA Max
VNA
Receiver
Port 2
VNA
Receiver
Port 1
SPA
Receiver
Port 2
Vector Network Analyzer
Bias Tee (Option 10)
center conductor of the cable during measurements. For frequency sweeps in excess of 2 MHz, the LMR Master can supply internal voltage control from
+12 to +32 V in 0.1 V steps up to 450 mA. Bias is available on VNA Port 2 and the SPA Input (RF In) for use with antenna pre-amplifiers.
Internal Voltage/Current +12 V to +32 V at 450 mA (Steady state)
The Compact LMR Master offers optional integrated bias tee for supplying DC plus RF to the DUT as shown in this simplified block diagram.
For tower mounted amplifier tests, the S412E with optional internal bias tees can supply both DC and RF signals on the
Frequency Range 2 MHz to 4/6 GHz at VNA Port 2
Internal Resolution 0.1 V
Bias Tee Selections Internal, Off
(Continued)
Vector Voltmeter (Option 15)
A phased array system relies on phase matched cables for nominal performance. For this class of application, the LMR Master offers this special software
mode to simplify phase matching cables at a single frequency. The similarity between the popular vector voltmeter and this software mode ensures
minimal training is required to phase match cables. Operation is as simple as configuring the display for absolute or relative measurements. The
easy-to-read large fonts show either reflection or transmission measurements using impedance, magnitude, or VSWR readouts. For instrument landing
system (ILS) or VHF Omni-directional Range (VOR) applications, a table view improves operator efficiency when phase matching up to twelve cables. The
S412E solution is superior because the signal source is included internally, precluding the need for an external signal generator.
CW Frequency Range 500 kHz to 1.6 GHz (6 GHz with Option 16)
Measurement Display CW, Table (Twelve Entries, Plus Reference)
Measurement Types Return Loss, Insertion
Measurement Format dB/VSWR/Impedance
Distance Domain
Distance-to-Fault Analysis is a powerful field test tool to analyze cables for faults, including minor discontinuities that may occur due to a loose
connection, corrosion, or other aging effects. By using Frequency Domain Reflectometry (FDR), the VNA’s DTF mode exploits a user-specified band of full
power operational frequencies (instead of DC pulses from TDR approaches) to more precisely identify discontinuities. The VNA converts S-parameters
from frequency domain into distance domain on the horizontal display axis, using a mathematical computation called Inverse Fourier Transform.
Connect a reflection at the opposite end of the cable and the discontinuities appear versus distance to reveal any potential maintenance issues. When
access to both ends of the cable is convenient, a similar distance domain analysis is available on transmission measurements.
Distance Domain will improve your productivity with displays of the cable in terms of discontinuities versus distance. This readout can then be compared
against previous measurements (from stored data) to determine whether any degradations have occurred since installation (or the last maintenance
activity). More importantly, you will know precisely where to go to fix the problem and minimize or prevent downtime of the system.
Maximum Distance
(4001 data points, 1.6 GHz span) 374.9 m (1,229.9 ft)
(4001 data points, 6.0 GHz span) 99.9 m (327.75 ft)
Minimum Distance Resolution
Minimum Distance Resolution
Maximum Distance
(1.6 GHz span) 18.7 cm (7.36 in)
(6.0 GHz span) 4.99 cm (1.97 in)
Measurement Display Return Loss, VSWR
Measurement Format dB, VSWR
10 of 40 PN: 11410-00486 Rev. AT S412E TDS
Page 11

Specifications S412E
Interference Analyzer (Option 25)
Measurements
Spectrum Field Strength
Occupied Bandwidth
Channel Power
Adjacent Channel Power Ratio (ACPR)
AM/FM/SSB Demodulation (Wide/Narrow FM, Upper/Lower SSB - audio out only)
Carrier-to-Interference ratio (C/I)
Spectrogram Collect data up to 72 hours
Signal Strength Gives visual and aural indication of signal strength
Signal ID Up to 12 signals
Center Frequency
Bandwidth
Signal Type: FM, GSM, W-CDMA, CDMA, Wi-Fi
Closest Channel Number
Number of Carriers
Signal-to-Nose Ratio (SNR) > 10 dB
Interference Mapping Triangulate location of interference with on-display maps
Application Option Bias-Tee On/Off
Impedance (50
Compatible with the MA2700A InterferenceHunter™ Handheld Direction Finding System
Channel Scanner (Option 27)
Number of Channels 1 to 20 Channels
Measurements Graph/Table, Max Hold On/5 sec/Off, Freq/Channel, Current/Max, Single/Dual Color
Scanner Scan Channels, Scan Frequencies, Scan Customer List, Scan Script Master™
Amplitude Reference Level, Scale
Custom Scan Signal Standard, Channel, # of Channels, Channel Step Size, Custom Scan
Frequency Accuracy ± 10 Hz + Frequency Reference
Measurement Range –110 dBm to +26 dBm
Application Options Bias-Tee On/Off, Impedance (50
(GPS Option 31 recommended)
Ω
, 75 Ω, Other)
Ω
, 75 Ω, Other)
GPS Receiver (Option 31)
GPS Time/Location Indicator Time, Latitude, Longitude and Altitude on display
GPS-Enhanced Frequency Accuracy < 50 ppb with GPS On, 3 minutes after satellite is locked in selected mode (Applies to Spectrum Analyzer,
Connector SMA, Female
Ethernet Connectivity
Connector RJ45
LAN Speed 10 Mbps
Static IP settings IP address
Remote Control Remote capability provided with Web Remote Control and SCPI programming
Data Upload With Line Sweep Tools through Ethernet connection
(requires external GPS antenna, sold separately)
Setup On/Off, Antenna Voltage 3.3/5.0 V, GPS Info
Time, Latitude, Longitude and Altitude with trace storage
Interference Analyzer, LMR Signal Analyzers)
Mode Static, DHCP
Subnet Mask
IP Gateway
S412E TDS PN: 11410-00486 Rev. AT 11 of 40
Page 12

S412E Specifications
Coverage Mapping (Option 431)
Measurements
Indoor Mapping RSSI, ACPR
Outdoor Mapping RSSI, ACPR
Setup Parameters
Frequency Center/Start/Stop, Span, Freq Step, Signal Standard, Channel #, Channel Increment
Amplitude Reference Level (RL), Scale, Attenuation Auto/Level, RL Offset, Pre-Amp On/Off, Detection
Span Span, Span Up/Down (1-2-5), Full Span, Zero Span, Last Span
Measurement Setup ACPR, RSSI
Point Distance / Time Setup Repeat Type Time Distance
Save Points Map Save KML, JPEG, Tab Delimited
Recall Points Map Recall Map, Recall KML Points only, Recall KML Points with Map, Recall Default Grid
Electromagnetic Field Test (Option 444)
BW RBW, Auto RBW, VBW, Auto VBW, RBW/VBW, Span/VBW
Measurements
Setup Limit lines, axis dwell time, measurement time, auto-logging, measurement units, trace display
Spectrum Analyzer Field strength is measured
LTE OTA P-SS, S-SS, and RS are measured and displayed based on each Cell ID received
Units Spectrum Analyzer: dBm/m
LTE OTA: dBm/m2, V/m, W/m
Results Maximum, minimum, and average of all measurements conducted
Display Measurement status, number of measurements taken, pass/fail indicators
Frequency Range
Supported Antenna
2000-1800-R 9 kHz to 300 MHz
2000-1792-R 30 MHz to 3 GHz
2000-1791-R 700 MHz to 6 GHz
Modes where EMF Measurements Available
Spectrum Analyzer
LTE OTA (Option 546)
CW Signal Generator
Setup Parameters
Generator On/Off
Tx Output Level 0.1 dB resolution, 0 dBm to –130 dBm (spec to –120 dBm)
Tx Pattern CW, AM w/ 1 kHz, FM w/ 1 kHz
RF Characteristics
Power Level Accuracy 2.0 dB (CW Pattern, temperature range 15 °C to 35 °C, –120 dBm to 0 dBm) typical
Frequency Range 500 kHz to 1.6 GHz
Frequency Accuracy Same as Spectrum Analyzer
2
, dBV/m, dBmV/m, dBuV/m, V/m, W/m2, dBW/m2, A/m, dBA/m, W/cm
2
2
12 of 40 PN: 11410-00486 Rev. AT S412E TDS
Page 13

Specifications S412E
Internal Power Meter
Frequency Center/Start/Stop, Span, Frequency Step, Signal Standard, Channel #, Full Band
Amplitude Maximum, Minimum, Offset, Relative On/Off, Units, Auto Scale
Average Acquisition Fast/Med/Slow, # of Running Averages
Limits Limit On/Off, Limit Upper/Lower
Frequency Range 10 MHz to 1.6 GHz (Standard), 10 MHz to 6 GHz (Option 6)
Measurement Range –120 dBm to +26 dBm
Maximum Power Same as RF In Damage Level
Application Option Impedance (50
Span 1 kHz to 100 MHz
Display Range –140 dBm to +30 dBm,
Offset Range 0 dB to +100 dB
VSWR 2:1 typical
Accuracy Same as Spectrum Analyzer
Ω
, 75 Ω, Other)
≤
40 dB span
High Accuracy Power Meter (Option 19)
Amplitude Maximum, Minimum, Offset, Relative On/Off, Units, Auto Scale
Average # of Running Averages, Max Hold
Zero/Cal Zero On/Off, Cal Factor (Center Frequency, Signal Standard)
Limits Limit On/Off, Limit Upper/Lower
Power Sensor Model MA24105A MA24106A MA24108A/18A/26A MA24208A/18A MA24330A/40A/50A
Description Inline High
Frequency Range 350 MHz to 4 GHz 50 MHz to 6 GHz 10 MHz to
Connector Type N(f), 50 Ω Type N(m), 50 Ω Type N(m), 50 Ω
Dynamic Range +3 dBm to
Measurand True-RMS True-RMS True-RMS, Slot
Measurement Uncertainty ± 0.17 dB
(for complete specifications)
Data sheet
Power Sensor
+51.76 dBm
(2 mW to 150 W)
a
11410-00621 11410-00424 11410-00504 11410-00841 11410-00906
a. Expanded uncertainty with K=2 for power measurements of a CW signal greater than +20 dBm with a matched load.
Notes:
Measurement results referenced to the input side of the sensor.
b. Total RSS measurement uncertainty (0 ºC to 50 ºC) f or power measurements of a CW signal greater than –20 dBm with zero
mismatch errors.
c. Expanded uncertainty with K=2 for power measurements of a CW signal greater than –20 dBm with zero mismatch errors.
d. Power uncertainty expressed with two sigma confidence level for CW measurement after zero operation. Includes
calibration factor and linearity over temperature uncertainties, but not the effects of mismatch, zero set and drift, or noise.
e. Includes lineari ty over temperature uncertainties, but not the effects of calibration factor, mismatch, zero set and drift, and
noise.
(Requires external USB power sensor, sold separately)
High Accuracy
RF Power Sensor
Microwave USB
Power Sensor
Microwave
Universal USB
Power Sensor
10 MHz to 8/18 GHz 10 MHz to
Type N(m), 50 Ω Type K(m), 50 Ω
–60 dBm to
+20 dBm
(1 nW to 100 mW)
True-RMS, Slot
Power, Burst
Average Power
±0.17dB
–40 dBm to
+23 dBm
(0.1 µW to 200 mW)
b
±0.16dB
8/18/26 GHz
(8/18 GHz)
Type K(m), 50 Ω
(26 GHz)
–40 dBm to
+20 dBm
(0.1 µW to 100 mW)
Power, Burst
Average Power
c
±0.18dB
Microwave CW USB
Power Sensor
33/40/50 GHz
(33/40 GHz)
Type V(m), 50 Ω
(50 GHz)
–70 dBm to
+20 dBm
(0.1 nW to 100 mW)
Average Power
d
±0.17dB
e
S412E TDS PN: 11410-00486 Rev. AT 13 of 40
Page 14

S412E Specifications
NBFM Analyzer and Coverage Mapping
Measurements
NBFM Analyzer
Carrier Power
Carrier Frequency
Frequency Error
FM Deviation (Peak, Average, RMS)
Modulation Rate
SINAD
Quieting
THD
Occupied Bandwidth (% Int Pwr or > dBc method)
Decoded CTCSS/DCS/DTMF
Encoded CTCSS/DCS/DTMF
(requires Option 31 GPS and a suitable GPS antenna)
RSSI
THD
SINAD
External SINAD
NBFM Talk-Out Coverage
Graphs
NBFM Analyzer NBFM Talk-Out Coverage
Spectrum
Audio Spectrum
Audio Waveform/Scope
Summary Display
Setup Parameters
Frequency Receive Frequency, Transmit Frequency, Span, Offset
Amplitude Reference level, Scale, Ext Attenuation, Auto Range, Adjust Range
Measurement NBFM Analyzer, NBFM Coverage, Quieting, SINAD
Auto Scan Detection and frequency lock when RF In > +10 dBm, FM or CW signal
Tx Patterns CW, FM w/ CTCSS/DCS/DTMF, FM w/ CTCSS/DCS/DTMF + Tone Modulation, FM + Tone Modulation
NBFM Analyzer Active Graph, Maximize Active Trace, Graph Type, Audio Span, Audio Sweep Time, Occupied Bandwidth,
Graph Type Spectrum, Audio Spectrum, Audio Waveform/Scope, Summary Display
NBFM Coverage
(requires Option 31 GPS) Display Type (Map or Time Graph)
RF Measurements
Additional Summary Measurements Deviation
(temperature range 15 °C to 35 °C)
Received Power dBm ± 1.25 dB, ± 0.5 dB typical
Frequency Error Hz ± 10 Hz + Frequency Reference
SINAD/Quieting Audio In port conforms to TIA-603-D for input voltage and impedance
Tone Decode CTCSS/DCS (standard tones per TIA-603-D), DTMF
Outdoor measured values are overlaid on a geo-tagged map, or displayed on
a value vs. time graph. Captured data is exportable to both KML and CSV text
(requires Option 31 GPS and a suitable GPS antenna).
Indoor measured values are referenced by creating touchscreen points on a
floorplan.
Setup Tone Type (CTCSS, DCS, DTMF)
Filters High Pass (300 Hz, 3 kHz, None) and Low Pass (300 Hz, 3 kHz, 15 kHz, None)
De-emphasis On/Off
Frequency Display (Carrier or Error)
USB Memory File formats: .nbfm, .kml, both
Log data On/Off
Modulation Rate
THD
Occupied Bandwidth
Coverage Measurements
RSSI, SINAD, THD
NBFM Signal Generator
Setup Parameters
14 of 40 PN: 11410-00486 Rev. AT S412E TDS
Generator On/Off
TX Output Level 0.1 dB resolution, 0 dBm to –130 dBm (spec to –120 dBm)
Frequency Accuracy Same as Spectrum Analyzer
Page 15

Specifications S412E
P25/P25p2 Analyzer and P25/P25p2 Talk-Out Coverage (Options 521 and 522)
Measurements
P25/P25p2 Analyzer
(Option 521)
Received Power
Frequency Error
Modulation Fidelity
NAC (hex)
Symbol Rate Error
BER (1011 for P25, 1031 for P25p2), O.153 (P25), Voice, and Control Channel)
Symbol Deviation
Hexadecimal Display of Control Channel Traffic
Graphs
P25/P25p2 Analyzer
(Option 521)
Constellation (P25 only)
Linear Constellation
Spectrum [Spans (kHz) = 25, 50, 100, 500, 1000, 5000]
Histogram
Eye Diagram
Demodulation Summary Display
Base Station Control Channel Summary Displays (Active Control Channel,
Band Plan, Backup Control Channel, Adjacent Site Summary)
TDMA Power Profile (P25p2 only)
Standards Compliance
P25 Relevant sections of TIA-102.CAAA-C
P25 Phase 2 Relevant sections of TIA-102.CCAA
Setup Parameters
Frequency Receive Frequency, Transmit Frequency, Span, Offset
Amplitude Reference level, Scale, Ext Attenuation, Auto Range, Adjust Range
Setup P25 Modulation Types: C4FM, CQPSK
P25 BER patterns: 1011, O.153 (V.52), Voice, Control Channel
P25 Phase 2 Modulation Types: Base Station (H-DQPSK) & Mobile Station (H-CPM)
P25 Phase 2 BER patterns: 1031, Silence, Voice, Control Channel
Averaging, WACN ID, System ID, Color Code, Descrambling (Off/On)
Measurement P25 Analyzer, P25 Coverage
P25/P25p2 Analyzer Active Graph, Maximize Active Trace, Graph Type, Symbol Span
Graph Type Constellation (P25 only), Linear Constellation, Spectrogram, Histogram, Eye Diagram,
Eye Diagram Symbol Span 2, 3, 4, 5
P25/P25p2 Coverage USB Memory File formats .p25, .kml, both (Option 522, requires Option 31 GPS)
Log Data On/Off
Demodulation Summary Display, Base Station Control Channel Summary Displays (Active Control Channel,
Band Plan, Backup Control Channel, Adjacent Site Summary)
P25/P25p2 Talk-Out Coverage
(Option 522, requires Options 31 and 521)
BER
RSSI
Modulation Fidelity
P25/P25p2 Talk-Out Coverage
(Option 522, requires Options 31 and 521)
Outdoor measured values are overlaid on a geo-tagged map, or displayed on
a value vs time graph, and are exportable to both KML and CSV text (requires
Option 31 GPS and a suitable GPS antenna).
Indoor measured values are referenced by creating touchscreen points on a
floorplan.
RF Measurements (Option 521)
Received Power dBm ± 1.25 dB, ± 0.5 dB typical
Frequency Error Hz ± 10 Hz + Frequency Reference
Additional Summary Measurements Modulation Fidelity (%)
(temperature range 15 °C to 35 °C)
BER/MER (%)
Symbol Deviation (Hz)
Network Access Code (Hex)
Symbol Rate Error (Hz)
Coverage Measurements (Option 522)
RSSI, BER, Modulation Fidelity
S412E TDS PN: 11410-00486 Rev. AT 15 of 40
Page 16

S412E Specifications
P25/P25p2 Signal Generator
Setup Parameters
Generator On/Off
Tx Output Level 0.1 dB resolution, 0 dBm to –130 dBm (spec to –120 dBm)
P25 Tx Patterns P25: 1011, 1011 Cal, Interference, Silence, Busy, Idle, High Dev, Low Dev, O.153 (v. 52)
P25p2 Tx Patterns Base Station (H-DQPSK): 1031, 1031 Cal, Silence
p25_lsm: 1011, 511 (O.153/v.52), 1011 Cal, Interference, Silence, Busy, Idle, Fidelity
CW, AM and FM
Mobile Station (H-CPM, Selectable timeslot): 1031, 1031 Cal, Silence
CW, AM, FM
RF Characteristics
Power Level Accuracy 2.0 dB (CW Pattern, temperature range 15 °C to 35 °C, –120 dBm to 0 dBm) typical
P25 Modulation Fidelity < 1.25 % max, < 0.75 % typical
P25p2 Modulation Fidelity < 2.0 % max, < 1.75 % typical
Frequency Accuracy Same as Spectrum Analyzer
Frequency Range 500 kHz to 1.6 GHz
16 of 40 PN: 11410-00486 Rev. AT S412E TDS
Page 17

Specifications S412E
DMR (MOTOTRBO) Analyzer and DMR Talk-Out Coverage (Options 591 and 592)
Measurements
DMR (MOTOTRBO) Analyzer
(Option 591)
Received Power
Frequency Error
Modulation Fidelity
Color Code (decimal)
RX Timeslot (Base Station only)
Symbol Rate Error
Symbol Deviation
Base Station: 1031, 1031-1 % BER, O.153, O.153-1 % BER, Silence, tscc
Mobile Station: 1031, 1031-1 % BER, O.153, O.153-1 % BER, Silence
Repeater Receiver Sensitivity Test
CW, AM, FM
BER
RSSI
Modulation Fidelity
DMR Talk-Out Coverage
(Option 592, requires Options 31 and 591)
Graphs
DMR (MOTOTRBO) Analyzer
(Option 591)
Constellation
Linear Constellation
Spectrum [Spans (kHz) = 25, 50, 100, 500, 1000, 5000]
Histogram
Eye Diagram
Summary Display
DMR Summary
Power Profile
Setup Parameters
Frequency Receive Frequency, Transmit Frequency, Span, Rx/Tx Coupling, Coupling Offset
Amplitude Reference level, Scale, Ext Attenuation, Auto Range, Adjust Range
Setup Modulation Type (Base Station, Mobile Station), BER pattern (1031, O.153, Voice, Silence)
Measurement DMR Analyzer, DMR Coverage, DMR Bit Capture
DMR Analyzer Active Graph, Maximize Active Trace, Graph Type, Symbol Span
Graph Type Constellation, Linear Constellation, Spectrogram, Histogram, Eye Diagram, Summary, DMR Summary,
Eye Diagram Symbol Span 2, 3, 4, 5
(Option 592, requires Option 31 GPS) USB Memory File formats .dmr2, .kml, both
DMR Coverage
RF Measurements (Option 591)
Received Power dBm ± 1.25 dB, ± 0.5 dB typical
Frequency Error Hz ± 10 Hz + Frequency Reference
Summary Measurements Received Power, Frequency Error, Modulation Fidelity, BER, Symbol Deviation, Color Code,
DMR Summary Measurements MS ID, Target ID, Talk Group ID, FID, Call Type, Base Station ID
Power Profile
Log data On/Off
(temperature range 15 °C to 35 °C)
Symbol Rate Error
DMR Talk-Out Coverage
(Option 592, requires Options 31 and 591)
Outdoor measured values are overlaid on a geo-tagged map, or displayed on
a value vs. time graph, and are exportable to both KML and CSV text (requires
Option 31 GPS and a suitable GPS antenna).
Indoor measured values are referenced by creating touchscreen points on a
floorplan.
Coverage Measurements (Option 592)
RSSI, BER, Modulation Fidelity
DMR Signal Generator
Setup Parameters
Generator On/Off
Tx Output Level 0.1 dB resolution, 0 dBm to –130 dBm (spec to –120 dBm)
Tx Pattern Base Station: 1031, 1031-1 % BER, O.153, O.153-1 % BER, Silence, tscc
RF Characteristics
Power Level Accuracy 2.0 dB (CW Pattern, temperature range 15 °C to 35 °C, –120 dBm to 0 dBm) typical
Frequency Range 500 kHz to 1.6 GHz
Mod Fidelity 1.25 % max, 0.75 % typical
Frequency Accuracy Same as Spectrum Analyzer
S412E TDS PN: 11410-00486 Rev. AT 17 of 40
Mobile Station: 1031, 1031-1 % BER, O.153, O.153-1 % BER, Silence
CW, AM, FM
Page 18

S412E Specifications
dPMR Analyzer (Options 573 and 572)
Measurements
dPMR RF Analyzer
(Option 573)
Received Power
Frequency Error
Modulation Fidelity
Symbol Rate Error
Symbol Deviation
Graphs
dPMR RF Analyzer
(Option 573)
Constellation
Linear Constellation
Spectrum [Spans (kHz) = 25, 50, 100, 500, 1000, 5000]
Histogram
Eye Diagram
Summary Display
RSSI
Modulation Fidelity
Outdoor measured values are overlaid on a geo-tagged map and exportable
to both KML and CSV text (requires Option 31 GPS and a suitable GPS
antenna).
Indoor measured values are referenced by creating touchscreen points on a
floorplan.
dPMR Talk-Out Coverage
(Option 572, requires Options 31 and 573)
dPMR Talk-Out Coverage
(Option 572, requires Options 31 and 573)
Setup Parameters
Frequency Receive Frequency, Transmit Frequency, Span, Offset
Amplitude Reference level, Scale, Ext Attenuation, Auto Range, Adjust Range
Setup Modulation Bandwidth (6.25 kHz)
Measurement dPMR Analyzer, dPMR Coverage
dPMR Analyzer Active Graph, Maximize Active Trace, Graph Type, Symbol Span
Eye Diagram Symbol Span 2, 3, 4, 5
RF Measurements (Option 573)
Additional Summary Measurements Modulation Fidelity (%)
Graph Type Constellation, Linear Constellation, Spectrogram, Histogram, Eye Diagram, Summary
dPMR Coverage USB Memory File formats .dpmr, .kml, both
Received Power dBm ± 1.25 dB, ± 0.5 dB typical
Frequency Error Hz ± 10 Hz + Frequency Reference
Log data On/Off
(temperature range 15 °C to 35 °C)
Symbol Deviation (Hz)
Symbol Rate Error (Hz)
Coverage Measurements (Option 572)
RSSI, Modulation Fidelity
Signal Generator
Setup Parameters
RF Characteristics
Power Level Accuracy 2.0 dB (CW Pattern, temperature range 15 °C to 35 °C, –120 dBm to 0 dBm) typical
Generator On/Off
Tx Output Level 0.1 dB resolution, 0 dBm to –130 dBm (spec to –120 dBm)
Tx Patterns CW, AM, FM, O.153
Frequency Range 500 kHz to 1.6 GHz
Frequency Accuracy Same as Spectrum Analyzer
18 of 40 PN: 11410-00486 Rev. AT S412E TDS
Page 19

Specifications S412E
NXDN Analyzer and NXDN Talk-Out Coverage (Options 531 and 532)
Measurements
NXDN Analyzer
(Option 531)
Received Power
Frequency Error
Modulation Fidelity
RAN (decimal)
Symbol Rate Error
BER (1031, O.153, Voice, and Control Channel)
Symbol Deviation
BER
RSSI
Modulation Fidelity
NXDN Talk-Out Coverage
(Option 532, requires Options 31 and 531)
Graphs
NXDN Analyzer
(Option 531)
Constellation
Linear Constellation
Spectrum [Spans (kHz) = 25, 50, 100, 500, 1000, 5000]
Histogram
Eye Diagram
Summary Display
Setup Parameters
Frequency Receive Frequency, Transmit Frequency, Span, Offset
Amplitude Reference level, Scale, Ext Attenuation, Auto Range, Adjust Range
Setup Modulation Bandwidth (6.25 kHz and 12.5 kHz),
BER pattern (1031, O.153, Voice, Control Channel)
Measurement NXDN Analyzer, NXDN Coverage
NXDN Analyzer Active Graph, Maximize Active Trace, Graph Type, Symbol Span
Graph Type Constellation, Linear Constellation, Spectrogram, Histogram, Eye Diagram, Summary
Eye Diagram Symbol Span 2, 3, 4, 5
(Option 532, requires Option 31 GPS) USB Memory File formats .nxdn, .kml, both
RF Measurements (Option 531)
Additional Summary Measurements Modulation Fidelity (%)
NXDN Coverage
Log data On/Off
(temperature range 15 °C to 35 °C)
Received Power dBm ± 1.25 dB, ± 0.5 dB typical
Frequency Error Hz ± 10 Hz + Frequency Reference
BER/MER (%)
Symbol Deviation (Hz)
Radio Access Number (RAN) Decimal
Symbol Rate Error (Hz)
NXDN Talk-Out Coverage
(Option 532, requires Options 31 and 531)
Outdoor measured values are overlaid on a geo-tagged map and exportable
to both KML and CSV text (requires Option 31 GPS and a suitable GPS
antenna).
Indoor measured values are referenced by creating touchscreen points on a
floorplan.
Coverage Measurements (Option 532)
RSSI, BER, Modulation Fidelity
NXDN Signal Generator
Setup Parameters
Modulation Bandwidth 6.25 kHz, 12.5 kHz
Generator On/Off
Tx Output Level 0.1 dB resolution, 0 dBm to –130 dBm (spec to –120 dBm)
Tx Patterns (9600 and 4800) 1031, O.153 (v. 52), High Dev, Low Dev, UDCH Pattern 10, CAC, 1031 DTS, FACCH3 DTS, Framed PN9,
RF Characteristics
Power Level Accuracy 2.0 dB (CW Pattern, temperature range 15 °C to 35 °C, –120 dBm to 0 dBm) typical
Frequency Range 500 kHz to 1.6 GHz
Mod Fidelity 1.25 % max
Frequency Accuracy Same as Spectrum Analyzer
S412E TDS PN: 11410-00486 Rev. AT 19 of 40
1031 Cal, CW, AM, FM
Page 20

S412E Specifications
TETRA Analyzer and TETRA Coverage Mapping (Options 581 and 582)
Measurements
TETRA Analyzer
(Option 581)
Received Power
Frequency Error
Vector Error, RMS and Peak
Bit Error Rate (BER)
Residual Carrier Magnitude
IQ Imbalance
Magnitude & Phase Error
Symbol Rate Error
Base Station Extended Color Code
Base Station Receiver Sensitivity Test
Graphs
TETRA Analyzer
(Option 581)
Constellation
Spectrum [Spans (kHz) = 25, 50, 100, 500, 1000, 5000]
Eye Diagram
Summary Display
TETRA Summary
Setup Parameters
Frequency Receive Frequency, Tx Frequency, Rx Coupling, Coupling Offset, Span
Amplitude Reference level, Scale, Ext Attenuation, Auto Range, Adjust Range, Tx Output Lvl, Tx Power Offset, Units
Setup Mod Type, Rx Pattern, Tx Pattern, Squelch Lvl, Numeric Averaging
Measurements TETRA Analyzer, TETRA Coverage, TETRA BS Sensitivity
TETRA Analyzer Active Graph, Maximize Active Graph, Graph Type, Symbol Span
Graph Type Constellation, Spectrum, Eye Diagram, Summary, TETRA Summary
Eye Diagram Symbol Span 2, 3, 4, 5
(Option 582, requires Option 31 GPS) USB Memory File formats .tetra, .kml, or both
TETRA Coverage
Log data On/Off
(Option 582, requires Options 31 and 581)
RSSI
BER
RMS Vector Error (EVM)
(Option 582, requires Options 31 and 581)
Outdoor measured values are overlaid on a geo-tagged map and exportable
to both KML and CSV text (requires Option 31 GPS and a suitable GPS
antenna).
Indoor measured values are referenced by creating touchscreen points on a
floorplan.
TETRA Coverage
TETRA Coverage
RF Measurements (Option 581)
Received Power dBm ± 1.25 dB, ± 0.5 dB typical
Frequency Error Hz ± 10 Hz + Frequency Reference
Additional Summary Measurements Vector Error, RMS and Peak (%)
TETRA Summary Measurements Mobile Color Code (Decimal)
(temperature range 15 °C to 35 °C)
BER
Residual Carrier Magnitude (%)
IQ Imbalance (dB)
Phase Error (Degrees)
Magnitude Error (%)
Symbol Rate Error (Hz)
Mobile Network Code (Decimal)
Base Station Color Code (Decimal)
Base Station Extended Color Code (Hex)
Location Area Code (Decimal)
Mobile Station Maximum Transmit Power (dBm)
Coverage Measurements (Option 582)
RSSI, BER, RMS Vector Error (EVM)
TETRA Signal Generator
Setup Parameters
Modulation TypeΠ/4 (Pi/4) DQPSK
Generator On/Off
Tx Output Level 0.1 dB resolution, 0 dBm to –130 dBm (spec to –120 dBm)
Base Station Test Patterns tetra_bs_idle_unallocPCH
RF Characteristics
Power Level Accuracy 2.0 dB (CW Pattern, temperature range 15 °C to 35 °C, –120 dBm to 0 dBm) typical
Frequency Range 500 kHz to 1.6 GHz
Frequency Accuracy Same as Spectrum Analyzer
tetra_bs_busy_allocPCH
T1_TCH_7p2 (Airbus TB3, Hytera, Sepura, Motorola, ETELM NeTIS)
EVM 3.5 % max
20 of 40 PN: 11410-00486 Rev. AT S412E TDS
Page 21

Specifications S412E
PTC-ITCR Analyzer and PTC-ITCR Talk-Out Coverage (Options 721 and 722)
Measurements
PTC-ITCR Analyzer
(Option 721)
Received Power
Burst Power
Peak Envelope Power
Frequency Error
Π
/4 DQPSK: Error Vector Magnitude, BER, IQ Offset, Phase Error, Magnitude
Error, Symbol Rate Error
Graphs
PTC-ITCR Analyzer
(Option 721)
Constellation
Linear Constellation
Spectrum [Spans (kHz) = 25, 50, 100, 500, 1000, 5000]
Histogram
Eye Diagram
Summary Display
BER
RSSI
Modulation Fidelity
Outdoor measured values are overlaid on a geo-tagged map, or displayed on
a value vs time graph, and are exportable to both KML and CSV text (requires
Option 31 GPS and a suitable GPS antenna).
Indoor measured values are referenced by creating touchscreen points on a
floorplan.
PTC-ITCR Talk-Out Coverage
(Option 722, requires Options 31 and 721)
PTC-ITCR Talk-Out Coverage
(Option 722, requires Options 31 and 721)
Setup Parameters
Frequency Receive Frequency, Transmit Frequency, Offset, Span, Signal Standard, AAR Channel #
Amplitude Reference level, Scale, Ext Attenuation, Auto Range, Adjust Range
Setup RX Pattern (O.153/V.52, PN9 Normal), Symbol Rate (Half Rate 8 ksps, Full Rate 16 ksps), TX Pattern (O.153
Continuous, PN9 Normal Types 1-4, PN9 Normal Continuous), CW, AM 1 kHz tone, FM 1 kHz tone
Measurement PTC-ITCR Analyzer, PTC-ITCR Coverage
PTC-ITCR Analyzer Active Graph, Maximize Active Trace, Graph Type, Symbol Span
Graph Type Constellation, Linear Constellation, Spectrum, Histogram, Eye Diagram, Summary
Eye Diagram Symbol Span 2, 3, 4, 5
PTC-ITCR Coverage (Option 722) USB Memory File formats .ptc and .kml (both require Options 31 and 731)
Log data On/Off
RF Measurements (Option 721)
Received Power dBm ± 1.25 dB, ± 0.5 dB typical
Burst Power dBm ± 1.25 dB, ± 0.5 dB typical
Peak Envelope Power dBm ± 1.25 dB, ± 0.5 dB typical
Frequency Error Hz ± 10 Hz + Frequency Reference
Additional Summary Measurements Error Vector Magnitude %
Coverage Measurements (Option 722)
(temperature range 15 °C to 35 °C)
BER %
IQ Offset dB
Phase Error degrees
Magnitude Error %
Symbol Rate Error (Hz)
(Requires Options 31 and 721)
RSSI, BER, Modulation Fidelity
PTC-ITCR Signal Generator
Setup Parameters
Modulation TypeΠ/4 DQPSK
Symbol Rate (ksps) 8 (Half Rate), 16 (Full Rate)
Generator On/Off
Tx Output Level 0.1 dB resolution, 0 dBm to –130 dBm (spec to –120 dBm)
Tx Pattern PN9 Continuous, PN9 Burst, CW, AM, FM
RF Characteristics
Power Level Accuracy 2.0 dB (CW Pattern, temperature range 15 °C to 35 °C, –120 dBm to 0 dBm) typical
Frequency Range 500 kHz to 1.6 GHz
Frequency Accuracy Same as Spectrum Analyzer
EVM 3.5 % max
S412E TDS PN: 11410-00486 Rev. AT 21 of 40
Page 22

S412E Specifications
PTC-ACSES Analyzer and PTC ACSES Talk-Out Coverage (Options 731 and 733)
Measurements
PTC-ACSES Analyzer
(Option 731, requires Option 31 GPS)
Received PowerPeak Envelope Power
Frequency Error
Μ
SK: Error Vector Magnitude, BER, Phase Error, Magnitude Error
G
RS decoder
BER
RSSI
EVM
PER
PTC-ACSES Talk-Out Coverage
(Option 733, requires Options 31 and 731)
Graphs
PTC-ACSES Analyzer
(Option 731, requires Option 31 GPS)
Constellation
Spectrum [Spans (kHz) = 25, 50, 100, 500, 1000, 5000]
Eye Diagram
Setup Parameters
Frequency Receive Frequency, Transmit Frequency, Receive/Transmit Coupling, Coupling Offset, Span, Signal
Amplitude Ref Level, Scale, Receive Power Offset, Auto Receive Range, Adjust Receive, Transmit Output Level, Transmit
Measurement PTC-ACSES Analyzer, PTC-ACSES Coverage, PTC-ACSES Radio Receiver Tester
PTC-ACSES Analyzer Active Graph, Maximize Active Trace, Graph Type, Symbol Span
Graph Type Constellation, Spectrum, Eye Diagram, Summary, Payload, and Decoded message (only for unencrypted)
Eye Diagram Symbol Span 2, 3, 4, 5
PTC-ACSES Coverage (Option 733) USB Memory File formats .ptc and .kml, both (requires Option 31 GPS)
Log data On/Off
RF Measurements (Option 731)
Received Power dBm ± 1.25 dB, ± 0.5 dB typical
Peak Envelope Power dBm ± 1.25 dB, ± 0.5 dB typical
Frequency Error Hz ± 10 Hz + time base error, 99% confidence level
Additional Summary Measurements Error Vector Magnitude %
Standard, AAR Channel #
Power Offset, Receive and Transmit units
Setup Averaging, Reset PER Counter, Receive Trigger Setup, Decode Setup, Squelch Level
(temperature range 15 °C to 35 °C)
BER %
PER Rx Packets
Phase Error degrees
Magnitude Error %
Requires Option 31
PTC-ACSES Talk-Out Coverage
(Option 733, requires Option 31 and 731)
Outdoor measured values are overlaid on a geo-tagged map, or displayed on
a value vs time graph, and are exportable to both KML and CSV text (requires
Option 31 GPS and a suitable GPS antenna).
Message Decode Table and Payload Table
Message Decode Parsed information (ATCS addresses, time slot in Frame and Epoch)
Payload Hex over-the-air
Coverage Measurements (Option 733)
RSSI, BER, EVM (require Options 31 and 731)
PTC ACSES Signal Generator
Setup Parameters
RF Characteristics
1. Temporary Speed Restriction
22 of 40 PN: 11410-00486 Rev. AT S412E TDS
Modulation Type GMSK
Symbol Rate (bps) 9600
Generator On/Off
Tx Output Level 0 dBm to –130 dBm (spec to –120 dBm)
Tx Pattern Generic TSR
Power Level Accuracy 2.0 dB (CW Pattern, temperature range 15 °C to 35 °C, –120 dBm to 0 dBm) typical
Frequency Range 500 kHz to 1.6 GHz
Frequency Accuracy Same as Spectrum Analyzer
1
, TSR+beacon, Customer pattern, CW, AM, FM
Page 23

Specifications S412E
AM/FM/PM Signal Analyzers (Option 509)
Measurements
Display
Type
Graphic
Display
Numerical
Displays
RF Spectrum
AM/FM/PM
Power (dBm) vs.
Frequency
Carrier Power
Carrier Frequency
Occupied
Bandwidth
a. Requires Sinewave modulation
Setup Parameters
Audio Spectrum
(AM)
Depth (%) vs.
Modulation
Frequency
AM Rate
RMS Depth
(Pk-Pk)/2 Depth
a
SINAD
THDa
Distortion/Total
a
Vrms
Frequency Center Freq, Span, Freq Step, Signal Standard, Channel, Channel Increment, Set Carrier Freq
Amplitude Scale, Power Offset, Adjust Range
Setup Demod Type (AM, FM, PM), IFBW, Auto IFBW
Measurements RF Spectrum AM/FM/PM, Audio Spectrum (AM/FM/PM), Audio Waveform (AM/FM/PM),
Summary (AM/FM/PM), Average
Marker On/Off, Delta, Peak Search, Marker Freq to Center, Marker to Ref Lvl, Marker Table, All Markers Off
Audio
Spectrum
(FM/PM)
Deviation
(kHz/rad) vs.
Modulation
Frequency
FM/PM Rate
RMS Deviation
(Pk-Pk)/2
Deviation
a
SINAD
a
THD
Distortion/Total
a
Vrms
Audio Waveform
(AM)
Depth (%) vs. Time Deviation
AM Rate
RMS Depth
(Pk-Pk)/2 Depth
a
SINAD
a
THD
Distortion/Total
a
Vrms
Audio Waveform
(FM/PM)
(kHz/rad) vs. Time
FM/PM Rate
RMS Depth
(Pk-Pk)/2 Depth
a
SINAD
a
THD
Distortion/Total
a
Vrms
Summary
(AM)
Summary
(FM/PM)
None None
RMS Depth (AM)
Peak + Depth
Peak – Depth
(Pk-Pk)/2 Depth
Carrier Power
Carrier Frequency
Occupied
Bandwidth
AM Rate
a
SINAD
a
THD
Distortion/Total
a
Vrms
RMS Deviation
(FM/PM)
Peak + Depth
Peak – Depth
(Pk-Pk)/2 Depth
Carrier Power
Carrier Frequency
Occupied
Bandwidth
AM Rate
a
SINAD
a
THD
Distortion/Total
a
Vrms
Specifications
AM Modulation Rate: ± 1 Hz (< 100 Hz), ± 2% (> 100 Hz)
Depth: ± 5% for modulation rates 10 Hz to 100 kHz
FM Modulation Rate: ± 1 Hz (< 100 Hz); ± 2% (100 Hz to 100 kHz)
Deviation Accuracy: ± 5% (100 Hz to 100 kHz, IFBW must be greater than 95 % occupied BW)
PM Modulation Rate: ± 1 Hz (< 100 Hz); ± 2% (100 Hz to 100 kHz)
Deviation Accuracy: ± 5% (deviation 0 to 93 Rad, rate 10 Hz to 5 kHz, IFBW must be greater than
95 % occupied BW)
IF Bandwidth 1 kHz to 300 kHz in 1-3 sequence
Frequency Span RF Spectrum: 10 kHz to 10 MHz
Audio Spectrum: 2 kHz, 5 kHz, 10 kHz, 20 kHz
RBW/VBW 30
Span/RBW 100
Sweep time 50 µs to 50 ms (Audio Waveform)
S412E TDS PN: 11410-00486 Rev. AT 23 of 40
Page 24

S412E Specifications
LTE Signal Analyzers (Options 541, 542, 546, and 886)
Measurements
RF
(Option 541)
Channel Spectrum
Channel Power
Occupied Bandwidth
ACPR
Spectral Emission Mask
Category A or B (Opt 1)
RF Summary
Power vs. Resource Block (RB)
RB Power (PDSCH)
Active RBs, Utilization %,
Channel Power, Cell ID
OSTP, Frame EVM by modulation
Constellation
QPSK, 16QAM, 64QAM
256QAM Demod (Option 886)
Modulation Results
Ref Signal Power (RS)
Sync Signal Power (SS)
EVM – rms, peak, max hold
Frequency Error – Hz, ppm
Carrier Frequency
Cell ID
Control Channel Power
Bar Graph or Table View
RS, P-SS, S-SS
PBCH, PCFICH, PHICH, PDCCH
Total Power (Table View)
EVM
Modulation Results
Tx Time Alignment
Modulation Summary
Includes EVM by modulation
Antenna Icons
Detects active antennas (1/2)
Demodulation
(Options 542 and 886)
Over-the-Air (OTA)
(Option 546)
Scanner
Cell ID (Group, Sector)
S-SS Power, RSRP, RSRQ, SINR
Dominance
Modulation Results – On/Off
Tx Test
Scanner
RS Power of MIMO antennas
(2x2, 4x4)
Cell ID, Average Power
Delta Power (Max-Min)
Graph of Antenna Power
Modulation Results – On/Off
Mapping
On-screen
S-SS Power, RSRP, RSRQ, or SINR
Scanner
Modulation Results – Off
Pass/Fail
(User Editable)
View Pass/Fail Limits
All, RF, Modulation
Available Measurements
Channel Power
Occupied Bandwidth
ACLR
Frequency Error
Carrier Frequency
Dominance
EVM peak, rms
RS Power
RS EVM
SS, P-SS, S-SS Power
SS, P-SS, S-SS EVM
PBCH Power
PBCH EVM
PCFICH Power
PCFICH EVM
PHICH Power, EVM
PDCCH Power, EVM
Cell, Group, Sector ID
OSTP
Tx Time Alignment
Setup Parameters
Frequency E-UTRA bands 1 – 5, 7 – 14, 17 – 21, 23 – 32, 66A (tunable 10 MHz to 1.6 GHz; to 6 GHz with Option 6)
Center, Signal Standard, Channel #, Closest Channel, Decrement/Increment Channel
Bandwidth 1.4, 3, 5, 10 MHz
Span Auto, 1.4, 3, 5, 10, 15, 20, 30 MHz
Amplitude Scale/Division, Power Offset, Auto Range, Adjust Range
Sweep Single/Continuous, Trigger Sweep
EVM Mode Auto, PBCH only
Save/Recall Setup, Measurement, Screen Shot (save only), to internal/external memory
Measurement Summary Screens Overall Measurements, RF Measurements, Modulation Measurements
RF Measurements (Option 541)
RF Channel Power Accuracy ± 1.5 dB, ± 1.0 dB typical, (RF input –50 dBm to +10 dBm)
Demodulation Measurements (Option 542)
Frequency Error ± 10 Hz + Frequency Reference, 99 % confidence level
Residual EVM (rms) 2.0 % typical (E-UTRA Test Model 3.1, RF Input –50 dBm to +10 dBm) for BW
Over-the-Air (OTA) Measurements (Option 546)
Scanner Six strongest signals if present
Auto Save — Sync Signal Power and Modulation Results with GPS tagging
Auto Save Scanner — three strongest signals if present
RS Power — strongest signal
Mapping Map On-screen S-SS Power, RSRP, RSRQ, or SINR of Cell ID with strongest signal
Scanner — three strongest signals if present
Save and Export Scanner data: *.kml, *.mtd (tab delimited)
≤
10 MHz
24 of 40 PN: 11410-00486 Rev. AT S412E TDS
Page 25

Specifications S412E
TDD LTE Signal Analyzers (Options 551, 552, and 556)
Measurements
RF
(Option 551)
Channel Spectrum
Channel Power
Occupied Bandwidth
Power vs. Time
Frame View
Sub-Frame View
Total Frame Power
DwPTS Power
Transmit Off Power
Cell ID
Timing Error
ACLR
Spectral Emission Mask
Category A or B (Opt 1)
RF Summary
Power vs. Resource Block (RB)
RB Power (PDSCH)
Active RBs, Utilization %,
Channel Power, Cell ID
OSTP, Frame EVM by modulation
Constellation
QPSK, 16QAM, 64QAM
256QAM Demod (Option 886)
Modulation Results
Ref Signal Power (RS)
Sync Signal Power (SS)
EVM – rms, peak, max hold
Frequency Error – Hz, ppm
Carrier Frequency
Cell ID
Control Channel Power
Bar Graph or Table View
RS, P-SS, S-SS
PBCH, PCFICH, PHICH, PDCCH
Total Power (Table View)
EVM
Modulation Results
Tx Time Alignment
Modulation Summary
Includes EVM by modulation
Antenna Icons
Detects active antennas (1/2)
Demodulation
(Options 552)
Scanner
Cell ID (Group, Sector)
S-SS Power, RSRP, RSRQ, SINR
Dominance
Modulation Results – On/Off
Auto Save On/Off
Tx Test
Scanner
RS Power of MIMO antennas
(2x2, 4x4)
Mapping
On-screen
Scanner
Modulation Results – On/Off
Carrier Aggregation
Up to 5 component carriers (CC1 to CC5)
CP, MIMO status, RS & SS Power, EVM,
Frequency Error, Time Alignment Error,
Cell ID
(Option 31 Recommended)
Over-the-Air (OTA)
(Option 556)
Cell ID, Average Power
Delta Power (Max-Min)
Graph of Antenna Power
Modulation Results – On/Off
S-SS Power, RSRP, RSRQ, or SINR
Pass/Fail
(User Editable)
View Pass/Fail Limits
All, RF, Modulation
Available Measurements
Channel Power
Occupied Bandwidth
ACLR
Frequency Error
Carrier Frequency
Dominance
EVM peak, rms
Frame EVM, rms
Frame EVM by mod type
RS, SS Power
RS EVM
P-SS, S-SS: Power
P-SS, S-SS: EVM
PBCH: Power, EVM
PCFICH: Power, EVM
PHICH: Power, EVM
PDCCH: Power, EVM
Cell, Group, Sector ID
OSTP
Tx Time Alignment
Frame Power (TDD option 551)
DwPTS Power (TDD option 551)
Transmit Off Power (TDD option 551)
Timing Error (TDD option 551)
Setup Parameters
Frequency E-UTRA bands 1 – 5, 7 – 14, 17 – 21, 23 – 32, 66A (tunable 10 MHz to 1.6 GHz; to 6 GHz with Option 6)
Center, Signal Standard, Channel #, Closest Channel, Decrement/Increment Channel
Bandwidth 1.4, 3, 5, 10 MHz
Span Auto, 1.4, 3, 5, 10, 15, 20, 30 MHz
Amplitude Scale/Division, Power Offset, Auto Range, Adjust Range
Sweep Single/Continuous, Trigger Sweep
EVM Mode Auto, PBCH only
Save/Recall Setup, Measurement, Screen Shot (save only), to internal/external memory
Measurement Summary Screens Overall Measurements, RF Measurements, Modulation Measurements
RF Measurements (Option 551)
RF Channel Power Accuracy ± 1.5 dB, ± 1.0 dB typical, (RF input –30 dBm to +10 dBm)
Demodulation Measurements (Option 552)
Frequency Error ± 10 Hz + Frequency Reference, 99 % confidence level
Residual EVM (rms) 2.0 % typical (E-UTRA Test Model 3.1, RF Input –50 dBm to +10 dBm) for BW
Over-the-Air (OTA) Measurements (Option 556)
Scanner Six strongest signals if present
Auto Save — Sync Signal Power and Modulation Results with GPS tagging
Tx Test Show Mod Results
Mapping Map On-screen S-SS Power, RSRP, RSRQ, or SINR of Cell ID with strongest signal
Scanner — three strongest signals if present
Save and Export Scanner data: *.kml, *.mtd (tab delimited)
≤
10 MHz
S412E TDS PN: 11410-00486 Rev. AT 25 of 40
Page 26

S412E Specifications
GSM/GPRS/EDGE Measurements (Option 880)
Measurements
RF Demodulation Over-the-Air (OTA) Pass/Fail
Channel Spectrum
Channel Power
Occupied Bandwidth
Burst Power
Average Burst Power
Frequency Error
Modulation Type
BSIC (NCC, BCC)
Multi-channel Spectrum
Power vs. Time (Frame/Slot)
Channel Power
Occupied Bandwidth
Burst Power
Average Burst Power
Frequency Error
Modulation Type
BSIC (NCC, BCC)
Phase Error
EVM
Origin Offset
C/I
Modulation Type
Magnitude Error
There are no additional OTA
Measurements
RF and Demodulation Measurements
can be made OTA
View Pass/Fail Limits
GSM, EDGE
Available Measurements
Channel Power
Occupied Bandwidth
Burst Power
Average Burst power
Frequency Error
Phase Error
Script Master™
Setup Parameters
GSM/EDGE Select Auto, GSM, EDGE
Frequency Center, Signal Standard, Channel #, Closest Channel, Decrement/Increment Channel
Amplitude Power Offset, Auto Range, Adjust Range
Sweep Single/Continuous, Trigger Sweep
Save/Recall Setup, Measurement, Screen Shots (JPEG - save only), to internal/external memory
Measurement Summary Screen Overall Measurements
RF Measurements
Frequency Error ± 10 Hz + time base error, 99 % confidence level
Occupied Bandwidth Bandwidth within which lies 99 % of the power transmitted on a single channel
Burst Power Error ± 1.5 dB; ± 1 dB typical (–50 dBm to +20 dBm)
Demodulation Measurements
GMSK Modulation Quality (RMS Phase)
Measurement Accuracy ± 1
Residual Error (GMSK) 1
8PSK Modulation Quality (EVM)
Measurement Accuracy ± 1.5 %
Residual Error (8PSK) 2.5 %
º
º
26 of 40 PN: 11410-00486 Rev. AT S412E TDS
Page 27

Specifications S412E
IEEE 802.16 Fixed WiMAX Signal Analyzers (Options 46 and 47)
Measurements
RF
(Option 46)
Channel Spectrum
Channel Power
Occupied Bandwidth
Power vs. Time
Channel Power
Preamble Power
Data Burst Power
Crest Factor
ACPR
Setup Parameters
Measurement Summary Screens Overall Measurements, RF Measurements, Signal Quality Measurements
Constellation
RCE (RMS/Peak)
EVM (RMS/Peak)
Frequency Error
Carrier Frequency
Base Station ID
Spectral Flatness
Adjacent Subcarrier Flatness
EVM vs. Subcarrier/Symbol
RCE
EVM
Frequency Error
Carrier Frequency
Base Station ID
Bandwidth 1.25, 1.50, 2.50, 3.50, 5.00, 5.50, 6.00, 7.00, 10.00 MHz
Cyclic Prefix Ratio (CP) 1/4, 1/8, 1/16, 1/32
Span 5, 10, 15, 20 MHz
Frame Length 2.5, 5.0, 10.0 ms
Frequency Center, Signal Standard, Channel #, Closest Channel, Decrement/Increment Channel
Amplitude Scale/Division, Power Offset, Auto Range, Adjust Range
Sweep Single/Continuous, Trigger Sweep
Save/Recall Setup, Measurement, Screen Shot (save only), to internal/external memory
Demodulation
(Option 47) Over-the-Air (OTA)
There are no additional OTA
Measurements.
RF Measurements and Demodulation
can be made OTA.
(Requires Option 6)
Channel Power
Occupied Bandwidth
Burst Power
Preamble Power
Crest Factor
Frequency Error
Carrier Frequency
EVM
RCE
Base Station ID
Pass/Fail
(User Editable)
RF Measurements (Option 46)
RF Channel Power Accuracy ± 1.5 dB, ± 1.0 dB typical, (RF input –50 dBm to +20 dBm)
Demodulation (Option 47)
Frequency Error 0.07 ppm + Frequency Reference, 99 % confidence level
Residual EVM (rms) 3 % typical, 3.5 % max (RF Input –50 dBm to +20 dBm)
(temperature range 15 ºC to 35 ºC)
(temperature range 15 ºC to 35 ºC)
S412E TDS PN: 11410-00486 Rev. AT 27 of 40
Page 28

S412E Specifications
IEEE 802.16 Mobile WiMAX Signal Analyzers (Options 66, 67, and 37)
(Requires Option 6, Option 37 requires Option 31 for full functionality)
Measurements
RF
(Option 66)
Channel Spectrum
Channel Power
Occupied Bandwidth
Power vs. Time
Channel Power
Preamble Power
Downlink Burst Power
Uplink Burst Power
ACPR
Setup Parameters
Measurement Summary Screens Overall Measurements, RF Measurements, Signal Quality Measurements
Constellation
RCE (RMS/Peak)
EVM (RMS/Peak)
Frequency Error
CINR
Base Station ID
Sector ID
Spectral Flatness
Adjacent Subcarrier Flatness
EVM vs. Subcarrier/Symbol
RCE (RMS/Peak)
EVM (RMS/Peak)
Frequency Error
CINR
Base Station ID
Sector ID
DL-MAP (Tree View)
Zone Type PUSC
DL-MAP Auto Decoding Convolutional Coding (CC), Convolutional Turbo Coding (CTC)
Bandwidths 3.50, 5.00, 7.00, 8.75, 10.00 MHz
Cyclic Prefix Ratio (CP) 1/8
Span 5, 10, 20, 30 MHz
Frame Lengths 5, 10 ms
Demodulation Auto, Manual, FCH
Frequency Center, Signal Standard, Channel #, Closest Channel, Decrement/Increment Channel
Amplitude Scale/Division, Power Offset, Auto Range, Adjust Range
Sweep Single/Continuous, Trigger Sweep
Save/Recall Setup, Measurement, Screen Shot (save only), to internal/external memory
Demodulation
(Option 67)
Over-the-Air (OTA)
(Option 37)
Channel Power Monitor
Preamble Scanner (Six)
Preamble
Relative Power
Cell ID
Sector ID
PCINR
Dominant Preamble
Base Station ID
Pass/Fail
(User Editable)
Channel Power
Occupied Bandwidth
Downlink Bust Power
Uplink Burst Power
Preamble Power
Crest Factor
Frequency Error
Carrier Frequency
EVM
RCE
Sector ID
RF Measurements (Option 66)
RF Channel Power Accuracy ± 1.5 dB, ± 1.0 dB typical, (RF input –50 dBm to +20 dBm)
Demodulation (Option 67)
Frequency Error 0.02 ppm + Frequency Reference, 99 % confidence level
Residual EVM (rms) 2.5 % typical, 3.0 % max, (RF Input –50 dBm to +20 dBm)
(Temperature range 15 ºC to 35 ºC)
(Temperature range 15 ºC to 35 ºC)
Over-the-Air (OTA) Measurements (Option 37)
Channel Power Monitor Over time (one week), measurement time interval 1 to 60 sec
Preamble Scanner Six Strongest Preambles
Auto Save Yes
GPS Logging Yes
28 of 40 PN: 11410-00486 Rev. AT S412E TDS
Page 29

Specifications S412E
General Specifications
System Parameters
System Status (Temperature, Battery Info, Serial Number, Firmware Version, Options Installed)
System Options Name, Date and Time, Brightness, Volume
Internal Trace/Setup Memory 2,000 traces, 2,000 setups
External Trace/Setup Memory Limited by size of USB Flash drive
Mode Switching Auto-Stores/Recalls most recently used Setup Parameters in the Mode
File Management
File Types Vary with measurement mode
Delete Selected file or files from internal/external memory (USB)
File Sort Method By Name/Date/Type, Ascend/Descend
Self Test, Application Self Test, GPS (see Option 31)
Language (English, French, German, Spanish, Chinese, Japanese, Korean, Italian, Russian, Portuguese)
Reset (Factory Defaults, Master Reset, Update Firmware)
File Save, Recall, Copy, Delete
Save Setups, Measurements, Screen Shots (JPEG)
Recall Setups, Measurements
Copy Selected file or files to internal/external memory (USB)
Connectors
VNA Port 1, VNA Port 2 Type N, female, 50
VNA Port Damage Level 23 dBm, ± 50 VDC
RF In Port Damage Level +33 dBm peak, ± 50 VDC, Maximum Continuous Input (≥ 10 dB attenuation)
Signal Generator Port Type N, female, 50
Signal Generator Port Damage Level +27 dBm, ± 16 VDC
External Reference In BNC, female, 1 MHz, 1.2288 MHz, 1.544 MHz, 2.048 MHz, 2.4576 MHz, 4.8 MHz, 4.9152 MHz, 5 MHz,
Audio In (SINAD/Quieting) BNC, female, Impedance 50 k
External Trigger/Clock Recovery BNC, female, Maximum Input ± 5 VDC
RF In Port Type N, female, 50
GPS SMA, female
External Power 5.5 mm barrel connector, 12.5 VDC to 15 VDC, < 4.0 A
USB Interface (2) Type A (Connect USB Flash Drive and Power Sensor)
USB Interface 5-pin mini-B, Connect to PC for data transfer
Ethernet Interface RJ45 connector for Ethernet 10-Base T
Headset Jack 3.5 mm mini-phone plug
9.8304 MHz, 10 MHz, 13 MHz, and 19.6608 MHz at –10 dBm to +10 dBm
Display
Type Resistive TFT Touchscreen
Size 8.4 inch daylight viewable color LCD
Resolution 800 x 600
Pixel Defects No more than five defective pixels (99.9989% good pixels)
Power
Field Replaceable Battery Li-Ion, 7500 mAh rated capacity
40 W on battery power only
DC Power Universal 110/220 V AC/DC Adapter
Life Time Charging Cycles > 300 (80 % of initial capacity)
Battery Operation 3.6 hours, typical
Battery Charging Limits 0 °C to +45 °C, Relative Humidity ≤ 80 %
55 W running with AC/DC adapter while charging battery
Ω
Ω
Ω
Ω
, Maximum Voltage > 1.77 Vrms (TIA-603-D compliant)
S412E TDS PN: 11410-00486 Rev. AT 29 of 40
Page 30

S412E Specifications
General Specifications
Regulatory Compliance
European Union EMC 2014/30/EU, EN 61326:2013, CISPR 11/EN 55011, IEC/EN 61000-4-2/3/4/5/6/8/11
Australia and New Zealand RCM AS/NZS 4417:2012
Environmental
Operating Temperature Range –10 ºC to 55 ºC
Storage Temperature Range –51 ºC to 71 ºC
Maximum Relative Humidity 95 % RH at 30 ºC, non-condensing
Vibration, Sinusoidal 5 Hz to 55 Hz
Vibration, Random 10 Hz to 500 Hz
Half Sine Shock 30 g
Explosive Atmosphere MIL-PRF-28800F, Section 4.5.6.3
ESD
RF Port Center Pin Withstands up to ±15 kV
Size and Weight
Warranty
(Continued)
Low Voltage Directive 2014/35/EU
Safety EN 61010-1:2010
RoHS Directive 2011/65/EU applies to instruments with CE marking placed on the market after July 22, 2017
Canada ICES-1(A)/NMB-1(A)
South Korea KCC-REM-A21-0004
MIL-PRF-28800F Class 2
Altitude 4600 meters, operating and non-operating
Size 273 mm x 199 mm x 91 mm (10.7 in x 7.8 in x 3.6 in)
Weight 3.6 kg (7.9 lb)
Duration Standard three-year warranty (battery one-year warranty)
n
MIL-STD-810G, Method 511.5, Procedure 1
30 of 40 PN: 11410-00486 Rev. AT S412E TDS
Page 31

Specifications S412E
Master Software Tools
(for your PC)
Database Management
Full Trace Retrieval Retrieve spectrum analyzer traces from instrument into one PC directory
Trace Catalog Index all traces into one catalog
Trace Rename Utility Rename measurement traces
Group Edit Titles, subtitles, plot scaling, markers and limit lines, simultaneously on similar files
DAT File Converter Converts HHST files to MST file format and vice-versa
Data Analysis
Trace Math and Smoothing Compare multiple traces
Data Converter Convert from/to Return Loss, VSWR, Cable Loss, DTF and also into Smith Charts
Measurement Calculator Translates into other units
Report Generation
Report Generator Includes GPS, power level, and calibration status along with measurements
Edit Graph Change scale, limit lines, and markers
Report Format Create reports in HTML for PDF format
Export Measurements Export measurements to *.s2p, *.jpg or *.csv format
Notes Annotate measurements
Mapping (GPS Required)
Spectrum Analyzer Mode MapInfo, MapPoint
Folder Spectrogram (Spectrum Monitoring for Interference Analysis and Spectrum Clearing)
Folder Spectrogram – 2D View Creates a composite file of multiple traces
Video Folder Spectrogram – 2D View Create AVI file to export for management review/reports
Folder Spectrogram – 3D View Views (Set Threshold, Markers)
Peak Power, Total Power, Peak Frequency, Histogram, Average Power (Max/Min)
File Filter (Violations over limit lines or deviations from averages)
Playback
- 3D (Rotate X, Y, Z Axis, Level Scale, Signal ID)
- 2D View (Frequency or Time Domain, Signal ID)
- Top Down
Playback (Frequency and/or Time Domain)
List/Parameter Editors
Traces Add, delete, and modify limit lines and markers
Antennas, Cables, Signal Standards Modify instrument’s Antenna, Cable, and Signal Standard List
Product Updates Auto-checks Anritsu website for latest revision firmware
Languages Customize non-English language menus
Display Modify display settings
Script Master™
Channel Scanner Mode Automate scan up to 1200 channels, repeat for sets of 20 channels, repeat all channels
Connectivity
Connections Connect to PC using USB, LAN, or Direct Ethernet connection
Network Search Find all Anritsu handheld instruments on local network
Download Download measurements and live traces to PC for storage and analysis
Upload Upload measurements and other files from PC to instrument
easyTest Tools™
Export Measurements can be saved in various formats, depending on the measurement type, including JPEG, CSV,
Printing Print individual or all measurement screens
(for your PC)
and Anritsu DAT format
Instrument Modes
Cable & Antenna Analyzer
Spectrum Analyzer
Commands
Display Image Allows putting a custom image on the instrument screen
Recall Setup Places the instrument into a known state; auto-advance to next command available
Prompt Displays instructional messages on the instrument screen; timed advance to next command available;
instrument users can be allowed or disallowed from making setup adjustments
Save Allows automatic or manual saving of traces; auto-advance to next command available
S412E TDS PN: 11410-00486 Rev. AT 31 of 40
Page 32

S412E Specifications
Line Sweep Tools
Features
traces every day. LST is the next generation of Anritsu’s familiar Handheld Software Tools (HHST) and shares its uncomplicated user interface, giving a
new face to the term “ease of use.”
Line Sweep Tools (LST) is a free PC based program that increases productivity for people who deal with numerous Cable and Antenna
(for your PC)
Trace Capture
Browse to Instrument View and copy traces from the test equipment to your PC using Windows Explorer
Open Legacy Files Open DAT files captured with Handheld Software Tools v6.61
Open Current Files Open VNA or DAT files
Capture Plots To The Line Sweep Tools screen, DAT files, Database, or JPEG
Traces
Trace Types Return Loss, VSWR, DTF-RL, DTF-VSWR, Cable Loss, Smith Chart, and PIM
Trace Formats DAT, VNA, CSV, PNG, BMP, JPG, HTML, Data Base, and PDF
Report Generation
Report Generator Includes GPS location along with measurements
Report Format Create reports in HTML or PDF format
Report Setup Report Title, Company, Prepared for, Location, Date and Time, Filename, Company logo (optionally set by
Trace Setup One Trace Portrait Mode, Two Trace Portrait Modes, One Trace Landscape Mode
user)
Trace Validation
Presets Seven presets allow “one click” setting of up to 6 markers and one limit line
Marker Controls Six regular Markers, Marker Peak, Marker Valley, Marker between, and frequency entry
Delta Markers Six Delta markers
Limit Line Enable and drag or value entry. Also works with presets
Next Trace Button Next Trace and Previous Trace arrow keys allow quick switching between traces
Tools
Cable Editor Allows creation of custom cable parameters (instrument type/model must match original)
Distance to Fault Converts a Return Loss trace to a Distance to Fault trace (only *.dat and *.vna file types supported)
Measurement Calculator Converts Real, Imaginary, Magnitude, Phase, RL, VSWR, Rho, and Transmit power
Signal Standard Editor Creates new band and channel tables (instrument type/model must match original)
Renaming Grid 36 user definable phrases for creation of file names, trace titles, and trace subtitles
Connectivity
Connections Ethernet, USB cable, and USB memory stick
Web Remote Control
Control Full instrument control through a browser – all instrument functions except power switch and rotary knob
Connections RJ45 Ethernet jack
Protocol HTTP/TCP/IP
Physical Layer Cat 5 Cable, Wi-Fi router compatible
Software Required HTML 5-compliant browser – Google Chrome, Mozilla Firefox
Operating System iOS, Windows, Linux, Android operating systems that can host the HTML 5-compliant browser
Remote Hardware PCs, tablets, and smart phones with Ethernet or Wi-Fi connection and an HTML 5-compliant browser
Download Individual instrument files downloaded via browser
Display Modes Normal: All modes and displays supported
Password The instrument can be password protected
Users/Instruments One user/device can view and control many instruments
Programmable Remote Control
Programming Language Standard Commands for Programmable Instruments (SCPI)
Functionality Many instrument functions are programmable. See the Programming Manual for details.
Interfaces Ethernet, USB
Available Drivers LabView. Visit NI.com for driver
Third party Wi-Fi router
Multiple instrument files and directories zipped and downloaded via browser
File downloads are not supported by iOS
Screen capture capability
Fast: Spectrum traces update faster (up to five updates per second)
Passwords may be used to manage who is controlling the instrument
32 of 40 PN: 11410-00486 Rev. AT S412E TDS
Page 33

Specifications S412E
Ordering Information – Options
S412E Description
500 kHz to 1.6 GHz Vector Network Analyzer
9 kHz to 1.6 GHz Spectrum Analyzer
10 MHz to 1.6 GHz Power Meter
500 kHz to 1.6 GHz CW Signal Generator
10 MHz to 1.6 GHz NBFM Analyzer
Options
S412E-0010 High Voltage Variable Bias Tee
S412E-0031 GPS Receiver (requires GPS antenna)
S412E-0019 High-Accuracy Power Meter (requires External Power Sensor)
S412E-0025 Interference Analyzer (Option 31 recommended)
S412E-0027 Channel Scanner
S412E-0006 6 GHz Coverage on Spectrum Analyzer
S412E-0016 6 GHz Coverage on Vector Network Analyzer
S412E-0015 Vector Voltmeter
S412E-0431 Coverage Mapping (requires Option 31)
S412E-0444 EMF Measurements (requires Anritsu Isotropic Antenna)
S412E-0509 AM/FM/PM Analyzer
S412E-0521 P25/P25p2 Analyzer Measurements
S412E-0522 P25/P25p2 Coverage Measurements (requires Options 31 and 521)
S412E-0531 NXDN Analyzer Measurements
S412E-0532 NXDN Coverage Measurements (requires Options 31 and 531)
S412E-0573 dPMR RF Analyzer Measurements
S412E-0572 dPMR Coverage Measurements (requires Options 31 and 573)
S412E-0581 TETRA Analyzer Measurements
S412E-0582 TETRA Coverage Measurements (requires Options 31 and 581)
S412E-0591 DMR (MOTOTRBO) Analyzer Measurements
S412E-0592 DMR (MOTOTRBO) Coverage Measurements (requires Options 31 and 591)
S412E-0731 PTC-ACSES Analyzer (requires Options 31)
S412E-0733 PTC-ACSES Talk-Out Coverage (requires Options 31 and 731)
S412E-0721 PTC-ICTR Analyzer
S412E-0722 PTC-ICTR Coverage Measurements (requires Options 31 and 721)
S412E-0541 LTE RF Measurements
S412E-0542 LTE Modulation Quality
S412E-0546 LTE Over-the-Air Measurements (requires Option 31)
S412E-0551 TDD LTE RF Measurements (requires Option 541)
S412E-0552 TDD LTE Modulation Quality (requires Option 542)
S412E-0556 TDD LTE Over-the-Air Measurements (requires Options 31 & 546)
S412E-0886 LTE 256QAM Demodulation (Requires Option 542 or 552)
S412E-0880 GSM/GPRS/EDGE Measurements
S412E-0046 IEEE 802.16 Fixed WiMAX RF Measurements (requires Option 6)
S412E-0047 IEEE 802.16 Fixed WiMAX Demodulation (requires Option 6)
S412E-0066 IEEE 802.16 Mobile WiMAX RF Measurements (requires Option 6)
S412E-0067 IEEE 802.16 Mobile WiMAX Demodulation (requires Option 6)
S412E-0037 IEEE 802.16 Mobile WiMAX Over-the-Air Measurements
S412E-0098 Standard Calibration to ISO17025 and ANSI/NCSL Z540-1. Includes calibration certificate.
S412E-0099 Premium Calibration to ISO17025 and ANSI/NCSL Z540-1. Includes calibration certificate, test report, and
(requires Option 6; Option 31 required for full functionality)
uncertainty data.
S412E TDS PN: 11410-00486 Rev. AT 33 of 40
Page 34

S412E Specifications
Standard Accessories (Included with instrument)
Manuals, Related Literature
Troubleshooting Guides
(Soft copy at
(Soft copy at
www.anritsu.com
www.anritsu.com
Part Number Description
2000-1691-R Stylus with Coiled Tether
2000-1797-R Screen Protector Film, 8.4 inch (2, one installed)
2000-1654-R Soft Carrying Case
633-75 Rechargeable 7500 mAh Li-Ion Battery
40-187-R AC-DC Adapter
806-141-R Automotive Power Adapter, 12 VDC, 60 W
3-2000-1498 USB A - 5-PIN Mini-B Cable, 3 meters (10 ft)
Standard Three Year Warranty (one year on battery)
Certificate of Conformance
)
Part Number Description
10100-00065 Product Information, Compliance, and Safety
10580-00318 LMR Master User Guide
10580-00289 Vector Network Analyzer Measurement Guide
10580-00243 Land Mobile Radio Measurement Guide
10580-00241 Cable and Antenna Analyzer Measurement Guide
10580-00349 Spectrum Analyzer Measurement Guide
10580-00240 Power Meter Measurement Guide
10580-00234 3GPP Signal Analyzer Measurement Guide
10580-00236 WiMAX Signal Analyzer Measurement Guide
10580-00455 EMF Measurement Guide
10580-00319 Programming Manual
)
Part Number Description
11410-00551 Spectrum Analyzers
11410-00472 Interference
11410-00566 LTE eNode Testing
11410-00466 GSM/GPRS/EDGE Base Stations
11410-00473 Cable, Antenna, and Component Troubleshooting Guide
11410-00427 Understanding Cable & Antenna Analysis White Paper
34 of 40 PN: 11410-00486 Rev. AT S412E TDS
Page 35

Specifications S412E
Optional Accessories
Backpack and Transit Case
USB Power Sensors
(for complete ordering information, see the respective data sheets of each sensor)
Part Number Description
67135 Anritsu Backpack (For Handheld Instrument and PC)
760-243-R Large Transit Case with Wheels and Handle
760-261-R Large Transit Case with Wheels and Handle
760-262-R Transit Case for MA2700A, several Yagi antennas and filters
760-271-R Transit Case for Portable Directional Antennas and Port Extender
760-286-R Compact Transit Case with Wheels and Handle
Model Number Description
MA24105A Inline Dual Directional High Power Sensor,
MA24106A High Accuracy RF Power Sensor,
MA24108A Microwave USB Power Sensor,
MA24118A Microwave USB Power Sensor,
MA24126A Microwave USB Power Sensor,
MA24208A Microwave Universal USB Power Sensor,
MA24218A Microwave Universal USB Power Sensor,
MA24330A Microwave CW USB Power Sensor, 10 MHz to 33 GHz, +20 dBm
MA24340A Microwave CW USB Power Sensor, 10 MHz to 40 GHz, +20 dBm
MA24350A Microwave CW USB Power Sensor, 10 MHz to 50 GHz, +20 dBm
MA25100A RF Power Indicator
56 cm x 45.5 cm x 26.5 cm (22.07" x 17.92" x 10.42")
63.1 cm x 50 cm x 30 cm (24.83" x 19.69" x 11.88"), space for MA2700A,
antennas, filters, instrument inside soft case, and other interference
hunting accessories/tools
52.4 cm x 42.8 cm x 20.6 cm (21.9" x 14.0" x 8.12")
(for 2000-1777-R, 2000-1778-R, 2000-1779-R, 2000-1798-R)
55.6 cm x 35.5 cm x 22.9 cm (21.89" x 13.98" x 9.01")
350 MHz to 4 GHz, +3 dBm to +51.76 dBm
50MHz to 6GHz, +23dBm to –40dBm
10MHz to 8GHz, +20dBm to –40dBm
10 MHz to 18 GHz, +20 dBm to –40 dBm
10 MHz to 26 GHz, +20 dBm to –40 dBm
10MHz to 8GHz, +20dBm to –60dBm
10 MHz to 18 GHz, +20 dBm to –60 dBm
Baseband Audio Generator and Oscilloscope
Miscellaneous Accessories
Model Number Description
2000-1897-R USB Baseband Audio generator and 2-Channel oscilloscope
2000-1898-R USB Low Distortion Baseband Audio generator and 2-Channel oscilloscope
Part Number Description
MA2700A Handheld Interference Hunter (For full specifications, refer to the
MA25200A High Power Tx/Rx Input Protection Module
2000-1374-R External Dual Charger for Li-lon Batteries
2000-1797-R Screen Protector Film
2000-1689-R EMI Near Field Probe Kit
10 MHz bandwidth, 8 kS buffer memory, 16 protocol serial decoder,
USB connected and powered
16-bit resolution, low distortion (96 dB SFDR), low noise (8.5 µV RMS),
5 MHz bandwidth, 16 MS buffer memory, low-distortion signal generator,
arbitrary waveform generator, USB powered
MA2700A Technical Data Sheet 11410-00692)
633-75 Rechargeable Li-Ion Battery, 7500 mAh
66864 Rack Mount Kit, Master Platform
S412E TDS PN: 11410-00486 Rev. AT 35 of 40
Page 36

S412E Specifications
Full Temperature N-Type Coaxial Calibration Kits
Part Number Description
Coaxial Calibration Components, Other 50 Ω, 75 Ω
Part Number Description
–10 °C to +55 °C (see individual data sheets on www.anritsu.com)
OSLN50A-8 High Performance Type N(m), DC to 8 GHz, 50 Ω
OSLNF50A-8 High Performance Type N(f), DC to 8 GHz, 50 Ω
TOSLN50A-8 High Performance with Through, Type N(m), DC to 8 GHz, 50 Ω
TOSLNF50A-8 High Performance with Through, Type N(f), DC to 8 GHz, 50 Ω
22N50 Precision N(m) Short/Open, 18 GHz
22NF50 Precision N(f) Short/Open, 18 GHz
28N50-2 Precision Termination, DC to 18 GHz, 50 Ω, N(m)
28NF50-2 Precision Termination, DC to 18 GHz, 50 Ω, N(f)
SM/PL-1 Precision N(m) Load, 42 dB, 6 GHz
SM/PLNF-1 Precision N(f) Load, 42 dB, 6 GHz
2000-1914-R Precision Open/Short/Load, 4.3-10(f), DC to 6 GHz, 50 Ω
2000-1915-R Precision Open/Short/Load, 4.3-10(m), DC to 6 GHz, 50 Ω
2000-1618-R Open/Short/Load, 7/16 DIN(m), DC to 6.0 GHz 50 Ω
2000-1619-R Open/Short/Load, 7/16 DIN(f), DC to 6.0 GHz 50 Ω
12N50-75B Matching Pad, DC to 3 GHz, 50 Ω to 75 Ω
22N75 Open/Short, N(m), DC to 3 GHz, 75 Ω
22NF75 Open/Short, N(f), DC to 3 GHz, 75 Ω
26N75A Precision Termination, N(m), DC to 3 GHz, 75 Ω
26NF75A Precision Termination, N(f), DC to 3 GHz, 75 Ω
1091-55-R Open, TNC(f), DC to 18 GHz
1091-53-R Open, TNC(m), DC to 18 GHz
1091-56-R Short, TNC(f), DC to 18 GHz
1091-54-R Short, TNC(m), DC to 18 GHz
1015-54-R Termination, TNC(f), DC to 18 GHz
1015-55-R Termination, TNC(m), DC to 18 GHz
Adapters
Precision Adapters
Part Number Description
1091-26-R DC to 18 GHz, N(m) to SMA(m), 50 Ω
1091-27-R DC to 18 GHz, N(m) to SMA(f), 50 Ω
1091-80-R DC to 18 GHz, N(f) to SMA(m), 50 Ω
1091-81-R DC to 18 GHz, N(f) to SMA(f), 50 Ω
1091-172-R DC to 1.3 GHz, N(m) to BNC(f), 50 Ω
1091-465-R DC to 6 GHz, 4.3-10(f) to N(f), 50 Ω
1091-467-R DC to 6 GHz, 4.3-10(m) to N(f), 50 Ω
510-90-R DC to 7.5 GHz, 7/16 (f) to N(m), 50 Ω
510-91-R DC to 7.5 GHz, 7/16 (f) to N(f), 50 Ω
510-92-R DC to 7.5 GHz, 7/16 (m) to N(m), 50 Ω
510-93-R DC to 7.5 GHz, 7/16 (m) to N(f), 50 Ω
510-96-R DC to 7.5 GHz, 7/16 DIN(m) to 7/16 DIN(m), 50 Ω
510-97-R DC to 7.5 GHz, 7/16 DIN(f) to 7/16 DIN(f), 50 Ω
513-62-R DC to 18 GHz, TNC(f) to N(f), 50 Ω
1091-315-R DC to 18 GHz, TNC(m) to N(f), 50 Ω
1091-324-R DC to 18 GHz, TNC(f) to N(m), 50 Ω
1091-325-R DC to 18 GHz, TNC(m) to N(m), 50 Ω
1091-317-R DC to 18 GHz, TNC(m) to SMA(f), 50 Ω
1091-318-R DC to 18 GHz, TNC(m) to SMA(m), 50 Ω
1091-323-R DC to 18 GHz, TNC(f) to TNC(f), 50 Ω
1091-326-R DC to 18 GHz, TNC(m) to TNC(m), 50 Ω
510-102-R DC to 11 GHz, N(m)-N(m), 90 degrees, 50 Ω
Part Number Description
34NN50A Precision Adapter, N(m) to N(m), DC to 18 GHz, 50 Ω
34NFNF50 Precision Adapter, N(f) to N(f), DC to 18 GHz, 50 Ω
36 of 40 PN: 11410-00486 Rev. AT S412E TDS
Page 37

Specifications S412E
Filters
Attenuators
Phase-Stable Test Port Cables, Armored
Part Number Description
1030-114-R 806 MHz to 869 MHz, N(m) to SMA(f), 50 Ω
1030-109-R 824 MHz to 849 MHz, N(m) to SMA(f), 50 Ω
1030-110-R 880 MHz to 915 MHz, N(m) to SMA(f), 50 Ω
1030-105-R 890 MHz to 915 MHz Band, 0.41 dB loss, N(m) to SMA(f), 50 Ω
1030-111-R 1850 MHz to 1910 MHz, N(m) to SMA(f), 50 Ω
1030-106-R 1710 MHz to 1790 MHz Band, 0.34 dB loss, N(m) to SMA(f), 50 Ω
1030-107-R 1910 MHz to 1990 MHz Band, 0.41 dB loss, N(m) to SMA(f), 50 Ω
1030-112-R 2400 MHz to 2484 MHz, N(m) to SMA(f), 50 Ω
1030-149-R High Pass, 150 MHz, N(m) to N(f), 50 Ω
1030-150-R High Pass, 400 MHz, N(m) to N(f), 50 Ω
1030-151-R High Pass, 700 MHz, N(m) to N(f), 50 Ω
1030-152-R Low Pass, 200 MHz, N(m) to N(f), 50 Ω
1030-153-R Low Pass, 550 MHz, N(m) to N(f), 50 Ω
1030-155-R 2500 MHz to 2700 MHz, N(m) to N(f), 50 Ω
Part Number Description
3-1010-122 20 dB, 5 W, DC to 12.4 GHz, N(m) to N(f)
42N50-20 20 dB, 5 W, DC to 18 GHz, N(m) to N(f)
42N50A-30 30 dB, 50 W, DC to 18 GHz, N(m) to N(f)
3-1010-123 30 dB, 50 W, DC to 8.5 GHz, N(m) to N(f)
1010-127-R 30 dB, 150 W, DC to 3 GHz, N(m) to N(f)
3-1010-124 40 dB, 100 W, DC to 8.5 GHz, N(m) to N(f), Uni-directional
1010-121-R 40 dB, 100 W, DC to 18 GHz, N(m) to N(f), Uni-directional
1010-128-R 40 dB, 150 W, DC to 3 GHz, N(m) to N(f)
Part Number Description
15NNF50-1.5C 1.5 m, DC to 6 GHz, N(m) to N(f), 50 Ω
15NN50-1.5C 1.5 m, DC to 6 GHz, N(m) to N(m), 50 Ω
15NDF50-1.5C 1.5 m, DC to 6 GHz, N(m) to 7/16 DIN(f), 50 Ω
15ND50-1.5C 1.5 m, DC to 6 GHz, N(m) to 7/16 DIN(m), 50 Ω
15NNF50-3.0C 3.0 m, DC to 6 GHz, N(m) to N(f), 50 Ω
15NN50-3.0C 3.0 m, DC to 6 GHz, N(m) to N(m), 50 Ω
15NNF50-5.0C 5.0 m, DC to 6 GHz, N(m) to N(f), 50 Ω
15NN50-5.0C 5.0 m, DC to 6 GHz, N(m) to N(m), 50 Ω
15N43M50-1.5C Test Port Extension Cable, Armored, 1.5 meters,
15N43F50-1.5C
15N43M50-3.0C
15N43F50-3.0C
DC to 6GHz, N(m) to 4.3-10(m)
Test Port Extension Cable, Armored, 1.5 meter,
DC to 6GHz, N(m) to 4.3-10(f)
Test Port Extension Cable, Armored, 3 meters,
DC to 6 GHz, N(m) to 4.3-10(m)
Test Port Extension Cable, Armored, 3 meters,
DC to 6 GHz, N(m) to 4.3-10(f)
Interchangeable Adapter Phase Stable Test Port Cables, Armored w/Reinforced Grip
line sweep applications. It uses the same ruggedized grip as the Reinforced Grip series cables. Now you can also change the adapter interface on the grip
to four different connector types)
Part Number Description
15RCN50-1.5-R 1.5 m, DC to 6 GHz, N(m), N(f), 7/16 DIN(m), 7/16 DIN(f), 50 Ω
15RCN50-3.0-R 3.0 m, DC to 6 GHz, N(m), N(f), 7/16 DIN(m), 7/16 DIN(f), 50 Ω
(Recommended for cable and antenna
S412E TDS PN: 11410-00486 Rev. AT 37 of 40
Page 38

S412E Specifications
GPS Antennas
(active)
Directional Antennas
Part Number Description
2000-1528-R Magnet Mount, SMA(m) with 5 m (16.4 ft) cable, requires 5 VDC
2000-1652-R Magnet Mount, SMA(m) with 0.3 m (1 ft) cable, requires 3.3 VDC or 5 VDC
2000-1760-R Miniature Antenna, SMA(m), requires 2.5 VDC to 3.7 VDC
2000-1946-R Mag Mount Broadband Antenna
Cable 1: 617MHz to 960MHz, 3dBi peak gain,
Cable 2: 3000 MHz to 6000 MHz, 5 dBi peak gain, N(m), 50 Ω, 10 ft
Cable 3: GPS 26 dB gain, SMA(m), 50 Ω, 10 ft
Part Number Description
2000-1411-R 824 MHz to 896 MHz, N(f), 12.3 dBi, Yagi
2000-1412-R 885 MHz to 975 MHz, N(f), 12.6 dBi, Yagi
2000-1413-R 1710 MHz to 1880 MHz, N(f), 12.3 dBi. Yagi
2000-1414-R 1850 MHz to 1990 MHz, N(f), 11.4 dBi, Yagi
2000-1415-R 2400 MHz to 2500 MHz, N(f), 14.1 dBi, Yagi
2000-1416-R 1920 MHz to 2170 MHz, N(f), 14.3 dBi, Yagi
2000-1659-R 698 MHz to 787 MHz, N(f), 10.1 dBi, Yagi
2000-1660-R 1425 MHz to 1535 MHz, N(f), 14.3 dBi, Yagi
2000-1715-R Directional Antenna, 698 MHz to 2500 MHz, N(f), gain of 2 dBi to 10 dBi,
2000-1726-R Antenna, 2500 MHz to 2700 MHz, N(f), 14.1 dBi, Yagi
2000-1747-R Antenna, Log Periodic, 300 MHz to 7000 MHz, N(f), 5.1 dBi, typical
2000-1748-R Antenna, Log Periodic, 1 GHz to 18 GHz, N(f), 6 dBi, typical
2000-1777-R Portable Directional Antenna, 9 kHz to 20 MHz, N(f)
2000-1778-R Portable Directional Antenna, 20 MHz to 200 MHz, N(f)
2000-1779-R Portable Directional Antenna, 200 MHz to 500 MHz, N(f)
2000-1812-R Portable Yagi Antenna, 450 MHz to 512 MHz, N(f), 7.1 dBi
2000-1825-R Portable Yagi Antenna, 380 MHz to 430 MHz, N(f), 7.1 dBi
typical
1710 MHz to 3700 MHz, 4 dBi peak gain, N(m), 50 Ω, 10 ft
Portable Antennas
Isotropic Antennas
Part Number Description
2000-1200-R 806 MHz to 866 MHz, SMA(m), 50Ω*
2000-1473-R 870 MHz to 960 MHz, SMA(m), 50
2000-1035-R 896 MHz to 941 MHz, SMA(m), 50
2000-1030-R 1710 MHz to 1880 MHz, SMA(m), 50
2000-1474-R 1710 MHz to 1880 MHz with knuckle elbow (1/2 wave)*
2000-1031-R 1850 MHz to 1990 MHz, SMA(m), 50
2000-1475-R 1920 MHz to 1980 MHz and 2110 MHz to 2170 MHz, SMA(m), 50
2000-1032-R 2400 MHz to 2500 MHz, SMA(m), 50
2000-1361-R 2400 MHz to 2500 MHz, 5000 MHz to 6000 MHz, SMA(m), 50
2000-1636-R Antenna Kit (Consists of: 2000-1030-R, 2000-1031-R, 2000-1032-R,
2000-1616 20 MHz to 21000 MHz, N(f), 50 Ω
2000-1487-R Telescoping Whip Antenna, BNC **
Part Number Description
2000-1791-R Isotropic Antenna, 700 MHz to 6000 MHz, N(m)
2000-1792-R Isotropic Antenna, 30 MHz to 3000 MHz, N(m)
2000-1800-R Isotropic Antenna, 9 kHz to 300 MHz, N(m)
2000-1200-R, 2000-1035-R, 2000-1361-R, and carrying pouch)
* Requires 1091-27-R SMA(f) to N(m) adapter
** Requires 1091-172-R BNC(f) to N(m) adapter
Ω
*
Ω
(1/2 wave)*
Ω
(1/2 wave)*
Ω
(1/2 wave)*
Ω
(1/2 wave)*
Ω
*
Ω
*
38 of 40 PN: 11410-00486 Rev. AT S412E TDS
Page 39

Specifications S412E
NEON® MA8100A Signal Mapper
Model Number Description
MA8100A-000 NEON Signal Mapper with Anritsu Integration and Tracking Unit. Includes
MA8100A-001 NEON Signal Mapper with Anritsu Integration and Tracking Unit. Includes
MA8100A-003 NEON Signal Mapper with Anritsu Integration and Tracking Unit. Includes
MA8100A-005 NEON Signal Mapper with Anritsu Integration and Tracking Unit. Includes
MA8100A-100 NEON Signal Mapper with Anritsu Integration and Tracking Unit. Includes
2300-606 Perpetual NEON Software License with 3 years of maintenance and
2300-612 Renewal of 1 year NEON Software License with 1 year of maintenance and
2300-613 Renewal of 3 year NEON Software License with 3 years of maintenance and
2300-614 Renewal of 5 year NEON Software License with 5 years of maintenance and
2000-1852-R NEON Tracking Unit (includes USB cable and belt clip, Worldwide version)
2000-2015-R NEON Tracking Unit (includes USB cable and belt clip, Japan version)
2000-1853-R Belt clip (for NEON Tracking Unit)
1 year NEON Software License with 1 year of maintenance and support
and 1 year of Cloud Service (PN: 2300-607).
1 year NEON Software License with 1 year of maintenance and support
and 1 year of Cloud Service (PN: 2300-574).
3 year NEON Software License with 3 years of maintenance and support
and 3 years of Cloud Service (PN: 2300-575).
5 year NEON Software License with 5 years of maintenance and support
and 5 years of Cloud Service (PN: 2300-576).
Perpetual NEON Software License with 3 years of maintenance and
support and 3 years of Cloud Service (PN: 2300-606).
support and 3 years of Cloud Service. Part number can also be used to
order a perpetual license after a limited term license has expired.
support and 1 year of Cloud Service.
support and 3 years of Cloud Service.
support and 5 years of Cloud Service.
S412E TDS PN: 11410-00486 Rev. AT 39 of 40
Page 40

Training at Anritsu
Anritsu has designed courses to help you stay up to date with technologies important to your job. For available training
courses, visit:
www.anritsu.com/training
.
• United States
Anritsu Americas Sales Company
450 Century Parkway, Suite 190
Allen, TX 75013, U.S.A.
Phone: +1-800-Anritsu (1-800-267-4878)
• Canada
Anritsu Electronics Ltd.
700 Silver Seven Road, Suite 120
Kanata, Ontario K2V 1C3, Canada
Phone: +1-613-591-2003
Fax: +1-613-591-1006
• Brazil
Anritsu Eletronica Ltda.
Praça Amadeu Amaral, 27 - 1 Andar
01327-010 - Bela Vista - Sao Paulo - SP
Brazil
Phone: +55-11-3283-2511
Fax: +55-11-3288-6940
• Mexico
Anritsu Company, S.A. de C.V.
Blvd Miguel de Cervantes Saavedra #169 Piso 1,
Col. Granada
Mexico, Ciudad de Mexico, 11520, MEXICO
Phone: +52-55-4169-7104
• United Kingdom
Anritsu EMEA L td.
200 Capability Green
Luton, Bedfordshire, LU1 3LU, U.K.
Phone: +44-1582-433200
Fax: +44-1582-731303
• France
Anritsu S.A.
12 avenue du Québec, Bâtiment Iris 1- Silic 612,
91140 Villebon-sur-Yvette, France
Phone: +33-1-60-92-15-50
Fax: +33-1-64-46-10-65
• Germany
Anritsu GmbH
Nemetschek Haus, Konrad-Zuse-Platz 1
81829 München, Germany
Phone: +49-89-442308-0
Fax: +49-89-442308-55
• Italy
Anritsu S.r.l.
Via Elio Vittorini 129, 00144 Roma, Italy
Phone: +39-6-509-9711
Fax: +39-6-502-2425
List Revision Date: 20200602
• Sweden
Anritsu AB
Isafjordsgatan 32C
164 40 Kista, Sweden
Phone: +46-8-534-707-00
• Finland
Anritsu AB
Teknobulevardi 3-5
FI-01530 Vantaa, Finland
Phone: +358-20-741-8100
Fax: +358-20-741-8111
• Denmark
Anritsu A/S
c/o Regus Winghouse, Ørestads Boulevard 73, 4th
floor,
2300 Copenhagen S, Denmark
Phone: +45-7211-2200
• Russia
Anritsu EMEA Ltd.
Representation Office in Russia
Tverskaya str. 16/2, bld. 1, 7th floor
Moscow 125009, Russia
Phone: +7-495-363-1694
Fax: +7-495-935-8962
• Spain
Anritsu EMEA Ltd.
Representation Office in Spain
Paseo de la Castellana, 141.
Planta 5, Edificio Cuzco IV
28046, Madrid, Spain
Phone: +34-91-572-6761
• United Arab Emirates
Anritsu EMEA Ltd.
Dubai Liaison Office
902 Aurora Tower
P O Box: 500311- Dubai Internet City
Dubai, United Arab Emirates
Phone: +971-4-3758479
Fax: +971-4-4249036
• India
Anritsu India Private Limited
6th Floor, Indiqube ETA, No.38/4
Adjacent to EMC2, Doddanekundi, Outer Ring Road
Bengaluru 560048, India
Phone: +91-80-6728-1300
Fax: +91-80-6728-1301
• Singapore
Anritsu Pte. Ltd.
11 Chang Charn Road, #04-01, Shriro House
Singapore 159640
Phone: +65-6282-2400
Fax: +65-6282-2533
• P.R. China (Shanghai)
Anritsu (China) Co., Ltd.
Room 2701-2705, Tower A
New Caohejing International Business Center
No. 391 Gui Ping Road
Shanghai 200233, P.R. China
Phone: +86-21-6237-0898
Fax: +86-21-6237-0899
• P.R. China (Hong Kong)
Anritsu Company Ltd.
Unit 1006-7, 10/F.
Greenfield Tower, Concordia Plaza
No. 1 Science Museum Road
Tsim Sha Tsui East, Kowloon
Hong Kong, P.R. China
Phone: +852-2301-4980
Fax: +852-2301-3545
• Japan
Anritsu Corporation
8-5, Tamura-cho, Atsugi-shi, Kanagawa, 243-0016
Japan
Phone: +81-46-296-6509
Fax: +81-46-225-8352
• South Korea
Anritsu Corporation, Ltd.
5FL, 235 Pangyoyeok-ro
Bundang-gu, Seongnam-si
Gyeonggi-do 13494, South Korea
Phone: +82-31-696-7750
Fax: +82-31-696-7751
• Australia
Anritsu Pty. Ltd.
Unit 20, 21-35 Ricketts Road
Mount Waverley, Victoria 3149, Australia
Phone: +61-3-9558-8177
Fax: +61-3-9558-8255
• Taiwan
Anritsu Company Inc.
7F, No. 316, Sec. 1, NeiHu Rd. Taipei 114, Taiwan
Phone: +886-2-8751-1816
Fax: +886-2-8751-1817
Data subject to change without notice.
For the most recent specifications, visit: www.anritsu.com.
40
40 of 40
® Anritsu All trademarks are registered trademarks of their respective companies.
Copyright November 2020, Anritsu Company, USA. All Rights Reserved.
S412E TDS, PN: 11410-00486, Rev. AT
Anritsu utilizes recycled paper and environmentally conscious inks and toner.
 Loading...