

Page 1

Installation/User’s Guide
Agilent J3916A HSSI WanProbe
Page 2

Consumer Warranty Statement
Consumer Warranty Statement
AGILENT TECHNOLOGIES, INC. LIMITED WARRANTY STATEMENT
AGILENT PRODUCT DURATION OF LIMITED WARRANTY
HSSI WanProbe 1 year
Agilent warrants to you, the end-user customer, that Agilent hardware,
accessories and supplies will be free from defects in materials and workmanship
after the date of purchase, for the period specified above. If Agilent receives
notice of such defects during the warranty period, Agilent will, at its option,
either repair or replace products which prove to be defective. Replacement
products may be either new or like-new.
Agilent warrants to you that Agilent software will not fail to execute its
programming instructions after the date of purchase, for the period specified
above, due to defects in material and workmanship when properly installed and
used. If Agilent receives notice of such defects during the warranty period,
Agilent will replace software media which does not execute its programming
instructions due to such defects.
Agilent does not warrant that the operation of Agilent products will be
uninterrupted or error free. If Agilent is unable, within a reasonable time, to
repair or replace any produ ct to a cond it ion as warranted, you will be ent it l ed to a
refund of the purchase price upon prompt return of the product.
Agilent products may contain remanufactured parts equivalent to new in
performance or may have been subject to incidental use.
Warranty does not apply to defects resulting from (a ) improper or inadequate
maintenance or calibration, (b) software, interfacing, parts or supplies not
supplied by Agilent , (c) unauthorized modification or misuse, (d) operation
outside of the published environmental specifications for the product, or (e)
improper site preparation or maintenance.
ii
Page 3

Consumer Warranty Stat ement
AGILENT MAKES NO OTHER EXPRESS WARRANTY OR CONDITION
WHETHER WRITTEN OR ORAL. TO THE EXTENT ALLOWED BY LOCAL
LAW, ANY IMPLIED WARRANTY OR CONDITION OF
MERCHANTABILITY, SATISFACTORY QUALITY, OR FITNESS FOR A
PARTICULAR PURPOSE IS LIMITED TO THE DURATION OF THE
EXPRESS WARRANTY SET FORTH ABOVE. Some countries, states or
provinces do not allow limitations on the duration of an implied warranty, so the
above limitation or exclusion might not apply to you. This warranty gives you
specific legal rights an d you might also have other rig hts th at vary fr om country t o
country, state to state, or province to province.
TO THE EXTENT ALLOWED BY LOCAL LAW, THE REMEDIES IN THIS
WARRANTY STATEMENT ARE YOUR SOLE AND EXCLUSIVE
REMEDIES. EXCEPT AS INDICATED ABOVE, IN NO EVENT WILL
AGILENT OR ITS SUPPLIERS BE LIABLE FOR LOSS OF DATA OR FOR
DIRECT, SPECIAL, INCIDENTAL, CONSEQUENTIAL (INCLUDING LOST
PROFIT OR DATA), OR OTHER DAMAGE, WHETHER BASED IN
CONTRACT, TORT, OR OTHERWISE. Some countries, States or provinces do
not allow the exclusion or limitation of incidental or consequential damages, so
the above limitation or exclusion may not apply to you.
FOR CONSUMER TRANSACTIONS IN AUSTRALIA AND NEW
ZEALAND: THE WARRANTY TERMS CONTAINED IN THIS STATEMENT,
EXCEPT TO THE EXTENT LAWFULLY PERMITTED, DO NOT EXCLUDE,
RESTRICT OR MODIFY AND ARE IN ADDITION TO THE MANDATORY
ST ATUTORY RIGHTS APPLICABLE TO THE SALE OF THIS PRODUCT TO
YOU.
iii
Page 4

Operating Restrictions
The following warnings and operating information are shown in French followed
by the English translation.
MISE ENGARDE
MISE ENGARDE
Restrictions d'utilisation
L'utilisateur se doit d'observer les mesures de précaution
énumérées ci-dessous pour tou tes les ph ases d 'u tili sati on ,
de service et de réparation de cet appareil. Le fait de ne
pas s'y conformer équivaut à ne pas respecter les mises en
gardes spécifique s contenu es da ns ce manu el et cons titue
une violation des norme s de sécurité relatives à la
conception, la fabrication et l'utilisation prévue de cet
appareil. La société Agilent Technologies, Inc. n'assume
aucune responsabilité envers un client qui manquerait de
se conformer à ces exigences.
Mise à la t erre
Afin de minimiser les risques de choc électrique, le
chÀssis et le cabinet de l'apparei l doivent être mis à la
terre. L'appareil est équipé d'un cordon d'alimentation
muni d'une fiche hom oloqu é e à trois lames, com patib le
c.a. La prise murale et la prise femelle de la rallonge
électrique doivent respecter les normes de sécurité de la
«Commision électrotechnique internationale» (IEC).
Cet appareil répond aux normes
de la «Classe de sécurité I» et
est muni d'un fil de mise à la
terre pour votre protection.
Pour prévenir les risques de
choc électrique, la broche de
mise à la terre du cordon
d'alimentation ne doit pas être
désactivée.
WARNING
WARNING
Operating Restrictions
The following general safety precatuions must be observed
during all phases of oper ation, service, and r epair of this
instrument. Failure to comply with these precautions with
specific warnings in this manual violate safety standards of
design, manufacture, an d intended use of this instrument.
Grounding
To minimize shock hazard, the instrument chassis and
cabinet must be connected to an electrical ground. The
instrument is equipped with a three-conductor AC power
cable compatible with an approved three-contact electrical
outlet. The power jack and mating plug of th e power cord
must meet International Electrotechnical Commission (IEC)
safety standards.
This product is a Safety Class I
instrument with a protective earth
terminal.
For protection f rom electric shock
hazard, power cord ground must
not be defeated.
iv
Page 5

Environnement
Ne faites pas fonctionner cet appareil en présence de gaz
inflammables ou de vapeurs dangereuses. L'utilisation de
n'importe quel appareil électrique dans ces conditions
constitue un risque élevé pour votre sécurité.
Service et ajustement
Des «tensions dangereuses» résident dans cet appareil. Par
conséquent, le service et l'ajustement doivent être effectués
uniquement par une personne qualifiée.
Ne remplacez pas de composantes lorsque le cordon
d'alimentation est sous tension. Il p ourrait y avoir présence
de «tensions dangereuses» même lorsque l'appar eil est
déconnecté.
Environment
Do not operate the instrument in the presence of flammable
gases or fumes. Operation of any electrical instrument in
such an environment constitutes a definite safety hazard.
Service and Adjustment
Dangerous voltages exist within this instrument. Service
and adjustment of this instrumen t is to be perfor med only by
trained service personnel.
Do not replace components with the power cable connected.
Dangerous voltages may be present even when the power
cable is disconnected.
Ne faites pas de service interne ou d'ajustement sauf en
présence d'une autre personne, capable de prodiguer les
premiers soins et de pratiquer la réanimation.
Service non aut orisé
L'installation de pièces étrangères, ou toute modification
apportée à l'appareil sans le consentement de Agilent
Technologies, Inc. est formellement interdit. Le fait de
procéder à de tels modifications sans autorisation pourrait
entraîner l'annulation de la garantie de l'appareil ou de tout
contrat de service.
Pour un service et des réparations autorisées, retournez
l'appareil à un point de vente et service Agilent
Technologies, Inc..
Do not perform internal servicing or adjustment unless
another person, c apable of rendering first aid and
resuscitation is present.
Unauthorized Service
The installation of substitute parts or the installation of any
instrument modification not authorized by Agilent
Technologies, Inc. is specifically forbidden. The
performance of such unauthori zed service can negate the
instrument warranty or any maintenance agreements.
Return the instrument to a Agilent Technologies, Inc. Sales
and Service Office for authorized service and repair.
v
Page 6

Notice
Notice
© Copyright Agilent Technologies, Inc.
All Rights Reserved
Reproduction, adapta tion, or translation without prior written permission is
prohibited, except as allowed under the copyright laws.
The information contained in this document is subject to change without notice.
Agilent Technologies, Inc. makes no warranty of any kind with regard to th is
material, including, but not limited to, the implied warranties of
merchantability and fitness for a particular purpose.
shall not be liable for errors contained herein or for incidental or consequential
damages in connection with the furnishing, performance, or use of this material.
Agilent Technologies assumes no responsibility for the use or reliability of it s
software on equipment that is not furnished by Agilent Technologies.
Agilent Technologies
This document contains pro prietary in formation that is protected by c opyright. All
rights are reserved. No part of this document may be photocopied, reproduced, or
translated to another language without the prior written consent of Agilent
Technologies, Inc.
Agilent Technologies, Inc.
NetMetrix Division
5070 Centennial Boulevard
Colorado Springs, Colorado 80919-2497
vi
Page 7

Safety Information
Safety Information
Before you use thi s instru ment, be sure to pa y speci al att ention to the “S afety” an d
“Warning” topics in this Manual. Failure to comply with the p recautions or w ith
specific warnings in this book violates safety standards of design, manufacture,
and intended use of this instrument. Agilent assumes no liability for the
customer’s failure to comply with these requirements.
Electric Shock Hazard.
Do not remove the system covers. To avoid electric
shock, use only the supplied power cords and connect only to properly grounded
(3-pin) wall outlets.
Explosion Hazard.
Fire Hazard.
Do not operate in the presence of flammable gases.
For continued protection against fire hazard replace only with fuse
of same type and rating.
Indoor Use.
Cleaning.
solution of soap and water.
This instrument is designed for indoor use.
To clean the instrument, use a damp cloth moistened with a mild
Do not
use harsh chemicals.
Do not
let water get into
the instrument.
Product Damage.
the product shows visible damage,
fails to perform,
has been stored in unfavorable conditions, or
has been subject to severe transport stresses.
Do not use this product when:
Make the product inoperative and secure it against any unintended operation.
Contact yo ur nearest Agilent Sales office for assistance.
Defects and Abnormal Stresses.
Whenever this inst rument has be en damaged or
wet, make the product inoperative and secure it against any unintended operation.
vii
Page 8

Warning Symbols Used in This Book
Warning Symbols Used in This Book
Instruction book symbol: the product will be marked with this symbol when it is
necessary for the user to refer to the instruction book in order to protect against
damage.
Indicates potential for electrical shock.
WARN IN G
CAUTION
An operating procedure, prac tice, etc. which, if not correctly foll owed could result
in personal injury or loss of life.
An operating procedure, practice, etc. which, if not strictly observed, could result
in damage to, or destruction of, equipment or software.
viii
Page 9

Conventions Used in this Book
g
Conventions Used in this Book
NOTE
An operating procedure, prac tice, or informat ion of impor tance , is separ ated fr om
normal text as shown in this NOTE.
Terminology and conventions in this manual are handled with the following
methods:
z
Keys on the keyboard such as
(page down) or F1 (function key #1)
P
Dn
are printed in the characters you see here.
z
Text that you should type is printed in characters such as:
Filename.ext
z
In some cases, you must press two keys simultaneously. This is represented
as
CTRL + Q
.
ix
Page 10

Trademarks
Trademarks
Agilent is a registered trademark and OpenView is a trademark of
Hewlett-Packard Company.
Microsoft, LAN Manager, MS-DOS, and Windows are either registered
trademarks or trademarks of Microsoft Corporation in the United States and/or
other countries.
UNIX is a registered trademark in the United States and other countries, licensed
exclusively through X /Open Company Limited.
Ethernet is a tradem ark of Xerox Corporation.
Hayes is a registered trademark of Hayes MicroComputer Products, Inc.
IBM and Token-Ring are trademarks of International Business Machines
Corporation.
Sun and Solaris are registered trademarks of Sun Microsystems, Inc.
SPARC is a registered trademark of SPARC International, Inc. Products bearing
the SPARC trademark are based on an architecture developed by Sun
Microsystems, Inc.
Novell and NetWare are registered trademarks of Novell Inc.
x
Page 11

Printing History
Printing History
New editions are complete revisions of this book. Update packages may contain
new or additional material and be released between editions. See the date of the
current edition on the back cover of this book.
First Edition . . . . . . . . . . . . . . . . . . November 1999 J3916-99501
Additional Help
You can obtain additional assistance in the U.S. by calling U.S. Response Center
at 888 699 7280, or Internationally by calling your local Agilent Sales Office.
xi
Page 12

Additional Help
xii
Page 13

Contents
Consumer Warranty Statement. . . . . . . . . . . . . . . . . . . . . . . . . . . . . . . . . ii
Operating Restrictions . . . . . . . . . . . . . . . . . . . . . . . . . . . . . . . . . . . . . . .iv
Notice . . . . . . . . . . . . . . . . . . . . . . . . . . . . . . . . . . . . . . . . . . . . . . . . . . . .vi
Safety Information . . . . . . . . . . . . . . . . . . . . . . . . . . . . . . . . . . . . . . . . . vii
Warning Symbols Used in This Book . . . . . . . . . . . . . . . . . . . . . . . . . .viii
Conventions Used in this Book . . . . . . . . . . . . . . . . . . . . . . . . . . . . . . . .ix
Trademarks. . . . . . . . . . . . . . . . . . . . . . . . . . . . . . . . . . . . . . . . . . . . . . . . x
Printing History . . . . . . . . . . . . . . . . . . . . . . . . . . . . . . . . . . . . . . . . . . . .xi
Additional Help . . . . . . . . . . . . . . . . . . . . . . . . . . . . . . . . . . . . . . . . . . . .xi
1 Introduction. . . . . . . . . . . . . . . . . . . . . . . . . . . . . . . . . . . 1
Installation and Configuration Overview. . . . . . . . . . . . . . . . . . . . . . . . . 4
Local Terminal Configuration and Installation . . . . . . . . . . . . . . . . . 4
Installation and Bootp Server Configuration . . . . . . . . . . . . . . . . . . 4
Probe Overview . . . . . . . . . . . . . . . . . . . . . . . . . . . . . . . . . . . . . . . . . . . . 5
System Overview . . . . . . . . . . . . . . . . . . . . . . . . . . . . . . . . . . . . . . . 5
Supported MIBs . . . . . . . . . . . . . . . . . . . . . . . . . . . . . . . . . . . . . . . . 7
Management Stations . . . . . . . . . . . . . . . . . . . . . . . . . . . . . . . . . . . . 8
Access Security . . . . . . . . . . . . . . . . . . . . . . . . . . . . . . . . . . . . . . . . . 8
Status LEDs . . . . . . . . . . . . . . . . . . . . . . . . . . . . . . . . . . . . . . . . . . . . . . 10
Front Panel LEDs . . . . . . . . . . . . . . . . . . . . . . . . . . . . . . . . . . . . . . 10
Rear Panel Telemetry LEDs . . . . . . . . . . . . . . . . . . . . . . . . . . . . . . 11
10Base-T/100Base-TX Telemetry Interface Status LEDs . . . . 11
Token-Ring Telemetry Interface Status LED . . . . . . . . . . . . . . 12
HSSI WAN Interface Status LEDs . . . . . . . . . . . . . . . . . . . . . . 13
CONFIG Button . . . . . . . . . . . . . . . . . . . . . . . . . . . . . . . . . . . . . . . 13
Included Parts . . . . . . . . . . . . . . . . . . . . . . . . . . . . . . . . . . . . . . . . . 14
Optional Accessories. . . . . . . . . . . . . . . . . . . . . . . . . . . . . . . . . 14
2 Local Terminal Configuration. . . . . . . . . . . . . . . . . . . 15
Probe Configuration Using a Local Terminal . . . . . . . . . . . . . . . . . . . . 17
Using the Main Menu. . . . . . . . . . . . . . . . . . . . . . . . . . . . . . . . . . . . . . . 19
Modify/View Configuration Values . . . . . . . . . . . . . . . . . . . . . . . . 22
Modify/View Security Values . . . . . . . . . . . . . . . . . . . . . . . . . . . . 24
xiii
Page 14

Modify/View Interface Values . . . . . . . . . . . . . . . . . . . . . . . . . . . . 25
Fast Ethernet Telemetry Interface Configuration . . . . . . . . . . 25
Token-Ring Telemetry Interface Configuration . . . . . . . . . . . 29
HSSI WAN Interface Configuration . . . . . . . . . . . . . . . . . . . . 33
Display Interface Summary . . . . . . . . . . . . . . . . . . . . . . . . . . . . . . . 36
Modify/View Serial Port Settings . . . . . . . . . . . . . . . . . . . . . . . . . 36
Exiting the Main Menu and Restarting the Probe. . . . . . . . . . . . . . . . . . 40
3 Installation . . . . . . . . . . . . . . . . . . . . . . . . . . . . . . . . . . 41
Selecting a Location . . . . . . . . . . . . . . . . . . . . . . . . . . . . . . . . . . . . . . . . 43
Installing the Probe. . . . . . . . . . . . . . . . . . . . . . . . . . . . . . . . . . . . . . . . . 44
Table Installation . . . . . . . . . . . . . . . . . . . . . . . . . . . . . . . . . . . . . . . 45
Rack or Cabinet Installation . . . . . . . . . . . . . . . . . . . . . . . . . . . . . . 45
Wall Installation . . . . . . . . . . . . . . . . . . . . . . . . . . . . . . . . . . . . . . . 47
Connecting the Probe . . . . . . . . . . . . . . . . . . . . . . . . . . . . . . . . . . . . . . . 4 9
Connecting to the Network (Out-of-Band) . . . . . . . . . . . . . . . . . . . 49
Connecting to 10MB/s Ethernet Telemetry Networks. . . . . . . 50
Connecting to 10Base-T/100Base-TX Telemetry Networks. . 51
Connecting to Token-Ring Telemetry Networks. . . . . . . . . . . 53
About the Information in the Following Sections . . . . . . . . . . . . . . 56
Connecting to a HSSI System (In-Band) . . . . . . . . . . . . . . . . . . . . . 56
HSSI Monitor Connections . . . . . . . . . . . . . . . . . . . . . . . . . . . 56
Connecting to the Serial Port (Out-of-Band) . . . . . . . . . . . . . . . . . . 59
Direct Connection . . . . . . . . . . . . . . . . . . . . . . . . . . . . . . . . . . 59
Modem Connection . . . . . . . . . . . . . . . . . . . . . . . . . . . . . . . . . 60
Data Switch Connection . . . . . . . . . . . . . . . . . . . . . . . . . . . . . 65
Starting the Probe . . . . . . . . . . . . . . . . . . . . . . . . . . . . . . . . . . . . . . . . . . 6 7
Verifying the Installation . . . . . . . . . . . . . . . . . . . . . . . . . . . . . . . . . . . .68
Out-of-Band Troubleshooting . . . . . . . . . . . . . . . . . . . . . . . . . . . . . 69
Ethernet Telemetry Interface . . . . . . . . . . . . . . . . . . . . . . . . . . 69
HSSI Troubleshooting . . . . . . . . . . . . . . . . . . . . . . . . . . . . . . . . . . . 70
4 Bootp Server Configuration . . . . . . . . . . . . . . . . . . . . 71
Probe Configuration Using a Bootp Server . . . . . . . . . . . . . . . . . . . . . . 73
Bootp Server Setup on an HP or Sun System . . . . . . . . . . . . . . . . . . . .75
Starting the Bootp Server on an HP or Sun System . . . . . . . . . . . .77
Bootp Server Setup on a PC . . . . . . . . . . . . . . . . . . . . . . . . . . . . . . . . . . 79
Using Microsoft LAN Manager . . . . . . . . . . . . . . . . . . . . . . . . . . . 80
Using Novell NetWare . . . . . . . . . . . . . . . . . . . . . . . . . . . . . . . . . 82
xiv
Page 15

Starting the PC Bootp Server . . . . . . . . . . . . . . . . . . . . . . . . . . 83
Configuring the Bootptab File . . . . . . . . . . . . . . . . . . . . . . . . . . . . . . 85
Example Bootptab File . . . . . . . . . . . . . . . . . . . . . . . . . . . . . . . 88
5 Probe Operation . . . . . . . . . . . . . . . . . . . . . . . . . . . . . . 89
Restarting the Probe . . . . . . . . . . . . . . . . . . . . . . . . . . . . . . . . . . . . . . . . 91
Warm Start . . . . . . . . . . . . . . . . . . . . . . . . . . . . . . . . . . . . . . . . . . . 91
Cycling Power. . . . . . . . . . . . . . . . . . . . . . . . . . . . . . . . . . . . . . 93
Selecting the Warm Start Menu Item . . . . . . . . . . . . . . . . . . . . 94
Cold Start . . . . . . . . . . . . . . . . . . . . . . . . . . . . . . . . . . . . . . . . . . . . 95
Pressing the CONFIG Button Twice. . . . . . . . . . . . . . . . . . . . . 95
Selecting the Cold Start Menu Item . . . . . . . . . . . . . . . . . . . . . 96
6 Download New Firmware . . . . . . . . . . . . . . . . . . . . . . 97
Downloading Firmware using an HP-UX W orkstation and a Terminal100
Install New Download Firmware on an HP-UX Workstation . . . 100
Download Firmware to the Probe . . . . . . . . . . . . . . . . . . . . . . . . . 101
Downloading Firmware using a Networked PC and a Terminal . . . 104
Setup TFTP Server for Downloading . . . . . . . . . . . . . . . . . . . . . . 104
Download Firmware to the Probe . . . . . . . . . . . . . . . . . . . . . . . . . 104
Xmodem Download of Firmware . . . . . . . . . . . . . . . . . . . . . . . . . . . . 108
A Cables and Connectors . . . . . . . . . . . . . . . . . . . . . . . 113
HSSI Connectors and Cables . . . . . . . . . . . . . . . . . . . . . . . . . . . . . . . . 115
HSSI Null Modem Cable . . . . . . . . . . . . . . . . . . . . . . . . . . . . . . . . . . . 116
Token-Ring Cables. . . . . . . . . . . . . . . . . . . . . . . . . . . . . . . . . . . . . . . . 118
Serial Port Interface Cabl es . . . . . . . . . . . . . . . . . . . . . . . . . . . . . . 119
Cable Connector Pin-Outs . . . . . . . . . . . . . . . . . . . . . . . . . . . . . . . . . . 120
The Probe’s RS-232 Port Pin-Out. . . . . . . . . . . . . . . . . . . . . . 120
The Probe’s RS-232 Modem Cable Connectors. . . . . . . . . . . 121
25-pin Terminal/PC Cable Connectors . . . . . . . . . . . . . . . . . . 122
9-pin Terminal/PC Cable Connectors . . . . . . . . . . . . . . . . . . . 122
UTP Network Connector Pin-Out. . . . . . . . . . . . . . . . . . . . . . 123
STP Network Connector Pin-Out . . . . . . . . . . . . . . . . . . . . . . 124
xv
Page 16

B Specifications . . . . . . . . . . . . . . . . . . . . . . . . . . . . . . . 125
Probe Memory Allocation . . . . . . . . . . . . . . . . . . . . . . . . . . . 128
Glossary
Index
Agilent Technologies, Inc. Offices
xvi
Page 17

Figures
Figure 1-1: The Probe. . . . . . . . . . . . . . . . . . . . . . . . . . . . . . . . . . . . . . . . 3
Figure 1-2: Probe System Example . . . . . . . . . . . . . . . . . . . . . . . . . . . . 6
Figure 1-3: Front Panel LEDs . . . . . . . . . . . . . . . . . . . . . . . . . . . . . . . 11
Figure 1-4: Rear Panel LEDs . . . . . . . . . . . . . . . . . . . . . . . . . . . . . . . . 12
Figure 2-1: Probe Rear Panel. . . . . . . . . . . . . . . . . . . . . . . . . . . . . . . . . 20
Figure 2-2: Probe Main Menu . . . . . . . . . . . . . . . . . . . . . . . . . . . . . . . 21
Figure 2-3: Modify/View Configuration Values Menu . . . . . . . . . . . . 22
Figure 2-4: Modify/View Security Values Menu . . . . . . . . . . . . . . . . . 24
Figure 2-5: Modify/View Interface Values Menu (Fast Ethernet) . . . 26
Figure 2-6: Modify/View Interface Values Menu (Token Ring) . . . . . 30
Figure 2-7: Modify/View Interface Values Menu (HSSI WAN) . . . . . 33
Figure 2-8: Display Interface Summary . . . . . . . . . . . . . . . . . . . . . . . . 36
Figure 2-9: Modify/View Serial Port Settings Menu . . . . . . . . . . . . . 37
Figure 3-1: Install the Probe in a Rack or Cabinet. . . . . . . . . . . . . . . . . 46
Figure 3-2: Install the Probe on a Wall . . . . . . . . . . . . . . . . . . . . . . . . 48
Figure 3-3: Probe Rear Panel (Token-Ring Option shown) . . . . . . . . . 50
Figure 3-4: Connecting the Probe to a 10MB/s Ethernet Network . . . 51
Figure 3-5: Connecting the Probe to a 10Base-T/100Base-T Network 53
Figure 3-6: Connecting the Probe Using RJ-45 Connectors . . . . . . . . 54
Figure 3-7: Connecting the Probe using a Media Filter . . . . . . . . . . . . 55
Figure 3-8: Connecting the Probe Using Data & DB-9 Connectors . . 56
Figure 3-9: HSSI System . . . . . . . . . . . . . . . . . . . . . . . . . . . . . . . . . . . 57
Figure 3-10: Close-up of the HSSI Interface . . . . . . . . . . . . . . . . . . . . 57
Figure 3-11: HSSI Monitor In-Line Connection . . . . . . . . . . . . . . . . . 58
Figure 3-12: Probe Direct Connection . . . . . . . . . . . . . . . . . . . . . . . . . 60
Figure 3-13: Probe Modem Connection . . . . . . . . . . . . . . . . . . . . . . . . 61
Figure 3-14: Probe Data Switch Connection . . . . . . . . . . . . . . . . . . . . 66
Figure 5-1: Probe Main Menu . . . . . . . . . . . . . . . . . . . . . . . . . . . . . . . . 94
Figure 6-1: Probe Main Menu (HP-UX Workstation) . . . . . . . . . . . . . 102
Figure 6-2: Probe TFTP Download Menu (HP-UX Workstation) . . . 103
Figure 6-3: Probe Main Menu (Networked PC) . . . . . . . . . . . . . . . . . 106
Figure 6-4: Probe TFTP Download Menu (Networked PC) . . . . . . . 107
xvii
Page 18

Figure 6-5: Probe Main Menu (XMODEM) . . . . . . . . . . . . . . . . . . . .109
Figure 6-6: Probe XMODEM Download Menu . . . . . . . . . . . . . . . . . 109
Figure A-1: Data Connector Color Coded Connection Points . . . . . . . 124
Figure B-1: Probe Memory Allocation . . . . . . . . . . . . . . . . . . . . . . . . 129
xviii
Page 19

Tables
Table 1-1: Private MIB Access Security Privileges. . . . . . . . . . . . . . . . . 9
Table 4-1: Minimum Requirements for a Bootp Server. . . . . . . . . . . . . 74
Table 4-2: Bootp Server Bootptab Files . . . . . . . . . . . . . . . . . . . . . . . . 85
Table 4-3: Bootptab File Tags . . . . . . . . . . . . . . . . . . . . . . . . . . . . . . . . 86
Table 4-4: Bootp Process Verification . . . . . . . . . . . . . . . . . . . . . . . . . 87
Table 5-1: Probe Data and Parameters Reset by Warm or Cold Start . . 92
Table A-1: HSSI Interface Cable Pinout . . . . . . . . . . . . . . . . . . . . . . . 115
Table A-2: HSSI Null Modem Cable Pinout . . . . . . . . . . . . . . . . . . . 116
Table A-3: Token-Ring Cable Type, Vp, and Impedance . . . . . . . . . . 118
Table A-4: Serial Port Interface Cable . . . . . . . . . . . . . . . . . . . . . . . . 119
Table A-5: Probe RS-232 Port Pin-Out . . . . . . . . . . . . . . . . . . . . . . . . 120
Table A-6: Probe to Modem Cable Min. Pin-Out (25-Pin to 25-Pin) . 121
Table A-7: Probe to 25-Pin Terminal Cable Min. Pin-Out . . . . . . . . . 122
Table A-8: Probe to 9-Pin Terminal Cable Min. Pin-Out . . . . . . . . . . 122
Table A-9: UTP (Type 3) Network Connector Pin-Outs . . . . . . . . . . 123
Table A-10: STP (Type 1) Network Connector Pin-Outs . . . . . . . . . . 124
xix
Page 20

xx
Page 21

1
Introduction
Page 22

Introduction
Introduction
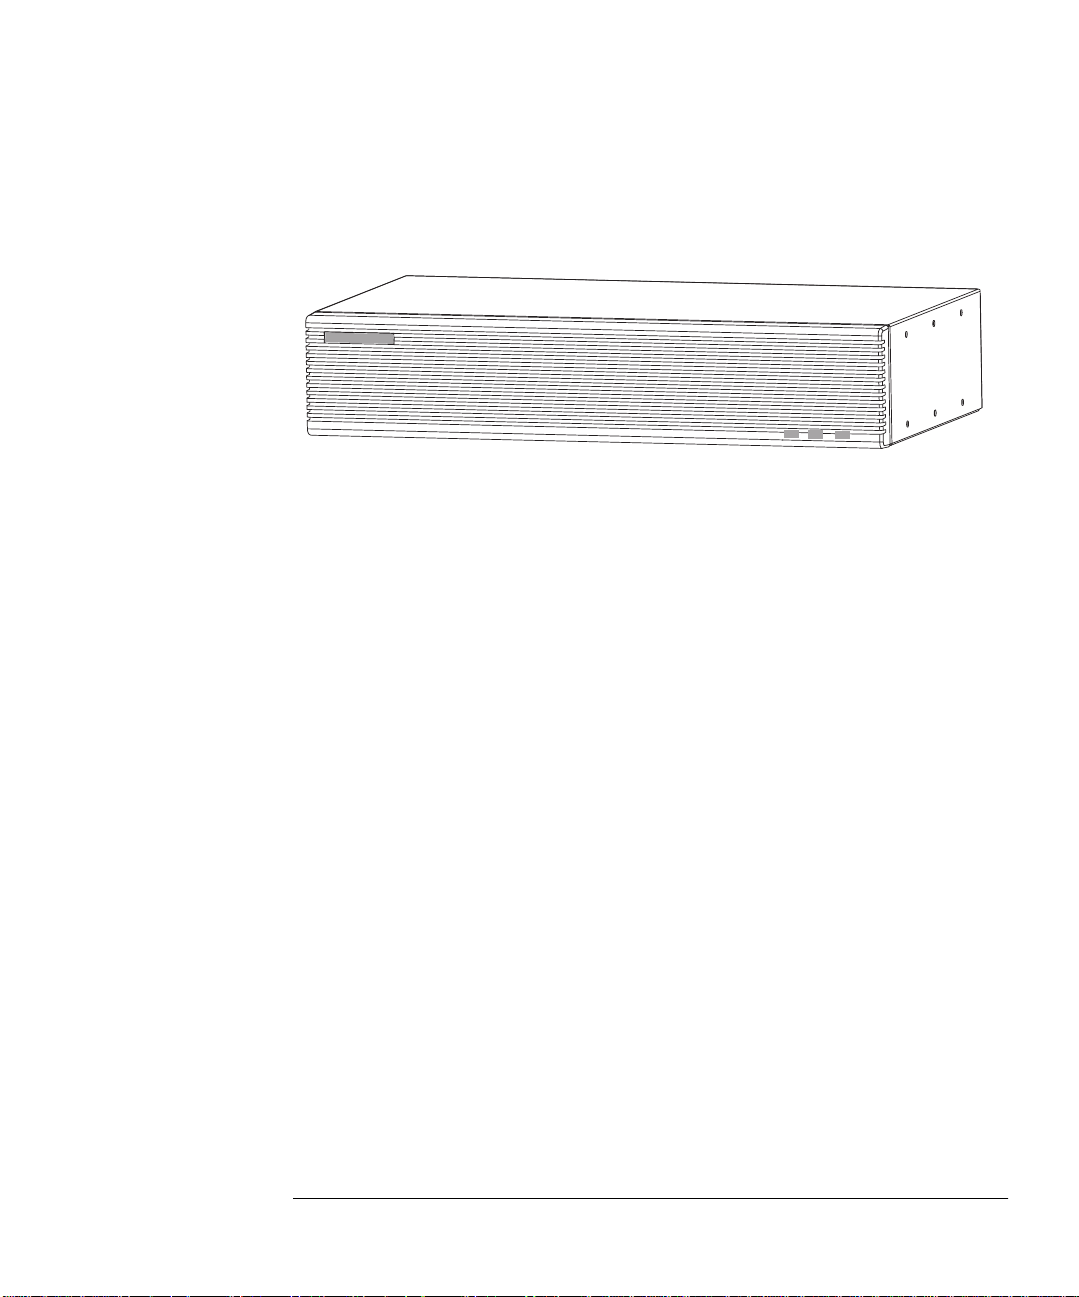
This chapter introduces the Agilent J3916A HSSI WanProbe, shown in Figure 11 on page 3, including its installation and configuration options.
You can use your WanProbe with the NetMetrix/UX software, supported by
HP-UX and Solaris. The term “NetMetrix” is used in this manual to refer to
Agilent NetMetrix/UX.
The Agilent J3916A HSSI WanProbe is a MIPS-based, SNMP-managed WAN
interface monitor for HSSI Wide Area Networks (WAN). The WanProbe is an
intelligent device that must be physically located at the site where the WAN
circuits reside.
The base hardware configuration supports a HSSI WAN interface, a 10Base-T/
100Base-TX telemetry int erface, and a SLIP connection. The HSSI WanProbe can
also be ordered with a Token-Ring telemetry interface. The HSSI WAN interface
supports monitoring bot h d ir ect io ns of a full-duplex circuit simultaneousl y. Probe
data is retrieved using SNMP via a LAN or SLIP connection.
The 10Base-T/100Base-TX telemetry interface uses an RJ-45 connector. The
Ethernet telemetry interface uses an AUI connector. The optional Token-Ring
telemetry interface uses either an RJ-45 or DB-9 connector. The HSSI WAN
interface uses industry-standard connectors.
2
Page 23
Introduction
Figure 1-1: The Probe
The HSSI WanProbe has 32 MB of memory (optionally 64 or 128 MB), and uses
FLASH EPROM. Probe firmware upgrades are easily downloaded over the LAN
to multiple probes simultaneously. You can also download firmware using the
probe’s serial port.
The WanProbe maintains a variety of statistical measurements on network
performance, continuously keeping track of traffic levels, errors, and other
important trends. Alarm thresholds can be set to a number of parameters to
immediately alert the network manager or initiate a packet trace to capture the
details of an event for later analysis. Traffic and error levels are monitored for the
WAN connection on a per-PCV basis.
In addition to using SNMP and selected RMON MIB groups, the WanProbe uses
Agilent priv ate MIB exten sions to provid e additional capabilities. Multiple
SNMP trap addresses, or groups of addresses, can be defined for event
notification. A real-time utilization variable provides the alarm capability at
instantaneous peaks of network load. An additional Out-of-Band connection to
the probe can be established using Serial Link Internet Protocol (SLIP), either
directly, using a modem, or by using a data switch.
3
Page 24

Introduction
Installation and Configuration Overview
Installation and Configuration Overview
To quickly install and configure your probe, it is important for you to understand
the available configuration and installation options. Configuration consists of
setting the probe parameters (IP address, for example). Installation consists of
physically installing the probe and connecting it to the network.
Local Terminal Configuration and Installation
This method of installation and configuration requires that you first configure the
probe and then instal l the probe. These proc edures are detailed in “Local Terminal
Configuration and Installation” on page 4 and “Installation” on page 41.
Installation and Bootp Server Configuration
This method of installation and configuration requires that you first install the
probe and then configure the probe. These procedures are detailed in
“Installation” on page 41 and “Bootp Server Configuration” on page 71.
4
Page 25

Introduction
Probe Overview
Probe Overview
This section provides some general information on the Agilent J3916A HSSI
WanProbe.
NOTE
The HSSI WanProbe repeats the received signal. There is a few milliseconds
interruption to network traffic if the probe loses power.
System Overview
A typical probe distributed monitoring system consists of the following:
z
One or more WanProbes
z
One or more NetMetrix management stations, using NetMetrix
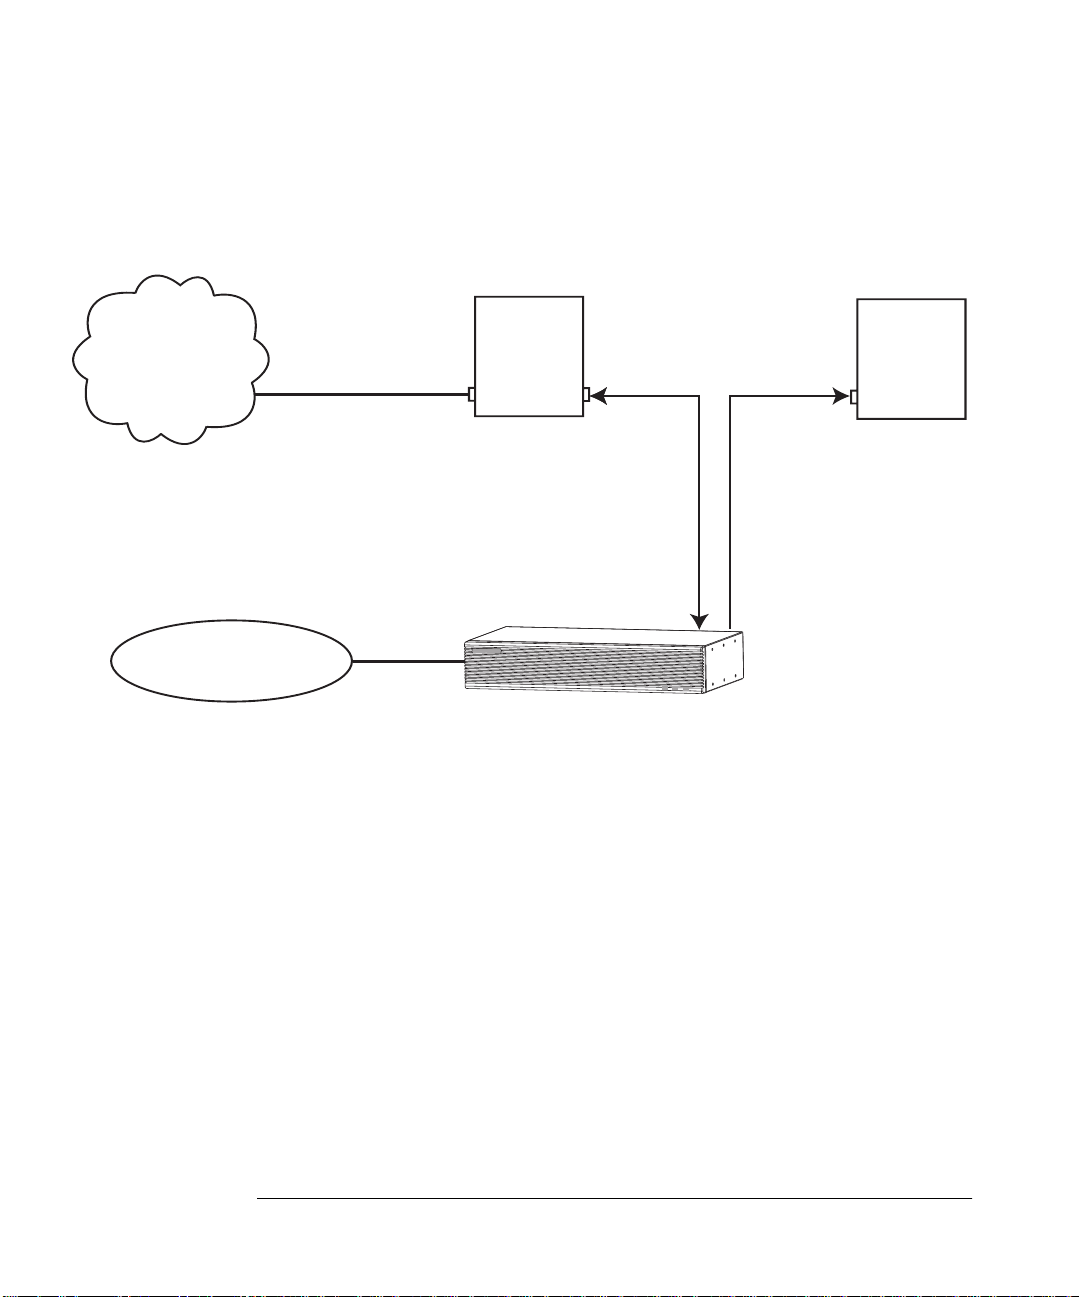
Figure 1-2 on page 6 shows a WanProbe system example.
5
Page 26
Introduction
Probe Overview
WAN
Network
Telemetry Network
(Ethernet or Token-Ring)
T3/E3
DSU/CSU
T3 or E3 from Telco
Agilent HSSI WanProbe
Figure 1-2: Probe System Example
Router
HSSI HSSI
6
Page 27

Introduction
Probe Overview
Supported MIBs
The W anProbe use s SNMP, MIB-II, Agilent priv ate MIB extensions, and sel ected
RMON MIB groups (groups 3,7,8, and 9) to provide the following features:
Alarms
z
Filters
z
Packet Capture
z
Events
z
Log
z
Tra p
z
Signaling Layer Statistics
z
Signaling Layer Historical Statistics
z
Frame Relay Protocol Statistics
z
Frame Relay Historical Protocol Statistics
z
PPP* Protocol Statistics
z
PPP* Historical Protocol Statistics
z
Per PVC Frame Relay Protocol Statistics
z
Per PVC Frame Relay Historical Protocol Statistics
z
Per PVC PPP* Protocol Statistics
z
Per PVC PPP* Historical Protocol Statistics
z
* PPP refers to PPP, HDLC, or SDLC.
The WanProbe implements groups 3, 7, 8, and 9 of RFC 1757,the Remote
Network Monitoring Management Information Base (RMON-1 MIB). Refer to
the RFC for more information.
The WanProbe also implements the Agilent Private MIB, which contains all
WAN statistics and allows for configuration and administration of the probe. It
provides enhanced authentication features, specification of trap destinations,
remote download of new firmware revisions, serial line control, and other
features. The Agilent Private MIB is available electronically with NetMetrix.
7
Page 28

Introduction
Probe Overview
Management Stations
You can use a management station to communicate with the probe and gather
network data. The manageme nt stati on pres ents i nformat ion in an easy -to-u se and
easy-to-understand text and graphic format.
The management station uses NetMetrix software. NetMetrix management
applications allow you to review and reconf igure the pr obe parameter s (such as IP
address, trap destina tions, filters , and packe t captu res), t o manage th e infor mation
collected by the pr obe (includin g statisti cs, historic al studie s, alarms, and capt ured
packet traces), and to monitor local or remote networks (by gathering network
statistics from Agilent Probe agents as network monitors).
Refer to your NetMetrix documentation for more informa tion.
Access Security
A network administrator can disable standard RMON functions as a security
precaution. A security menu allows the network administrator to disable the
RMON-1 packet capture capabilities of the probe to prevent network users from
viewing network traffic. TFTP firmware downloads can be disabled to prevent
users from do wnloading ea rlier versions of the probe firmware. For more
information, refer to “Modify/View Security Values” on page 24.
The probe private MIB uses a fou r-level access contr ol scheme. An access level is
assigned for each community string. The access level is an integer value between
one and four, with increasing degrees of authorization granted for higher
authorization numbers. Each higher level is granted the rights of all lower levels
in addition to the specific privileges of that level. Table 1-1 on page 9 shows
specific access privileges by level.
8
Page 29

Introduction
Probe Overview
Default
Community
Level Permissions
Name
public 1 Read access to MIB-II objects.
rmon 2 Read access to MIB-II, RMON MIB, and the
probe MIB objects, excluding the objects in
the accessControl group and in the
captureBuffer Table.
rmon_admin 3 Write access to RMON MIB an d the probe
MIB objects, excluding the objects in the
probeAdmin, interface, and accessControl
groups.
Read access to MIB-II, RMON MIB
(including the captureBuffer Table), and the
probe MIB objects, excluding those in the
accessControl group.
Agilent _admin 4 Read and write access to all MIB-II, RMON
MIB, and the probe MIB objects.
Table 1-1: Private MIB Access Security Privileges
9
Page 30

Introduction
Status LEDs
Status LEDs
The probe has status LEDs for the base hardware configuration (t he 10Base-T/
100Base-TX telemetry interface), for the HSSI WAN interface, and for the
optional Token-Ring telemetry i nterf ace. Thes e LEDs a re loc ated on t he fro nt and
back panels of the probe. (Figure 1-3 on page 11 shows the LEDs on the front of
the porbe and Figure 1-4 on page 12 shows the LEDs on the back of the probe.)
Front Panel LEDs
The ~ Line On, Activity, and Fault LEDs are on the front of the probe.
~ Line On
power.
Activity
Ethernet telemetry network or transmitted by the probe. When flashing, the
frequency shows the amount of traffic. During periods of steady traffic, it may
appear to stay on solid.
Fault
. This yellow LED is t urned on when the probe ne eds to b e reset , repair ed, or
replaced or when new firmware is downloaded. The Fault LED is normally on
during the power-on self-test, but turns off after a successful self-test or when a
cold or warm start is completed.
Power
or
. This green LED is turned on when data is being received from the
. This green LED is turned on when the probe is receiving
10
Page 31

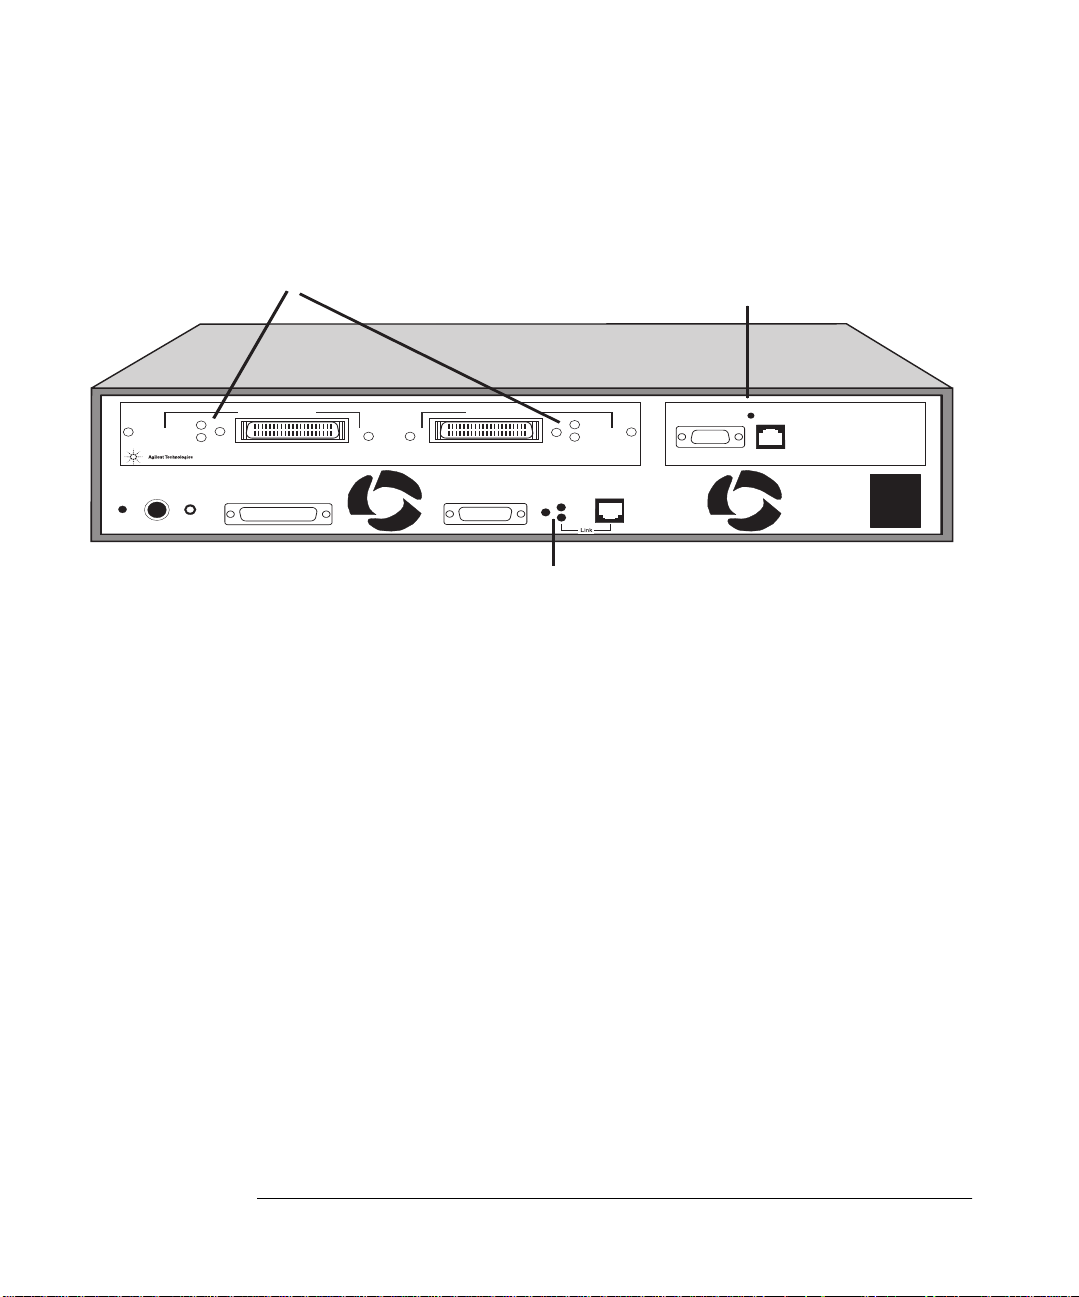
Figure 1-3: Front Panel LEDs
Introduction
Status LEDs
Rear Panel Telemetry LEDs
The telemetry LEDs are located on the back of the probe. (See Figure 1-4.)
10Base-T/100Base-TX Telemetry Interface Status LEDs
On the back of the probe, there are LEDs associated specifically with each
interface and a Power LED. The 10Base-T/100Base-TX telemetry interface has
LEDs for Activity, Link and Collision.
Link.
This green LED is turned on when the probe is attached to a 10Base-T/
100Base-TX network.
Collision.
network.
This yellow LED is turned on when the probe detects collisions on the
11
Page 32
Introduction
Status LEDs
HSSI WAN Interface Status LEDs
Port 1
Fault
To DTE From DCE
HSSI Interface
RS-232
Power
Data
Clock
Config.
Figure 1-4: Rear Panel LEDs
Token-Ring Telemetry Interface Status LED
The optional Token-Ring telemetry interface has an LED for
LED is turned on when data is being received from the network or transmitted by
the probe. When flashing, the frequency shows the amount of traffic. During
periods of steady traffic, the LED may appear to stay on solid.
Port 2
AUI
Fault
Activity
Collision
Data
Clock
100Base-T
10Base-T/100Base-TX Status LEDs
Token-Ring Telemetry Status LED
Activity
DB-9
RJ-45
Token-Ring Telemetry INTERFACE
Activity
. This green
12
Page 33

Introduction
Status LEDs
HSSI WAN Interface Status LEDs
The HSSI WAN interface has a pair of In and Out LEDs for Data and Clock
functions. It also has a Fault LED for the microprocessor contained on the WAN
interface. (See Figure 1-4.)
Data
. These green LEDs are turned on when valid frames are received from the
network by the HSSI interface . When flashing, the frequency shows the amount
of traffic. During periods of steady traffic, the LED may appear to stay on solid.
Clock
. These green LEDs are turned on when the HSSI interface detects a clock
signal on the interface.
Fault
. These yellow LEDs are t ur ned off when the HSSI interfac e is r unni ng. It is
normal for these LEDs to flash during initialization or when a network error is
detected.
CONFIG Button
The CONFIG button is used to configure the probe from a terminal or to restart
the probe. The CONFIG button is recessed and located on the back of the probe
near the RS-232C connector. You will need to use a narrow, pointed object (l ike a
pen) to press the CONFIG button.
To configure the probe using a local terminal (or PC emulating a terminal),
connect a terminal to the probe using a null modem cable and push the CONFIG
button to display the probe Main Menu. This operation is described in “Local
Terminal Configuration” on page 15.
You can restart the probe (with a warm start or cold start) using the CONFIG
button. (See “Probe Operation” on page 89.)
13
Page 34

Introduction
Status LEDs
Included Parts
The following items are included with your Agilent J3916A HSSI WanProbe:
Agilent J3916A HSSI WanProbe
z
Agilent J3916A HSSI WanProbe Installation/User’s Guide—this manual
z
(J3916-99501)
Bootp Software 3.5-inch Disk, for PCs
z
Hardware Kit (5064-0339)
z
Two Mounting Brackets for the Agilent Probe
Four 10-mm #M4 Mounting Screws
Four 5/8-in #12-24 Mounting Screws
Four Self-Adhesive rubber feet
Power Cord, one of the following:
z
Australian (8120-1369)
Danish (8120-2957)
European (8120-1689)
Japanese (8120-4753)
South Africa (8120-4600)
Swiss (8120-2104)
United Kingdom (8120-1351)
United States/Canada 125 V (8120-1378)
United States/Canada 250 V (8120-0698)
Optional Accessories
The following Agilent Probe accessories can be purchased from Agilent :
Null Modem Cable—9 pin to 25 pin (Agilent 24542G)
z
14
Page 35

2
Local Terminal Configuration
Page 36

Local Terminal Configuration
Local Terminal Configuration
This chapter describes how to use a local terminal to configure your Agilent
J3916A HSSI WanProbe so that it can communicate via a network. If you plan to
use the Bootp server method of configuration, skip to “HSSI WAN Interface
Configuration” on page 33 and then continue with “Installation” on page 41.
16
Page 37

Probe Configuration Using a Local Terminal
Local Terminal Configuration
Probe Configuration Using a Local Terminal
An initial configuration of the probe is necessary before it can communicate over
the LAN telemetry network interface or serial port. Th e WAN interface must be
configurated before monitoring can o ccur . You perform the configurati on by using
a series of configur ation menus that provide a numbe r of options (f ields) to choo se
from.
NOTE
This chapter covers all the information you will need to perform the initial
configuration of the probe with the exception of, the
firmware
start and Exit and Cold start and Exit
XMODEM Download new firmware
and
menu items. These topics are explained
TFTP Download new
menu items and the
Warm
in Chapter 6 “Download New Firmware” and Chapter 5 “Probe Operation”,
respectively.
The initial configuration for the Ethernet LAN Telemetry network (10Base-T or
100Base-TX) communication includes:
z
IP Address
z
Default Gateway IP Address (if required)
z
Subnet Mask (if required)
z
Autodiscovery Echo Interval
The initial configuration for the optional Token-Ring LAN Telemetry interface
includes:
z
Ring Speed
z
Ring Number
The following configuration parameters are used to display time and date
information in the user interface only. A separate internal clock is used to timestamp data collected from the network.
z
Date
z
Time
z
Time Zone
17
Page 38

Local Terminal Configuration
Probe Configuration Using a Local Terminal
The initial configuration for communication over the serial port includes:
Serial Port IP Address
z
Serial Port Subnet Mask (if required)
z
Serial Port Speed
z
Serial Port Mode
z
Modem Control String (if required)
z
The initial configuration for the HSSI WAN interface parameters includes:
Data Sense
z
Link Type
z
Clock Speed
z
(Refer to “HSSI WAN Interface Configuration” on page 33 for additional
information.)
18
Page 39

Local Terminal Configuration
Using the Main Menu
Using the Main Menu
To configure the probe, connect a terminal directly to the probe and use the probe
Main Menu.
NOTE
The probe is not available to the network when you are using the configuration
menus.
To view the probe Main Menu:
1. Connect a terminal or a personal computer (PC) emulating a terminal to the
probe RS-232 connector using a null modem cable. Refer to Appendix A,
“Cables and Connectors” on page 113 for more information on cables.
2. Configure the terminal for 8 bits/character, 1 stop bit, no parity, Xon/Xoff
handshaking, and a baud rate of 9600.
3. Connect the power cord to the probe and to a power source (either 100-120/
VAC or 220-240/VAC). The probe does not have a power switch, but is
turned on by connecting to a power source.
19
Page 40

Local Terminal Configuration
Using the Main Menu
4. Start the configuration by quickly pressing the CONFIG button on the back
of the probe one time only. After about 10 seconds, the probe displays its
Main Menu on the terminal. Figure 2-1 shows the location of the CONFIG
button and Figure 2-2 on pa ge 21 shows the probe’s Main Menu. If the Main
Menu is not displayed, verify that the previous steps in this procedure have
been performed correctly.
Power
NOTE
Data
Clock
Fault
HSSI Interface
Config.
Config. Button
Figure 2-1: Probe Rear Panel
The probe CONFIG button is recessed. This requires the use of a narrow, pointed
object (like a pen) to press the CONFIG button.
The probe executes a cold start if you press the CONFIG button twice within one
second. If th is happens, wait for the cold start to be completed and press the
CONFIG button again to enter the configuration mode.
A warm start or cold start is completed when the Fault LED goes off. If traffic is
present, the Activity LED flashes to show traffic.
Port 1
To DTE From DCE
RS-232
AUI
Port 2
Fault
Activity
Collision
Data
Clock
100Base-T
Activity
DB-9
RJ-45
Token-Ring Telemetry INTERFACE
20
Page 41

Local Terminal Configuration
Main Menu - Revision
[1]Modify/View configuration values ->
[2]Modify/View security values ->
[3]Modify/View interface values ->
[4]Display interface summary
[5]TFTP Download new firmware ->
[6]XMODEM Download new firmware ->
[7]Warm start and Exit
[8]Cold start and Exit
Figure 2-2: Probe Main Menu
Using the Main Menu
NOTE
Item 5 (TFTP Download new firmware) is not displayed if the Allow TFTP
firmware downloads menu item is not enabled. Refer to “Modify/View Security
Values” on page 24 for more information on enabling this menu item.
If item 5 (TFTP Download new firmware) is not displayed, the number used to
access items 6, 7, and 8 will be different.
21
Page 42

Local Terminal Configuration
Using the Main Menu
Modify/View Configuration Values
To configure items in the Modify/View Configuration Values menu:
1. On the Main Menu, Press 1,
the Modify/View Configuration Values menu.
Modify/View Configuration Values Menu - Firmware Rev
Memory configuration x Mbytes
[1]Autodiscovery Echo Interval (sec.) 1800
[2]Date Wed 05/05/98
[3]Time 09:12:00
[4]Time zone PST8PDT
S.Save changes and exit
0.Cancel changes and exit
Modify/View configuration values
. You see
Figure 2-3: Modify/View Configuration Values Menu
2. Press a number to select a field and then type the corresponding values
necessary to configure the probe to operate on your network.
Autodiscovery Press 1 and then type the autodiscovery echo interval, in
Echo Interval seconds (optional). This parameter sets the time interval the
probe uses to transmit the autodiscovery frame used by HP
OpenView to maintain the network map.
The default value is 30 minutes (1800 seconds). A value of
zero results in no autodiscovery frame transmission.
22
Page 43

Local Terminal Configuration
Using the Main Menu
Date Press 2 and then type the day of the week and then the date in
month/day/year format (mm/d d/y y, through 1999 or
mm/dd/yyyy, starting 2000).
Time Press 3 and then type the time of day in hours, minutes,
seconds (hh:mm:ss) for m at.
Time Zone Press 4 and then type your time zone in one to 15 characters
(optional).
The Time Zone characters are stored for your convenience
and are used to time-stamp probe information.
NOTE
The recommended practice is to use the format of Time Zone, hours from
Greenwich mean time, and then Daylight Saving Time, such as PST8PDT for
Pacific Standard Time (the default). The probe does not automatically update the
Time field when your local time changes between standard time to daylight
savings time.
The values you enter for date and time take effect as soon as you enter them. All
other parameters do not take effect until you select the Save Changes and Exit.
3. Press S to save the configuration changes and return to the Main Menu.
4. Press 0 to cancel your current changes and return to the Main Menu.
23
Page 44

Local Terminal Configuration
Using the Main Menu
Modify/View Security Values
To configure security values for probe access, you use the Modify/View Security
Values menu.
1. On the Main Menu, press 2,
Modify/View Security Values menu (Figure 2-4) .
Modify/View Security Values Menu - Firmware Rev
[1]Allow packet capture Yes [2]Allow TFTP firmware downloads Yes [3]Allow Packet Generation Yes [4]Allow duplicate and changed IP checking Yes S.Save changes and exit
0.Cancel changes and exit
Modify/View securi ty values
. You see the
Figure 2-4: Modify/View Security Values Menu
2. Press a number to select a field and then type the corresponding values
necessary to configure the probe to operate on your network. See “Access
Security” on page 8 for more information on security.
Allow Packet Press 1 and then type Yes to allow or No to not allow
Capture packet capture.
Allow TFTP Press 2 and then type Yes to allow or No to not allow
Firmware Downloads TFTP firmware downloading.
24
Page 45

Local Terminal Configuration
Using the Main Menu
Allow Packet Press 3 and then type Yes to allow or No to not allow
Generation packet generation.
Allow duplicate and Press 4 and then type Yes to allow or No to not allow
changed IP checking checking of duplicate and changed IP addresses.
3. Press S to save your changes and return to the Main Menu.
4. Press 0 to cancel your current changes and return to the Main Menu.
Modify/View Interface Values
Use the Modif y/View interface Values menu to configure the probe port interface
settings. This procedure involves two steps—selecting the port and then setting
the configuration. For example, the options for the port configuration are:
[1] 1.1/Ethernet
z
[2] 1.2/Serial
z
[3] 3.1/Frame_Relay
z
[4] 3.1/HSSI
z
NOTE
NOTE
Refer to “Display Interface Summary” on page 36 for information on port types
and port numbers for the installed interfaces.
Port 1 is always t he Ethernet telemetry interface (the 10Base-T/100Base-TX with
RJ-45 and AUI connectors).
Fast Ethernet Telemetry Interface Configuration
Use the following procedure to configure the Fast Ethernet Telemetry Interface:
1. On the Main Menu, Press 3,
Modify/View Interface Values menu (Figure 2-5 ).
Modify/View interf ace values
. You see the
25
Page 46

Local Terminal Configuration
Using the Main Menu
Modify/View Interface Values Menu - Firmware Rev
MAC Address 00 00 C6 XX XX XX
Interface Type Ethernet
[1]Port 1.1 Ethernet
[2]Port Type Telemetry
[3]IP address 0.0.0.0
[4]Default gateway IP address 0.0.0.0
[5]Subnet mask 255.0.0.0
[6]Physical Connector RJ-45
[7]Link Speed Auto Negotiate
S.Save changes and exit
0.Cancel changes and exit
Figure 2-5: Modify/View Interface Values Menu (Fast Ethernet)
2. Press a number to select a field and then type the corresponding values
necessary to configure the probe to operate on your network.
26
Page 47

Local Terminal Configuration
Using the Main Menu
NOTE
Port Press
and then press 1 again to display th e current Ethernet
1
port configuration parameters and current settings.
If the optional Token-Ring telemetry interface is not installed, the probe will not
allow you to change the Fast Ethernet interface’s port type from telemetry.
If the Token-Ring telemetry interface is installed, you can configure either the
Fast Ethernet int erfac e or the Token-Ring interfac e as the telem etr y inter face . The
Fast Ethernet interface comes from the factory configured as Telemetry and the
Token-Ring interface comes configured as Monitor/Transmit and is disabled.
“Disabled” in this case means that the interface does not function at all, not as a
Telemetry port nor as a Monitor/Transmit port. If you configure the Token-Ring
interface as Telemetry, the Fast Ethernet interface automatically becomes
configured as Monitor/Transmit and is disabled.
Port Type The Fast Ethernet interface is alwa ys a Telemetry port. The
telemetry port does not maintain network statistics for the
Fast Ethernet interface. The telemetry interface only allows
the retrieval of WAN network statistics. Port 1 is the Fast
Ethernet interface and it is the telemetry port by default. If the
Token-Ring interface is also installed, you can select either
the Fast Ethernet or the Token-Ring interface (but not both)
as the telemetr y port. Refer to “Token-Ring Telemetry
Interface Configuration” on page 29 for information on
configuring the Token-Ring interface. The probe must be
configured with exactly one telemetry port.
27
Page 48

Local Terminal Configuration
Using the Main Menu
The Telemetry port only receives packets destined to the
telemetry port’s IP address, can transmit packets onto the
network, and is used for SNMP co mmunications to t he probe.
It requires the IP A ddress, Subnet Mask, and Default
Gateway IP Address fields. The foll owing apply to Telemetry
ports:
HP OpenView can discover the inte rface
z
The interface is IP addressable
z
The interface responds to RMON-1
z
The interfa ce will transmit all traps from the prob e
z
The interface will transmit all extended RMON packets
z
sample from Monitor -on ly por ts, M onitor /Transmit ports.
IP Address Press 3 and then type the IP address for the probe. If the IP
address is 0.0.0.0, the probe will tr ansmit Bootp Reque sts
for configuration information (including IP address) over the
network. (This does not apply t o port s conf igu red as Monitor Only .)
CAUTION
Default Gateway Press 4 and then type the default gateway IP address for the
probe
IP Address Optional
Subnet Mask Press 5 and then type the subnet mask for the probe.
Physical Press 6 and choose a physical connector. The menu displays
Connector the physical connectors that are available. You can use the
RJ-45 or AUI connector. If you select AUI, item s 7 and 8
(Link Speed and Full/Half Duplex) are not available. AUI is
10MB/s half-duplex.
If you manually select the Link Speed, be careful to configure it correctly. If you
configure the Link Speed for 100 MB/s and you connect the probe to a
10MB/s network, the probe will generate 100% utilization for that segment.
28
Page 49

Local Terminal Configuration
Using the Main Menu
Link Speed Press 7 and select the Link Speed as Auto Negotiate,
10MB/s, or 100MB/s.
Parameters do not take effect until you select the Save Changes and Exit menu
item.
3. Press S to save your configuration changes and return to the Main Menu.
4. Press 0 to cancel you r changes and return to the Main Menu.
Token-Ring Telemetry Interface Configuration
If the optional Token-Ring telemetry interface is not installed, skip this section
and continue with “HSSI WAN Interface Configuration” on page 33. Otherwise,
use the foll owing proce dure to configure items in the Modify/View Interface
Values menu for the Token-Ring Telemetry Interface:
1. On the Main Menu, Press 3, Modify/View Interface Values. You see the
Modify/View Interface Values menu (Figure 2-6 ).
29
Page 50

Local Terminal Configuration
Using the Main Menu
Modify/View Interface Values Menu - Firmware Rev
MAC Address 00 00 C6 XX XX XX
Interface Type Token Ring
[1]Port 3
[2]Port Type Telemetry
[3]IP address 0.0.0.0
[4]Default gateway IP address 0.0.0.0
[5]Subnet mask 0.0.0.0
[6]Token Ring Speed (Mbps) 16
[7]Ring Number -1
S.Save changes and exit
0.Cancel changes and exit
Figure 2-6: Modify/View Interface Values Menu (Token Ring)
2. Press a number to select a field and then type the corresponding values
necessary to configure the probe to operate on your network.
Port Press
display the Token-Ring port configuration parameters along
with the current set tings. The port nu mber for th e T oken -Ring
interface (if installed) d epends on where it is installed. Refer
to “Display I nterface Summary” on page 36 for informatio n
on port types and port numbers for the installed interfaces.
You can then view or configure the Token-Ring port
configuration parameters.
30
and then press the number of the Token-Ring port to
1
Page 51

Local Terminal Configuration
Using the Main Menu
NOTE
If the Token-Ring telemetry interface is installed, you can configure either the
Fast Ethernet int erfac e or the Token-Ring interfac e as the telem etr y inter face . The
Fast Ethernet interface comes from the factory configured as Telemetry and the
Token-Ring interface comes configured as Monitor/Transmit and is disabled.
“Disabled” in this case means that the interface does not function at all, not as a
Telemetry port nor as a Monitor/Transmit port. If you configure the Token-Ring
interface as Telemetry, the Fast Ethernet interface automatically becomes
configured as Monitor/Transmit and is disabled.
Port Type Press
and select the port type as Telemetry. Making this
2
configuration change will dis abl e the Ethernet telemetry port
(port 1). You can select either the Token-Ring or the Fast
Ethernet interface (but not both) as the telemetry port. The
telemetry port does not maintain network statistics for the
T oken-Ring inter face. The telemetry inter face only allows the
retrieval of WAN ATM network statistics. Refer to “Fast
Ethernet Telemetry Interface Configuration” on page 25 for
information on configuring the Fast Ethernet interface. The
probe must be configured with exactly one telemetry port.
IP Address Press 3 and then type the IP address for the probe. If the IP
address is 0.0.0.0, the probe will tr ansmit Bootp Reque sts
for configuration information (including IP address) over the
network. This does not apply to ports configured as MonitorOnly.
Default Gateway Press 4 and then type the default gateway IP address for the
probe
IP Address (optional).
Subnet Mask Press 5 and then type the subnet mask for the probe.
Token-Ring Press 6 to modify or view the network speed setting.
Speed The default configuration is set to 16 Mbps network speed.
You can enter values of 4 or 16 for 4 Mbps or 16 Mbps
respectively or enter Auto to automatically sense the ring
speed.
31
Page 52

Local Terminal Configuration
Using the Main Menu
NOTE
Selecting Auto to automatically sense the ring speed does not function in all
network installa ti ons . If the probe fails to insert into the r ing with the Token -Ri ng
Speed set to Auto, select a fixed speed of 4 or 16 to match your network.
Ring Number Press 7 and then typ e the local ring number (in decimal) for
your network. Set to -1 for use with ring p arameter servers
for automatic setting of the ring number, and set to <x> to
explicitly set the ring number, where x is the ring number in
decimal.
Parameters do not take effect until you select the Save Changes and Exit
menu item.
3. Press S to save the configuration changes and return to the Main Menu.
4. Press 0 to cancel your current changes and return to the Main Me nu.
32
Page 53

Local Terminal Configuration
Using the Main Menu
HSSI WAN Interface Configuration
Use the following procedure to configure the HSSI WAN Interface:
1. On the Main Menu, Press 3,
Modify/View Interface Values menu (Figure 2-7 ).
Modify/View Interface Values Menu - Firmware Rev
Interface Type HSSI
[1]Port 3.1 HSSI
[2]Port Type Monitor-only
[3]Data Sense Normal
[4]Link Type Frame Relay
[5]Clock Speed 52 Mb
S.Save changes and exit
0.Cancel changes and exit
Modify/View Interf ace Values
. You see the
Figure 2-7: Modify/View Interface Values Menu (HSSI WAN)
2. Press a number to select a field and then type the corresponding values
necessary to configure the probe to operate on your network.
33
Page 54

Local Terminal Configuration
Using the Main Menu
Port Press
and then type the HSSI WAN interface port number
1
to display the HSSI WAN port configuration parameters
along with their current settings. Refer to “Display Interface
Summary” on page 36 for information on port types and port
numbers for the installed interfaces. You can then view or
configure the HSSI WAN port’s configuration parameters.
The following are your HSSI port choices:
[3] 3.1/Frame_Relay
z
[4] 3.1/HSSI
z
Port Type The port type is set to Monitor-only.
Data Sense Press
and then select the format of the bit stream (the Data
3
Sense type) as Normal, Inverted, or NRZI (Non-Return to
Zero Invert, on zeros).
Normal means that the data bits are not inverted or, in other
words, that a M ar k r epresents a binary 1. Inverted means that
the data bits are inverted or, in other words, that a Mark
represents a binary 0. NRZI means that bit timing is
determined from the clocking signals present on the HSSI
interface and succ essive Mark s or Spaces repr esent a binar y 1
and changes from Mark to Space or from Space to Mark
represent a binary 0.
Link Type Press
Relay, HDLC, SDLC, or PPP.
34
and then select the link layer analysis type as Frame
4
Page 55

Local Terminal Configuration
Using the Main Menu
Clock Speed Press
and then select one of the following Clock Speeds:
5
[1]1Mb [2]1.5Mb [3]2Mb [4]2.5Mb [5]3Mb [6]3.5Mb [7]4Mb [8]4.5Mb [9]5Mb [10]5.5Mb [11]6Mb [12]6.5Mb [13]7Mb [14]7.5Mb [15]8Mb [16]8.5Mb [17]9Mb [18]9.5Mb [19]10Mb [20]10.5Mb [21]11Mb [22]11.5Mb [23]12Mb [24]12.5Mb [25]13Mb [26]13.5Mb [27]14Mb [28]14.5Mb [29]15Mb [30]15.5Mb [31]16Mb [32]16.5Mb [33]17Mb [34]17.5Mb [35]18Mb [36]18.5Mb [37]19Mb [38]19.5Mb [39]20Mb [40]20.5Mb [41]21Mb [42]21.5Mb [43]22Mb [44]22.5Mb [45]23Mb [46]23.5Mb [47]24Mb [48]24.5Mb [49]25Mb [50]25.5Mb [51]26Mb [52]26.5Mb [53]27Mb [54]27.5Mb [55]28Mb [56]28.5Mb [57]29Mb [58]29.5Mb [59]30Mb [60]30.5Mb [61]31Mb [62]31.5Mb [63]32Mb [64]32.5Mb [65]33Mb [66]33.5Mb [67]34Mb [68]34.1Mb [69]34.5Mb [70]35Mb [71]35.5Mb [72]36Mb [73]36.5Mb [74]37Mb [75]37.5Mb [76]38Mb [77]38.5Mb [78]39Mb [79]39.5Mb [80]40Mb [81]40.5Mb [82]41Mb [83]41.5Mb [84]42Mb [85]42.5Mb [86]43Mb [87]43.5Mb [88]44Mb [89]44.21Mb [90]44.5Mb [91]45Mb [92]45.5Mb [93]46Mb [94]46.5Mb [95]47Mb [96]47.5Mb [97]48Mb [98]48.5Mb [99]49Mb [100]49.5Mb [101]50Mb [102]50.5Mb [103]51Mb [104]51.5Mb [105]52Mb
35
Page 56

Local Terminal Configuration
Using the Main Menu
Display Interface Summary
Use the following procedure to display the Interface Summary screen
(Figure 2-8). This screen lists the Interface, Port Type, and IP Address.
1. On the Main Menu, press 4,
Display Inte rface Summary listing Interface, the Por t Type, and Port IP
Address.
Display Interface Summary
Interface Port Type IP Address
---------------- ---------------- ----------------
1.1/Ethernet Telemetry 15.6.72.216
1.2/Serial NA 0.0.0.0
3.1/Frame_Relay Monitor-only NA
3.1/HSSI Monitor-only NA
Display Interface Sum mary
. You see the
Figure 2-8: Display Interface Summary
2. Press Enter to return to the Main Menu.
Modify/View Serial Port Settings
You use the Modify/View Interface Values Men u to vie w or mod if y the se rial port
settings. Use the following procedure to configure the probe serial port:
1. On the Main Menu,
Modify/View Interface Val ues Menu.
36
Press 3, Modify/View Interface Values
. You see the
Page 57

Local Terminal Configuration
Using the Main Menu
Modify/View Interface Values Menu - Firmware Rev
Interface Type Serial
[1]Port 1.2 Serial
[2]Port Type NA
[3]Serial port IP address 0.0.0.0
[4]Serial port subnet mask 255.255.252.192
[5]Serial port speed 9600
[6]Serial port mode Direct
[7]Serial port hardware flow control On
[8]Modem Init String ^s^M^d1^sATE0Q0V1X4
S0=1...
[9]Modem Hangup String ^d2^s+++^d2^sATH0^M^d2
[10]Modem Connect Responses /CONNECT/300/CONNECT/1200/
...
[11]Modem No-Connect Responses /NO CARRIER/BUSY/NO
DIALT...
S.Save changes and exit
0.Cancel changes and exit
Figure 2-9: Modify/View Serial Port Settings Menu
2. Select Interface Type and then type Serial.
3. Press 1, Port and then type the Serial Port Number. You see the
current serial port settings (Figure 2-9).
37
Page 58

Local Terminal Configuration
Using the Main Menu
4. Press a number to select a field and then type the corresponding values
necessary to configure the probe to operate on your network.
Serial port IP address Press 3 and then type the serial port IP address for the
probe. The default Serial Port IP Address is 0.0.0.0.
Serial port Press 4 and then type the serial port subnet mask for
subnet mask the probe (optional). It is recommended that you do not
change the serial port subnet mask unless there is a
conflict. The default Serial Port Subnet Mask is
255.255.255.192.
Serial port speed Press 5 and then type a serial port speed (300 to 38,400
baud) for the probe’s SNMP connection. The default is
9600 baud. This speed is used only for Out-of-Band
access to the probe using SNMP. It does not affect the
serial connection for the local termina l, which is fixed at
9600 baud.
Make sure that the serial port speed is set to less than or
equal to the maximum speed of the modem to be used.
Serial port mode Press 6 and then select the ser ial port mode by pres sing 1
for direct connection (the default) or 2 for modem
connection.
Serial port hardware Press 7 and then select hardware flow control Off by
flow control pressing 1 or hardware flow control On (the default) by
pressing 2.
Modem Init St ring Press 8 and then type the modem initialization string.
Only the first 20 characters of the 256 character
maximum will be displayed in the M odify/View Serial
Port Settings menu. The default is
^s^M^d1^sATEOQOV1X4 S0=1 S2=43^M.
38
Page 59

Local Terminal Configuration
Using the Main Menu
Modem Hangup String Press 9 and then type Only the first 20 characters of the
256 character maximum will be displayed in the Modify/
View Serial Port Settings menu. The default is
^d2^s+++^d2^sATHO^M^d2.
Modem Connect Press 10 to enter the modem connect responses. Only
Responses the first 20 characters of the 256 character maximum will
be displayed in the Modify/View Serial Port Settings
menu. The default is /CONNECT/300/CONNECT
1200/1200/CONNECT 2400/2400/CONNECT
4800/4800/CONNECT 9600/9600/CONNECT
14400/14400/CONNECT 19200/19200/
CONNECT 38400/38400/.
Modem No-Connect Press 11 to enter the modem no-connect responses.
Responses Only the first 20 characters of the 256 character
maximum will be displayed in the M odify/View Serial
Port Settings menu. The default is /NO CARRIER/
BUSY/NO DIALTONE/NO ANSWER/ERROR/.
5. Press S to save the configuration changes and return to the Main Menu.
6. Press 0 to cancel your current changes and return to the Main Me nu.
39
Page 60

Exiting the Main Menu and Restarting the Probe
1. On the Main menu, Press 7 to execute a warm start or press 8 to execute a cold start.
A cold start is required if yo u change the IP Address, De fault Gateway, or
Subnet Mask. For either menu choice, the probe exits the Main Menu and
restarts normal operations.
2. If you are performing the initial probe configuration, prepare the probe for
installation by disconnecting the power cord. You will not lose your initial
configuration information.
NOTE
A warm start resets all data collected by the probe. A cold start resets all data
collected by the pr obe and also resets any user-confi gur at ion information, such as
history studies, filters, and alarms to their default values. Refer to “Probe
Operation” on page 89 for more information on what is reset by warm and cold
starts.
After the probe restarts (boots), it operates normally using the new configuration
information. The warm start or cold start occurs immediately and there is no
visual indication of when it finishes.
40
Page 61

3
Installation
Page 62

Installation
Installation
This chapter describes how to install the Agilent J3916A HSSI WanProbe.
Installing an Agilent probe consists of the following tasks:
z
“Selecting a Location” on page 43
z
“Installing the Probe” on page 44
z
“Connecting the Probe” on page 49
z
“Starting the Probe” on page 67
z
“Verifying the Installation” on page 68
If you plan to configure the probe from a local ter mina l and have not yet done so,
go to “Probe Configuration Usi ng a Loca l Terminal” on page 17, and perform the
configuration now.
42
Page 63

Selecting a Location
Installation
Selecting a Location
Select a location for your probe where it will be the most useful. The probe must
be connected to a LAN to retrieve data. The data that can be retrieved was
previously monitored from traffic present on the WAN where it is attached.
Consider the following installation requirements when selecting a location for
your probe:
z
A flat surface that i s lar ge enough to suppo rt the probe (requires clear ance at
rear and sides for cooling and rear panel access), adequate wall space, or
double high space in a 19 inch rack or cabinet.
z
A grounded power outlet (either 100-120/VAC or 220-240/VAC).
z
Access to a Fast Ethe rnet connect ion t ap or to a Token-Ring network MsAU
connection (if the Token-Ring Telemetry option is installed).
NOTE
z
Access to the WAN connection to monitor.
z
Access to an RS-232C connection (required only for Out-of-Band
communication).
z
Access to a phone line and a modem within 50 feet (required only for Outof-Band communication using a modem connection).
The MAC addresses for the probe can be found on the r ear pane l. It is a good id ea
to make a note of the interface and its address
prior
to installing your probe
because some installation m ethods make it difficult to see the rear panel without
removing the probe.
43
Page 64

Installation
Installing the Probe
Installing the Probe
This section describes how to install your probe. First decide which installation
method you are going to use and then install the probe using one of the following
methods:
z
“Table Installation” on page 45
z
“Rack or Cabinet Installation” on page 45
z
“Wall Installation” on page 47
CAUTION
not
Do
attach the power cord to the probe until the probe is completely installed.
If the power cord is already attached to the probe, remove it now (you will not
lose any configuration parameters). The probe does not have a pow er switch but
becomes operational when the power is attached.
44
Page 65

Installing the Probe
Installation
Table Installation
Use the following procedure to install the probe on a table:
1. Attach the self-adhesi ve ru bber fee t t o the bot t om of the probe as marked in each corner.
2. Place the probe on a flat surface (refer to the requirements as listed in
“Selecting a Location” on page 43).
Rack or Cabinet Installation
You can install the probe in a rack or cabinet with either the front or rear panel
facing out. You may want the rear panel facing out so that you can see the status
LEDs for each port. (The front panel Fault and Activity LEDs indicate when the
10Base-T/100Base-TX telemetry interface LEDs are lit.)
Make sure you have screws that fit your rack (or cabinet) before installing the
probe as noted in Step 3 below.
Use the following procedure to install the probe in a rack or cabinet:
1. Attach the installation brackets to the probe with the 10-mm #M4 screws
(included), using a POZIDRIV #2 or cross-head screwdriver. See Figure
3-1.
2. Position the probe in the rack (or cabinet) and slide it up or down until the
rack holes line up with the holes in the brackets.
3. Attach the probe to the rack with the 5/8-in. #12-24 scre ws (included). Some
cabinets require 5/8-in. #10-32 screws (available as Agilent part number
2680-0302) instead of the 5/8-in. #12-24 screws.
Figure 3-1 shows a rack or cabinet installation.
45
Page 66

Installation
Installing the Probe
Figure 3-1: Install the Probe in a Rack or Cabinet
46
Page 67

Installing the Probe
Installation
Wall Installation
Use the following procedure to install the probe on a wall:
1. Attach the installation brackets to the probe with the 10-mm #M4 screws
(included), using a POZIDRIV #2 or cross-head screwdriver. See Figure
3-2.
2. Attach the probe to a wood surface (minimum 1/2-in. plywood or
equivalent) on a wall with 5/8-in. #12 wood screws or equivalent (not
included).
Figure 3-2 shows a wall installation.
47
Page 68

Installation
Installing the Probe
Figure 3-2: Install the Probe on a Wall
48
Page 69

Connecting the Probe
Installation
Connecting the Probe
The probe communicates with Agilent NetMetrix through Out-of-Band
connections using the 10Base-T/100Base-TX or Token-Ring (optional) telemetry
interfaces or by using a serial connection.
You can establish both telemetry and serial Out-of-Band connections to give you
the option of communicati ng with the probe either ove r the telemetry network or
over the serial link, respectively. The telemetry connection has the advantage of
being faster than the serial connection. The disadvantage of using only the
telemetry connection is that certain network or component failures can result in a
loss of communications w ith the probe.
The Out-of-Band serial connection can be used as the primary means of
communication or as a backup l ink in ca se of a f ailur e on your t elemet ry network.
The disadvantage of usi ng only the ser ial connec tion is tha t it is a slowe r means of
communications.
Refer to one of the following sections in this chapter for specific information on
connecting the probe:
z
“Connecting to the Network (Out-of-Band)”
z
“Connecting to a HSSI System (In-Band)” on page 56
z
“Connecting to the Serial Port (Out-of-Band)” on page 59
Connecting to the Network (Out-of-Band)
You can connect the probe to an Out-of-Band telemetry network as described in
one of the following topics.
z
“Connecting to 10MB/s Ethernet Telemetry N etworks” below
z
“Connecting to 10Base-T/100Base-TX Telemetry Networks” on page 51
z
“Connecting to Token-Ring Telemetry Networks” on page 53
Figure 3-3 shows the probe rear panel with the Token-Ring option installed.
49
Page 70

Installation
Connecting the Probe
CAUTION
HSSI WAN Interface Status LEDs
Data
Clock
Fault
HSSI Interface
Power
Config.
Do not touch the probe connector pins or the cable connector pins. Static
discharge may damage equipment.
Token-Ring Telemetry Status LED
Port 1
To DTE From DCE
RS-232
10Base-T/100Base-TX Status LEDs
AUI
Port 2
Fault
Activity
Collision
Data
Clock
100Base-T
Token-Ring T elemetry INTERFA CE
DB-9
Activity
RJ-45
Figure 3-3: Probe Rear Panel (Token-Ring Option shown)
Connecting to 10MB/s Ethernet Telemetry Networks
You can connect the probe to the network either by connecting the RJ-45
connector to a 10Base-T/100Base-TX half-duplex network or by connecting the
AUI connector to a 10MB/s Ethernet network. Use the following procedures to
connect the probe’s AUI connector to a 10MB/s Ethernet network for telemetry
communications. Never use both the AUI and RJ-45 connectors.
1. Connect the probe’s AUI port, located on the rear panel , to the net work wit h
an AUI cable. Figure 3-4 shows how to connect the probe to a 10MB/s
Ethernet network using the AUI connector.
2. Select
AUI
as the Physical Connector parameter from the Modify/View
Interface Values menu. Refer to Step 1 on page 25 for information on
configuring the Physical Connector parameter.
50
Page 71

Connecting the Probe
Installation
Figure 3-4: Connecting the Probe to a 10MB/s Ethernet Network
NOTE
The following types of netwo rk-speci fic MAUs ar e availabl e for c onnecting to the
AUI port:
Fiber-Optic MAU (Agilent 28683A) - for fiber-optic cabling
z
10Base-2 MAU (Agilent 28641B) - for ThinLAN cabling
z
If the SQE test is available on the MAU, disable it.
Connecting to 10Base-T/100Base-TX Telemetry Networks
You can connect the probe to the network either by connecting the RJ-45
connector to a 10Base-T/100Base-TX half-duplex or full-duplex network or by
connecting the AUI connector to a 10MB/s Ethernet network.
Use the following proce dures to c onnect the probe ’s RJ-45 connector t o a 1 0MB/s
or 100MB/s Ethernet network for telemetry communications. Never use both the
AUI and RJ-45 connectors.
51
Page 72

Installation
Connecting the Probe
1. Connect the probe’ s 10Bas e-T/100Base-TX (RJ -45) port, locat ed on the rear
panel, to the network using a category 5 cable. Figure 3-5 shows how to
connect the probe to a 10Base-T or 100Base-TX network.
2. Select RJ-45 as the Physical Connector parameter from the Modify/View
Interface Values menu. Refer to Step 1 on page 25 for information on
configuring the Physical Connector parameter.
3. If you are connecting to a device tha t support s the auto -negotia tion prot ocol,
select Auto Negotiate for the Link Speed pa rameter from the Modify/View
Interface Values menu. Otherwise, select 10MB/s (for 10MB/s Eth ernet) or
100MB/s (for 100MB/s Ethernet). Refer to Step 1 on page 25 for
information on configuring the Link Speed parameter.
The probe will automatically negotiate the speed of the interface if the Link
Speed parame ter is set to Auto Negotiate and if the connected device
supports the auto-negotiation protocol.
4. If you selected 10MB/s or 100MB/s for the Link Speed parameter, you must
also select Half-Duplex for the Full/Half Duplex pa rameter from the
Modify/View Interface Values menu. Refer to Step 1 on page 25 f or
information on configuring the Full/Half Duplex parameter.
52
Page 73

Connecting the Probe
Installation
Figure 3-5: Connecting the Probe to a 10Base-T/100Base-T Network
CAUTION
Connecting to Token-Ring Telemetry Networks
The Token-Ring option must be installed to connect the probe to a Token-Ring
telemetry network.
Connecting the Token-Ring interface to your network when the interface is
configured to the wrong network speed (4Mb/16Mb) can cause
traffic on your network
the ring.
You can configure the Token-Ring Speed from the Modify/View Configuration
Values Menu. The probe is configured with a default setting for 16Mbps
networks. Refer to “Token-Ring Telemetry Interface Configuration” on page 29
for information on changing this param eter.
You connect the Token-Ring interface to your network by using the appropriate
cables. The probe has both RJ-45 and DB-9 connectors on the rear panel for
connecting to Token-Ring networks. Figure 3-6 shows the back panel with the
Token-Ring option installed.
and it will preven t the prob e from prope rly in serting i nto
disruption of all
53
Page 74

Installation
Connecting the Probe
Do not attach cables to both the Token-Ring DB -9 and RJ-45 connectors
simultaneously. This causes the probe to malfunction, and can disrupt your
network. You must use only one network connector at a time for correct probe
operation.
CAUTION
The Token-Ring interface is not compatible with Token-Ring expansion module s
(Local Ringhub from Madge and other vendors, for example) which require
power from the Token-Ring interface. The Token-Ring interface must be
connected directly to the MsAU.
T oken-Ri ng networks typical ly use Type 3 (Unshielded Twisted Pair (UTP)) cable
or Type 1 (Shielded Twisted Pair (STP)) cable. Networks using UTP cable
typically use the RJ-45 type connectors and networks using STP cable typically
use Token-Ring Data Connectors or DB-9 type connectors.
If your network uses RJ-45 connectors, you will need the standard cable with
RJ-45 connectors on both ends to connect the probe to the ring. Connect one end
of this cable t o any op en port of a Medi a Stat ion Access Unit ( MsAU) and connect
the other end to the RJ-45 connector on the probe. Figure 3-6 shows the TokenRing interface connected to a Type 3 MsAU.
Figure 3-6: Connecting the Probe Using RJ-45 Connectors
54
Page 75

Connecting the Probe
Installation
NOTE
Do not connect the probe to either the ring-in (RI) or ring-out (RO) connection
port.
The T oken-Ri ng interfa ce can also be connect ed to a Type 3 MsAU using a Media
Filter. The Media Filter is used to connect from STP (DB-9) to UTP (RJ-45).
Figure 3-7 shows the Token-Ring interface connected to a MsAU using a Media
Filter.
Figure 3-7: Connecting the Probe using a Media Filter
If your network uses the Token-Ring Data Connectors, you need a Type 1 cable
with a Token-Ring Data Connector on one end and a DB-9 connector on t he other
end to connect the pro be to the ring. Conn ect the Token-Ring Data Conne ctor plug
to any open port (excludin g the RI or RO por ts) of a MsAU and con nect th e DB-9
connector to the probe’s DB-9 connector. Figure 3-8 on page 56 shows the TokenRing interface connected to a Type 1 MsAU using Token-Ring Data and DB-9
connectors.
55
Page 76
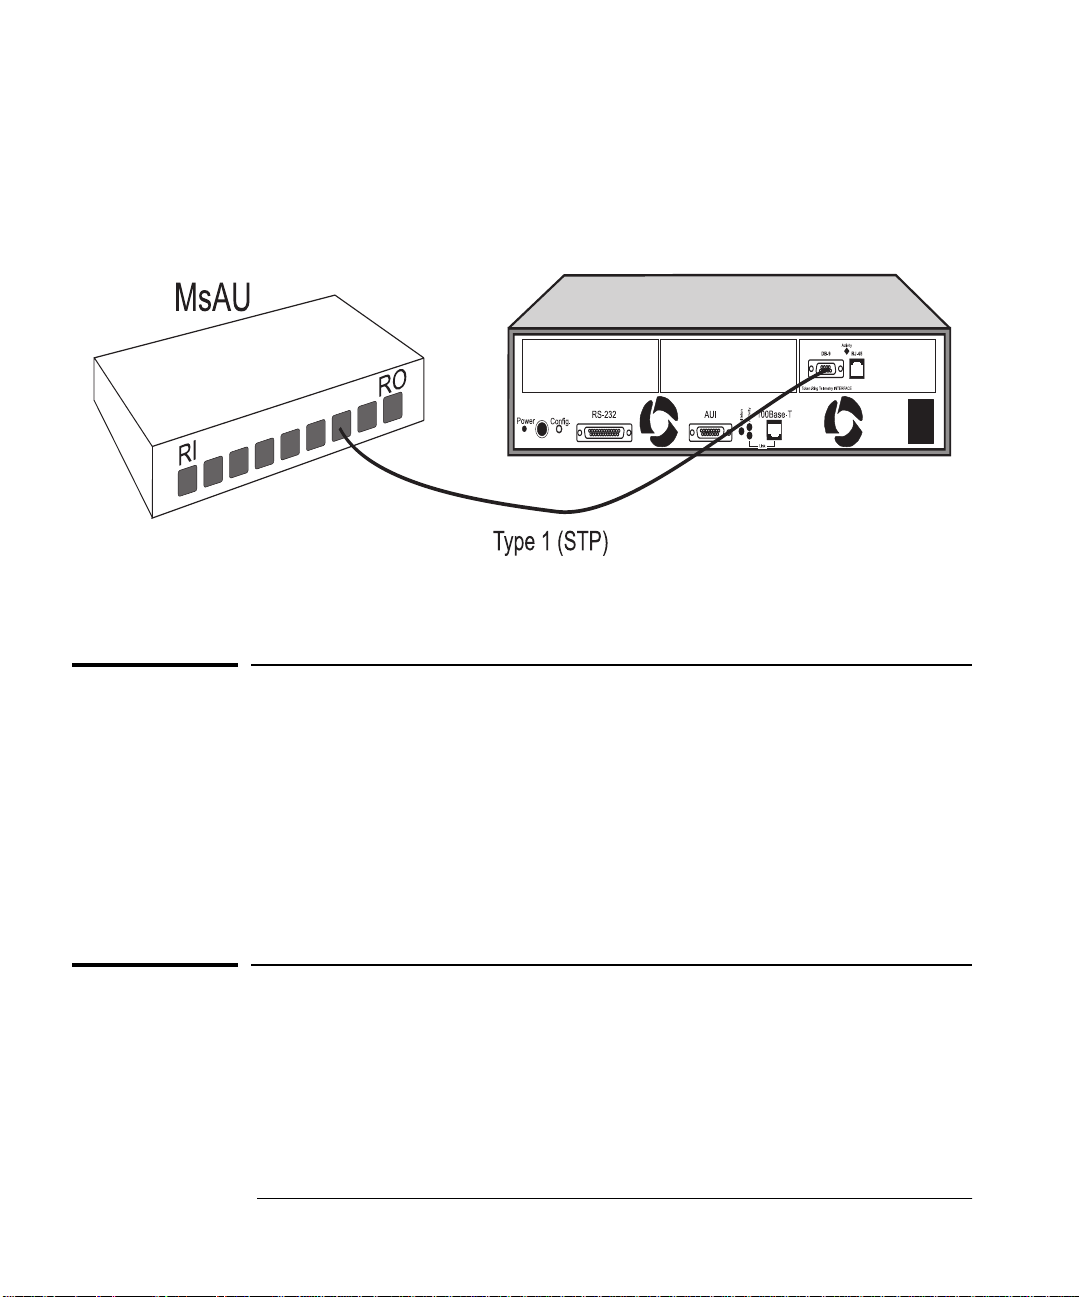
Installation
Connecting the Probe
Figure 3-8: Connecting the Probe Using Data & DB-9 Connectors
About the Information in the Following Sections
It is assumed that you understand the basic terminology and concepts of WAN
network test interfaces.
Comprehensive coverage of net work test con nections and phys ical layer testing is
beyond the scope of th is Installation/User’s Guide. Consequently, the i nfor mat ion
provided here covers only the basics, and only very common or generic
connection schemes are shown.
Connecting to a HSSI System (In-Band)
HSSI Monitor Connections
This section describes the basic connection method used to monitor the network
using the HSSI interface. Figure 3-9 on page 57 shows the HSSI system prior to
connecting the WanProbe.
56
Page 77

Connecting the Probe
Installation
Ethernet
WAN
Network
LAN
Router
HSSI
LANOut
T3/E3
T3/E3
DSU/CSU
HSSI
In
Figure 3-9: HSSI System
Figure 3-10 presents the details of the Agilent HSSI interface.
Data
Clock
Fault
Port 1
To DTE From DEC
HSSI Interface
Port 2
Fault
Data
Clock
Figure 3-10: Close-up of the HSSI Interface
57
Page 78

Installation
Connecting the Probe
In-Line HSSI Connection
Connecting the probe in-line requires that the connection between the Data
Terminating Eq uipment (DTE) and the Data Circuit-terminating Equipm ent
(DCE) be momentarily broken. Installation requires the addition of a new HSSI
cable to the network configuration.
Data
Clock
Ethernet
Fault
HSSI Interface
Port 1
To DTE
LAN
Router
HSSILAN
Port 2
From DCE
T3/E3
DSU/CSU
HSSI Out
In
Fault
Data
Clock
T3/E3
WAN
Network
Figure 3-11: HSSI Monitor In-Line Connection
Use the following procedure to connect the HSSI WanProbe to monitor a HSSI
system with a momentary interruption to service:
1. Disconnect, at the DS U/CSU, the HSSI ca ble be tween t he T3/ ES DSU/CSU and the LAN router.
58
Page 79

Connecting the Probe
Installation
2. Connect the HSSI cable to the left-most HSSI connector on the HSSI
WanProbe.
3. Connect the new HSSI cable between the DSU/CSU and the right-most
connector on the HSSI WanProbe.
NOTE
The HSSI cable should be a straight-through cable. Part numbers: Cisco Systems
CAB-HSI1 or ADC/Kentrox 96010011—10ft. HSSI cables.
In this connection scheme, the probe monitors network traffic as if the signal
between the DTE and DCE is sent straight-through the prob e.
Connecting to the Serial Port (Out-of-Band)
Out-of-Band communications with the probe are conducted through the serial
port, not over the network. This mode of communications is optional.
The following methods are available for Out-of-Band connections:
“Direct Connection”
z
“Modem Connection” on page 60
z
“Data Switch Connection” on page 65
z
Direct Connection
To make a direct connection to the probe, connect the NetMetrix management
station’s serial port to the probe’s RS-232C port using a null modem cable
(Agilent part number 24542G—9-to-25 pin, or equivalent). Figure 3-12 shows
the direct connection to the probe.
59
Page 80

Installation
Connecting the Probe
Figure 3-12: Probe Direct Connection
Modem Connection
You can use a modem connection to increase the distance between the probe and
the NetMetrix management statio n. Perform the followi ng tasks to make a modem
connection between a NetMetrix management station and the probe. Figure 3-13
shows the modem connection to the probe.
“Install the Management Station Modem”
z
“Install the Probe’s Modem” on page 62
z
“Configure the Managem ent Station and the Probe” on page 62
z
60
Page 81

Connecting the Probe
Installation
Figure 3-13: Probe Modem Connection
Install the Management Station Modem
You need the following list of equipment to install the management station’s
modem:
CAUTION
Hayes-compatible 300 to 38.4 K baud modem
z
RS-232C (straight through) modem cable
z
Modular phone cable with RJ-11 connectors or equivalent
z
Use the following procedure to install the management station’s modem:
Turn off all equipment prior to making cable connections.
1. Place the modem close enough to the management station to not violate the
50-foot RS-232C distance limitation.
2. Connect the RS-232C cable from the modem’s RS-232C port to the
management station’s serial port. Take care in selecting the appropriate
serial port on the management station (COM1 or COM2, for example).
3. Connect the RJ-11 modular phone cable from the modem
To Line
port to
the telephone jack.
4. Connect power to the modem and turn on the modem power switch (not
required for a PC internal modem).
61
Page 82

Installation
Connecting the Probe
5. Perform any other instructions as required by the modem manufacturer. If
you have any problems with the modem, contact the modem manufacturer
for assistance.
Install the Probe’s Modem
You need the following list of equipment to install the probe’s modem:
Hayes-compatible 300 to 38.4 K baud modem
z
RS-232C (straight through) modem cable
z
Modular phone cable with RJ-11 connectors or equivalent
z
Use the following procedure to install the probe’s modem:
1. Place the modem close enough to the probe to not violate the 50-foot RS-232C distance limitation.
2. Connect an RS-232C cable from the modem’s RS-232C port to the probe’s
RS-232 port. A null modem cable
cannot
be used for this connection.
3. Connect the RJ-11 modular phone cable from the modem
To Line
port to
the telephone jack.
4. Connect power to the modem and place the modem power switch to on.
5. Perform any other instructions as required by the modem manufacturer. If
you have any problems with the modem, contact the modem manufacturer
for assistance.
Configure the Management Station and the Probe
Refer to your NetMetrix documentation for information on configuring the
management station for use with a modem. Verify that the packet retransmission
timeout is set appropriately. For example, a 1500-byte SNMP packet requires
about one second to transmit over a 9600 baud connection, with another one
second for the reply. A packet retransmission timeout of three to five seconds is
appropria te for this example.
The probe can be configured for Serial Line Internet Protocol (SLIP) link
communications either by using a local terminal through the serial port or by
using a NetMetrix management station over the network.
62
Page 83

Connecting the Probe
Installation
If you use the network to configure the probe, make the network connection (r efer
to “Connecting to the Network (Out-of-Band)” on pag e 49) and then refer to your
NetMetrix documentation to configure the following probe parameters:
Serial Port IP Address
z
Serial Port Subnet Mask
z
Serial Port Speed
z
Hardware Flow Control (if unsure, consult your modem’s documentation)
z
Modem Init St ring
z
If you use an ASCII terminal to configure the probe as described in “Probe
Configuration Using a Local Terminal” on page 17, attach the terminal and
configure the following probe parameters:
Serial Port IP Address
z
Serial Port Subnet Mask
z
Serial Port Speed
z
Hardware Flow Control (if unsure, ask your local network administrator)
z
Modem Init St ring
z
The Serial Port IP Address must be on the same IP subnet as the management
station’s serial IP address.
Normally, each company has one subnet mask that is used for all machines on
their network. Enter this subnet mask value into the Serial Port Subnet Mask
field. The Serial Subnet Mask used for the probe should match the subnet mask
used for the SLIP port on the management station.
Set the Serial Port Speed to a value that is less than or equal to the maximum
speed at which your modem can operate.
Set the Hardware Flow Control to Off (On is the default), unless you are using
high speed modems (14.4K baud or faster) with advanced features, such as error
correction and data compression. If the Hardware Flow Control is set to On, you
can set it to Off by using the probe’s menu or over the network from a NetMetrix
management station (refer to your NetMetrix documentation for details).
63
Page 84

Installation
Connecting the Probe
Verify that the Modem Init String is properly initialized for the attached modem
by referencing the modem’s documentation. The probe’s default modem
initialization string is c onfigured to work with low-s peed and medium-speed
Hayes compatible modems. The following modem settings are recommended for
low-speed to medium-speed modem connections:
Modem Flow Control: Off
Data Compression (if applicable): Off
Error Correction (if applicable): Off
Not all Hayes commands are the same for all Hayes-compatible modems. Refer
to your modem’s documentation to determine the commands required for each of
the above settings and append these commands to the end of the default Modem
Init String.
NOTE
Your modem documentation discusses the features that are relevant to your
modem. If your modem does not support a feature (data compression, for
example), you do not need to turn it off in the Modem Init String.
Some modems require you to set register values explicitly, rather than sending
Hayes style commands. In this case, follow your modem documentation to set
these registers.
If you are using a high-speed modem, you probably need to modify the default
modem initialization string. The following modem settings are recommended for
high-speed modem connections:
Modem Flow Control: Hardware Flow Control (RTS/CTS signaling)
Carrier Dete ct: Always On
Data Compression: Enabled
Error Correction: Enabled
After appending the appropriate commands to the modem initialization string,
warm start your probe.
Refer to your NetMetrix documentation for information on how to esta blish
communications with the probe over the SLIP link.
64
Page 85

Connecting the Probe
Installation
Data Switch Connection
Use the data switch connection to provide the flexibility of using more than one
management station to communicate with more than one probe.
To make a data switch connection to th e probe, connect a NetMetrix management
station to the probe’s RS-232C port through a data switch. Set the Serial Port
Mode to Direct, if your probe is directly connected to the data switch, or set it to
Modem, if your probe must dial through a modem to another modem that is
attached to the data switch.
To allow traps to be sent from the probe to your management station, specify a
Serial Trap Destination of type Switch or Modem Switch, using NetMetrix.
Refer to your data switch documentation for information on setting up your data
switch. There are many variations available for this connection method. Figure 314 shows a possible data switch connection scheme.
65
Page 86

Installation
Connecting the Probe
Router
T3/E3
HSSI HSSI
DSU/CSU
Agjilent HSSI WanProbe
T3/E3
66
WAN
Network
ModemModem
Telemetry Network
(Ethernet or Token-Ring)
Data
Modem Modem
Switch
Figure 3-14: Probe Data Switch Connection
Page 87

Starting the Probe
Starting the Probe
Installation
NOTE
If you are using the Bootp serv er method of configur ation, do not atta ch the power
cord to the probe until told to do so in “Bootp Server Configuration” on page 71.
If you used the local terminal method of configuration, attach the power cord to
the probe. The probe does not have a power switch, but is powered on when
power is attached. When powered on or reset, the probe runs self-tests and
transmits ICMP echo frames to the default gateway for the purpose of allowing
the probe to be discovered by the routers (ARP cache). The probe transmits four
ICMP echo request packets about 10 seconds after booting and again every
autodiscovery echo interval.
67
Page 88

Installation
Verifying the Installation
Verifying the Installation
You can verify the probe’s installation by looking at the status LEDs on the front
or back of the probe. LEDs on the back of the probe show the status of each port
and the LEDs on the front of the probe indicate the status of the 10Base-T/
100Base-TX telemetry interface. After the probe restarts (boots), it runs a poweron self-test (POST) and then starts normal operations.
The Fault LED is briefly turned on (about three seconds) during the POST. After
the probe passes the POST, the Fault LED turns off. The Activity LED flashes
during network activit y . The ~ Line On or Power LED should be on to indicate that
power is applied to the probe.
After the probe has passed its self-tests, look at the status LEDs to verify your
installation. The status LEDs should be in the following states:
LED State
Activity Flashing, if connected to a network with traffic, or may
appear to stay on solid during periods of steady traffic.
~ Line On or Power On solid
Fault Off
You can use NetMetrix to verify that the probe can be reached (refer to your
NetMetrix documentation).
68
Page 89

Verifying the Installation
Installation
Out-of-Band Troubleshooting
For the Ethernet or Token-Ring telemetry interface, if the Activity LED is off,
verify that t he probe is properly connected to th e telemetry network and that the re
is traffic on the network. Also, verify th at you have the corr ect Physical Connect or
selected from the Modify/View Interface Values menu.
If the ~ Line On or Power LED is off, verify that power is properly connected to
the probe and to the correct power source.
If the Fault LED is on, the probe failed the self-test. Repeat the installation
procedures and verifi cation of instal lation. If y ou have an option inst alled, you can
look at each port’s Fault LED to see which port is generating the fault condition.
For the Token-Ring telemetry interface, if yo u are still having difficulty, call your
local Agilent se rvice re presenta tive. For the Eth ernet te lemetr y interf ace, c ontinue
with the follo wing “Ethern et Te lemetry Interface”section.
CAUTION
Ethernet Telemetry Interface
If you selected
connected Hub or switch supports this mode of operation. If you are not sure,
configure the link speed and full-duplex or half-duplex manually.
If you manually selected the Link Speed, be careful to configure it correctly. If
you configure the Link Speed for 100 MB/s and you connect the probe to a
10MB/s network, the probe will generate 100% utilization for that segment.
If you manually selected the link speed, verify that you are using the correct
speed. Also, if you manually selected the link speed, verify that you are using the
correct mode of operati on (full-duplex or half-duple x). 10MB/s Ether net is always
half-duplex.
If you are still having d iff iculty, call your local Agilent service representative.
Auto Negotiate
for the Link Speed parameter, verify that the
69
Page 90

Installation
Verifying the Installation
HSSI Troubleshooting
Before monitoring any data, the connection between the network and the probe
must be verified as reliable. The physical medium between network devices
should also be checked. Simple problems with the connection or the physical
layer configuration can prevent or skew more sophisticated traffic monitoring.
Refer to the following tips to help you prevent these problems:
Learn about the format of the b it strea m befo re you con figur e the pr obe. For
z
example, are binary ones represented as marks or spaces or is the data
inverted?
Cable leng th can affect the ability of the probe to ma intain clock
z
synchronization. Verify that the cables are not too long.
Is the DCE connected to the port 2 connec tor? I f the cables ar e rever sed, the
z
probe will not function.
If the Clock LED does not turn on, verify that the cables are connect correctly as
described in “Connecting to a HSSI System (In-Band) ” on page 56 and verify that
all of the equipment is functioning properly.
The most common cause for fail ure is a bad conne ction a t the pr obe. The r ed fault
LED should not be on while the probe is operational.
70
Page 91

4
Bootp Server Configuration
Page 92

Bootp Server Configuration
Bootp Server Configuration
This chapter describes how to use the Bootp server method to configure the
Agilent J3916A HSSI WanProbe so that it can communicate over the network.
This chapter assumes that you have already installed the probe, but have not
attached the power cord. If you plan to use the local terminal method of
configuration, skip this chapter and refer to “Local Terminal Configuration and
Installation” on page 4.
The following sections are covered in this chapter:
z
“Probe Configuration Using a Bootp Server” on page 73
z
“Bootp Server Setup on an HP or Sun System” on page 75
z
“Bootp Server Setup on a PC” on page 79
z
“Configuring the Bootptab File” on page 85
72
Page 93

Probe Configuration Using a Bootp Server
Bootp Server Configuration
Probe Configuration Using a Bootp Server
You can use a Bootstrap Protocol (Bootp*) server to load the probe’s IP
configuration. This method requires that a Bootp server maintains a file
containing client configuration information, maps from MAC addresses to IP
addresses, and responds to requests from clients. You can configure the probe
from an HP-UX, Solaris, or MS-DOS syst em acting as a Bootp server. The system
that is operating a s the Bootp server must be connect ed to your network. Table 4-1
shows the minimum requirements for a Bootp server operating on HP 9000, Sun
SPARC, and PC systems.
Before you can use the Bootp server, you must edit the bootptab file to configure
the required probe parameters. Refer to “Configuring the Bootptab File” on
page 85 for more information.
The probe’s MAC address is twelve characters long and is printed on a tag on the
back of the probe. You must determine the IP Address, Default Gateway IP
Address, and Subnet Mask from the network.
To allow the probe to use a Bootp server that is not on the same s ubnet, the router
involved must support Boot p Relay (the tra nsfer of a Bootp req uest). For exampl e,
if you have multiple probes th at you want to configu re from a singl e Bootp server,
be sure that the routers in the path between your Bootp server and the probes
support Bootp Relay. Otherwise, you will need to operate the Bootp serve r on the
same subnet as your pro bes. You can confi gure mul tiple pr obes on one su bnet an d
then place them on their respective segments.
*BOOTP, RFC 951, RFC 1084 phase I only
73
Page 94

Bootp Server Configuration
Probe Configuration Using a Bootp Server
Bootp Server Type
Item
HP Sun PC
Model or Processor HP 9000
Model 700
or 800
Operating System HP-UX 9 .x
or later*
Network Operating
System/Subsystem
Floppy Drive Not
System Memory Not
ARP A
Berkeley
Services
Applicable
Applicable
Sun SPARC
Model 1, 1+,
2, IPC, 5, 10,
20
Solaris 2.1 or
later*
Sun
Networking
Services
(Ethernet and
TCP/IP)
Not
Applicable
Not
Applicable
286 or above
DOS 3.0 or later
Microsoft LAN
Manager 1.0 or later
-orNovell NetWare
environment, including
LSL.COM v1.2,
IPXODI.COM v1.2,
NETX.COM v3.1
or later
3.5-inch Floppy Disk
Drive
10KB of free memory
to run the installation
process. 100 KB of free
memory to run
BOOTPD.
Table 4-1: Minimum Requirements for a Bootp Server
* Although bootp is supported on many versions of HP-UX and Solaris, the
NetMetrix application is only supported on specific operating system releases.
Refer to your NetMetrix d ocume ntation for the list of supported operati ng s yst em
releases.
74
Page 95

Bootp Server Setup on an HP or Sun System
Bootp Server Configuration
Bootp Server Setup on an HP or Sun System
If your Bootp server is an HP-UX or Solari s system, use the followi ng instructions
to configure the probe:
1. Determin e the IP address to be used for the probe.
2. Determine the name to be used as the probe’s Doma in Name Services (refer
to the HP ARPA Services manual) or configure an IP address and name for
the probe in your loca
3. Make sure that the Bootp ser ver can communicate with th e probe ( if they a re
separated by a router, the router must support Bootp Relay).
4. From the Bootp server, edit the client configuration file and enter the
following parameters to be used for the probe (do not specify any other
parameters):
l /etc/hosts file.
NOTE
z
MAC Address
z
IP Address
z
Default Gateway IP Address (if available)
z
Subnet Mask
The Bootp server must support the vendor specific subnet mask field and the
default gateway field.
5. Start the Bootp daemon as des cribed i n “Star ting t he Bootp Server on an HP
or Sun System” on page 77.
6. Connect the power cord to the probe and to a power source (either 100-120/
VAC or 220-240/VAC). The probe does not have a power switch but
becomes operational when power is attached.
75
Page 96

Bootp Server Configuration
Bootp Server Setup on an HP or Sun System
The probe automatically broadcasts Bootp requests when its IP address is
0.0.0.0 (the default). The probe broadcasts Bootp requests to signal its
need to be configured.
7. For HP-UX systems: Log in as root , then use SAM to fol low the i nstructi ons
presented on the screen.
For HP-UX 9.x, choose:
Networking/Communications -> Service:Enable/Disa ble
For HP-UX 10.x and 11.x, choose:
Networking and Communications -> Network Services
NOTE
NOTE
If the last screen presented in Step 7 displays bootp server enabled, (for
either HP-UX 9.x, HP-UX 10.x, or HP-UX 11.x) then your ma chi ne is already set
up as a bootp server.
8. Edit the /etc/bootptab file to configure the probe and add descriptive
comments to the file for reference. Refer to “Configuring the Bootptab File”
on page 85, the bootpd(1M) man page or the HP ARPA Services manual
for more information on configuring the /etc/bootptab file.
9. Use tail -f to check the system log file to ensure that the Bootp server
responded correctly to the Bootp request. The log file is /var/adm/
messages (Solaris), /usr/adm/syslog (HP-UX 9.x), or /usr/
adm/syslog/syslog.log (HP-UX 10.x and 11.x).
10. If you are using HP OpenView, you can verify that the probe has been
assigned the correct IP address and shows up on the management station
map as a network analyzer. The discovery process that places the probe in
the management station map can take several minutes to complete.
You may be able to decrease the required time for discovery of the probe by
pinging it continuously from your Agilent NetMetrix management station. You
can also ping the probe to verify that it responds to the new IP address.
76
Page 97

Bootp Server Setup on an HP or Sun System
Bootp Server Configuration
Starting the Bootp Server on an HP or Sun System
You can start the Bootp server on an HP or Sun system in one of the following
ways. Refer to “Configuring the Bootptab File” on page 85 if you need to
configure the bootptab file.
Bootp for Solaris is shipped on the NetMetrix CD-ROM but it is not part of the
operating system.
standalone
z
z
z
inetd
. Become superuser and give one of the following commands:
/etc/bootpd -s for HP-UX v. 9.x
/usr/lbin/bootpd -s for HP-UX v. 10.x & 11.x
/usr/netm/sun4s/bootpd -s for Solaris
. Become superuser and use the following procedure:
1. Edit the file /etc/inetd.conf. Search for a line like the following and
ensure that the line is uncommented (does not contain a # character). If
necessary, add the line to the file.
bootps dgram udp wait root path/bootpd bootpd
Where path is one of the following:
/etc for HP-UX v. 9.x
/usr/lbin for HP-UX v. 10.x & 11.x
/usr/netm/sun4s for Solaris
For HP-UX
2.
, give one of the following commands to force inetd to re-read
the inetd.conf file that you modified in Step 1:
/etc/inetd -c for HP-UX v. 9.x
/usr/sbin/inetd -c for HP-UX v. 10.x & 11.x
77
Page 98

Bootp Server Configuration
Bootp Server Setup on an HP or Sun System
3. For Solaris, determine the process ID for inetd by entering the followin g
command:
ps -ef | grep inetd
Then force inetd to re-rea d the inetd.co nf fil e that you modi fied i n Step 1 on
page 77 by giving the following command:
kill -HUP process_id
For additional information, refer to the man pages for bootpd(1M),
inetd(1M), inetd.conf(4M), ps(1M) and kill.
78
Page 99

Bootp Server Configuration
Bootp Server Setup on a PC
Bootp Server Setup on a PC
Bootp software for a PC is inc lu ded ( on a 3.5-inch floppy disk) with your Agilent
probe. Bootp software im plements an internet Bootstrap Protocol (Bootp) server
as defined in RFC 951 and RFC 1048. It is run from the DOS prompt either as a
standalone executable or as a terminate-and-stay-resident (TSR) program and
communicates to a network interface card using the Microsoft NDIS (LAN
Manager), or Novell ODI (NetWare), network stack. Bootp software does not
support Microsoft Windows.
Refer to “Configuring the Bootptab File” on page 85 if you need to configure the
bootptab configuration file.
Use the following procedure to setup the Bootp server software on a PC:
1. Insert the 3.5-inch floppy disk into your disk drive.
2. Change the prompt to indicate your floppy disk drive volume and enter
setup
Bootp Setup
===========
Setup helps you install the Bootp server software for
use with either Microsoft LAN Manager or Novell ODI
version 3.1 software by:
- copying to your setup drive software for interfacing
the Bootp program to your networking software.
- modifying your CONFIG.SYS, AUTOEXEC.BAT, and
PROTOCOL.INI or NET.CFG files. (A copy of these files
are saved in CONFIG.BTP, AUTOEXEC.BTP, PROTOCOL.BTP
and NET.BTP, respectively.)
- copying the Bootp software to BOOTPD directory on your
startup drive.
- providing a README file that contains more information.
(Press return to continue or press ‘E’ to exit.)
. The following screen is displayed:
79
Page 100

Bootp Server Configuration
Bootp Server Setup on a PC
3. Press Return to cont inue. The following screen is then di splayed:
Please specify startup drive to install Bootp on [C:\]:
4. Specify the drive where you want to install the Bootp software and press
Return. The d efault is to ins tall the Bootp software in C:\. The following
screen is then displayed:
Install Bootp Software for use with:
0: Microsoft LAN Manager 1.0 or later
1: Novell NetWare v3.1 or later
2: Exit this setup program
Enter choice [0 - 2]:
5. Specify the Network Operating System that you are using and then refer to
either “Using Microsoft LAN Manager” below or “Using Novell NetWare”
on page 82.
There will be different setup screens displayed depending on the Network
Operating System that you are using (Microsoft LAN Manager or Novell
NetWare).
Using Microsoft LAN Manager
If you have selected
NetWare” on page 82.
If you have selected
use the following procedure to setup your Bootp installation.
80
Novell NetWare v3.1 or later
, skip to “Using Novell
Microsoft LAN Manager 1.0 or la ter
from the setup menu,
 Loading...