

Page 1
NIRS
Analyzer PRO
Manual
8.928.8004EN
Page 2

Page 3

Metrohm AG
CH-9100 Herisau
Switzerland
Phone +41 71 353 85 85
Fax +41 71 353 89 01
info@metrohm.com
www.metrohm.com
NIRS
Analyzer PRO
Manual
8.928.8004EN 03.2013 fpe
Page 4

Teachware
Metrohm AG
CH-9100 Herisau
teachware@metrohm.com
This documentation is protected by copyright. All rights reserved.
Although all the information given in this documentation has been checked with great care, errors
cannot be entirely excluded. Should you notice any mistakes please send us your comments using the
address given above.
Page 5

▪▪▪▪▪▪▪
Change Control
Version
Date
Summary of Changes
1.0
Dec. 2,
2012
Document first release, initiated change control
Change control on this document is as follows:
3
Page 6

▪▪▪▪▪▪▪
Table of contents
1 Introduction ................................................................................................................... 5
1.1 Information Disclaimer ................................................................................. 7
2 Hardware Familiarization .............................................................................................. 8
2.1 Lamp Housing .............................................................................................. 8
2.2 Optical Switch .............................................................................................. 8
2.3 Diode Array Spectrometer ............................................................................ 9
3 Specifications............................................................................................................... 11
3.1 Window Reflectance .................................................................................. 12
3.2 MicroBundle Fiber Optic Interface .............................................................. 12
3.3 Direct Light ................................................................................................ 13
4 Mounting Information ................................................................................................. 14
4.1 4.1 Mounting Frame, U-Bolts Secured to Mounting Flanges ...................... 14
4.2 Mounting by straps to blind plates ............................................................ 19
4.3 Weld Flange ............................................................................................... 20
5 Mounting Dimensions .................................................................................................. 22
6 Electrical Connection ................................................................................................... 23
7 Air Cooling Connection Kit........................................................................................... 30
8 Air Purge Connection (Used with “Spoon Probe”) ....................................................... 32
9 Fiber Optic Probe Mounting ........................................................................................ 34
10 Ethernet Connection .................................................................................. 35
11 Safety and Power-up .................................................................................. 37
12 Connection to Vision Software ................................................................... 38
13 Diagnostics ................................................................................................. 43
13.1 Window Reflection ..................................................................................... 43
13.1.1 Performance Test ................................................................................................. 43
13.1.2 Reference Standardization .................................................................................... 46
13.1.3 Wavelength Certification ...................................................................................... 50
13.2 MicroBundle Fiber Optic Sensing ............................................................... 52
13.2.1 Performance Test ................................................................................................. 52
13.2.2 Reference Standardization .................................................................................... 55
13.2.3 Wavelength Certification ...................................................................................... 59
13.3 Direct Light Sampling ................................................................................. 60
13.3.1 Performance Test ................................................................................................. 61
13.3.2 Reference Standardization (External Reference Correction) .................................... 64
14 Sampling .................................................................................................... 65
15 Standards and Approvals ........................................................................... 66
4
Page 7
▪▪▪▪▪▪▪
1 Introduction
Analyzer PRO is a rugged, compact Near-Infrared Process
Instrument, designed for the wavelength range from 1100-1650
nanometers. This is an excellent region for process analysis,
containing many second and third overtones of molecular
vibrations which can be measured.
The instrument is based upon high-resolution diode array
technology. The InGaAs diode array, with spectral dispersion of
1.1 nm/pixel, is a stable, intrinsically accurate method of NIR
absorbance measurement. It offers excellent peak shape
resolution, and contains no moving parts. Therefore, no
wavelength accuracy adjustment is needed, as there is no
measurable drift.
Sampling systems are as follows:
• Window Reflectance, where the sample passes in contact with the window on the side of the
instrument
• Reflectance Probe, using a 1” (25.4mm) diameter stainless steel probe
• Direct Light Reflectance, where the sample passes at a distance of 4-10 inches
(approximately 100-250mm) from the window
The analyzer is housed in a robust cabinet, designed for easy, reliable mounting at the desired
location in the production area. Mounting is simplified by use of industry-standard stainless steel
clamps, which facilitate installation and removal, as well as good positioning of the analyzer to the
sample.
The instrument may be mounted in any orientation, as long as the sample window is in the proper
location. The sample interface is normally placed at a point of production where the product is
pumped through a pipe, dryer, blender, or other feed mechanism. There should be no (or very few)
gaps or voids in the product flow, as these will cause measurement instability.
5
Page 8
▪▪▪▪▪▪▪
The Analyzer PRO vides non-destructive analysis of
chemical and pharmaceutical products directly in
the process line, without use of a bypass loop.
Because most materials can be measured directly,
with no need for sample dilution or preparation,
the material can be measured as produced, with
no loss of end product.
Operation of the Analyzer PRO is through
Metrohm Vision™ software, which is robust,
powerful, and easy to use. This validated software
package meets all 21 CFR Part 11 requirements,
and comes with a test script to prove compliance
for internal regulatory personnel. Combined with
normal customer procedures for network and user
access, all 21 CFR Part 11 requirements are met.
Vision provides excellent tools by which to develop an analytical model for sample prediction. The
NIR sample information is correlated with quantitative lab data from the primary analysis method,
and a predictive model is used to report values for ongoing sample analysis.
Communication between instrument and computer is by Ethernet line, using standard connectors.
Commands use a proprietary, encrypted language which is not susceptible to hacking, support of
viruses, or other means of hacking. Only authorized operators may communicate with the Analyzer
PRO instrument, and only by valid entry through Vision.
Measurements may be displayed in a control room area on the computer screen as they are reported
in the Routine Analysis section of Vision. Provision is made for digital electronic transfer to most
supported plant controller languages.
Use of the Analyzer PRO helps to optimize the use of raw materials by ongoing measurement in real
time. This permits adjustment and correction of the process to target values, eliminating or
minimizing waste product. The Analyzer PRO fits into Process Analytical Technology (PAT) planning,
in support of recent FDA process initiatives.
Precise instrument matching enhances method development, minimizes implementation efforts, and
ensures straightforward calibration model transferability between analyzers.
6
Page 9

▪▪▪▪▪▪▪
1.1 Information Disclaimer
This manual and the information herein are correct as of the time of publication, based upon the best
information available at the time. Configuration, options, and software information may change over
time, in keeping with the corporate philosophy of continuous improvement.
Metrohm NIRSystems and its distributors cannot be liable for changes to the customer process based
upon information contained in this manual which is subject to revision and update. Additionally, the
information and steps in this manual are not meant to serve as template standard operating
procedures for use in regulation industries. Customers should supply their own procedures for
internal users, based upon the specific samples, methods, and needs of the application.
Metrohm offers optional training and field support to assist in the technical aspects of calibration and
library development. The final responsibility lies with the user, who has access to calibration samples,
lab data, and other information required to build and maintain methods using this instrument.
7
Page 10
▪▪▪▪▪▪▪
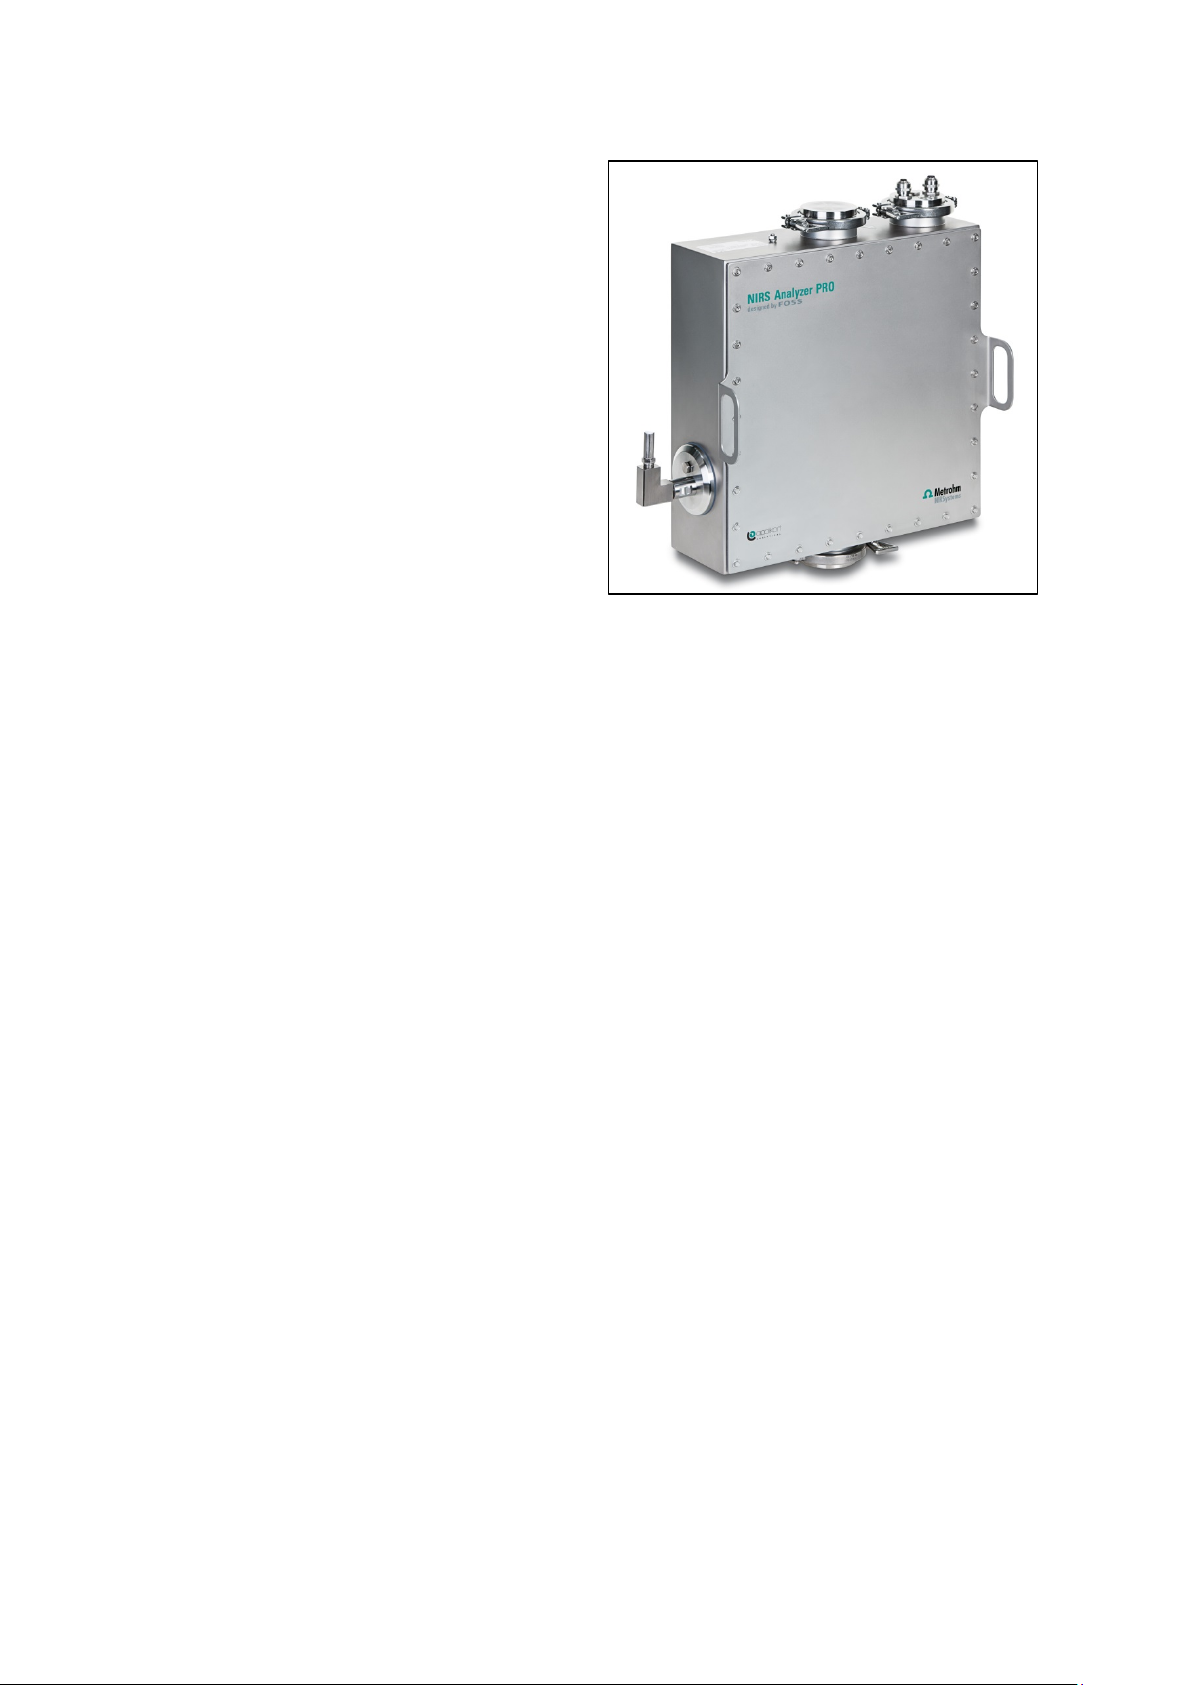
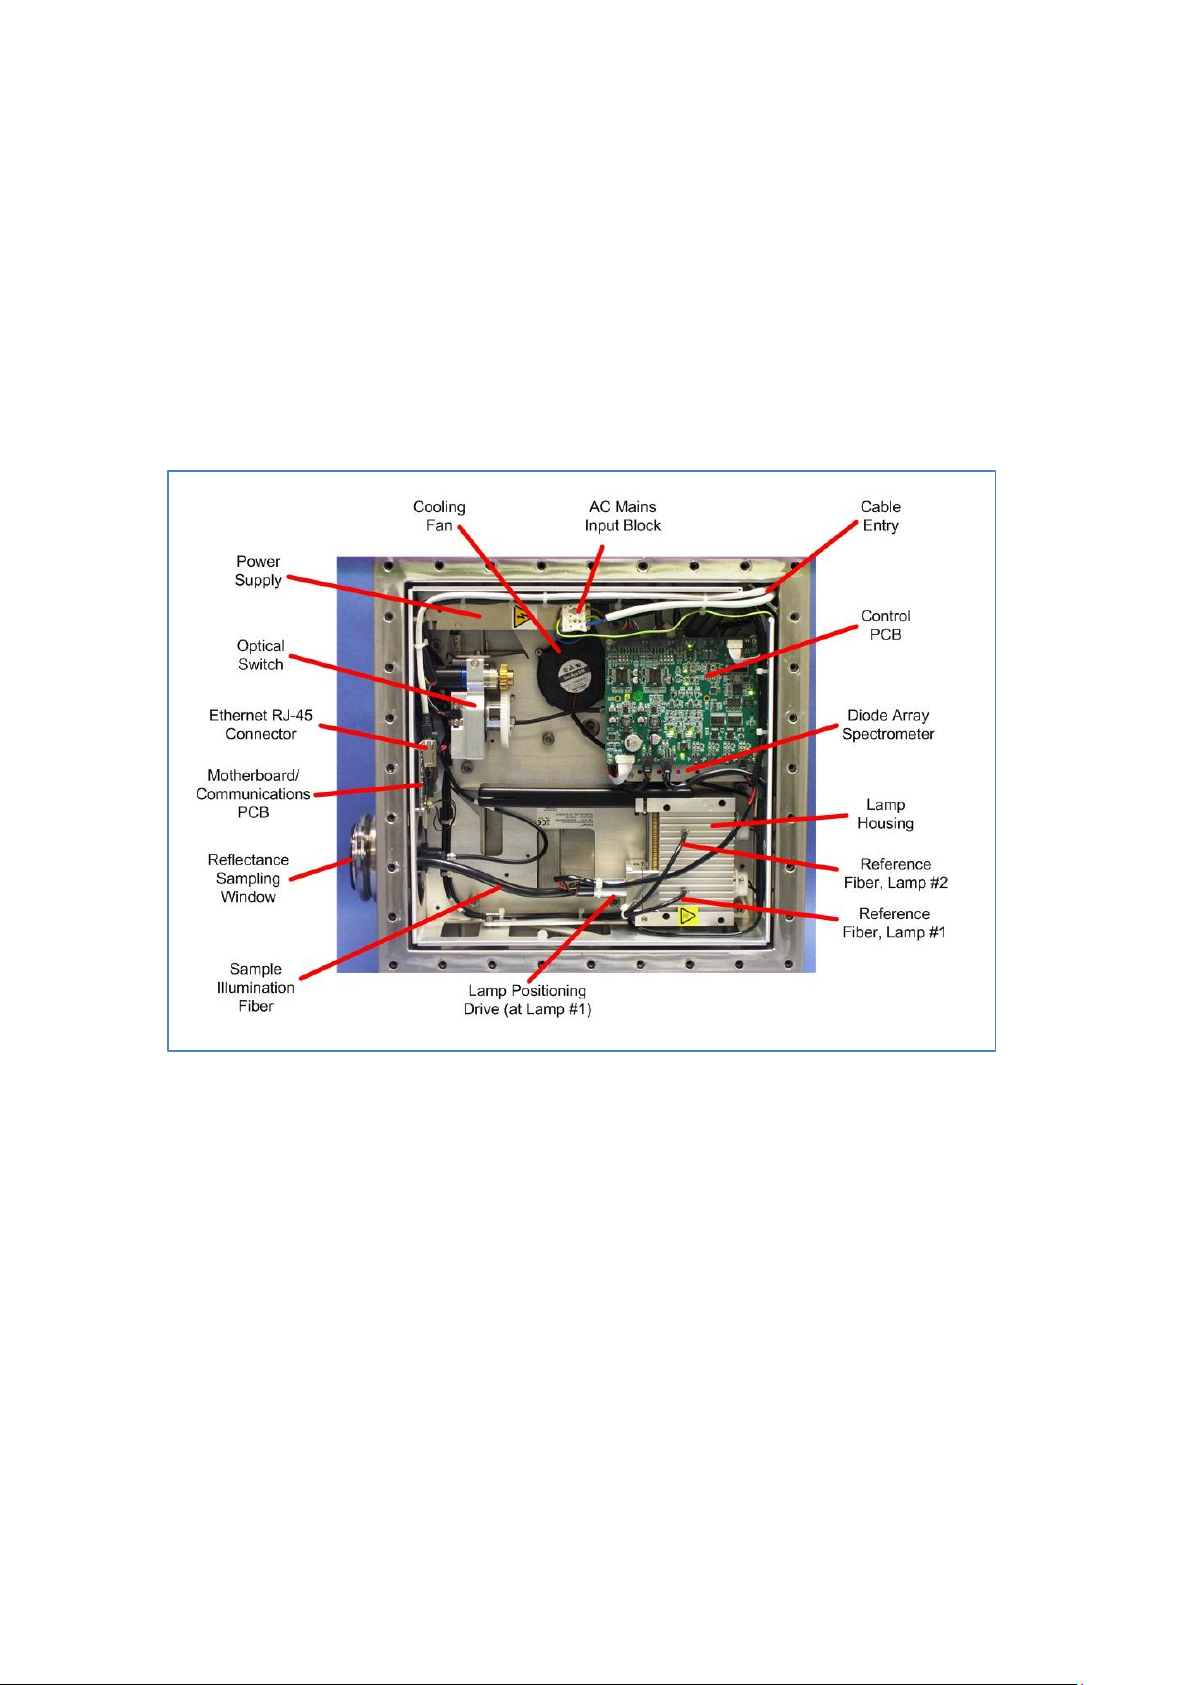
2 Hardware Familiarization
Analyzer PRO is built into a rugged, sealed stainless steel housing which is designed to withstand the
harsh production environment, including washdown.
Fiber optics are used with the Reflectance Probe design, and should always be protected from
damage and abuse. In particular, fiber bend radius should never be less than 6” (150mm). It is
strongly recommended that fibers be mounted in enclosed cable trays to minimize handling,
movement, and possible accidents.
The inside view of the instrument is as shown.
Primary components are as follows:
2.1 Lamp Housing
This contains two halogen lamps. Only one lamp is active at a time. If a lamp fails, the other is
automatically switched on, and a motor moves the Sample Illumination or “light-output” fiber to the
operating lamp. The Sample Illumination Fiber carries the light energy to the sampling point.
Note that the Lamp Housing also has a Reference Fiber for each lamp, which are routed to the
optical switch. These fibers are used to measure the background (reference) energy for each lamp.
The Optical Switch automatically moves to the correct position, based upon which lamp is in use.
2.2 Optical Switch
The Optical Switch receives the light reflected back from the sample, which has been modified by
interaction with the sample material. The other inputs to the Optical Switch are the two Reference
fibers from Lamps #1 and #2, along with a “Dark Signal” reference. The Optical Switch, under control
of the on-board electronics, measures the energy returning from the sample, compares this with the
energy level sent to the sample, and scales the signal to create an absorbance spectrum over the
8
Page 11
▪▪▪▪▪▪▪
wavelength range from 1100-1650 nm. (The optical switch may be heard moving when instrument
The diode-array spectrometer is composed of 512
scans are taken, if the ambient noise level is low enough.)
2.3 Diode Array Spectrometer
discrete InGAs detector diodes. It has no moving
parts.
The wavelength accuracy is intrinsically stable, and
requires no adjustment. Temperature is maintained
internally to assure consistent and accurate
response.
NOTE: There are no user-serviceable parts in the
Diode Array Assembly. Do not attempt to open,
disassemble, or service this unit. Any attempt at
service or opening will immediately void the
warranty.
Power Supply
This takes the incoming AC Mains voltage and steps it down to 24 VDC, as used by the instrument.
Cooling Fan
The fan circulates air internally to maintain consistent, controlled temperature to the spectrometer
and all internal components. This assures repeatable optical response.
Sampling Point
This may be either a Window Reflectance system (as shown here), a Fiber Optic Probe, or Direct
Light. The internal instrument interface is the same for all styles. A fiber optic bundle carries the light
to the sample. A small bundle carries the returning energy from the sample to the Optical Switch.
AC Mains Block
This is explained in the section on electrical Connection. All connections should be made in
compliance with local codes, by a qualified electrician. Always use safety lockout procedures when
performing electrical wiring.
Ethernet RJ-45 Connector
The Ethernet cable is plugged in on the instrument motherboard.
Control PCB
Instrument functions are controlled from this PC board. There are no user-serviceable items or
procedures in connection with this board.
9
Page 12
▪▪▪▪▪▪▪
The internal light paths of the Analyzer PRO are
Block Diagram
shown.
The sample is illuminated with white light. The
resulting signal is sent back (through the optical
switch) to the Diode Array Spectrometer for
analysis.
Both dark and light reference signals are used to
set the scale of absorbance. Vision uses the
resulting information to produce sample spectra.
The formula (shown only for information) is as
follows:
10
Page 13
▪▪▪▪▪▪▪
3 Specifications
Overall Analyzer PRO instrument specifications are as follows:
Item Specification
Ambient Temperature
Ambient Humidity 10-90% Relative Humidity, non-condensing
Electrical Supply 100-240 VAC, 50-60 Hz, 2.0 A, 150 W
Protection IP69k according to IEC 60529 and DIN 40050 part 9, NT ELEC 023
Dimensions
Weight 33.0 pounds (15 Kg)
Pressurized Air Cooling
(Ambient Temperature 4565 Degrees C)
Pressurized Air – Spoon
Probe
Network Connections Local Area Network (LAN) – Ethernet, RJ-45 connection
23 to 104° F (-5 to 40° C)
With Air Cooling: 23 to 149° F (-5 to 65° C)
Width: 17.0” (42 cm)
Height: 17.0” (42 cm)
Depth: 5.0” (13 cm)
Cooling air flow rate minimum 5 Liters/min
>99.9% water free
>99.9% free of oil and fine particles down to 0.3 micrometers
Purge air: 3-5 bar
Sample Temperature,
Reflectance Window
Sample Temperature,
Spoon Probe
Computer Requirements See Vision computer requirements
Wavelength Range 1100-1650 nm
Analysis Time:
Wavelength Accuracy 0.5 nm
Wavelength Precision < 0.02 nm
Wavelength Stability < 0.01 nm/°C
Specifications for each type of sample interface follow:
302 degrees F (150° C)
248 degrees F (120° C)
5 – 50 ms / integration time; depends upon sample. Typical result
time: 3-15 sec.
11
Page 14

▪▪▪▪▪▪▪
3.1 Window Reflectance
In-line analysis of paste, granulates, slurry, powdered products and similar materials in pipes or fluid
transport systems can be performed without need for bypass streams. The sample material must pass
over the sample interface window.
The window reflection interface may easily be installed into the production line using standard GEA
Tuchenhagen flowcell mountings, or by welding an interface flange into the wall of the
pipe/transport system. GEA Tuchenhagen is well known for innovative, hygienic components for
operation in the process stream.
• Temperature: 150°C (302°F)
• Pressure: Vacuum > 1 Torr (approximately 1 mm Hg), Pressure < 3000 PSI
• Lens: Sapphire; diameter 45 mm (1.8”), thickness 12 mm (0.5”), with
EPDM O-ring seal for reliable, temperature resistant sealing
• Pipe flowcells: Fits directly into GEA Tuchenhagen Varinline Access units (DN40 to
DN150 with 68 mm [2.7”] opening). This mounting method facilitates
implementation of CIP (clean in place) and SIP (sterilize in place) methods.
• Transport System: Stainless steel welding flange
3.2 MicroBundle Fiber Optic Interface
Direct in-line measurement with microbundle fiber optic probe interface, optimized for process
streams of clear to opaque liquids, slurries, suspensions, and powders. The analyzer may be
configured with a reflectance or immersion probe based upon sample type.
316 Stainless Steel or Hastalloy Probes (custom materials also available)
• Micro Interactance Reflectance Probe
• Micro Interactance Immersion Probe
• Micro Interactance Reflectance with purge on collection tip
(requires clean air or nitrogen for purge)
• Optimized Micro Reflectance (45-degree) Probe with 3 meters of fiber
(Angled face for optimized sample collection)
Window: Sapphire
Temperature: 300°C (572°F)
Pressure: 5000 PSI (344 Bar)
12
Diameter: 1” (25.4 mm) Standard
Length: 12” (305 mm) Standard
Installation: 1” Swagelok® crimp fitting
Cleaning: Wash in water, hot or cold depending upon product
Fiber: Interactance Micro Fiber Optic Bundle (3m) with Metal or Nylon Cladding,
SMA connection to the Analyzer PRO
Page 15

▪▪▪▪▪▪▪
3.3 Direct Light
In-line analysis of products where direct contact with the product is not technically feasible, such as
product transported on a conveyor belt or similar means of movement.
Lens: Sapphire; diameter 45 mm (1.8”), thickness 12 mm (0.5”), with EPDM O-ring
seal for reliable, temperature resistant sealing
Distance: 100-250 mm to sample surface (4 to 10”)
Scanning Area: 20 - 85 mm (0.8 to 3.3”) diameter, depending upon distance to sample
13
Page 16
▪▪▪▪▪▪▪
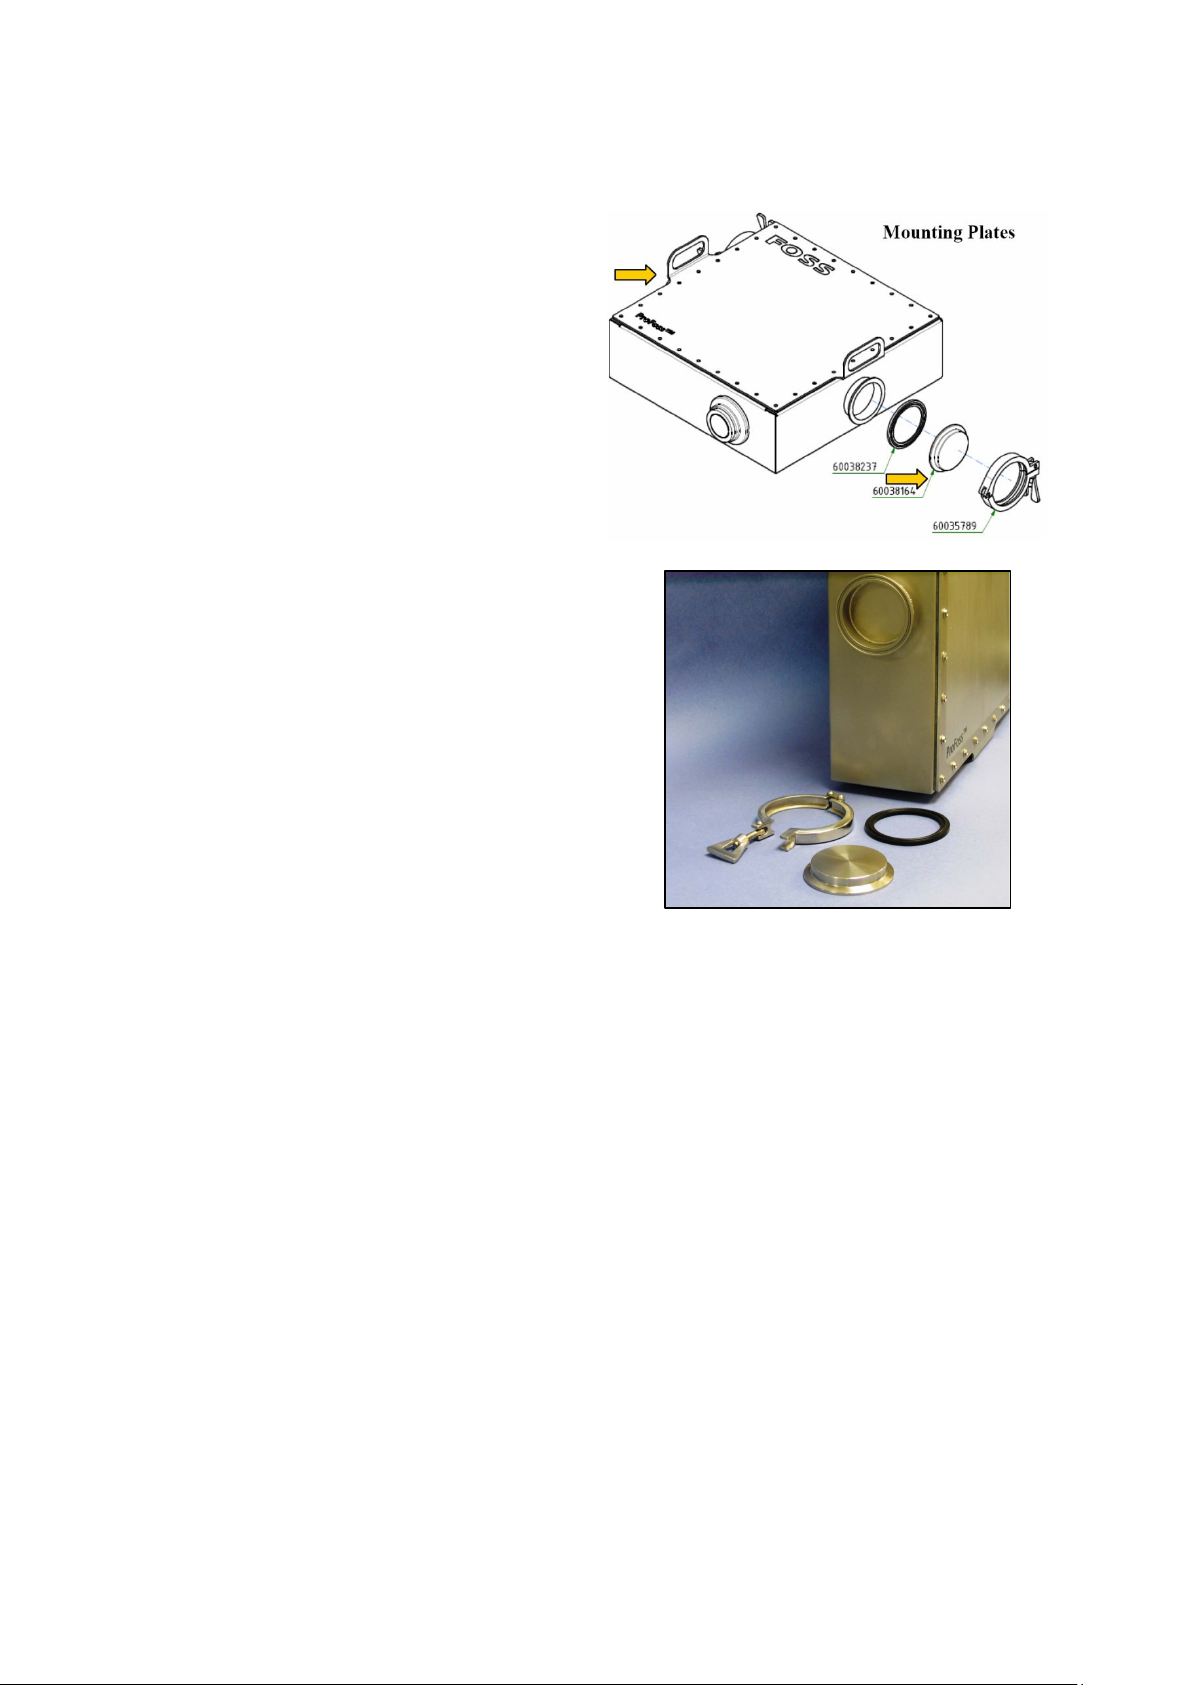
4 Mounting Information
Analyzer PRO is provided with an innovative, rugged integral flange-mounting system that permits
easy installation and service. There are two mounting flanges, top and bottom, to which are
mounted “blind plates” using a rugged, industry-standard tri-clamping mechanism. This approach
eliminates bolt holes or other entry points for contaminants.
The mounting flanges are sized to attach directly to 3” (76.2 mm) diameter stainless steel piping,
which is widely used in sanitary installation areas. To mount using pipe, determine where the window
or fiber will be positioned, and install pipes in the corresponding positions for supporting and
mounting the enclosure. The pipes should have the proper flange ends to accept the clamps to lock
the Analyzer PRO instrument in place.
Two alternative methods are shown. This first is preferred in most cases.
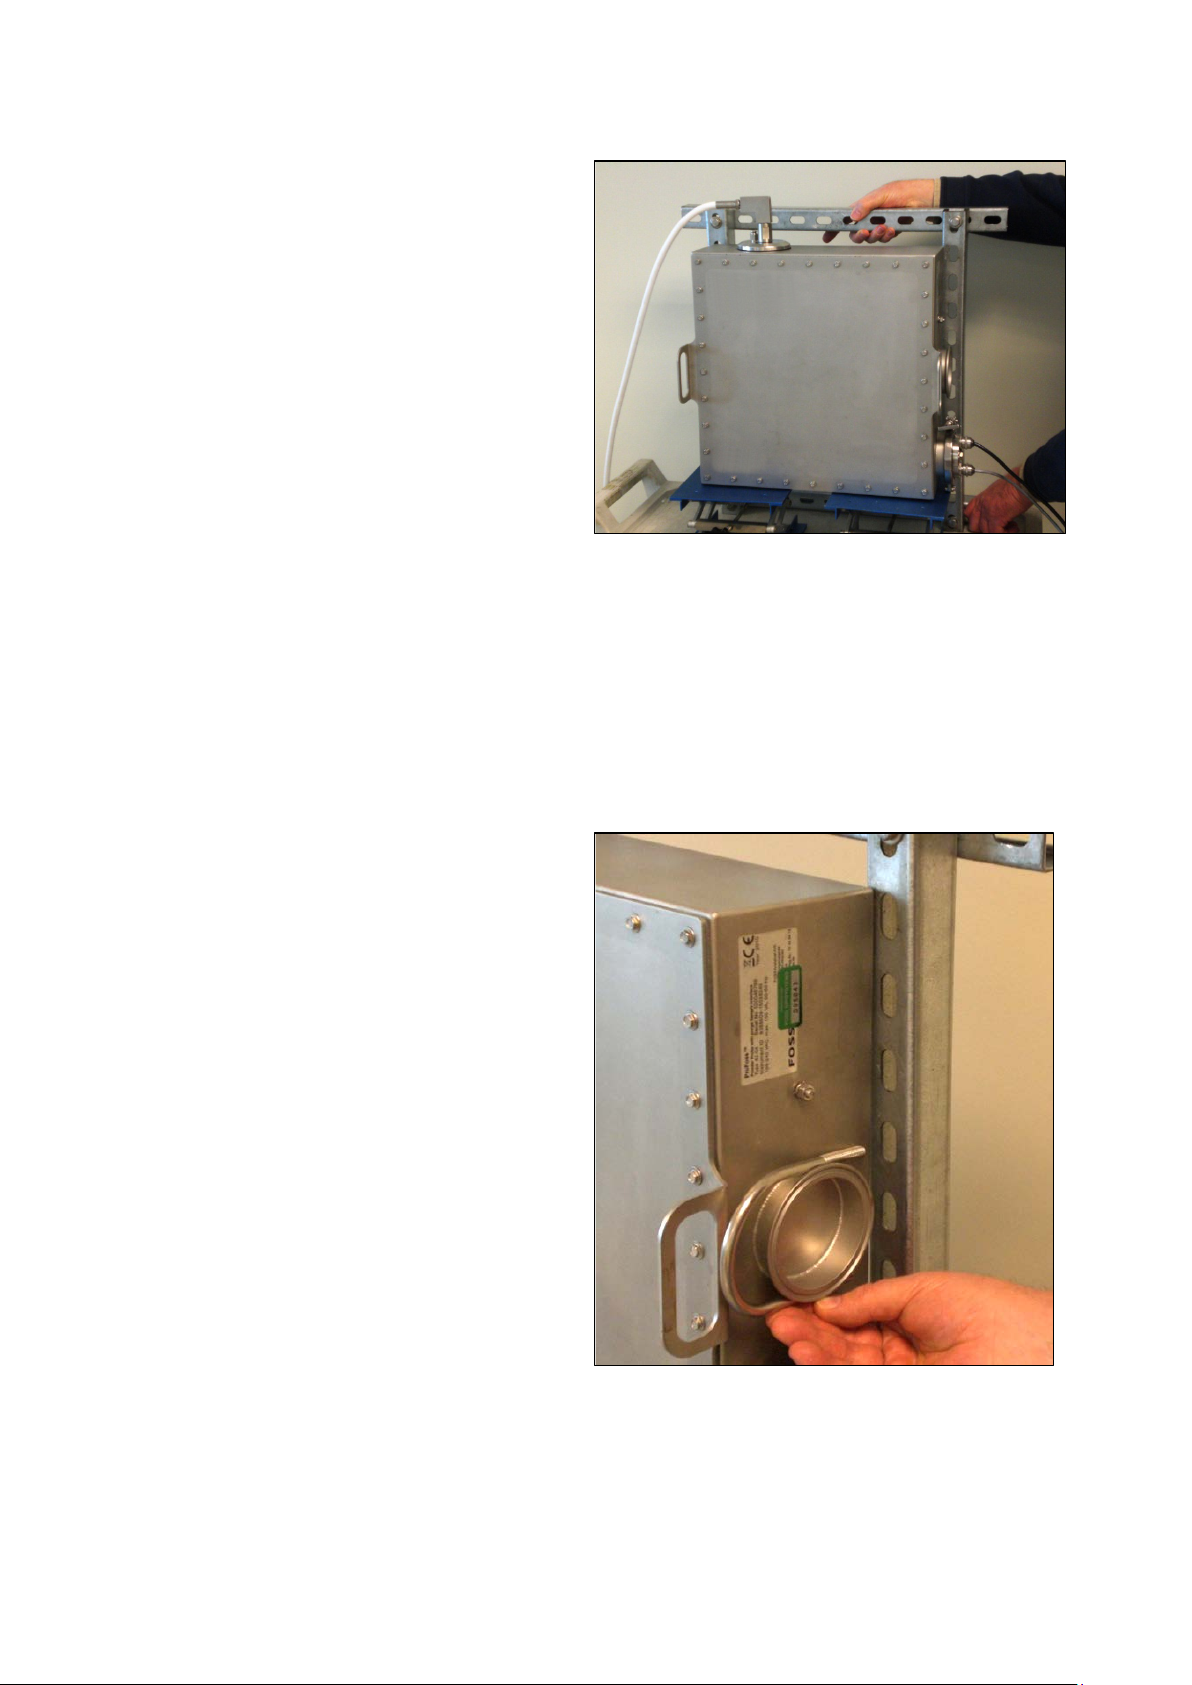
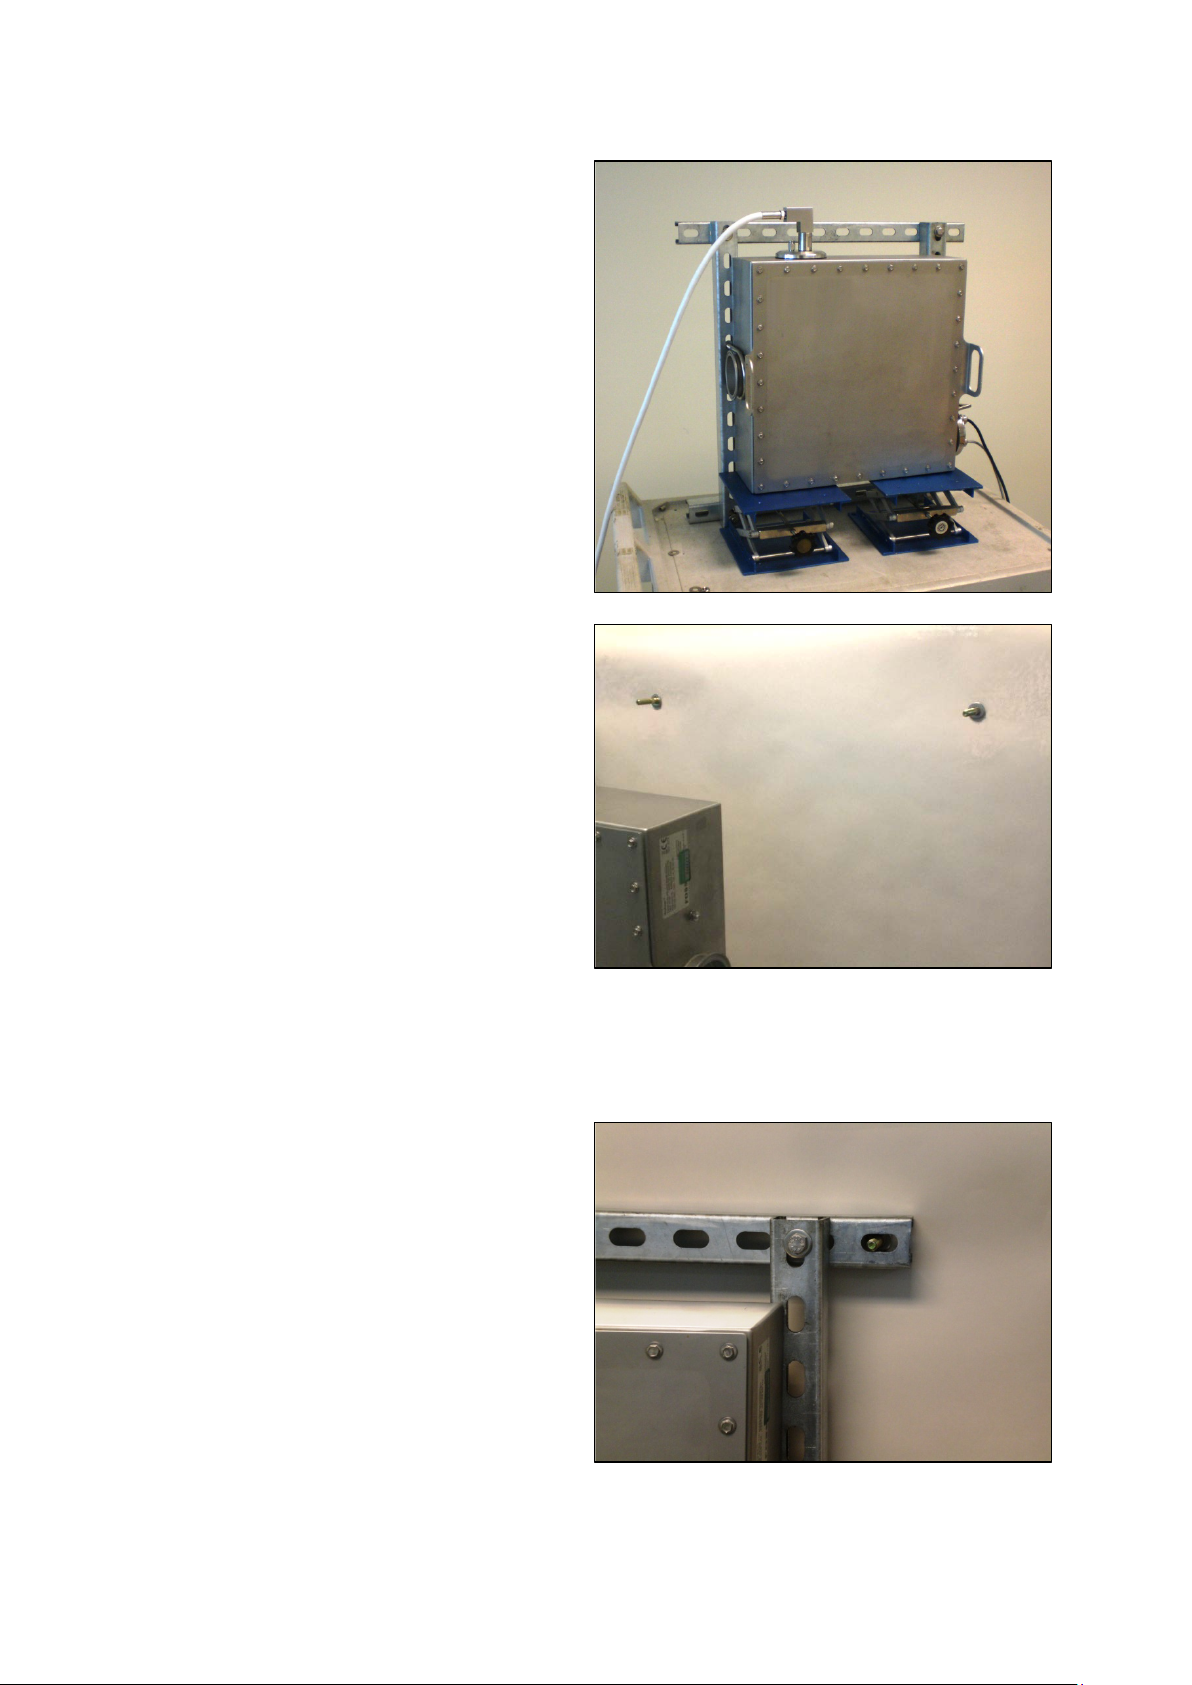
4.1 4.1 Mounting Frame, U-Bolts Secured to Mounting Flanges
Many installations will be performed using a fabricated mounting frame which can be bolted to a
solid surface in the plant. This mounting method should be well-planned, so the sample window (or
fiber optic probe) is in the right location upon final installation. In this case a Analyzer PRO Fiber Optic
Probe system is being installed.
This sequence shows mounting the frame to the Analyzer PRO instrument first, then bolting the
frame (with Analyzer PRO installed) to the mounting bolts.
We advise using a cart or frame to support the instrument during mounting, to avoid damage. Use
lab jacks as shown, to make height adjustment easy. Protect the fiber optic cable, as well as the
power and communications cables. Do not kink, bend, or otherwise stress the fiber optic cable in any
way, as this may damage the internal fibers and cause loss of energy.
Safety NOTE: Please follow all site safety rules regarding lifting and physical exertion while mounting
the Analyzer PRO.
In addition, use of a rolling cart provides an easy way to protect the fiber optic cable, power cable,
and communications cable – they are carefully coiled on the lower shelf of the cart, to avoid damage.
1. Remove the locking clamps and blind
mounting plate from each mounting
flange. Remove the gasket as well.
Keep all these parts in a safe place, in
case they are needed at some point in
the future.
14
Page 17
▪▪▪▪▪▪▪
2. Fabricate the mounting frame as
shown. It may be larger if required. In
Note that the Analyzer PRO instrument is on a cart for positioning. We use lab jacks to
3. Use 3” (76.2 mm) inside-diameter
this installation we purchased pre-cut
channel from McMaster Carr. We used
four (4) lengths of Steel Strut Channel,
Slotted, 1-5/8” x 1-5/8”, zinc-plated, 2
foot length, part number 3310T53.
The brackets each measure 24” (610
mm) in length. The upright brackets
are bolted so the centerline of the
slotted holes is 17.25” (about 439 mm)
apart. Use 3/8” (or 10mm) bolts.
The brackets should be capable of
supporting the full Analyzer PRO
weight, plus an ample safety margin.
We suggest a minimum capacity be
100 pounds, or roughly 45 kilograms.
raise it to the final mounting height, to avoid difficult lifting. The installer is shown
checking the size and slot pattern for fit.
stainless U-Bolts with extended-length
legs, like that shown.
(This is a McMaster-Carr ExtendedLength Type 316 SS U-Bolt 3/8”-16
Thread, part number 29605T7 -- as of
time of publication.)
Remove the nuts from the U-Bolt and
gently place it over the flange as
shown. Verify that the mounting
height is correct, and that the U-Bolt
will be in the correct position to bolt
onto the brackets. Use additional
wooden blocks to reach the proper
mounting height. Check both sides.
15
Page 18
▪▪▪▪▪▪▪
4. Adjust height with the lab jacks, so the
5. When the height is correct, push the
U-Bolts align properly with the frame
slots. Adjust each side equally, to keep
the Analyzer PRO aligned with the
bracket.
U-Bolt through the slots.
Do this on both sides of the Analyzer
PRO instrument, in preparation for
securing with washers and nuts.
6. Install large washers, lock washers,
and nuts on the ends of the U-Bolts.
Do not tighten until all four sets of
washers and nuts are in place.
When all four sets of hardware are in
place, gently tighten each nut, using
care not to distort the U-Bolts or
frame.
16
If preferred, nylon-insert locking nuts
may be used in place of normal lock
washers and hex nuts.
Page 19
▪▪▪▪▪▪▪
7. The Analyzer PRO instrument is now
securely mounted to the fabricated
8. Mounting studs should be placed in
9. Roll the cart so the mounting frame is
frame. It is ready to be mounted to the
final process location.
Verify that all hardware is secure.
Protect the fiber (if so equipped) as
well as the power and
communications cables.
Carefully move the Analyzer PRO
instrument and mounting frame to the
final location.
the correct positions to hold the frame
in place.
We installed 3/8” studs in the
mounting area as shown. These are
21.75” (552mm ) apart, which
corresponds with the slot holes in our
mounting frame. The lower studs are
mounted 22” (560mm) below, at the
same width.
These studs should be capable of
supporting the weight of the Analyzer
PRO instrument and frame, with a
large margin of safety. Be sure to
measure for the frame used, and
directly in front of the mounting studs.
Using the lab jacks, raise the Analyzer
PRO instrument (on the mounting
frame as shown) to the correct
position. When the studs align with
the mounting frame, gently ease the
mounting frame over the studs as
shown.
17
Page 20
▪▪▪▪▪▪▪
10. Install a large washer, a lock washer,
11. When all four sets of washers and nuts
12. When all hardware is tight, the lab
and a hex nut onto each stud.
Do not tighten until all four sets of
hardware are in place.
Continue to protect the fiber optic
cable, as shown here.
are threaded on, begin tightening each
set. Do not damage or distort the
mounting frame.
If nylon-insert nuts are preferred, those
may be used in place of standard hex
nuts.
jacks may be lowered and removed.
This may be done gently, to verify that
the mountings support the weight,
and that all hardware is properly
tightened.
This photo shows the final mounting,
with all bolts installed and tightened.
As before, continue to protect the
fiber optic cable, as well as the power
and communications cables. The cart is
still shown at the bottom of this
photo, immediately after removing lab
jacks. The cables are on the bottom
shelf, ready for the next stages of
installation.
18
Page 21
▪▪▪▪▪▪▪
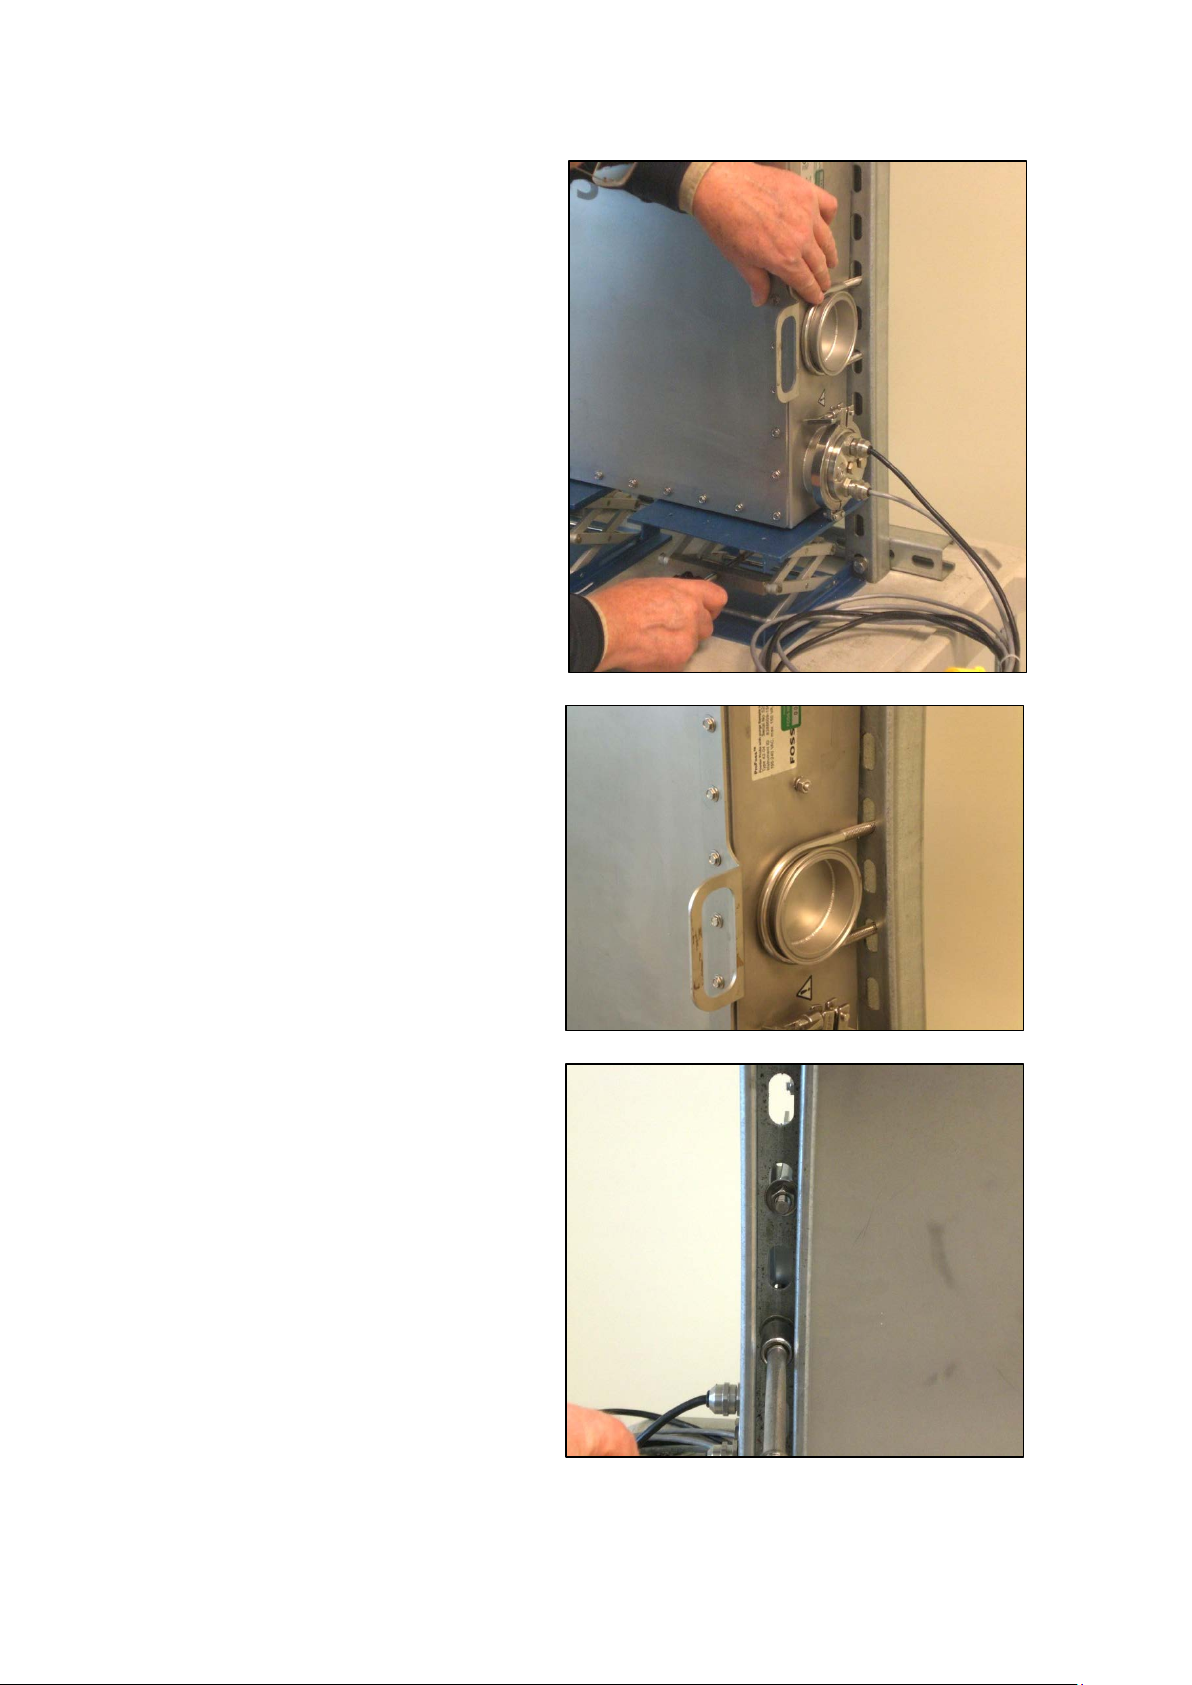
4.2 Mounting by straps to blind plates
The blind plates are 15mm stainless steel,
The mounting flange of the instrument is shown at
and are equipped with a special gasket to
properly affix the blind plate to the flange on
the instrument.
The blind plates may be welded or machined
in any way to properly affix and support the
instrument in the desired position.
Do not distort or weaken the blind plates, as
they support the full weight of the Analyzer
PRO. Weight is 33 pounds, or 15 Kg.
the top.
The “blind plate” and gasket are shown at right.
The clamp is a “Tri-Clover” style. It is an ISO Clamp,
76.1mm. This style of clamp is used in sanitary
installations, and is known for ruggedness as well as
ease of installation and removal.
Do not attempt to drill mounting holes through the
cabinet or cover, as this will compromise the
protective sealing of the instrument enclosure. Any
holes drilled in the cabinet will invalidate the
instrument warranty.
Before mounting, determine the optimal desired position of the sampling window, and arrange for
the blind plate positions to correspond to that desired sampling position. (With a fiber optic probe
this position may be less critical.)
Before mounting the instrument, verify that the blind plates are in the correct locations, and that the
fabricated mounting arrangement will support the full weight of the instrument. When mounted, the
distance from the outside flat of the top blind plate, to the outside flat of the bottom blind plate is
19.25” (384mm). Leave some provision for movement of the mounting brackets (such as slotted
holes) to ease mounting and final positioning. At least ¼” (6mm) of movement is recommended. The
gaskets have a molded ridge on each surface, and the mounting must accommodate this ridge
during assembly.
The blind plate, gasket, and mounting flange should be securely clamped in place, top and bottom.
There should be no play in the clamp or mounting mechanism. This method of mounting provides for
easy mounting and dismounting, if required. The cover, secured by 32 bolts and sealed by a
compressive gasket, has two handles which allow lifting. Please wear protective gloves when lifting.
19
Page 22

▪▪▪▪▪▪▪
This photo shows one installation on a process
The Weld flange uses the standard sanitary
pipe.
The Analyzer PRO instrument is supported by
metal straps from a support above the
instrument, using the mounting flanges. In this
case the blind plates were drilled to accept the
mounting bolt. Because the mounting flange
openings are sealed, there is no risk of
contaminants getting inside the Analyzer PRO
enclosure.
This photo was taken before the cables were
secured with tie wraps.
When the mouning is finished, secure the power cable and commmunications cable to prevent
damage. Be careful where they exit the Analyzer PRO, as a very tight bend here may cause cable
damage. It is wist to protect the cables from any passing traffic or possbile impact.
4.3 Weld Flange
The Weld Flange may be used to mount the instrument to ports where sample material is moving in a
continuous manner, and sampling will be consistent. Additional supports using the mounting plates
are required to hold the weight of the Analyzer PRO. While this flange may be welded, may
customers prefer to bolt it in place. Either method is acceptable, as long as sampling is not impeded.
sample interface and offers a large diameter
surface that can be welded onto the process.
The Analyzer PRO is then connected to this
flange.
Additional supports using the mounting plates
are required to hold the weight of the Analyzer
PRO.
Sample windows must be clean before final
installation.
20
Page 23

▪▪▪▪▪▪▪
This photo shows an installation on a chute,
where the product falls by gravity onto the
This shows the weld flange mounted on the
sample window, thus providing a suitable
measurement.
The Weld Flange is bolted to a plate which
mounts in the duct. The plate may be removed
if needed, and replaced with a blank plate. This
allows cleaning and minor maintenance,
without stopping the line for more than a brief
interval.
Note that the Analyzer PRO is supported by
straps on each side, which support the weight.
The Weld Flange does not support the weight
of the instrument.
Analyzer PRO. The Tri-clamp is used to secure
the instrument in place on the weld flange.
NOTE: The Weld Flange provides positioning of
the sample window only. It does not support
the weight of the Analyzer PRO instrument.
21
Page 24

▪▪▪▪▪▪▪
This view shows the
The front view shows
Flange mounting
5 Mounting Dimensions
The Analyzer PRO dimensions are as shown. Note that the dimensions are in “hard Metric”. The inch
conversions are very close, but will be less exact.
distance to the viewing
window, as measured
from the side.
Note the mounting
flanges shown on either
side of the drawing –
these are detailed below.
overall dimensions, as
well as the height to
each flange.
The critical dimensions
are those to the
sampling point – the
sample window must be
in the correct position to
take spectra of the
sample.
Be sure to leave room for
electrical connection.
dimensions are shown.
Leave room for
attachment of Tri-clamps
by installation personnel.
22
Page 25

▪▪▪▪▪▪▪
6 Electrical Connection
The electrical connector flange also uses a removable plate
Connections are marked as follows:
The Analyzer PRO is shipped with a temporary AC mains electrical cable in place, suitable for initial
testing. Cord length is just over two meters. The installer need only terminate the AC mains power
cable as required to meet local codes and installation requirements.
For permanent installation, a suitable cable must be installed. This cable should be three-conductor,
round cross-section, 3.0mm nominal diameter, and must meet all electrical, temperature, and
installation requirements for the area where mounting will be performed.
and quick connect clamp. The plate has two cable entry
glands for the power line and the other for the LAN cable.
The instrument is supplied with fitted cables for both with
3 meters length enabling the Analyzer PRO to be installed
easily in a laboratory environment for start-up training on
the operation of the analyzer.
An additional two plugged threaded holes (G1/8 thread)
are present on the plate for the addition of the air cooling
kit.
An illuminated button is also present. Functions will be
discussed.
Electrical specifications are as follows:
Electrical Supply 100-240 VAC, 50-60 Hz, 2.0 A, 150 W
Protection IP69k according to IEC 60529 and DIN 40050 part 9, NT ELEC 023
Symbol Meaning N. America Europe
L Line White Brown
N Neutral Black Blue
Ground Green
Green/
Yellow
AC Mains connections and Ethernet Connection
enter the Analyzer PRO through the fitting shown.
This fitting provides for gasketed, sealed entry of
cables.
The cables have round cross-section to assure good sealing in the clamping ferrules. When the AC
23
Page 26

▪▪▪▪▪▪▪
1. Remove power from the instrument.
2. Unplug or disconnect existing,
3. Remove the 32 screws holding the cover
mains cable is replaced, the same type of cross-section of cable must be used to assure a good seal.
The cables are carefully routed to prevent interference with operation of the Analyzer PRO.
When replacing the temporary AC mains cable, follow this procedure:
Both poles must be broken.
Use safety lock-out procedures if
applicable.
temporary AC mains cable.
in place on the instrument. Use a 7 mm
socket or nut driver.
NOTE: If using a powered removal tool,
set the torque on a low setting, to avoid
stressing the screws. Start at a low
torque, then increase enough to remove
the screws easily. Use a similar torque
when re-installing the screws. Avoid
cross-threading.
24
Page 27

▪▪▪▪▪▪▪
4. Press each tab above the wire to be
removed, and pull the wire directly
5. Gently loosen the cable gland over the
6. Remove the Tri-clamp holding the cable
7. Continue to loosen the gland nut until it
outward.
NOTE: Verify that power is off before
performing this operation.
existing AC mains cable. Use a 22 mm
(approx 7/8”) open-end wrench.
NOTE: This nut is easy to loosen before
removal of Tri-clamp. Do not fully
remove the nut at this point.
input header. Save clamp for re-use.
separates from the cable seal.
25
Page 28

▪▪▪▪▪▪▪
8. Slide the gland nut and sealing ferrule
9. Prepare a “fish” line which will be used
11. Note the position of the nut, seal and o-
back from the threaded area.
to pull the new cable into the enclosure.
This line will be used to pull the new
cable back into the correct position.
10. Gently pull the old cable out of the
threaded header, guiding the fish line as
needed.
Do not pull the line all the way out – the
far end should remain where it can be
used to pull the new line into the
instrument enclosure.
This view shows the fish line after
pulling. Remove tape and old cable.
ring on the existing cable. Remove each
one and prepare to install on the new
cable.
26
Page 29

▪▪▪▪▪▪▪
12. Install the parts as shown on the new
cable. This cable is a “North American”
13. Secure the new cable to the fish line,
15. Run the new cable to the AC power
type of cable, with white, black and
green conductors.
and prepare to gently pull the new cable
into the instrument.
14. Pull the fish line inside the instrument,
while feeding the new cable gently
through the threaded opening, and up
through the corner of the instrument
cabinet.
block. Push down on each tab and
install the correct wires as shown, all the
way into the aperture.
After installation, give each wire a
gentle tug to assure that it is seated
properly. If the cable “pulls out”, verify
that the cable end is not distorted, and
try again.
27
Page 30

▪▪▪▪▪▪▪
16. Be sure the black o-ring is installed into
17. Thread the gland nut and hand-tighten.
18. Using the same 22 mm wrench, tighten
19. Tie-wrap the new cable to the Ethernet
the groove on the sealing ring as
shown.
the gland nut to compress the seal
properly. Do not crush the cable. When
tight, the cable should not “give” when
tugged slightly.
cable internally, to secure it from
moving under vibration. Cut off the
loose end.
28
Page 31

▪▪▪▪▪▪▪
20. If not using a “fish”, the wire can be fed
directly. Note that the cable is fed
The AC Mains connection point is shown, with
When complete, check all connections and seals. Check power to be sure it operates properly. Re-
This photo shows a close-up view of the wiring
through a corner of the mounting
enclosure, and is easier to feed in one
direction than the other.
We recommend feeding the new AC
mains cable through the triangular
corner opening – and then into the
large round opening -- where it can
easily be located and pulled through.
European color coding. Always follow all
applicable local codes to assure safe, reliable
connection.
As a reminder, connections are as follows:
Symbol Meaning N. America Europe
L Line White Brown
Ground Green
N Neutral Black Blue
install instrument cover.
entry point.
Note the LED on the flange. This LED is not
related to AC power.
This LED will be steady green (not blinking)
when the instrument is ready. When scanning,
the LED will blink green. This will also be
mentioned in the sampling section of this
manual.
Green/
Yellow
29
Page 32

▪▪▪▪▪▪▪
Preparation for Installation:
Mounting the air tubing:
7 Air Cooling Connection Kit
Compressed Air Cooling Kit (60038416), installation
The optional air cooling kit for high ambient temperatures over 45 °C includes quick-connect fittings
that are placed in the two plugged holes. Tubing is also supplied, along with an air filter set with
regulator to remove water and oil from the compressed air supply.
Adjust the air supply volume until the temperature is below this value
This kit includes three Air Fittings, a 30 cm (11.8 inch) piece of air tubing, and 20 m (65 feet) of extra
tubing.
1. Loosen the tri clamp and pull out the round plate with the
two blind plugs.
2. Remove the two blind plugs and mount the air fittings
instead.
3. Mount the third air fitting on the inside of the plate. Use the
hole closest to the bottom of the cabinet. This is now the air
input.
4. Some of the first kits included a Silencer (Ceramic cylinder
on a short brass tube) for the exhaust. This must NOT be
mounted; it may cause a too high pressure inside the box.
5. Cut the tube to length with a clean cut.
6. Push the end of the tube into the fitting until it makes a
tight seal.
7. To remove the tube, press down the collar of the fitting
while gently pulling the tube.
Connecting the units:
8. Mount the 30 cm tube in the air input fitting on the inside of the round plate. Lead it into the
instrument, under the Mounting Tray so that the outlet is close to the opposite wall. If
needed, adjust the length of the tube.
9. Mount the plate on the instrument again, and tighten the Tri-clamp.
10. Mount a suitable length of tubing to the air out (exhaust) air fitting on the Analyzer PRO. Lead
the tube to terminate at a point where the exhaust flow of air is not objectionable to nearby
personnel.
11. ATEX rated areas may require termination of the exhaust tube to another room or outside.
Check with the customer’s Safety personnel, or the on-site ATEX-responsible person.
12. Mount a tube from the regulator to the air input on the Analyzer PRO.
30
Page 33

▪▪▪▪▪▪▪
13. Pull the knob on the regulator and turn it fully counter clockwise in order to set the pressure
to zero.
14. Connect the factory air to the water separator.
15. Slowly increase the pressure until a smooth flow is felt from the exhaust tube.
Normally a setting of app. 0.02 MPa (0.2 bar) is about right. The objective is to keep the temperature
somewhat below 65 °C.
31
Page 34

▪▪▪▪▪▪▪
The “Spoon Probe” is typically used in fluid bed
The air inlet at the base of the probe is shown.
8 Air Purge Connection (Used with “Spoon Probe”)
Air purge may be used with the MicroBundle “Spoon Probe’ which uses air purging to remove
accumulated sample from the window area, under control of the software.
Part number 60039031 must be used. Install the kit as explained above. The Analyzer PRO
MicroBundle Fiber version comes with the solenoid air control valve and fittings already mounted.
Connect the output from the regulator to the air input on the instrument.
One way valves are mounted in the air in and air out connections inside the instrument: Observe the
“in” and “out” arrow marks next to the fittings.
1. Connect the air tube from the powder probe to the air out fitting.
2. Connect the air from the regulator to the air in fitting.
Adjust the pressure for effective emptying of the spoon after measurement. Pressure range 0,3 – 0,5
MPa (3 – 5 bar, 43.5 to 72.5 PSI).
The probe is designed for a standard 1” Swagelok® crimp fitting.
dryers and other locations where sample is
conveyed in a manner where it may accumulate
on the probe and be sampled periodically.
After sampling, purge air is activated through
the purge holes, and the sample is cleared from
the sampling area, in preparation for the next
sample.
The fitting is a ¼” NPT Swagelok SS-400-1-1
fitting, or equivalent. (Qty. 1)
It is critical to remember that the supply lines
must be sized much larger that the final deliver
line to the probe. Internal friction on a long
supply line will limit the amount of gas available
to the probe, if the line is too small. The tubing
to the probe itself is ¼” (about 6mm) however
the supply lines may have to be much larger to
accommodate the full flow required.
A ground ring is provided, as samples may build up static electricity. The probe should be properly
grounded using this ring.
32
Page 35

▪▪▪▪▪▪▪
This photo shows a typical accumulation of
sample on the face of the spoon probe. This
The photo shows the internal control for the air
The user is responsible for chemical compatibility with
photo was taken in a fluid bed dryer, in
between purge cycles.
As sample accumulates, the instrument will take
a sample scan and produce sample spectra for
analysis. The scan timing must sometimes be
adjusted to the flow rate, to assure that enough
sample has accumulated.
When the purge air system is activated, the
pressure through the purge holes “blasts” the
sample from the face of the probe. While a
slight film may be left on the probe window,
this is not enough to skew spectra, and can be
ignored.
purge. This valve is controlled by Vision. A setup
screen allows setting of intervals and timing.
This shows a typical setup, though yours will
vary.
IMPORTANT NOTE:
The purge gas provided to the probe must be instrument grade, to avoid coating the probe window
with foreign substances.
Specifically, if air is provided, it should be from an “oil-less” source, and should be clean, dry, and
filtered. “Instrument-grade” air, or pure nitrogen, are two possible types of purge gas that may be
used.
the process, cleanliness of the purge gas, temperature
variation, pressure, and control over flow.
33
Page 36

▪▪▪▪▪▪▪
As a rule, it is always best to mount the exposed cable
9 Fiber Optic Probe Mounting
The MicroBundle fiber optic probe will come installed to the Analyzer PRO. It will be tested in the
final configuration, to assure good operation.
It is very important to protect the fiber optic cable, to prevent damage. While the cable can be
replaced, this is quite expensive and should be avoided. Careful mounting and handling are
important. Never let a fiber optic cable hang where it can be snagged by equipment, crushed, or
otherwise damaged.
Fiber optic cables, if not protected, are susceptible to various types of damage. These include:
Abrasion of the protective covering
Repetitive flexing of unsupported cable lengths
Breakage of fibers by tight bends
Compression of the fiber bundle
Physical damage from equipment operating in the area
Inadvertent damage from untrained personnel
The minimum bend radius of the fiber bundle is approximately 12 inches, or 30 mm. Do not bend
tighter than this.
Always handle the fiber gently, and do not let it be compressed, abraded, or twisted.
in a cable tray, or other means of protecting the cable
from damage.
There are various suppliers of cable trays. The one
shown is manufactured by Panduit. Please find a
supplier in your area, and protect the fiber optic cable
in a suitable cable tray.
34
Page 37

▪▪▪▪▪▪▪
10 Ethernet Connection
The cable type is as follows:
Patch cable:
The Analyzer PRO is shipped with a two-meter length of Ethernet communication cable, wired into
the instrument and tie-wrapped in place. Do not remove the tie wraps or attempt to change the
cable. The cable should last the life of the Analyzer PRO Instrument.
• Category 5e, SF/UTP Patch 4P
• IEC 61156-6 LSHT
(or equivalent)
The exposed end of the Ethernet cable has an
RJ-45 plug like that shown in the photo at right.
The exposed end should be connected to the
LAN, and the connection should be shielded
from wash-down, dirt, vibration, and
tampering.
It is advisable to place the Analyzer PRO within
the same “network neighborhood” as the
computer on which Vision is installed. They
should be under the same network “subnet
mask”.
Because network setups vary dramatically from company to company, Metrohm cannot provide
troubleshooting for a specific network. That is the responsibility of company IT and Network Support
personnel.
As a rule, if the Analyzer PRO can communicate locally (whether through a local router or other
means) then it is capable of network communication through a Local Area Network (LAN). Wide Area
Networks (WAN) may pose problems due to different subnet masks, security issues, or firewalls
between different parts of the network. Please consult your local support personnel for help with
these issues.
It is very important to know if the connection cable is a “patch” or “crossover” type of cable. While
the cables are usually marked in some manner, one way to verify is to view the ends of the cable
together.
When held with both ends as shown,
conductors up, both ends of a patch cable will
appear identical.
The “solid” orange, blue, green and brown will
be in the same positions on each jack.
The striped wires may appear white, as in this
photo, or the stripes may appear more clearly.
35
Page 38

▪▪▪▪▪▪▪
Crossover Cable:
When held with both ends as shown,
conductors up, the wire patterns are different.
Note the left plug – the order of solid wires is
orange, blue, green, and brown.
On the right plug, the order of solid wires is
green, brown, orange, and blue.
On a crossover cable, the pairs are designed to
“cross over” the signal when devices are
hooked directly to each other, instead of
through a network switch.
Devices area available with can plug into a cable and change the cable type from crossover to patch,
or the other direction. In the latest networks, the type of cable may not matter, as the system sense
the signal and corrects the pin signals as required. This is called “automatic MDI/MDI-X
configuration”.
Because of the many variations in network design, capability, permissions, and administration, a full
discussion is not possible in this manual. The field is very dynamic, and we recommend consultation
with network personnel on these issues if problems arise.
36
Page 39

▪▪▪▪▪▪▪
11 Safety and Power-up
It is allowable to release the mounting clamps
When dismounting the Analyzer PRO, avoid
The Analyzer PRO is designed for safe operation in a process environment, and is well-sealed against
dust, dirt, and wash-down. Do not open the housing or loosen any cable glands, as this may
compromise the sealing of the unit.
which secure the unit, as the housing is sealed
behind where the clamps mount. If removing the
clamps, always use adequate safety precautions
to prevent personal injury, or damage to the
Analyzer PRO instrument.
Do not ever open the Analyzer PRO instrument
with power applied, as hazardous voltages are
present inside the instrument. Personal injury
may result from contact with live power. Always
use lockout procedures to avoid personal injury.
stressing or damaging the electrical lines in any
way. As the instrument is moved, be sure there is
adequate slack in the AC mains (power) and
communications cables. If necessary, these may
be disconnected at the external connecting
points for each.
37
Page 40

▪▪▪▪▪▪▪
1. Click on the Start icon, then click on
3. Vision prompts the user to create a new
12 Connection to Vision Software
Analyzer PRO is designed to operate with Vision software. Vision requires a User ID and password for
entry as a security measure. Each user must operate within a “Project” inside Vision. The procedure
for creating a Project will be shown. Inside the Project, Vision uses a Data Collection Method (DCM)
to communicate with the Analyzer PRO.
Please follow this procedure to connect:
Vision in the menu as shown.
Alternatively, if a Vision icon appears on
the desktop, double-click it to open
Vision.
2. The Vision log-in box is shown. Type in
the default User ID “NIRS” and then the
default password, “NIRS”.
Click “OK”. Vision will open.
Project. Enter the name of the Project,
using a logical name such as that
shown, or a name related to the
product being analyzed.
The name can be up to 16 characters,
with no spaces. It may not contain
characters like “/”, “+”, “*”, or other
such characters. The name will be
shown in lower-case.
Location may be left empty, and Vision
will place the Project database in the
default Vision directory.
38
Click “OK”.
Page 41

▪▪▪▪▪▪▪
4. Vision asks to create a Project database
as shown. If this location is acceptable,
5. Vision opens a screen for configuration
6. Select and highlight the instrument with
7. Vision prompts for connection to the
click “OK”.
As a rule it is best to use the default
location, unless there is an over-riding
reason to use another location.
of data sources. This enables
communication with the instrument
through Vision.
Highlight “NIRSystems DDA Analyzer
PRO Instrument Driver” and click
“Configure”.
the correct chassis ID number.
If there is only one instrument on the
network, it will be shown by default, as
shown at right.
Click “OK” to return to the previous
screen. Then click “OK” again. This sets
the communication channel to the
Analyzer PRO instrument.
instrument. Click on “Acquire new Data”
to connect.
39
Page 42

▪▪▪▪▪▪▪
8. The Analyzer PRO instrument
9. When finished, the screen
runs an automatic selfchecking routine, which
appears as shown. No operator
input is required.
indicates successful testing.
Click on “Close” to proceed.
10. Vision requests a valid Data Collection
Method (DCM) in this screen. Since no
DCM has been created yet, click on
“New”.
40
Page 43

▪▪▪▪▪▪▪
11. The Profess Analyzer
sends its
12. Vision displays the selection box for the DCM.
13. Vision checks to verify that the instrument is
configuration to the
Data Collection
Method – this is a
“Window Reflection”
system, as shown in
the Sampling system
“Module” box.
The wavelength
range is 1100-1650
nanometers.
Reference
Standardization is a
default for this model,
and the box is
checked.
The “Method” name is empty when the DCM is displayed. Enter a name for the method. The
name used here is “Window Refl”. Spaces are allowed in the DCM name.
Click “OK” when finished.
Click on the method just created, then click on
“OK”.
You may hear some clicking noises from the
Analyzer PRO instrument as it executes internal
checks. These noises are normal.
stable. If the Analyzer PRO was just turned on,
this may take some time, depending on ambient
temperature.
Once the instrument is stabilized, this box is
removed from the screen.
41
Page 44

▪▪▪▪▪▪▪
14. Vision displays the instrument
15. When the system is ready to run, the
Please proceed to the section on Analyzer PRO Diagnostics.
configuration, so the user may confirm
that this is the correct instrument.
This information is used to create a path
in the Diagnostic Database.
Diagnostics menu will become active.
42
Page 45

▪▪▪▪▪▪▪
13 Diagnostics
1. Please verify that the
Diagnostics are provided to assure ongoing performance of the Analyzer PRO instrument. Upon each
connection to the instrument, Self-Test is performed automatically. The instrument monitors itself,
and will alert the operator in the event of malfunction.
It is wise to institute ongoing testing to monitor instrument performance and operation. The
frequency for this testing depends upon application and usage, and should be set by the System
Manager and other personnel who are preparing the system for use. This team of people will have
the best information on frequency of use, and the need for ongoing testing.
The tests are quite similar for each instrument configuration; however there are small differences in
how the standards are presented. Therefore this manual gives specific directions for each
configuration. Find the configuration that will be used, and follow the directions accordingly.
Tests are described below.
13.1 Window Reflection
First, verify that the Data Collection Method is correctly set up.
Sampling System appears as
shown below, in the area
marked by the box.
There is no need to set “Cell”
or Detector” as these
selections default to the
proper settings.
2. Click on OK if setting up the DCM, then select it in the “Select Data Collection Method”
window as shown in the previous section of this manual.
If using the View DCM command, simply click on “Close”.
13.1.1 Performance Test
It is wise to run Performance Test to verify that the instrument is fully warmed up and operating
correctly. Follow these steps:
43
Page 46

▪▪▪▪▪▪▪
1. Click on “Analyzer PRO Setup/Diagnostic”, then “Run
2. Vision displays the Instrument
Performance Test”.
Configuration box. This information
is used to set up the Diagnostic
Database entries for this instrument.
If correct, click on “OK”.
This box is shown upon each initial
connection, and is not shown on
subsequent diagnostic tests, as long
as the instrument has remained
connected to Vision.
3. Vision asks which fiber should be used for the
test. The test defaults to the Sample fiber. Do not
click yet.
4. When testing the sample channel, always place
the R80 standard on the sample window. Click
on “Sample” to start the test.
Because of the large spot size, it is not necessary
to orient the sample in any particular direction.
Simply center it over the window as shown.
NOTE: We advise removing the standards when
not in use. The intense light beam can warm the
standards considerably, which will change their
photometric response. Please place the standards
on the window only for current testing, and
remove them promptly when finished.
44
Page 47

▪▪▪▪▪▪▪
5. When the test is finished,
the split-screen display will
6. The tabulated results show
appear as shown. (The test
normally takes 9-10 minutes
in this configuration.)
Double-click in the lower
right quadrant to see the
tabulated results.
these items:
• Scan: 10 is the default value
• EOC: Errors on communication this will be “0” nearly all the time.
• P-P: Peak to Peak noise
• Minimum: Magnitude of lowest-going noise peak
• Wavelength: Location of negative peak
• Maximum: Magnitude of highest-going noise peak
• Bias: Baseline offset of noise scans
• RMS: Root-mean-square value of P-P
• Gain: Not used on this instrument
45
Page 48

▪▪▪▪▪▪▪
7. The “OpQual” tab gives
8. If a printed copy is needed, click on “Print Report”.
1. Click on “Analyzer PRO Setup/Diagnostic”, then “Create
acceptance specifications,
along with actual results
and a “Yes/No” indicator to
test status.
A copy is automatically saved to the Vision Diagnostic
Database. Click on “Close Report” when finished.
NOTE: We advise removing the standards from the sample window when not in use. The intense
light beam can warm the standards considerably, which will change their photometric response.
Please place the standards on the window only for current testing, and remove them promptly when
finished.
13.1.2 Reference Standardization
Reference Standardization is a method to set the photometric scale of the instrument to a known,
repeatable level. Ideally, the instrument reference scale should be set so that 100% reflectance is
equivalent to zero (0) Absorbance. This facilitates transfer of models from one instrument to another
of the same optical sampling geometry.
In practice, it is quite difficult to set the scale exactly, due to issues of cleanliness, temperature, and
atmospheric influences. Fortunately, NIR instruments normally use mathematical and chemometric
modeling methods that compensate for minor photometric scale differences between instruments.
Reference Standard”.
This test is required to set the photometric scale to a known
absorbance value.
46
Page 49

▪▪▪▪▪▪▪
2. Vision shows this selection box, marked
“Select ERC Correction File”.
3. Vision prompts the user to place the 80%
4. Click “OK” when the standard is in
5. Vision takes a scan of the
The term “ERC” stands for “External
Reference Correction”, which is another
term for Reference Standardization.
Essentially, this is a method to
mathematically correct the instrument
reference to the equivalent of 100%
reflectance.
From the CD or DVD drive, highlight the
RSS1xxxx file, then click “Open”.
reflectance standard (R801xxxx) from the
XC-1000 set over the sample window.
position.
internal instrument reference
path. This may take several
minutes. Some clicking of the
optical switch assembly will be
audible. Messages are shown at
the lower left corner of the
Vision screen indicating actions.
Click “OK” to have Vision plot
the file spectrum of the Certified
80% Reflectance Reference
standard, from the CD.
47
Page 50

▪▪▪▪▪▪▪
6. Vision shows the spectrum of the
7. Vision plots the correction
9. Vision asks to upload the new
certified 80% Reflectance
Standard spectrum, plotted from
1100-1650nm.
Chick “OK” to plot the spectrum
of the correction.
spectrum in dark green. This
correction spectrum will be
applied to the internal reference.
Click “OK” to apply the
correction.
8. Vision applies the correction,
shown in purple.
Click “Yes” to save the ERC to
the Diagnostic Database.
ERC (Reference Standardization)
to the Analyzer PRO instrument.
Click “Yes” to proceed.
48
Page 51

▪▪▪▪▪▪▪
10. Vision loads the ERC (Reference
Standardization) file to the
11. This enlarged plot shows the full
instrument.
Click “Print Report” if verification
is needed. Click “Close Report”
when finished.
Reference Standardization.
Further explanation may help the
user understand what is taking
place.
The magenta plot at the top is a
raw absorbance spectrum of the
R80 standard, as measured
though the instrument fiber
paths.
The absorbance level is too high,
due to fiber absorbance. This will
be corrected using the certified
spectrum of the R80 from the
CD.
The dark green spectrum is correction required to read the certified 80% standard correctly on this
instrument. By applying this correction, a true spectrum of the R80 will be displayed on this
instrument.
The purple spectrum is the resulting, corrected spectrum of the R80 standard, after correction.
There is another mathematical correction which is applied, but that is not shown during Reference
Standardization. The difference between the spectrum of the R80 standard and 100% reflectance is
known, and is also applied to the reference as sample spectra are acquired. The net result is that
sample spectra appear as if taken against a perfect 100% reflective background. Since this is done on
each Analyzer PRO instrument, spectra and models should transfer with minimal baseline correction
required.
When correcting the reference, there will always be slight correction differences due to fiber position,
placement of the standard, temperature, dust, and other factors. Normally the correction will be
good to within several hundredths of an absorbance unit, as illustrated above. Math treatments are
used to correct for the resulting minor baseline effects.
49
Page 52

▪▪▪▪▪▪▪
1. Click on “Analyzer PRO Setup/Diagnostic”, then “Run
2. The default number of scans is 10. The default
3. The Standards set contains a mini-CD
5. Vision requests that the user place the
6. Verify that the serial number of the standard is
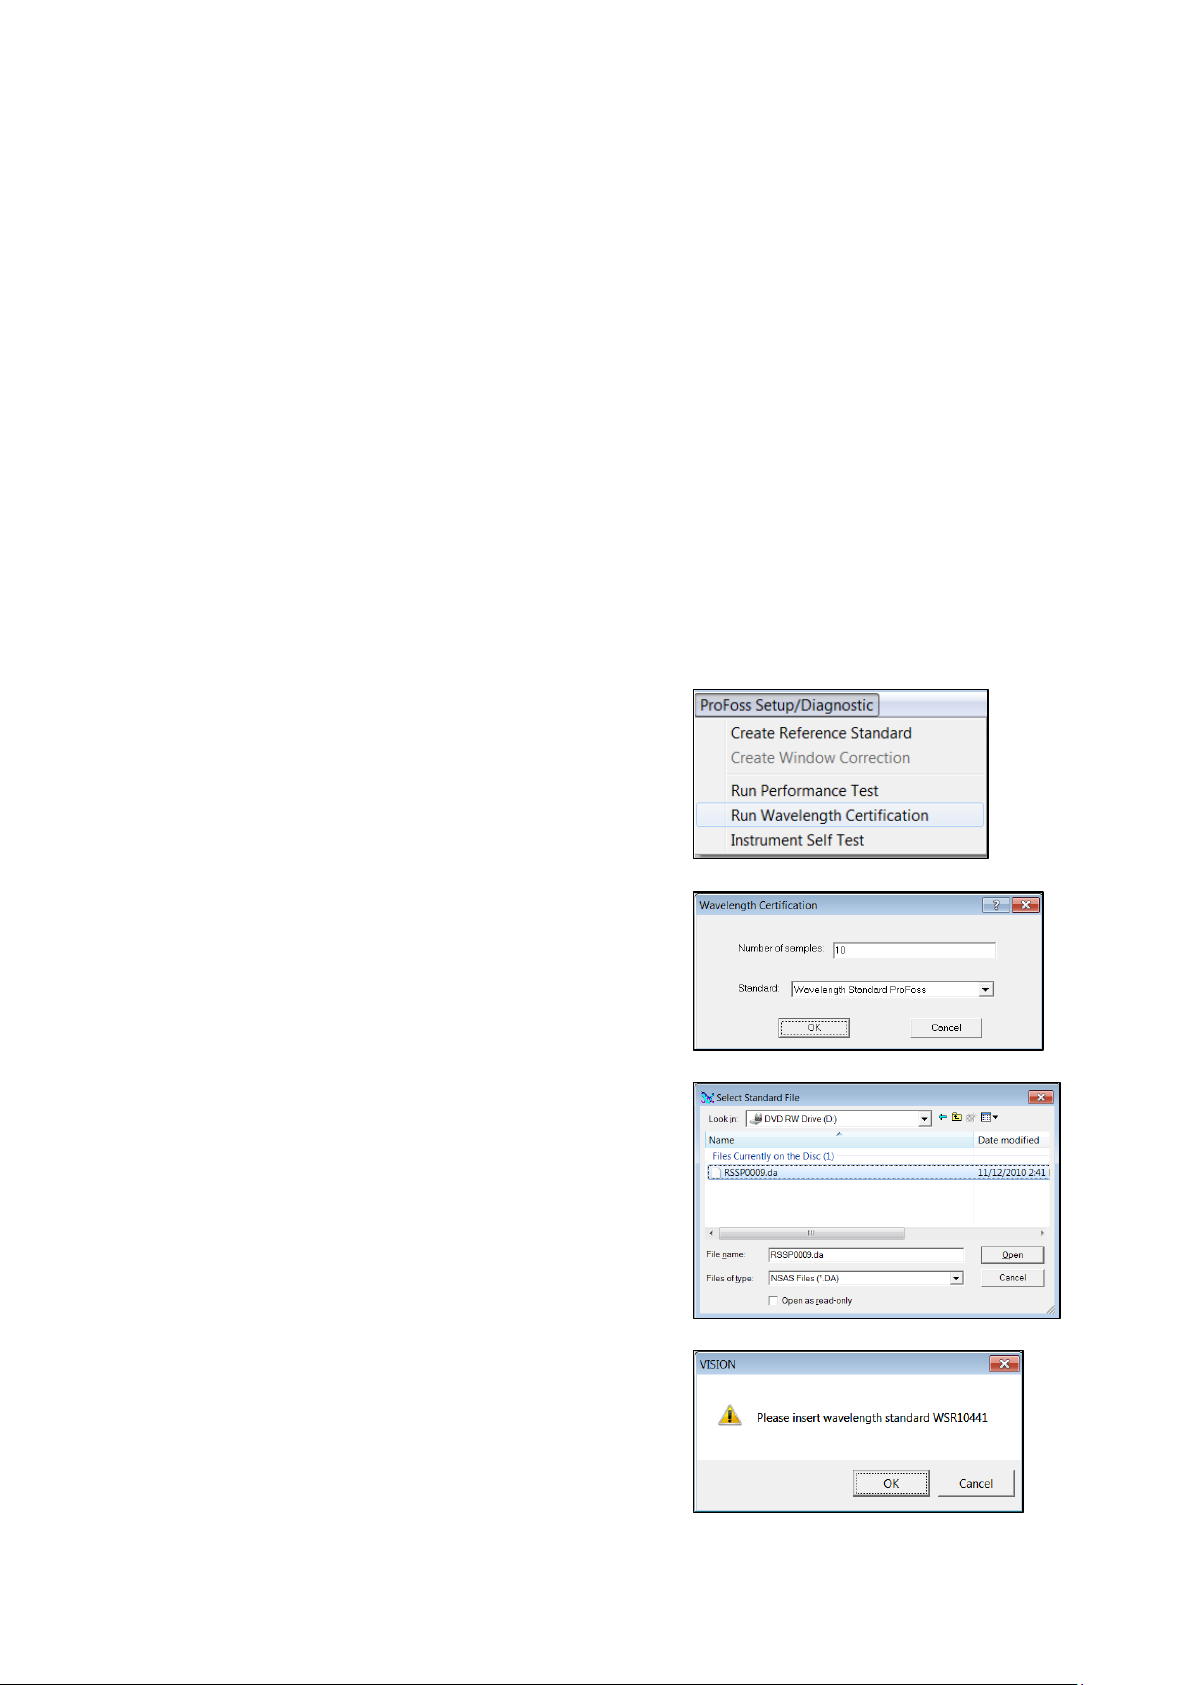
13.1.3 Wavelength Certification
This test verifies that the wavelength scale of the Analyzer PRO meets parameters specified by the
U.S. National Institute of Standards and Technology (N.I.S.T.) for NIR wavelength response using rareearth standards.
Wavelength Certification”.
selection is “Wavelength Standard Analyzer PRO”.
Click “OK”.
with the standards file on it. Click on this
file, then click “Open”.
Vision initiates the test.
4. Vision begins taking an instrument reference spectrum.
wavelength standard onto the sample window.
Do not click “OK” yet.
50
the same as that shown in the Vision prompt box.
Click “OK” when ready. Vision will start the test.
Page 53

▪▪▪▪▪▪▪
7. This test runs in
about two
8. There are four
N.I.S.T. uncertainty is applied for rare-earth-type wavelength standards, shown as a
9. If a printed copy is needed, click on “Print Report”.
minutes. Splitscreen results
appear as
shown.
Double-click on
the lower right
quadrant to see
full tabulated
results.
wavelength
peaks used,
which serve to
characterize the
full wavelength
scale of the
instrument.
tolerance of +/-1.0 nm.
The Pass result is shown at the bottom of this report for each wavelength peak tested.
A copy is automatically saved to the Vision Diagnostic Database.
Click on “Close Report” when finished.
NOTE: We advise removing the standards from the sample window when not in use. The intense
light beam can warm the standards considerably, which will change their wavelength response.
Please place the standards on the window only for current testing, and remove them promptly when
finished.
51
Page 54

▪▪▪▪▪▪▪
1. Please verify that the Sampling
For testing purposes, we suggest the probe end be securely
13.2 MicroBundle Fiber Optic Sensing
First, verify that the Data Collection Method is correctly set up.
System appears as shown below,
in the area marked by the box.
Note that the drop-down menu
shows three different types of
probes which may be used. We
will use the Interactance
Reflectance Probe with Purge.
This probe is normally configured
with a “Purge” time and a “Settle”
time set in the DCM. The exact
settings will depend upon a
number of application factors,
and are quite product-specific.
Some experimentation may be
required to find the best
combinations.
For our purposes now, we will leave the purge and settle settings at “0”.
2. Click on OK if setting up the DCM, then select it in the “Select Data Collection Method”
window as shown in the previous section of this manual.
If using the View DCM command, simply click on “Close”.
13.2.1 Performance Test
It is wise to run Performance Test to verify that the instrument is fully warmed up and operating
correctly.
clamped in place.
This photo shows a common testing clamp, which attaches to
the side of a cart in the laboratory. Using this method, the fiber
optic probe can be placed upright, and the reflectance
standard cells are held securely in place by gravity. This avoids
any gaps, or inaccuracy caused by too much compression.
The clamp is a Double-Buret Clamp, part number 05-779Q,
available from Fisher Scientific. At the time of writing, the price
is less than $60 US.
Follow these steps to run Performance Test:
52
Page 55

▪▪▪▪▪▪▪
1. Click on “Analyzer PRO Setup/Diagnostic”, then “Run
Performance Test”.
2. Vision displays the Instrument
This shows the correct placement of the reflectance reference on the
Configuration box. This information is used
to set up the Diagnostic Database entries
for this instrument.
If correct, click on “OK”.
This box is shown upon each initial
connection, and is not shown on
subsequent diagnostic tests, as long as the
instrument has remained connected to
Vision.
3. Vision asks which fiber should be used for the test.
The test defaults to the Sample fiber. (Do not click
yet.)
Be sure Reflectance probe – the one used for
calibration – is on the fiber, and the reflectance
standard is in place as shown in the photo.
probe.
NOTE: the label may be on the top plate, instead of on the side.
Let gravity hold the reference in place – do not apply pressure, as this
could compress the reference material and change its reflectivity.
As a precaution, always keep the probe window and the reflectance
reference very clean. Do not allow dust, dirt, or liquids to contaminate
the surface. Consistent spectral performance depends upon clean
surfaces.
4. Click on “Sample” to start the test.
53
Page 56

▪▪▪▪▪▪▪
5. When the test is finished, the
6. The tabulated results show these
items:
split-screen display will
appear as shown. (The test
normally takes 9-10 minutes
in this configuration.)
Double-click in the lower
right quadrant to see the
tabulated results.
• Scan: 10 is the default value.
• EOC: Errors on communication – this will be “0” nearly all the time.
• P-P: Peak to Peak noise
• Minimum: Magnitude of lowest-going noise peak
• Wavelength: Location of negative peak
• Maximum: Magnitude of highest-going noise peak
• Bias: Baseline offset of noise scans
• RMS: Root-mean-square value of P-P
• Gain: Not used on this instrument
54
Page 57

▪▪▪▪▪▪▪
6. If a printed copy is needed, click on “Print Report”.
A copy is automatically saved to the Vision Diagnostic
1. Click on “Analyzer PRO Setup/Diagnostic”, then “Create
2. Vision shows this selection box, marked
Database. Click on “Close Report” when finished.
NOTE: We advise removing the standards from the sample window when not in use. The intense
light beam can warm the standards considerably, which will change their photometric response.
Please place the standards on the window only for current testing, and remove them promptly when
finished.
13.2.2 Reference Standardization
Reference Standardization is a method to set the photometric scale of the instrument to a known,
repeatable absorbance level. Ideally, the instrument reference scale should be set so that 100%
reflectance is equivalent to zero (0) Absorbance. This facilitates transfer of models from one
instrument to another of the same optical sampling geometry.
In practice, it is challenging to set the scale exactly, due to issues of cleanliness, temperature, and
atmospheric influences. However, the scale can be set closely. Fortunately, NIR instruments normally
use mathematical and chemometric modeling methods that compensate for minor photometric scale
differences between instruments.
Reference Standard”.
This test is required to set the photometric scale to a known
absorbance value.
“Select ERC Correction File”.
The term “ERC” stands for “External
Reference Correction”, which is another
term for Reference Standardization.
Essentially, this is a method to
mathematically correct the instrument
reference to the equivalent of 100%
reflectance.
Select the RSSP file, then click “Open”.
55
Page 58

▪▪▪▪▪▪▪
3. Vision takes a scan of the
4. Vision plots the stored
internal instrument
reference path.
Click “OK” to have Vision
plot the file spectrum of
the Certified 99%
Reflectance Reference
standard, from the CD.
file of the Certified 99%
Reflectance Reference
standard.
Position the Certified
99% Reflectance
Reference on the probe
end, and click “OK”.
5. Vision prepares to scan
the Certified 99%
Reflectance Reference.
Click “OK”. This may take
several minutes to
complete.
56
Page 59

▪▪▪▪▪▪▪
6. Vision plots the spectrum
of the internal instrument
7. Vision calculates the
8. Vision asks to save the
reference in magenta.
Note that the wavelength
scale is that of the
instrument, 11001650nm. This is normal.
The overall plot is scaled
from 400-2500 nm, the
useful range of the
Certified 99%
Reflectance Standard.
Click on “OK” to
proceed.
correction needed to
adjust the instrument
reference as required.
This is shown in green.
Click “OK” to apply the
correction.
correction (called the
“ERC”) to the Diagnostic
Database. Click “OK”.
57
Page 60

▪▪▪▪▪▪▪
9. Vision asks to upload the
10. When finished, Vision
The plots on this diagram
ERC to the instrument for
use when taking spectra.
Click “OK”.
indicates that the
correction was properly
loaded to the instrument.
If a printed copy is
needed, click on “Print
Report”.
bear further explanation to
help the user understand
what is taking place.
The magenta plot at the
bottom is a raw
absorbance spectrum of
the internal reference fiber
of the instrument. This
should not be used as a
reference in this form, for
two reasons:
First, the absorbance is negative, which means the reference would appear artificially brighter than
samples. Second, the spectral shape is not a flat line, and would impart unwanted artifacts into the
sample spectrum. Correction is required.
The cyan (light blue) spectrum is the Certified 99% Reflectance Standard, as measured on a
controlled, calibrated master spectrophotometer. This is close to 100% reflectance, though not
exactly. By measuring on the master instrument, the difference between the instrument reference
fiber and the Certified 99% Reflectance Standard is calculated, and is stored for correction purposes.
The correction between the Certified 99% Reflectance Standard and the instrument reference fiber is
applied. This correction is the green spectrum at the top of the plot. When this correction is applied,
the resulting spectrum is the purple line, overlaying the cyan plot of the Certified 99% Reflectance
Reference.
Vision also applies the mathematical correction required to make the instrument reference read at
58
Page 61
▪▪▪▪▪▪▪
the 100% reflectance level, though this is not shown on the correction plot. By applying this
1. Click on “Analyzer PRO Setup/Diagnostic”, then
3. The XC-2400 Standards set contains a mini-CD
4. Vision requests that the user place the
mathematical correction, sample spectra appear as if taken using an ideal 100% reflective
background reference.
When correcting the reference, there will always be slight correction differences due to fiber position,
placement of the standard, temperature, dust, and other factors. Normally the correction will be
good to within several hundredths of an absorbance unit, as illustrated above. Math treatments are
used to correct for the resulting minor baseline effects.
NOTE: We advise removing the standards from the sample window when not in use. The intense
light beam can warm the standards considerably, which will change their photometric response.
Please place the standards on the window only for current testing, and remove them promptly when
finished.
13.2.3 Wavelength Certification
This test verifies that the wavelength scale of the Analyzer PRO meets parameters specified by the
U.S. National Institute of Standards and Technology (N.I.S.T.) for NIR wavelength response using rareearth standards.
“Run Wavelength Certification”.
2. The default number of scans is 10. The default
selection is “Wavelength Standard Analyzer PRO”.
Click “OK”.
with the standards file on it. Click on this file,
then click “Open”.
Vision initiates the test.
wavelength standard onto the probe.
Do not click “OK” yet.
59
Page 62

▪▪▪▪▪▪▪
5. Verify that the serial number of the standard is the
6. This test runs in
7. If a printed copy is needed, click on “Print Report”.
same as that shown in the Vision prompt box. (A tie
wrap may be present to hold the cup in place.)
Click “OK” when ready. Vision will start the test.
about two
minutes.
Tabular results
appear as
shown.
There are four
wavelength
peaks used,
which serve to
characterize the
full wavelength
scale of the
instrument.
A copy is automatically saved to the Vision Diagnostic Database.
Click on “Close Report” when finished.
NOTE: We advise removing the standards from the sample window when not in use. The intense
light beam can warm the standards considerably, which will change their wavelength response.
Please place the standards on the window only for current testing, and remove them promptly when
finished.
13.3 Direct Light Sampling
The Analyzer PRO Direct Light instrument setup is somewhat simpler than the others, as the sampling
method does not lend itself to fine adjustments of “absolute” photometric scale or wavelength. The
instrument is quite stable in both respects.
First, verify that the Data Collection Method is correctly set up. Please verify that the Sampling System
appears as shown below, in the area marked by the box.
60
Page 63
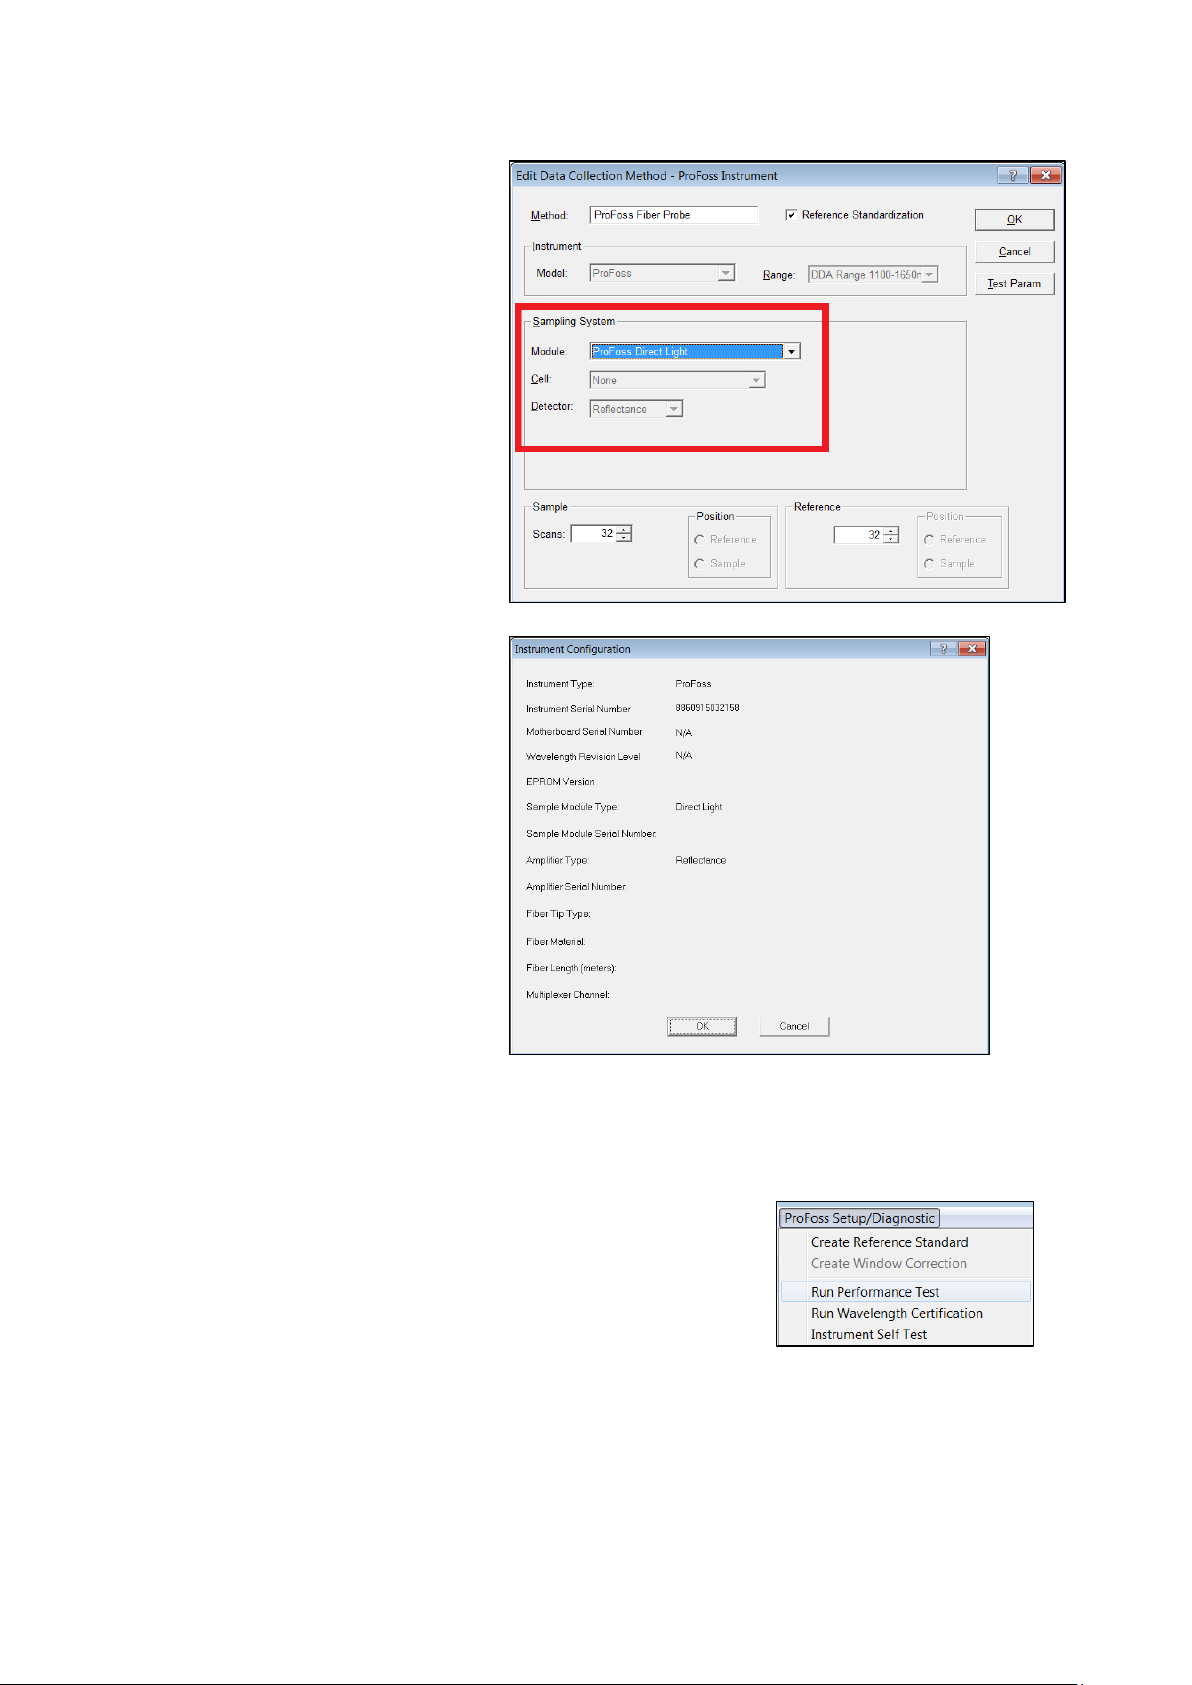
▪▪▪▪▪▪▪
1. Please verify that the
Sampling System appears as
2. Verify that the instrument is
1. Click on “Analyzer PRO Setup/Diagnostic”, then “Run
shown below, in the area
marked by the box.
There is no need to set “Cell”
or Detector” as these
selections default to the
proper settings.
correctly shown, and that the
Sample Module Type is
“Direct Light”.
Click “OK”.
13.3.1 Performance Test
Follow these steps to run Performance Test:
Performance Test”.
61
Page 64

▪▪▪▪▪▪▪
2. Vision displays the Instrument
3. Vision asks which fiber should be used for the
Configuration box. This information
is used to set up the Diagnostic
Database entries for this instrument.
If correct, click on “OK”.
This box is shown upon each initial
connection, and is not shown on
subsequent diagnostic tests, as long
as the instrument has remained
connected to Vision.
test. The test defaults to the Sample fiber. (Do
not click yet.)
The Direct Light system should be tested in the
“Reference” position. Click on “Reference” to
begin the test. The system defaults to Lamp 1.
You may hear the instrument making noises as
the Optical Switch begins its operation. A note
will be shown at the bottom of the Vision
screen explaining each step.
NOTE: While the “Sample” position could be used for Performance Test, this is not
recommended with Direct Light. There are several reasons for this. First, a bright, 99%
Spectralon sample without a quartz window should be used. Second, the distance should be
75mm (about 3”) from the sample window. If the Spectralon is used frequently for
Performance Testing, it will be very difficult to keep it clean, and this may impact other
instrument adjustments and results.
As a precaution, always keep the probe window very clean. Do not allow dust, dirt, or liquids
to contaminate the surface. Consistent spectral performance depends upon clean surfaces.
62
Page 65

▪▪▪▪▪▪▪
4. 4. When the test is finished,
the split-screen display will
5. This is a typical set of
appear as shown. (The test
normally takes about 5
minutes in this
configuration, on the
Reference Channel.)
Double-click in the lower
right quadrant to see the
tabulated results.
Performance Test results for
the Reference Channel. The
tabulated results show
these items:
• Scan: 10 is the default value.
• EOC: Errors on communication – this will be “0” nearly all the time.
• P-P: Peak to Peak noise
• Minimum: Magnitude of lowest-going noise peak
• Wavelength: Location of negative peak
• Maximum: Magnitude of highest-going noise peak
• Bias: Baseline offset of noise scans
• RMS: Root-mean-square value of P-P
• Gain: Not used on this instrument
63
Page 66

▪▪▪▪▪▪▪
6. To see the test results and acceptance
7. If a printed copy is needed, click on “Print
specifications, click on the “OpQual” tab at
the bottom of the screen. This is a typical
result.
Report”.
A copy is automatically saved to the Vision
Diagnostic Database. Click on “Close Report”
when finished.
13.3.2 Reference Standardization (External Reference Correction)
Reference Standardization is a method to set the photometric scale of the instrument to a known,
repeatable level. Ideally, the instrument reference scale should be set so that 100% reflectance is
equivalent to zero (0) Absorbance. This facilitates transfer of models from one instrument to another
of the same optical sampling geometry.
In the case of the Analyzer PRO Direct Light System this method is not practical for a variety of
reasons, including operating distance, possible window reflections, temperature variations, and other
optical factors. Instead, the Direct Light system is standardized on a special 99% Spectralon®
standard. Once standardized, the system will maintain its settings for the life of the lamp, and should
remain very stable. The Spectralon standard should be kept in a protected, clean location, so it will be
ready when required at the next lamp change or major service interval.
Fortunately, NIR instruments normally use mathematical and chemometric modeling methods that
compensate for minor photometric scale differences between instruments. This permits consistent
spectral readings between like systems. The method for Direct Light is called “ERC” for External
Reference Correction”.
Because this function is performed at the factory, it is not covered in this manual. If you have a
Analyzer PRO Direct Light System, please contact your local Metrohm office for more information on
External Reference Correction.
64
Page 67

▪▪▪▪▪▪▪
14 Sampling
First, click on the Reference icon, which is a white cuvette.
To save the sample spectrum, click on the blue diskette icon.
The green button on the housing is provided to take and store
Once Vision Diagnostics have been performed, the user may take reference and sample spectra. In
Data Acquisition, these actions are performed.
When the Reference spectrum is finished, continue below.
Next, click on the Sample icon, which is a green cuvette.
When the Sample spectrum is shown on screen, it may be saved.
Vision will ask for product and sample names, and other
information. Please see the Vision manual for full information on
saving spectra.
sample spectra in real time, from the process floor. This is useful
when calibrating the system. In such cases, a “grab sample” may
be taken for lab analysis, and a spectrum taken immediately, so
that the lab analysis corresponds directly to the sample
spectrum.
This sampling method makes the calibration data much more
precise, and minimizes time lags and resulting changes to the
product stream. It is important to note the time and date of the
grab sample, so it can be correlated to the correct spectrum that
will be stored.
When a sample is desired during Routine Analysis, press the green button, and Vision will take a
sample spectrum. The spectrum will be stored in a Product called “***SaveKeyPressed***” and will be
consecutively numbered. The acquisition time will be saved in the Properties box for that sample.
65
Page 68

▪▪▪▪▪▪▪
15 Standards and Approvals
The Analyzer PRO™ instrument is CE labeled and complies with the following directives:
• EMC Directive (2004/108/EC)
• Low Voltage Directive (LVD) (2006/95/EC)
• RoHS Directive (2002/95/EC) (Restriction of Hazardous Substances)
• Packaging and packing and waste Directive (94/62/EC)
• WEEE Directive (2002/96/EC) (Waste Electrical and Electronic Equipment)
• ATEX Directive, (94/9/EC), Zone 20 (EN 61241-1-2004 – Explosion safety for DUST-Protection
by enclosure tD)
• IECEx, Zone 20 (IEC 61241-1-2004 – Explosion safety for DUST-Protection by enclosure tD)
• REACH Directive (1907/2006/EC) (Registration, Evaluation, Authorisation and Restriction of
Chemicals)
• Developed and produced according to FOSS ISO approval, ISO 9001.
66
 Loading...