

Page 1

HP StoreFront Analytics Pack for VMware vCOPS™ 1.1
User Guide
Abstract
This guide provides the information you need to install and use HP StoreFront Analytics Pack for VMware vCOPS™ 1.1 to
monitor performance for HP 3PAR Storage Systems, and is intended for system and storage administrators who monitor and
direct system configurations and resource allocation for HP 3PAR Storage Systems.
HP Part Number: QR482-96548
Published: June 2014
Edition: 3
Page 2

© Copyright 2014 Hewlett-Packard Development Company, L.P.
Confidential computer software. Valid license from HP required for possession, use or copying. Consistent with FAR 12.211 and 12.212, Commercial
Computer Software, Computer Software Documentation, and Technical Data for Commercial Items are licensed to the U.S. Government under
vendor's standard commercial license.
The information contained herein is subject to change without notice. The only warranties for HP products and services are set forth in the express
warranty statements accompanying such products and services. Nothing herein should be construed as constituting an additional warranty. HP shall
not be liable for technical or editorial errors or omissions contained herein.
Page 3

Contents
1 Introduction...............................................................................................5
2 Installation.................................................................................................6
Installing the software................................................................................................................6
Windows Installation Procedure.............................................................................................6
Linux Installation Procedure...................................................................................................7
vApp Installation Procedure...................................................................................................7
Configuring a Storage System (adding an adapter instance)......................................................8
Licensing............................................................................................................................9
Checking the software version....................................................................................................9
Troubleshooting the software installation....................................................................................10
Notes....................................................................................................................................11
Resource Kinds..................................................................................................................11
Adapter Kind....................................................................................................................11
Adapter Instances..............................................................................................................12
Resource metrics reported for HP 3PAR resources...................................................................13
3 Dashboards.............................................................................................16
Dashboard color coding..........................................................................................................16
Editing a dashboard...............................................................................................................16
Editing a dashboard widget................................................................................................16
HP Storage Monitoring dashboard............................................................................................16
HP Storage Monitoring dashboard Interactions......................................................................18
STORAGE SYSTEMS widget.................................................................................................19
HEALTH widget..................................................................................................................20
Storage Systems widget icons.........................................................................................20
HEALTH STATUS widget......................................................................................................22
HEAT MAP widget.............................................................................................................22
HP STORAGE SYSTEM ALERTS widget..................................................................................25
METRICS widget................................................................................................................25
50 LEAST HEALTHY HP 3PAR RESOURCES widget..................................................................26
HP Storage Troubleshooting dashboard.....................................................................................27
HP Storage Troubleshooting dashboard Interactions................................................................28
VIRTUAL MACHINES widget...............................................................................................28
VM TO STORAGE MAPPING widget....................................................................................28
MAPPING DETAILS widget..................................................................................................30
METRIC GRAPH (SELECT RESOURCE FROM VM TO STORAGE MAPPING) widget.....................31
ALERTS widget...................................................................................................................32
HP Storage Performance dashboard..........................................................................................33
CAPACITY UTILIZATION (%) - TOP-5 VOLUMES widget...........................................................34
IOPS - TOP-5 VOLUMES widget...........................................................................................34
RESPONSE TIME (MS) - TOP-5 VOLUMES widget...................................................................35
QDEPTH - TOP-5 VOLUMES widget......................................................................................35
IOPS -TOP-5 FC PORTS widget.............................................................................................35
RESPONSE TIME (MS) - TOP-5 FC PORTS widget...................................................................36
IOPS - TOP-5 iSCSI PORTS widget........................................................................................36
SSD UTILIZATION (%) - TOP 5 VOLUMES widget....................................................................36
RESPONSE TIME (MS) - TOP-5 PHYSICAL DISKS widget..........................................................37
IOPS - TOP-5 PHYSICAL DISKS widget..................................................................................37
THROUGHPUT (KBPS) - TOP-5 PHYSICAL DISKS widget..........................................................37
4 Using the HP StoreFront Analytics Pack for VMware vCOPS™ 1.1....................38
Analyzing performance issues..................................................................................................38
Contents 3
Page 4

5 Support and Other Resources.....................................................................39
Contacting HP........................................................................................................................39
HP 3PAR documentation..........................................................................................................39
Typographic conventions.........................................................................................................42
HP 3PAR branding information.................................................................................................42
Glossary....................................................................................................43
Index.........................................................................................................44
4 Contents
Page 5

1 Introduction
HP StoreFront Analytics Pack for VMware vCOPS™ 1.1 provides integrated and highly automated
performance, capacity, configuration compliance, and cost management tools to the vCenter
Operations Manager custom Graphical User Interface (GUI). The software uses the VCOPs analytics
engine that analyzes what is normal and then applies them to a dynamic HP 3PAR environment.
For information on vCenter Operations Manager, refer to VMware vCenter Operations Manager
Enterprise documentation at:
http://www.vmware.com/support/pubs/vcops-pubs.html
When the HP StoreFront Analytics Pack for VMware vCOPS™ 1.1 is installed, the custom HP
Storage Monitoring, HP Storage Troubleshooting, and HP Storage Performance dashboards are
added to the vCenter Operations Manager custom GUI.
• The HP Storage Monitoring dashboard allows you to monitor 3PAR resources associated with
a vCenter environment. The attributes that can be monitored include: storage system health,
capacity utilization, and system alerts. The analytics engine also allows for proactive monitoring
of the HP 3PAR environment and indicates the state of the resources within the storage system.
If a problem occurs, an alert is triggered and displayed. The analytics engine also provides
for proactive prediction which can determine the point in the future when a resource will reach
a critical level.
• The HP Storage Troubleshooting dashboard is used to troubleshoot the storage system. It
provides a way to correlate from the virtual environment to the storage environment and it
provides tools to drill down and identify problem resources within the storage system to solve
load or capacity issues.
• The HP Storage Performance dashboard provides tools to view how well the storage system
resources are being utilized and to help balance performance trends before they become
issues.
The HP StoreFront Analytics Pack for VMware vCOPS™ 1.1 can be installed with the Advanced
and Enterprise editions of vCenter Operations Manager, but not the Standard edition.
5
Page 6
2 Installation
The HP StoreFront Analytics Pack for VMware vCOPS™ 1.1 is installed into the vCenter Operations
Manager custom GUI by using the Update tab of the vCenter Operations Manager Administration
interface and a PAK file.
Installing the software
The HP StoreFront Analytics Pack for VMware vCOPS™ 1.1 software can be installed on a
Windows, Linux, or vApp platforms.
This section describes the installation process for each platform.
Windows Installation Procedure
If you have a standalone installation, install the HP Storage adapter by extracting the adapter
installation files from a ZIP file and running an installation utility.
Prerequisites
• Read the release notes that are included with the downloaded zip file.
Procedure
1. Download HP StoreFront Analytics for VMware vCOPS 1.1 from the following site:
https://h20392.www2.hp.com/portal/swdepot/index.do
2. Extract the downloaded zip file to a temporary folder.
3. Open the ZIP file and extract the files to a temporary folder on your vCenter Operations
Manager server.
4. In the temporary folder, run the installer (install.bat) from a command window.
5. Log in to the Custom user interface as an administrator.
6. Select Admin > Support.
7. On the Info tab, find the Adapters Info pane and click the Describe icon ( ). The Describe
8. Click Yes to start the describe process then click OK.
6 Installation
icon is located at the top right of the Adapters Info pane.
Page 7

The Custom user interface will find the adapter files and gather the information about the abilities
of the adapter. It will then update the user interface with information about the adapter. The Describe
process will take several minutes and when it completes, the adapter will appear in the Adapters
Info pane (the build number will appear in the Adapter Version column).
NOTE: Verify that the build number in the Adapter Version column for the adapter matches the
build number in the ZIP file that you downloaded.
Linux Installation Procedure
If you have a standalone installation, install the HP Storage adapter by extracting the adapter
installation files from a TGZ file and running an installation utility.
Prerequisites
• Read the release notes that are included with the downloaded TGZ file.
Procedure
1. Download HP StoreFront Analytics for VMware vCOPS 1.1 from the following site:
https://h20392.www2.hp.com/portal/swdepot/index.do
2. Extract the downloaded ZIP file to a temporary folder to extract the adapter installation TGZ.
3. Open the TGZ file and extract the TAR file to a temporary folder on your vCenter Operations
Manager server.
4. In the temporary folder, run the installer (install.sh).
5. Log in to the Custom user interface as an administrator.
6. Select Admin > Support.
7. On the Info tab, find the Adapters Info pane and click the Describe icon ( ).
The Describe icon is located at the top right of the Adapters Info pane.
8. Click Yes to start the Describe process, then click OK.
The Custom user interface will find the adapter files and gather the information about the abilities
of the adapter. It will then update the user interface with information about the adapter. The Describe
process will take several minutes and when it completes, the adapter will appear in the Adapters
Info pane (the build number will appear in the Adapter Version column).
NOTE: Verify that the build number in the Adapter Version column for the adapter matches the
build number in the TGZ file that you downloaded.
vApp Installation Procedure
Prerequisites
• For prerequisites, refer to the vCenter Operations Manager vApp Deployment and Configuration
Guide located at:
http://www.vmware.com/support/pubs/vcops-pubs.html.
1. Download HP StoreFront Analytics Pack for VMware vCOPS™ 1.1 from the following site:
https://h20392.www2.hp.com/portal/swdepot/index.do
Extract the downloaded zip file to a temporary folder to obtain the PAK file.
2. Open a browser window and log in to the vCenter Operations Manager Administration GUI
as the Admin user.
For example: https://xx.xx.xx.xx/admin/ (where xx.xx.xx.xx is the IP address of the
UI virtual machine in the vAPP).
Installing the software 7
Page 8

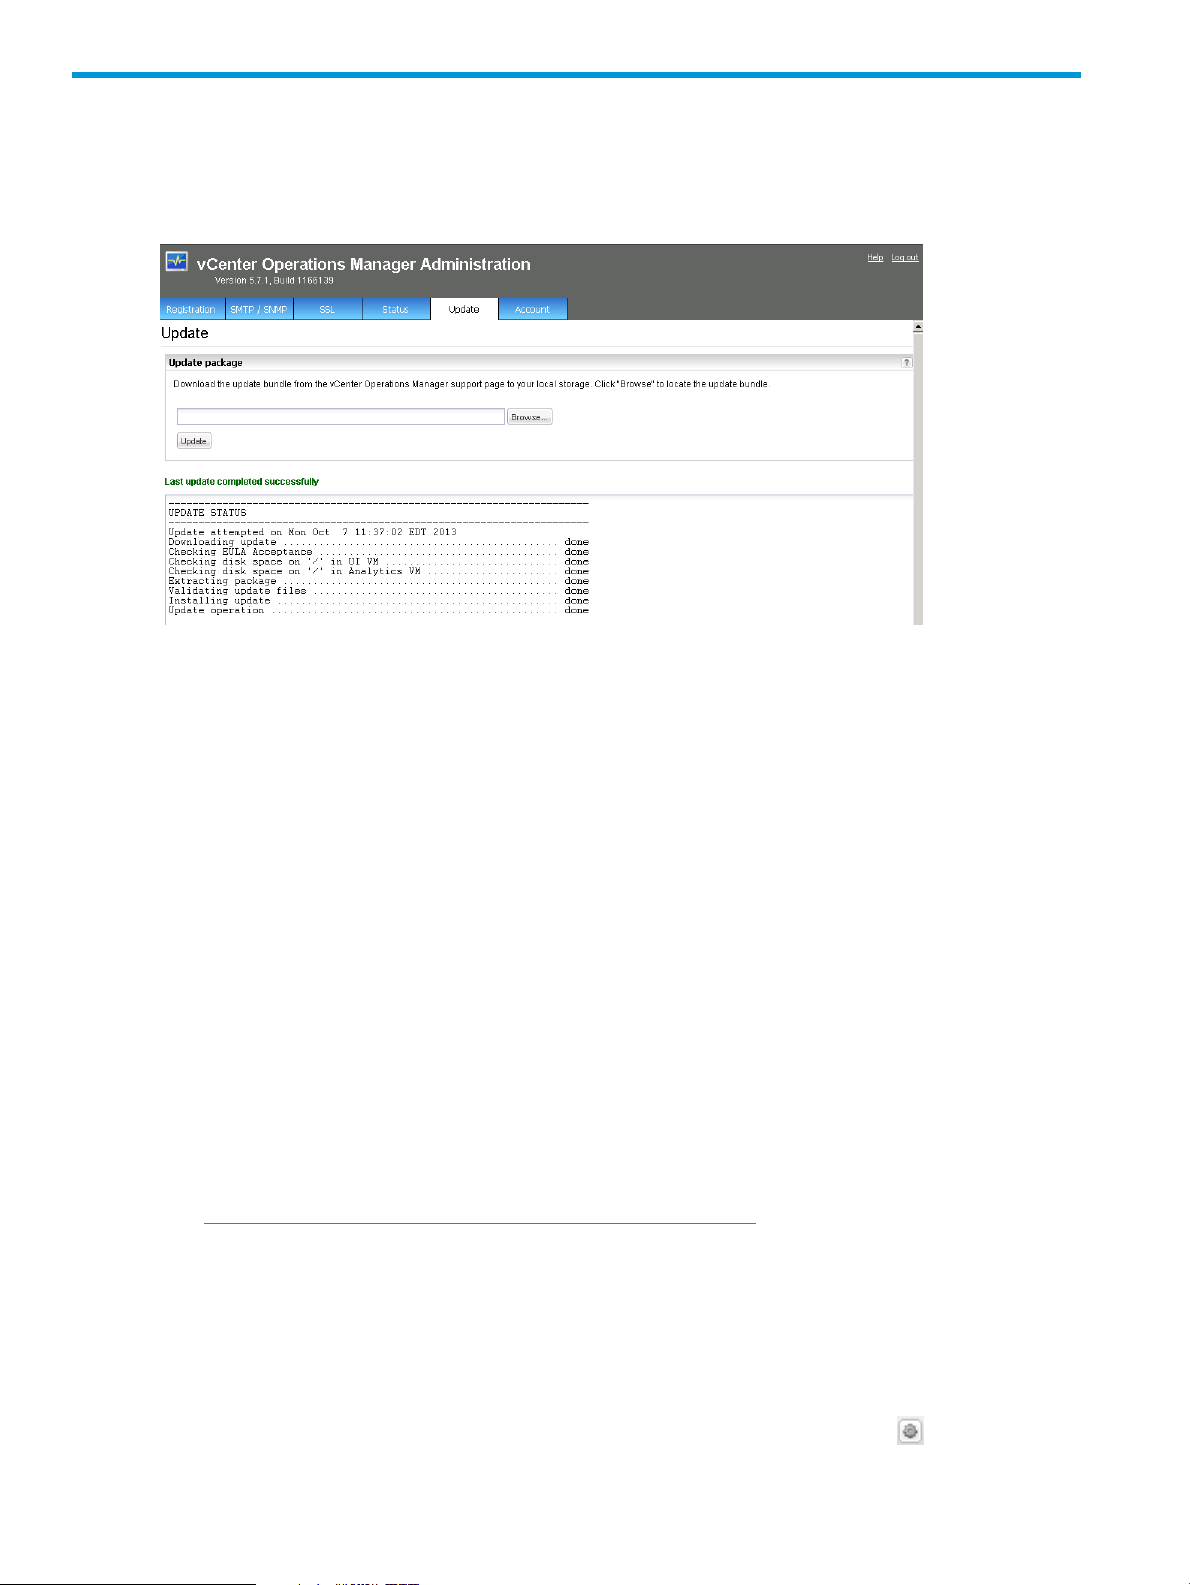
3. On the Update tab, click Browse to locate the temporary folder and select the PAK file.
4. Click Update and then click OK to confirm the update.
The vCenter Operations Manager Administration GUI uploads the PAK file.
5. Read and accept the EULA, and then click OK.
6. Click OK to start the update process.
The update might take several minutes. Status information appears on the Update tab when
the update is finished.
After the installation completes, the screen will show:
Last update completed successfully
7. Open a browser window and log in to the vCenter Operations Manager Custom GUI as the
admin user.
For example: https://xx.xx.xx.xx/vcops-custom/ (where xx.xx.xx.xx is the IP address
of the UI virtual machine).
8. Click ADMIN > SUPPORT.
9. Click the Info tab.
10. Verify that the build number in the Adapter Version column for the adapter matches the build
number in the PAK file that you uploaded.
You now need to configure and add the HP Storage Adapter instance. Each 3PAR array that is
configured will be of the type HP Storage Adapter Instance. It is possible to configure multiple HP
Storage Adapter adapter instances.
Configuring a Storage System (adding an adapter instance)
1. Open a browser window and log in to the Custom GUI as an administrator.
For example: https://xx.xx.xx.xx/vcops-custom/ (where xx.xx.xx.xx is the IP address
of the UI virtual machine).
2. Click Environment > Configuration > Adapter Instances.
3. Below the Adapter Instances heading, click the Add Adapters button .
4. In the Add Adapter Instance window, add the following information.
• Collector - select vCenter Operations Standard Server.
• Adapter Kind - select HP Storage Adapter.
• Adapter Instance Name - enter a friendly name for the HP 3PAR array that is being
configured.
• Management Server Name - <server name or IP address> is the server name or
IP Address of the 3PAR StoreServ system.
• CIM Port - is the CIM port on the array.
NOTE: By default, the port number is 5989, but a different port may have been
configured.
• Data Source Protocol - enter WEBM.
8 Installation
• Auto Discovery - set to true.
• License - enter the license information.
• Report Physical Disks - By default, the selection is set to false. When it is set to false, the
information for the physical disks in the environment will not be reported.
• Credential - Click Add and enter the credentials for the HP 3PAR array that is being
configured.
Page 9
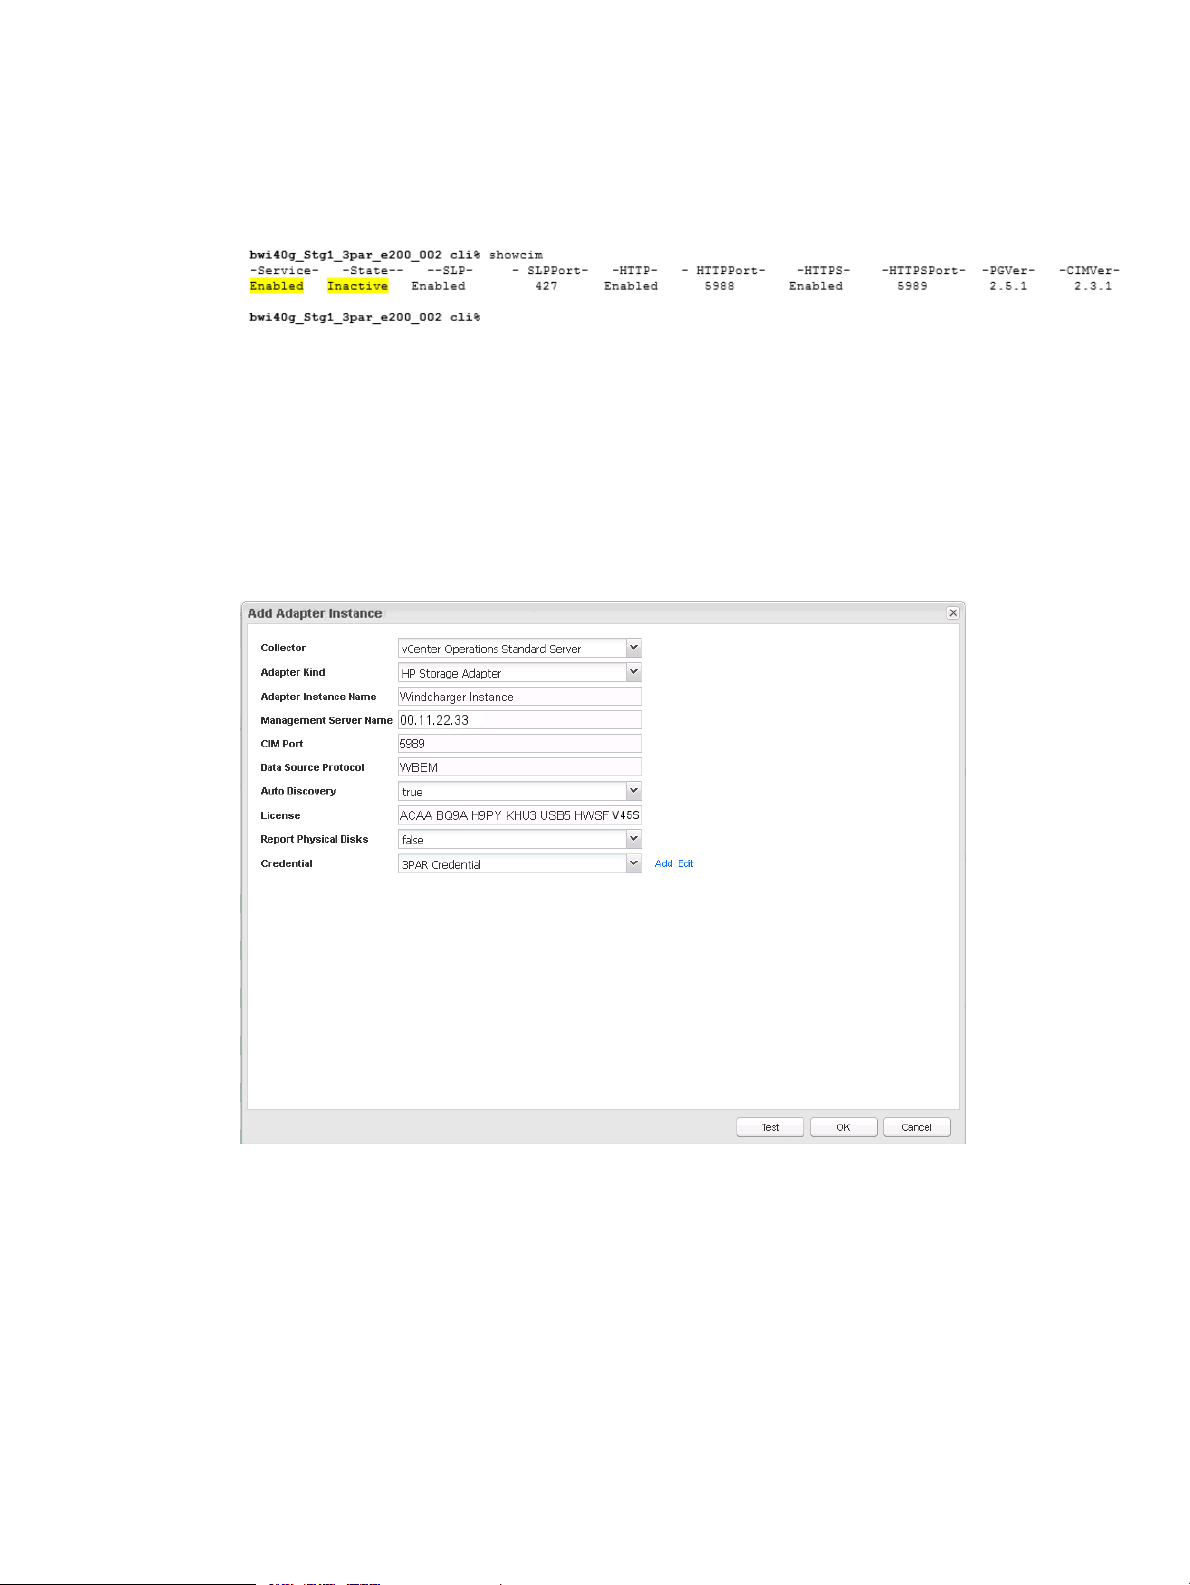
5. Click Test to make sure the parameters are correct.
To verify that the CIM service is running on the 3PAR storage system, Open an SSH session
to the 3PAR storage system and run the showcim command. The output should indicate the
state of the service as Active (see Figure 1 (page 9) .
Figure 1 SHOWCIM command output
If the State is inactive, you can activate it by running startcim command. After about 5
minutes, run the showcim command to check the status of the CIM service. If it is still Inactive,
you can issue stopcim command followed by startcim command.
6. Click OK.
The HP Storage Adapter instance appears in the Adapter Instances list.
A completed configuration for an adapter instance is shown in Figure 2 (page 9).
Figure 2 Completed Add Adapter Instance window
Licensing
HP StoreFront Analytics Pack for VMware vCOPS™ 1.1 provides detailed HP 3PAR StoreServ
health information for free, while advanced performance metrics and capacity information is
captured and displayed during the included sixty-day evaluation period. You need to purchase a
license to view the advanced metrics after the 60 day evaluation period expires.
Checking the software version
Use this procedure to check the installed version of the HP StoreFront Analytics Pack for VMware
vCOPS™ 1.1 software.
1. Open a browser window and open vCenter Operations Manager custom GUI.
Checking the software version 9
Page 10

2. Click the Admin > Support.
3. Click the Info tab.
4. Under Adapters Info, view the HP Storage Adapter version in the Adapter Version column.
Troubleshooting the software installation
Known troubleshooting information can help you diagnose and correct problems with the HP
Storage Adapter. Log files contain valuable information about adapter instance operation.
Troubleshooting an HP Storage Adapter Instance
Perform these general troubleshooting steps to diagnose and correct problems with an HP Storage
Adapter instance.
1. View the collection status and collection state for the adapter instance resource on the
Environment Overview page in the Custom GUI.
2. Check the adapter and collector log files for errors. You can view HP Storage Adapter errors
in the adapter and collector log files.
To View the HP Storage Adapter logs from the custom GUI
1. In vCenter Operations Manager custom GUI, click the ADMIN > SUPPORT.
2. Click the Logs tab.
3. In the Logs list, expand the vCenter Operations Collector folder.
4. Expand the adapters folder.
5. Expand the HP3ParAdapter folder.
6. Double click a HP Storage Adapter_##.log file in the list to view the log.
The content of the log file appears in the Log Content area.
NOTE: The log file for storage systems is identified by adding the storage system ID to the
end of the log file. For instance, HP3ParAdapter_38.log identifies a log file for a storage
system with ID 38.
10 Installation
Page 11
Notes
Resource Kinds
The HP 3PAR resources for the HP Storage Adapter are prefixed with HP 3PAR. For example HP
Storage Adapter Instance, HP 3PAR Array, HP 3PAR Array Controller, HP 3PAR Disk Drive.
Adapter Kind
The adapter kind for the HP Storage Adapter is HP Storage Adapter.
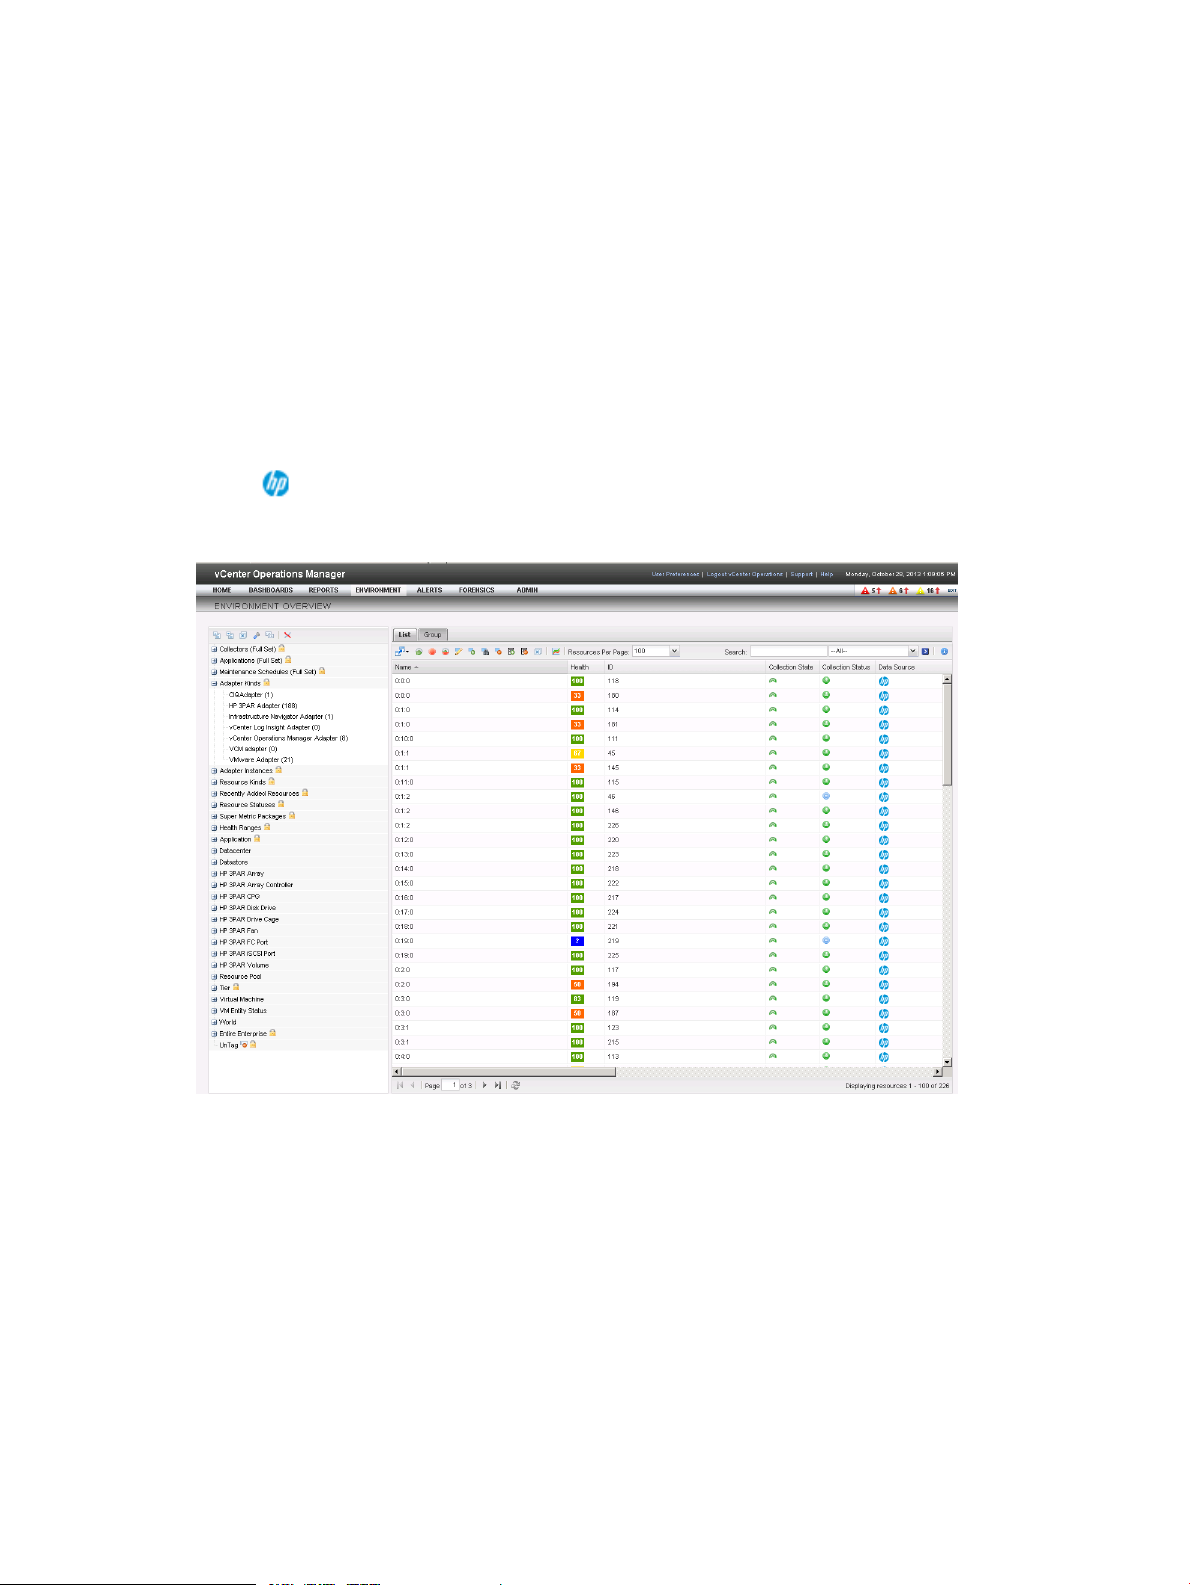
Use the following procedure to view the adapter kind.
1. In vCenter Operations Manager, click ENVIRONMENT > ENVIRONMENT OVERVIEW.
2. Expand the Adapter Kinds list.
3. Click HP Storage Adapter in the list.
The HP Storage Adapter resources appear in the List tab in the Data Source column and is indicated
by the icon.
Figure 3 HP Storage Adapter Kind
Notes 11
Page 12
Adapter Instances
The adapter instances for the HP Storage Adapter are in the HP Storage Adapter Instance under
Adapter Instances.
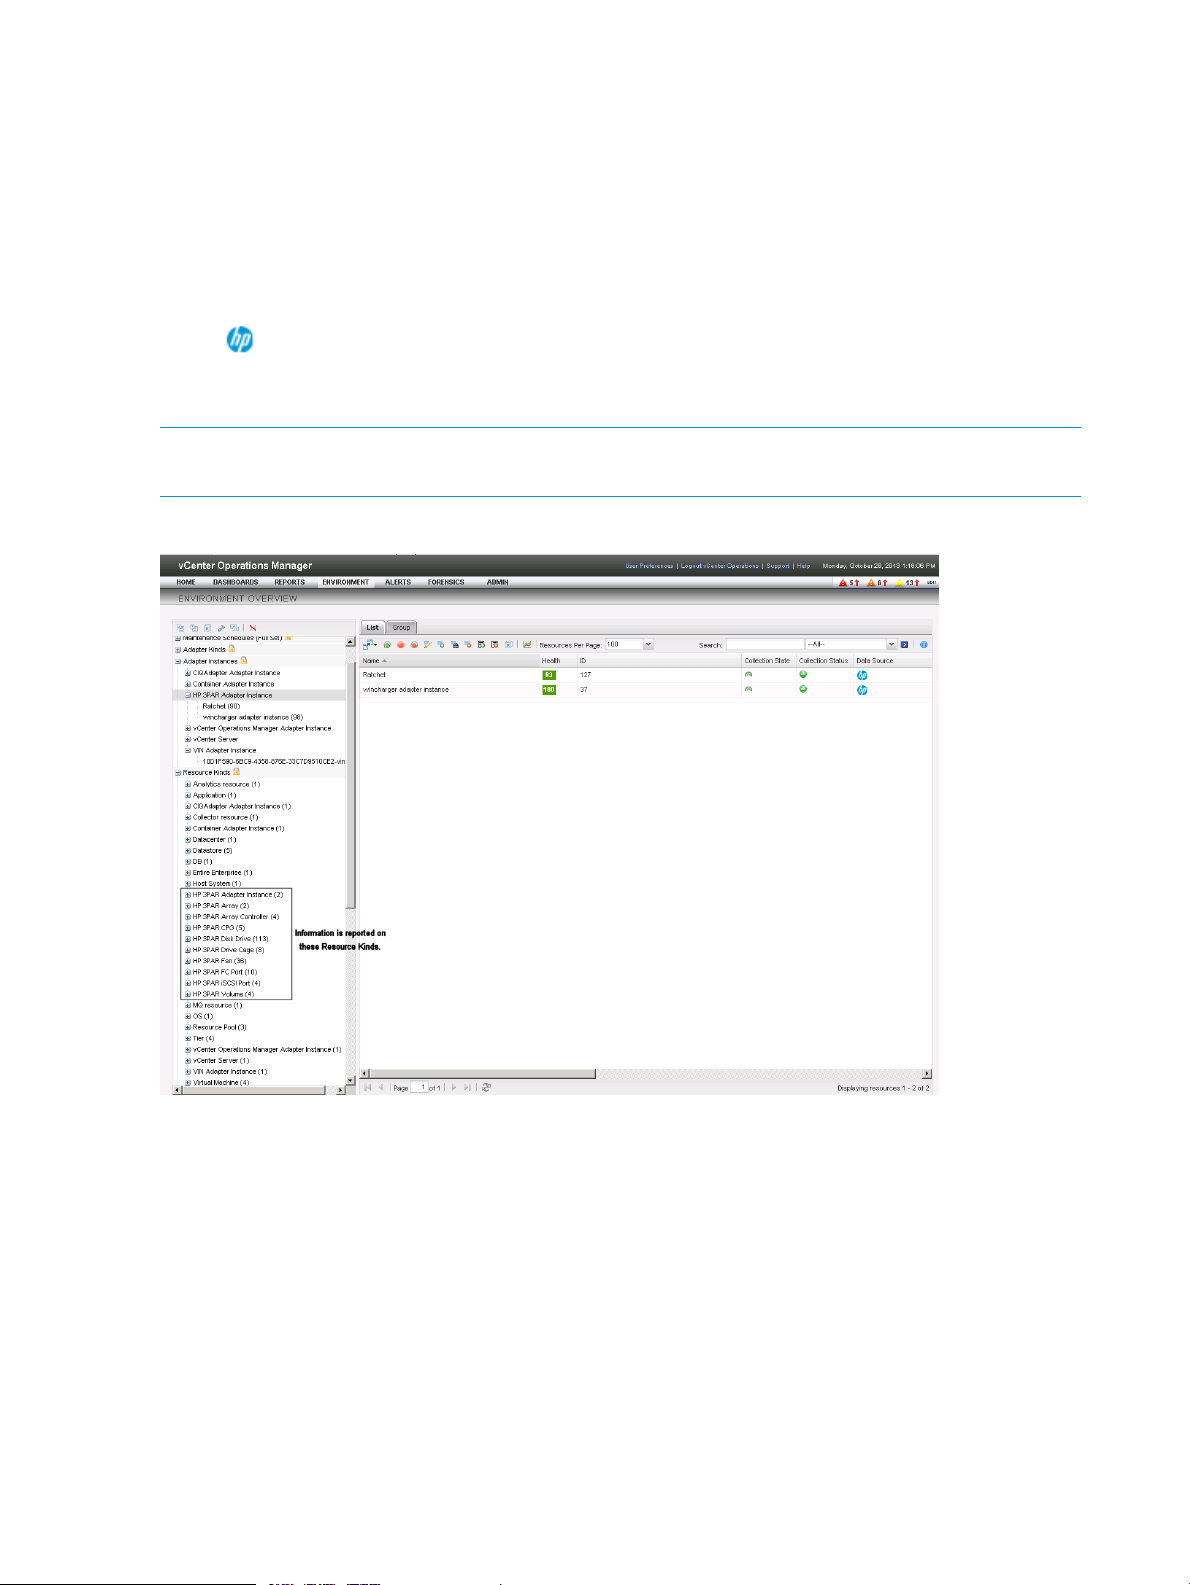
Use the following procedure to view the adapter instances.
1. In vCenter Operations Manager, click ENVIRONMENT > ENVIRONMENT OVERVIEW.
2. Expand the Adapter Instances in the list.
3. Expand the HP Storage Adapter Instance.
The HP Storage Adapter Instance appears in the List tab in the Data Source column and is indicated
by the icon.
Depending on how many HP 3PAR storage systems are configured, there may be more than one
HP Storage Adapter Instance.
NOTE: The various HP 3PAR resource kinds that are reported are shown below Resource Kinds
in the list.
Figure 4 HP 3PAR instance
12 Installation
Page 13

Resource metrics reported for HP 3PAR resources
The metrics that are reported by HP 3PAR resources are shown in Table 1 (page 13).
Table 1 HP 3PAR resources reported metrics
Reported MetricsResource
HP 3PAR Array
HP 3PAR Array Controller
Health
• State
System Capacity
• Allocated in GB
• Free in GB
• Free in GB (FC)
• Free in GB (NL)
• Free in GB (SSD)
• Percent Free
• Total in GB
Health
• State
System Performance
• IOPS (Read)
• IOPS (Write)
• IOPS (Total)
• KBPS (Read)
• KBPS (Write)
• KBPS (Total)
HP 3PAR Disk Drive
CPG CapacityHP 3PAR CPG
• Available in percent
• Growth Limit in GB
• Utilization in percent
Health
• State
Health
• State
Physical Disk Performance
• IO Size in KB
• IOPS (Read)
• IOPS (Write)
• IOPS (Total)
• KBPS (Read)
• KBPS (Write)
• KBPS (Total)
• Queue Depth
• Response Time in ms
Notes 13
Page 14

Table 1 HP 3PAR resources reported metrics (continued)
Reported MetricsResource
HP 3PAR Drive Cage
HP 3PAR Fan
Health
• State
Health
• State
FC Port PerformanceHP 3PAR FC Port
• IO Size in KB
• IOPS (Read)
• IOPS (Write)
• IOPS (Total)
• KBPS (Read)
• KBPS (Write)
• KBPS (Total)
• Queue Depth
• Response Time in ms
Health
• State
FC Port PerformanceHP 3PAR iSCSI Port
• IO Size in KB
• IOPS (Read)
• IOPS (Write)
• IOPS (Total)
• KBPS (Read)
• KBPS (Write)
• KBPS (Total)
• Queue Depth
• Response Time in ms
Health
• State
HP 3PAR Volume
14 Installation
Health
• State
Volume Capacity
• Percent on FC
• Percent on NL
• Percent on SSD
• Total in GB
• Utilization in GB
• Utilization in percent
Volume Performance
• IO Size in KB
• IOPS (Read)
• IOPS (Write)
• IOPS (Total)
Page 15

Table 1 HP 3PAR resources reported metrics (continued)
Reported MetricsResource
• KBPS (Read)
• KBPS (Write)
• KBPS (Total)
• Queue Depth
• Response Time in ms
Notes 15
Page 16

3 Dashboards
The customized HP dashboards are available as tabs or from the DASHBOARDS menu in the
vCenter Operations Manager custom GUI.
The dashboards consists of customized widgets with customized interactions and several standard
widgets. You can modify the dashboards with additional standard widgets. To modify the
dashboard, see “Editing a dashboard” (page 16).
To open the custom GUI, in a browser window, log in to the vCenter Operations Manager custom
GUI as the admin user (for example: https://xx.xx.xx.xx/vcops-custom - where xx.x.xx.xx
is the IP address of the UI virtual machine).
Dashboard color coding
The widgets on the custom HP dashboards use the standard vCenter Operations Manager color
code to indicate the performance level of the resources. The status is determined by the software’s
analytics and can be a ranking from 0 to 100. Green indicates best performance, which is a status
100 for health or 0 for workload. Red indicates poorer performance, which is a status 0 for health
or 100 for workload.
For information on vCenter Operations Manager, refer to VMware vCenter Operations Manager
Enterprise documentation at:
http://www.vmware.com/support/pubs/vcops-pubs.html.
Editing a dashboard
To edit a dashboard, click EDIT in the Dashboard Tools toolbar at the top of the GUI. For additional
information see the VMware vCenter Operations Manager Enterprise Getting Started Guide located
on the VMware support site at:
http://www.vmware.com/support/pubs.
NOTE: Best Practice - You can modify the custom HP dashboards to display other information;
however, it is strongly suggested to first make a copy of the dashboard, then modify the copy. To
make a copy of the dashboard, use the CLONE button in the Dashboard Tools menu.
Editing a dashboard widget
To edit a widget, click the Edit Widget button at the top of the widget . For additional information
see the VMware vCenter Operations Manager Enterprise Getting Started Guide located on the
VMware support site at:
http://www.vmware.com/support/pubs.
NOTE: Best Practice - You can modify the custom HP dashboards to display other information;
however, it is strongly suggested to first make a copy of the dashboard, then modify the copy. To
make a copy of the dashboard, use the CLONE button in the Dashboard Tools menu.
HP Storage Monitoring dashboard
The HP Storage Monitor dashboard is used to monitor the storage system. The dashboard
incorporates customized widgets and interactions to display information on the selected storage
system or resource.
The following customized widgets are installed in the HP Storage Monitor dashboard:
• STORAGE SYSTEMS
• HEALTH (SELECT STORAGE SYSTEM ABOVE)
16 Dashboards
Page 17

• HEAT MAP (SELECT CONFIGURATION FROM DROPDOWN)
• HEALTH (SELECT STORAGE SYSTEM ABOVE)
• HP STORAGE SYSTEM ALERTS
• Metrics (SELECT STORAGE SYSTEM ABOVE)
• 50 LEAST HEALTHY HP 3PAR RESOURCES
To initialize the interactions of the dashboard, you first need to select a storage system in the HP
STORAGE SYSTEMS widget.
Figure 5 HP Storage Monitor dashboard
HP Storage Monitoring dashboard 17
Page 18

HP Storage Monitoring dashboard Interactions
The following interactions occur with the HP Storage Monitoring dashboard when you select a
storage system in the HP STORAGE SYSTEM widget:
• The HP STORAGE SYSTEM ALERTS widget updates to show alerts for the storage systems that
are configured in the environment.
The HEAT MAP widget updates to show information about the selected configuration. When
one of the elements in the widget is selected, the METRICS widget will be updated to show
the details of the selected widget.
The widget can display information about multiple resource kinds. Select the appropriate
resource kind from the pull-down menu.
• The HEALTH widget updates to show the storage system health for the selected storage system.
When you select a resource (disk drive, fan, FC port, etc.) in this widget, the HEALTH STATUS
widget will be updated with health history information about the selected resource.
NOTE:
• You may need to initially click a storage system or resource to update the widgets.
• Best Practice - You can modify the HP dashboards to display other information; however, it is
strongly suggested to first make a copy of the dashboard and modify the copy. To make a
copy of the dashboard, use the CLONE button in the Dashboard Tools menu.
18 Dashboards
Page 19

STORAGE SYSTEMS widget
This widget shows the storage systems configured in the environment. Selecting a storage system
in this widget displays a heat map of the storage system in the HEAT MAP widget as well as a
view of all of the resources within the storage system in the HEALTH widget. The list can be sorted
by column heading.
• Name - the name of the storage systems configured by the user.
• Health - the health of the storage systems as reported by the vCOPs analytics.
• Collection Status - the status of the data collection of the storage systems.
• Resource Kind - the type of resource.
• Capacity Available - the reported system capacity | percent free metric.
• Health - the reported health state metric.
• Maintenance Schedule - the time and date when maintenance is allowed.
• Instance Generated |Number of down resources - the number of resources that are not
operational.
• Description - a short description of the storage systems.
• Instance Generated |Number of resources collected - the number of resources that have been
collected for the selected storage system.
HP Storage Monitoring dashboard 19
Page 20

HEALTH widget
This widget shows a graphical representation of the health of the selected storage system. An icon
is shown for each resource of the storage system and a colored box indicates the health status for
each resource (see “Dashboard color coding” (page 16)).
Double clicking an icon will bring that resource into focus and display a detailed health graphic
in the HEALTH STATUS widget below.
Storage Systems widget icons
The resources in the storage system are represented by icons in the dashboard. The following is
a list of the icons and their association with the resources.
- Disk Array - this is a representation of the HP 3PAR storage system containing the other
components (controllers, disk drives, fans, etc.).
- Drive Cage.
- Array Controller.
20 Dashboards
Page 21

- Disk Drive.
- Disk Array Fan.
- Array Controller Port (FC or iSCSI).
- Common Provisioning Group (CPG) or Storage Pool.
- Virtual Volume.
HP Storage Monitoring dashboard 21
Page 22

HEALTH STATUS widget
This widget shows a detailed representation of the health of the selected resource over time. The
resources are selected by clicking an icon in the HEALTH widget. The timeline and other parameters
can be changed using the Edit Widget button (see “Editing a dashboard widget” (page 16)).
HEAT MAP widget
This widget shows a heat map of the selected Configuration. The following configurations are
available fro selection:
• CAPACITY USED - HP 3PAR CPG
• CAPACITY USED - HP 3PAR VOLUME
• IOPS - HP 3PAR FC PORT
• IOPS - HP 3PAR DISK DRIVE
• IOPS - HP 3PAR VOLUME.
22 Dashboards
Page 23

The following graphics show sample heat maps for different resource kinds.
CAPACITY USED - HP 3PAR VOLUME
IOPS - HP 3PAR FC PORT
HP Storage Monitoring dashboard 23
Page 24

IOPS - HP 3PAR DISK DRIVE
24 Dashboards
Page 25

HP STORAGE SYSTEM ALERTS widget
This widget lists if there are any alerts for the storage system and provides a convenient way to
view and manage alerts. When you double-click an alert in the ALERTS widget, the Alert Summary
page appears with details about the alert.
METRICS widget
This widget shows a graph containing metrics for the selected resource kind in the HEAT MAP
widget.
HP Storage Monitoring dashboard 25
Page 26

50 LEAST HEALTHY HP 3PAR RESOURCES widget
This widget lists the 50 least healthy resource kinds in the environment. The number and types of
items displayed can be modified by editing the widget. The utilization information can be used to
rebalance the loads to volumes with lower utilization.
26 Dashboards
Page 27

HP Storage Troubleshooting dashboard
The HP Storage Troubleshooting dashboard is used to troubleshoot the storage system components.
The dashboard also provides summary information about VMs and how they map to HP storage
volumes, pools, disks and ports. The dashboard includes graphs for key performance metrics such
as IOPS and bandwidth, which are displayed in relation to the selected object of the VM to Storage
Mapping widget.
The dashboard incorporates customized widgets and interactions to display information on the
selected storage system or resource.
The following customized widgets are installed in the HP Storage Troubleshooting dashboard:
• VIRTUAL MACHINES
• VM TO STORAGE MAPPING
• MAPPING DETAILS
• SELECTED RESOURCE METRIC GRAPH
• ALERTS
Figure 6 HP Storage Troubleshooting dashboard
HP Storage Troubleshooting dashboard 27
Page 28

HP Storage Troubleshooting dashboard Interactions
The following interactions occur with the HP Storage Troubleshooting dashboard when you select
a virtual machine in the VIRTUAL MACHINES widget:
• The ALERTS widget updates to show alerts for the resources.
• The VM TO STORAGE MAPPING widget will be updated with status information on the selected
virtual machine in the VIRTUAL MACHINES widget.
• Selecting a resource in the VM TO STORAGE MAPPING widget updates the Mapping Details
widget and also update the SELECTED RESOURCE METRIC GRAPH widget.
NOTE: Best Practice - You can modify the HP dashboards to display other information; however,
it is strongly suggested to first make a copy of the dashboard and modify the copy. To make a
copy of the dashboard, use the CLONE button in the Dashboard Tools menu.
VIRTUAL MACHINES widget
This widget shows the virtual machines that are managed by the registered vCenter. When a virtual
machine is selected, the details appear in the VM TO STORAGE MAPPING widget.
VM TO STORAGE MAPPING widget
This widget shows the virtual machine-to-storage mapping of the selected virtual machine in the
VIRTUAL MACHINES widget. This widget provides a correlation between the virtual machine and
the different storage resources attached to it.
The widget header contains selection buttons to view the resources by health, workload, or capacity.
The resources can also be filtered by selecting one of the STATUS FILTER buttons. When a resource
is selected, the mapping details are shown in the MAPPING DETAILS widget.
28 Dashboards
Page 29

- selects the badges in the storage system that represent health values for the resources in
the storage system. The health badges indicate the current storage system performance.
- selects the badges in the storage system that represent workload values for the resources
in the storage system. These represent the demand for resources within the storage system.
- selects the badges in the storage system that represent capacity values for the resources
in the storage system. These represent the remaining capacity for the resources.
For information on resource badges, refer to VMware vCenter Operations Manager Enterprise
documentation at:
http://www.vmware.com/support/pubs
HP Storage Troubleshooting dashboard 29
Page 30

The Health, Workload, and Capacity icons appear colored next to each component to indicate
the values (see “Dashboard color coding” (page 16)). The values can be filtered by state by clicking
the Status Filter icons in the widget header. Components can also be sorted alphabetically or
numerically using the Sort By drop down list.
MAPPING DETAILS widget
This widget shows a health tree for the selected resource in the VM TO STORAGE MAPPING widget.
The selected resource appears in the center of the graphic of the widget and related resources
(treated as parents and children) are shown above and below the resource. When a resource is
selected, the metrics for the resource are shown in the SELECTED RESOURCE METRIC GRAPH widget.
30 Dashboards
Page 31

METRIC GRAPH (SELECT RESOURCE FROM VM TO STORAGE MAPPING) widget
The metrics displayed in the screen are determined by the resource selected in the VM TO STORAGE
MAPPING widget (Virtual Machine, Datastore, HP 3PAR Volume, etc.). For details on the displayed
metrics, see “Resource metrics reported for HP 3PAR resources” (page 13).
HP Storage Troubleshooting dashboard 31
Page 32

ALERTS widget
This widget shows a lists of all alerts for all monitored resources in the storage system. The list can
be sorted by column heading.
32 Dashboards
Page 33

HP Storage Performance dashboard
The HP Storage Performance dashboard is used to monitor the resources with the highest utilization
within the storage system. If the storage system is experiencing performance issues, this dashboard
is a good place to start looking for resources with issues. There is no customized interaction between
the widgets on this dashboard; however, the widgets are customized to show specific resources
within the storage system that are approaching critical performance values.
If you double click a resource in any of the widgets, you will go to the RESOURCE DETAIL dashboard
for that resource.
Each widget shows the Utilization Index (the value determined by the vCOPs analytics to indicate
a resource usage) and the Resource of the index. The utilization value of the resource is shown on
each horizontal bar. The lengths of the bars are relative to the longest bar in the widget.
The following customized widgets are installed in the HP Storage Performance dashboard:
• CAPACITY UTILIZATION (%) - TOP 5 VOLUMES
• IOPS - TOP 5 VOLUMES
• RESPONSE TIME (MS) - TOP 5 VOLUMES
• QDEPTH - TOP 5 VOLUMES
• IOPS - TOP 5 FC PORTS
• RESPONSE TIME (MS) - TOP 5 FC PORTS
• IOPS - TOP 5 iSCSI PORTS
• SSD UTILIZATION (%) - TOP 5 VOLUMES
• RESPONSE TIME (MS) - TOP 5 PHYSICAL DISKS
• IOPS - TOP-5 PHYSICAL DISKS
• THROUGHPUT (KBPS) - TOP 5 PHYSICAL DISKS
HP Storage Performance dashboard 33
Page 34

Figure 7 HP Storage Performance dashboard
NOTE: The interactions on the HP Storage Performance dashboard have not been customized.
CAPACITY UTILIZATION (%) - TOP-5 VOLUMES widget
This widget shows the five volumes with high utilization. The Volume Capacity - Capacity Utilization
in percent metric is used to determine the Utilization Index which can be used to rebalance the
workload to resources with a lower index.
IOPS - TOP-5 VOLUMES widget
This widget shows the five volumes with high input/output operations per second. The Volume
Performance - IOPS metric is used to determine the Utilization Index which can be used to rebalance
the workload to resources with a lower index.
34 Dashboards
Page 35

RESPONSE TIME (MS) - TOP-5 VOLUMES widget
This widget shows the five volumes with high response times. The Volume Performance - Response
Time in ms metric is used to determine the Utilization Index which can be used to rebalance the
workload to resources with a lower index.
QDEPTH - TOP-5 VOLUMES widget
This widget shows the five volumes with high pending input/output operations. The Volume
Performance - Queue Depth metric is used to determine the Utilization Index which can be used
to rebalance the workload to resources with a lower index.
IOPS -TOP-5 FC PORTS widget
This widget shows the five ports with high input/output operations per second. The FC Port
Performance - IOPS metric is used to determine the Utilization Index which can be used to rebalance
the workload to resources with a lower index.
HP Storage Performance dashboard 35
Page 36

RESPONSE TIME (MS) - TOP-5 FC PORTS widget
This widget shows the five fibre channel ports with high response times. The FC Performance Response Time in ms metric is used to determine the Utilization Index which can be used to rebalance
the workload to resources with a lower index.
IOPS - TOP-5 iSCSI PORTS widget
This widget shows the five ISCSI ports by IOPS with high usage. The Health - State metric is used
to determine the Utilization Index which can be used to rebalance the workload to resources with
a lower index.
SSD UTILIZATION (%) - TOP 5 VOLUMES widget
This widget shows the five SSD Volumes with high usage. The Percent On SSD metric is used to
determine the Utilization Index which can be used to rebalance the workload to resources with a
lower index.
36 Dashboards
Page 37

RESPONSE TIME (MS) - TOP-5 PHYSICAL DISKS widget
This widget shows the five disk drives with high response times. The Physical Disk Performance Response Time in ms metric is used to determine the Utilization Index which can be used to rebalance
the workload to resources with a lower index.
IOPS - TOP-5 PHYSICAL DISKS widget
This widget shows the five disk drives with high input/output operations per second. The Physical
Disk Performance - IOPS metric is used to determine the Utilization Index which can be used to
rebalance the workload to resources with a lower index.
THROUGHPUT (KBPS) - TOP-5 PHYSICAL DISKS widget
This widget shows the five ports with high throughput. The Physical Disk Performance - KBPS metric
is used to determine the Utilization Index which can be used to rebalance the workload to resources
with a lower index.
HP Storage Performance dashboard 37
Page 38

4 Using the HP StoreFront Analytics Pack for VMware
vCOPS™ 1.1
Analyzing performance issues
To gain deeper visibility of the critical storage resources from within vCenter Operations Manager,
specific storage platform adapters are required. The HP StoreFront Analytics Pack for VMware
vCOPS™ 1.1 is a software adapter that extends vCenter Operations Manager functionality to
support HP 3PAR StoreServ arrays. VMware administrators using HP StoreFront Analytics Pack for
VMware vCOPS™ 1.1 can visualize and analyze data from their HP 3PAR StoreServ storage array
on standard and custom dashboards directly within vCenter Operations Manager without the need
to switch to another tool. The HP StoreFront Analytics Pack for VMware vCOPS™ 1.1 provides
customers using HP 3PAR StoreServ storage with custom dashboards to gain deep insights and
visibility into the health, risk and efficiency of the storage infrastructure’s performance and capacity
capabilities.
If you are observing performance issues within the storage system, you can use the HP Storage
Performance dashboard to view volumes with high utilization. Using that information, you can use
the HP Storage Troubleshooting dashboard to view the details of the volumes to see which virtual
machine on the volume has a high utilization and then determine what the virtual machine is doing
to cause the high utilization.
HP 3PAR StoreServ array information can be accessed from within VMware vCenter Operations
Manager in several ways based on the selected object in the user interface.
The following HP dashboards help the user view detailed storage information on the selected
object(s) in different ways:
• HP Storage Monitoring Dashboard - Provides summary and detailed information about the HP
storage system in the VMware vSphere environment, including HP storage system health,
capacity information, 50 Least Healthy HP 3PAR Resources and HP storage system alerts.
• HP Storage Troubleshooting Dashboard - Provides summary and detailed information about
virtual machines and how they map to HP storage volumes, pools, disks and ports. The
dashboard includes graphs for key performance metrics such as IOPS and bandwidth, which
are displayed in relation to the selected object of the VM to Storage Mapping widget.
• HP Storage Performance Dashboard - Provides tools to view how well the storage system
resources are being utilized and to help balance performance trends before they become
issues. The dashboard displays graphs for top 5 Utilization Indexes of volumes with high
utilization which are displayed in relation to the selected object of the VM to Storage Mapping
widget. Selecting a row in one of the widgets and clicking the Resource Detail icon ( ) will
display more detail about the resource.
The included HP dashboards are provided as an easy way to quickly start viewing common storage
metrics that are key to monitoring and analyzing infrastructure health. You can also utilize vCenter
Operations Manager widgets to configure your own specialized views based on HP 3PAR StoreServ
metrics.
38 Using the HP StoreFront Analytics Pack for VMware vCOPS™ 1.1
Page 39

5 Support and Other Resources
Contacting HP
For worldwide technical support information, see the HP support website:
http://www.hp.com/support
Before contacting HP, collect the following information:
• Product model names and numbers
• Technical support registration number (if applicable)
• Product serial numbers
• Error messages
• Operating system type and revision level
• Detailed questions
Specify the type of support you are requesting:
systems
Support requestHP 3PAR storage system
StoreServ 7000 StorageHP 3PAR StoreServ 7200, 7400, and 7450 Storage
HP 3PAR T-Class storage systems
HP 3PAR F-Class storage systems
HP 3PAR documentation
Supported hardware and software platforms
and administer HP 3PAR storage systems
Using the HP 3PAR CLI to configure and administer storage
systems
3PAR or 3PAR StorageHP 3PAR StoreServ 10000 Storage systems
See:For information about:
The Single Point of Connectivity Knowledge for HP
Storage Products (SPOCK) website:
http://www.hp.com/storage/spock
The HP 3PAR StoreServ Storage site:Locating HP 3PAR documents
http://www.hp.com/go/3par
To access HP 3PAR documents, click the Support link for
your product.
HP 3PAR storage system software
HP 3PAR StoreServ Storage Concepts GuideStorage concepts and terminology
HP 3PAR Management Console User's GuideUsing the HP 3PAR Management Console (GUI) to configure
HP 3PAR Command Line Interface Administrator’s
Manual
to manage host configuration and connectivity information
Model (CIM) to manage HP 3PAR storage systems
HP 3PAR Command Line Interface ReferenceCLI commands
HP 3PAR System Reporter Software User's GuideAnalyzing system performance
HP 3PAR Host Explorer User’s GuideInstalling and maintaining the Host Explorer agent in order
HP 3PAR CIM API Programming ReferenceCreating applications compliant with the Common Information
Contacting HP 39
Page 40

See:For information about:
HP 3PAR-to-3PAR Storage Peer Motion GuideMigrating data from one HP 3PAR storage system to another
Configuring the Secure Service Custodian server in order to
monitor and control HP 3PAR storage systems
Copy
Identifying storage system components, troubleshooting
information, and detailed alert information
Server
HP 3PAR Secure Service Custodian Configuration Utility
Reference
HP 3PAR Remote Copy Software User’s GuideUsing the CLI to configure and manage HP 3PAR Remote
HP 3PAR Upgrade Pre-Planning GuideUpdating HP 3PAR operating systems
HP 3PAR F-Class, T-Class, and StoreServ 10000 Storage
Troubleshooting Guide
HP 3PAR Policy Server Installation and Setup GuideInstalling, configuring, and maintaining the HP 3PAR Policy
HP 3PAR Policy Server Administration Guide
40 Support and Other Resources
Page 41

See:For information about:
Planning for HP 3PAR storage system setup
Hardware specifications, installation considerations, power requirements, networking options, and cabling information
for HP 3PAR storage systems
HP 3PAR StoreServ 7000 Storage Site Planning ManualHP 3PAR 7200, 7400, and 7450 storage systems
HP 3PAR StoreServ 7450 Storage Site Planning Manual
HP 3PAR 10000 storage systems
Installing and maintaining HP 3PAR 7200, 7400, and 7450 storage systems
initializing the Service Processor
7450 storage systems
HP 3PAR host application solutions
Backing up Oracle databases and using backups for disaster
recovery
HP 3PAR StoreServ 10000 Storage Physical Planning
Manual
HP 3PAR StoreServ 10000 Storage Third-Party Rack
Physical Planning Manual
HP 3PAR StoreServ 7000 Storage Installation GuideInstalling 7200, 7400, and 7450 storage systems and
HP 3PAR StoreServ 7450 Storage Installation Guide
HP 3PAR StoreServ 7000 Storage SmartStart Software
User’s Guide
HP 3PAR StoreServ 7000 Storage Service GuideMaintaining, servicing, and upgrading 7200, 7400, and
HP 3PAR StoreServ 7450 Storage Service Guide
HP 3PAR StoreServ 7000 Storage Troubleshooting GuideTroubleshooting 7200, 7400, and 7450 storage systems
HP 3PAR StoreServ 7450 Storage Troubleshooting Guide
HP 3PAR Service Processor Software User GuideMaintaining the Service Processor
HP 3PAR Service Processor Onsite Customer Care
(SPOCC) User's Guide
HP 3PAR Recovery Manager Software for Oracle User's
Guide
Backing up Exchange databases and using backups for
disaster recovery
Backing up SQL databases and using backups for disaster
recovery
Backing up VMware databases and using backups for
disaster recovery
Installing and using the HP 3PAR VSS (Volume Shadow Copy
Service) Provider software for Microsoft Windows
Best practices for setting up the Storage Replication Adapter
for VMware vCenter
Troubleshooting the Storage Replication Adapter for VMware
vCenter Site Recovery Manager
Installing and using vSphere Storage APIs for Array
Integration (VAAI) plug-in software for VMware vSphere
HP 3PAR Recovery Manager Software for Microsoft
Exchange 2007 and 2010 User's Guide
HP 3PAR Recovery Manager Software for Microsoft SQL
Server User’s Guide
HP 3PAR Management Plug-in and Recovery Manager
Software for VMware vSphere User's Guide
HP 3PAR VSS Provider Software for Microsoft Windows
User's Guide
HP 3PAR Storage Replication Adapter for VMware
vCenter Site Recovery Manager Implementation Guide
HP 3PAR Storage Replication Adapter for VMware
vCenter Site Recovery Manager Troubleshooting Guide
HP 3PAR VAAI Plug-in Software for VMware vSphere
User's Guide
HP 3PAR documentation 41
Page 42

Typographic conventions
Table 2 Document conventions
ElementConvention
Bold text
Monospace text
<Monospace text in angle brackets>
Bold monospace text
• Keys that you press
• Text you typed into a GUI element, such as a text box
• GUI elements that you click or select, such as menu items, buttons,
and so on
• File and directory names
• System output
• Code
• Commands, their arguments, and argument values
• Code variables
• Command variables
• Commands you enter into a command line interface
• System output emphasized for scannability
WARNING! Indicates that failure to follow directions could result in bodily harm or death, or in
irreversible damage to data or to the operating system.
CAUTION: Indicates that failure to follow directions could result in damage to equipment or data.
NOTE: Provides additional information.
Required
Indicates that a procedure must be followed as directed in order to achieve a functional and
supported implementation based on testing at HP.
HP 3PAR branding information
• The server previously referred to as the "InServ" is now referred to as the "HP 3PAR StoreServ
Storage system."
• The operating system previously referred to as the "InForm OS" is now referred to as the "HP
3PAR OS."
• The user interface previously referred to as the "InForm Management Console (IMC)" is now
referred to as the "HP 3PAR Management Console."
• All products previously referred to as “3PAR” products are now referred to as "HP 3PAR"
products.
42 Support and Other Resources
Page 43

Glossary
CPG Common Provisioning Group - defines the Logical Disk creation characteristics, such as RAID
type, set size, disk type for chunklet selection, plus total space warning and limit points. A CPG
creates a virtual pool of LDs that allows Volumes to share resources and to allocate space on
demand. A volume created from a CPG can automatically be grown on demand by mapping
new regions from the LDs associated with the CPG. Common provisioning groups and their
importance to thin provisioning will be discussed in more detail in the next section.
KPI Key Performance Indicator (as in the VMware metric - Full Set - Active KPI Breach Count)
Utilization Index A value that is calculated by the vCOPs analytics to indicate the usage level of a resource. The
higher the value, the greater the resource is being used.
vApp A collection of virtual machines.
vCOPS vCenter Operations Manager
VM Virtual Machine
43
Page 44

Index
A
Adapter Instance, 12
Adapter Kind, 11
C
conventions
text symbols, 42
D
Dashboard
cloning, 16, 18
color codes, 16
customized, 16
editing, 16
HEAT MAP widget, 22
HP Storage Monitoring, 16
HP Storage Performance, 33
HP Storage Troubleshooting, 27
STORAGE SYSTEMS widget, 19
Dashboard widgets
50 LEAST HEALTHY HP 3PAR RESOURCES, 26
ALERTS, 32
CAPACITY UTILIZATION (%) - TOP-5 VOLUMES, 34
cloning, 16
editing, 16
HEALTH, 20
HEALTH STATUS, 22
HP STORAGE SYSTEM ALERTS, 25
IOPS - TOP-5 iSCSI PORTS, 36
IOPS - TOP-5 PHYSICAL DISKS, 37
IOPS - TOP-5 VOLUMES, 34
IOPS -TOP-5 FC PORTS, 35
MAPPING DETAILS, 30
METRIC GRAPH (SELECT RESOURCE FROM VM TO
STORAGE MAPPING), 31
METRICS, 25
QDEPTH - TOP-5 VOLUMES, 35
RESPONSE TIME (MS) - TOP-5 FC PORTS, 36
RESPONSE TIME (MS) - TOP-5 PHYSICAL DISKS, 37
RESPONSE TIME (MS) - TOP-5 VOLUMES, 35
SSD UTILIZATION (%) - TOP 5 VOLUMES, 36
Storage Systems icons, 20
THROUGHPUT (KBPS) - TOP-5 PHYSICAL DISKS, 37
VIRTUAL MACHINES, 28
VM TO STORAGE MAPPING, 28
I
Installation
Linux, 7
vApp, 7
Windows, 6
interactions
HP Storage Monitoring, 18
HP Storage Troubleshooting dashboard, 28
M
metrics
reported for HP 3PAR resources, 13
R
Resource Kinds, 11
S
symbols in text, 42
T
text symbols, 42
Troubleshooting
Analyzing performance issues, 38
H
HP StoreFront Analytics Pack for VMware vCOPS
configuration, 8
Installation, 6
licensing, 9
software location, 7
troubleshooting installation, 10
version, 9
44 Index
 Loading...