

Page 1
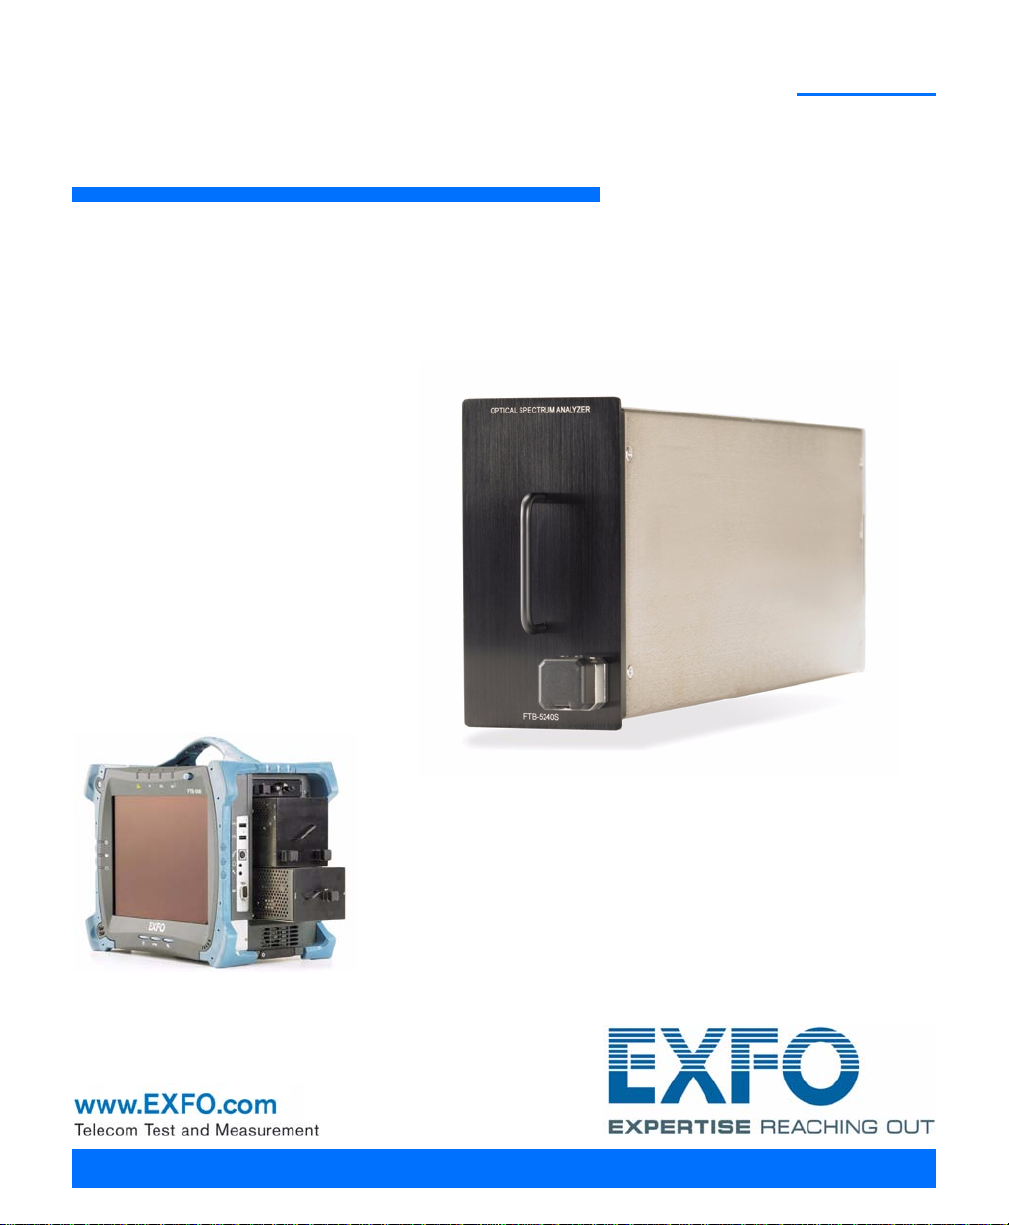
FTB-5240S/5240BP
Optical Spectrum Analyzer for FTB-500
User Guide
Page 2

Copyright © 2009–2010 EXFO Inc. All rights reserved. No part of this
publication may be reproduced, stored in a retrieval system or transmitted
in any form, be it electronically, mechanically, or by any other means such
as photocopying, recording or otherwise, without the prior written
permission of EXFO Inc. (EXFO).
Information provided by EXFO is believed to be accurate and reliable.
However, no responsibility is assumed by EXFO for its use nor for any
infringements of patents or other rights of third parties that may result from
its use. No license is granted by implication or otherwise under any patent
rights of EXFO.
EXFO’s Commerce And Government Entities (CAGE) code under the North
Atlantic Treaty Organization (NATO) is 0L8C3.
The information contained in this publication is subject to change without
notice.
Trademarks
EXFO’s trademarks have been identified as such. However, the presence
or absence of such identification does not affect the legal status of any
trademark.
Units of Measurement
Units of measurement in this publication conform to SI standards and
practices.
Patents
The Optical Spectrum Analyzer, including its proprietary measurement
software, is protected by US patent 6,636,306 (and equivalents in several
other countries), and pending PCT international application
PCT/CA2008/000647; EXFO’s Universal Interface is protected by US patent
6,612,750.
Version number 5.0.0
ii FTB-5240S/5240BP
Page 3

Contents
Contents
Certification Information ....................................................................................................... vi
1 Introducing the FTB-5240S/5240BP Optical Spectrum Analyzer ................ 1
Models ....................................................................................................................................2
Typical Applications ................................................................................................................3
Conventions ............................................................................................................................4
2 Safety Information ....................................................................................... 5
3 Getting Started with Your Optical Spectrum Analyzer .............................. 7
Inserting and Removing Test Modules ....................................................................................7
Starting the Optical Spectrum Analyzer Application .............................................................12
Exiting the Application .........................................................................................................14
4 Preparing Your Optical Spectrum Analyzer for a Test .............................. 15
Cleaning and Connecting Optical Fibers ...............................................................................15
Installing the EXFO Universal Interface (EUI) .........................................................................17
Selecting a Test Mode ...........................................................................................................18
Nulling Electrical Offsets .......................................................................................................21
Performing User Calibration ..................................................................................................23
5 Setting Up the Instrument in WDM Mode ................................................ 37
Defining Preferences .............................................................................................................39
Setting Up WDM Analysis Parameters ...................................................................................58
Setting Up Acquisition Parameters ........................................................................................99
6 Setting Up the Instrument in Drift Mode ............................................... 103
Defining Preferences ...........................................................................................................105
Setting Up Drift Analysis Parameters ..................................................................................123
Setting Up Acquisition Parameters ......................................................................................159
7 Setting Up the Instrument in DFB Mode ................................................ 165
Defining Preferences ...........................................................................................................166
Setting Up Acquisition Parameters ......................................................................................179
8 Setting Up the Instrument in Spectral Transmittance Mode ................ 183
Defining Preferences ...........................................................................................................184
Setting Up Spectral Transmittance Analysis Parameters ......................................................198
Setting Up Acquisition Parameters ......................................................................................205
Optical Spectrum Analyzer iii
Page 4

Contents
9 Setting Up the Instrument in EDFA Mode ...............................................209
Defining Preferences ...........................................................................................................210
Setting Up EDFA Analysis Parameters .................................................................................230
Setting Up Acquisition Parameters .....................................................................................265
10 Testing DWDM Systems ............................................................................269
Using the Discover Feature .................................................................................................269
Starting a Measurement .....................................................................................................273
11 Managing Results .....................................................................................277
Managing WDM Test Results ..............................................................................................278
Managing Drift Test Results ................................................................................................320
Managing DFB Test Results .................................................................................................340
Managing Spectral Transmittance Test Results ....................................................................350
Managing EDFA Test Results ...............................................................................................368
Using Zoom Controls ..........................................................................................................396
Managing Trace Files ..........................................................................................................398
Generating Reports .............................................................................................................410
12 Maintenance ..............................................................................................421
Cleaning EUI Connectors ....................................................................................................422
Recalibrating the Unit .........................................................................................................424
Recycling and Disposal (Applies to European Union Only) ..................................................425
13 Troubleshooting ........................................................................................427
Viewing Online Documentation ..........................................................................................427
Contacting the Technical Support Group ............................................................................427
About .................................................................................................................................428
Transportation ....................................................................................................................430
14 Warranty ....................................................................................................431
General Information ...........................................................................................................431
Liability ...............................................................................................................................432
Exclusions ...........................................................................................................................433
Certification ........................................................................................................................433
Service and Repairs .............................................................................................................434
EXFO Service Centers Worldwide ........................................................................................435
iv FTB-5240S/5240BP
Page 5

Contents
A Technical Specifications ........................................................................... 437
B SCPI Command Reference ....................................................................... 439
Quick Reference Command Tree .........................................................................................440
Product-Specific Commands—Description ..........................................................................443
C Formulas Used with Your Optical Spectrum Analyzer ............................ 519
EDFA Noise Figure Calculation ............................................................................................519
Central Wavelength Calculation (Spectral Transmittance) ...................................................520
Bandwidth Calculation (Spectral Transmittance) .................................................................521
Index .............................................................................................................. 523
Optical Spectrum Analyzer v
Page 6

Certification Information
Certification Information
F.C.C. Information
Electronic test equipment is exempt from Part 15 compliance (FCC) in
the United States. However, compliance verification tests are
systematically performed on most EXFO equipment.
Information
Electronic test equipment is subject to the EMC Directive in the European
Union. The EN61326 standard prescribes both emission and immunity
requirements for laboratory, measurement, and control equipment.
This unit has undergone extensive testing according to the European Union
Directive and Standards.
vi FTB-5240S/5240BP
Page 7

Certification Information
DECLARATION OF CONFORMITY
Application of Council Directive(s): 2006/95/EC - The Low Voltage Directive
Manufacturer’s Name: EXFO Electro-Optical Engineering Inc.
Manufacturer’s Address: 400 Godin Avenue
Quebec, Quebec
(418) 683-0211
Equipment Type/Environment: Test & Measurement / Industrial
Trade Name/Model No.: FTB-5230/5240/5240B/5240BP/5240S
Standard(s) to which Conformity is Declared:
EN 61010-1:2001 Edition 2.0 Safety Requirements for Electrical Equipment for Measurement,
EN 61326-1:2006 Electrical Equipment for Measurement, Control and Laboratory
EN 60825-1:2007 Edition 2.0 Safety of laser products – Part 1: Equipment classification and
EN 55022: 2006 + A1: 2007 Information technology equipment — Radio disturbance
I, the undersigned, hereby declare that the equipment specified above conforms to the above Directive and Standards.
Manufacturer
Signature:
Control, and Laboratory Use – Part 1: General Requirements.
Use - EMC Requirements
requirements
characteristics — Limits and methods of measurement
2004/108/EC - The EMC Directive
93/68/EEC - CE Marking
And their amendments
Canada, G1M 2K2
Optical Spectrum Analyzer
Full Name: Stephen Bull, E. Eng
Position: Vice-President Research and
Address: 400 Godin Avenue, Quebec (Quebec),
Date: January 09, 2009
Development
Canada, G1M 2K2
Optical Spectrum Analyzer vii
Page 8

Page 9

1 Introducing the
FTB-5240S/5240BP Optical
Spectrum Analyzer
The FTB-5240S/5240BP Optical Spectrum Analyzer (OSA) is designed to
measure optical power as a function of wavelength or frequency and
Optical Signal to Noise Ratio (OSNR).
Your Optical Spectrum Analyzer offers truly portable spectral
characterization for DWDM network commissioning as well as In-Band
Optical Signal to Noise Ratio (OSNR) measurement for ROADM and
40 Gbit/s signals and networks.
The FTB-5240S is an expert DWDM OSA that is designed for efficient
commissioning, maintenance and trouble-shooting of DWDM components
and links in the field, from 50 GHz to CWDM network.
Handle
Input port
The FTB-5240BP is a high-resolution OSA designed for accurate and
precise spectral measurements, even for channels with 12.5 GHz spacing.
Optical Spectrum Analyzer 1
Page 10

Introducing the FTB-5240S/5240BP Optical Spectrum Analyzer
Models
Models
The Optical Spectrum Analyzer comes in different models:
³ FTB-5240S: The FTB-5240S is a small form factor expert OSA (two-slot
unit). It offers new modulation schemes, such as non-return-to-zero
(NRZ), duo binary, differential phase-shift keying (DPSK), quadrature
phase shift keying (QPSK), which present large line widths and often
display multiple peaks. In-depth analysis ensures the correct
identification and signal measurement of each carrier.
³ FTB-5240S-P: It is the FTB-5240S model with a polarization controller. It
is a hardware-ready version of an expert OSA (two-slot unit), without
the software to compute the In-Band OSNR. You can upgrade this
model on field using the software key, and it will become fully capable
of In-Band OSNR measurement.
³ FTB-5240S-P-InB: It is the FTB-5240 S-P model (two-slot unit) with the
addition of an automated and integrated polarization controller. It is
possible to change the state of polarization (SOP) at the input of the
OSA and take advantage of a polarization diverse design to determine
the OSNR in the band of a DWDM channel. This is required when noise
is not flat under adjacent peaks or when crosstalk is dominant.
³ FTB-5240BP: It is a three-slot model with a polarization controller for
automated In-band testing and better optical performance.
³ High Power Model (HPW): This model allows you to connect the
FTB-5240S or FTB-5240S-P OSA to a network that carries very high
optical power. This situation becomes more common with the
deployment of latest CATV networks. The sensitivity of this OSA model
is shifted accordingly and the module is protected to work under these
extended power levels.
2 FTB-5240S/5240BP
Page 11

Introducing the FTB-5240S/5240BP Optical Spectrum Analyzer
Typical Applications
Typical Applications
You can use your Optical Spectrum Analyzer for the following tasks:
³ Characterizing channels in the O- to U-band spectra
³ Testing laser sources for spectral purity and power distribution
³ Testing the transmission characteristics of optical devices
³ Troubleshooting and monitoring key parameters on CWDM or DWDM
signals to check system stability
³ Characterizing all channel spacings, from 50 GHz DWDM to CWDM
(from 12.5 GHz for FTB-5240BP)
³ Testing high-speed networks (40 Gbit/s and higher)
³ Measuring OSNR, but specifically within the channel (In-Band OSNR)
for FTB-5240S-P-InB and FTB-5240BP models
Optical Spectrum Analyzer 3
Page 12

Introducing the FTB-5240S/5240BP Optical Spectrum Analyzer
Conventions
Conventions
Before using the product described in this manual, you should understand
the following conventions:
WARNING
Indicates a potentially hazardous situation which, if not avoided,
could result in death or serious injury. Do not proceed unless you
understand and meet the required conditions.
CAUTION
Indicates a potentially hazardous situation which, if not avoided,
may result in minor or moderate injury. Do not proceed unless you
understand and meet the required conditions.
CAUTION
Indicates a potentially hazardous situation which, if not avoided,
may result in component damage. Do not proceed unless you
understand and meet the required conditions.
IMPORTANT
Refers to information about this product you should not overlook.
4 FTB-5240S/5240BP
Page 13
2 Safety Information
WARNING
Do not install or terminate fibers while a light source is active.
Never look directly into a live fiber and ensure that your eyes are
protected at all times.
WARNING
Use of controls, adjustments and procedures for operation and
maintenance other than those specified herein may result in
hazardous radiation exposure or impair the protection provided by
this unit.
Your instrument is a Class 1 laser product in compliance with standards
IEC 60825-1:2007 and 21 CFR 1040.10. Laser radiation may be encountered
at the output port.
The following label indicates that a product contains a Class 1 source:
CLASS 1
LASER PRODUCT
Note: Label shown for information purposes only. It is not affixed to your product.
Optical Spectrum Analyzer 5
Page 14

Page 15

3 Getting Started with Your
Optical Spectrum Analyzer
Inserting and Removing Test Modules
CAUTION
Never insert or remove a module while the FTB-500 is turned on.
This will result in immediate and irreparable damage to both the
module and unit.
WARNING
When the laser safety LED ( ) is flashing on the FTB-500, at least
one of your modules is emitting an optical signal. Please check all
modules, as it might not be the one you are currently using.
To insert a module into the FTB-500:
1. Exit ToolBox and turn off your unit.
2. Position the FTB-500 so that its right panel is facing you.
Optical Spectrum Analyzer 7
Page 16
Getting Started with Your Optical Spectrum Analyzer
Inserting and Removing Test Modules
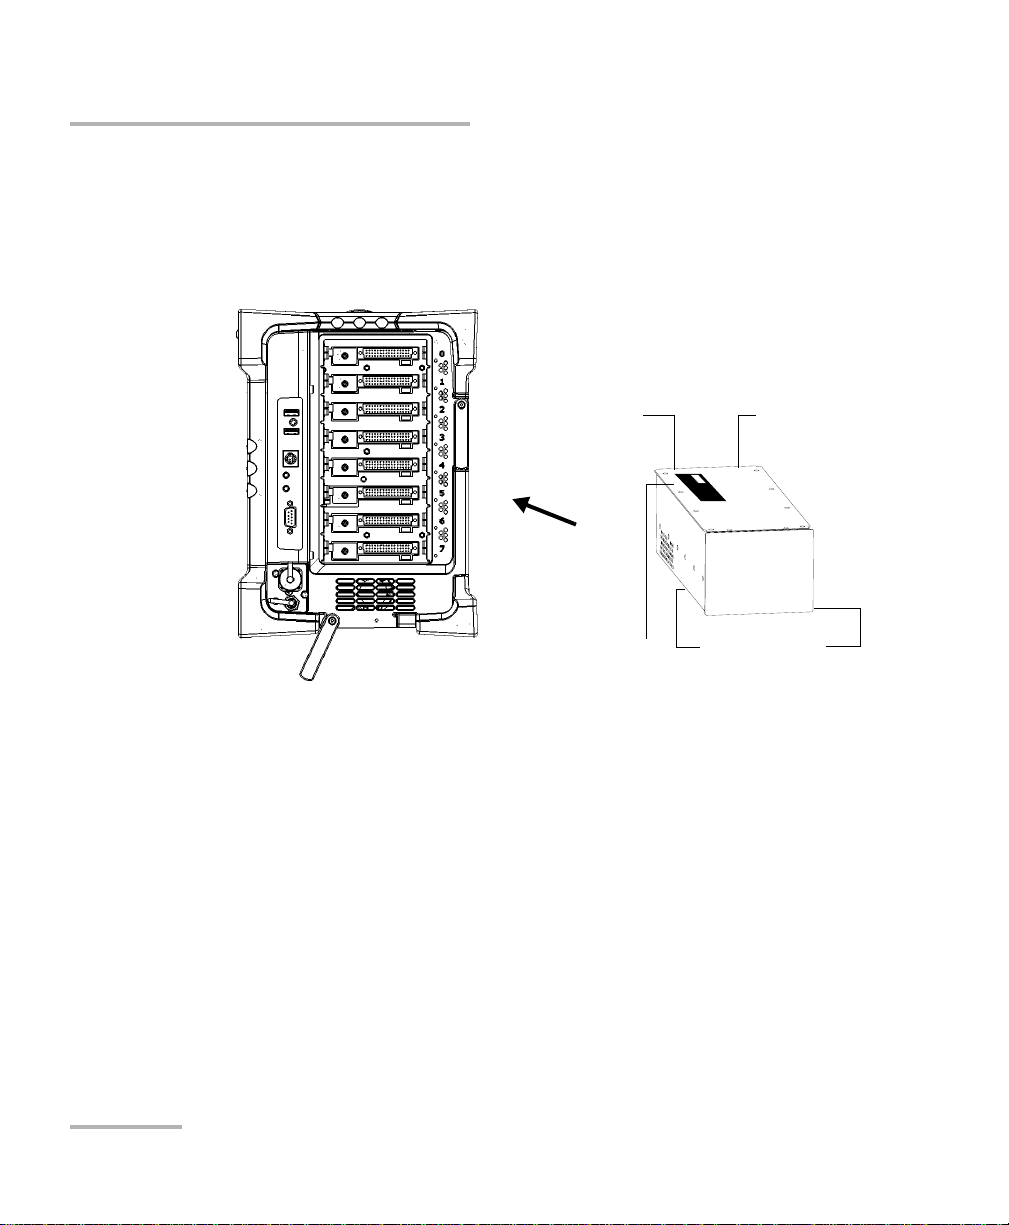
3. Take the module and place it so that the connector pins are at the
back, as explained and shown below.
Identification sticker must be facing up and connector pins at the right
of the retaining screw hole.
FTB-500 right panel
4. Insert the protruding edges of the module into the grooves of the
5. Push the module all the way to the back of the slot, until the retaining
6. Place the FTB-500 so that its left panel is facing you.
Retaining screw
hole at the
back
Identification sticker
facing up
receptacle’s module slot.
screw makes contact with the receptacle casing.
Connector
pins at the
back
Protruding edges
at bottom
8 FTB-5240S/5240BP
Page 17
Getting Started with Your Optical Spectrum Analyzer
Inserting and Removing Test Modules
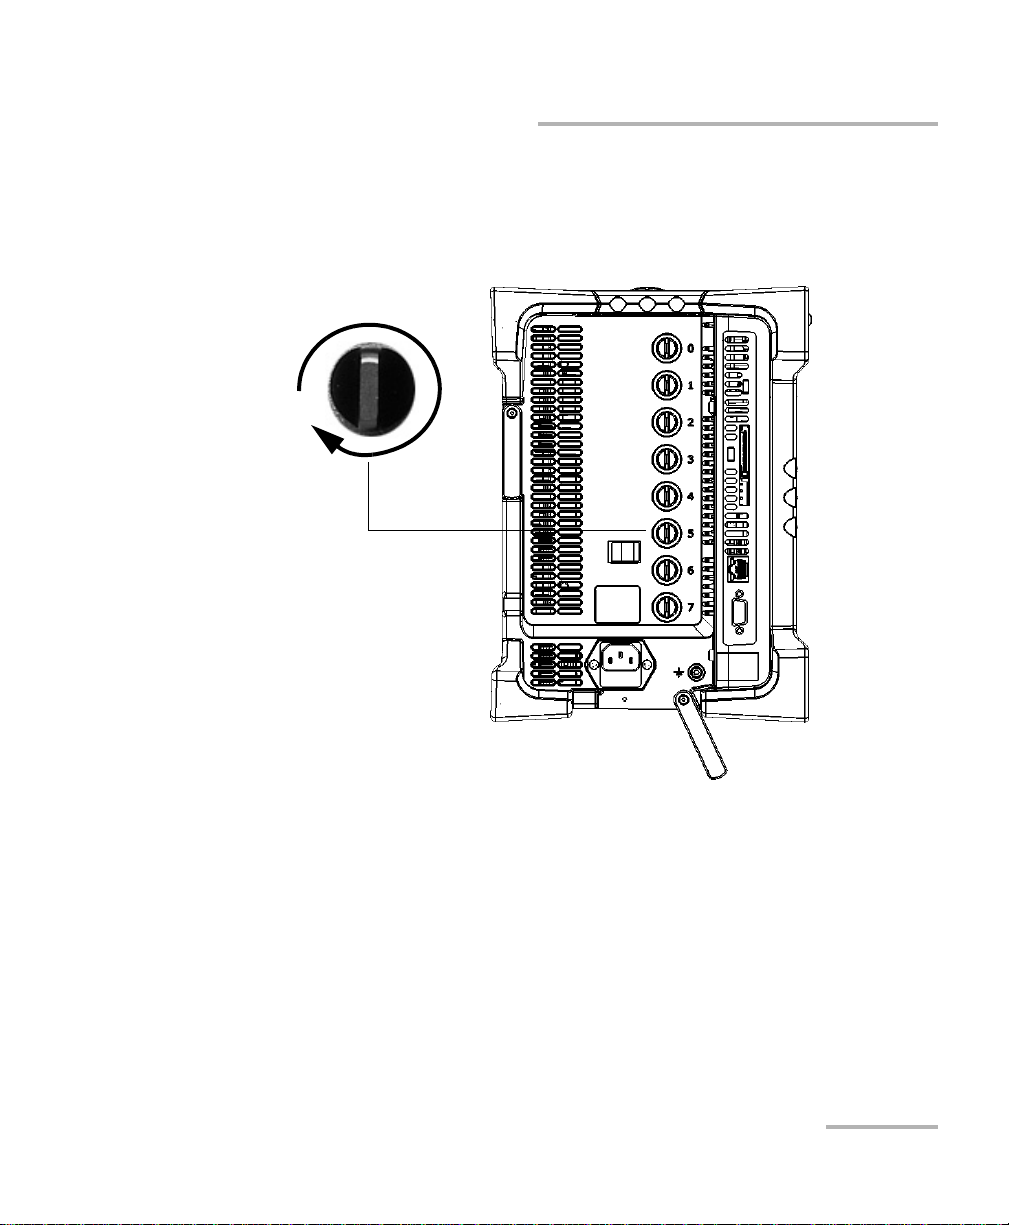
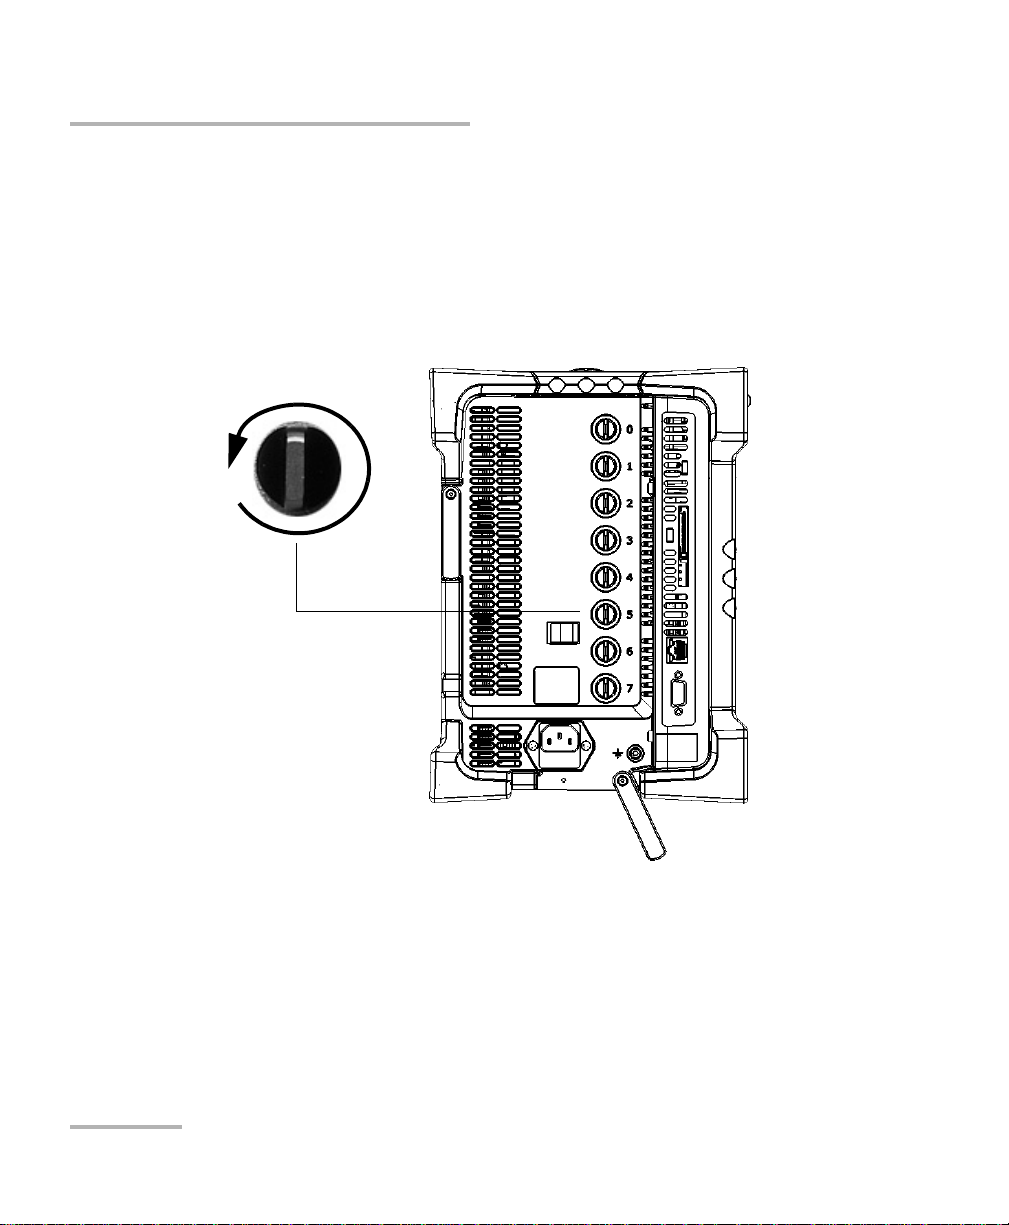
7. While applying slight pressure to the module, turn the retaining screw
clockwise until it is tightened.
This will secure the module into its “seated” position.
Turn retaining screw knob
clockwise
FTB-500 left panel
When you turn on the unit, the startup sequence will automatically detect
the module.
Optical Spectrum Analyzer 9
Page 18
Getting Started with Your Optical Spectrum Analyzer
Inserting and Removing Test Modules
To remove a module from the FTB-500:
1. Exit ToolBox and turn off your unit.
2. Position the FTB-500 so that the left panel is facing you.
3. Turn the retaining screw counterclockwise until it stops.
The module will be slowly released from the slot.
Turn retaining screw knob(s)
counterclockwise
FTB-500 left panel
4. Place the FTB-500 so that the right panel is facing you.
10 FTB-5240S/5240BP
Page 19
Getting Started with Your Optical Spectrum Analyzer
Inserting and Removing Test Modules
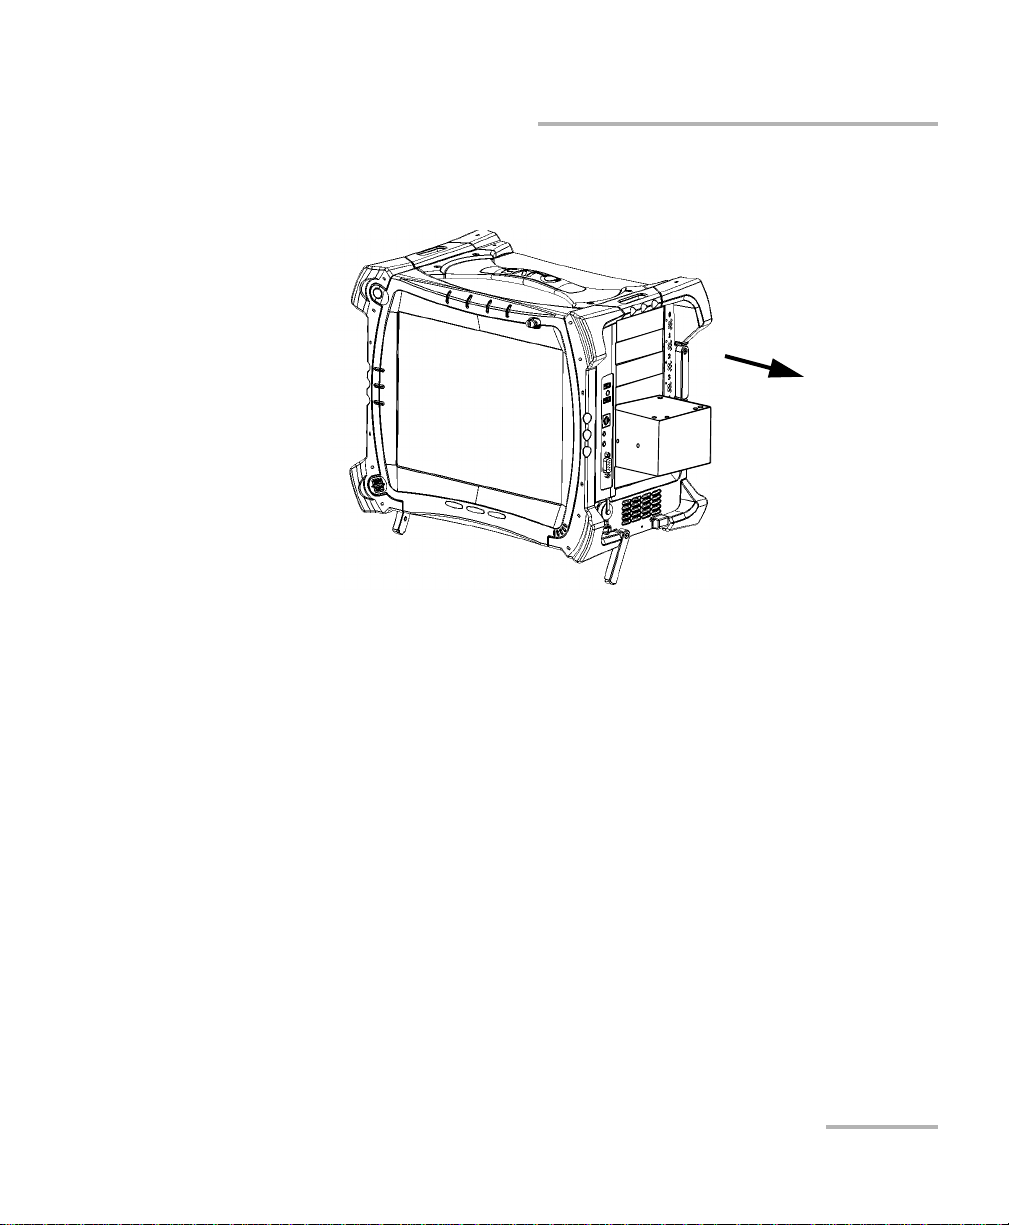
5. Hold the module by its sides or by the handle (NOT by the connector)
and pull it out.
Optical Spectrum Analyzer 11
Page 20
Getting Started with Your Optical Spectrum Analyzer
Starting the Optical Spectrum Analyzer Application
Starting the Optical Spectrum Analyzer
Application
Your FTB-5240S/5240BP Optical Spectrum Analyzer module can be
configured and controlled from its dedicated ToolBox application.
Note: For details about ToolBox, refer to the FTB-500 user guide.
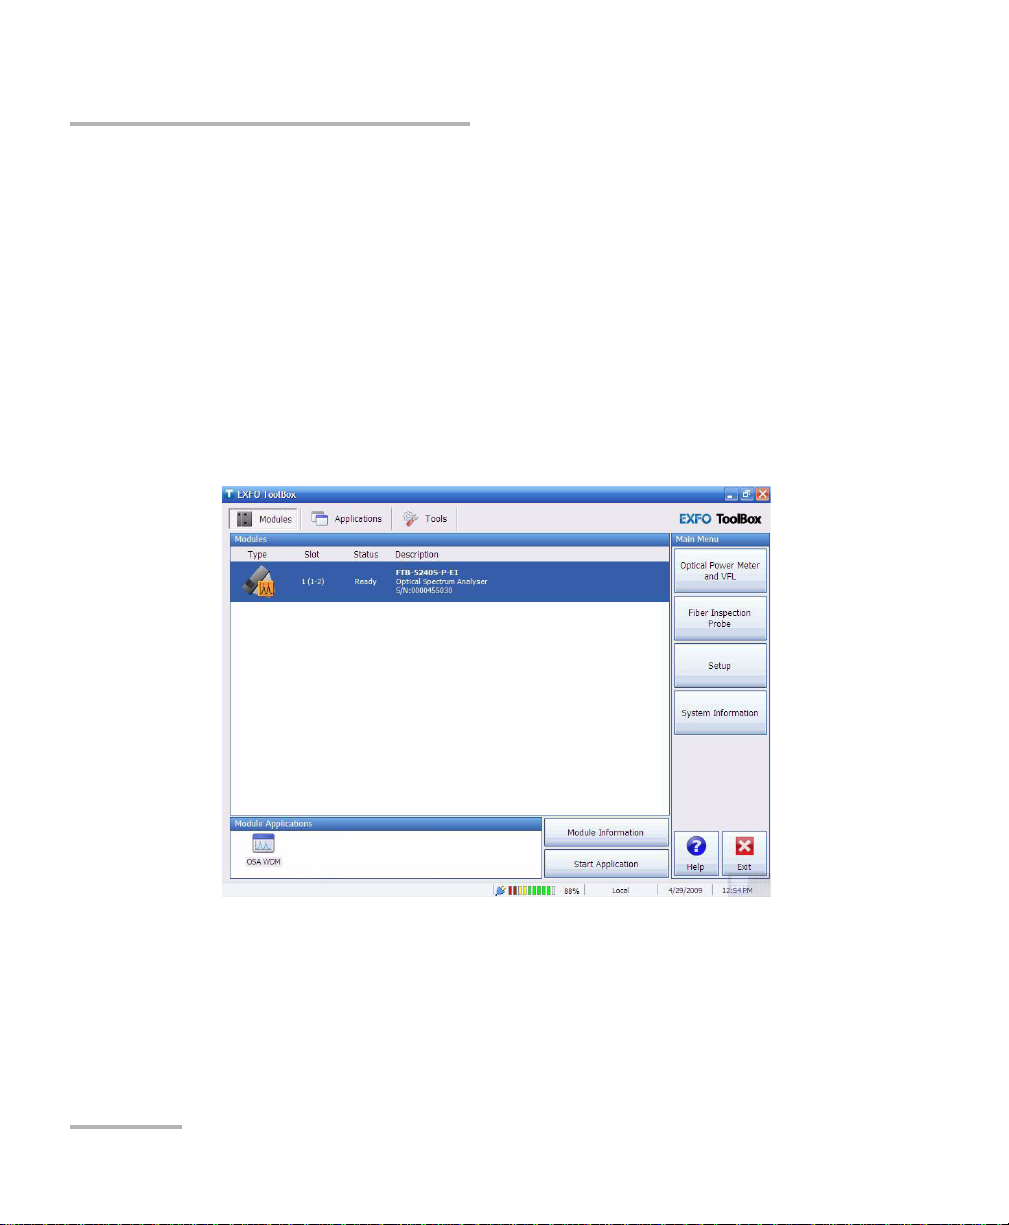
To start the application:
1. From the main window, select the module to use.
It will turn blue to indicate that it is highlighted.
2. Click the corresponding button in the Module Applications box.
12 FTB-5240S/5240BP
Page 21
Display
panes
Result
panes
Getting Started with Your Optical Spectrum Analyzer
Starting the Optical Spectrum Analyzer Application
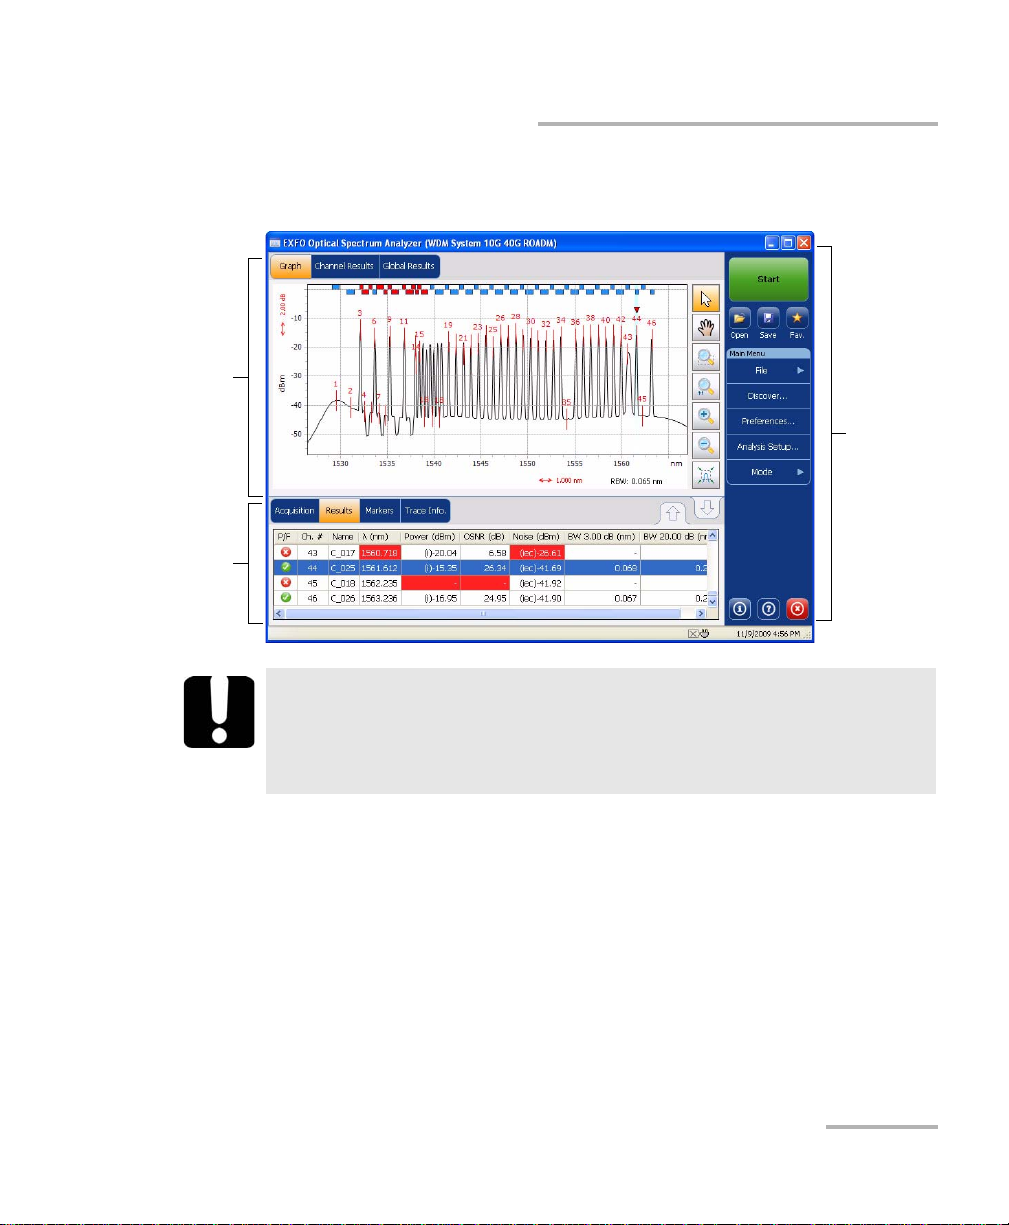
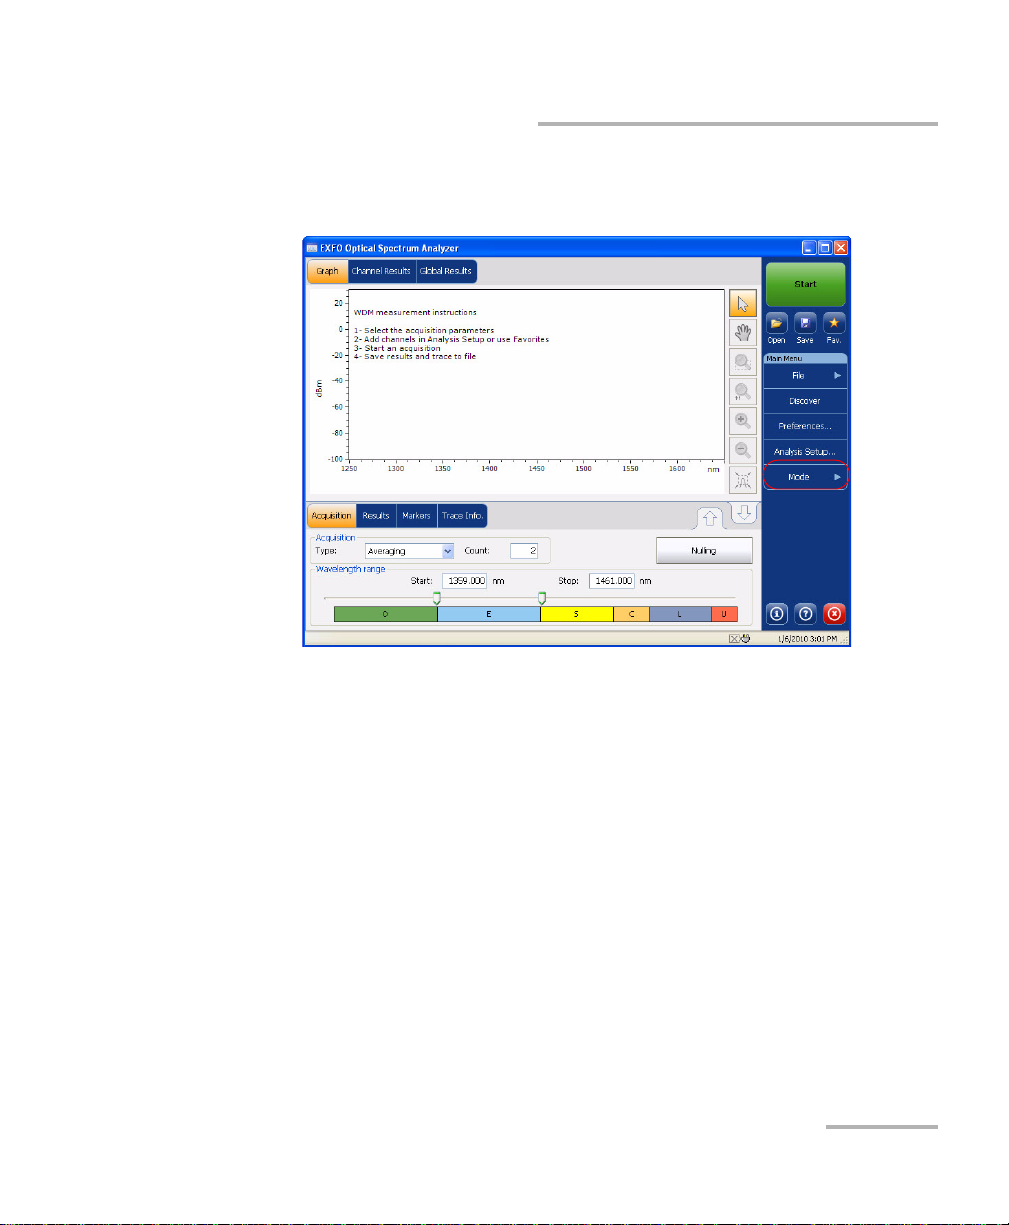
The main window (shown below) contains all the commands required to
control the Optical Spectrum Analyzer:
Function
buttons
IMPORTANT
For optimal test results, you must allow a minimum warm up
period of two hours for your Optical Spectrum Analyzer before
starting your tests.
Optical Spectrum Analyzer 13
Page 22
Getting Started with Your Optical Spectrum Analyzer
Exiting the Application
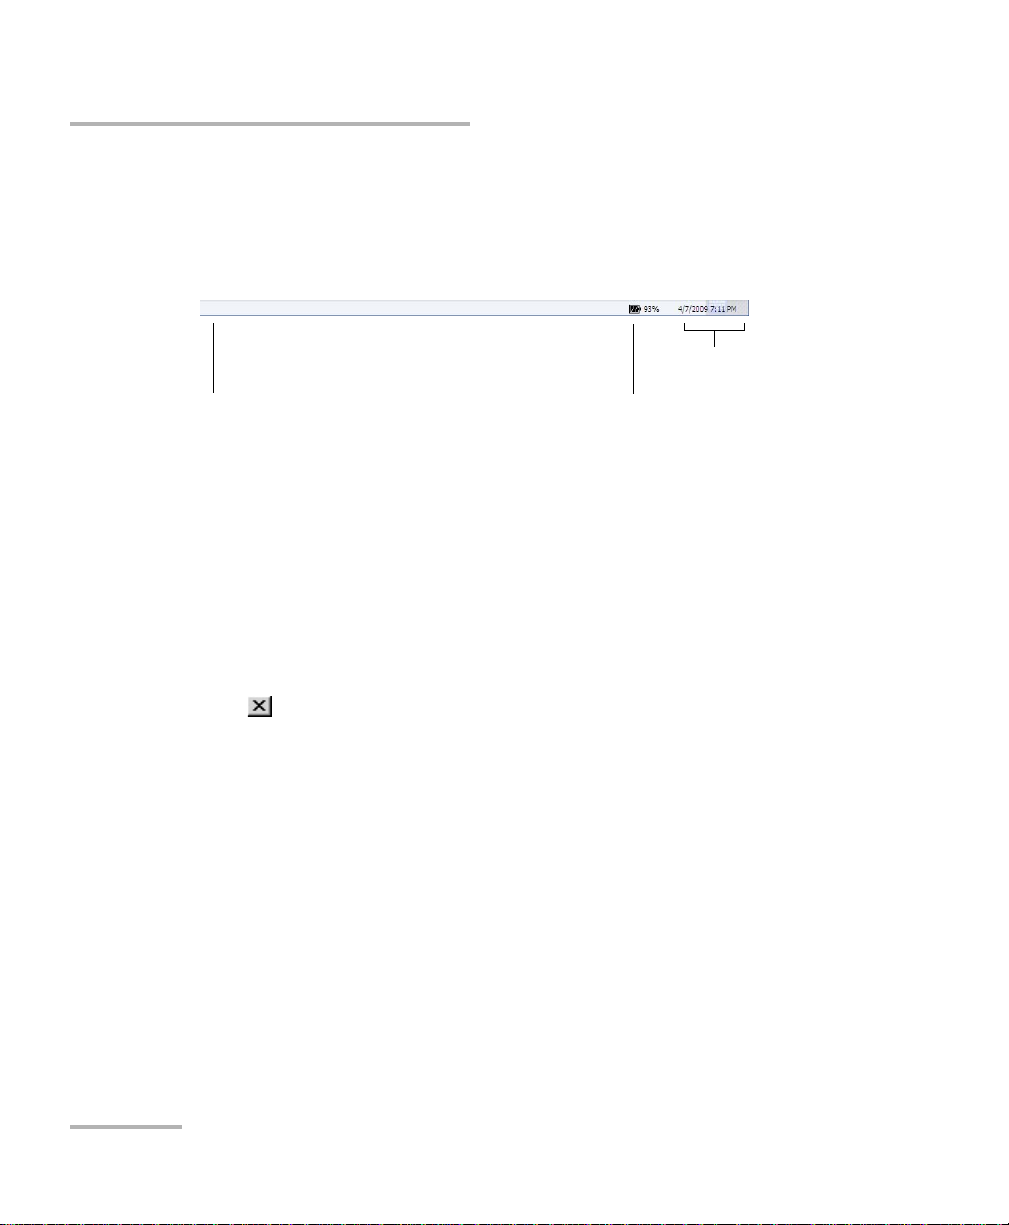
Status Bar
The status bar, located at the bottom of the main window, identifies the
current operational status of the FTB-5240S/5240BP Optical Spectrum
Analyzer.
Current date and time
Module status
For more information about automating or remotely controlling the
FTB-5240S/5240BP Optical Spectrum Analyzer, refer to the FTB-500 user
guide.
Battery indicator
Exiting the Application
Closing any application that is not currently being used helps freeing
system memory.
To close the application from the main window:
Click in the top right corner of the main window.
OR
Click the Exit button located at the bottom of the function bar.
14 FTB-5240S/5240BP
Page 23

4 Preparing Your Optical
Spectrum Analyzer for a Test
IMPORTANT
For optimal test results, you must allow a minimum warm up
period of two hours for your Optical Spectrum Analyzer before
starting your tests.
Cleaning and Connecting Optical Fibers
IMPORTANT
To ensure maximum power and to avoid erroneous readings:
³ Always inspect fiber ends and make sure that they are clean as
explained below before inserting them into the port. EXFO is
not responsible for damage or errors caused by bad fiber
cleaning or handling.
³ Ensure that your patchcord has appropriate connectors. Joining
mismatched connectors will damage the ferrules.
To connect the fiber-optic cable to the port:
1. Inspect the fiber using a fiber inspection microscope. If the fiber is
clean, proceed to connecting it to the port. If the fiber is dirty, clean it as
explained below.
2. Clean the fiber ends as follows:
2a. Gently wipe the fiber end with a lint-free swab dipped in isopropyl
alcohol.
2b. Use compressed air to dry completely.
2c. Visually inspect the fiber end to ensure its cleanliness.
Optical Spectrum Analyzer 15
Page 24

Preparing Your Optical Spectrum Analyzer for a Test
Cleaning and Connecting Optical Fibers
3. Carefully align the connector and port to prevent the fiber end from
touching the outside of the port or rubbing against other surfaces.
If your connector features a key, ensure that it is fully fitted into the
port’s corresponding notch.
4. Push the connector in so that the fiber-optic cable is firmly in place,
thus ensuring adequate contact.
If your connector features a screwsleeve, tighten the connector
enough to firmly maintain the fiber in place. Do not overtighten, as this
will damage the fiber and the port.
Note: If your fiber-optic cable is not properly aligned and/or connected, you will
notice heavy loss and reflection.
16 FTB-5240S/5240BP
Page 25
Preparing Your Optical Spectrum Analyzer for a Test
Installing the EXFO Universal Interface (EUI)
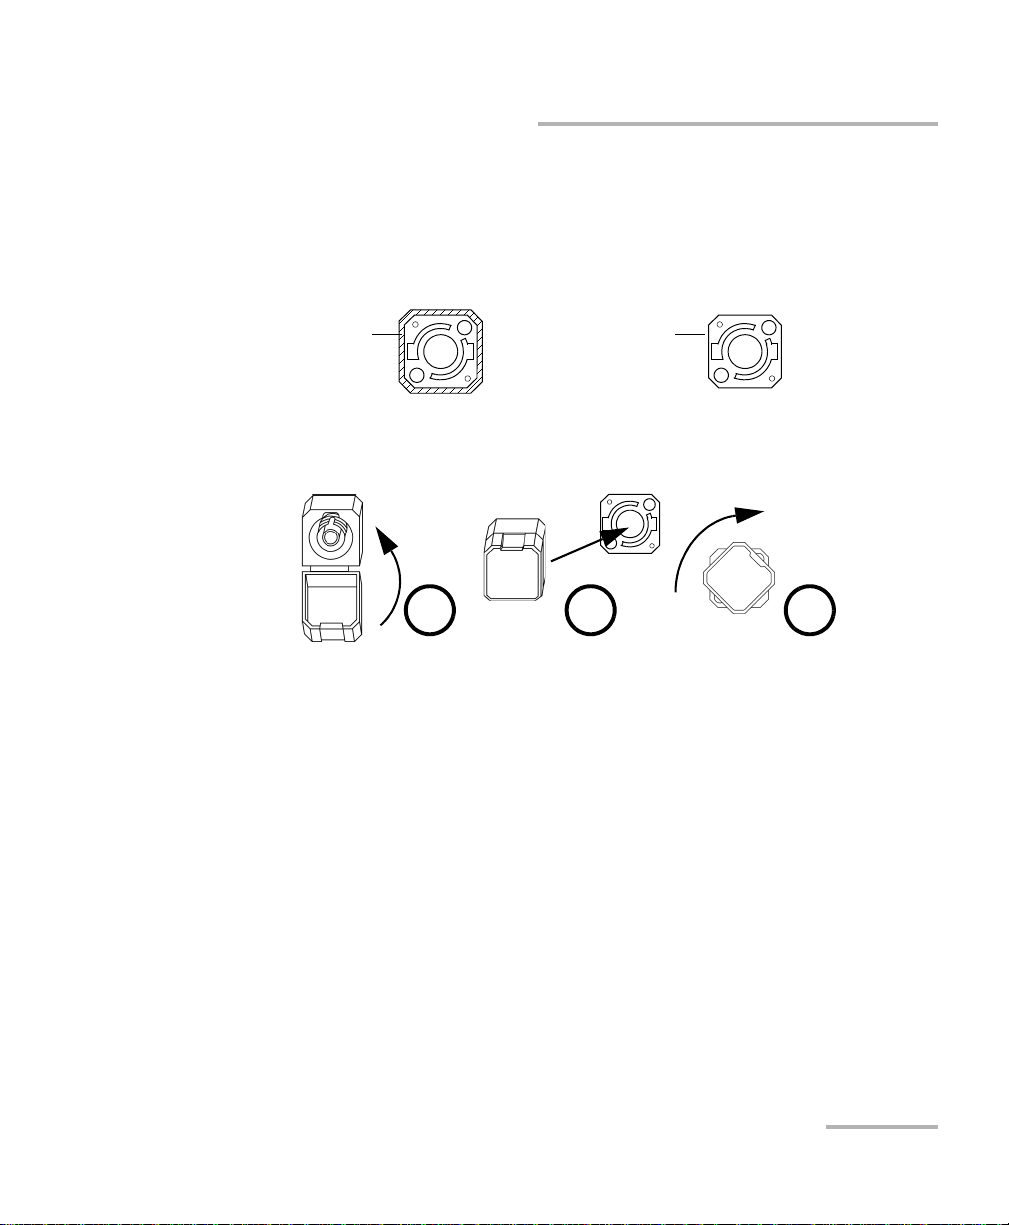
Installing the EXFO Universal Interface (EUI)
The EUI fixed baseplate is available for connectors with angled (APC) or
non-angled (UPC) polishing. A green border around the baseplate
indicates that it is for APC-type connectors.
Green border
indicates APC
option
Bare metal
(or blue border)
indicates UPC
option
To install an EUI connector adapter onto the EUI baseplate:
1. Hold the EUI connector adapter so the dust cap opens downwards.
2 3 4
2. Close the dust cap in order to hold the connector adapter more firmly.
3. Insert the connector adapter into the baseplate.
4. While pushing firmly, turn the connector adapter clockwise on the
baseplate to lock it in place.
Optical Spectrum Analyzer 17
Page 26

Preparing Your Optical Spectrum Analyzer for a Test
Selecting a Test Mode
Selecting a Test Mode
Your Optical Spectrum Analyzer gives you different ways to test all your
DWDM systems. Your OSA provides the following test modes:
³ WDM: Allows you to analyze an optical link using an OSA module. By
default, WDM test mode is selected.
³ Drift: Allows you to monitor an optical link for a fixed duration using an
OSA module.
³ DFB: Allows you to characterize a DFB laser source using the OSA
module.
³ Spectral Transmittance: Allows you to characterize the spectral
transmittance of optical components such as filters.
³ EDFA: Allows you to characterize the performance of an Erbium Doped
Fiber Amplifier (EDFA) using the OSA module in field deployed systems
(NB measurement assumes transmission conditions).
18 FTB-5240S/5240BP
Page 27
Preparing Your Optical Spectrum Analyzer for a Test
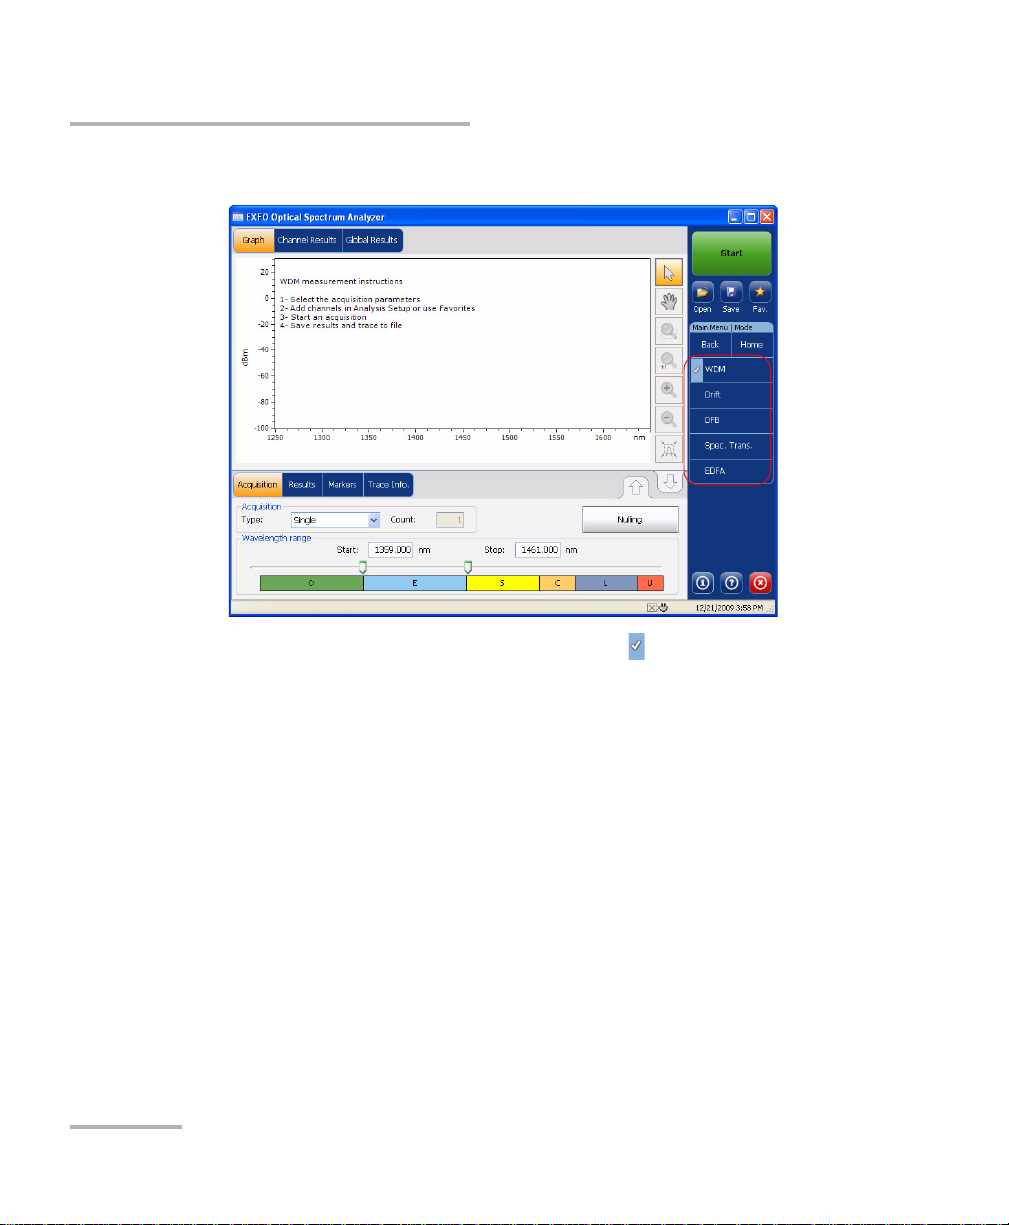
To select a test mode:
1. From the main menu, press Mode.
Selecting a Test Mode
Optical Spectrum Analyzer 19
Page 28
Preparing Your Optical Spectrum Analyzer for a Test
Selecting a Test Mode
2. Select the desired test mode.
Once you select the mode, you will notice a against the selected
mode and all the tabs on the main window and the main menu will
change accordingly.
After selecting the test mode, you must configure it. You will find the
instructions in Setting Up the Instrument in WDM Mode on page 37,
Setting Up the Instrument in Drift Mode on page 103, Setting Up the
Instrument in DFB Mode on page 165, Setting Up the Instrument in
Spectral Transmittance Mode on page 183 and Setting Up the
Instrument in EDFA Mode on page 209.
20 FTB-5240S/5240BP
Page 29
Preparing Your Optical Spectrum Analyzer for a Test
Nulling Electrical Offsets
Nulling Electrical Offsets
The offset nulling process provides a zero-power reference measurement,
thus eliminating the effects of electronic offsets and dark current due to
detectors.
Temperature and humidity variations affect the performance of electronic
circuits and optical detectors. For this reason, EXFO recommends
performing a nulling of the electrical offsets whenever environmental
conditions change.
Nulling can be performed for all tests modes. In addition, a nulling is
performed automatically each time you start the OSA application, and at
regular intervals afterwards for WDM test mode.
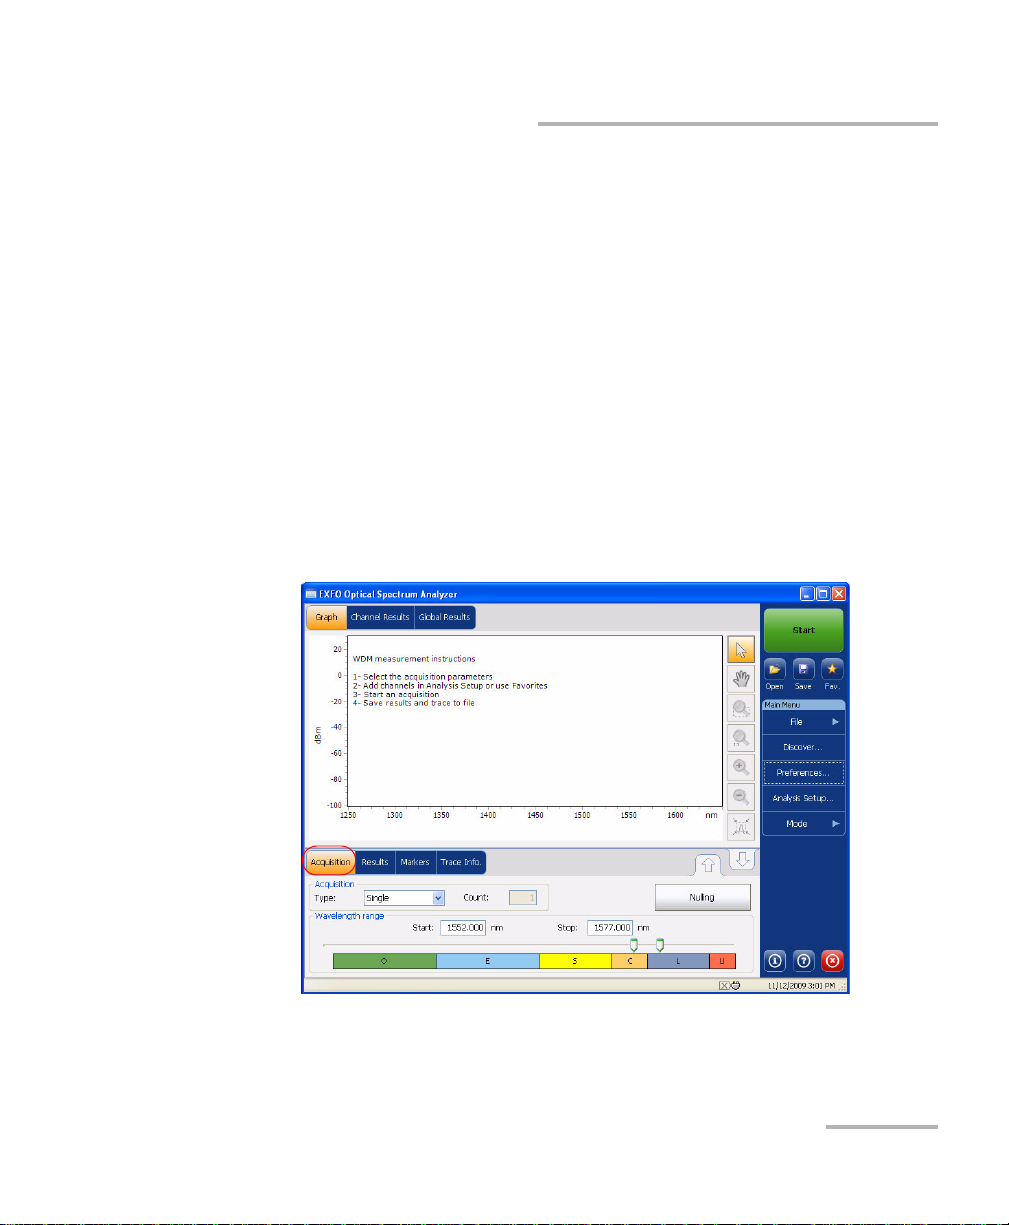
To perform offset nulling:
1. From the main window, select the Acquisition tab.
2. Disconnect any incoming signal to obtain an optimal accuracy.
Optical Spectrum Analyzer 21
Page 30
Preparing Your Optical Spectrum Analyzer for a Test
Nulling Electrical Offsets
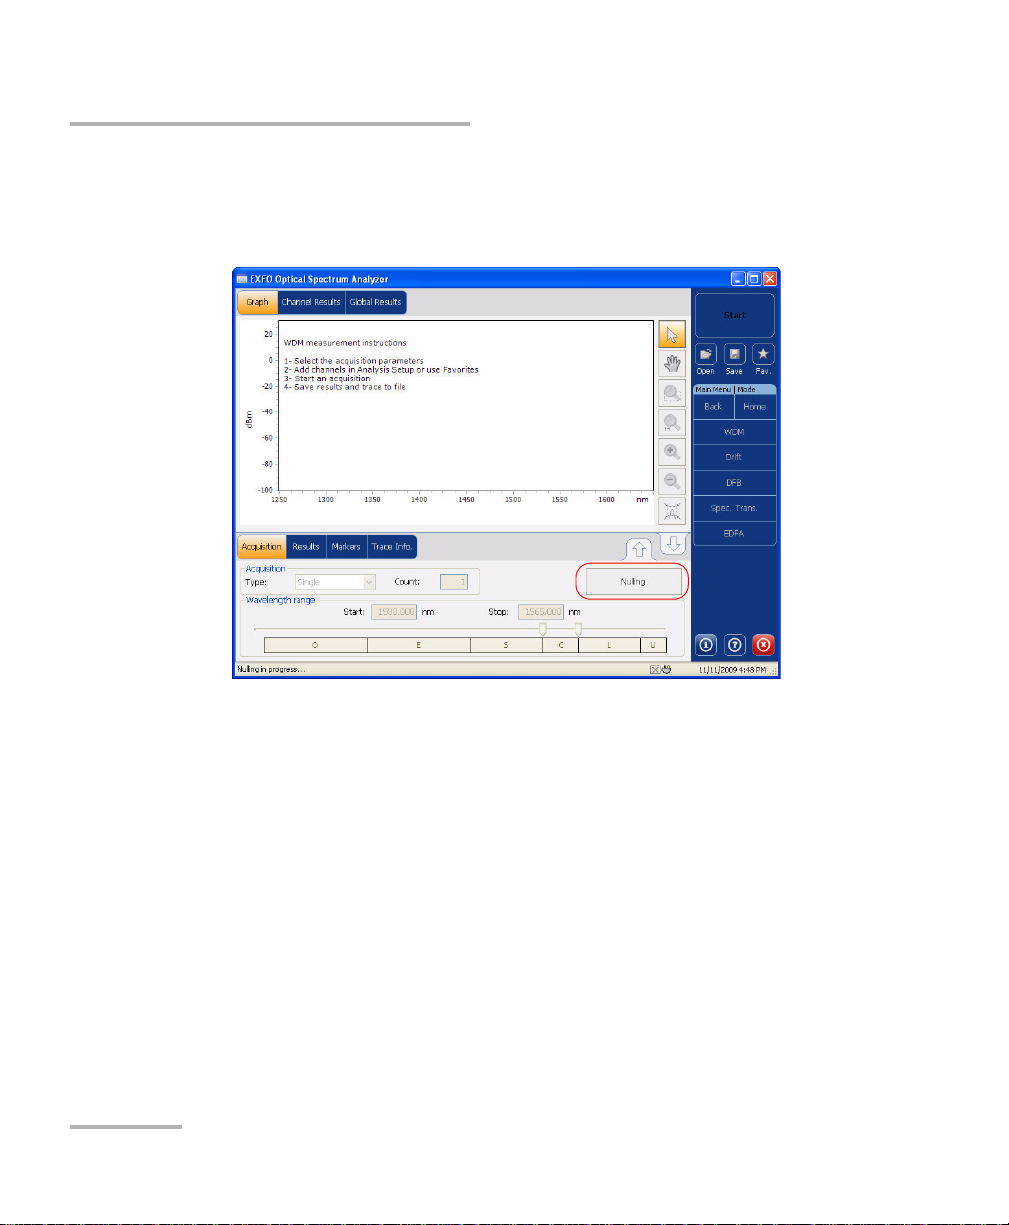
3. Press Nulling.
You are notified that the nulling is in progress in the status bar. Nulling
should be completed in a few seconds.
Note: The Start and Discover options are not available during the nulling
process.
22 FTB-5240S/5240BP
Page 31

Preparing Your Optical Spectrum Analyzer for a Test
Performing User Calibration
Performing User Calibration
Calibrating your module can help you achieve better results. It is
particularly important when the measurement accuracy is critical or when
your OSA has experienced unusual shock or vibrations. To reach the
highest possible accuracy, you can perform a wavelength or power
calibration. Your OSA allows you to modify and read the user calibration
values, revert to the factory calibration, load and save the modified user
calibration file. The user configuration file (*.txt) contains the reference
and modified wavelength and power values.
You can perform user calibration for all tests modes. Select a test mode as
explained in Selecting a Test Mode on page 18, and follow the procedures
mentioned below for performing user calibration.
Note: The procedure for performing user calibration is the same for all test
modes. The procedure is explained with WDM mode only in this document.
IMPORTANT
For optimal results, you must allow a minimum warm up period of
two hours for your Optical Spectrum Analyzer before performing
user calibration.
IMPORTANT
The correction factor list must be cleared before making new
calibration measurements. If calibration measurements are made
when user correction factors are inside the module, they will affect
the measurements and the calibration results will be inapplicable.
Optical Spectrum Analyzer 23
Page 32

Preparing Your Optical Spectrum Analyzer for a Test
Performing User Calibration
A high level sequence of steps to perform user calibration are listed below,
with the detailed instructions in the following procedures.
³ Proper warm-up is required before performing user calibration.
³ If user correction factors are present in the module (indicated by a
message in calibration page),
³ save a backup copy of the correction factors (optional but strongly
recommended).
³ clear user correction factors.
³ Make measurements.
³ Write measurement to text file according to following format.
³ First column: reference wavelength in nm
³ Second column: wavelength (in nm) read using the OSA
application and module
³ Third column: reference power in dBm
³ Fourth column: power (in dBm) read using the OSA application
and module
100 calibration points limit in the application. Each value in the file
must be separated using semi-colon (;) character.
³ Write new correction factors inside the module
³ Load the text file built at preceding step
³ Press Write to Module.
The application shows a warning message indicating to clear
correction factors before making new measurements
³ Verify that calibration points are properly applied.
24 FTB-5240S/5240BP
Page 33

Preparing Your Optical Spectrum Analyzer for a Test
Performing User Calibration
An example of the calibration file format is given below.
1310.154; 1310.167; -1.34; -1.55
1490.000; 1490.000; 1.09; 1.15
1551.334; 1551.298; -5.20; -5.45
1625.401; 1625.448; 0.00; 0.00
Note: The decimal separator is a point ( . ). This decimal separator is constant
independent of what the regional settings are.
To perform a user calibration:
1. From the Main Menu, press Analysis Setup.
Optical Spectrum Analyzer 25
Page 34

Preparing Your Optical Spectrum Analyzer for a Test
Performing User Calibration
2. Select the Calibration tab.
Note: You cannot edit the power or wavelength values directly from the
application. The modifications in the user calibration have to be made in a
text file, and then it can be loaded in the application.
26 FTB-5240S/5240BP
Page 35

Preparing Your Optical Spectrum Analyzer for a Test
Performing User Calibration
3. If a user calibration file exists, press Load Factors to load the file.
4. Select the modified user calibration file and press Open.
Optical Spectrum Analyzer 27
Page 36

Preparing Your Optical Spectrum Analyzer for a Test
Performing User Calibration
The calibration values will replace the Correction factors list in the
Analysis setup - Calibration window.
28 FTB-5240S/5240BP
Page 37

Preparing Your Optical Spectrum Analyzer for a Test
Performing User Calibration
5. Press Write to Module to apply the modified calibration values to the
module.
Optical Spectrum Analyzer 29
Page 38

Preparing Your Optical Spectrum Analyzer for a Test
Performing User Calibration
6. To verify that the calibration changes are properly applied to the
module, press Load from Module.
Note: OK and Cancel buttons do not have any impact on the calibration page or
the correction factors inside the module.
30 FTB-5240S/5240BP
Page 39

Preparing Your Optical Spectrum Analyzer for a Test
To clear user correction factors:
1. From the Main Menu, press Analysis Setup.
Performing User Calibration
Optical Spectrum Analyzer 31
Page 40

Preparing Your Optical Spectrum Analyzer for a Test
Performing User Calibration
2. Select the Calibration tab.
32 FTB-5240S/5240BP
Page 41

Preparing Your Optical Spectrum Analyzer for a Test
Performing User Calibration
3. Press Clear user correction factors, to load the factory calibration
values.
Note: The application will ask if you want to clear user correction factors on the
module and the user calibration will be removed. Press Yes or No as
required.
Note: OK and Cancel buttons do not have any impact on the calibration page or
the correction factors inside the module.
Optical Spectrum Analyzer 33
Page 42

Preparing Your Optical Spectrum Analyzer for a Test
Performing User Calibration
To save a user calibration:
1. From the Main Menu, press Analysis Setup.
34 FTB-5240S/5240BP
Page 43

Preparing Your Optical Spectrum Analyzer for a Test
2. Select the Calibration tab.
Performing User Calibration
Optical Spectrum Analyzer 35
Page 44

Preparing Your Optical Spectrum Analyzer for a Test
Performing User Calibration
3. Press Save Factors, to save the modified user calibration values.
36 FTB-5240S/5240BP
Page 45

5 Setting Up the Instrument in
WDM Mode
Before performing a spectral analysis in the WDM mode, you must set up
your OSA module and the test application with the appropriate parameters,
as explained in this chapter.
Select the WDM test mode as explained in Selecting a Test Mode on
page 18 before setting up the WDM test parameters.
³ The preferences are the result displayed in the graph and tables, as
well as the job information and related comments saved with each file
(See Defining Preferences on page 39 for more details).
³ The analysis parameters include the channel list details, pass-fail
threshold settings and allows you to select the noise and power
calculation methods (See Setting Up WDM Analysis Parameters on
page 58 for more details).
³ The acquisition parameters include the type of measurement you want
to perform and the wavelength range (See Setting Up Acquisition
Parameters on page 99 for more details).
You can set up your unit in different manners, depending on your testing
needs. The four possible ways for WDM mode are preferred, easy, efficient
and post-processing.
³ The preferred way is to use the complete analysis setup parameters
and complete the information in all tables, as explained in Setting Up
WDM Analysis Parameters on page 58. This setup will be used for the
next acquisition.
³ The easiest way to set up the instrument, especially when the operator
does not know in advance what to expect at the input of the OSA is to
use the Discover button. After Discover button has been pressed, a
measurement and analysis will be performed according to the best
setup determined by the instrument and this setup will be used for the
next scan. This is explained in Using the Discover Feature on page 269.
Optical Spectrum Analyzer 37
Page 46

Setting Up the Instrument in WDM Mode
³ The most efficient way to setup the instrument is to use one of the
favorites configurations, uploading a pre-customized acquisition and
analysis setup configuration. The operator in the field only has to press
the star button, select the appropriate configuration and press Start. As
an example, a pre-customized configuration could be: “32 channels
DWDM 50GHz”; “Toronto-Montreal CWDM” or “Vendor ABC DWDM
ROADM 40Gb”. This is explained in Managing Favorites on page 86.
³ The post-processing optimized way to setup the instrument is to
change the active trace analysis parameters until satisfactory from the
Channel Results and Global Results tabs, apply those changes to the
analysis setup to use it for future measurements, and re-analyze the
trace with those parameters. This is explained in Changing Active Trace
Analysis Parameters and Re-analyzing on page 306.
38 FTB-5240S/5240BP
Page 47

Setting Up the Instrument in WDM Mode
Defining Preferences
Defining Preferences
The preferences window allows you to set general information and
comments on trace, set display parameters and customize the WDM
results table. This information is saved with all the traces.
Defining Trace Information
The trace information relates to the description of the job to be done, cable
and job IDs, and any relevant information about what is being tested.
The Link ID is used by the application to propose a file name when you
want to save the current acquisition. The link parameters are prefix and
suffix values (file names) for the link IDs.
To enter general information:
1. From the Main Menu, press Preferences.
Optical Spectrum Analyzer 39
Page 48

Setting Up the Instrument in WDM Mode
Defining Preferences
2. Select the General tab.
3. Define the general parameters as needed.
4. Press OK to save the changes and close the window, or press Cancel to
exit without saving.
Press Clear to clear all the changes made in the General tab.
40 FTB-5240S/5240BP
Page 49

Setting Up the Instrument in WDM Mode
To enter link and location information:
1. From the Main Menu, press Preferences.
Defining Preferences
2. Select the Information tab.
Optical Spectrum Analyzer 41
Page 50

Setting Up the Instrument in WDM Mode
Defining Preferences
3. Under System and link information, define the following parameters
as needed:
³ Link ID prefix: Sets the prefix value for the link ID. You can enter
any alphanumeric value.
³ Starting value: Sets the suffix increment starting value for the link
ID.
This value is incremented each time a new file is saved provided
the Auto Increment option is selected.
IMPORTANT
When the Auto Increment option is not selected, while saving the trace
file, you have to manually change the file name, else the application will
overwrite the previously saved files every time you save a new trace.
³ Orientation: Sets the orientation of the link.
³ System: Sets the system information.
4. Under Location Information, define the following parameters as
needed:
³ Network element: Sets the type of network element.
³ Test poin t: Sets the test point.
³ Description: Enter the description of location if required.
5. Press OK to save the changes and close the window, or press Cancel to
exit without saving.
Press Restore Defaults to remove all the changes and apply the default
values.
42 FTB-5240S/5240BP
Page 51

Setting Up the Instrument in WDM Mode
To enter comments:
1. From the Main Menu, press Preferences.
Defining Preferences
Optical Spectrum Analyzer 43
Page 52

Setting Up the Instrument in WDM Mode
Defining Preferences
2. Select the Comments tab.
3. Enter your comments for the current trace.
4. Press OK to save the changes and close the window, or press Cancel to
exit without saving.
Press Clear to clear all the changes made in the Comments tab.
44 FTB-5240S/5240BP
Page 53

Setting Up the Instrument in WDM Mode
Defining Preferences
Defining Display Parameters
The application allows you to set display settings for the acquisition trace.
You can set the spectral unit for the trace and the results table. You can also
select the label that should appear on the peaks of the trace.
To define display parameters:
1. From the Main Menu, press Preferences.
Optical Spectrum Analyzer 45
Page 54

Setting Up the Instrument in WDM Mode
Defining Preferences
2. Select the Display tab.
46 FTB-5240S/5240BP
Page 55

Setting Up the Instrument in WDM Mode
Defining Preferences
3. Select the spectral unit you want to work with.
With the nanometer (nm) spectral unit, the trace will appear as shown
below:
With the terahertz (THz) spectral unit, the trace will appear as shown
below:
Optical Spectrum Analyzer 47
Page 56

Setting Up the Instrument in WDM Mode
Defining Preferences
4. Select the label that will appear on the peaks in the graph.
48 FTB-5240S/5240BP
Page 57

Setting Up the Instrument in WDM Mode
Defining Preferences
Note: The channel name and channel number cannot be shown at the same
time. If a number is displayed on the peak, it means that the channel name
for that peak is not defined. If a channel name is defined for the peak, it will
be displayed at the top of the peak.
Default channel
names
Defined channel
names
Optical Spectrum Analyzer 49
Page 58

Setting Up the Instrument in WDM Mode
Defining Preferences
5. Select Show to display the empty channels from the channel list in the
Results tab. If Hide is selected, it will not display the empty channels in
the Results tab.
6. Select Show to enable horizontal markers in the Markers tab. If Hide is
selected, horizontal markers will be disabled.
50 FTB-5240S/5240BP
Page 59

Setting Up the Instrument in WDM Mode
Defining Preferences
7. Select the background color scheme for Graph as desired.
8. Press OK to save the changes and close the window, or press Cancel to
exit without saving.
Press Restore Defaults to remove all the changes and apply the default
values.
Optical Spectrum Analyzer 51
Page 60

Setting Up the Instrument in WDM Mode
Defining Preferences
Customizing WDM Results Table
It is possible to select which results you would like to be displayed in the
Results tab of your WDM tests.
To customize the results table:
1. From the Main Menu, press Preferences.
52 FTB-5240S/5240BP
Page 61

Setting Up the Instrument in WDM Mode
Defining Preferences
2. Select the WDM Results tab.
3. Select which parameters you want to display in the Results tab from
the list of available choices:
³ Name: indicates the name of channel.
³ Center wavelength/frequency: indicates the spectral
center-of-mass for the peak in that channel.
³ Signal Power: indicates the signal power for the selected channel
(excludes noise).
³ OSNR: is the Optical Signal to Noise Ratio, given by Signal power
(according to the current calculation method, in dBm) minus
Noise (according to the current calculation method, in dBm).
³ Noise: indicates the noise level for the selected channel.
³ BW 3.00 dB: indicates bandwidth measured by taking the width of
a signal at 50 % linear power of the peak or -3 dB from the peak.
³ BW at x dB: indicates bandwidth measured by taking the width of
a signal at x dB from the peak.
Optical Spectrum Analyzer 53
Page 62

Setting Up the Instrument in WDM Mode
Defining Preferences
4. Press Up or Down to change the order in which the columns will
appear in the Results tab.
5. Press OK to save the changes and close the window, or press Cancel to
exit without saving.
Press Restore Defaults to remove all the changes and apply the default
values.
54 FTB-5240S/5240BP
Page 63

Setting Up the Instrument in WDM Mode
Defining Preferences
Customizing WDM File Name
The application shall provide a way to define the name of the next file to be
saved. Defining a file autonaming format will allow you to quickly and
automatically name traces in a sequential order. The customized name
appears when the file is saved using the Save As option. It is possible to
select which fields you want to include in the file name and the order in
which it should be displayed.
To customize the file name:
1. From the Main Menu, press Preferences.
Optical Spectrum Analyzer 55
Page 64

Setting Up the Instrument in WDM Mode
Defining Preferences
2. Select the File Name tab.
3. Select which parameters you want to include in the file name from the
list of available choices:
³ Wavelength/frequency range: indicates the current
wavelength/frequency acquisition range.
³ Acquisition type: indicates the current acquisition type selected.
³ Scan count: indicates the current number of scans in the
acquisition tab.
³ Link ID: indicates the prefix value for the link ID configured in the
Preferences-Information tab.
³ Cable ID: indicates the prefix value for the cable ID configured in
the Preferences-General tab.
³ Fiber ID: indicates the prefix value for the fiber ID configured in
the Preferences-General tab.
³ Location description: indicates the location description provided
in the Preferences-Information tab.
56 FTB-5240S/5240BP
Page 65

Setting Up the Instrument in WDM Mode
Defining Preferences
4. Press Up or Down to change the order in which the field values will
appear in the file name.
Based on the fields selected, a preview of the file name shall be
displayed under File name preview. The field values are separated
with an underscore ( _ ).
5. Press OK to save the changes and close the window, or press Cancel to
exit without saving.
Press Restore Defaults to remove all the changes and apply the default
settings.
Optical Spectrum Analyzer 57
Page 66

Setting Up the Instrument in WDM Mode
Setting Up WDM Analysis Parameters
Setting Up WDM Analysis Parameters
This section presents the various analysis settings for the application,
particularly the channel list and settings. These settings are applied on
subsequent acquisitions. You can set the channel list, global thresholds,
default channel thresholds, channel parameters, manage favorite
configurations and perform user calibration.
Note: The analysis setup parameters will be applied to the global results and
channel results, upon the next acquisition. However, you can also apply the
modifications to the active trace in order to re-analyze it.
58 FTB-5240S/5240BP
Page 67

Setting Up the Instrument in WDM Mode
Setting Up WDM Analysis Parameters
Defining General Settings
The general analysis parameters for WDM acquisitions affect the
calculation of the results. These calculations take place after an
acquisition. If these settings are modified, they will be applied to the next
acquisition. However, any modifications made in the general parameters
can also be applied to the active trace for re-analysis.
IMPORTANT
In the General tab, you can set the default channel parameters. Any
channel found during an acquisition that is not defined in the
channel list will be analyzed according to the default channel
settings.
To define general settings:
1. From the Main Menu, press Analysis Setup.
Optical Spectrum Analyzer 59
Page 68

Setting Up the Instrument in WDM Mode
Setting Up WDM Analysis Parameters
2. Select the General tab.
60 FTB-5240S/5240BP
Page 69

Setting Up the Instrument in WDM Mode
Setting Up WDM Analysis Parameters
3. Under Default channel settings, define the following parameters as
needed:
³ Clear the Activate default channel selection, to use the currently
defined channel for analysis. This reduces the analysis time by
eliminating the peak detection over the complete spectral range.
The peaks outside the defined channel will not be detected or
analyzed.
Optical Spectrum Analyzer 61
Page 70

Setting Up the Instrument in WDM Mode
Setting Up WDM Analysis Parameters
³ Channel width (GHz or nm): indicates the limit inside which the
power values will be considered in the channel.
For default channels, the channel width that sets the limits of the
channel, should be the same as the channel distance or smaller
(channel distance is defined while creating a channel list). If the
channel width is not compatible with the channel spacing, either a
single peak may be found for two distinct channels and two
analysis would be performed and displayed for that peak, or, it is
possible that two peaks may be found within the same channel
and be considered as one multi-peak signal. With this result, you
can use markers to find the spacing between adjacent channels or
to find the channel width.
³ OSNR distance (GHz or nm): OSNR distance is automatically set
at the channel edge, that is, at half of the channel width from the
center wavelength.
³ Signal power calculation: indicates which calculation method to
apply for signal power value.
Integrated signal power: The integrated signal power represents
the sum of the power values included between the channel limits
of this channel, minus the estimated noise contribution between
the same boundaries. In some cases, for instance CATV signals,
signals with high-frequency modulation, or signals with an
inherent line width similar or larger than the OSA's resolution
bandwidth, this calculation becomes a better estimation of the
true signal power.
Peak signal power : The peak signal power represents the
maximum power value inside the channel, but it differs a little
from the peak measurement on the spectrum due to the fact that
the estimated noise is subtracted to get the peak signal power.
Total channel power: The total channel power represents the sum
of the power values included inside the channel width (including
noise).
62 FTB-5240S/5240BP
Page 71

Setting Up the Instrument in WDM Mode
Setting Up WDM Analysis Parameters
³ Noise for OSNR: indicates which calculation method to use for
OSNR value.
Fixed range IEC based (IEC): The IEC method uses the
interpolation of noise measured on both sides of the signal to
estimate the noise level. The position at which the noise is
estimated from the center wavelength is given by the OSNR
distance.
In-Band (InB): The In-Band method uses a series of scans having
different polarization states to calculate the noise level under the
peak (In-Band).
In-Band narrow filter (InB nf): The In-Band narrow filter method
uses additional processing to provide an accurate OSNR value for
the narrow carved noise. This is because with narrow filters, the
noise level under the peak is not uniform and the OSNR value
depends on the processing width selected.
4. Under Global analysis parameters, define the following parameters
as needed:
Optical Spectrum Analyzer 63
Page 72

Setting Up the Instrument in WDM Mode
Setting Up WDM Analysis Parameters
³ Peak detection level (dBm): indicates the minimum power level
from where the peak can be considered as a signal.
³ RBW for OSNR (nm): indicates the resolution bandwidth for the
selected OSNR value. The resolution bandwidth of an OSA
determines its ability to deal with close optical channel spacing. It
is measured as the width of the response curve at half peak power
(i.e., 3 dB down) of the instrument to a monochromatic test signal.
The instrument’s RBW value is written below the graph on the right
(below wavelength offset).
³ Wavelength offset (nm): indicates the offset value applied on the
wavelength. You can use an offset to adjust your unit. This does not
replace a calibration performed at EXFO, but it can help you
achieve the specifications if you have determined that, for
example, your modules are used beyond the normal allowed use.
Entering a value in THz is not possible. The wavelength offset
appears below the graph, on the right, next to the arrow.
³ Power offset (dB): indicates the offset value applied on the power.
You can use an offset to adjust your unit. This does not replace a
calibration performed at EXFO, but it can help you achieve the
specifications if you have determined that, for example, your
modules are used beyond the normal allowed use. The power
offset appears in the graph, on the left, above the arrow.
To edit the power offset value in percentage, press Edit % button.
The percentage value entered in Edit percentage will be
converted to a corresponding equivalent value in dB.
³ Bandwidth at (dB): Set the power level used, relative to the
channel peak power, to compute the bandwidth.
64 FTB-5240S/5240BP
Page 73

Setting Up the Instrument in WDM Mode
Setting Up WDM Analysis Parameters
5. If you want to apply the above settings to the active trace, select the
Apply to active trace and re-analyze option and press OK.
6. Press OK to save the changes and close the window, or press Cancel to
exit without saving.
Press Restore Defaults to remove all the changes and apply the default
values.
Optical Spectrum Analyzer 65
Page 74

Setting Up the Instrument in WDM Mode
Setting Up WDM Analysis Parameters
You can set your pass/fail threshold limits in different ways depending on
the type of test you are performing.
Threshold Limit Definition
None No threshold limit is set. The results will be displayed without a
Pass/Fail verdict.
Min. only The threshold limit is set for a minimum value only. The
Pass/Fail verdict is declared as Pass (in green), when the value
is equal to or greater than the minimum threshold set. The
verdict is declared as Fail (in red), when the value is below the
minimum threshold set.
Max. only The threshold limit is set for a maximum value only. The
Pass/Fail verdict is declared as Pass (in green), when the value
is equal to or less than the maximum threshold set. The verdict
is declared as Fail (in red), when the value is above the
maximum threshold set.
Min. and Max. The threshold limit is set for the minimum and maximum value.
The Pass/Fail verdict is declared as Pass (in green), when the
value is equal to or within the minimum and maximum
thresholds set. The Pass/Fail verdict is declared as Fail (in red),
when the value is beyond the minimum or maximum
thresholds set.
Use Default This threshold limit option is available in the Channel
Parameters tab of Channel Results window only.
When this limit is set, the defaults set for the default channels in
the Analysis Setup tab will be applied to the channel.
66 FTB-5240S/5240BP
Page 75

Setting Up the Instrument in WDM Mode
Setting Up WDM Analysis Parameters
Defining Global Thresholds
Global thresholds will be applied to the global results during the next
acquisition. However, any modifications made in the global thresholds
parameters can also be applied to the active trace for re-analysis.
The application allows you to activate and deactivate the threshold
functionality with a single control. When thresholds are globally enabled,
the results are displayed with the Pass/Fail status based on various settings
(global results, channel results). In addition, a global pass/fail status is also
displayed in the Global Results tab (See Global Results Tab on page 304).
When thresholds are globally disabled, results are displayed without a
Pass/Fail status and the Global pass/fail status will not be active in the
Global Results tab. The P/F column under the results table will not be
displayed.
Optical Spectrum Analyzer 67
Page 76

Setting Up the Instrument in WDM Mode
Setting Up WDM Analysis Parameters
To define global thresholds:
1. From the Main Menu, press Analysis Setup.
2. Select the Global Thresholds tab.
68 FTB-5240S/5240BP
Page 77

Setting Up the Instrument in WDM Mode
Setting Up WDM Analysis Parameters
3. Select the Activate all thresholds option, to manually set the global
threshold values. If this option is not selected, all the thresholds will be
deactivated, results are displayed without a Pass/Fail status and Global
pass/fail status will not be active in the Global Results tab.
4. Enter values in the boxes as explained below:
³ Average signal power (dBm): indicates the sum of the signal
powers of all the peaks detected in the current acquisition, divided
by the total number of peaks.
³ Signal power flatness (dB): indicates the difference between the
maximum and minimum signal power values of the detected
peaks, in dB.
³ Average OSNR (dB): indicates the sum of the entire OSNR of the
peaks detected in the current acquisition, divided by the total
number of peaks.
³ OSNR flatness (dB): indicates the difference between the
maximum and minimum OSNR values of the detected peaks, in
dB.
Optical Spectrum Analyzer 69
Page 78

Setting Up the Instrument in WDM Mode
Setting Up WDM Analysis Parameters
³ Empty channel count: Select this option to obtain the number of
empty channels from the channel list in the Global Results tab. If
this option is not selected, it will not display the Pass/Fail verdict in
the Results tab for the empty channels.
5. If you want to apply the above settings to the active trace, select the
Apply to active trace and re-analyze option and press OK.
6. Press OK to save the changes and close the window, or press Cancel to
exit without saving.
Press Restore Defaults to remove all the changes and apply the default
values.
70 FTB-5240S/5240BP
Page 79

Setting Up the Instrument in WDM Mode
Setting Up WDM Analysis Parameters
Defining Default Thresholds
Default thresholds will be applied to any channel found outside the
channel list during the next acquisition.
Note: The default thresholds settings are enabled only when the Activate all
thresholds option is selected in the Global Thresholds tab. For more
information, see Defining Global Thresholds on page 67.
To define Default Thresholds:
1. From the Main Menu, press Analysis Setup.
Optical Spectrum Analyzer 71
Page 80

Setting Up the Instrument in WDM Mode
Setting Up WDM Analysis Parameters
2. Select the Default Thresholds tab.
3. Enter values in the boxes as explained below:
³ Wavelength / Fre q u e nc y ( n m/ G Hz ) : indicates the channel’s central
wavelength/frequency.
³ Signal power (dBm): indicates the signal power for the selected
channel (excludes noise).
³ OSNR (dB): is the Optical Signal to Noise Ratio, given by Signal
power (according to the current calculation method, in dBm)
minus Noise (according to the current calculation method, in
dBm).
³ Noise (dBm): indicates the level of the noise for the selected
channel.
72 FTB-5240S/5240BP
Page 81

Setting Up the Instrument in WDM Mode
Setting Up WDM Analysis Parameters
4. If you want to apply the above settings to the active trace, select the
Apply to active trace and re-analyze option and press OK.
5. Press OK to save the changes and close the window, or press Cancel to
exit without saving.
Press Restore Defaults to remove all the changes and apply the default
values.
Optical Spectrum Analyzer 73
Page 82

Setting Up the Instrument in WDM Mode
Setting Up WDM Analysis Parameters
Managing Channels
Testing DWDM systems involves characterizing multiple signals in a link.
The application allows you to define channels using a channel editor or
quickly generate them from the current data. You can also rapidly create a
list of equally spaced channels. Once a channel list is created, you can
modify it as needed. You can edit the analysis parameters for one channel
or multiple channels.
Adding Channels
While creating the channel list, some channels may overlap. When the
channel widths are specified in nm, two channels are considered to be
overlapping when more than 0.001 nm (approximately) of wavelength
range is common between the two channels.
To add a channel list:
1. From the Main Menu, press Analysis Setup.
74 FTB-5240S/5240BP
Page 83

Setting Up the Instrument in WDM Mode
Setting Up WDM Analysis Parameters
2. Select the Channels tab.
3. By default, the channel list is empty. Press Add Channels.
4. Enter values in the boxes as explained below:
³ Start range (nm or THz): indicates the starting range of the
channel list.
Optical Spectrum Analyzer 75
Page 84

Setting Up the Instrument in WDM Mode
Setting Up WDM Analysis Parameters
³ Stop range (nm or Thz): indicates the ending range of the
channel list.
³ Channel center wavelength/frequency: indicates the spectral
center-of-mass for the peak in that channel.
Note: When using the custom channel center wavelength option, the first channel
will be centered at the Start Range, and the list will be created using
channel distance and channel width.
³ Channel distance (nm or GHz): indicates distance between the
channels. The value of channel distance will be set depending on
the selection made for the channel center wavelength option. The
channel distance box will be enabled only when the channel
center wavelength option is set to custom.
³ Channel width (nm or GHz): indicates the limit inside which the
power values will be considered in the channel. Integrated power
is calculated on channel width.
³ Name prefix: Adds prefix to the channel names.
³ Starting Value: Sets the increment starting value for the channel
name in the channel list.
³ Increment value: Sets the increment value for the channel name
in the channel list.
5. Press OK to return to the Channels window, which now lists the added
channels.
Note: When new channels are added, the Use Default thresholds will be applied
to the channel parameters.
Note: A warning message will be displayed if any channels are overlapping, but
the analysis can still be performed on overlapping channels. If any
duplicate channels are added, a confirmation message will be displayed to
overwrite the existing channels with the duplicate channels.
76 FTB-5240S/5240BP
Page 85

Setting Up the Instrument in WDM Mode
Setting Up WDM Analysis Parameters
6. If you want to apply the above settings to the active trace, select the
Apply to active trace and re-analyze option.
7. Press OK to save the changes and close the window, or press Cancel to
exit without saving.
Note: The application displays a message if more than 1000 channels are added.
You ca n ex it th e Analysis Setup window only after deleting the extra
channels from the channel list. You can delete the channels manually as
required.
Optical Spectrum Analyzer 77
Page 86

Setting Up the Instrument in WDM Mode
Setting Up WDM Analysis Parameters
To edit the parameters of a specific channel:
1. From the Main Menu, press Analysis Setup.
78 FTB-5240S/5240BP
Page 87

Setting Up the Instrument in WDM Mode
Setting Up WDM Analysis Parameters
2. Select the Channels tab.
3. Select the channel or channels to be modified in the channel list.
Selected channels have a in the first column of the channels table.
If you want the changes to be applied to all of your channels, press
Select All. Channels can be selected one by one or all together. You
can press Unselect All to clear all channel selections. To delete the
selected channels, press Delete.
Optical Spectrum Analyzer 79
Page 88

Setting Up the Instrument in WDM Mode
Setting Up WDM Analysis Parameters
4. Press Edit Selection.
80 FTB-5240S/5240BP
Page 89

Setting Up the Instrument in WDM Mode
Setting Up WDM Analysis Parameters
5. Modify the settings as needed. For more information about the settings,
see Adding Channels on page 74, Changing Default Channel
Parameters on page 309 and Defining Default Thresholds on page 71. If
you leave a box empty, it will remain as it was before your changes.
Modify appropriate settings.
Optical Spectrum Analyzer 81
Page 90

Setting Up the Instrument in WDM Mode
Setting Up WDM Analysis Parameters
6. Press OK to return to the Channels tab, which now contains the
modified settings.
7. If you want to apply the above settings to the active trace, select the
Apply to active trace and re-analyze option in the Channels window
and press OK.
8. Press OK to save the changes and close the window, or press Cancel to
exit without saving.
82 FTB-5240S/5240BP
Page 91

Setting Up the Instrument in WDM Mode
Setting Up WDM Analysis Parameters
To add current peaks:
Note: You can add current peaks to the channel list only if an acquisition has
already been performed.
1. From the Main Menu, press Analysis Setup.
Optical Spectrum Analyzer 83
Page 92

Setting Up the Instrument in WDM Mode
Setting Up WDM Analysis Parameters
2. Select the Channels tab.
3. Press Import from Trace. All peaks from the current trace will be
added to the channel list.
A warning message will be displayed if any channels are overlapping. Press
OK to close the warning window.
Note: Changes can be applied to any channel at any time.
Note: If some channels were already present in the channel list, the new
channels created with the Add Current Peaks button will be added to the
list.
84 FTB-5240S/5240BP
Page 93

Setting Up the Instrument in WDM Mode
Setting Up WDM Analysis Parameters
4. If you want to apply the above settings to the active trace, select the
Apply to active trace and re-analyze option and press OK.
5. Press OK to save the changes and close the window, or press Cancel to
exit without saving.
Optical Spectrum Analyzer 85
Page 94

Setting Up the Instrument in WDM Mode
Setting Up WDM Analysis Parameters
Managing Favorites
Favorites are configurations files that contain all of the parameters from the
Analysis Setup tab and Acquisition tab. When you often use the same
settings, you can save them as a favorite, then recall them for future
acquisitions.
To apply a test configuration to the current acquisition:
1. From the Main Menu, press Analysis Setup.
OR
From the main window, press .
86 FTB-5240S/5240BP
Page 95

2. Select the Favorites tab.
Setting Up the Instrument in WDM Mode
Setting Up WDM Analysis Parameters
Optical Spectrum Analyzer 87
Page 96

Setting Up the Instrument in WDM Mode
Setting Up WDM Analysis Parameters
3. To apply the settings from a favorite file to the current analysis setup,
select a file from the favorites list and press Apply Selection. The apply
selection button will be enabled only when a file is selected from the
favorites list. When the Apply Selection button is pressed, the content
of the file will be loaded in the other tabs of this page. To make these
parameters effective for the next acquisition you need to press the OK
button.
88 FTB-5240S/5240BP
Page 97

Setting Up the Instrument in WDM Mode
Setting Up WDM Analysis Parameters
4. If you want to apply the above settings to the active trace, select the
Apply to active trace and re-analyze option and press OK.
5. Press OK to load the configuration and close the window, or press
Cancel to exit without saving.
Optical Spectrum Analyzer 89
Page 98

Setting Up the Instrument in WDM Mode
Setting Up WDM Analysis Parameters
To save a test configuration:
1. From the Main Menu, press Analysis Setup.
OR
From the main window, press .
90 FTB-5240S/5240BP
Page 99

Setting Up the Instrument in WDM Mode
Setting Up WDM Analysis Parameters
2. Select the Favorites tab.
3. To save an analysis setup to a file, press Save As. The default directory
where the file will be saved is the favorites folder. You should use this
folder unless you save the file on a USB stick.
Optical Spectrum Analyzer 91
Page 100

Setting Up the Instrument in WDM Mode
Setting Up WDM Analysis Parameters
4. In the Save As window, enter a file name and press Save. The file will
be added to the favorites list in the Analysis setup – Favorites window.
5. If you want to apply the above settings to the active trace, select the
Apply to active trace and re-analyze option and press OK.
6. Press OK to load the configuration and close the window, or press
Cancel to exit without saving.
92 FTB-5240S/5240BP
 Loading...