

Page 1
ETS-1000G
10 Gigabit Ethernet Analyzer
User Guide
Page 2

Copyright Information
Copyright Information
Copyright © 2013 EXFO Inc. All rights reserved. No part of this publication
may be reproduced, stored in a retrieval system or transmitted in any form,
be it electronically, mechanically, or by any other means such as
photocopying, recording or otherwise, without the prior written permission
of EXFO Inc. (EXFO).
Information provided by EXFO is believed to be accurate and reliable.
However, no responsibility is assumed by EXFO for its use nor for any
infringements of patents or other rights of third parties that may result from
its use. No license is granted by implication or otherwise under any patent
rights of EXFO.
EXFO’s Commerce And Government Entities (CAGE) code under the North
Atlantic Treaty Organization (NATO) is 0L8C3.
The information contained in this publication is subject to change without
notice.
Trademarks
EXFO’s trademarks have been identified as such. However, the presence
or absence of such identification does not affect the legal status of any
trademark.
Units of Measurement
Units of measurement in this publication conform to SI standards and
practices.
January 25, 2013
Version number: 1.0.0
ii ETS-1000G
Page 3

Contents
Contents
Copyright Information ............................................................................................................ ii
Certification Information ......................................................................................................vii
1 Introducing the ETS-1000G .......................................................................... 1
Scope of use ...........................................................................................................................1
Conventions ............................................................................................................................4
Supply Kit ...............................................................................................................................5
2 Safety Information ....................................................................................... 7
Laser Safety Warnings .............................................................................................................7
Installation Instruction Warnings ............................................................................................8
3 Device Description ....................................................................................... 9
Front Panel .............................................................................................................................9
Keyboard ..............................................................................................................................10
LEDs ......................................................................................................................................11
Status Bar .............................................................................................................................13
External Connectors ..............................................................................................................14
Control Menu Structure ........................................................................................................15
4 RFC 2544 ..................................................................................................... 19
Throughput Analysis .............................................................................................................19
Latency Analysis ....................................................................................................................20
Frame Loss Rate Analysis ......................................................................................................21
Back to Back Analysis ............................................................................................................22
5 Preparing RFC 2544 for Analysis ............................................................... 23
Topology ...............................................................................................................................25
Main header parameters .......................................................................................................26
Additional header parameters ..............................................................................................27
Select the Frame Size ............................................................................................................31
Setting Test Parameters .........................................................................................................32
6 Analyzing RFC 2544 .................................................................................... 39
Throughput Test Results ........................................................................................................39
Latency Test Results ..............................................................................................................40
Frame Loss Rate Test Results .................................................................................................42
Back to Back Test Results ......................................................................................................43
Saving Test Results ................................................................................................................44
10 Gigabit Ethernet Analyzer iii
Page 4

Contents
7 Asymmetric Test ..........................................................................................45
Testing Example ....................................................................................................................46
8 Complex Traffic ...........................................................................................51
Complex Traffic MPLS Setting ...............................................................................................56
9 Loopback .....................................................................................................57
10 OAM .............................................................................................................59
11 ET–Discovery ................................................................................................63
12 TCP/IP Tests ..................................................................................................65
Ping ......................................................................................................................................65
Traceroute .............................................................................................................................69
DNS Lookup ..........................................................................................................................71
ARP Request Monitor ............................................................................................................73
TCP Client .............................................................................................................................74
13 BERT .............................................................................................................77
BERT MPLS Setting ................................................................................................................81
Connection Options ..............................................................................................................81
14 Delay Variation ............................................................................................85
15 Traffic Generator .........................................................................................89
Static Traffic ..........................................................................................................................91
MAC/IP and VLAN flood ........................................................................................................94
16 Statistics ......................................................................................................95
Summary statistics ................................................................................................................95
Statistics of Frame Types .......................................................................................................96
Statistics of Frame Sizes ........................................................................................................97
Statistics for Layers ...............................................................................................................98
Statistics of Frame Errors ......................................................................................................99
17 Saving test results and statistics .............................................................101
18 Network Parameters .................................................................................103
19 Interface Parameters ................................................................................105
iv ETS-1000G
Page 5

Contents
20 Device Settings ......................................................................................... 111
Display Settings ..................................................................................................................111
General Settings .................................................................................................................112
Information ........................................................................................................................113
SFP/SFP+ Information .........................................................................................................114
Storage Battery ...................................................................................................................114
Temperature .......................................................................................................................115
Option Control ...................................................................................................................115
21 Profiles ...................................................................................................... 117
22 Event Logging .......................................................................................... 119
23 Remote Control ........................................................................................ 121
Updating SW versions on the device ...................................................................................121
Connecting to a PC via the USB Interface ...........................................................................122
Remote Control Over TELNET ..............................................................................................123
Remote Control Through the WWW Interface ....................................................................124
Taking Screenshots .............................................................................................................124
24 Service and Maintenance ......................................................................... 127
Recalibrating the Unit .........................................................................................................128
Battery Charging Procedure ................................................................................................128
Recycling and Disposal (Applies to European Union Only) ..................................................130
25 Troubleshooting ....................................................................................... 131
Contacting the Technical Support Group ............................................................................132
26 Warranty .................................................................................................. 133
General Information ...........................................................................................................133
Liability ...............................................................................................................................134
Exclusions ...........................................................................................................................135
Certification ........................................................................................................................135
Service and Repairs .............................................................................................................136
EXFO Service Centers Worldwide ........................................................................................137
A Specifications ............................................................................................. 139
Interfaces ............................................................................................................................139
Testing ................................................................................................................................139
General Features .................................................................................................................141
Delivery options ..................................................................................................................142
10 Gigabit Ethernet Analyzer v
Page 6

Contents
B Reference Tables......................................................................................... 143
Traffic Types and Priorities ..................................................................................................143
Precedence Values ..............................................................................................................144
ToS Values ...........................................................................................................................144
Class of Service and DSCP Values ........................................................................................145
ECN Values .........................................................................................................................146
TCP/IP Port Numbers ...........................................................................................................147
Connection Errors ...............................................................................................................147
Test Sequences ....................................................................................................................148
Digits, Letters, and Characters ............................................................................................148
C Remote Control Commands ...................................................................... 151
Remote control commands (a console terminal) .................................................................151
Remote control commands (TELNET). Configuration mode ................................................162
D Ethernet Frame Structure .......................................................................... 171
E Glossary....................................................................................................... 173
Index ...............................................................................................................181
vi ETS-1000G
Page 7

Certification Information
Certification Information
North America Regulatory Statement on Product
Safety
This unit was certified by an agency approved in both Canada and the
United States of America. It has been evaluated according to applicable
North American approved standards for product safety for use in Canada
and the United States.
Electronic test and measurement equipment is exempt from FCC part 15,
subpart B compliance in the United States of America and from ICES-003
compliance in Canada. However, EXFO Inc. makes reasonable efforts to
ensure compliance to the applicable standards.
The limits set by these standards are designed to provide reasonable
protection against harmful interference when the equipment is operated in
a commercial environment. This equipment generates, uses, and can
radiate radio frequency energy and, if not installed and used in accordance
with the user guide, may cause harmful interference to radio
communications. Operation of this equipment in a residential area is likely
to cause harmful interference in which case the user will be required to
correct the interference at his own expense.
Modifications not expressly approved by the manufacturer could void the
user's authority to operate the equipment.
European Union (CE) Information
Electronic test and measurement equipment is subject to the EMC
Directive in the European Union. The EN61326 standard prescribes both
emission and immunity requirements for laboratory, measurement, and
control equipment. This unit has been tested and found to comply with the
limits for a Class A digital device. Please refer to the CE Declaration of
Conformity on page ix.
10 Gigabit Ethernet Analyzer vii
Page 8

Certification Information
Note: If the equipment described herein bears the CE symbol, the said equipment
complies with the applicable European Union Directive and Standards
mentioned in the Declaration of Conformity.
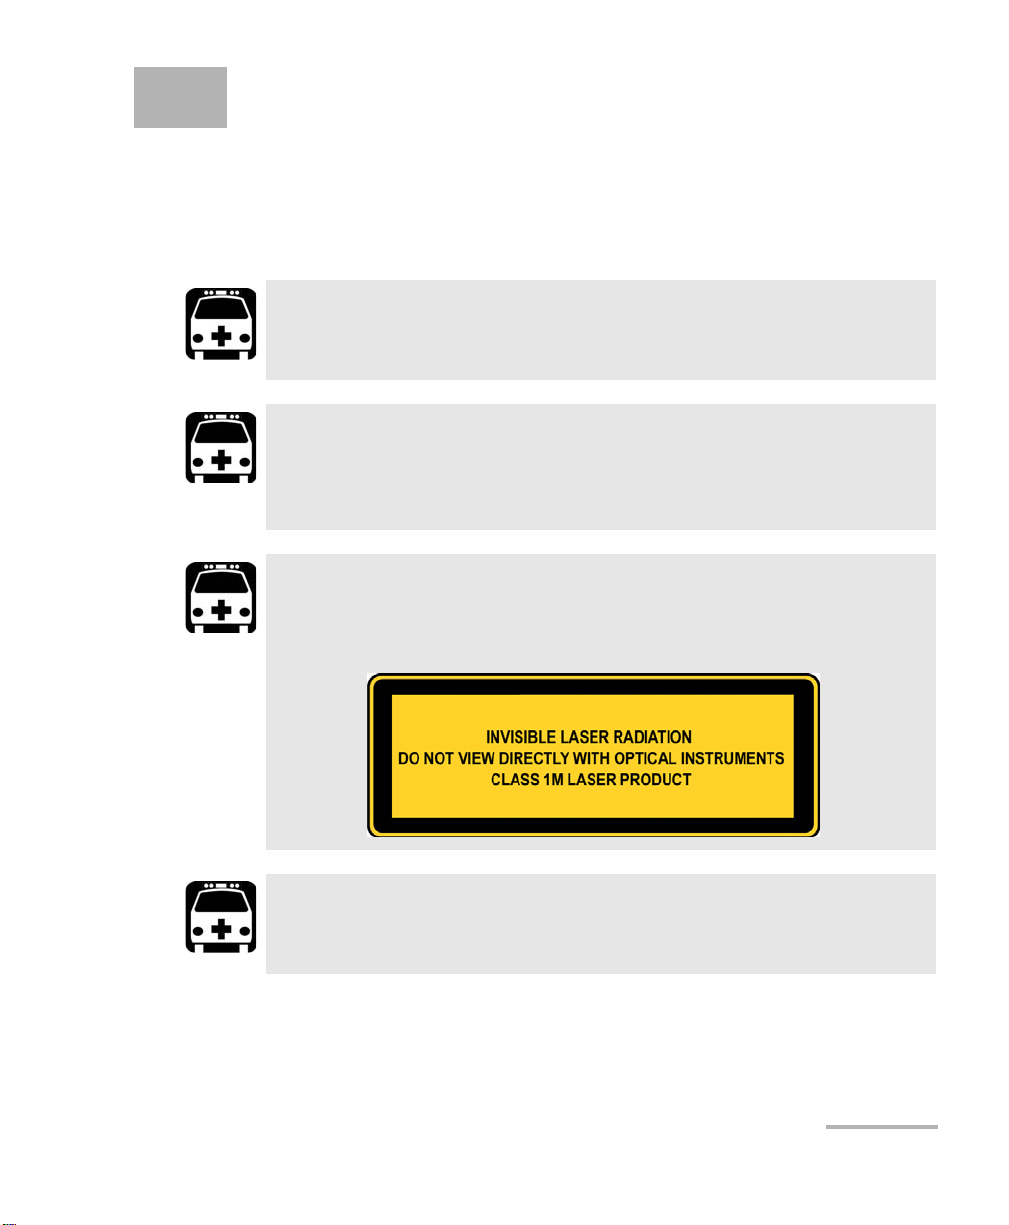
Laser
Your instrument is a Class 1 laser product in compliance with standards IEC
60825-1 and 21 CFR 1040.10. Laser radiation may be encountered at the
output port.
viii ETS-1000G
Page 9
CE Declaration of Conformity
EN 55022: 2006
Information technology equipment — Radio disturbance
characteristics
EN 55024 :1998 + A1: 2001 + A2: 2003
Information Technology Equipment - Immunity
Characteristics
EN 61010-1:2001 Edition 2.0
Safety requirements for electrical equipment for measurement,
control, and laboratory use
– Part 1: General requirements
EN 60825-1:2007 Edition 2.0
Safety of laser products – Part 1: Equipment classification and
requirements
DECLARATION OF CONFORMITY
Application of Council Directive(s): 1999/5/EC – The R&TTE Directive
And their amendments
Manufacturer’s Name and Address:
400 Godin Avenue Winchester House
Quebec City, Quebec School Lane, Chandlers Ford
G1M 2K2, CANADA SO53 4DG, UK
Tel.: +1 418 683-0211 Tel.: +44 2380 246 800
Equipment Type/Environment: Test & Measurement / Basic
Trade Name/Model No.: Ethernet Loopback Device / ETS-1000G
Standard(s) to which Conformity is declared:
2011/65/UE – Restriction of the use of certain hazardous substances (RoHS)
EXFO Inc. EXFO Europe Ltd.
— Limits and methods of measurement
- Limits and Methods of Measurements
Certification Information
10 Gigabit Ethernet Analyzer ix
I, the undersigned, hereby declare that the equipment specified above conforms to the above Directive and Standards.
Manufacturer:
Stephen Bull, E. Eng
Vice-President Research and Development
400 Godin Avenue,
Quebec City, Quebec
G1M 2K2 CANADA
January 21, 2013
Page 1 of 1
Page 10

Page 11

1 Introducing the ETS-1000G
The analyzer ETS-1000G (hereinafter referred to as the device, the tester) is
designed for analyzing and performing diagnostic tests of equipment in the
Ethernet networks. It supports all data transfer rates from 10 Mbps to
10 Gbps.
Scope of use
Certification of channels and fault diagnostics in the networks that use
the Ethernet technology with rates 10/100/1000 Mbps and 10 Gbps.
Checking the quality of provided services for conformance to the
Service Level Agreement (SLA) (for Voice-over-IP (VoIP) and
Video-over-IP services).
10 Gigabit Ethernet Analyzer 1
Page 12
Introducing the ETS-1000G
Scope of use
Key Features and Benefits
Interfaces:
10G Ethernet: SFP+;
1G Ethernet: SFP (1000BaseX) / RJ-45 (10/100/1000BaseT);
LAN 10/100 BASE-T;
USB 1.1/2.0.
2 ETS-1000G
Page 13

Introducing the ETS-1000G
Scope of use
Testing in compliance with RFC 2544:
throughput,
latency,
frame loss rate,
limit load.
Measurement of the bit error rate (BERT) on the physical layer, the data
link layer, the network layer and the transport layer using standard and
user-defined sequences.
Support for Q-in-Q (VLAN Stacking): double encapsulation with an
option to insert up to 3 VLAN tags. An option to set a VLAN priority, a
VLAN ID.
Support for multi-protocol label switching: an option to insert up to 3
MPLS labels.
Setting up a loopback on the physical, data link, network and transport
layers.
Intelligent device search mode: detecting other ETS-1000G devices in
the network and subsequently enabling the Loopback mode on them
for the data link, network or transport layer using the OAM protocol.
Generating and analyzing several data streams to check the operability
and the Quality of Service (QoS) of different services.
Managing the device over TELNET.
Displaying test results through the WWW interface.
Packet jitter measurement.
Gathering and displaying statistics of the traffic being received and
transmitted on the physical, data link and network layers in
compliance with RFC 2819[4].
10 Gigabit Ethernet Analyzer 3
Page 14
Introducing the ETS-1000G
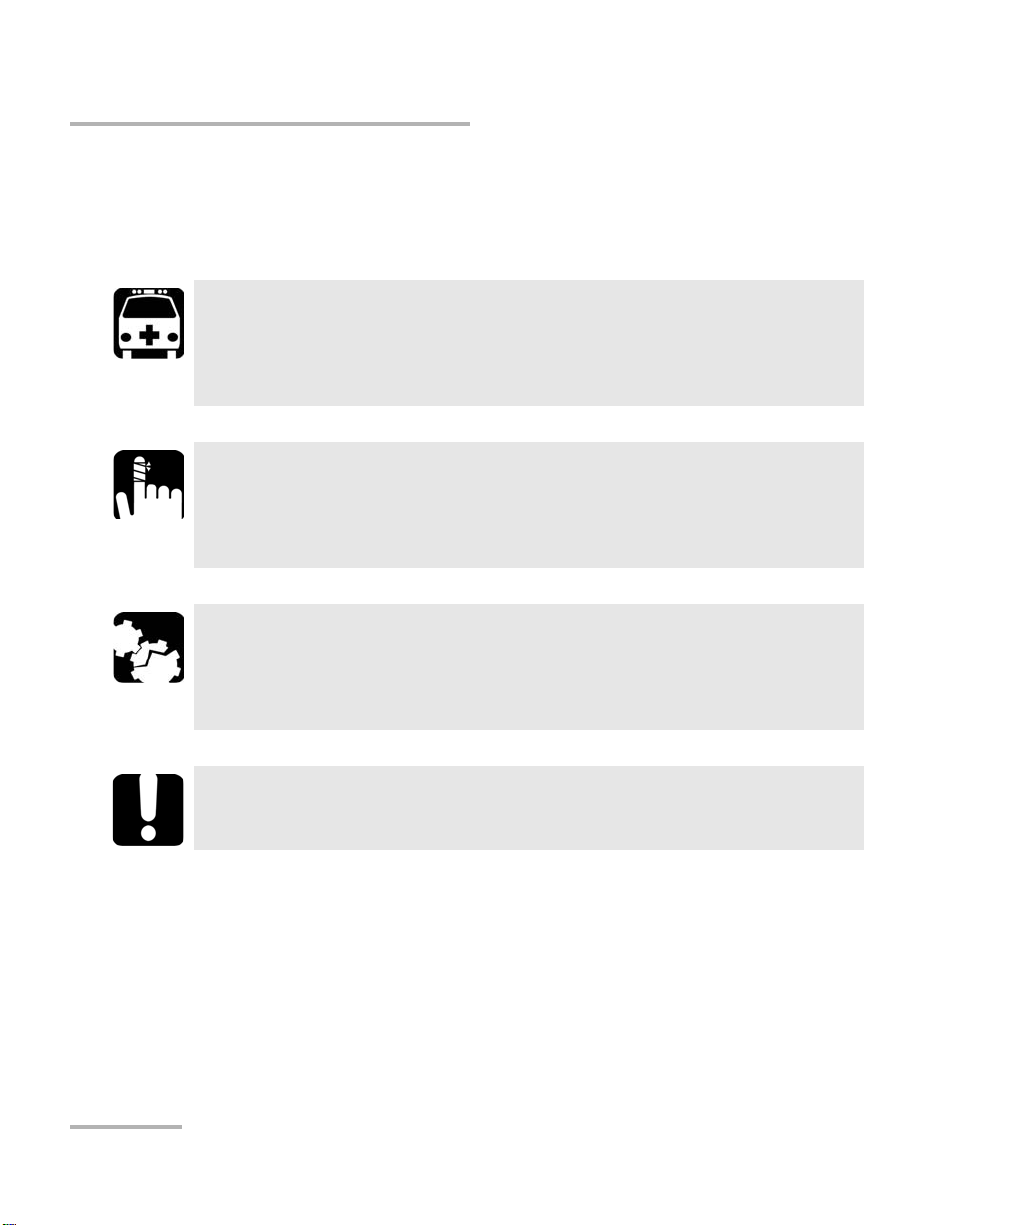
Conventions
Conventions
Before using the product described in this guide, you should understand
the following conventions:
Indicates a potentially hazardous situation which, if not avoided,
could result in death or serious injury. Do not proceed unless you
understand and meet the required conditions.
Indicates a potentially hazardous situation which, if not avoided,
may result in minor or moderate injury. Do not proceed unless you
understand and meet the required conditions.
Indicates a potentially hazardous situation which, if not avoided,
may result in component damage. Do not proceed unless you
understand and meet the required conditions.
WARNING
CAUTION
CAUTION
IMPORTANT
Refers to information about this product you should not overlook.
4 ETS-1000G
Page 15

Introducing the ETS-1000G
Supply Kit
Supply Kit
The supply kit consists of the following:
Name Quantity
10 Gigabit Ethernet Analyzer ETS-1000G 1
Pulsed power supply unit with connecting cable 1
PC connecting cable 2
10 Gigabit Ethernet Analyzer 5
Page 16

Page 17
2 Safety Information
Before working with analyzer ETS-1000G carefully read this operations
manual, the purpose of the keyboard, external connectors and parts tester.
Laser Safety Warnings
WARNING
When the LASER LED is on or flashing, the ETS-1000G is
transmitting an optical signal.
WARNING
Do not install or terminate fibres while a laser source is active.
Never look directly into a live fibre, and ensure that your eyes are
protected at all times.
WARNING
This product may employ a Class 1M SFP or SFP+. Check pluggable
transceiver label for laser classification.
WARNING
Use of optical instruments with this product will increase eye
hazard.
10 Gigabit Ethernet Analyzer 7
Page 18

Safety Information
Installation Instruction Warnings
Installation Instruction Warnings
This unit is designed for indoor use only.
No user serviceable parts are contained inside. Contact the
manufacturer regarding service of this equipment.
All electrical interfaces are SELV (Safety Extra Low Voltage) circuitry
intended for intra-building use only.
All wiring and installation must be in accordance with local building
and electrical codes acceptable to the authorities in the countries
where the equipment is installed and used.
CAUTION
CAUTION
CAUTION
IMPORTANT
CAUTION
Electrostatic Discharge (ESD) Sensitive Equipment:
Plug-in modules can be damaged by static electrical discharge. To
minimize the risk of damage, dissipate static electricity by touching
a grounded unpainted metal object
before removing, inserting, or handling the module.
before connecting or disconnecting cables to/from the module.
before inserting or removing SFP/SFP+ to/from the module.
8 ETS-1000G
Page 19
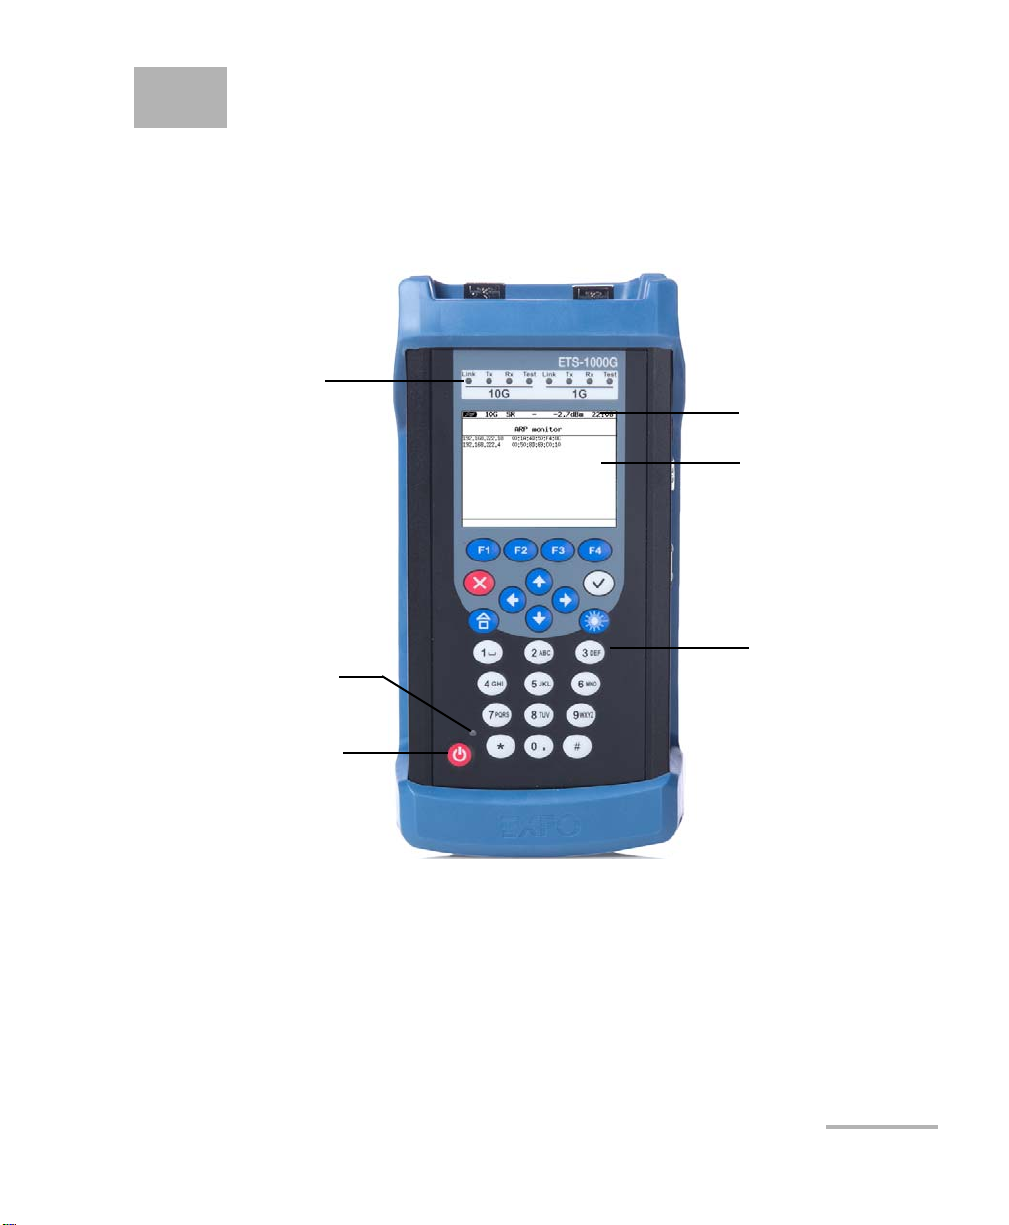
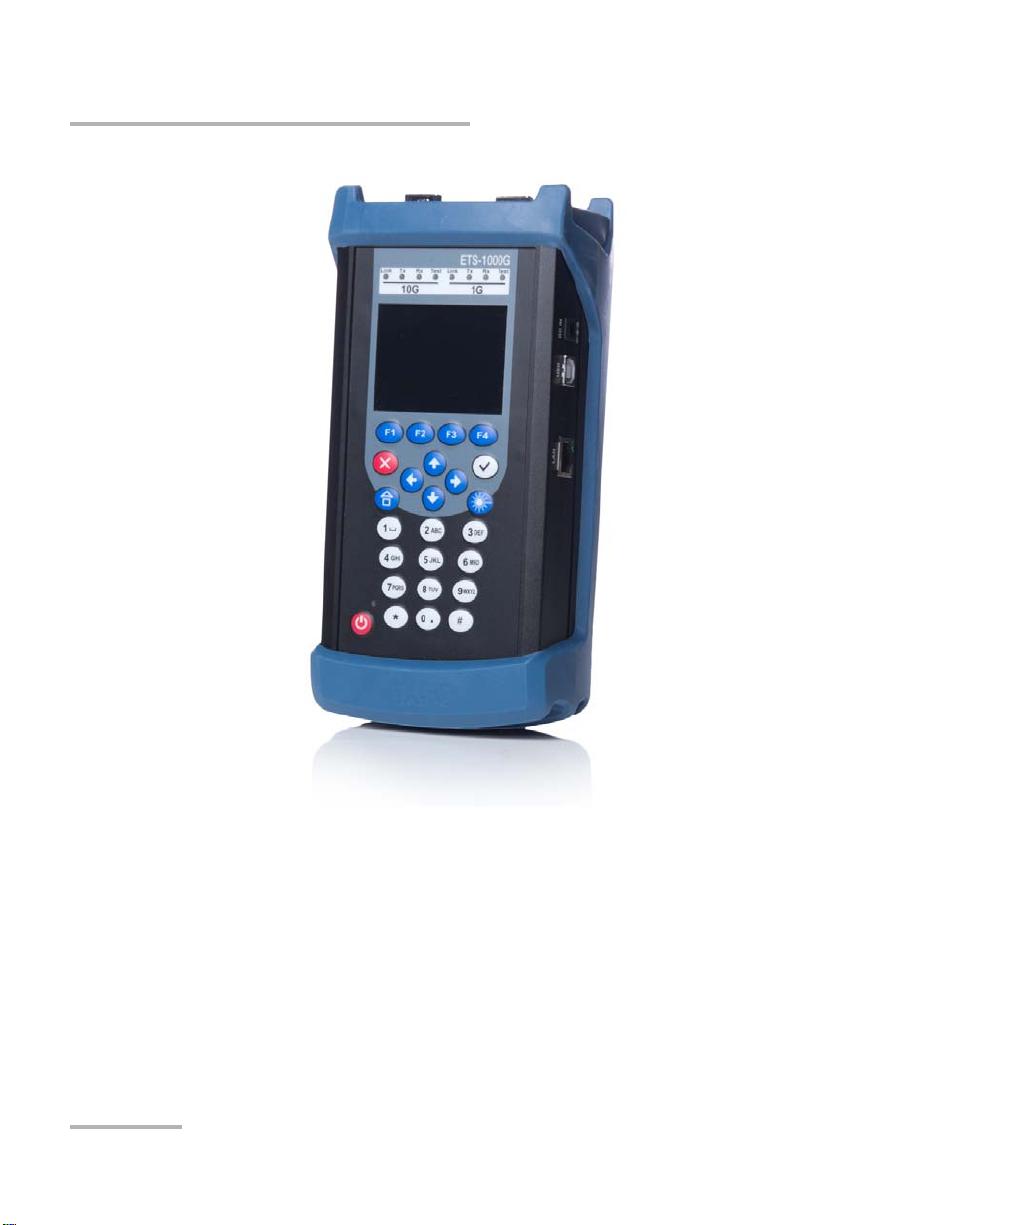
3 Device Description
Status Bar
Display
Keyboard
Power On/Off
Indicator
On/Off Button
Status LEDs
The parts of the device are explained in the sections that follow.
Front Panel
10 Gigabit Ethernet Analyzer 9
Page 20
Device Description
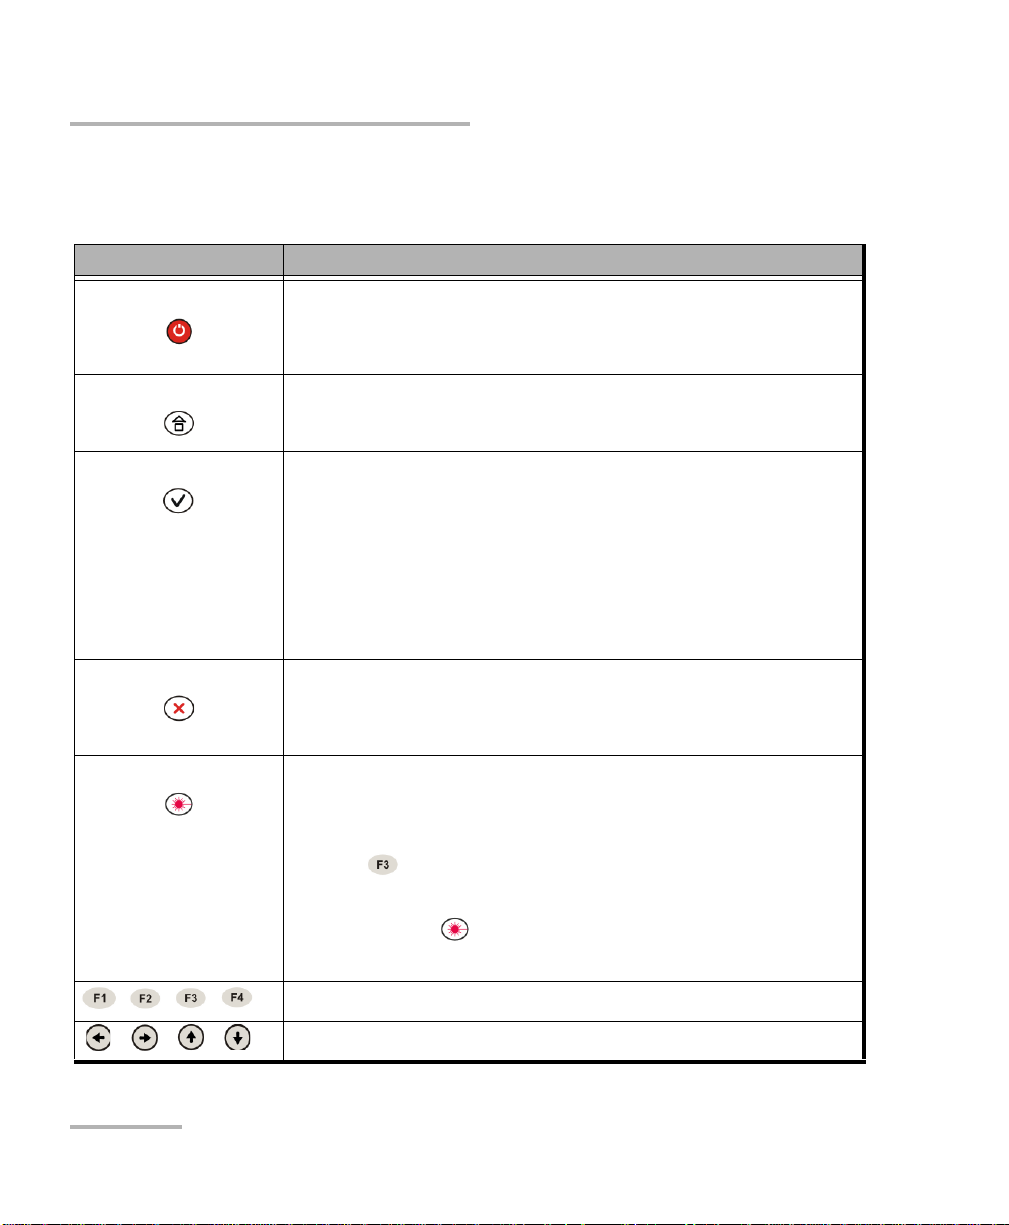
Keyboard
Keyboard
Icon Description
On/Off
To switch the device on or off, press and hold the key for
2-3 s.
Main menu
The key for returning to the main menu from any submenu.
Enter
When a menu item is selected, pressing the key opens the
respective menu.
When a menu item that provides for inputting parameter
values is selected, pressing the key enables the data input
mode. To confirm input data and exit the data input mode,
press the key repeatedly.
Cancel/Escape
The key is used for returning to the previous menu or canceling data input in the data input mode.
Laser
After pressing the key, the prompt to switch the laser on
appears on the screen (if the laser is disabled). If a user
presses (Yes), the laser will be enabled and the Laser
LED will be lit red (refer to LEDs on page 11). To disable
the laser, press again. Depending on the 10G or 1G
mode SFP+ or SFP laser is turned on.
10 ETS-1000G
Function keys
Cursor keys
Page 21
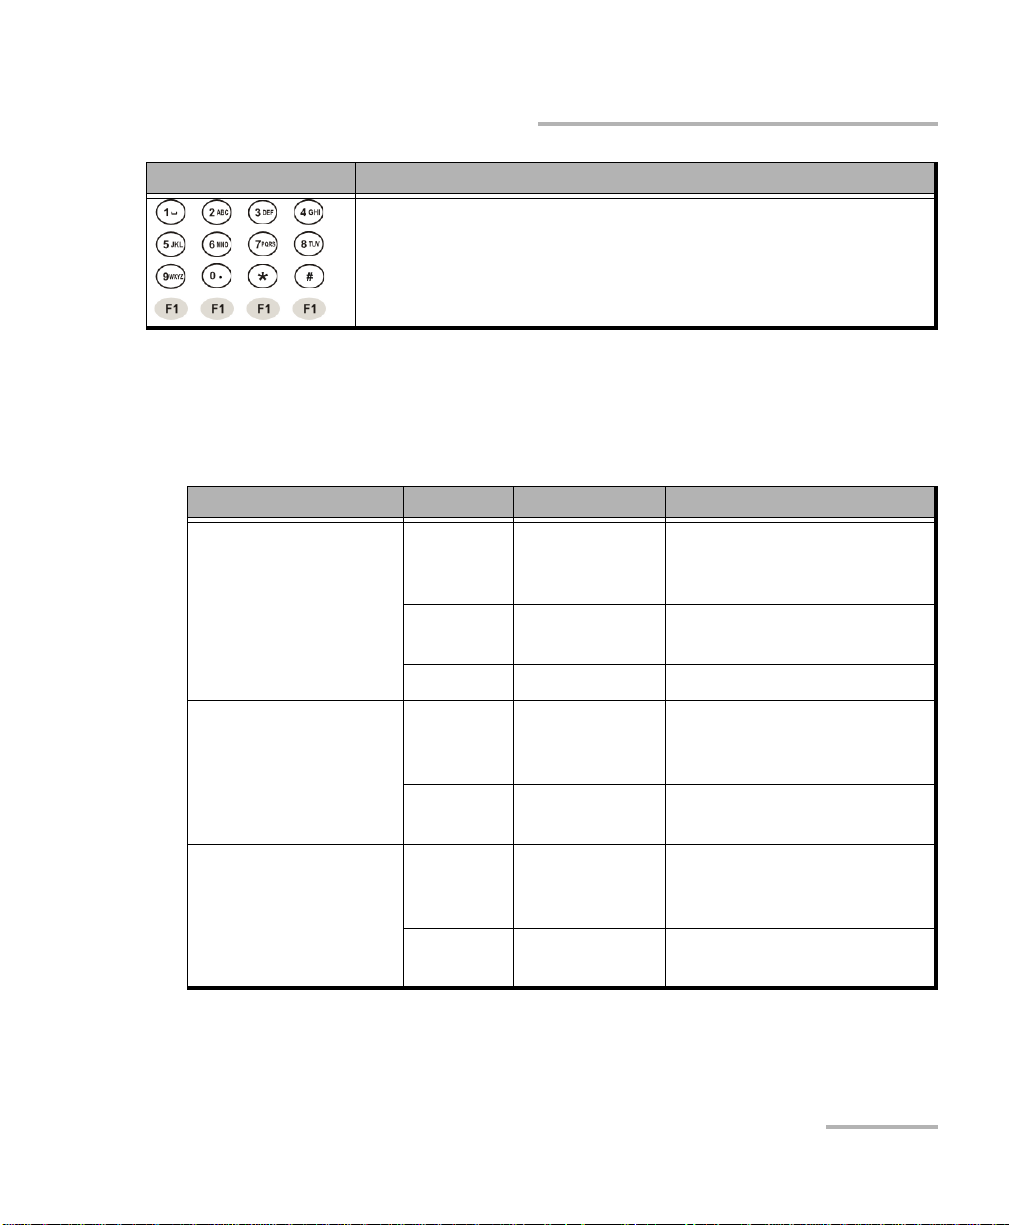
Icon Description
Device Description
LEDs
Numeric, character and symbol keys.
Digits, letters and characters that can be input using the numeric
keyboard.
LEDs
LED Color State Description
10G, 1st LED Green LED is
constantly on.
Red LED is
constantly on.
— LED is off. Interface is disabled.
10G, 2nd LED Green LED is flashing
or constantly
on.
A connection to the 10G
equipment being tested is
established.
No connection.
Packet traffic is being
transmitted over 10G
interface.
— LED is off. Packet traffic is not being
transmitted.
10G, 3rd LED Green LED is flashing
or constantly
on.
— LED is off. Packet traffic is not being
10 Gigabit Ethernet Analyzer 11
Packet traffic is being
received on 10G interface.
received.
Page 22

Device Description
LEDs
LED Color State Description
1G, 1st LED Green LED is
constantly on.
Red LED is
constantly on.
—
LED is off. Interface is disabled.
1G, 2nd LED Green LED is flashing
or constantly
on.
— LED is off. Packet traffic is not being
1G, 3rd LED Green LED is flashing
or constantly
on.
— LED is off. Packet traffic is not being
Test Gre en LE D is
constantly on.
Green LED is flashing. The Loopback mode is
A connection to the 1G
equipment being tested is
established.
No connection.
Packet traffic is being
transmitted over 1G
interface.
transmitted.
Packet traffic is being
received on 1G interface.
received.
A test is being performed.
enabled.
— LED is off. The Loopback mode is
disabled; testing is not
performed.
Laser Red LED is
Laser is enabled (SFP/SFP+).
constantly on.
12 ETS-1000G
Page 23
Device Description
The LED which is located at the bottom of the device's clipboard is lit when
the external power supply is connected:
Green - batteries are charged,
Green (flashing) - batteries are being charged,
Green (blinking) - the device's SW versions are being updated.
Status Bar
The status bar contains data about the following parameters (from left to
right):
Battery charge level,
Data rate (“- - -” indicates that a connection to the equipment being
tested is not established),
SFP/SFP+ module type,
Test being conducted (“—” indicates that testing is not being
performed at the moment),
Status Bar
Rx signal power level (10G, SFP+),
Current time.
The tests being performed are indicated in the status bar using
abbreviations:
Abbreviation Expansion
THR (throughput) Throughput analysis.
LAT (latency) Latency analysis.
FRL (frame loss) Frame loss analysis.
BTB (back-to-back) Back to back analysis.
LB1 (loopback layer 1) Loopback on the physical (first) layer.
LB2 (loopback layer 2) Loopback on the data link (second) layer.
10 Gigabit Ethernet Analyzer 13
Page 24
Device Description
External Connectors
Abbreviation Expansion
LB3 (loopback layer 3) Loopback on the network (third) layer.
LB4 (loopback layer 4) Loopback on the transport (fourth) layer.
BER (bit error rate test) Determining the bit error rate.
PJ (packet jitter) Determining the packet jitter.
GEN (generate) Generating test traffic.
J+G (jitter + generate) The functions of determining the packet jitter and
generating test traffic are started on the same port.
CTR (complex traffic) Generating/receiving complex traffic.
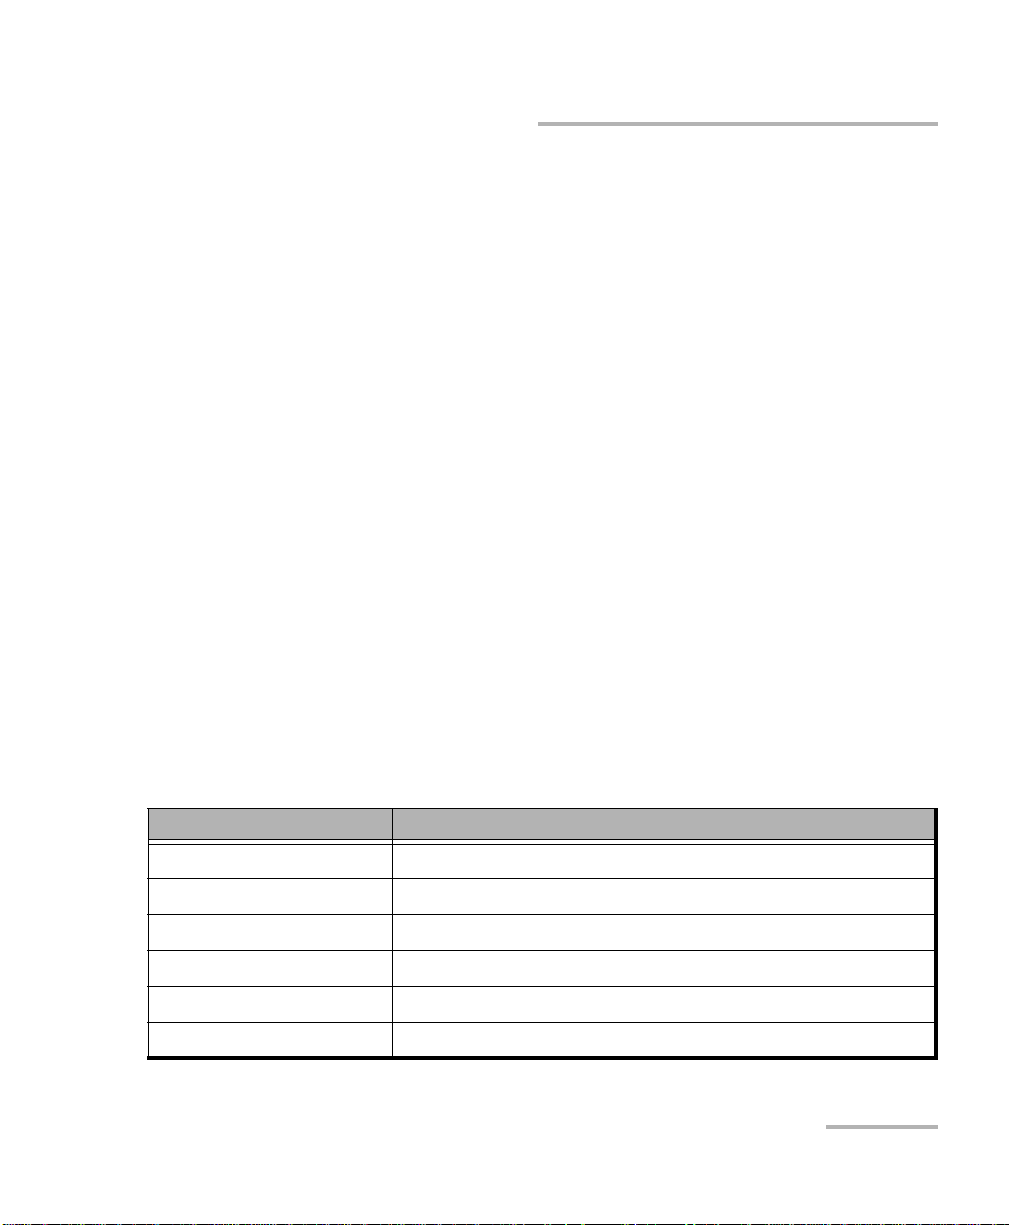
External Connectors
The layout of external connectors on the top and side panels of the device
is shown in following figures
14 ETS-1000G
Page 25
Device Description
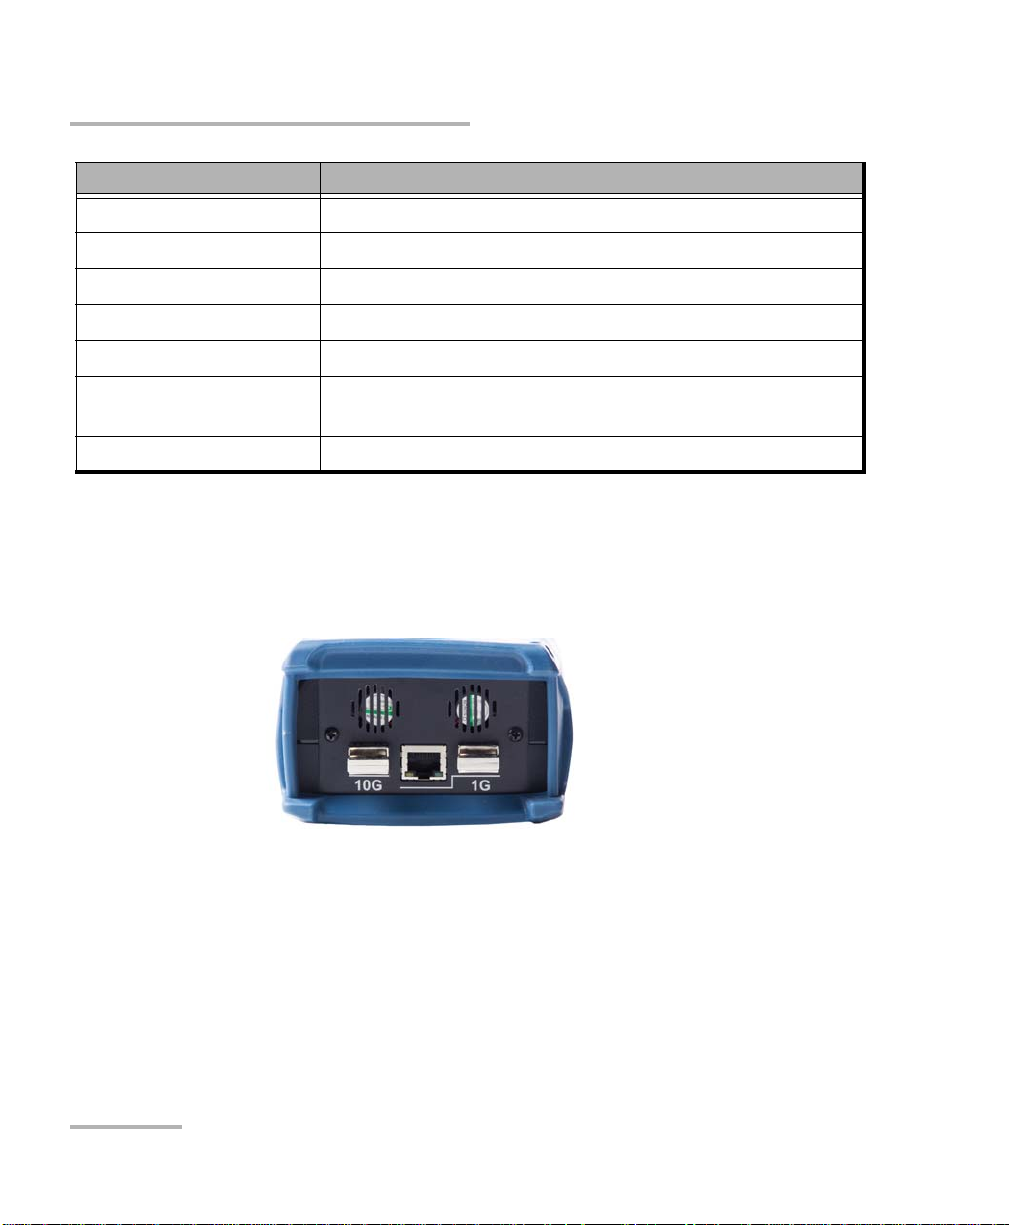
1
Control Menu Structure
The digit 1 in the above figure specifies the reset button.
Marking Description
10G Connecting the SFP+ module
1G RJ-45 connectors to connect to the tested network or
equipment (supported rates 10/100/1000 Mbps)
Port of the device contains 2 connectors — RJ-45 and SFP.
During the test only one connector of the port is used.
SFP-module connectors
LAN Remote control of the tester
USB Connecting to a PC via the USB interface
DC IN External power unit connector
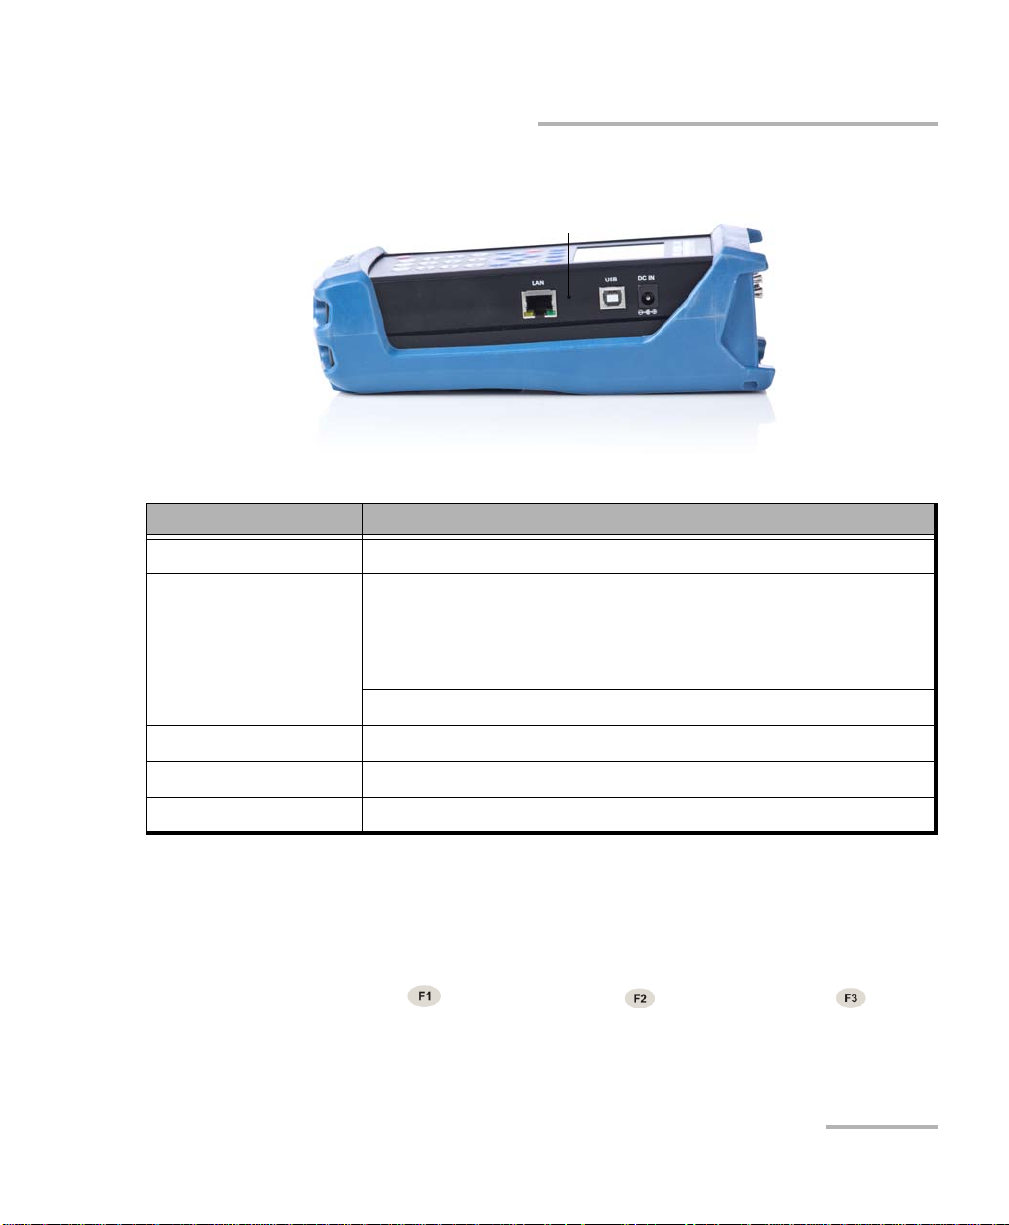
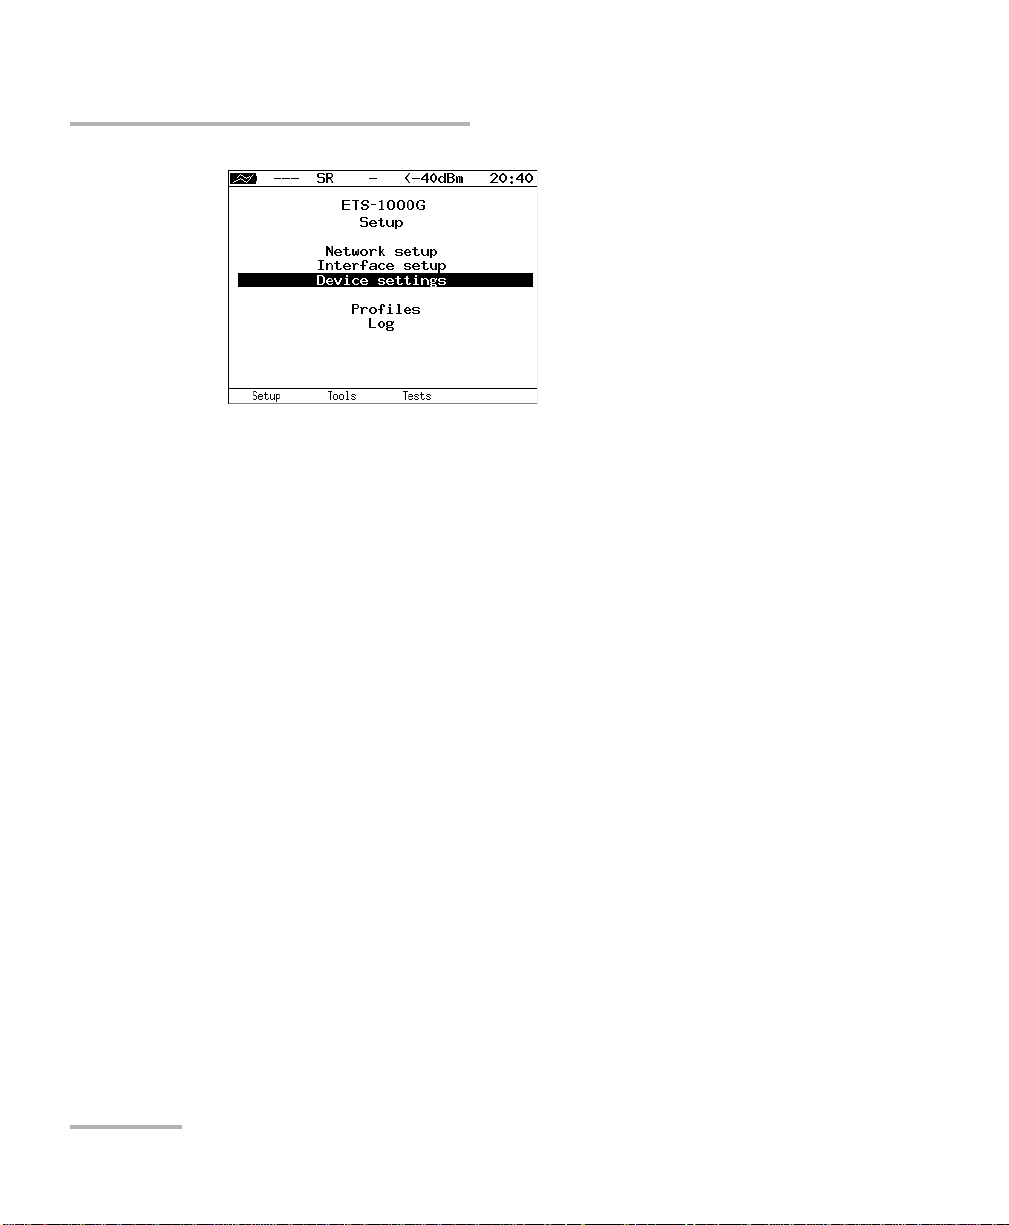
Control Menu Structure
The main menu of the ETS-1000G device consists of three submenus
(hereinafter referred to as menus). To switch between them, use the
following keys: (ETS-1000G Setup), (ETS-1000G Tools),
(ETS-1000G Tests).
1. ETS-1000G Setup.
10 Gigabit Ethernet Analyzer 15
Page 26
Device Description
Control Menu Structure
16 ETS-1000G
Page 27
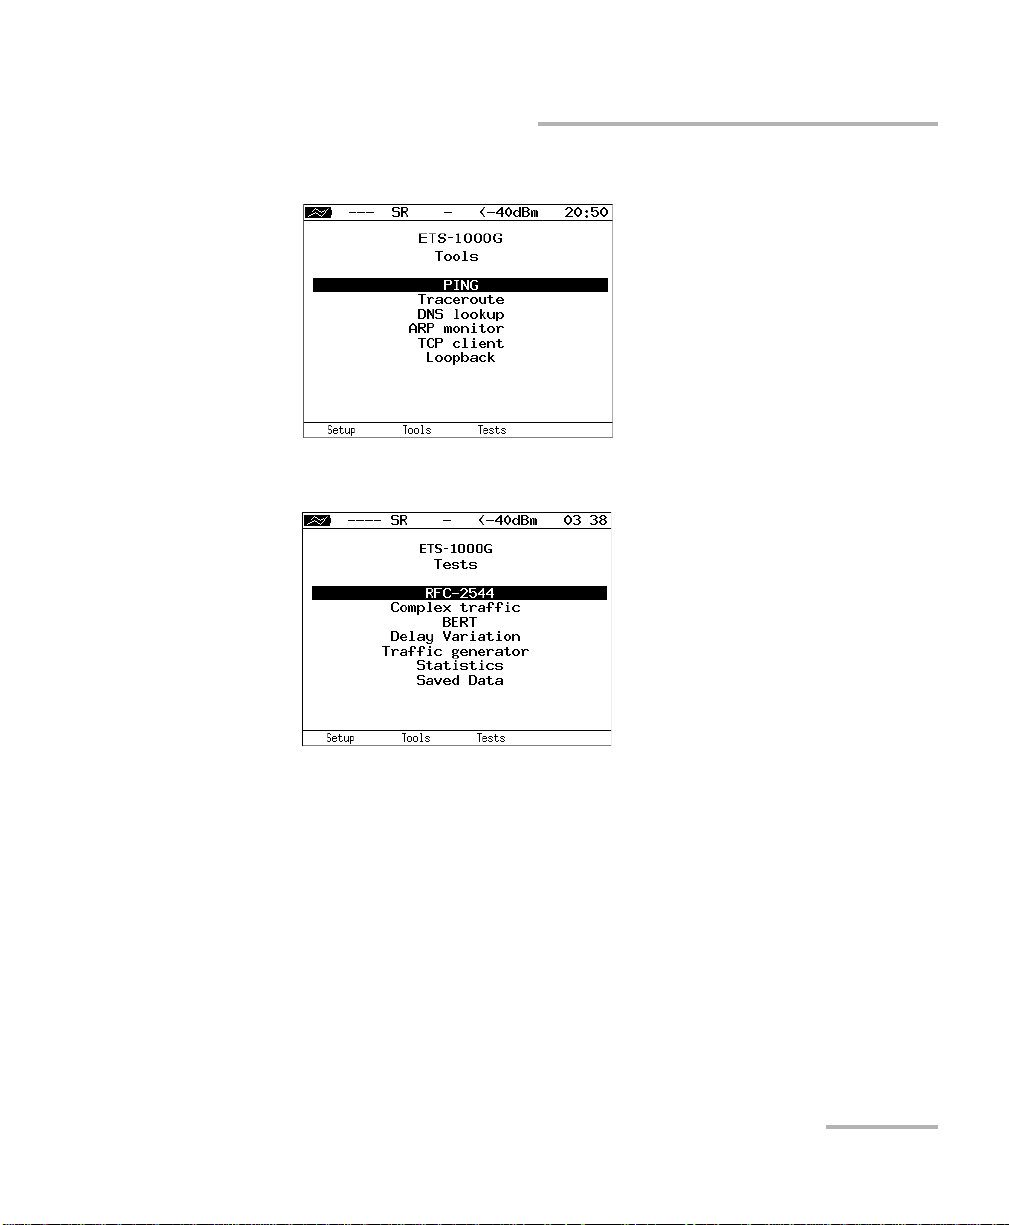
2. ETS-1000G Tools.
3.
ETS-1000G Tests.
Device Description
Control Menu Structure
10 Gigabit Ethernet Analyzer 17
Page 28

Page 29
4 RFC 2544
RFC 2544 methodology define a set of tests which are used for evaluating
key features of network devices and checking conformance of the services
being rendered to the specifications stipulated in SLA between
telecommunications operators and clients.
Owing to an opportunity of making an analysis of throughput, latency,
frame loss rate and limit load, these methods are currently are a de facto
standard for evaluating the performance of Ethernet-based networks.
ETS-1000G allows performing four standard tests in compliance with RFC
2544.
Throughput Analysis
Note: An analysis of throughput is performed for determining the maximum
possible switching speed for network elements in transport Ethernet-based
networks.
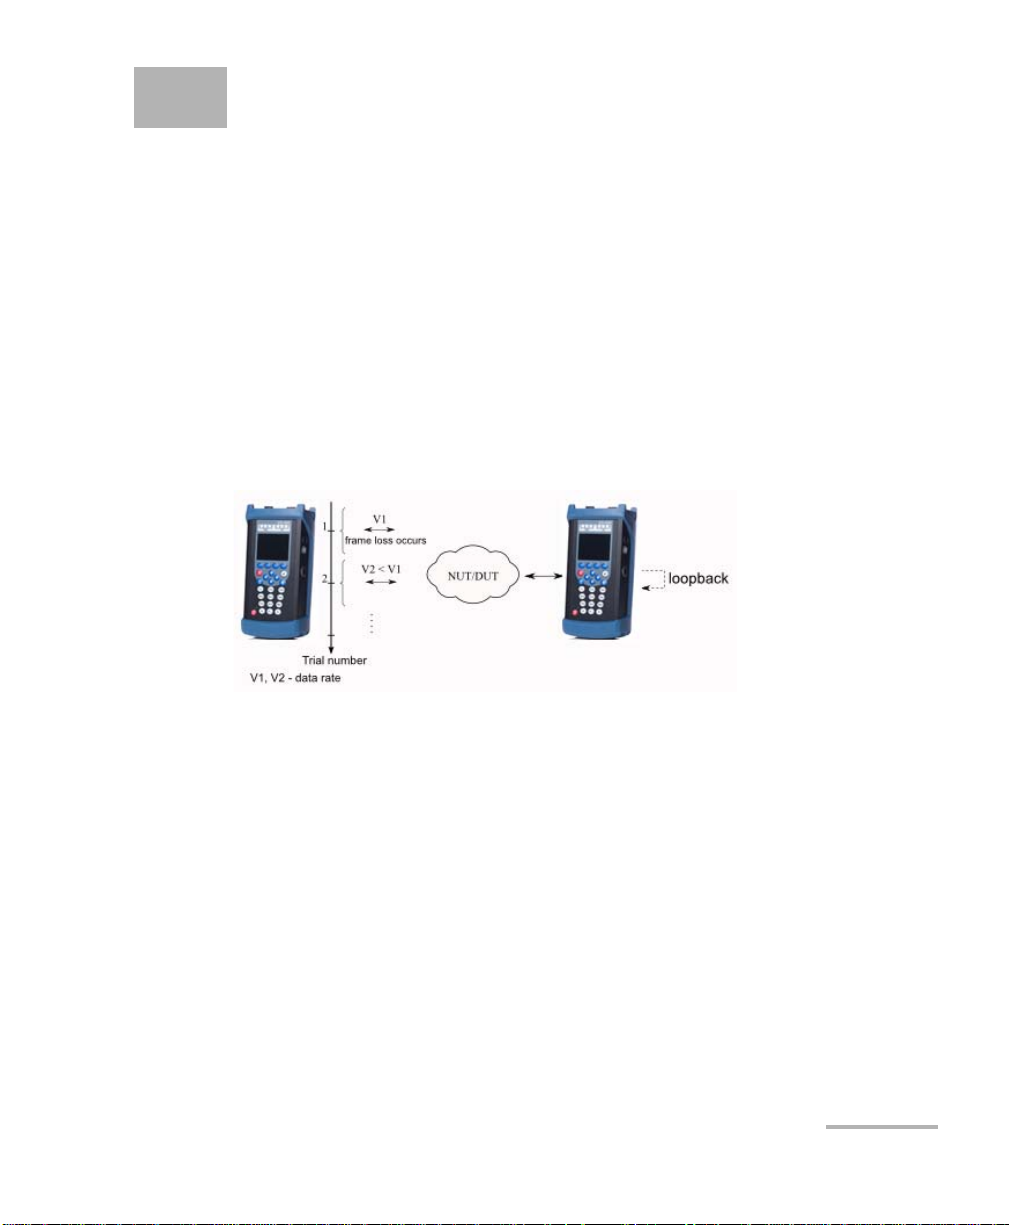
Throughput is the maximum data rate at which the quantity of frames
1
that
have been transferred via DUT is equal to the quantity of frames that have
been sent to it from the test equipment. During an analysis of throughput, a
number of packets are sent to the DUT input with the minimum interframe
2
gap
. Then the quantity of packets that have been received from the output
port of DUT is calculated. If it is less than the quantity of transmitted
packets, the interframe gap will be increased and the test will be repeated.
The binary search method is used for determining throughput.
1
The terms a frame and a packet are used in descriptions as synonyms.
2
Hereinafter it is assumed that the tester automatically executes all the operations under consideration.
10 Gigabit Ethernet Analyzer 19
Page 30
RFC 2544
Latency Analysis
Latency Analysis
Note: An analysis of latency is used for evaluating the time it takes a frame to be
transferred from the source to the destination and back to the source
element. A variable latency value may cause problems in the operation of
real-time services.
During an analysis of latency, the throughput of DUT is determined first.
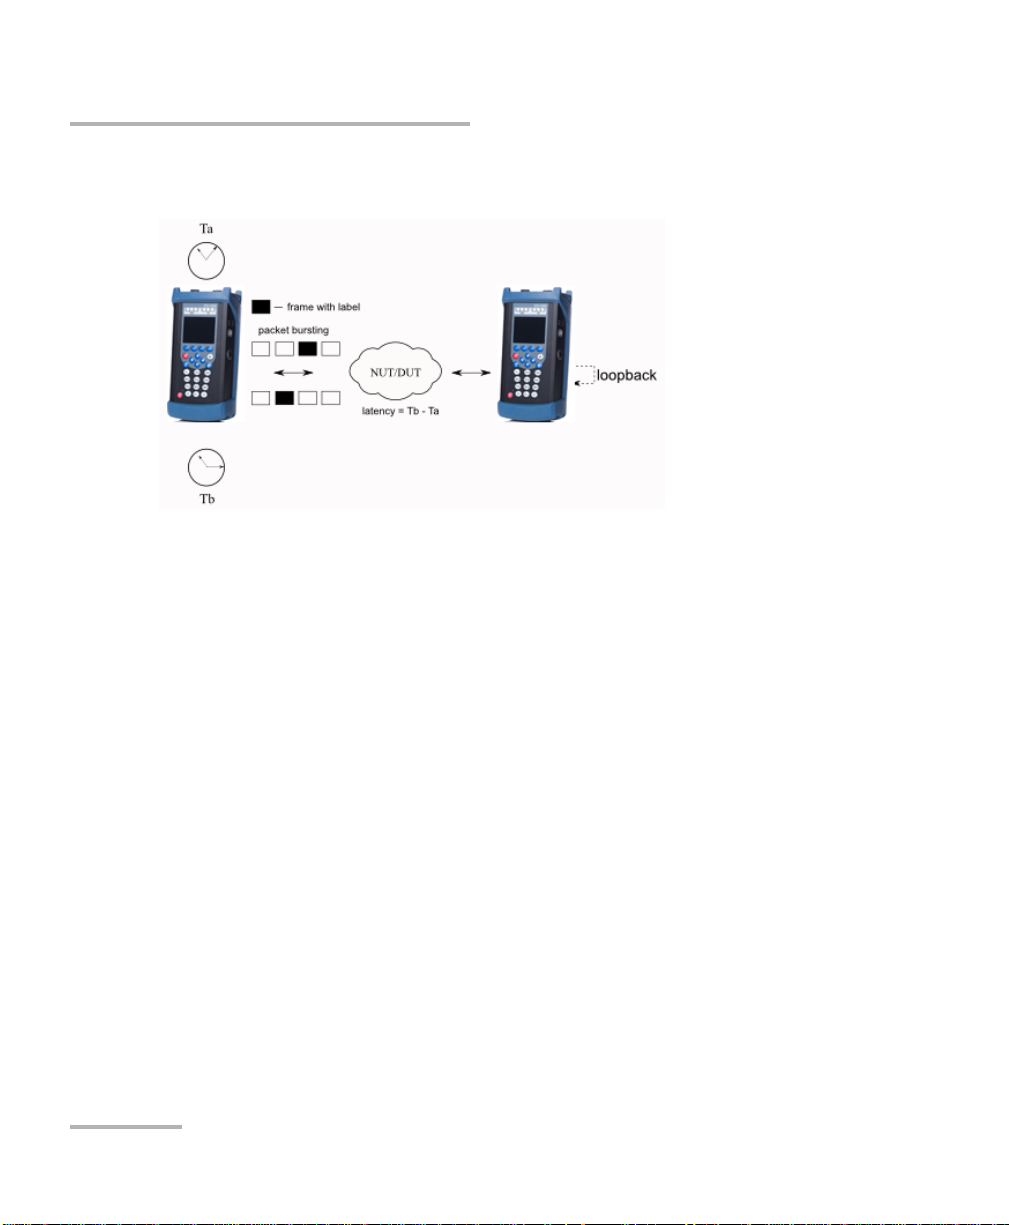
Then a frame ow is sent to the destination for each packet size determined
by RFC 2544 at the flow data rate corresponding to it. After a while a label
of the specific format is inserted into one packet. A Ta value (the time by
which the labeled packet has been completely transmitted) is recorded on
the transmitting side. On the receiving side the label is identified and a Tb
value (the time when the labeled packet was received) is recorded.
A latency is a difference (Tb - Ta). The analysis results are used for
calculating an average latency.
20 ETS-1000G
Page 31

RFC 2544
Frame Loss Rate Analysis
Frame Loss Rate Analysis
Note: An analysis of frame loss rate is necessary for checking the network's
capability to support real-time applications (which do not provide for
retransmission), as a high frame loss rate causes the deterioration of QoS.
An analysis of frame loss rate allows calculating the percentage of frames
that a network element has failed to transmit in case of steady load due to
the shortage of hardware resources.
During an analysis of frame loss rate, a number of frames are sent to the
input of DUT at a certain rate (input count) and the quantity of packets
which have been received from the output port of DUT (output count) is
calculated.
Frame loss rate is calculated according to the following formula:
100 x (inputcount — outputcount)
(inputcount)
The first attempt should be made at the maximum data rate for this
connection. The next attempt should be made at the rate which equals 90.
10 Gigabit Ethernet Analyzer 21
Page 32

RFC 2544
Back to Back Analysis
Back to Back Analysis
Note: An analysis of limit load allows evaluating the time it takes the device to
process the limit load.
During an analysis of data transmission unevenness, a number of frames
are sent to the input of DUT with the minimum interframe gap and the
quantity of packets which have been received from the output of DUT is
calculated. If it turns out to be equal to the quantity of sent frames, the test
will be finished. If the quantity of packets on the output of DUT is less than
the quantity of transmitted packets, the time will be reduced and the test
will be repeated.
22 ETS-1000G
Page 33

5 Preparing RFC 2544 for
Analysis
To make an analysis in compliance with RFC 2544, it is necessary to
connect the device to the device/network under test according to
the diagrams shown below.
one of
The following notation conventions are used in the diagrams:
Notation Description
MAC s A sender's MAC address.
MAC d A destination MAC address.
IP s A sender's IP address.
IP d A destination IP address.
MAC r A router's MAC address.
MAC 1 A MAC address of ETS-1000G.
10 Gigabit Ethernet Analyzer 23
Page 34

Preparing RFC 2544 for Analysis
Notation Description
IP 1 An IP address of ETS-1000G.
MAC 2 A MAC address of the remote device which implements traffic
redirection (loopback).
IP 2 An IP address of the remote device which implements traffic
redirection (loopback).
switch A network switch.
router A router.
To test the networks which include the devices operating on the data link
layer of the OSI model, for example, a switch, ETS-1000G should be
connected according to the diagram. In this case the traffic being
generated by the device should be redirected back via setting up a
loopback. The source and destination MAC addresses in incoming packets
are swapped and the traffic is sent back to the source port.
To test the networks which include the devices operating on the network
layer of the OSI model, for example, a router, ETS-1000G should be
connected according to the similar diagram as shown on the previous
page. Unlike the previous case, both the source and destination MAC and
IP addresses in incoming packets are swapped and the traffic is sent back
to the source port.
24 ETS-1000G
Page 35

Preparing RFC 2544 for Analysis
Top ol og y
Topology
Remote IP Remote device IP address (see Asymmetric Test on page 45)
Direction Testing direction:
both — select if you want to perform measurement of both
direction (from local device to remote and from remote
device to local);
upstream — select if you want to perform asymmetric test
in the direction from local device to remote (see
Asymmetric Test on page 45);
downstream — select if you want to perform asymmetric
test in the direction from remote device to local (see
Asymmetric Test on page 45).
10 Gigabit Ethernet Analyzer 25
Page 36

Preparing RFC 2544 for Analysis
Main header parameters
Main header parameters
Header parameters can be set using the menu
RFC 2544 > Setup > Header.
Src MAC A sender's MAC address.
Dst MAC A destination MAC address.
Src IP A sender's IP address.
Dst IP A destination IP address.
When setting MAC addresses, account must be taken of the following
aspects:
The source interface MAC address should be used for specifying the
sender's MAC address.
If there is a direct connection between the source and the destination
without any intermediate routers, the destination interface MAC
address should be used for specifying the destination MAC address.
If there is at least one router between the source and the destination,
the MAC address of the router which is nearest to the source should be
specified as the destination MAC address.
26 ETS-1000G
Page 37

Preparing RFC 2544 for Analysis
Additional header parameters
There is an option to automatically substitute MAC addresses and IP
addresses:
Press (when Src. MAC or Dst. MAC is selected) to substitute the
MAC address of test port which has been specified using the Interface
Parameters menu for the current MAC address.
Press (when Src. IP or Dst. IP is selected) to substitute the IP
address of test port which has been specified using the Network
Parameters menu for the current IP address.
Press (when Dst. MAC is selected) to submit an ARP request. As a
result of this request the MAC address corresponding to the destination
IP address will be substituted for the current destination MAC address.
Besides, the parameter values specified using the Header (Advanced)
menu are displayed on the screen.
Additional header parameters
Auto-ARP If On is selected, then an ARP request will be submitted
automatically when tests are started. As a result of this
request the MAC address corresponding to the destination
IP address specified using the Header menu will be substituted for the current destination MAC address.
10 Gigabit Ethernet Analyzer 27
Page 38

Preparing RFC 2544 for Analysis
Additional header parameters
VLAN Opening the VLAN menu which allows setting up to three
VLAN tags.
MPLS Opening the Label Stack menu.
IP DiffServ Allows selecting the Precedence and ToS fields
(PREC+TOS) or the DSCP field (DSCP) to set the Class of
Service for the traffic received from various applications.
The description of these fields is given below.
Precedence This field specifies a frame priority. Eight frame priority
values are supported. A sender can set any value from the
table (see Reference Tables on page 143) in this field.
ToS This field defines the Type of Service of an IP packet. A
sender can set any value listed in the table. Besides, it is
possible to set any other combination of 4 bits according to
the router's settings.
DSCP The DSCP field consists of 8 bits. It allows setting more
Classes of Service for traffic than the Precedence and ToS
fields do. The description of six highorder bits is given in
Reference Tables on page 143. T wo low-order bits are used
by TCP for transmitting congestion information. They are
described in Reference Tables on page 143.
UDP src A sender's UDP port number.
UDP dst A destination UDP port number.
Press (when VLAN is selected) to automatically substitute the settings
of test port which have been specified using the menu Interface
Parameters > VLAN for the VLAN settings.
Press (when MPLS is selected) to automatically substitute the settings
of test port which have been specified using the menu Interface
Parameters > MPLS for the MPLS settings.
28 ETS-1000G
Page 39

Preparing RFC 2544 for Analysis
Additional header parameters
VLAN setting
VLAN Selecting the number of labels (1 - 3, Off).
ID A 12-bit VLAN identifier. It is a number in the range
from 0 to 4095. It uniquely defines the VLAN which a
frame belongs to. The zero value of VLAN ID indicates
that this frame carries no information about VLAN and
contains priority information only. If the value of VLAN
ID is set to 1, when the frame passes through the switch's
port, the value of VLAN ID of this frame will be set to the
port's VLAN ID.
Priority This field defines a traffic priority. Eight traffic priority
values are supported. A correspondence between traffic
priorities and traffic types is described in Reference Tables
on page 143.
10 Gigabit Ethernet Analyzer 29
Page 40

Preparing RFC 2544 for Analysis
Additional header parameters
MPLS setting
Number of Labels Select the number of labels (1 - 3, Off).
Label The label value.
MPLS COS The Class of Service of a packet.
TTL The time-to-live of a labeled packet.
30 ETS-1000G
Page 41

Preparing RFC 2544 for Analysis
Select the Frame Size
Select the Frame Size
There are two ways to set the size of the frames to be transmitted:
1. To select standard sizes in compliance with RFC 2544 (using (By
default)): 64, 128, 256, 512, 1024, 1280 and 1518 bytes. In this case it is
possible to additionally set one frame of a random size.
2. To input the sizes of frames manually.
Note: The frame sizes should not be less than 64 bytes and should not exceed
64000 bytes.
10 Gigabit Ethernet Analyzer 31
Page 42

Preparing RFC 2544 for Analysis
Setting Test Parameters
Setting Test Parameters
There are two ways to set values of test parameters for making
an analysis:
1. Select standard settings in compliance with RFC 2544. To do so, select
RFC-2544 > Setup and press (By default).
2. Set parameters manually according to the directions given in the
subsequent sections.
To optimize the speed and to increase the efficiency of making an analysis,
ETS-1000G provides an option to change the standard values of test
parameters (defined by RFC 2544).
Test results are represented in the tabular and graphical forms according to
RFC 2544 recommendation.
Parameters of the Throughput Test
Enabled Enabling/disabling the throughput analysis.
Rate (L1) A raw data rate value (L1) that is specified in percentage
terms ( ), Kbps ( ) or Mbps ( ).
32 ETS-1000G
Page 43

Preparing RFC 2544 for Analysis
Setting Test Parameters
Trial, s The period of time during which the test should be per-
formed for each frame size specified in the settings
(1-3600 s).
Resolution, % Resolution at which the throughput search should be per-
formed. Possible values: 10, 1, 0.1, 0.01, 0.001, 0.0001.
The minimum resolution value corresponds to the highest
accuracy of channel throughput measurement and the longest test duration.
Threshold, % Threshold of available loss (0-10%). If the quantity of
received packets is less than the quantity of transmitted
packets by the value of allowed loss threshold, the test will
be considered as completed.
Parameters of the Latency Test
Enabled Enabling/disabling the data deference analysis.
Trial qty The number of test reiterations for each defined frame size.
10 Gigabit Ethernet Analyzer 33
Page 44
Preparing RFC 2544 for Analysis
Setting Test Parameters
Trial, s The period of time during which the test should be per-
formed for each frame size specified in the settings
(1-3600 s).
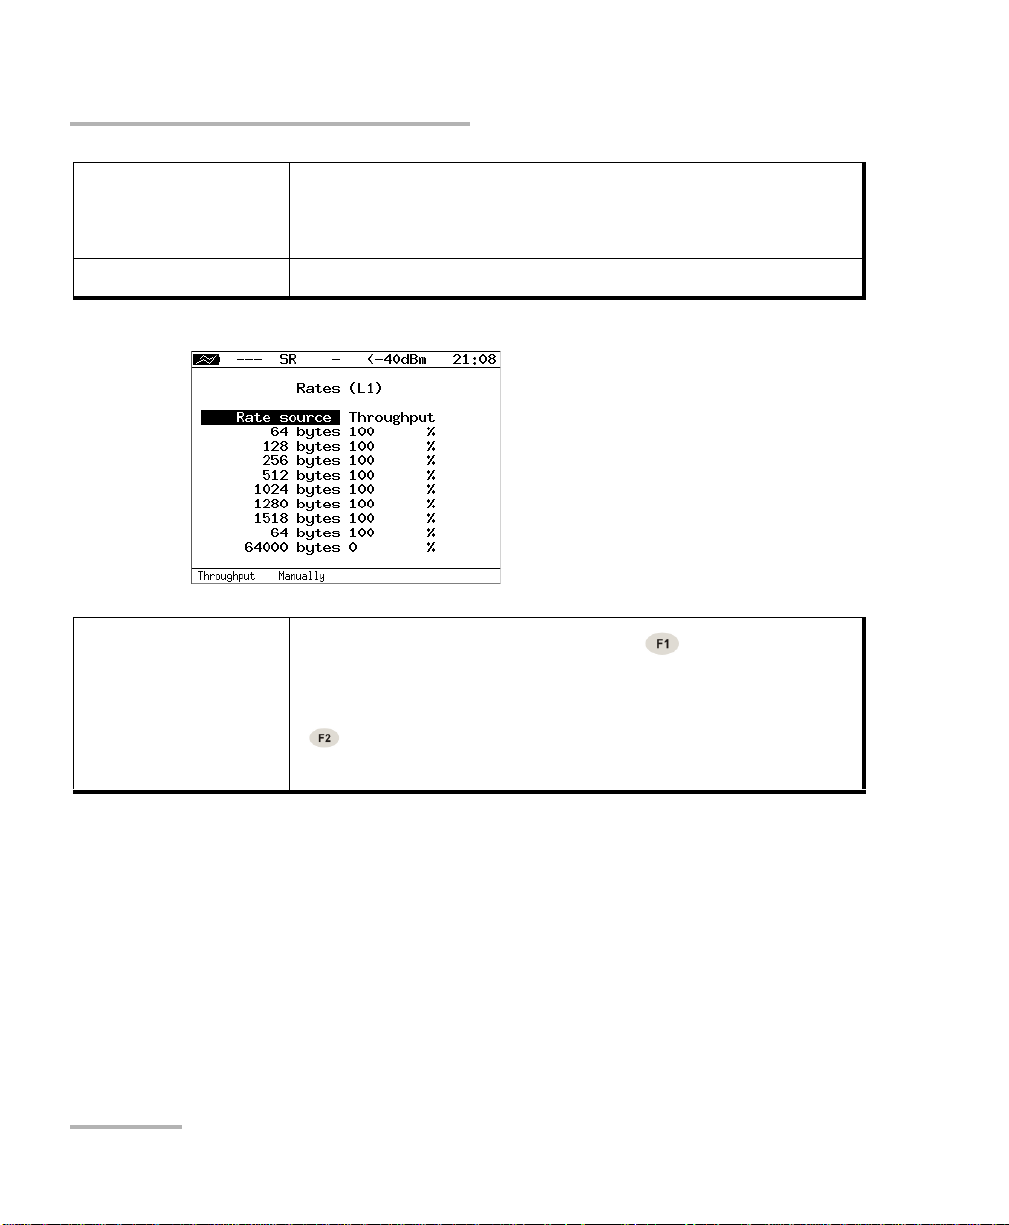
Rates (L1) Open the Rates (L1) menu.
Rate source
If the Throughput value is selected ( ), the Latency test
will be performed using the load value obtained as a result
of the Throughput test. If the Manually value is selected
( ), then user-defined values will be used for performing the test.
34 ETS-1000G
Page 45

Preparing RFC 2544 for Analysis
Setting Test Parameters
Parameters of the Frame Loss Rate Test
Enabled Enabling/disabling the deviation loss rate analysis.
Trial, s The period of time during which the test should be per-
formed for each frame size specified in the settings
(1-3600 s).
Steps qty The number of load adjustment steps.
The Start rate (L1) and Stop rate (L1) fields allow setting the range of load
values to be used for performing the loss rate analysis. Raw data rate
values (L1) can be specified in percentage terms ( ), Kbps ( ) or
Mbps ( ).
10 Gigabit Ethernet Analyzer 35
Page 46

Preparing RFC 2544 for Analysis
Setting Test Parameters
Parameters of the Back-to-Back Test
Enabled Enabling/disabling the limit load analysis.
Trial qty The number of test reiterations for each frame size config-
ured in the settings.
Trial, s The period of time during which the test should be per-
formed for each frame size specified in the settings
(2-3600 s).
Rates (L1) Open the Rates (L1) menu.
36 ETS-1000G
Page 47

Preparing RFC 2544 for Analysis
Setting Test Parameters
Advanced Settings
Wait time, ms The time between completing a test iteration
and sending a learning frame.
Learn time, ms The interval between sending a learning frame and starting
the test.
According to RFC 2544, the interval is 7000 ms (2000 ms are allocated for
receiving residual frames, 5000 ms are allocated for stabilization of the
device under test), and the duration of learning is 2000 ms.
A user may set arbitrary values of the interval within the range from 100 to
10,000 ms. The duration of learning should not be shorter than 100 ms and
longer than 10,000 ms.
10 Gigabit Ethernet Analyzer 37
Page 48

Page 49

6 Analyzing RFC 2544
To start tests that are based on RFC 2544, open the RFC-2544 menu and
press
To conduct tests selectively, open the menu of the specific test and press
Throughput Test Results
Test results are displayed in the tabular form: the frame size (in bytes), a
throughput value (in %), which has been obtained as a result of the
analysis. (To select the unit of measurement, including Mbps L2, Mbps L3,
Mbps L4 or fps, press ).
(Start). All the selected tests will be conducted.
(Start).
To switch to the graphical representation of test results, press (Plot).
It is possible to switch between two options of the graphical representation
of test results using (View):
10 Gigabit Ethernet Analyzer 39
Page 50

Analyzing RFC 2544
Latency Test Results
1. The maximum value on the Y-axis indicates the maximum data rate.
Empty columns indicate the maximum theoretical throughput value.
2. The maximum value on the Y-axis indicates the maximum measured
throughput value.
In both cases values on the X-axis indicate frame size values.
Filled columns in the diagram are used for displaying the throughput value
obtained as a result of testing which is expressed in fps and in percentage
terms relative to the stated load.
Latency Test Results
The table displays an average latency value (in ms) for each data frame
size specified in the settings and the respective throughput value (in %),
which has been obtained as a result of the Throughput test.
40 ETS-1000G
Page 51

Analyzing RFC 2544
Latency Test Results
The diagram shows a column for each frame size whose height
corresponds to an average latency value (in ms).
10 Gigabit Ethernet Analyzer 41
Page 52

Analyzing RFC 2544
Frame Loss Rate Test Results
Frame Loss Rate Test Results
The table lists frame loss rate values for each packet size (in bytes) and the
respective channel occupancy (in %). To select the unit of measurement,
including Mbps L2, Mbps L3, Mbps L4 or %, press .
The diagram shows dependence of the frame loss rate (in %) on the load
(in %) for each frame size specified in the settings.
42 ETS-1000G
Page 53

Analyzing RFC 2544
Back to Back Test Results
Back to Back Test Results
The table lists the load defined in the test settings and the time it takes the
device to process the limit load for each packet size. If the time during
which the device endures the maximum load cannot be determined, the
test status column will display Error and the Time, s column will be filled
with dashes.
It is possible to display the Frames column containing the number of
frames which have been transmitted during the test instead of the Time, s
column. To do so, press (Frames).
The diagram shows a column for each configured frame size whose height
corresponds to the time during which the device endured the limit load.
The number of packets transmitted during the test is indicated on the
columns in the diagram.
10 Gigabit Ethernet Analyzer 43
Page 54

Analyzing RFC 2544
Saving Test Results
Saving Test Results
In the mode of testing based on RFC 2544, press (Save/Load) to open
the menu which allows displaying information about saved measurements
( ), saving test results and parameters ( ), loading ( ) and
deleting ( ) saved measurement results and parameters.
44 ETS-1000G
Page 55

7 Asymmetric Test
Asymmetric test function is used to check operability of communication
link that has different data transmitting and receiving parameters
(throughput etc) — asymmetric channels.
Note: The option is not included in the basic configuration; should be purchased
additionally.
Measurements of the asymmetric channels parameters should be
performed independently for each direction. Therefore, the test traffic
transmission is produced in one selected by the user direction.
By testing two ETS-1000G should be used: local and remote. On the local
device the test parameters are set. The remote device is on the other end
of asymmetric channel.
Testing results are displayed on the screen of the local device.
Note: Tests for which the function is available are BERT and RFC 2544:
throughput, frame loss, back-to-back. RFC 2544 latency test is not available.
10 Gigabit Ethernet Analyzer 45
Page 56

Asymmetric Test
Test i ng Exam p le
Testing Exam ple
The following description is an example of an asymmetric testing for the
BERT (for RFC 2544 procedure is similar).
Connection scheme is shown in the following image.
The following notation conventions are used in the diagrams:
MAC 1 – local device MAC address;
IP 1 – local device IP address;
MAC R1 – MAC-address of the gateway that is nearest to the local
device;
MAC RN – MAC-address of the gateway that is nearest to the re-
mote device;
MAC 2 – remote device MAC address;
IP 2 – remote device IP address.
To perform measurement in the direction from local device to
remote, do the following:
1. Make sure that the local and remote device support asymmetric test
function: in the ETS-1000G. Setup > Device settings > Options menu
list of options should contain XAT option.
46 ETS-1000G
Page 57

Asymmetric Test
Test i ng Exam p le
2. Connect the local and remote device according to the scheme shown
in the scheme image on this page.
3. On the local and remote device switch to the ETS-1000G. Setup >
Network Setup menu and set:
Interface – Test
One of the following methods specify the IP address of local device (IP
1) and remote device (IP 2):
set IP address manually;
receive IP address via DHCP.
4. On the local device switch to the BERT > Setup > Topology menu.
Set:
Remote IP – IP 2
Direction – Upstream
10 Gigabit Ethernet Analyzer 47
Page 58

Asymmetric Test
Test i ng Exam p le
5. On the local device switch to the BERT > Setup > Header menu.
Set:
Src MAC - MAC 1
Dst MAC - MAC R1
Src IP - IP 1
Dst IP - IP 2
Note: To get gateway MAC address it is necessary to submit an ARP request:
switch to the Dst MAC menu item and press button.
According to the section BERT on page 77 on the local device it is
necessary to perform BER test settings. Then switch to the BERT menu and
press (Start) button.
Note: After pressing the Start button the following messages can be displayed on
the screen of the local device:
Connecting to remote port... — occurs immediately after the test start.
No route to host — occurs if the local device is unable to connect to the
remote device.
Connection is lost — occurs if the remote device is not responding
after the connection is established.
48 ETS-1000G
Page 59

Asymmetric Test
Test i ng Exam p le
Remote unit is busy — occurs when the remote device is already
under test.
Asymm. BERT at L1 is not supported — occurs when you try to perform
BERT on the first level.
Note: The Unit is used for remote testing message is displayed on the screen of
the remote device during the test.
10 Gigabit Ethernet Analyzer 49
Page 60

Asymmetric Test
Test i ng Exam p le
To perform measurement in the direction from remote device to
local, do the following:
1. Make sure that the local and remote device support asymmetric test
2. Connect the local and remote device according to the scheme shown
3. On the local and remote device switch to the ETS-1000G. Setup >
4. On the local device switch to the BERT > Setup > Topology menu.
function: in the ETS-1000G. Setup > Device settings > Options menu
list of options should contain XAT option.
in the image.
Network Setup menu and set:
Interface - Test
One of the following methods specify the IP address of local device (IP
1) and remote device (IP 2):
set IP address manually;
receive IP address via DHCP.
Set:
Remote IP - IP 2
Direction - Downstream
5. On the local device switch to the BERT > Setup > Header menu.
Set:
Src MAC - MAC 2
Dst MAC - MAC RN
Src IP - IP 2
Dst IP - IP 1
6. According to the section BERT on page 77, on the local device it is
necessary to perform BER test settings. Then switch to the BERT menu
and press (Start) button.
Note: After pressing the Start button a messages similar to the listed on page 48
can be displayed on the screen of the local and remote device.
50 ETS-1000G
Page 61

8 Complex Traffic
The complex test traffic generation function1 allows creating up to 10 data
streams with various parameters. It can be used for checking whether the
priority assignment function is properly implemented in the device being
tested and for simulating various workload profiles.
Tests Opening the Complex Traffic: Report screen (for starting a test,
displaying measurement results).
Setup Opening the Settings menu.
To start a test, adjust the test parameters using the Settings menu and press
(Start).
10 Gigabit Ethernet Analyzer 51
Page 62

Complex Traffic
After the test has been completed, the following data will be displayed for
each stream:
the specified frame size,
the specified data rate (L2),
the frame loss value obtained as a result of testing,
the bandwidth calculated according to the results of testing.
Press (Diagram) to open the screen which contains the graphical
representation of test results.
The diagram shows a column for each stream whose height corresponds
to the respective frame loss value.
Press (Save/Load) to open the Results menu.
Press to open the Complex Traffic: latency screen.
52 ETS-1000G
Page 63

Cur Current data deference.
Min Minimum data deference.
Avg Average data deference.
Max Maximum data deference.
Press again to open the Complex Traffic: Frames screen.
Complex Traffic
The screen displays the number of transmitted packets (Tx) and the
number of received packets (Rx) for each stream.
10 Gigabit Ethernet Analyzer 53
Page 64

Complex Traffic
Streams Quantity of data streams (1-10).
Duration Duration of generating the specified quantity of streams
(1-2886 s).
Header Opening the Header menu.
Frames Opening the Frames menu.
Rates (L2) Opening the Rates (L2) menu.
54 ETS-1000G
Page 65

Complex Traffic
To select the number of the stream to be adjusted, use the keys
and .
Frame sizes should be set manually within the range from 64 to 9600 bytes
for each stream.
A data rate value (L2) should be specified in percentage terms ( ),
Kbps ( ) or Mbps ( ).
10 Gigabit Ethernet Analyzer 55
Page 66

Complex Traffic
Complex Traffic MPLS Setting
Complex Traffic MPLS Setting
The label stack to be used for testing is set using the Label Stack menu:
ETS-1000G. Measurements > Complex Traffic > Setup > Header >
Advanced > MPLS.
Labels Select the number of labels (from 1 to 3) to be added to an
outgoing packet.
Label The label value.
MPLS COS The Class of Service of a packet.
TTL The time-to-live of a labeled packet.
56 ETS-1000G
Page 67

9 Loopback
The loopback feature is used for testing networks in compliance with RFC
2544, measuring BER and solving some other tasks. It allows looping back
the traffic coming to the device on the four OSI layers.
On the physical layer (L1) all incoming traffic is left unchanged and
redirected back. Besides, statistics of received traffic is collected.
On the data link layer (L2) all incoming frames are redirected back, the
source and destination MAC addresses may be swapped. Statistics of
received and transmitted traffic is collected.
On the network layer (L3) all incoming packets are redirected back, the
source and destination MAC and IP addresses are swapped. Statistics of
received and transmitted traffic is collected.
On the transport layer (L4) all incoming traffic is redirected back. In
addition to swapping the source and destination MAC and IP addresses,
the source and destination TCP/UDP port numbers are swapped too.
Note: Defective packets are not redirected in case of setting up a loopback on the
data link (L2), network (L3) and transport (L4) layers.
Note: Packets with identical MAC Dst and MAC Src, M Protocol Data Units
(OAMPDU) and ARP requests which are contained in the incoming traffic
are not redirected in case of setting up a loopback on the data link (L2),
network (L3) and transport (L4) layers.
Note: If an incoming packet contains an MPLS label, it will be redirected without
changing the label value.
10 Gigabit Ethernet Analyzer 57
Page 68

Loopback
Layer Selec t the OSI layer on which test traffic should be redirected:
Off – disable the loopback feature,
1 – the physical layer,
2 – the data link layer (MAC),
3 – the network layer (IP),
4 – the transport layer (TCP/UDP).
ET-Discovery Open the ET-Discovery menu.
OAM Open the OAM menu.
58 ETS-1000G
Page 69

10 OAM
An important task of telecommunications service providers is to ensure a
high grade of administration and maintenance of Ethernet-based
networks. The IEEE 802.3ah standard was developed for that purpose [7]
(also known as Ethernet in the First Mile (EFM) OAM).
OAM (Operations, Administration, and Maintenance) is a link state
monitoring protocol that is implemented on the data link layer of the OSI
model. The transmission of information between Ethernet devices is
implemented using protocol data units (OAMPDU).
An important feature of the OAM protocol consists in providing an
opportunity of enabling the Loopback mode on a remote device.
To establish a connection between the ETS-1000G device and a
remote device over the OAM protocol and to enable the Loopback
mode, it is necessary to execute the following procedure:
1. Establish a direct connection between the local ETS-1000G de
remote device
vice and the
according to the diagram shown below.
2. Enable the operation of the OAM protocol in the active or passive mode
on the remote device.
On the local device:
3. Open the OAM menu.
4. Select the active operating mode for the OAM protocol in the Mode
menu item.
5. The remote device detection status should be set to Send any in the
Discovery menu item.
10 Gigabit Ethernet Analyzer 59
Page 70

OAM
6. Open the Remote Device menu. Information about the remote device
should be displayed in the screen.
7. Press (LB up). The Loopback mode will be enabled for the data
link layer (L2) on the remote device (traffic will be redirected without
the swapping of MAC addresses).
To disable the Loopback mode, press (LB down).
Mode The possible OAM states are:
Active – the active mode. In this mode the port can send
the commands to detect devices and to enable the
Loopback feature on the remote device, and also respond
to the Ethernet OAM commands received from the remote
device.
Passive – the passive mode. In this mode the port cannot
initiate enabling the Loopback feature, it can only respond
to the Ethernet OAM commands received from the remote
device.
Off – OAM is disabled.
60 ETS-1000G
Page 71

Discovery A remote network device detection status. The possible
statuses are:
Fault — the initial state. A connection to the remote device
is not established.
Send local — send OAMPDU with information about
supported operating modes.
Passive wait — wait for OAMPDU with information about
supported operating modes from the remote device which
has been configured in the active mode.
Send loc/rem — send OAMPDU with information about the
operating modes supported for the local and remote
devices, and with the label indicating the possibility to
establish a connection.
Send loc/rem ok — receive OAMPDU with information that
operating modes of the local and remote devices are
compatible.
Send any — a connection has been established.
Remote device Open the menu that contains information about the remote
device.
OAM
Note: A connection can be established successfully only if the remote device
supports the Remote loopback feature. If this feature is unavailable, the
remote device detection status will be set to Send loc/rem ok.
10 Gigabit Ethernet Analyzer 61
Page 72

OAM
MAC address The MAC address of the remote device.
Vendor OUI The unique organization identifier which is used for gener-
ating the MAC address.
Mode The remote client's OAM state.
Unidirectional Support for unidirectional interconnection.
Rem. loopback Support for the remote loopback mode.
Link events Support for the notification of connection errors.
Var. retrieval Support for reading the variables used for the evaluation of
link quality.
LB status A status of the Loopback mode on the remote device.
Note: ETS-1000G doesn't support the unidirectional, link events and var. retrieval
features.
62 ETS-1000G
Page 73

11 ET–Discovery
The ET–discovery function allows enabling the Loopback mode for the
data link layer (L2), the network layer (L3) or the transport layer (L4) on the
remote analyzer (ETS-1000G) or the remote loopback device.
According to the test diagram, it is possible to enable the Loop-back mode
successively on several devices ETS-1000G, which can belong both to
different subnets or to the same subnet.
10 Gigabit Ethernet Analyzer 63
Page 74

ET–Discovery
IP An IP address of the remote device.
Loopback Select the loopback layer:
- Disable the Loopback mode.
- Enable the data link layer loopback.
- Enable the network layer loopback.
- Enable the transport layer loopback.
To obtain data on the remote device and ensure that the
Loopback mode can be enabled, follow the procedure below:
1. Connect ETS-1000G to the network according to the diagram shown in
the previous page.
2. Open the Network Parameters menu, specify the port's IP address or
make sure that the device has received the correct IP address via
DHCP.
3. Open the ET Discovery menu.
4. Specify the IP address of the remote device in the IP address field.
5. Press (Detect). If the function has been executed successfully, the IP
address, the name and the MAC address of the remote device will be
displayed on the screen. The Loopback menu item will become
available for editing.
6. 6. Select the loopback layer using , , .
Note: The data are transmitted over UDP. Destination port: 32 792. Source port: 32
793.
64 ETS-1000G
Page 75

12 TCP/IP Tests
The tests which are described in this section are used for diagnostics in the
networks containing the devices which ensure the switching and routing of
the data being transmitted. The TCP/IP tests which are implemented in the
device allow detecting the problems relating to the network configuration,
checking the network connectivity, determining data transmission routes,
checking the operability of data links and estimating their occupancy.
Ping
The Ping tool allows checking the operability of data links and intermediate
network devices. When the test is being performed, the system sends
requests to the specified node and records the responses being received
from it. Analysis results are used for generating a statistical report.
To perform the test, follow the procedure below:
1. Connect the device to the network under test according to the diagram
shown below.
2. Set up a network connection (refer Network Parameters on page 103).
3. Open the Ping menu.
10 Gigabit Ethernet Analyzer 65
Page 76

TCP/IP Tests
Ping
(Start)
(Statistics)
(Setup)
(Save/Load)
4. Set up the test parameters in the Ping Setup menu.
Start the test.
Open the Statistics screen.
Open the Ping Setup menu.
Open the menu for saving test results.
IP address The IP address of the node whose accessibility is to be
checked.
66 ETS-1000G
Page 77

TCP/IP Tests
Ping
Packet Size The size of an ICMP packet (in bytes).
Count The quantity of packets to be sent (from 0 to 9999). If the
zero value is selected, the packets will be sent until a user
presses (Stop).
Timeout The timeout for receiving a response to a ping request (in
ms).
Pause The time interval between two consecutive attempts to
send a request (in ms).
5. Open the Ping menu and press (Start). The test will be started. As
it is being performed, the lines containing the following data (from left
to right) are displayed in the screen:
the size of an ICMP packet,
the IP address of the network node which has responded to the ping
request,
the packet serial number,
the time period between sending a request and receiving a reply.
An example of test results is shown in the following figure.
The test results are used for generating a statistical report.
10 Gigabit Ethernet Analyzer 67
Page 78

TCP/IP Tests
Ping
Statistics contains information about the minimum and maximum time
between sending a request and receiving a response, and about the
number of transmitted, sent, lost and repeated packets (with the same
serial number). The value in the timeout line indicates the number of
packets for which the timeout for receiving a response to a ping request
has expired.
68 ETS-1000G
Page 79

TCP/IP Tests
Traceroute
The Traceroute tool is used for determining data routes and allows
diagnosing the availability of intermediate network devices. During the test
a sequence of frames is sent to the specified node and the system displays
information about all the intermediate routers through which the data have
been relayed on the way to the end node.
To perform the test, follow the procedure below:
1. Connect the device to the network under test according to the diagram
shown on this page.
2. Set up a network connection (refer Network Parameters on page 103).
3. Open the Traceroute menu.
Traceroute
(Start)
(Setup)
(Save/Load)
4. Set up the test parameters in the Traceroute Setup menu.
10 Gigabit Ethernet Analyzer 69
Start the test.
Open the Traceroute Setup menu.
Open the menu for saving test results.
Page 80

TCP/IP Tests
Traceroute
IP address An IP address of the end node.
Max. hops The maximum number of routers through which packets
can be transmitted.
Packet Size The size of a frame (in bytes).
Timeout The timeout for sending the next request (if the response to
the previous one has not been received).
5. Press (Start). The test will be started. As it is being performed, the
lines containing the following data (from left to right) are displayed in
the screen:
the number of an intermediate node,
the IP address of an intermediate node,
the response time.
70 ETS-1000G
Page 81

TCP/IP Tests
DNS Lookup
If the timeout for receiving a response from an intermediate node has
expired, the asterisk character (*) will be displayed in the
line containing
results. An example of test results is shown in the following image.
DNS Lookup
The DNS lookup tool allows detecting faults in the operation of NS servers.
The Domain Name System (DNS) is a distributed database that provides a
node's IP address according to the request containing its domain name.
To perform the test, follow the procedure below:
1. Connect the device to the network under test according to the diagram
shown in this chapter.
2. Set up a network connection (refer to Network Parameters on
page 103).
3. Open the DNS menu.
10 Gigabit Ethernet Analyzer 71
Page 82

TCP/IP Tests
DNS Lookup
Host The name of the node whose IP address should be deter-
mined.
IP The IP address of the node whose name was specified
above which has been received as a result of performing
the test.
4. Select the Host menu item and specify the domain name of the node.
5. Press (Start). The IP address of the node will be displayed in the IP
menu item.
If the IP address fails to be determined, the zero IP address
(0.0.0.0)
will be displayed in the IP menu item.
72 ETS-1000G
Page 83

TCP/IP Tests
ARP Request Monitor
ARP Request Monitor
The ARP monitor tool allows monitoring the ARP responses being
transmitted in the network and intercept the device IP and MAC addresses
which are contained in them.
To perform the test, follow the procedure below:
1. Connect the device to the network under test according to the diagram
shown in this chapter.
2. Set up a network connection (refer to Network Parameters on
page 103).
3. Open the ARP Monitor menu.
10 Gigabit Ethernet Analyzer 73
Page 84

TCP/IP Tests
TCP Client
TCP Client
4. After a while the message ARP table is empty disappears and network
devices' IP and MAC addresses are displayed on the
If an entry hasn't been updated within a minute, it will be deleted from the
list.
The TCP client tool allows establishing a TCP connection to a remote
network node to receive data from it and transmit data to it. This feature
can also be used for the management of a remote node over TELNET.
screen.
To establish a connection, follow the procedure below:
1. Connect the device to the network according to the diagram shown in
this chapter.
2. Set up a network connection (refer to Network Parameters on
page 103).
3. Open the TCP Client menu.
74 ETS-1000G
Page 85

TCP/IP Tests
TCP Client
(Open)
(Setup)
(Save/Load)
4. Open the TCP Client. Setup menu and adjust the connection
Establish a TCP connection.
Open the TCP Client. Setup menu.
Open the menu for saving test results.
parameters:
Enter the domain name or the IP address of the node.
Specify the port number (the most frequently used port numbers
are listed in Reference Tables on page 143).
10 Gigabit Ethernet Analyzer 75
Page 86

TCP/IP Tests
TCP Client
Host The domain name or the IP address of the node.
TCP Port The destination port number.
File The name of the le whose content should be displayed in
the result window if an HTTP GET request has been handled successfully.
5. Open the TCP Client menu and press (Establish) to establish a TCP
connection.
If a connection has been established successfully, a user may submit
commands of the respective protocol to request web pages from the
server. If problems occur during the connection establishment, an
error message will be displayed. Some error messages are listed in
Reference Tables on page 143.
Web pages are transmitted over HTTP. This protocol defines an
request. It can be used for checking whether a server responds to HTTP
requests and obtaining content of the specified resource.
76 ETS-1000G
HTTP GET
Page 87

13 BERT
BERT (Bit Error Rate Test) is a test that allows determining the main bit
index of link quality, the bit error rate, i.e. the number of bit errors divided
by the total number of transferred bits.
A binary sequence that is known at the far end and the near end is inserted
into an Ethernet frame which is transmitted to the physical media.
At the far end the sequence is compared with the original one and the bit
error rate is calculated. To enable the connection to a TDM network, an
interface converter is used. It converts the packet network traffic
(Ethernet) into the traffic being transmitted across TDM networks.
The test can be implemented on four OSI layers.
On the physical layer data is sent in portions at a certain interframe gap
(IFG). In this case the transmitting fiber optic pair is looped to the receiving
one or the Loopback function is used to conduct the test.
On the data link layer an Ethernet header is added to data, which allows
transmitting test packets across the network that contains the devices
operating on the second layer of the OSI model (for example, a switch).
The methods for connecting the device to the network being tested are
shown in the figures in this chapter.
On the network layer data is inserted into an IP packet, and then it is
inserted into an Ethernet frame. It allows transmitting test packets across
the network which contains the devices operating on the
and the network layer (for example, a switch, a router).
connecting the device to the network being tested are
An Ethernet frame that is generated on the transport layer contains an IP
header and a UDP header, which allows transmitting a test sequence using
transport protocols. The methods for connecting the device to the network
being tested are shown in the images in this chapter.
10 Gigabit Ethernet Analyzer 77
data link layer
The methods for
shown in the figures.
Page 88

BERT
ET The time that has elapsed since the beginning of the test.
RT The time that is left until the end of the test.
BITs The number of received bits.
EBITs The number of bit errors.
BER The number of bit errors divided by the total number of
received bits.
TX Err Number of manually injected errors.
LSS The time during which the loss of test sequence synchroni-
zation was observed.
%LSS The ratio of the time during which there was the loss of test
sequence synchronization to the time that has elapsed since
the beginning of the test (in percentage terms).
LOS The time during which there was no signal.
%LOS The ratio of the time during which there was no signal to
the time that has elapsed since the beginning of the test (in
percentage terms).
Setup Open the BERT Setup menu.
78 ETS-1000G
Page 89

Note: LSS is a state when there is no synchronization with the data being
received and it is impossible to evaluate the BER parameter. The possible
causes of the loss of synchronization are:
Inconsistency of test sequences (for example, PRBS 2e15 is set at the
receiving end, but PRBS 2e23 is being transmitted through the
channel).
The BER value of the channel being used for transmitting the sequence
is too high (the threshold value is 0.01).
You can manually inject single-bit errors into the outgoing test pattern
simply by clicking the button.
Press (Save/Load) to enter the menu which allows displaying
information about saved measurements ( ), saving test results and
parameters (), loading () and deleting () saved measurement
results and parameters.
BERT
Level
10 Gigabit Ethernet Analyzer 79
Selecting an OSI layer on which the test is to be conducted:
1 - the physical layer
2 - the data link layer (MAC)
3 - the network layer (IP)
4 - the transport layer (TCP/UDP)
Page 90

BERT
Pattern
User
Rate (L2)
Duration
Frame size
Selecting a standard test sequence or a user-defined test
sequence.
Enter a user-defined test sequence.
Data rate value (L2) in percentage terms ( ), in Kbps ( )
or in Mbps ( ).
Set the measurement duration.
If Random is selected, then the frame size will vary according
to the uniform law within the set limits (Min. frame, Max. frame
menu items).
If Constant is selected, then the frames whose size is set using
the Frame menu item will be used for testing.
Frame Set the data frame size.
Topology Switch to the Topology menu.
Header Open the Header menu.
80 ETS-1000G
Page 91

BERT
BERT MPLS Setting
BERT MPLS Setting
The label stack to be used for testing is set in the MPLS menu.
Labels Select the number of labels (from 1 to 3) to be added to an
outgoing packet.
Label The label value.
MPLS COS The Class of Service of a packet.
TTL The time-to-live of a labeled packet.
Connection Options
Testing on the physical layer (option 1)
10 Gigabit Ethernet Analyzer 81
Page 92

BERT
Connection Options
Testing on the physical layer (option 2)
Testing on the data link/network layer (option 1)
Testing on the data link/network layer (option 2)
82 ETS-1000G
Page 93

Testing on the data link/network layer (option 3)
BERT
Connection Options
10 Gigabit Ethernet Analyzer 83
Page 94

Page 95

14 Delay Variation
During an analysis of Ethernet-based networks, an important task is to
determine the packet jitter and latency. According to RFC 4689[5], the
packet jitter is the absolute difference of propagation of two successively
received packets which belong to the same data stream. This parameter is
used for evaluating the network's capability to transmit the
deference-sensitive traffic, such as video or voice. Using Delay Variation
option you can measure packet jitter and latency distribution.
ET The time that has elapsed since the beginning of the test.
RT The time that is left until the end of the test.
PKTs The total number of received packets.
OOOPs The number of packets which have been received in the order that
is different from the order in which they were sent.
%OOOPs The number of packets which have been received not in the order
in which they were sent; specified as the percentage of the total
number of received packets.
INOPs The number of packets which have been received in the order in
which they were sent.
%INOPs The number of packets which have been received in the order in
which they were sent; specified as the percentage of the total number of received packets.
10 Gigabit Ethernet Analyzer 85
Page 96

Delay Variation
< ms %PKTs The number of packets (as the percentage of number of received
packets) for which the jitter was below the specified threshold.
Note: When the test is performed according to the Static Traffic
Generation Configuration 2 shown on page 91, this value for
latency is not available (n/a).
>= ms
%PKTs
The number of packets (as the percentage of number of received
packets) for which the jitter was above or equal to the specified
threshold.
Note: When the test is performed according to the Static Traffic
Generation Configuration 2 shown on page 91, this value for
latency is not available (n/a).
Setup Open the Delay Variation Setup menu.
To start determining the packet jitter and latency for the packets being
received to 10G/1G port, press (Start).
To select Jitter or Latency measurement results press .
To open the screen which contains information about the jitter/latency
distribution, press (Distribution).
86 ETS-1000G
Page 97

Delay Variation
The screen displays two columns. The first one contains the limits of
subintervals, the second one contains the number of packets (in
percentage terms) for which the jitter/latency belongs to the specified
subinterval. The upper interval limit can be set in the Delay Variation >
Setup menu. It is specified as Jitter/Latency Threshold, ms. The interval
from zero to the set threshold is divided into a certain number of
subintervals. According to the results of the test, the percentage of packets
for which the jitter/latency lies within these limits is displayed for each
subinterval in the right column.
To open the screen which contains the graphical representation of the
packet jitter/latency, press (Plot).
Press (Save/Load) to open the menu which allows displaying
information about saved measurements ( ), saving test results and
parameters ( ), loading ( ) and deleting ( ) saved measurement
results and parameters (refer Saving test results and statistics on page 101).
10 Gigabit Ethernet Analyzer 87
Page 98

Delay Variation
Generator Enable/disable the test traffic generator. If On is selected, the
generator will be enabled at the start of the Delay Variation
test.
Jit. threshold, ms The threshold jitter value.
Lat. threshold, ms The threshold latency value.
Duration The Delay Variation measurement duration.
Traffic generator Open the Traffic Generator menu.
88 ETS-1000G
Page 99

15 Traffic Generator
The test traffic generation option allows to produce different types of test
traffic: static, MAC flood, VLAN flood, IP flood.
MAC, IP and VLAN flood modes allow to consume the limited addressable
memory of the DUT and to check if it has any protection against this kind of
attacks.
When you select MAC flood last 3 bytes of source MAC address will be
changed randomly.
When VLAN flood is selected, all VLAN ID and VLAN Priority bits will be
changed randomly.
When you select IP flood last byte of destination IP address will be
changed randomly.
Send Enable/disable the test traffic generation.
Traffic type Type of traffic that will be generated: static, MAC flood,
VLAN flood, IP flood.
Duration The time during which test traffic should be generated.
Rate (L2)
Data rate value (L2) in percentage terms ( ), in Kbps
( ) or in Mbps ( ).
10 Gigabit Ethernet Analyzer 89
Page 100

Traffic Generator
Frame Size If Random is selected, then the frame size will vary accord-
ing to the uniform law within the set limits (Min.frame,
Max. frame menu items).
If Constant is selected, then the frames whose size is set
using the Frame menu item will be used for testing.
Frame Frame size (any value within the range from 64 to 9600
bytes).
Header Open the Header menu.
ET The time that has elapsed since the beginning of the traffic
generation.
RT The time that is left until the end of the traffic generation.
90 ETS-1000G
 Loading...