

Page 1

53-1000601-02
March 2008
Fabric Watch
Administrator’s Guide
Supporting Fabric OS v6.1.0
Page 2

Copyright © 2007, 2008 Brocade Communications Systems, Inc. All Rights Reserved.
Brocade, Fabric OS, File Lifecycle Manager, MyView, and StorageX are registered trademarks and the Brocade B-wing symbol,
DCX, and SAN Health are trademarks of Brocade Communications Systems, Inc., in the United States and/or in other countries.
All other brands, products, or service names are or may be trademarks or service marks of, and are used to identify, products or
services of their respective owners.
Notice: This document is for informational purposes only and does not set forth any warranty, expressed or implied, concerning
any equipment, equipment feature, or service offered or to be offered by Brocade. Brocade reserves the right to make changes to
this document at any time, without notice, and assumes no responsibility for its use. This informational document describes
features that may not be currently available. Contact a Brocade sales office for information on feature and product availability.
Export of technical data contained in this document may require an export license from the United States government.
The authors and Brocade Communications Systems, Inc. shall have no liability or responsibility to any person or entity with
respect to any loss, cost, liability, or damages arising from the information contained in this book or the computer programs that
accompany it.
The product described by this document may contain “open source” software covered by the GNU General Public License or other
open source license agreements. To find-out which open source software is included in Brocade products, view the licensing
terms applicable to the open source software, and obtain a copy of the programming source code, please visit
http://www.brocade.com/support/oscd.
Brocade Communications Systems, Incorporated
Corporate Headquarters
Brocade Communications Systems, Inc.
1745 Technology Drive
San Jose, CA 95110
Tel: 1-408-333-8000
Fax: 1-408-333-8101
Email: info@brocade.com
European and Latin American Headquarters
Brocade Communications Switzerland Sàrl
Centre Swissair
Tour A - 2ème étage
29, Route de l'Aéroport
Case Postale 105
CH-1215 Genève 15
Switzerland
Tel: +41 22 799 56 40
Fax: +41 22 799 56 41
Email: emea-info@brocade.com
Asia-Pacific Headquarters
Brocade Communications Singapore Pte. Ltd.
9 Raffles Place
#59-02 Republic Plaza 1
Singapore 048619
Tel: +65-6538-4700
Fax: +65-6538-0302
Email: apac-info@brocade.com
Page 3

Document History
Title Publication Number Summary of Changes Date
Fabric Watch User’s Guide 53-0001559-02 New document May 2000
Fabric Watch User’s Guide 53-0000198-02 n/a January 2002
Fabric Watch User’s Guide 53-0000186-02 n/a March 2002
Fabric Watch User’s Guide 53-0000504-02 n/a April 2003
Fabric Watch User’s Guide 53-0000524-02 n/a April 2003
Fabric Watch User’s Guide 53-0000524-03 Updated default values and
restructured the document.
Fabric Watch User’s Guide 53-0000524-04 Rewrote the document
completely and added new
features.
Reorganized procedures
into steps, rewrote many
sections to improve clarity.
Added technical and
editorial changes.
Fabric Watch User’s Guide 53-0000524-05 Updates to support Fabric
OS v4.4.0 features and
Brocade 3016 and 4100
switches.
Rewrote Chapter 4,
“Configuring Fabric Watch.”
Fabric Watch Administrator’s Guide 53-0000524-06 Renamed book. Combined
the Introduction and
Concepts chapters into a
single chapter. Added
support for Brocade 200E,
Brocade 3014, and Brocade
48000.
Fabric Watch Administrator’s Guide 53-1000047-01 Updates to support Fabric
OS v5.1.0 features and
Brocade 4900 and 7500
switches.
Fabric Watch Administrator’s Guide 53-1000243-01 Updates to support Fabric
OS v5.2.0 features and the
FC4-16IP and FC4-48 port
blades. Removed references
to Brocade 3014 and 3016,
as embedded switches are
not supported in Fabric OS
v5.2.0.
Fabric Watch Administrator’s Guide 53-1000438-01 Updates to support Fabric
OS v5.3.0, implementation
of IPV6.
Fabric Watch Administrator’s Guide 53-1000601-01 Updates to support Fabric
OS v6.0.0
Fabric Watch Administrator’s Guide 53-1000601-02 Updates to support Fabric
OS v6.1.0
December 2003
April 2004
September 2004
March 2005
November 2005
September 2006
June 2007
September 2007
March 2008
Fabric Watch Administrator’s Guide iii
53-1000601-02
Page 4

iv Fabric Watch Administrator’s Guide
53-1000601-02
Page 5

Contents
About This Document
In this chapter . . . . . . . . . . . . . . . . . . . . . . . . . . . . . . . . . . . . . . . . . . . . ix
How this document is organized . . . . . . . . . . . . . . . . . . . . . . . . . . . . . ix
Supported hardware and software . . . . . . . . . . . . . . . . . . . . . . . . . . . x
What’s new in this document. . . . . . . . . . . . . . . . . . . . . . . . . . . . . . . . x
Document conventions. . . . . . . . . . . . . . . . . . . . . . . . . . . . . . . . . . . . . xi
Text Formatting. . . . . . . . . . . . . . . . . . . . . . . . . . . . . . . . . . . . . . . .xi
Notes, cautions, and warnings . . . . . . . . . . . . . . . . . . . . . . . . . . . xi
Key terms . . . . . . . . . . . . . . . . . . . . . . . . . . . . . . . . . . . . . . . . . . . xii
Additional information. . . . . . . . . . . . . . . . . . . . . . . . . . . . . . . . . . . . . xii
Brocade resources. . . . . . . . . . . . . . . . . . . . . . . . . . . . . . . . . . . . xii
Other industry resources. . . . . . . . . . . . . . . . . . . . . . . . . . . . . . . xii
Getting technical help. . . . . . . . . . . . . . . . . . . . . . . . . . . . . . . . . . . . . xiii
Document feedback . . . . . . . . . . . . . . . . . . . . . . . . . . . . . . . . . . . . . . xiv
Chapter 1 Fabric Watch Concepts
In this chapter . . . . . . . . . . . . . . . . . . . . . . . . . . . . . . . . . . . . . . . . . . . . 1
Fabric Watch overview . . . . . . . . . . . . . . . . . . . . . . . . . . . . . . . . . . . . . 1
Fabric Watch and Web Tools . . . . . . . . . . . . . . . . . . . . . . . . . . . . . . . . 3
Introduction to fabric health. . . . . . . . . . . . . . . . . . . . . . . . . . . . . . . . . 3
Fabric Watch components . . . . . . . . . . . . . . . . . . . . . . . . . . . . . . . . . . 4
Classes . . . . . . . . . . . . . . . . . . . . . . . . . . . . . . . . . . . . . . . . . . . . . . 4
Areas. . . . . . . . . . . . . . . . . . . . . . . . . . . . . . . . . . . . . . . . . . . . . . . . 5
Elements. . . . . . . . . . . . . . . . . . . . . . . . . . . . . . . . . . . . . . . . . . . .10
Event Configuration. . . . . . . . . . . . . . . . . . . . . . . . . . . . . . . . . . . . . . .11
Event behavior types . . . . . . . . . . . . . . . . . . . . . . . . . . . . . . . . . . 11
Data values . . . . . . . . . . . . . . . . . . . . . . . . . . . . . . . . . . . . . . . . . 12
Threshold values . . . . . . . . . . . . . . . . . . . . . . . . . . . . . . . . . . . . . 12
Time bases . . . . . . . . . . . . . . . . . . . . . . . . . . . . . . . . . . . . . . . . . . 14
Event settings. . . . . . . . . . . . . . . . . . . . . . . . . . . . . . . . . . . . . . . . 16
Port persistence . . . . . . . . . . . . . . . . . . . . . . . . . . . . . . . . . . . . . . . . .20
Port fencing . . . . . . . . . . . . . . . . . . . . . . . . . . . . . . . . . . . . . . . . . . . . .20
Fabric Watch Administrator’s Guide v
53-1000601-02
Page 6

Notification methods. . . . . . . . . . . . . . . . . . . . . . . . . . . . . . . . . . . . . .21
Switch event (error) log . . . . . . . . . . . . . . . . . . . . . . . . . . . . . . . .22
SNMP trap . . . . . . . . . . . . . . . . . . . . . . . . . . . . . . . . . . . . . . . . . .22
RAPI trap. . . . . . . . . . . . . . . . . . . . . . . . . . . . . . . . . . . . . . . . . . . .22
Port log lock . . . . . . . . . . . . . . . . . . . . . . . . . . . . . . . . . . . . . . . . .22
E-mail alert . . . . . . . . . . . . . . . . . . . . . . . . . . . . . . . . . . . . . . . . . .23
Notification methods . . . . . . . . . . . . . . . . . . . . . . . . . . . . . . . . . .23
Switch policies. . . . . . . . . . . . . . . . . . . . . . . . . . . . . . . . . . . . . . . . . . . 24
Audit messages. . . . . . . . . . . . . . . . . . . . . . . . . . . . . . . . . . . . . . . . . . 24
Chapter 2 Activating and Accessing Fabric Watch
In this chapter . . . . . . . . . . . . . . . . . . . . . . . . . . . . . . . . . . . . . . . . . . .25
Fabric Watch activation . . . . . . . . . . . . . . . . . . . . . . . . . . . . . . . . . . .25
Activating Fabric Watch with Telnet . . . . . . . . . . . . . . . . . . . . . .25
Fabric Watch access. . . . . . . . . . . . . . . . . . . . . . . . . . . . . . . . . . . . . .26
Fabric Watch access using the CLI . . . . . . . . . . . . . . . . . . . . . . .26
Fabric Watch access using SNMP-based enterprise managers27
Configuration file . . . . . . . . . . . . . . . . . . . . . . . . . . . . . . . . . . . . .28
Chapter 3 Fabric Watch configuration
In this chapter . . . . . . . . . . . . . . . . . . . . . . . . . . . . . . . . . . . . . . . . . . .29
Fabric Watch threshold configuration . . . . . . . . . . . . . . . . . . . . . . . .29
Step 1. Configuring the class and area . . . . . . . . . . . . . . . . . . . 30
Step 2. Configuring port fencing (optional) . . . . . . . . . . . . . . . .32
Step 3. Threshold configuration . . . . . . . . . . . . . . . . . . . . . . . . .33
Step 4. Advanced configuration . . . . . . . . . . . . . . . . . . . . . . . . . 35
Step 5. Alarm configuration . . . . . . . . . . . . . . . . . . . . . . . . . . . .40
Step 6. Disable and enable thresholds by port (optional) . . . .43
Notification configuration . . . . . . . . . . . . . . . . . . . . . . . . . . . . . . . . . .43
Configuring alarm notifications. . . . . . . . . . . . . . . . . . . . . . . . . .44
SNMP notification configuration. . . . . . . . . . . . . . . . . . . . . . . . .44
API notification configuration . . . . . . . . . . . . . . . . . . . . . . . . . . .44
Port Log Lock action configuration . . . . . . . . . . . . . . . . . . . . . . . 45
E-mail notification configuration . . . . . . . . . . . . . . . . . . . . . . . . . 45
Switch status policy configuration . . . . . . . . . . . . . . . . . . . . . . . . . . . 49
Switch status policy planning . . . . . . . . . . . . . . . . . . . . . . . . . . .49
Implementing your switch status policy . . . . . . . . . . . . . . . . . . . 50
Viewing your switch status policy . . . . . . . . . . . . . . . . . . . . . . . . 51
FRU configuration . . . . . . . . . . . . . . . . . . . . . . . . . . . . . . . . . . . . . . . .51
vi Fabric Watch Administrator’s Guide
53-1000601-02
Page 7

Fabric Watch using SNMP configuration . . . . . . . . . . . . . . . . . . . . . .52
Configuring Fabric Watch using SNMP . . . . . . . . . . . . . . . . . . . .52
Chapter 4 Generating Fabric Watch Reports
In this chapter . . . . . . . . . . . . . . . . . . . . . . . . . . . . . . . . . . . . . . . . . . . 57
Types of Fabric Watch reports . . . . . . . . . . . . . . . . . . . . . . . . . . . . . . 57
SAM report . . . . . . . . . . . . . . . . . . . . . . . . . . . . . . . . . . . . . . . . . .57
Switch health report . . . . . . . . . . . . . . . . . . . . . . . . . . . . . . . . . .59
Switch status policy report . . . . . . . . . . . . . . . . . . . . . . . . . . . . .60
Port detail report . . . . . . . . . . . . . . . . . . . . . . . . . . . . . . . . . . . . .60
Viewing Fabric Watch reports using Telnet . . . . . . . . . . . . . . . . . . . . 62
Appendix A Default Threshold Values
In this appendix. . . . . . . . . . . . . . . . . . . . . . . . . . . . . . . . . . . . . . . . . . 63
Overview . . . . . . . . . . . . . . . . . . . . . . . . . . . . . . . . . . . . . . . . . . . . . . .63
Environment class. . . . . . . . . . . . . . . . . . . . . . . . . . . . . . . . . . . . . . . .64
Fabric class . . . . . . . . . . . . . . . . . . . . . . . . . . . . . . . . . . . . . . . . . . . . .66
Performance Monitor class . . . . . . . . . . . . . . . . . . . . . . . . . . . . . . . .67
Port class . . . . . . . . . . . . . . . . . . . . . . . . . . . . . . . . . . . . . . . . . . . . . . .68
E_Port class . . . . . . . . . . . . . . . . . . . . . . . . . . . . . . . . . . . . . . . . .69
F/FL_Port class . . . . . . . . . . . . . . . . . . . . . . . . . . . . . . . . . . . . . .70
Resource class . . . . . . . . . . . . . . . . . . . . . . . . . . . . . . . . . . . . . . . . . .72
Security class. . . . . . . . . . . . . . . . . . . . . . . . . . . . . . . . . . . . . . . . . . . . 72
SFP class . . . . . . . . . . . . . . . . . . . . . . . . . . . . . . . . . . . . . . . . . . . . . . . 75
Appendix B Basic Fabric Watch Configuration Guidelines
Appendix C Using Fabric Watch with Configuration Files
In this appendix. . . . . . . . . . . . . . . . . . . . . . . . . . . . . . . . . . . . . . . . . . 79
Overview . . . . . . . . . . . . . . . . . . . . . . . . . . . . . . . . . . . . . . . . . . . . . . .79
Configuration files . . . . . . . . . . . . . . . . . . . . . . . . . . . . . . . . . . . . . . . .79
Configuring Fabric Watch with the configuration file. . . . . . . . . 79
Configuring Fabric Watch with a profile . . . . . . . . . . . . . . . . . . .80
Appendix D Port fencing types
Index
Fabric Watch Administrator’s Guide vii
53-1000601-02
Page 8

viii Fabric Watch Administrator’s Guide
53-1000601-02
Page 9

About This Document
In this chapter
•How this document is organized . . . . . . . . . . . . . . . . . . . . . . . . . . . . . . . . . . . ix
•Supported hardware and software. . . . . . . . . . . . . . . . . . . . . . . . . . . . . . . . . . x
•What’s new in this document . . . . . . . . . . . . . . . . . . . . . . . . . . . . . . . . . . . . . . x
•Document conventions . . . . . . . . . . . . . . . . . . . . . . . . . . . . . . . . . . . . . . . . . . . xi
•Additional information. . . . . . . . . . . . . . . . . . . . . . . . . . . . . . . . . . . . . . . . . . . xii
•Document feedback . . . . . . . . . . . . . . . . . . . . . . . . . . . . . . . . . . . . . . . . . . . . xiv
How this document is organized
This document is organized to help you find the information that you want as quickly and easily as
possible.
This document contains the following components:
• Chapter 1, “Fabric Watch Concepts,” provides an introduction to Fabric Watch and the benefits
of its use. It also defines concepts that are useful in Fabric Watch configuration.
• Chapter 2, “Activating and Accessing Fabric Watch,” describes the Fabric Watch requirements,
provides an overview of the interfaces, and explains the methods of accessing Fabric Watch
through each interface.
• Chapter 3, “Fabric Watch configuration,” describes how to configure Fabric Watch.
• Chapter 4, “Generating Fabric Watch Reports,” describes the reports available through Fabric
Watch and the methods of accessing each.
• Appendix A, “Default Threshold Values,” describes the Fabric Watch default threshold values
for all classes.
• Appendix B, “Basic Fabric Watch Configuration Guidelines,” describes some of the
modifications Fabric Watch users should consider when configuring their implementation.
• Appendix C, “Using Fabric Watch with Configuration Files,” describes the two methods of using
configuration files.
• Appendix D, “Port fencing types,” lists the set of port fencing types that are available with
Brocade Fabric OS version 6.1.
• The index points you to the exact pages on which specific information is located.
Fabric Watch Administrator’s Guide ix
53-10000601-02
Page 10

Supported hardware and software
This document is specific to Brocade Fabric OS version 6.0.0 and all switches running Fabric OS
version 6.1.0, including:
• Brocade 200E switch
• Brocade 300 switch
• Brocade 4016 switch
• Brocade 4020 switch
• Brocade 4024 switch
• Brocade 4100 switch
• Brocade 4900 switch
• Brocade 5000 switch
• Brocade 5100 switch
• Brocade 5300 switch
• Brocade 7500 SAN routers
• Brocade 7600 switch
• Brocade 48000 director
• Brocade DCX
What’s new in this document
The following Information was added:
• Port Fencing: Port Fencing is supported with Port class, E_Port class, and F/FL_Port class
in the following areas: Link Loss, Sync Loss, Protocol Error, Invalid Words, and Invalid CRCs.
Port Fencing is configured using the fwconfigure command.
• Support for Brocade 300, 5100, and 5300.
Information that was changed or removed:
• Default threshold values and buffer sizes have been changed for port, E_Port and
F/FL_Port classes.
• The agtcfgset and snmpmibcapset commands have been removed. Both have been
replaced with the snmpConfig command.
• Support for Brocade 3250, 3850, 3900, and 24000.
For further information, see the release notes.
x Fabric Watch Administrator’s Guide
53-10000601-02
Page 11
Document conventions
This section describes text formatting conventions and important notices formats.
Text Formatting
The narrative-text formatting conventions that are used in this document are as follows:
bold text Identifies command names
italic text Provides emphasis
code text Identifies CLI output
For readability, command names in the narrative portions of this guide are presented in mixed
lettercase: for example, switchShow. In actual examples, command lettercase is often all
lowercase. Otherwise, this manual specifically notes those cases in which a command is case
sensitive.
Identifies the names of user-manipulated GUI elements
Identifies keywords and operands
Identifies text to enter at the GUI or CLI
Identifies variables
Identifies paths and Internet addresses
Identifies document titles
Identifies syntax examples
Notes, cautions, and warnings
The following notices and statements are used in this manual. They are listed below in order of
increasing severity of potential hazards.
NOTE
A note provides a tip, guidance or advice, emphasizes important information, or provides a reference
to related information.
ATTENTION
An Attention statement indicates potential damage to hardware or data.
CAUTION
A Caution statement alerts you to situations that can be potentially hazardous to you.
DANGER
A Danger statement indicates conditions or situations that can be potentially lethal or extremely
hazardous to you. Safety labels are also attached directly to products to warn of these conditions
or situations.
Fabric Watch Administrator’s Guide xi
53-10000601-02
Page 12

Key terms
For definitions specific to Brocade and Fibre Channel, see the Brocade Glossary.
For definitions of SAN-specific terms, visit the Storage Networking Industry Association online
dictionary at
http://www.snia.org/education/dictionary.
Additional information
This section lists additional Brocade and industry-specific documentation that you might find
helpful.
Brocade resources
To get up-to-the-minute information, join Brocade Connect. It’s free! Go to http://www.brocade.com
and click Brocade Connect to register at no cost for a user ID and password.
For practical discussions about SAN design, implementation, and maintenance, you can obtain
Building SANs with Brocade Fabric Switches through:
http://www.amazon.com
For additional Brocade documentation, visit the Brocade SAN Info Center and click the Resource
Library location:
http://www.brocade.com
Release notes are available on the Brocade Connect Web site and are also bundled with the Fabric
OS firmware.
Other industry resources
• White papers, online demos, and data sheets are available through the Brocade Web site at
http://www.brocade.com/products/software.jhtml.
• Best practice guides, white papers, data sheets, and other documentation is available through
the Brocade Partner Web site.
For additional resource information, visit the Technical Committee T11 Web site. This Web site
provides interface standards for high-performance and mass storage applications for Fibre
Channel, storage management, and other applications:
http://www.t11.org
For information about the Fibre Channel industry, visit the Fibre Channel Industry Association Web
site:
http://www.fibrechannel.org
xii Fabric Watch Administrator’s Guide
53-10000601-02
Page 13

Getting technical help
Contact your switch support supplier for hardware, firmware, and software support, including
product repairs and part ordering. To expedite your call, have the following information available:
1. General Information
• Switch model
• Switch operating system version
• Error numbers and messages received
• supportSave command output
• Detailed description of the problem, including the switch or fabric behavior immediately
following the problem, and specific questions
• Description of any troubleshooting steps already performed and the results
• Serial console and Telnet session logs
• syslog message logs
2. Switch Serial Number
The switch serial number and corresponding bar code are provided on the serial number label,
as illustrated below.:
*FT00X0054E9*
FT00X0054E9
The serial number label is located as follows:
• Brocade 200E—On the nonport side of the chassis
• Brocade 300, 4100 , 4900, 5100, 5300, and 7500—On the switch ID pull-out tab located
on the port side on the left
• Brocade 5000—On the switch ID pull-out tab located on the bottom of the port side of the
switch
• Brocade 7600—On the bottom of the chassis
• Brocade 48000—Inside the chassis next to the power supply bays
• Brocade DCX—On the bottom right on the port side of the chassis
3. World Wide Name (WWN)
Use the wwn command to display the switch WWN.
If you cannot use the wwn command because the switch is inoperable, you can get the WWN
from the same place as the serial number, except for the Brocade DCX. For the Brocade DCX,
access the numbers on the WWN cards by removing the Brocade logo plate at the top of the
nonport side of the chassis.
Fabric Watch Administrator’s Guide xiii
53-10000601-02
Page 14

Document feedback
Quality is our first concern at Brocade and we have made every effort to ensure the accuracy and
completeness of this document. However, if you find an error or an omission, or you think that a
topic needs further development, we want to hear from you. Forward your feedback to:
documentation@brocade.com
Provide the title and version number of the document and as much detail as possible about your
comment, including the topic heading and page number and your suggestions for improvement.
xiv Fabric Watch Administrator’s Guide
53-10000601-02
Page 15

DRAFT: BROCADE CONFIDENTIAL
Chapter
Fabric Watch Concepts
In this chapter
•Fabric Watch overview. . . . . . . . . . . . . . . . . . . . . . . . . . . . . . . . . . . . . . . . . . . . 1
•Introduction to fabric health . . . . . . . . . . . . . . . . . . . . . . . . . . . . . . . . . . . . . . . 3
•Fabric Watch components . . . . . . . . . . . . . . . . . . . . . . . . . . . . . . . . . . . . . . . . 4
•Event Configuration. . . . . . . . . . . . . . . . . . . . . . . . . . . . . . . . . . . . . . . . . . . . . 11
•Port persistence. . . . . . . . . . . . . . . . . . . . . . . . . . . . . . . . . . . . . . . . . . . . . . . . 20
•Notification methods. . . . . . . . . . . . . . . . . . . . . . . . . . . . . . . . . . . . . . . . . . . . 21
•Switch policies . . . . . . . . . . . . . . . . . . . . . . . . . . . . . . . . . . . . . . . . . . . . . . . . . 24
•Audit messages . . . . . . . . . . . . . . . . . . . . . . . . . . . . . . . . . . . . . . . . . . . . . . . . 24
Fabric Watch overview
1
Fabric Watch is an optional storage area network (SAN) health monitor software feature for
Brocade switches. It enables each switch to constantly monitor its SAN fabric for potential faults
and to automatically alert you to problems long before they become costly failures.
Fabric Watch tracks a variety of SAN fabric elements, events, and counters. Monitoring fabric-wide
events, ports, GBICs, and environmental parameters enables early fault detection and isolation as
well as performance measurement. You can select custom fabric elements and alert thresholds or
choose from a selection of preconfigured settings. You can also easily integrate Fabric Watch with
enterprise system management solutions.
By implementing Fabric Watch, you can rapidly improve SAN availability and performance without
installing new software or system administration tools.
For a growing number of organizations, SAN fabrics are a mission-critical part of their system
architecture. These fabrics can include hundreds of elements, such as hosts, storage devices,
switches, and interswitch links (ISLs). An instrumentation solution for SANs delivers optimal value
by tracking a wide spectrum of fabric events. For instance, Fabric Watch monitors:
• Fabric resources, including fabric reconfigurations, zoning changes, and new logins.
• Switch environmental functions such as temperature, power supply, and fan status, along with
security violations.
• Port state transitions, errors, and traffic information for multiple port classes as well as
operational values for supported models of “smart” GBICs/SFPs.
• Performance information for AL_PA and end-to-end metrics.
Fabric Watch lets you define how often to measure each switch and fabric element and to specify
notification thresholds. Whenever fabric elements exceed these thresholds, Fabric Watch
automatically provides notification using several methods, including e-mail messages, SNMP traps,
and log entries.
Fabric Watch Administrator’s Guide 1
53-1000601-02
Page 16

Fabric Watch overview
1
DRAFT: BROCADE CONFIDENTIAL
Fabric Watch provides the following types of automatic notifications:
• A continuous alarm provides a warning message whenever a threshold is breached; it
continues to send alerts until the condition is corrected. For example, if a switch exceeds its
temperature threshold, Fabric Watch activates an alarm at every measurement interval until
the temperature returns to an acceptable level.
• A triggered alarm generates the first warning when a threshold condition is reached and a
second alarm when the threshold condition is cleared.
Fabric Watch provides event notifications in several different formats to ensure that event details
are accessible from all platforms and operating systems. In response to an event, Fabric Watch can
record event data as any (or all) of the following:
• Simple Network Management Protocol (SNMP) trap
Following an event, Fabric Watch transmits critical event data as an SNMP trap. Support for
SNMP makes Fabric Watch readily compatible with both network and enterprise management
solutions.
• Event log entry
Following an event, Fabric Watch adds an entry to the internal event log for an individual
switch, which stores up to 1024 error messages.
• Lock port log
Following an event, Fabric Watch adds an entry to the internal port log for an individual switch
and freezes the log to ensure that detail-level information is available.
• Rapi Trap
Following an event, Fabric Watch forwards event information to a proxy switch, which then
forwards the information to a server to notify you.
• E-mail notification
Following an event, Fabric Watch creates and sends an informational e-mail to a designated
recipient.
Fabric Watch is designed for rapid deployment. Simply enabling Fabric Watch permits immediate
fabric monitoring. Fabric Watch is also designed for rapid custom configuration. You can easily
create and modify configuration files using a text editor and then distribute configurations to all the
switches in the SAN through the Fabric OS configuration management utility. Fabric Watch also
comes with preconfigured profiles for rapid implementation.
For information on configuring and managing your SAN, see the Fabric OS Administrator’s Guide.
2 Fabric Watch Administrator’s Guide
53-1000601-02
Page 17

DRAFT: BROCADE CONFIDENTIAL
Fabric Watch and Web Tools
Web Tools provides a graphical user interface that can be launched from an Internet browser as an
alternative to Telnet and the command line interface. You can use Web Tools to perform any of the
following Fabric Watch-related operations:
• Activate Fabric Watch.
• View fabric and switch events.
• View and modify threshold and alarm configurations with the Fabric Watch view.
• Upload and download the configuration file.
• View and configure the FRU module.
• View and configure the e-mail address to which event messages are sent.
• View Fabric Watch reports.
Refer to the Web Tools Administrator’s Guide for information about how to use Web Tools.
Introduction to fabric health
Fabric Watch and Web Tools
1
Fabric health refers to the capability of the fabric to support data being routed through it. A healthy
fabric enables effective data transmission between networked devices.
Although the concept of fabric health initially seems fairly simple, it can be a deep and complex
topic due to the number of factors that are involved. One of the more obvious criteria for fabric
health is the condition of the network hardware. A switch or port failure could easily prevent data
packets from reaching their destination. Network traffic can also influence fabric health.
If the number of packets routed through a port exceeds the port bandwidth, it causes network
delays and packet losses. Even environmental factors can become issues, as network hardware
can fail to function properly when stored in locations that do not meet the environmental conditions
for the device. For example, switches can fail when stored in rooms that are too hot.
Because of the varied and complex factors in determining fabric health, you need fabric monitoring
software such as Fabric Watch to help you to quickly detect, identify, and resolve fabric health
issues by continuously monitoring possible issues and reporting any potential concerns. Fabric
Watch automatically provides detailed reports on detected issues and helps you correct failures.
Fabric Watch provides customizable monitoring thresholds. You can configure Fabric Watch to
provide notification before problems arise, such as reporting when network traffic through a port is
approaching the bandwidth limit. This information enables you to perform preemptive network
maintenance such as trunking or zoning and avoid potential network failures.
Fabric Watch Administrator’s Guide 3
53-1000601-02
Page 18

DRAFT: BROCADE CONFIDENTIAL
Fabric Watch components
1
Fabric Watch components
Fabric Watch uses a hierarchical organization to track the network device information it monitors.
There is a class, area, and element associated with every monitored behavior. Classes are the
highest level in the system, subdivided into one or more areas. Areas contain one or more
elements.
The following sections explain this hierarchy and its application within Fabric Watch.
Classes
Classes are high-level categories of elements. Classes are intentionally wide groupings of similar
fabric devices or fabric data.
Examples of classes include Port (which includes all physical ports on a switch), Security (which
includes information related to unauthorized login attempts), and Environment (which contains
information related to the internal temperature, supplied power and fan assemblies).
In some cases, classes are divided into subclasses. This additional level in the hierarchy increases
the flexibility of setting monitoring thresholds. You can use subclasses to add additional event
monitoring to fabric objects that meet the requirements of a subclass.
For example, ports connected to another switch can be monitored using both the Port class and
E_Port subclass. You can configure general port monitoring using the Port class and monitoring
specific to a type of port using the E_Port class. Ports connected to another switch can trigger
events based on either of these configurations. Ports that are not connected to another switch are
not affected by the additional monitoring configured into the E_Port class.
Tab le 1 describes the classes into which Fabric Watch groups all switch and fabric elements.
TABLE 1 Fabric Watch classes
Class Description
Environment Includes information about the physical environment in which the switch resides
and the internal environment of the switch. For example, an Environment-class
alarm alerts you to problems or potential problems with temperature, fans, and
power.
Fabric Groups areas of potential problems arising between devices, including interswitch
link (ISL) details, zoning, and traffic. A Fabric-class alarm alerts you to problems or
potential problems with interconnectivity.
Field Replaceable Unit (FRU) Monitors the status of FRUs and provides an alert when a part replacement is
needed. This class monitors states, not thresholds.
Performance Monitor Serves as a tuning tool. The Performance Monitor class groups areas that track the
source and destination of traffic. Use the Performance Monitor class thresholds
and alarms to determine traffic load and flow and to reallocate resources
appropriately.
The Performance Monitor class is divided into the areas AL_PA Performance
Monitor, EE (end-to-end) Performance Monitor, and Filter Performance Monitor.
Performance Monitoring is not supported on VE, EX, and VEX ports.
4 Fabric Watch Administrator’s Guide
53-1000601-02
Page 19

DRAFT: BROCADE CONFIDENTIAL
Fabric Watch components
TABLE 1 Fabric Watch classes (Continued)
Class Description
Port Enables you to set additional thresholds specific to different types of ports.
The Port class is made up of the following classes:
• E_Port class—Represents ports connected to another switch.
Note: If you are using a Brocade 48000 with a FR4-18i blade, or the Brocade
7500, the E_Port class monitors the following additional ports and creates
monitors for each of the logical ports:
— FCR (includes EX_Ports)
— FCIP (includes VE_Ports and VEX_Ports)
— State changes, utilization, and packet loss (applicable to VE_Ports only)
• F/FL_Port class —Represents fabric or fabric loop ports that are made of
copper or optical fiber.
Resource Monitors flash memory. It calculates the amount of flash space consumed and
compares it to a defined threshold.
Security Monitors all attempts to breach your SAN security, helping you fine-tune your
security measures.
SFP Groups areas that monitor the physical aspects of SFPs. An SFP class alarm alerts
you to an SFP malfunction fault.
Note: SFPs connected to GbE ports are not monitored.
1
Areas
While classes represent large groupings of information, areas represent the information that Fabric
Watch monitors. For example, switch temperature, one of the values tracked by Fabric Watch, is an
area within the class Environment.
The tables in this section describe all of the areas monitored by Fabric Watch, organized by their
associated classes.
Environment class areas
Tab le 2 lists and describes the Fabric Watch areas in the Environment class.
TABLE 2 Environment class areas
Area Description
Fan Refers to the speed of the fans inside the switch, in revolutions per minute. It is important that
the fans spin quickly enough to keep the ambient temperature from rising to levels at which
switch damage might occur.
Power Supply Monitors whether power supplies within the switch are on, off, present, absent, or faulty. Fabric
Watch monitors power supplies to be sure that power is always available to a switch.
Tem perature Refers to the ambient temperature inside the switch, in degrees Celsius. Temperature sensors
monitor the switch in case the temperature rises to levels at which damage to the switch might
occur.
NOTE
The fans in the Brocade 200E do not return RPM values, so there is no fan class area for it.
Fabric Watch Administrator’s Guide 5
53-1000601-02
Page 20

Fabric Watch components
1
DRAFT: BROCADE CONFIDENTIAL
Fabric class areas
Tab le 3 lists Fabric Watch areas in the Fabric class and describes each area.
TABLE 3 Fabric class areas
Area Description
Domain ID Changes Monitors forced domain ID changes. Forced domain ID changes occur when there is a
conflict of domain IDs in a single fabric and the principal switch has to assign another
domain ID to a switch.
Fabric Logins Activate when ports and devices initialize with the fabric.
Fabric Reconfiguration Tracks the number of reconfigurations of the fabric. Fabric reconfiguration occurs when:
• Two fabrics with the same domain ID are connected.
• Two fabrics are joined.
• An E_Port or VE_Port goes offline.
• A principal link segments from the fabric.
Loss of E_Port Tracks the number of times that an E_Port or VE_Port goes down. E_Ports and VE_Ports
go down each time you remove a cable or an SFP (where there are SFP failures or
transient errors).
Segmentation Changes Tracks the cumulative number of segmentation changes. Segmentation changes occur
due to:
• Zone conflicts.
• Incompatible link parameters. During E_Port and VE_Port initialization, ports
exchange link parameters, and incompatible parameters result in segmentation.
This is a rare event.
• Domain conflicts.
• Segmentation of the principal link between two switches.
SFP State Changes Indicates whether the state of the SFP is normal or faulty, on or off. A faulty or off state
means that you must reinsert, turn on, or replace the SFP. Fabric Watch monitors only
the digital diagnostic SFP.
Note: SFPs connected to GbE ports are not monitored.
Zoning Changes Tracks the number of zone changes. Because zoning is a security provision, frequent
zone changes might indicate a security breach or weakness. Zone change messages
occur whenever there is a change in zone configurations.
FRU class areas
Tab le 4 lists Fabric Watch areas in the FRU class and describes each area. Possible states for all
FRU-class areas are absent, faulty, inserted, on, off, ready, and up.
TABLE 4 FRU class areas
Area Indicates
Slot State of a slot has changed.
Power Supply State of a power supply has changed.
Fan State of a fan has changed.
WWN State of a WWN card has changed.
Supported FRU areas depend on the type of Brocade switches. For nonmodular switches such as
the Brocade 4100, 4900, 5000, 7500 and 7600, the slot and WWN areas are not supported.
6 Fabric Watch Administrator’s Guide
53-1000601-02
Page 21

DRAFT: BROCADE CONFIDENTIAL
Fabric Watch components
1
Performance Monitor class areas
Tab le 5 lists Fabric Watch areas in the Performance Monitor class and describes each area.
TABLE 5 Performance Monitor class areas
Area Indicates
Customer Define Relies on performance monitor Telnet commands. For more information on this area,
see the Fabric OS Command Reference.
Invalid Cyclic Redundancy
Checks (CRC)
Receive Performance The percentage of word frames traveling from the configured S_ID to the D_ID exceeds
Transmit Performance The percentage of word frames traveling from the configured D_ID to the S_ID; user
Errors have been detected in the Fibre Channel frame. Invalid CRC messages occur
when the number of CRC errors in Fibre Channel frames for specific source ID (S_ID)
and destination ID (D_ID) pairs change. These messages can also be caused by dirty
or aging equipment and temperature fluctuations.
the configured thresholds.
configuration triggers these messages, so you can use the Transmit Performance area
to tune your network.
Port class areas
Tab le 6 lists and describes the Fabric Watch areas in the port class.
NOTE
Fabric Watch monitors and reports the status of physical and virtual FC ports. Physical GbE ports
and ISCSI ports are not monitored and are not included in the Port Class area.
TABLE 6 Port class areas
Area Indicates
Invalid Cyclic Redundancy
Checks (CRCs)
Invalid Transmission Word A word did not transmit successfully. Invalid word messages usually indicate a
Link Failure Count A link has lost the signal. Both physical and hardware problems can cause link
Loss of Signal Count The number of times that a signal loss occurs in a port. Signal loss indicates that
Loss of Synchronization (Sync)
Count
Packet Loss The number of packets routed through a port exceeds the port bandwidth,
Primitive Sequence Protocol
Error
Receive (RX) Performance The percentage of maximum bandwidth consumed in packet receipts.
A frame is invalid and cannot be transmitted. Invalid CRCs can represent noise on
the network. Such frames are recoverable by retransmission. Invalid CRCs
indicate a potential hardware problem. These errors occur mostly in aging fabrics.
hardware problem.
failures. Link failures frequently occur due to a loss of synchronization. Check for
concurrent loss of synchronization errors and, if applicable, troubleshoot those
errors. Link failures also occur due to hardware failures.
no data is moving through the port. A loss of signal usually indicates a hardware
problem.
Two devices failed to communicate at the same speed. Synchronization losses
are always accompanied by link failure. Loss of synchronization errors frequently
occur due to a faulty SFP or cable.
specific to the E_Port.
A CRC sum disparity. Occasionally, these errors occur due to software glitches.
Persistent errors occur due to hardware problems.
Fabric Watch Administrator’s Guide 7
53-1000601-02
Page 22

Fabric Watch components
1
DRAFT: BROCADE CONFIDENTIAL
TABLE 6 Port class areas (Continued)
Area Indicates
State Changes The state of the port has changed for one of the following reasons:
• The port has gone offline.
• The port has come online.
• The port is testing.
• The port is faulty.
• The port has become an E_Port, EX_Port, VE_Port, or VEX_Port.
• The port has become an F/FL_Port.
• The port has segmented.
• The port has become a trunk port.
Transmit (TX) Performance The percentage of maximum bandwidth consumed in packet transmissions.
Utilization Indicates the percent of utilization for the port at the time of the last poll.
NOTE
Physical link error counters and statistics (such as link failure count, loss of signal co unt , and RX an d
TX performance percentages) are not applicable to VE_Ports.
Resource class area
Tab le 7 describes the Fabric Watch resource class area.
TABLE 7 Resource class area
Area Description
Flash Monitor Monitors the compact flash space available by calculating the percentage of flash space
consumed and comparing it with the configured high threshold value.
Security class areas
Tab le 8 lists Fabric Watch areas in the security class and describes what each area indicates. For
details on each area, see the Secure Fabric OS Administrator’s Guide.
TABLE 8 Security class areas
Area Indicates
API Violation An API access request reaches a secure switch from an unauthorized IP address.
DCC Violation An unauthorized device attempts to log in to a secure fabric.
Front Panel Violation A secure switch detects unauthorized front panel access.
HTTP Violation A browser access request reaches a secure switch from an unauthorized IP address.
Illegal Command Commands permitted only to the primary Fibre Channel Switch (FCS) are executed on
another switch.
Incompatible DB Secure switches with different version stamps have been detected.
Invalid Certificates The primary FCS sends a certificate to all switches in the secure fabric before it sends
configuration data. Receiving switches accept only packets with the correct certificate;
any other certificates are invalid and represent an attempted security breach.
Invalid Signatures If a switch cannot verify the signature of a packet, the switch rejects the packet and the
signature becomes invalid.
Invalid Timestamps If a time interval becomes too great from the time a packet is sent to the time it is
received, the timestamp of the packet becomes invalid and the switch rejects it.
8 Fabric Watch Administrator’s Guide
53-1000601-02
Page 23

DRAFT: BROCADE CONFIDENTIAL
Fabric Watch components
TABLE 8 Security class areas (Continued)
Area Indicates
Login Violation A login violation occurs when a secure fabric detects a login failure.
MS Violation An MS (Management Server) violation occurs when an access request reaches a
secure switch from an unauthorized WWN (World Wide Name). The WWN appears in
the ERRLOG.
No FCS The switch has lost contact with the primary FCS.
RSNMP Violation An RSNMP (Remote Simple Network Management Protocol) violation occurs when an
SNMP (simple network management protocol) get operation reaches a secure switch
from an unauthorized IP address.
SCC Violation An SCC violation occurs when an unauthorized switch tries to join a secure fabric. The
WWN of the unauthorized switch appears in the ERRLOG.
Serial Violation A serial violation occurs when a secure switch detects an unauthorized serial port
connection request.
SES Violation An SES violation occurs when an SES (SCSI Enclosed Services) request reaches a
secure switch from an unauthorized WWN.
SLAP Bad Packets A SLAP (Switch Link Authentication Protocol) bad packets failure occurs when the
switch receives a bad SLAP packet. Bad SLAP packets include unexpected packets and
packets with incorrect transmission IDs.
SLAP Failures A SLAP failure occurs when packets try to pass from a nonsecure switch to a secure
fabric.
Telnet Violation A Telnet violation occurs when a Telnet connection request reaches a secure switch
from an unauthorized IP address.
TS Out of Sync A TS (Time Server) out-of-synchronization error has been detected.
WSNMP Violation A WSNMP violation occurs when an SNMP set operation reaches a secure switch from
an unauthorized IP address.
1
SFP class areas
Tab le 9 lists Fabric Watch areas in the SFP class and describes each area.
NOTE
SFPs connected to GbE ports are not monitored.
TABLE 9 SFP class areas
Area Description
Temperature The temperature area measures the physical temperature of the SFP, in degrees Celsius. A
high temperature indicates that the SFP might be in danger of damage.
Receive Power The receive power area measures the amount of incoming laser, in µwatts, to help determine
if the SFP is in good working condition. If the counter often exceeds the threshold, the SFP is
deteriorating.
Transmit Power The transmit power area measures the amount of outgoing laser, in µwatts. Use this to
determine the condition of the SFP. If the counter often exceeds the threshold, the SFP is
deteriorating.
Fabric Watch Administrator’s Guide 9
53-1000601-02
Page 24

Fabric Watch components
1
DRAFT: BROCADE CONFIDENTIAL
TABLE 9 SFP class areas (Continued)
Area Description
Current The current area measures the amount of supplied current to the SFP transceiver. Current
area events indicate hardware failures.
Supply Voltage The supply voltage area measures the amount of voltage supplied to the SFP. If this value
exceeds the threshold, the SFP is deteriorating.
Elements
Fabric Watch defines an element as any fabric or switch component that the software monitors.
Within each area, the number of elements is equivalent to the number of components being
monitored. For instance, on a 64-port switch, each area of the Port class includes 64 elements.
Each element contains information pertaining to the description suggested by the area. To
continue the Ports example, each element in the Invalid word area of Ports would contain exactly
64 ports, each of which would contain the number of times invalid words had been received by the
port over the last time interval. Each of these elements maps to an index number, so that all
elements can be identified in terms of class, area, and index number. As an example, the
monitoring of the temperature sensor with an index of 1 can be viewed by accessing the first
temperature sensor within the temperature area of the environment class.
Subclasses are a minor exception to the preceding mapping rule. Subclasses, such as E_Ports,
contain areas with elements equivalent to the number of valid entries. Within the same example
used thus far in this section, in a 64-port switch in which eight ports are connected to another
switch, each area within the E_Port class would contain eight elements.
Each area of a subclass with defined thresholds will act in addition to the settings applied to the
element through the parent class. Assignment of elements to subclasses does not need to be
performed by a network administrator. These assignments are seamlessly made through
automated detection algorithms.
10 Fabric Watch Administrator’s Guide
53-1000601-02
Page 25

DRAFT: BROCADE CONFIDENTIAL
Event Configuration
The following area attributes are used to define and detect events in Fabric Watch:
• “Event behavior types” on page 11
• “Data values” on page 12
• “Threshold values” on page 12
• “Time bases” on page 14
• “Event settings” on page 16
You can customize the information reported by Fabric Watch by configuring event behavior types,
threshold values, time bases, and event settings. You cannot change data values; these represent
switch behavior that is updated by the software.
Event behavior types
Based on the number of notifications delivered for events there are two categories of event
behavior types:
• Continuous event behavior
• Triggered event behavior
Event Configuration
1
Continuous event behavior
You can set behavior type events to continuous trigger during a given sample period, until the fabric
no longer meets the criteria defined for the event.
As an example, you can configure Fabric Watch to notify you during every sample period that a port
is at full utilization. This information can help you plan network upgrades.
Triggered event behavior
If you do not want notification during each sample period from the port hardware failure to the time
of its repair, you can define the event behavior as triggered.
When an event behavior is defined as triggered, Fabric Watch sends only one event notification
when the fabric meets the criteria for the event. It does not send out any more notifications.
For example, when a port fails, Fabric Watch sends you a notification of the failure. After you repair
the port, Fabric Watch detects the repair. At this time, Fabric Watch determines that the fabric no
longer meets the event criteria, and watches for the error again. The next time the port fails, it
sends you another notification.
Fabric Watch Administrator’s Guide 11
53-1000601-02
Page 26

Event Configuration
1
DRAFT: BROCADE CONFIDENTIAL
Data values
A data value represents three aspects of a fabric: counter value, measured value, or state value.
Data values are updated by Fabric Watch approximately every six seconds, an interval that you
cannot change.
Counter value is the total number of times that a given event has occurred. For each monitored
event during the time period, the value is incremented.
Measured value is the current, measurable value of a fabric or fabric element, such as
environmental temperature or fan speed.
State value, which is the only qualitative data value, provides information on the overall state of a
fabric component, such as the physical health of a fan. Instead of numerical data, state values
contain information on whether components are faulty, active, or in another state.
Fabric Watch compares counter values and measured values to a set of configurable limits to
determine whether fabric monitoring has occurred and whether to notify you. You must set
appropriate threshold boundaries to trigger an event.
State values are handled differently, as Fabric Watch monitors state values for certain states,
which you can select. When a state value transitions to one of the monitored states, an event is
triggered.
Threshold values
Threshold values are of the following types:
• High and low thresholds
• Buffer values
High and low thresholds
High and low threshold values are the values at which potential problems might occur. For
example, in configuring a temperature threshold, you can select the temperatures at which a
potential problem can occur due to both overheating and freezing.
You can compare high and low thresholds with a data value. The units of measurement are the
same as that of the associated data.
12 Fabric Watch Administrator’s Guide
53-1000601-02
Page 27
DRAFT: BROCADE CONFIDENTIAL
Event Configuration
1
Buffer values
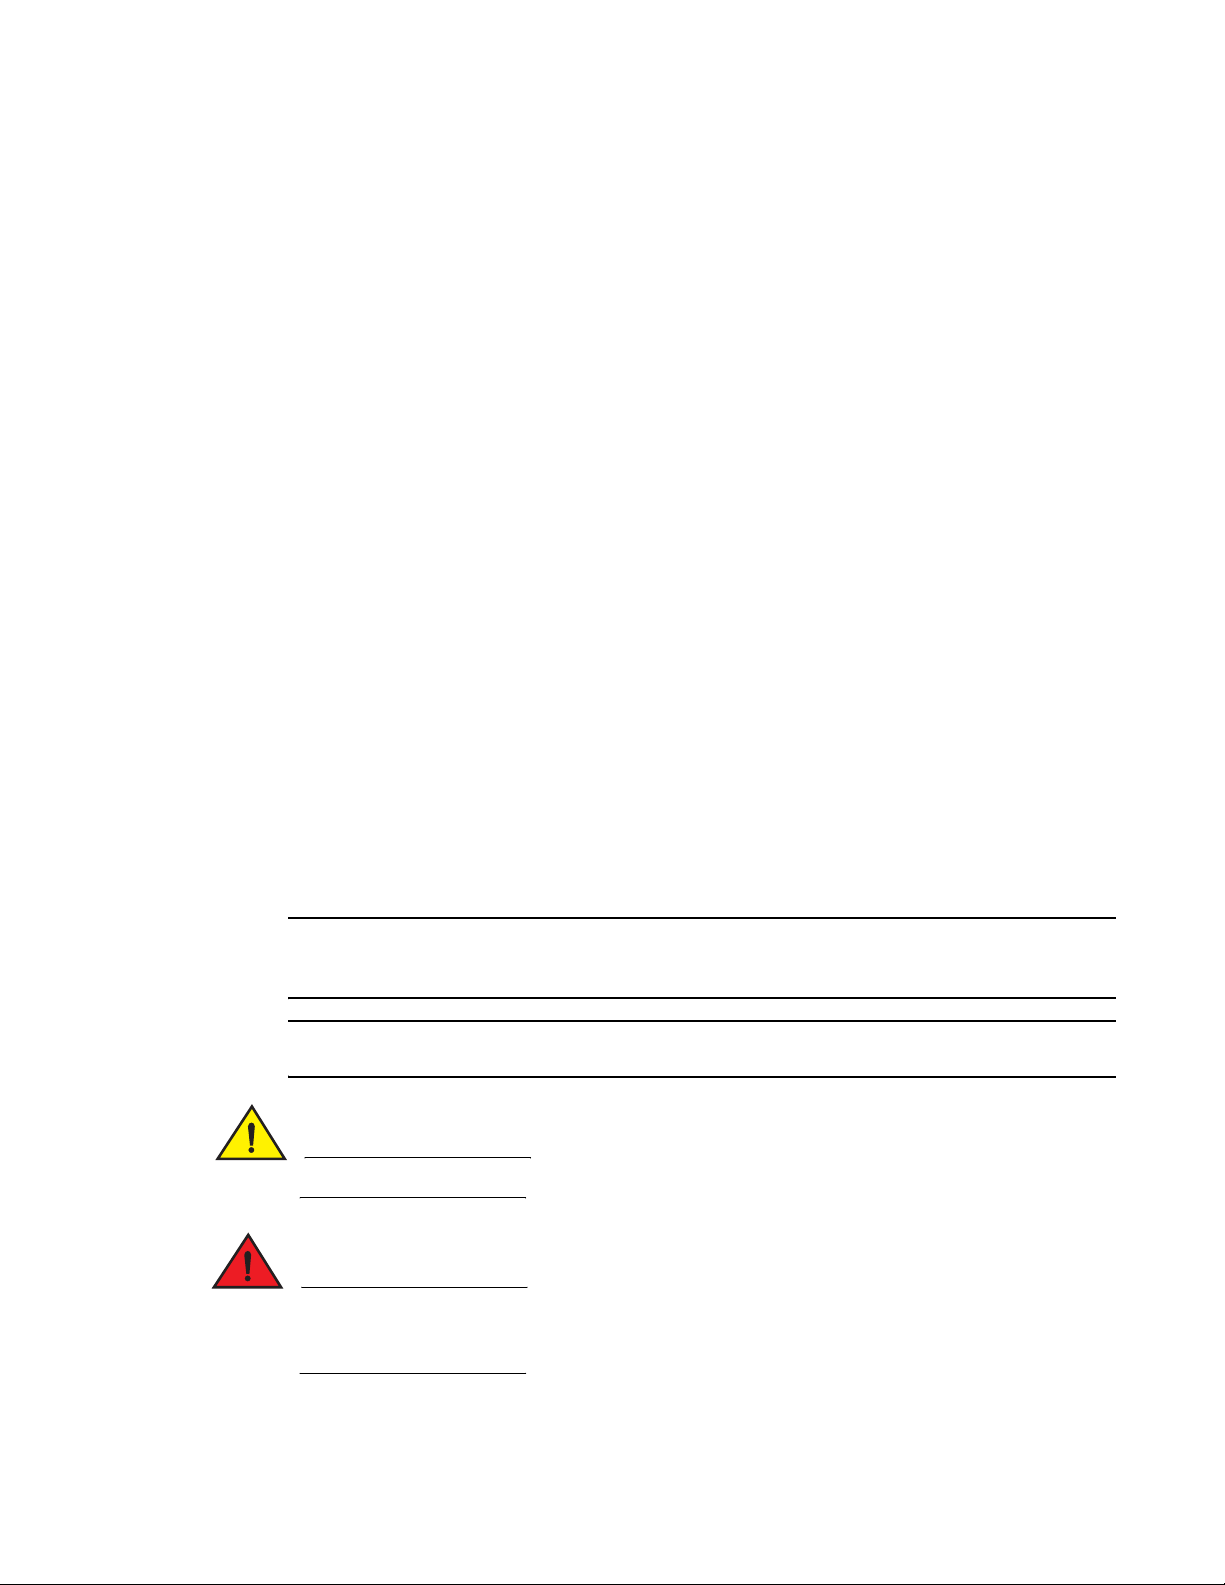
Figure 1 shows an example in which each time a signal crosses the high limit, an event occurs. The
arrows indicate the points at which the event criteria is met. In this case, there is a great deal of
fluctuation. Even when the monitor is set to triggered, a number of messages are sent.
FIGURE 1 Threshold monitoring
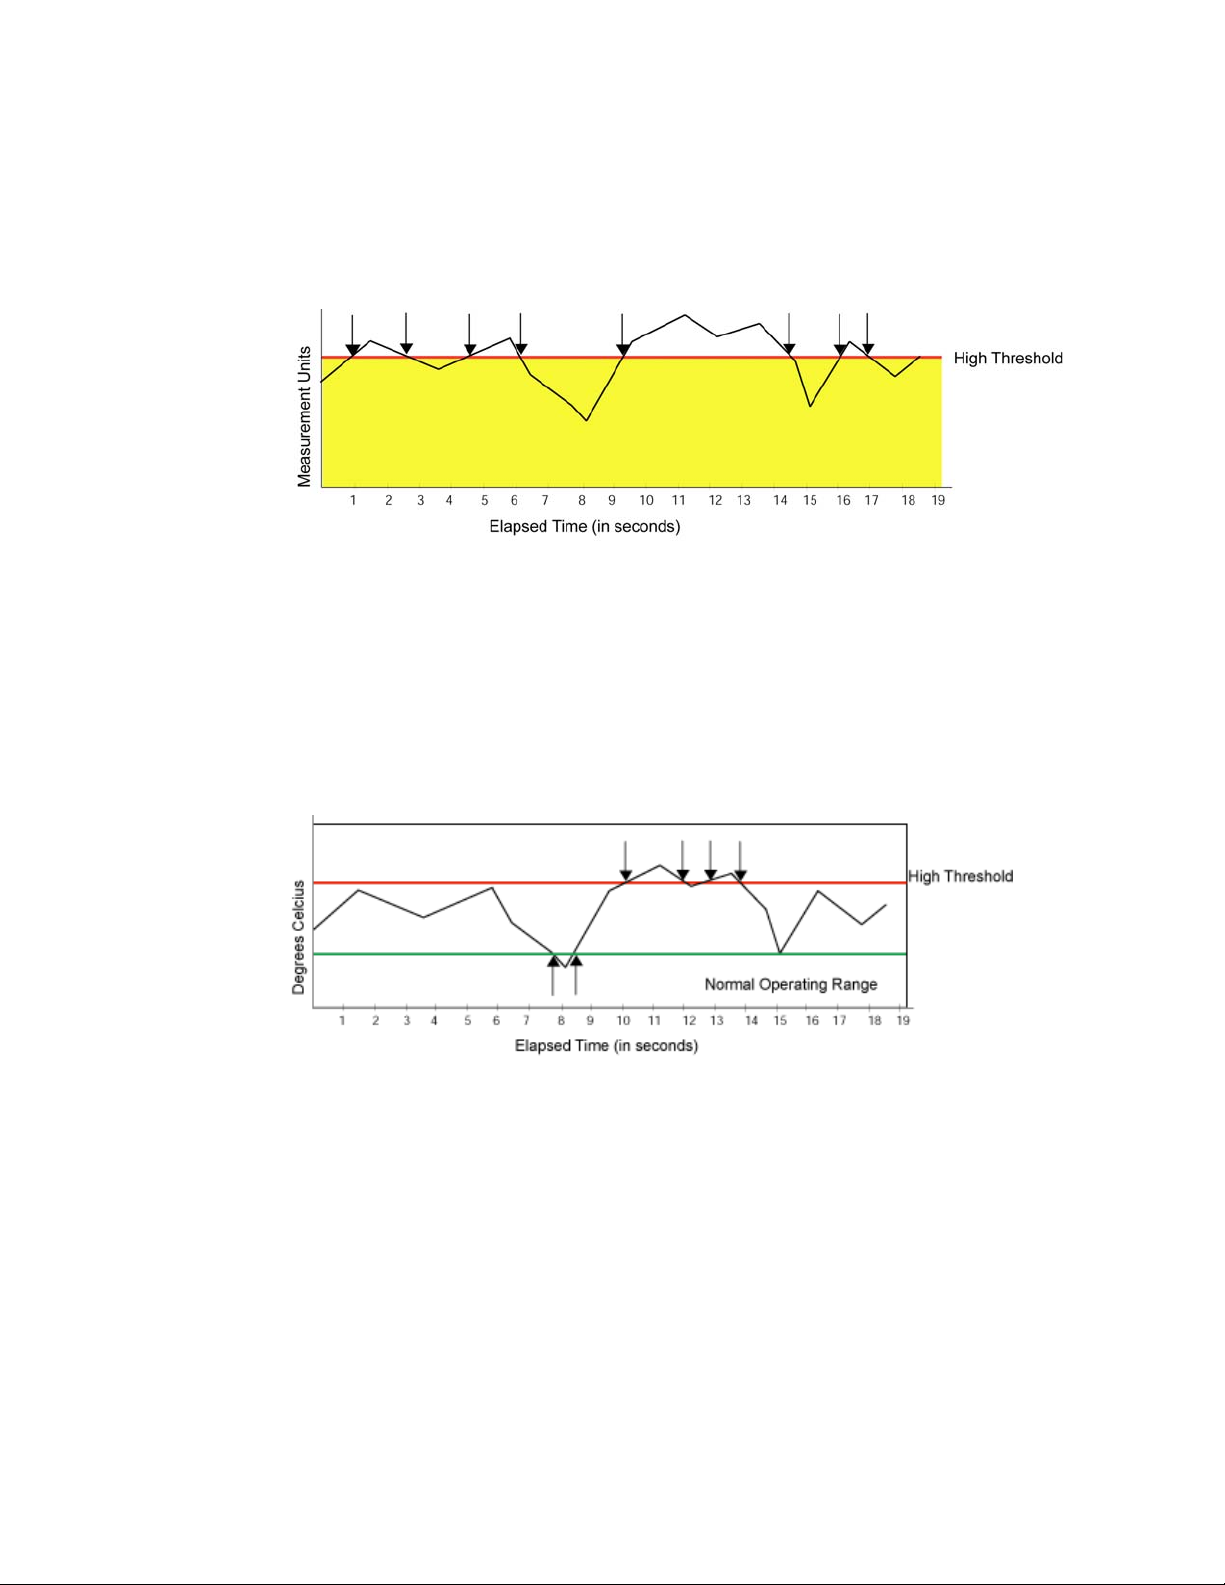
You can use buffer values to reduce the occurrence of events due to data fluctuation. When you
assign a buffer value, it is used to create a zone below the high threshold and above the low
threshold. When values cross above the high threshold or below the low threshold, an event occurs.
Figure 2 shows how to limit the number of event notifications using a buffer. When you specify a
buffer, events cannot occur below the high threshold and above the low threshold. Event
notification occurs only where the arrows indicate. The event criteria is continued to be met until
the data sensed falls below the low threshold value or above the high threshold value.
FIGURE 2 A buffered data region
Fabric Watch Administrator’s Guide 13
53-1000601-02
Page 28
Event Configuration
1
DRAFT: BROCADE CONFIDENTIAL
Time bases
Time bases are time periods within Fabric Watch. This configurable field impacts the comparison of
sensor-based data with user-defined threshold values.
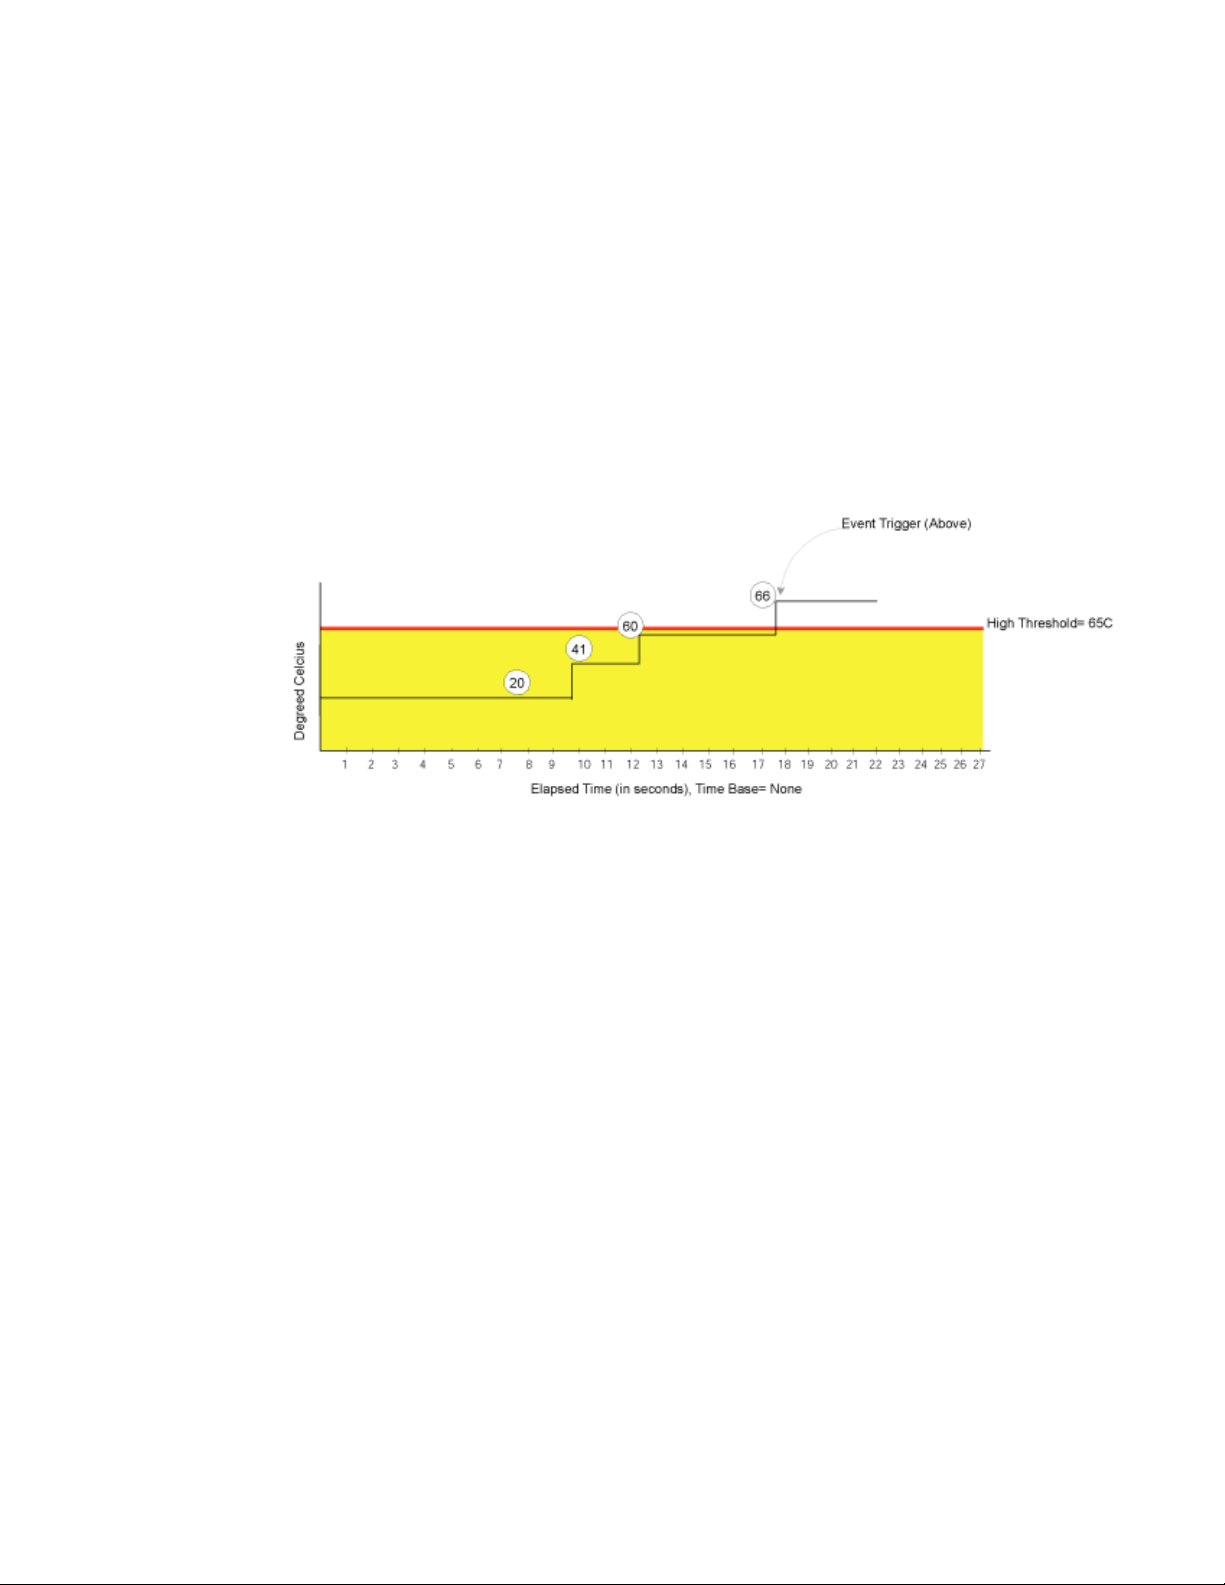
Setting time base to none
If you set a time base to none, Fabric Watch compares a data value against a threshold boundary
level. When the absolute value of the measuring counter exceeds the threshold boundary, an event
is triggered.
Figure 3 shows a high limit of 65 degrees Celsius placed on a counter measuring temperature.
During each sample period, Fabric Watch measures the temperature and compares it against the
high threshold. If the measured temperature exceeds the high threshold, it triggers an event.
FIGURE 3 Time base set to none
Specifying a time base
If you specify a time base value other than none (seconds, minute, hour, or day), Fabric Watch does
not use the current data value. Instead, it calculates the difference between the current data value
and the data value as it existed one time base ago. It compares this difference to the threshold
boundary limit.
For example, if you specify the time base minute, Fabric Watch calculates the counter value
difference between two samples a minute apart. It then compares the difference (current data
value – data value one minute ago) against the preset threshold boundary.
When you set a time base to a value other than none, there are two main points to remember when
configuring events:
• Fabric Watch triggers an event only if the difference in the data value exceeds the preset
threshold boundary limit.
• Even if the current data value exceeds the threshold, Fabric Watch does not trigger an
event if the rate of change is below the threshold limit.
14 Fabric Watch Administrator’s Guide
53-1000601-02
Page 29
DRAFT: BROCADE CONFIDENTIAL
Event Configuration
The following examples illustrate each point.
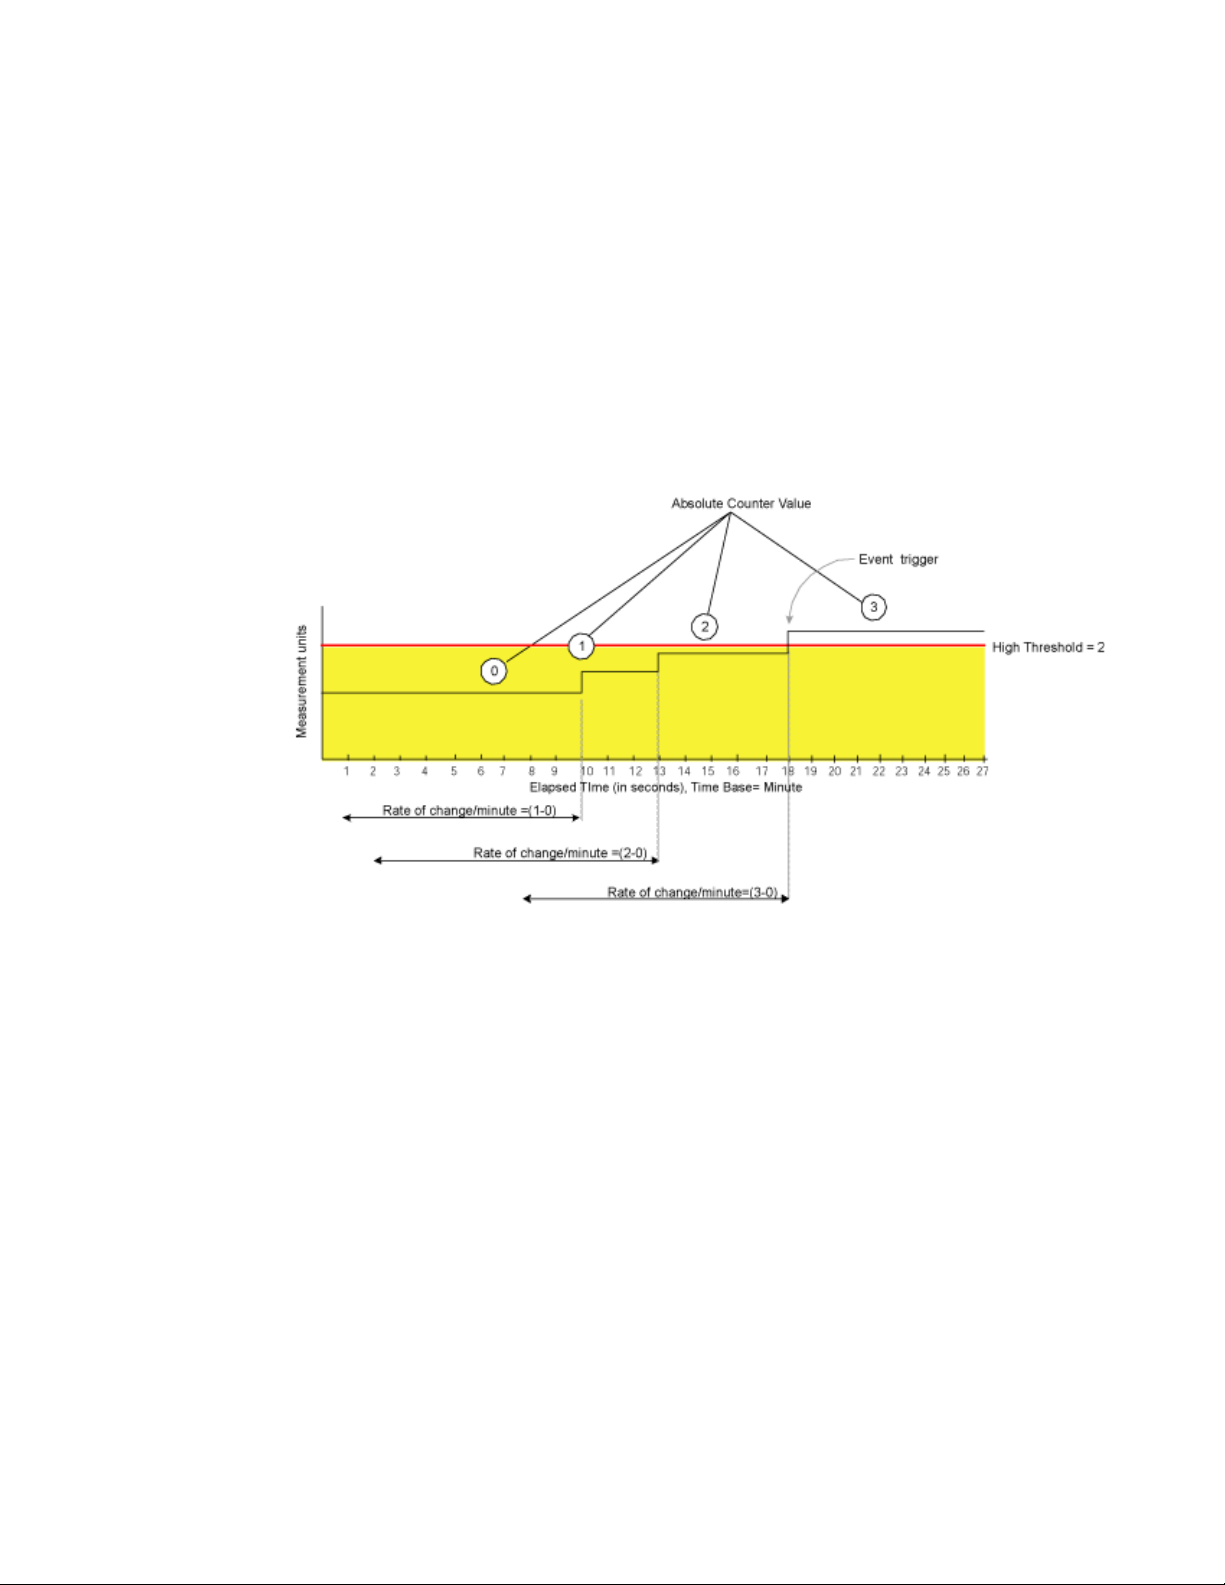
Example1: Triggering an event
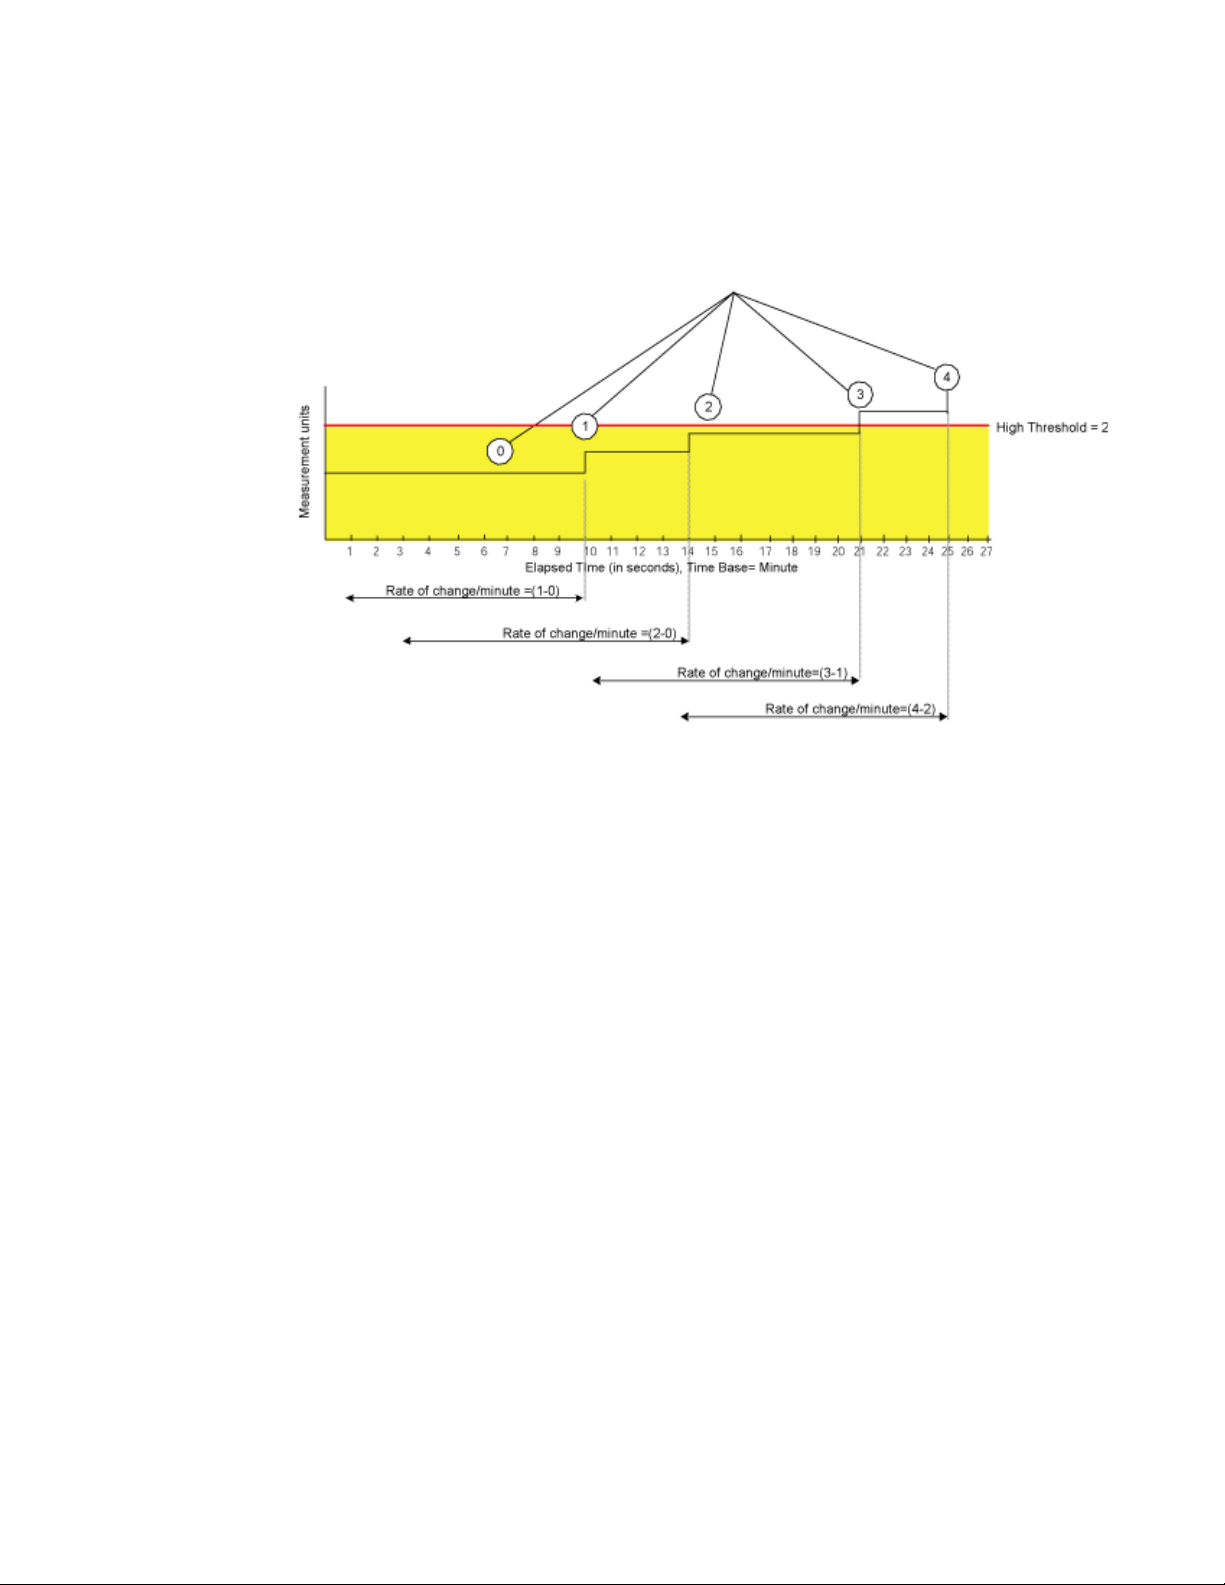
Figure 4 shows a sample graph of data obtained by Fabric Watch (the type of data is irrelevant to
the example). A high threshold of 2 is specified to trigger an event. A time base of minute is
defined. An event occurs only if the rate of change in the specific interval (one minute in this
example) is across the threshold boundary. It should be either higher than the high threshold limit
or lower than the low threshold limit.
As illustrated on the tenth sample, the counter value changes from 0 to 1; hence calculated rate of
change is 1 per minute. At the thirteenth sample, the rate of change is 2 per minute. The rate of
change must be at least 3 per minute to exceed the event-triggering requirement of 2, which is met
on the eighteenth sample.
1
FIGURE 4 Event trigger
Example 2: Not triggering an event
Figure 5 uses the same data to illustrate a case in which a threshold is exceeded without triggering
an event. In this case, the calculated rate of change in the data value is always less than or equal to
the high threshold of 2.
Fabric Watch Administrator’s Guide 15
53-1000601-02
Page 30
Event Configuration
1
DRAFT: BROCADE CONFIDENTIAL
At the tenth sample, the rate of change is one per minute. At the fourteenth, twenty-first, and
twenty-fifth sample, the rate of change remains equal to the high threshold of 2. In this case, Fabric
Watch does not trigger an event even though the absolute value of the counter reaches 4, which is
well above the high threshold.
FIGURE 5 Example without an event
Event settings
This section describes how Fabric Watch compares a fabric element’s data value against a
threshold value to determine whether or not to trigger an event. It describes how a specified buffer
zone impacts event triggering.
Fabric Watch monitors data values for one of the following conditions:
• “Above event triggers,” next
• “Below event trigger” on page 17
• “Changed event trigger” on page 18
• “In-between event triggers” on page 18
For Fabric Watch to monitor these conditions, the alarm setting must be set to a nonzero value.
16 Fabric Watch Administrator’s Guide
53-1000601-02
Page 31

DRAFT: BROCADE CONFIDENTIAL
Event Configuration
1
Above event triggers
Use the Above event trigger for an element that requires only high threshold monitoring. In the
Above event trigger, Fabric Watch triggers an event immediately after the data value becomes
greater than the high threshold.
Define a buffer zone within the operational limit of an area to suppress multiple events when the
counter value goes above the high threshold and fluctuates around it. The next event will not occur
until the counter value falls below the buffer zone created by the high threshold.
Above event trigger with a buffer zone. The Above event trigger occurs when the counter crosses
the high threshold (event 1 in
and buffer value, Fabric Watch triggers a second event (Event 2) to indicate that it has returned to
normal operation. The second event will not be triggered until the counter value falls below the high
threshold and buffer values.
Figure 6). When the data value becomes less than the high threshold
Figure 6 shows an
FIGURE 6 Above event trigger with buffer zone
Below event trigger
The Below event trigger generates an event when a data value becomes less than the low
threshold boundary.
When a buffer is defined, the event will be triggered when the value goes below the lower
threshold. A second event will not be generated until the value crosses the buffer region set above
the lower threshold.
Fabric Watch Administrator’s Guide 17
53-1000601-02
Page 32

Event Configuration
1
DRAFT: BROCADE CONFIDENTIAL
Changed event trigger
Use the Changed event trigger for an element that requires “rate of change” monitoring. When
Fabric Watch detects a change in the counter value between two sample periods (defined by the
time base), it triggers an event regardless of high or low threshold settings.
generated when the data value changes. Each arrow in the figure indicates a generated event.
Figure 7 shows events
FIGURE 7 Changed threshold
Use Changed event triggers with discretion. They are most useful when a change in value is
expected to be rare. Monitoring a fabric element that is subject to frequent change generates so
many events that it can render it virtually useless. For example, this trigger type is appropriate for
FRU failures. It is not appropriate for temperature monitoring.
In-between event triggers
Fabric Watch event triggers are usually set to notify the user of a warning or failure condition, but
there is an exception. You can define the In-Between event trigger to receive a notification of fault
recovery. For example, when measuring port performance, crossing the high threshold triggers an
Above threshold event, which displays a warning message. The threshold might be crossed for a
period so brief that is not a true cause for an alarm. An In-Between event trigger indicates that the
port performance has returned to the acceptable range.
Use the In-Between event trigger to:
• Verify a successful recovery from a faulty condition.
• Reset the counter value for the next event.
• Identify an element that is consistently operating under marginal conditions.
18 Fabric Watch Administrator’s Guide
53-1000601-02
Page 33

DRAFT: BROCADE CONFIDENTIAL
Event Configuration
Figure 8 illustrates event notification using an In-Between event trigger. The arrow labeled 1
indicates the point at which event notification occurs.
FIGURE 8 In-between event trigger
1
Fabric Watch alarm behavior
Fabric Watch alarm behavior depends on the threshold states associated with the Above, Below
and Changed thresholds. Threshold states can be INFORMATIVE, IN_RANGE, and OUT_OF_RANGE.
Alarms are generated only for the following transitions:
• IN_RANGE to OUT_OF_RANGE
• OUT_OF_RANGE to IN_RANGE
No alarm is generated for INFORMATIVE to IN_RANGE (or IN_RANGE to INFORMATIVE)
See Appendix , “Default Threshold Values” for more details about the threshold states for Above,
Below, and Changed.
Fabric Watch Administrator’s Guide 19
53-1000601-02
Page 34

Port persistence
1
Port persistence
The data collected in port monitoring can vary a great deal over short time periods. Therefore, the
port can become a source of frequent event messages (the data can exceed the threshold range
and return to a value within the threshold range).
Fabric Watch uses port persistence for a port event that requires the transition of the port into a
marginal status. Fabric Watch does not record any event until the event persists for a length of time
equal to the port persistence time. If the port returns to normal boundaries before the port
persistence time elapses, Fabric Watch does not record any event.
The port persistence time is measured in seconds, and can be configured. Configuring the port
persistence time to zero disables this feature. The default value for port persistence is 18 seconds.
Port fencing
A port that is consistently unstable can harm the responsiveness and stability of the entire fabric
and diminish the ability for the management platform to control and monitor the switches within
the fabric. Port Fencing is a Fabric Watch enhancement that takes the Port class, E_Port class, and
F/FL_Port class ports offline if the user-defined thresholds are exceeded.
DRAFT: BROCADE CONFIDENTIAL
NOTE
Port Fencing is not enabled by default. The user must manually enable Port Fencing.
When a port that has exceeded its user-defined thresholds is fenced by software, the port is placed
into the disabled state and held offline, thereby removing the port’s capability to transmit or
receive frames. Once a port is disabled, user intervention is necessary for frame traffic to resume
on the port.
20 Fabric Watch Administrator’s Guide
53-1000601-02
Page 35

DRAFT: BROCADE CONFIDENTIAL
Notification methods
Tab le 10 shows the default threshold boundary values and buffer sizes that have been changed for
the Port class, E_Port class, and F/FL_Port class and the areas that Port Fencing supports. For a
full list of default threshold boundary values and buffer sizes, refer to
Tab le 24.
Tab le 22, Table 23, and
1
TABLE 10 Changes in port thresholds and buffer size due to Port Fencing
Class and area Current default
high threshold
value per min
Port - link loss 5 1000 0 100
Port - sync loss 5 1000 0 100
Port - invalid words 5 1000 0 100
Port - invalid CRCS 5 1000 0 100
E_Port - sync loss 5 1000 0 100
E_Port - invalid words 5 1000 0 100
E_Port - invalid CRCS 5 1000 0 100
F/FL_Port - link loss 5 1000 0 100
F/FL_Port - sync loss 5 1000 0 100
F/FL_Port - invalid words 5 1000 0 100
F/FL_Port - invalid CRCS 5 1000 0 100
New default high
threshold value
per min
Current default
buffer size
New default
buffer size
Notification methods
There are five notification methods available through Fabric Watch, but not all notification methods
can be applied to all of the classes. Valid notification methods are represented through the valid
alarm matrix.
Fabric Watch provides the following notification methods:
• “Switch event (error) log,” next
• “SNMP trap” on page 22
• “RAPI trap” on page 22
• “Port log lock” on page 22
• “E-mail alert” on page 23
To enable event settings, you must set the associated attribute to a nonzero value between 1 and
31. The exact value you specify determines which event notification method Fabric Watch uses if
the event setting criteria is met.
For details about valid notification methods in the alarm matrix, see “Notification methods” on
page 23.
Fabric Watch Administrator’s Guide 21
53-1000601-02
Page 36

Notification methods
1
DRAFT: BROCADE CONFIDENTIAL
Switch event (error) log
The switch event (error) log holds up to 1024 entries. This error log stores event information but
does not actively send alerts. Use the errShow command to view the log.
Log entries can also trigger SNMP traps if the SNMP agent is configured. When the SNMP agent is
configured to a specific error message level, then error messages at that level trigger SNMP traps.
For information on configuring the SNMP agent using the snmpconfig command, see the Fabric OS
Command Reference.
SNMP trap
The Simple Network Management Protocol (SNMP) performs an operation called a trap that
notifies a management station (a workstation that runs network management applications using
SNMP protocol) when events occur.
You must configure the software to receive trap information from the network device. You must also
configure the SNMP agent on the switch to send the trap to the management station using the
snmpconfig command. For more information on this command, see the Fabric OS Command
Reference.
An SNMP trap forwards the following information to an SNMP management station:
• Name of the element whose counter registered an event
• Class, area, and index number of the threshold that the counter crossed
• Event type
• Value of the counter that exceeded the threshold
• State of the element that triggered the alarm
• Source of the trap
The trap stores event information but does not actively send alerts. Port changes do not generate
SNMP traps.
RAPI trap
RAPI Trap is a Fabric Watch alarm that actively alerts you to events. After you enable RAPI Trap,
Fabric Watch forwards all event information to a designated proxy switch. The host API
automatically configures the proxy switch based on firmware version. The switch forwards the
information to a server and alerts the SAN manager to event activity.
Third-party applications that use the Brocade API determine the manner in which RAPI Trap
presents alarms to the user.
Port log lock
The port log locks to retain detailed information about an event, preventing the information from
being overwritten as the log becomes full. This alarm stores event information but does not actively
send alerts, which is done automatically when some thresholds are exceeded and an alert is
triggered.
For more information about locking, unlocking, and clearing the port log, see the Fabric OS
Command Reference.
22 Fabric Watch Administrator’s Guide
53-1000601-02
Page 37

DRAFT: BROCADE CONFIDENTIAL
Notification methods
1
E-mail alert
E-mail alert sends information about a switch event to a specified e-mail address. E-mail alert can
send information about any error from any element, area, and class.
The e-mail specifies the threshold and describes the event, much like an error message. Use the
fwMailCfg command to configure e-mail alerts.
NOTE
To send e-mail alerts, the switch must be connected to a DNS server. Use the dnsConfig command
to configure DNS settings. In case a DNS server is not available, mails can be forwarded through a
relay host. The relay host IP can be configured using the fwMailCfg command.
Also, enabling e-mail alerts for the Changed threshold state in several areas can quickly result in a
significant amount of e-mail. Fabric Watch discards e-mail alerts when more than 100 are generated
within a minute; this prevents memory shortages.
Notification methods
Specify the particular notification method that you want Fabric Watch to use by assigning it a value.
Tab le 11 shows the numerical values for each notification method.
TABLE 11 Numerical values of notification methods
Notification method Assigned value
Error log entry 1
SNMP trap 2
Rapi Trap 4
Port log lock 8
E-mail notification 16
Port fencing 32
To determine the value for the event setting attribute that enables all desired notification methods,
add the values assigned to each method. For example, to enable SNMP trap, Rapi Trap and e-mail
notification, use the value 22, which is the sum of 2, 4, and 16.
Not all notification methods are valid for all areas. Every area has an associated valid alarm matrix,
which is the sum of all valid notification methods for that area. For example, an area with a valid
alarm matrix of 25 allows the error log entry (1), port log lock (8) and e-mail notification (16)
methods, but does not allow the SNMP trap (2) or Rapi Trap (4) methods.
An area with a valid alarm matrix of 31 allows all of the notification types.
Fabric Watch Administrator’s Guide 23
53-1000601-02
Page 38

Switch policies
1
Switch policies
Switch policies are a series of rules that define specific states for the overall switch. Fabric OS
interacts with Fabric Watch using these policies. Each rule defines the number of types of errors
that transitions the overall switch state into a state that is not healthy. For example, you can specify
a switch policy so that if a switch has two port failures, it is considered to be in a marginal state; if it
has four failures, it is in a down state.
You can define these rules for a number of classes and field replaceable units, including ports,
power supplies, flash memory, and fans.
See Chapter 4, “Generating Fabric Watch Reports” for information on viewing the current switch
policies using the switch policy report.
Audit messages
Fabric Watch events caused by configuration value changes are tagged as Audit messages.
DRAFT: BROCADE CONFIDENTIAL
NOTE
Audit messages are generated for port fencing configuration changes, whether port fencing is
enabled or disabled.
You can set up an external host to receive Audit messages so you can easily monitor unexpected
changes. For information on error messages generated by Fabric Watch, see the Fabric OS
Message Reference. For information on configuring an Audit Log, see the Fabric OS Administrator’s
Guide.
24 Fabric Watch Administrator’s Guide
53-1000601-02
Page 39

DRAFT: BROCADE CONFIDENTIAL
Chapter
Activating and Accessing Fabric Watch
In this chapter
•Fabric Watch activation. . . . . . . . . . . . . . . . . . . . . . . . . . . . . . . . . . . . . . . . . . 25
•Fabric Watch access . . . . . . . . . . . . . . . . . . . . . . . . . . . . . . . . . . . . . . . . . . . . 26
Fabric Watch activation
You can monitor one or multiple switches in a fabric using Fabric Watch. If you choose to use Fabric
Watch, it must be activated on each switch individually. Use Telnet or Web Tools to activate Fabric
Watch. Information about using Web Tools to activate and use Fabric Watch, see the Web Tools
Administrator’s Guide.
NOTE
If the Administrative Domain feature is enabled on the switch, the local switch must be a member
of the current Admin Domain in order for the Fabric Watch feature to be fully usable:
- CLI: Fabric Watch commands cannot be used, except the fwPortDetailShow command. It will still
show filtered output in Admin Domain context even if the local switch is not a member of the current
domain.
- Web Tools: Web Tools allows view-only access to all threshold configuration values even if the local
switch is not a member of the current domain. However, the thresholds can be changed only if the
local switch is a member of the current Admin Domain.
For more information on the Administrative Domain feature, see the Fabric OS Administrator’s
Guide.
2
After it is activated, configure Fabric Watch to monitor your system and its health, as described in
Chapter 3, “Fabric Watch configuration”.
Activating Fabric Watch with Telnet
To activate Fabric Watch using Telnet commands:
1. Log in as admin.
2. View a list of the activated licenses with the licenseShow command.
swd21:admin> licenseshow
SedQyzdQbdTfeRzZ:
Web license
Zoning license
bedR9dyyzzcfeSAW:
Fabric license
Scy9SbRQd9VdzATb:
Fabric Watch license
Fabric Watch Administrator’s Guide 25
53-1000601-02
Page 40

Fabric Watch access
2
If the Fabric Watch license is not listed, continue to step 3; otherwise, you are ready to use
Fabric Watch.
3. Enter the license key with the licenseAdd key command, where key is the Fabric Watch license
key. License keys are case-sensitive, so type the license key exactly as it appears.
switch:admin> licenseadd "R9cQ9RcbddUAdRAX"
4. Verify successful activation with the licenseShow command. If the license is not listed, verify
that you typed the key correctly; if you did not, then repeat
If you still do not see the license, verify that the entered key is valid, and that the license key is
correct before repeating step 3.
5. Initialize the Fabric Watch classes with the fwClassinit command.
Fabric Watch access
This section provides a brief overview of the available user interfaces. Further details about Fabric
Watch operations for each interface are provided later in this guide. User interfaces include:
DRAFT: BROCADE CONFIDENTIAL
step 3.
• “Fabric Watch access using the CLI”
• “Fabric Watch access using SNMP-based enterprise managers” on page 27
• “Configuration file” on page 28
Fabric Watch access using the CLI
Use a Telnet session or SSH to perform the following tasks:
• Observe the current monitors on a switch with the fwShow command.
• Query and modify threshold and alarm configurations (whether default or customized) with the
fwConfigure command.
• View and configure the FRU module with the fwFruCfg command.
• View and configure the e-mail addresses to which event messages are sent with the fwMailCfg
command.
To establish a Telnet session, use the following command, where switch represents the name or IP
address of the switch:
telnet switch
When this command is executed, you are prompted for a username and password. To use Fabric
Watch, connect using an account with administrative privileges.
26 Fabric Watch Administrator’s Guide
53-1000601-02
Page 41

DRAFT: BROCADE CONFIDENTIAL
Fabric Watch access
2
Fabric Watch access using SNMP-based enterprise managers
Use SNMP-based enterprise managers to:
• Query the MIB variable for individual fabric and switch elements.
• Query and modify threshold and alarm configurations.
• Receive alarm notification through SNMP traps.
• View and configure the mail database.
NOTE
The following instructions apply to the AdvantNet MIB browser. There may be some variation in the
procedures when other MIB browsers are used.
Configuring an SNMP-based enterprise manager for Fabric Watch
1. Open a MIB browser.
2. Load the appropriate MIB files if you have not already done so. First load the Brocade common
MIB file, followed by the Brocade software MIB file. The system should respond with a screen
similar to the following:
The MIB browser has populated the left side of the screen with a MIB tree that you can
navigate.
3. Begin a Telnet session with the switch. See “Fabric Watch access using the CLI” on page 26.
4. Type the IP address for the switch into the Host field. Type the community into the Community
field. Type the write community into the Write Community field, if you want to perform set
operations.
Fabric Watch Administrator’s Guide 27
53-1000601-02
Page 42

Fabric Watch access
2
DRAFT: BROCADE CONFIDENTIAL
5. Navigate down through the tree on the left until you find the Fabric Watch OID information.
Configuration file
Use a configuration file to:
• Upload and download the configuration file and make changes in a text editor.
• Upload and download the configuration file through a Telnet session or with Web Tools.
Uploading and downloading a configuration file to multiple switches efficiently populates your SAN
with consistent Fabric Watch settings.
For details about configuration file usage, see Appendix , “Using Fabric Watch with Configuration
Files”.
NOTE
A non-disruptive firmware download might fail if you attempt to download incorrect values. For
example, on a switch with only one power supply, you cannot download a “switch status power
supply value=4” taken from another switch.
When executing the configDownload command, Fabric Watch mail parameters cannot be modified
without disabling the switch.
28 Fabric Watch Administrator’s Guide
53-1000601-02
Page 43

Chapter
Fabric Watch configuration
In this chapter
•Fabric Watch threshold configuration . . . . . . . . . . . . . . . . . . . . . . . . . . . . . . 29
•Notification configuration . . . . . . . . . . . . . . . . . . . . . . . . . . . . . . . . . . . . . . . . 43
•Switch status policy configuration . . . . . . . . . . . . . . . . . . . . . . . . . . . . . . . . . 49
•FRU configuration . . . . . . . . . . . . . . . . . . . . . . . . . . . . . . . . . . . . . . . . . . . . . . 51
•Fabric Watch using SNMP configuration . . . . . . . . . . . . . . . . . . . . . . . . . . . . 52
This chapter describes the procedures used to configure Fabric Watch. This chapter does not
explain Fabric Watch terminology and concepts; see
To configure Fabric Watch using Web Tools, see the Web Tools Administrator’s Guide.
Fabric Watch threshold configuration
After it is activated, Fabric Watch automatically uses a set of default factory settings that might vary
from system to system, depending on the software version and the switch hardware. You can
create custom threshold configurations to suit your unique environment.
3
Chapter 1, “Fabric Watch Concepts” for these.
Both the factory default and user-customized Fabric Watch settings are individually maintained.
You cannot change the default values. During Fabric Watch configuration, you can select whether
Fabric Watch should use the default or custom settings for monitoring.
Configuring Fabric Watch thresholds enables you to define your own unique event conditions (such
as threshold traits, alarms, and e-mail configuration). For example, it is unlikely that you would
need to change the default values for Environment class because the hardware has been tested so
extensively. However, if you anticipate a need for additional notifications, or you need to better
gauge performance because of noticeable congestion on certain ports, you might want to configure
the values for some thresholds.
The steps to configure Fabric Watch Thresholds are as follows:
“Step 1. Configuring the class and area” on page 30
“Step 2. Configuring port fencing (optional)” on page 32
“Step 3. Threshold configuration” on page 33
“Step 4. Advanced configuration” on page 35
“Step 5. Alarm configuration” on page 40
“Step 6. Disable and enable thresholds by port (optional)” on page 43
Fabric Watch Administrator’s Guide 29
53-1000601-02
Page 44

Fabric Watch threshold configuration
3
Step 1. Configuring the class and area
During your planning activities, you should determine exactly what elements or monitors you want
to configure, and in which class they reside. After you have made this decision, you need to identify
the classes.
1. Using the CLI, log in to the switch as Admin.
2. Navigate to a specific class and area with the fwConfigure command.
The fwConfigure menu displays.
swd77:admin> fwconfigure
1 : Environment class
2 : SFP class
3 : Port class
4 : Fabric class
5 : E-Port class
6 : F/FL Port (Optical) class
7 : Alpa Performance Monitor class
8 : EEPerformance Monitor class
9 : Filter PerformanceMonitorclass
10 : Security class
11 : Resource class
12 : Quit
Select a class => : (1..12) [12] 5
The fwConfigure menu contains 12 menu items. The first 11 items correspond to the classes
available for configuration. The Quit menu item, which is the default, exits the fwConfigure
menu.
NOTE
For switches with embedded ports or copper ports, the fwConfigure menu has 13 menu items.
An additional menu item for F/FL Port (Copper) class is displayed.
3. Type the number from the list that corresponds to the class that you want to configure. For
example, if you type 5, the menu corresponding to the E_Port class displays.
1 : Link loss
2 : Sync loss
3 : Signal loss
4 : Protocol error
5 : Invalid words
6 : Invalid CRCS
7 : RXPerformance
8 : TXPerformance
9 : State Changes
10 : return to previous page
Select an area => : (1..10) [10] 7
For each class that you select, Fabric Watch provides a list of the areas of the class available
for configuration. The final item in the list, which is always the default, returns you to the
previous selection screen.
4. Type the number corresponding to the area that you want to configure, such as 7 for
RXPerformance. Fabric Watch displays a list of monitored elements in this area. The following
sample output shows the monitored elements in the RXPerformance area menu.
30 Fabric Watch Administrator’s Guide
53-1000601-02
Page 45

Fabric Watch threshold configuration
Index ThresholdName Port CurVal Status
LastEvent LasteventTime LastVal LastState
============================================================================
216 eportRXPerf216 8/24 0 Percentage(%)/min enabled
inBetween Fri Oct 21 14:21:01 2005 0 Percentage(%)/min Informative
217 eportRXPerf217 8/25 0 Percentage(%)/min enabled
inBetween Fri Oct 21 14:21:07 2005 0 Percentage(%)/min Informative
218 eportRXPerf218 8/26 0 Percentage(%)/min enabled
inBetween Fri Oct 21 14:21:07 2005 0 Percentage(%)/min Informative
219 eportRXPerf219 8/27 0 Percentage(%)/min enabled
inBetween Fri Oct 21 14:21:07 2005 0 Percentage(%)/min Informative
220 eportRXPerf220 8/28 0 Percentage(%)/min enabled
inBetween Fri Oct 21 14:21:07 2005 0 Percentage(%)/min Informative
221 eportRXPerf221 8/29 0 Percentage(%)/min enabled
inBetween Fri Oct 21 14:21:07 2005 0 Percentage(%)/min Informative
222 eportRXPerf222 8/30 0 Percentage(%)/min enabled
inBetween Fri Oct 21 14:21:07 2005 0 Percentage(%)/min Informative
223 eportRXPerf223 8/31 0 Percentage(%)/min enabled
inBetween Fri Oct 21 14:21:07 2005 0 Percentage(%)/min Informative
1 : refresh
2 : disable a threshold
3 : enable a threshold
4 : advanced configuration
5 : return to previous page
Select choice => : (1..5) [5] 1
3
where:
Index A numeric identifier assigned to the element
ThresholdName A string identifier assigned to the element
Port The user port number
CurVal The current data value contained by the element
Status Monitoring status, either enabled or disabled
LastEvent The last event setting that triggered an event.
LasteventTime The timestamp of the last triggered event for the element
LastVal The data value of the element at the time of the last event
LastState The last detected state of the element
See Chapter 1, “Fabric Watch Concepts” for more details about classes and areas.
Fabric Watch Administrator’s Guide 31
53-1000601-02
Page 46

Fabric Watch threshold configuration
3
Step 2. Configuring port fencing (optional)
The Port Fencing feature can be set for the Port class, E_Port class, and F/FL Port class only.
NOTE
The following is an example of selecting the Port class with Invalid CRCs. With the exception of
step 1, the same steps are required to enable the E_Port or F /FL P ort c lass , as wel l as e ach availabl e
area for the selected class (described in step 4).
1. Type fwalarmsfilterset 1 to enable Fabric Watch alarms.
2. Navigate to a specific class and area with the fwConfigure command.
swd77:admin> fwconfigure
1 : Environment class
2 : SFP class
3 : Port class
4 : Fabric class
5 : E-Port class
6 : F/FL Port (Optical) class
7 : Alpa Performance Monitor class
8 : EEPerformance Monitor class
9 : Filter PerformanceMonitorclass
10 : Security class
11 : Resource class
12 : Quit
Select a class => : (1..12) [12] 3
3. Type the number from the list that corresponds to the class that you want to configure. Select 3
for Port class, 5 for E_Port class, or 6 for F/FL Port (Optical) class.
For each class that you select, Fabric Watch provides a list of the areas of the class available
for configuration.
4. Select an area (areas 1 - 2 and 4 - 6 are available for Port Fencing).
1 : Link loss
2 : Sync loss
3 : Signal loss
4 : Protocol error
5 : Invalid words
6 : Invalid CRCS
7 : RXPerformance
8 : TXPerformance
9 : State Changes
10 : return to previous page
Select an area => : (1..2) (4..6) [10] 6
In this example, if you type 6, the menu corresponding to the Invalid CRCs displays.
See Chapter 1, “Fabric Watch Concepts” for more details about classes and areas.
32 Fabric Watch Administrator’s Guide
53-1000601-02
Page 47

Fabric Watch threshold configuration
3
5. Select advanced configuration by typing 4 at the Select choice prompt.
1 : refresh
2 : disable a threshold
3 : enable a threshold
4 : advanced configuration
5 : return to previous page
Select an area => : (1..5) [5] 4
6. Select change above alarm by typing 14 at the Select choice prompt.
7. Set the alarm for Port Fencing (32) by typing 32 at the Enter above alarm matrix prompt.
8. Verify that the alarm matrix displays the Above Custom as 32, and then change the Threshold
alarm level to custom by typing 11.
9. Select custom by typing 2 at the Enter alarm level type prompt.
10. Select apply threshold alarm changes by typing 16 at the Select choice prompt.
11. Change the number of errors per minute using the following substeps:
a. From the advanced configuration section, select change custom high by typing 7 at the
Select choice prompt.
b. Type the number of errors per minute at the Enter high threshold prompt.
12. Change the Threshold boundary level to custom by typing 3, and then select custom by
typing 2 at the Enter boundary level type.
13. Select apply threshold boundary changes by typing 9 at the Select choice prompt.
14. Type Enter until you reach the switch command prompt.
Step 3. Threshold configuration
After you have identified and selected the appropriate class and areas, you can configure
thresholds for those classes and areas. If you want a basic configuration, accept the default
configuration settings. If you want to customize settings, type advanced configuration at the Select
choice => prompt.
NOTE
The allowed threshold configuration settings are displayed on a per-class basis. Although Port
Fencing is displayed for other areas, such as RX Performance, for which Port Fencing is not
supported, you will not be able to set or apply the changes on such areas.
The area menu displays the following five options, which are described in the following sections:
1 : refresh
2 : disable a threshold
3 : enable a threshold
4 : advanced configuration
5 : return to previous page
Refreshing a threshold configuration
Select the refresh option to redraw the screen with the most recently-updated monitoring
information. After the screen refreshes, the same four options appear.
Fabric Watch Administrator’s Guide 33
53-1000601-02
Page 48

Fabric Watch threshold configuration
3
Disabling a threshold configuration
To stop monitoring a selected option, use the disable a threshold option, as follows:
1. Type 2 at the Select choice => prompt.
The system generates output, which varies based on the class and area you selected.
2. Type the index number of the element for which Fabric Watch should disable monitoring.
Fabric Watch redraws the element table with the selected element disabled. The second row of
information about the selected element does not appear anymore, and the status of the
element is set to disabled (see the system output).
Select threshold index => : (216..223) [216] 218
Index ThresholdName Port CurVal Status
LastEvent LasteventTime LastVal LastState
============================================================================
216 eportRXPerf216 8/24 0 Percentage(%)/min enabled
inBetween Fri Oct 21 14:21:01 2005 0 Percentage(%)/min Informative
217 eportRXPerf217 8/25 0 Percentage(%)/min enabled
inBetween Fri Oct 21 14:21:07 2005 0 Percentage(%)/min Informative
218 eportRXPerf218 8/26 0 Percentage(%)/min disabled
219 eportRXPerf219 8/27 0 Percentage(%)/min enabled
inBetween Fri Oct 21 14:21:07 2005 0 Percentage(%)/min Informative
220 eportRXPerf220 8/28 0 Percentage(%)/min enabled
inBetween Fri Oct 21 14:21:07 2005 0 Percentage(%)/min Informative
221 eportRXPerf221 8/29 0 Percentage(%)/min enabled
inBetween Fri Oct 21 14:21:07 2005 0 Percentage(%)/min Informative
222 eportRXPerf222 8/30 0 Percentage(%)/min enabled
inBetween Fri Oct 21 14:21:07 2005 0 Percentage(%)/min Informative
223 eportRXPerf223 8/31 0 Percentage(%)/min enabled
inBetween Fri Oct 21 14:21:07 2005 0 Percentage(%)/min Informative
Enabling a threshold
1. Type 3 at the Select choice => prompt.
The system generates output similar to that in the system output below, but the output you see
varies based on the class and area you selected.
2. Type the index number of the element for which Fabric Watch should enable monitoring.
Fabric Watch redraws the element table with the selected element enabled. A second row of
information about the selected element appears, and the status of the element is set to
enabled.
34 Fabric Watch Administrator’s Guide
53-1000601-02
Page 49

Fabric Watch threshold configuration
Select threshold index => : (216..223) [216] 218
Index ThresholdName Port CurVal Status
LastEvent LasteventTime LastVal LastState
=============================================================================
216 eportRXPerf216 8/24 0 Percentage(%)/min enabled
inBetween Fri Oct 21 14:21:01 2005 0 Percentage(%)/min Informative
217 eportRXPerf217 8/25 0 Percentage(%)/min enabled
inBetween Fri Oct 21 14:21:07 2005 0 Percentage(%)/min Informative
218 eportRXPerf218 8/26 0 Percentage(%)/min enabled
inBetween Fri Oct 21 14:21:07 2005 0 Percentage(%)/min Informative
219 eportRXPerf219 8/27 0 Percentage(%)/min enabled
inBetween Fri Oct 21 14:21:07 2005 0 Percentage(%)/min Informative
220 eportRXPerf220 8/28 0 Percentage(%)/min enabled
inBetween Fri Oct 21 14:21:07 2005 0 Percentage(%)/min Informative
221 eportRXPerf221 8/29 0 Percentage(%)/min enabled
inBetween Fri Oct 21 14:21:07 2005 0 Percentage(%)/min Informative
222 eportRXPerf222 8/30 0 Percentage(%)/min enabled
inBetween Fri Oct 21 14:21:07 2005 0 Percentage(%)/min Informative
223 eportRXPerf223 8/31 0 Percentage(%)/min enabled
inBetween Fri Oct 21 14:21:07 2005 0 Percentage(%)/min Informative
Step 4. Advanced configuration
3
Tab le 12 describes the 18 customization options displayed at the end of the Advanced
Configuration menu. With the exception of the last option, which exits advanced configuration
mode, each option has similar behavior. For each option, one or two lines will appear, prompting
you to accept the new setting information, and, after the information has been provided, the entire
screen will refresh to display the updated information.
TABLE 12 Advanced Configuration options
Option Effect Input information
change behavior type Changes the behavior type of a single
element to either Triggered or
Continuous. The change is volatile
because this option is not saved to
flash memory. Every time the switch
is rebooted, this option is reset.
change behavior interval Changes the behavior interval for a
single element. The change is volatile
because this option is not saved to
flash memory. Every time the switch
is rebooted, this option is reset.
This value is effective only when the
behavior type is set to continuous.
change threshold boundary
level
change custom unit Obsolete Obsolete
change custom time base Changes the time base for the area,
change custom low Changes the low setting for the
Changes between the factory default
and custom threshold information.
but only affects the custom column.
threshold, but only affects the custom
column.
The element index and the required
behavior type
The element index and the required
behavior interval, in seconds
The required threshold column
The required time base
The required low threshold, in the units
defined by the area
Fabric Watch Administrator’s Guide 35
53-1000601-02
Page 50

Fabric Watch threshold configuration
3
TABLE 12 Advanced Configuration options (Continued)
Option Effect Input information
change custom high Changes the high setting for the
threshold, but only affects the custom
column.
change custom buffer Changes the buffer size for the
threshold, but only affects the custom
column.
apply threshold boundary
changes
cancel threshold boundary
changes
change threshold alarm level Changes between the factory default
change changed alarm Changes the notification method for
change above alarm Changes the notification method for
change below alarm Changes the notification method for
change inBetween alarm Changes the notification method for
apply threshold alarm changes Confirms the changes made to the
cancel threshold alarm
changes
Confirms the changes made to the
threshold information. This must be
done to retain the changes made.
Returns the boundary information to
the last confirmed state.
and custom event settings for the
area.
changed event occurrences for this
method, but only affects the custom
column.
above event occurrences for this
method, but only affects the custom
column.
below event occurrences for this
method, but only affects the custom
column.
inBetween event occurrences for this
method, but only affects the custom
column.
event setting information. This must
be done to retain the changes made.
Returns the event setting information
to the last confirmed state.
The required high threshold, in the units
defined by the area
The required buffer size, in the units
defined by the area
None
None
The required event setting column
The required notification methods
The required notification methods
The required notification methods
The required notification methods
None
None
NOTE
Not all areas allow for the customization of all fields. If you attempt an illegal modification, Fabric
Watch displays an error message. Ensure that all changes to the threshold and event setting areas
of the screen are confirmed before leaving advanced configuration, or the changes are lost.
36 Fabric Watch Administrator’s Guide
53-1000601-02
Page 51

Fabric Watch threshold configuration
3
Configuring advanced settings
To customize Fabric Watch monitoring to suit to your environment, use the advanced configuration
option.
NOTE
The allowed advanced settings are displayed on a per-class basis. Although Port Fencing is displayed
for other areas, such as RX Performance, for which Port Fencing is not supported, you will not be
able to set or apply the changes on such areas.
1. Type 4 at the Select choice => prompt.
The system generates output, which varies based on the class and area you select. In the
Advanced Configuration menu shown here, the output is based on the E-Port class and
RXPerformance area.
See Chapter 1, “Fabric Watch Concepts” for more details about threshold and buffer values.
Index ThresholdName BehaviorType BehaviorInt
216 eportRXPerf216 Triggered 1
217 eportRXPerf217 Triggered 1
218 eportRXPerf218 Triggered 1
219 eportRXPerf219 Triggered 1
220 eportRXPerf220 Triggered 1
221 eportRXPerf221 Triggered 1
222 eportRXPerf222 Triggered 1
223 eportRXPerf223 Triggered 1
Threshold boundary level is setat : Default
DefaultCustom
Unit Percentage(%) Percentage(%)
Time base minuteminute
Low 0 0
High 100 100
BufSize 0 0
Threshold alarmlevel is set at: Default
Errlog-1, SnmpTrap-2, PortLogLock-4
RapiTrap-8, EmailAlert-16, PortFencing-32
Valid alarm matrix is 63
DefaultCustom
Changed 0 0
Below 0 0
Above 0 0
InBetween 0 0
Fabric Watch Administrator’s Guide 37
53-1000601-02
Page 52

Fabric Watch threshold configuration
3
1 : change behavior type 11 : change threshold alarm level
2 : change behavior interval 12 : change changed alarm
3 : change threshold boundary level 13 : change belowalarm
4 : change custom unit 14 : change abovealarm
5 : change custom timebase 15 : change inBetween alarm
6 : change custom low 16 : apply threshold alarm changes
7 : change custom high 17 : cancel threshold alarm changes
8 : change custom buffer 18 : return to previous page
9 : apply threshold boundary changes
10 : cancel threshold boundary changes
Select choice => : (1..18) [18]7
where:
Index A numeric identifier assigned to the element
ThresholdName A string identifier assigned to the element
BehaviorType Frequency of alarm notifications
BehaviorInt The element behavior interval, in seconds
2. Refer to the following system output to customize high threshold boundary for RXPerformance.
The threshold boundary section of the Advanced Configuration menu includes the threshold
information for the selected area. It contains two columns, Default (the default settings
column) and Custom (the custom settings column), and indicates the current setting.
NOTE
Default threshold boundary settings are Fabric OS (FOS) default settings; custom settings are
user-defined.
Fabric Watch displays the units of measurement (Unit), time base (Time base), low threshold
(Low), high threshold (High) and buffer size (BufSize) for each column.
In the following system output, a value of 80% is chosen as the custom high value for
RXPerformance. The default value is 100%.
1 : change behavior type 11 : change threshold alarm level
2 : change behavior interval 12 : change changed alarm
3 : change threshold boundary level 13 : change belowalarm
4 : change custom unit 14 : change abovealarm
5 : change custom timebase 15 : change inBetween alarm
6 : change custom low 16 : apply threshold alarm changes
7 : change custom high 17 : cancel threshold alarm changes
8 : change custom buffer 18 : return to previous page
9 : apply threshold boundary changes
10 : cancel threshold boundary changes
Select choice => : (1..18) [18]7
Enter high threshold =>: (0..100) [100] 80
Index ThresholdName BehaviorType BehaviorInt
216 eportRXPerf216 Triggered 1
217 eportRXPerf217 Triggered 1
218 eportRXPerf218 Triggered 1
219 eportRXPerf219 Triggered 1
220 eportRXPerf220 Triggered 1
221 eportRXPerf221 Triggered 1
222 eportRXPerf222 Triggered 1
223 eportRXPerf223 Triggered 1
38 Fabric Watch Administrator’s Guide
53-1000601-02
Page 53

Fabric Watch threshold configuration
Threshold boundary level is setat : Default
DefaultCustom
Unit Percentage(%) Percentage(%)
Time base minuteminute
Low 0 0
High 100 80
BufSize 0 0.
3
3. Type 3 at the Select choice => prompt to change the threshold boundary level, and then type 2
at the Enter boundary level type = > prompt to specify that this is a custom value, as shown in
the following system output.
1 : change behavior type 11 : change threshold alarm level
2 : change behavior interval 12 : change changed alarm
3 : change threshold boundary level 13 : change belowalarm
4 : change custom unit 14 : change abovealarm
5 : change custom timebase 15 : change inBetween alarm
6 : change custom low 16 : apply threshold alarm changes
7 : change custom high 17 : cancel threshold alarm changes
8 : change custom buffer 18 : return to previous page
9 : apply threshold boundary changes
10 : cancel threshold boundary changes
Select choice => : (1..18) [18]3
1 : Default
2 : custom
Enter boundary level type => : (1..2) [1] 2
Index ThresholdName BehaviorType BehaviorInt
216 eportRXPerf216 Triggered 1
217 eportRXPerf217 Triggered 1
218 eportRXPerf218 Triggered 1
219 eportRXPerf219 Triggered 1
220 eportRXPerf220 Triggered 1
221 eportRXPerf221 Triggered 1
222 eportRXPerf222 Triggered 1
223 eportRXPerf223 Triggered 1
Threshold boundary level is set at : Custom.
4. Type 9 at the Select choice => prompt to apply the custom value.
1 : change behavior type 11 : change threshold alarm level
2 : change behavior interval 12 : change changed alarm
3 : change threshold boundary level 13 : change belowalarm
4 : change custom unit 14 : change abovealarm
5 : change custom timebase 15 : change inBetween alarm
6 : change custom low 16 : apply threshold alarm changes
7 : change custom high 17 : cancel threshold alarm changes
8 : change custom buffer 18 : return to previous page
9 : apply threshold boundary changes
10 : cancel threshold boundary changes
Select choice => : (1..18) [18]9.
5. Type 16 at the Select choice => prompt to apply the changes.
Fabric Watch Administrator’s Guide 39
53-1000601-02
Page 54

Fabric Watch threshold configuration
3
6. Use the following commands to switch between custom and default values:
• fwSetToCustom
Sets the boundary and alarm level to custom
• fwSetToDefault
Restores the boundary and alarm level to the default
See Chapter 1, “Fabric Watch Concepts” for details about the event setting table and
notification methods for each of the possible event settings.
For details about advanced configuration menu options, see Table 1 2 on page 35.
Step 5. Alarm configuration
NOTE
The allowed alarm types are displayed on a per-class basis. Although Port Fencing is displayed for
other areas, such as RX Performance, for which Port Fencing is not supported, you will not be able
to set or apply changes on such areas.
Alarms act as a signal or alert that notifies you when a threshold has been crossed. You can
configure the following types of notification settings for Fabric Watch:
• Trigge red
A triggered behavior type signals you once after a threshold has been crossed. Triggered is the
default behavior type signal for all class areas.
• Continuous
A continuous behavior type signals you continuously after a threshold has been crossed.
Changing the alarm for the RXPerformance class
You can change the above alarm for the RXPerformance class. The value is the sum of the alarm
matrix values; for example, PortFencing-32, SnmpTrap-2, and Errlog-1 (32+2+1=35).
1. Add the numbers beside each state that you want to include. The values for the states are:
• Errlog - 1
• SnmpTrap - 2
• PortLogLock - 4
• RapiTrap - 8
• EmailAlert - 16
• PortFencing - 32
2. Enter the total at the prompt.
1 : change behavior type 11 : change threshold alarm level
2 : change behavior interval 12 : change changed alarm
3 : change threshold boundary level 13 : change belowalarm
4 : change custom unit 14 : change abovealarm
5 : change custom timebase 15 : change inBetween alarm
6 : change custom low 16 : apply threshold alarm changes
7 : change custom high 17 : cancel threshold alarm changes
8 : change custom buffer 18 : return to previous page
9 : apply threshold boundary changes
10 : cancel threshold boundary changes
Select choice => : (1..18) [18]14
40 Fabric Watch Administrator’s Guide
53-1000601-02
Page 55

Fabric Watch threshold configuration
Errlog-1, SnmpTrap-2, PortLogLock-4
RapiTrap-8, EmailAlert-16 PortFencing - 32
Valid alarm matrix is 63
Enter above alarm matrix => : (0..63) [0] 35
Index ThresholdName BehaviorType BehaviorInt
216 eportRXPerf216 Triggered 1
217 eportRXPerf217 Triggered 1
218 eportRXPerf218 Triggered 1
219 eportRXPerf219 Triggered 1
220 eportRXPerf220 Triggered 1
221 eportRXPerf221 Triggered 1
222 eportRXPerf222 Triggered 1
223 eportRXPerf223 Triggered 1
Threshold boundary level is setat : Custom
DefaultCustom
Unit Percentage(%) Percentage(%)
Time base minuteminute
Low 0 0
High 100 80
BufSize 0 0
3
Threshold alarmlevel is set at: Default
Errlog-1, SnmpTrap-2, PortLogLock-4
RapiTrap-8, EmailAlert-16
Valid alarm matrix is 31
DefaultCustom
Changed 0 0
Below 0 0
Above 0 19
InBetween 0 0
3. Type 2 at the Select choice => prompt to change the threshold alarm level.
1 : change behavior type 11 : change threshold alarm level
2 : change behavior interval 12 : change changed alarm
3 : change threshold boundary level 13 : change belowalarm
4 : change custom unit 14 : change abovealarm
5 : change custom timebase 15 : change inBetween alarm
6 : change custom low 16 : apply threshold alarm changes
7 : change custom high 17 : cancel threshold alarm changes
8 : change custom buffer 18 : return to previous page
9 : apply threshold boundary changes
10 : cancel threshold boundary changes
Select choice => : (1..18) [18]11
1 : Default
2 : custom
Enter alarm level type => : (1..2) [1] 2
Fabric Watch Administrator’s Guide 41
53-1000601-02
Page 56

Fabric Watch threshold configuration
3
Index ThresholdName BehaviorType BehaviorInt
216 eportRXPerf216 Triggered 1
217 eportRXPerf217 Triggered 1
218 eportRXPerf218 Triggered 1
219 eportRXPerf219 Triggered 1
220 eportRXPerf220 Triggered 1
221 eportRXPerf221 Triggered 1
222 eportRXPerf222 Triggered 1
223 eportRXPerf223 Triggered 1
Threshold boundary level is setat : Custom
DefaultCustom
Unit Percentage(%) Percentage(%)
Time base minuteminute
Low 0 0
High 100 80
BufSize 0 0
Threshold alarmlevel is set at: Custom
.
.
.
4. Type 16 at the Select choice => prompt to apply the threshold alarm level changes. Unless you
apply the value, it does not take effect.
1 : change behavior type 11 : change threshold alarm level
2 : change behavior interval 12 : change changed alarm
3 : change threshold boundary level 13 : change belowalarm
4 : change custom unit 14 : change abovealarm
5 : change custom timebase 15 : change inBetween alarm
6 : change custom low 16 : apply threshold alarm changes
7 : change custom high 17 : cancel threshold alarm changes
8 : change custom buffer 18 : return to previous page
9 : apply threshold boundary changes
10 : cancel threshold boundary changes
Select choice => : (1..18) [18]16
.
.
.
42 Fabric Watch Administrator’s Guide
53-1000601-02
Page 57

Notification configuration
3
Step 6. Disable and enable thresholds by port (optional)
On certain occasions, you might want to disable all port thresholds at once. For example, during an
event such as an upgrade of a device or server, you might elect not to receive error messages for
particular ports. When the upgrade is complete, you can show and enable disabled port
thresholds.
Enabling and disabling thresholds by port
swd77:admin> fwConfigure --disable --port 9
When you are ready to enable the disabled port thresholds, you can first view all previously
disabled ports using the following command:
swd77:admin> fwshow --disable --port
Port Threshold Status
=========================
9 disabled
A port is not considered disabled if one of the port thresholds is still enabled.
To enable all the thresholds for a port, at the command prompt enter:
swd77:admin> fwconfigure --enable --port 9
Notification configuration
You can be notified of an alarm condition through a notification. The tasks for configuring
notifications using Fabric Watch are:
• “Configuring alarm notifications” on page 44
• “SNMP notification configuration” on page 44
• “API notification configuration” on page 44
• “Port Log Lock action configuration” on page 45
• “E-mail notification configuration” on page 45
Fabric Watch Administrator’s Guide 43
53-1000601-02
Page 58

Notification configuration
3
Configuring alarm notifications
When you use alarm notifications, error messages are sent to designated locations such as an
error log, SNMP trap view, or e-mail. With an error log, you can log in to a particular switch to view
the error messages that have been captured for that particular switch. You can parse the log file to
make error message searches quicker and easier.
NOTE
You can enable Port Fencing only if the alarms are enabled using the fsAlarmsFilterSet command.
1. To ensure that notifications appear in the error log, use the following command.
swd77:admin> fwAlarmsFilterSet 1
The 1 option turns on the alarm notification.
2. If you decide not to have notifications sent, use the following command:
swd77:admin> fwAlarmsFilterSet 0
The 0 option turns the alarm notification off.
All alarms are suppressed when alarm notifications are turned off, except for the Environment
class and Resource class.
3. To verify or view your current alarm notifications, use the fwAlarmsFilterShow command.
swd77:admin> fwalarmsfiltershow
FW: Alarms are enabled
SNMP notification configuration
In environments in which you have a high number of messages (for example, hundreds per day)
coming from a variety of switches, you might want to receive them in a single location and view
them using a graphical user interface (GUI). In this type of scenario, SNMP notifications might be
the most efficient notification method. You can avoid having to log on to each switch individually as
you would have to do for error log notifications.
SNMP notifications are configured using snmpConfig, and within Fabric Watch, using alarms.
See “Configuring alarm notifications” on page 44 for details about setting alarms.
For details about SNMP configuration, including traps, see the snmpConfig commands in the
Fabric OS Command Reference and the Fabric OS Administrator’s Guide.
API notification configuration
In the Brocade Fabric OS API, notifications are triggered programatically.
The Brocade Fabric OS API is an application programming interface (API) that provides the method
for any application to access critical information about a Brocade SAN. Using Fabric OS API, an
application can query or control individual switches or the entire fabric. You can also configure API
notifications using the Brocade Fabric OS API.
44 Fabric Watch Administrator’s Guide
53-1000601-02
Page 59

Notification configuration
3
Port Log Lock action configuration
Port Log Lock freezes in time the port log dump output if an event is triggered. See “Configuring
alarm notifications” on page 44 for details about configuring port log lock actions.
See Chapter 1, “Fabric Watch Concepts” for more details about port log lock.
E-mail notification configuration
In environments where it is critical that you are notified about errors quickly, you might want to use
e-mail notifications. With e-mail notifications, you can be notified of serious errors by e-mail or a
pager, so you can react quickly.
Configuring e-mail notifications in a Telnet session
To configure e-mail notifications in a Telnet session, enter the fwMailCfg command at the prompt.
The fwMailcfg menu displays.
1 : Show Mail Configuration Information
2 : Disable Email Alert
3 : Enable Email Alert
4 : Send Test Mail
5 : Set Recipient Mail Address for Email Alert
6 : Relay Host IP Configuration
7 : Quit
Select an item => : (1..7) [7]
The following sections describe how to use the fwMailCfg menu options.
Showing mail configuration information
1. Type 1 in the fwMailCfg menu to view the current e-mail configuration classes.
The Config Show menu displays.
Config Show Menu
____________________________
1 : Environment class
2 : SFP class
3 : Port class
4 : Fabric class
5 : E-Port class
6 : F/FL Port (Optical) class
7 : Alpa Performance Monitor class
8 : End-to-End Performance Monitor class
9 : Filter Performance Monitor class
10 : Security class
11 : Resource class
12 : FRU class
13 : Quit
Select an item => : (1..13) [13]
The Config Show menu lists each class for which you can provide a separate e-mail address.
Fabric Watch Administrator’s Guide 45
53-1000601-02
Page 60

Notification configuration
3
2. Type the number corresponding to the class for which the e-mail configuration should be
displayed.
Fabric Watch displays information such as:
Mail Recipient Information
____________________________________
Email Alert = enabled
Mail Recipient = sysadmin@mycompany.com
The system returns to the main fwMailCfg menu.
Disabling an e-mail alert
1. Type 2 in the fwMailCfg menu to disable e-mail alerts for a specific class.
The Config Show menu displays.
2. Select a class for which Fabric Watch should disable e-mail alerts.
The following confirmation message displays:
Email Alert is disabled!
The system returns to the main fwMailCfg menu.
Enabling an e-mail alert
1. Type 3 in the fwMailCfg menu to enable e-mail alert for a specific class.
The Config Show menu displays.
2. Select a class for which Fabric Watch should enable e-mail alerts.
The following confirmation message displays:
Email Alert is enabled!
If the class does not have an e-mail configuration (there is no e-mail address assigned to the
class), the following error message displays:
Mail configuration for class Environment is not done.
Email Alert is not enabled!
The system returns to the main fwMailCfg menu.
NOTE
To ensure that the mail server address and domain name are configured correctly, use the
dnsConfig command. For more details, see the Fabric OS Command Reference.
46 Fabric Watch Administrator’s Guide
53-1000601-02
Page 61

Notification configuration
3
Sending test mail
1. Type 4 in the fwMailCfg menu to test the mail configuration for a specific class.
The Config Show menu displays.
2. Select a class to test.
If the e-mail configuration for the class is complete, the following confirmation message
displays:
Email has been sent
If the e-mail configuration for the class is not complete, the following error message displays:
Email has not been sent.
Check Mail configuration for Environment class!
The e-mail address specified in the mail configuration receives a test e-mail message.
The system returns to the main fwMailCfg menu.
Setting recipient mail address for e-mail alert
1. Type 5 in the fwMailCfg menu to specify the recipient to whom Fabric Watch should send the
e-mail alert for a class.
The configShow menu displays.
2. Select a class.
The following prompt displays:
Mail To: [NONE]
Enter the e-mail address of the person responsible for the specific class of alerts.
Fabric Watch uses the default value, located between the brackets in the prompt, as the
current e-mail address for the class. A value of NONE indicates that no e-mail address has
been provided.
NOTE
E-mail addresses must not exceed 128 characters.
The system displays a confirmation message and returns to the main fwMailCfg menu.
Relaying host IP configuration
1. Type 6 in the fwMailCfg menu to configure a relay host IP address.
The relay host configuration menu is displayed.
1 Display Relay Host configuration
2 Set Relay Host IP
3 Remove Relay Host configuration
4 Quit
2. Select 2 to set the relay host IP address.
The following message displays:
enter the Relay Host IP:
Fabric Watch Administrator’s Guide 47
53-1000601-02
Page 62

Notification configuration
3
3. Enter the relay host IP address (example: 192.168.39.118).
The following message displays:
Setting 192.168.39.118 as Relay Host..
4. Enter the Domain Name (example: Brocade.com).
Displaying the relay host configuration
1. Type 6 in the fwMailCfg menu to display the relay host configuration menu.
1 Display Relay Host configuration
2 Set Relay Host IP
3 Remove Relay Host configuration
4 Quit
2. Type 1 to display the configuration.
Removing the relay host configuration
1. Type 6 in the fwMailCfg menu to display the relay host configuration menu.
1 Display Relay Host configuration
2 Set Relay Host IP
3 Remove Relay Host configuration
4 Quit
2. Type 3 to remove the configuration.
48 Fabric Watch Administrator’s Guide
53-1000601-02
Page 63

Switch status policy configuration
The switch status policy monitors the overall status of a switch based on several contributing
parameters. The policy parameter values determine how many failed or faulty units of each
contributor are allowed before triggering a status change in the switch from Healthy to Marginal or
Down. While some users find that the default settings suit their needs, others need to configure a
switch status policy because of various conditions, such as unpredictable power outages,
temperature changes, or redundancy requirements.
You can configure your switch status policy to define the health of your switch. Generally speaking,
Fabric Watch defines the health of your switch using the following terms:
• Healthy
- when every contributor is working
- when the contributing parameter is not being tracked
- when the switch status policy parameter is zero
• Marginal
One or more components are triggering a Warning alarm.
• Down
One or more contributors have failed.
Status events are integrated into Brocade Web Tools and Fabric Manager so that if the overall
status of your switch is Healthy, the switch color is green. If the overall switch status is Marginal,
then the switch color is yellow. Finally, if the overall switch status is Down, the switch color is red.
The overall status is calculated based on the most severe status of all contributors.
Switch status policy configuration
3
NOTE
Policy parameters with a value of zero are not considered when calculating the switch status.
See the Web Tools Administrator’s Guide for more details about configuring status events using
Web Tools.
Switch status policy planning
Before entering the switchStatusPolicySet command, plan your switch status policy. How many
fans must fail before you consider a switch Marginal? Look at the needs of your system along with
the factors that affect its monitors.
that affect their health. Note that not all switches use the monitors listed in Table 13.
Tab le 13 lists the monitors in a switch and identifies the factors
Fabric Watch Administrator’s Guide 49
53-1000601-02
Page 64

Switch status policy configuration
3
TABLE 13 Switch status policy monitor health factors
Monitor Health factors
Power Supplies Power supply thresholds detect absent or failed power supplies, and power supplies that are
Temperatures Temperature thresholds, faulty temperature sensors.
Fans Fan thresholds, faulty fans.
WWN Faulty WWN card (applies to modular switches).
CP Switch does not have a redundant CP (applies to modular switches).
Blades Faulty blades (applies to modular switches).
Core Blade Faulty core blade (applies to modular switches).
Flash Flash thresholds.
Marginal Ports Port, E-Port, optical port, and copper port thresholds. Whenever these thresholds are
Faulty Ports Hardware-related port faults.
Missing SFPs Ports that are missing SFP media.
not in the correct slot for redundancy.
When intelligent blades like the FR4-18i are in the 48000 chassis, the 48000 operates in
high power mode, which means that four power supplies are required for redundancy. In
high power mode, Fabric Watch assumes a policy setting of 2,1, meaning that the switch
goes to a Down state if two power supplies fail, and goes to a Marginal state when one
power supply fails. Fabric Watch automatically changes the policy setting to 2,1 when an
FR-18i blade is detected. If the blade is removed, the policy remains set to 2,1.
persistently high, the port is Marginal.
Implementing your switch status policy
After you have planned and defined your switch status policy, implement it with the following
command.
1. Enter the switchStatusPolicySet command to configure each policy.
Each policy has two parameters that can be configured: Marginal and Down.
2. Set the number of units Marginal or Down based on your system requirements for each policy
or parameter.
The following example shows a switch status policy for Temperature:
Bad Temperatures contributing to DOWN status: (0..10) [0] 3
Bad Temperatures contributing to MARGINAL status: (0..10) [0] 1
The following example shows a switch status policy for Fans:
Bad Fans contributing to DOWN status: (0..3) [0] 2
Bad Fans contributing to MARGINAL status: (0..3) [0] 1
Switch status policies are saved in a nonvolatile memory, and therefore are persistent until
changed.
50 Fabric Watch Administrator’s Guide
53-1000601-02
Page 65

Viewing your switch status policy
After you have defined and configured your switch status policy, view it with the following
command:
switchStatusPolicyShow
The policy you defined here determines the output in the Switch Status Policy Report.
See Chapter 4, “Generating Fabric Watch Reports” for more details about the Switch Status Policy
Report.
FRU configuration
The configuration of FRUs is an exception to the procedures described thus far in this chapter.
FRUs are monitored using state values, as opposed to the quantitative values used to monitor the
rest of the fabric. As a result of the qualitative nature of this monitoring, the concept of thresholds
does not apply.
1. Establish a telnet connection with a switch.
2. Log in using administrative privileges.
FRU configuration
3
3. Enter the fwFruCfg command at the command prompt.
The fwFruCfg command displays your current FRU configuration. The types of FRUs are
different for the various platforms.
4. In the prompt that follows your current FRU configuration, you are asked to provide values for
each FRU alarm state and alarm action. To accept the default value for each FRU, press
Return.
After you have configured a FRU alarm state and alarm action, the values apply to all FRUs of
that type. For example, the values specified for a slot FRU will apply to all slots in the enclosure.
swd123:admin> fwfrucfg
The current FRU configuration:
Alarm State Alarm Action
----------------------------------------------------- Slot 31 1
Power Supply 0 0
Fan 0 0
WWN 0 0
Note that the value 0 for a parameter means that it is NOT used
in the calculation
Configurable Alarm States are:
Absent-1, Inserted-2, On-4, Off-8, Faulty-16
Configurable Alarm Actions are:
Errlog-1, E-mail-16
Slot Alarm State: (0..31) [31]
Slot Alarm Action: (0..17) [1]
Power Supply Alarm State: (0..31) [0]
Power Supply Alarm Action: (0..17) [0]
Fan Alarm State: (0..31) [0]
Fabric Watch Administrator’s Guide 51
53-1000601-02
Page 66

Fabric Watch using SNMP configuration
3
Fan Alarm Action: (0..17) [0]
WWN Alarm State: (0..31) [0]
WWN Alarm Action: (0..17) [0]
Fru configuration left unchanged
Specifying triggers for alarms
You can specify triggers for any number of alarm states or alarm actions. The first prompt enables
you to select which FRU states trigger events.
1. Add the numbers beside each state (for the states you want to include).
2. Enter the total at the prompt.
For example, to trigger events using the Absent, Off, and Faulty states, add the assigned values and
enter that value at the prompt. In this case, the values are 1, 8, and 16, respectively, and the total
is 25.
Fabric Watch using SNMP configuration
NOTE
The instructions given in this procedure apply to the AdventNet MIB browser. The procedure might
vary if you use other MIB browsers.
Configuring Fabric Watch using SNMP
1. Open a MIB browser, such as the one shown below.
2. Load the appropriate MIB files. First, load the Brocade common MIB file (BRCD_v5_0.mib),
followed by the Brocade software MIB file (SW_v5_3.mib). If this is successful, the system
displays a screen similar to
Figure 9.
FIGURE 9 Configuring Fabric Watch using SNMP
52 Fabric Watch Administrator’s Guide
53-1000601-02
Page 67

Fabric Watch using SNMP configuration
3
In Figure 9, the MIB browser has populated the left side of the screen with a MIB tree that can
be navigated.
3. Start a telnet session with the switch, and enter the snmpConfig command at the prompt; this
enables you to send Fabric Watch traps to an SNMP management station.
swd77:admin> snmpConfig -set mibcapability
The SNMP Mib/Trap Capability has been set to support
FE-MIB
SW-MIB
FA-MIB
SW-TRAP
FA-TRAP
FA-MIB (yes, y, no, n): [yes]
FICON-MIB (yes, y, no, n): [no]
HA-MIB (yes, y, no, n): [no]
SW-TRAP (yes, y, no, n): [yes] yes
swFCPortScn (yes, y, no, n): [no]
swEventTrap (yes, y, no, n): [no]
swFabricWatchTrap (yes, y, no, n): [no] yes
swTrackChangesTrap (yes, y, no, n): [no]
FA-TRAP (yes, y, no, n): [yes]
connUnitStatusChange (yes, y, no, n): [no]
connUnitEventTrap (yes, y, no, n): [no]
connUnitSensorStatusChange (yes, y, no, n): [no]
connUnitPortStatusChange (yes, y, no, n): [no]
SW-EXTTRAP (yes, y, no, n): [no]
swd77:admin>
4. Enter the snmpConfig command to configure the SNMP management host IP address.
swd77:admin> snmpConfig
Customizing MIB-II system variables ...
At each prompt, do one of the following:
o <Return> to accept current value,
o enter the appropriate new value,
o <Control-D> to skip the rest of configuration, or
o <Control-C> to cancel any change.
To correct any input mistake:
<Backspace> erases the previous character,
<Control-U> erases the whole line,
sysDescr: [Fibre Channel Switch.]
sysLocation: [End User Premise.]
sysContact: [Field Support.]
authTrapsEnabled (true, t, false, f): [false]
SNMP community and trap recipient configuration:
Community (rw): [Secret C0de]
Trap Recipient's IP address in dot notation: [0.0.0.0]
Community (rw): [OrigEquipMfr]
Trap Recipient's IP address in dot notation: [0.0.0.0]
Community (rw): [private]
Trap Recipient's IP address in dot notation: [0.0.0.0]
Community (ro): [public]
Trap Recipient's IP address in dot notation: [0.0.0.0] 1080::8:800:200C:417A
Trap recipient Severity level : (0..5) [0]
Community (ro): [common]
Trap Recipient's IP address in dot notation: [0.0.0.0]
Fabric Watch Administrator’s Guide 53
53-1000601-02
Page 68

Fabric Watch using SNMP configuration
3
Community (ro): [FibreChannel]
Trap Recipient's IP address in dot notation: [0.0.0.0]
SNMP access list configuration:
Access host subnet area in dot notation: [0.0.0.0]
Read/Write? (true, t, false, f): [true]
Access host subnet area in dot notation: [0.0.0.0]
Read/Write? (true, t, false, f): [true]
Access host subnet area in dot notation: [0.0.0.0]
Read/Write? (true, t, false, f): [true]
Access host subnet area in dot notation: [0.0.0.0]
Read/Write? (true, t, false, f): [true]
Access host subnet area in dot notation: [0.0.0.0]
Read/Write? (true, t, false, f): [true]
Access host subnet area in dot notation: [0.0.0.0]
Read/Write? (true, t, false, f): [true]
.
.
.
Committing configuration...done.
swd77:admin>
5. Enter the IP address for the switch in the Host field in the MIB browser. Enter the community
string in the Community field. To perform set operations, enter the write community into the
Write Community field.
6. View and listen for trap details from a MIB browser menu.
NOTE
Any changes related to Fabric Watch, such as changing the status of the Temperature sensor,
will generate traps.
7. Expand the tree on the left to find the Fabric Watch OID information. To find the OID, navigate
the following hierarchy: SW-MIB, bcsi, commDev, fibrechannel, fcSwitch, sw, swFwSystem.
54 Fabric Watch Administrator’s Guide
53-1000601-02
Page 69

Fabric Watch using SNMP configuration
Fabric Watch displays a screen similar to the one shown in Figure 10.
3
FIGURE 10 Example OID tree
8. Obtain the specific identifier for the element that will be modified. To get the identifier, click the
swFwThresholdTable and swFwThresholdEntry directory, and run a get operation on
swFwName. A list of elements appears in which each element is preceded by an identifier.
Remember the numeric portion of the identifier, which appears before the “==>” symbol. You
can scroll through the list to find the numeric identifier for the element in which you are
interested.
Figure 10 shows a sample screen.
Fabric Watch Administrator’s Guide 55
53-1000601-02
Page 70

Fabric Watch using SNMP configuration
3
For detailed descriptions of the SNMP fields in both telnet and Web Tools, see the Fabric OS
MIB Reference.
FIGURE 11 Example swFwName screen
In this example, 83.1 is the numeric identifier for the element referenced as resFlash000.
9. Traverse the fields beneath swFwClassAreaTable and swFwThresholdTable, appending the
numeric identifier from the previous step to each field before performing a get or write
operation. For example, to get and modify information specific to the resFlash000 element,
select one of the fields and append “83.1” in the Object ID field on the right side of the screen.
To modify information, you must define a write community. To modify an entry:
a. Select a field.
b. Append the numeric identifier to the Object ID.
c. Enter the new value into the Set Value field.
d. Select Set from the Operations menu.
56 Fabric Watch Administrator’s Guide
53-1000601-02
Page 71

Chapter
Generating Fabric Watch Reports
In this chapter
•Types of Fabric Watch reports . . . . . . . . . . . . . . . . . . . . . . . . . . . . . . . . . . . . 57
•Viewing Fabric Watch reports using Telnet . . . . . . . . . . . . . . . . . . . . . . . . . . 62
Types of Fabric Watch reports
You can run reporting commands in Fabric Watch to get instant access to switch information.
Although the switchShow command provides basic switch information, the Fabric Watch reports
provide detailed information and enable you to track marginal or faulty ports that can affect
throughput or switch performance.
You can run reports on the command line using a telnet session, or by using Web Tools (if you have
installed a Web Tools license). Both tools generate reports that contain the same information, but
is presented differently. The examples in this chapter use the command line interface.
4
You can generate the following types of reports using Fabric Watch:
• “SAM report,” next
• “Switch health report” on page 59
• “Switch status policy report” on page 60
SAM report
The switch availability monitor (SAM) report lets you see the uptime and downtime for each port. It
also enables you to check if a particular port is failing more often than the others.
NOTE
SAM report details do not display the health status of GbE ports. Fabric Watch only monitors and
reports the status for physical and virtual FC ports.
Typ e the fwSamShow command to generate a SAM report. The following is an example of a SAM
report.
Fabric Manager Administrator’s Guide 57
53-1000601-02
Page 72

Types of Fabric Watch reports
4
Example: SAM Report
Total Total Down Total
Port Type Up Time Down Time Occurrence Offline Time
(Percent) (Percent) (Times) (Percent)
=============================================================================
1/0 U 0 0 0 100
1/1 U 0 0 0 100
1/2 U 0 0 0 100
1/3 U 0 0 0 100
1/4 U 0 0 0 100
1/5 U 0 0 0 100
1/6 U 0 0 0 100
1/7 U 0 0 0 100
1/8 U 0 0 0 100
1/9 U 0 0 0 100
1/10 U 0 0 0 100
1/11 U 0 0 0 100
1/12 EX 100 0 0 0
1/13 EX 100 0 0 0
1/14 EX 100 0 0 0
1/15 EX 100 0 0 0
2/0 U 0 0 0 100
2/1 U 0 0 0 100
2/2 U 0 0 0 100
2/3 LB 100 0 0 0
2/4 U 0 0 0 100
2/5 LB 100 0 0 0
2/6 U 0 0 0 100
2/7 U 0 0 0 100
2/8 U 0 0 0 100
2/9 U 0 0 0 100
2/10 T 100 0 0 0
2/11 T 100 0 0 0
2/12 LB 100 0 0 0
2/13 LB 100 0 0 0
2/14 U 0 0 0 100
2/15 LB 100 0 0 0
3/0 T 100 0 0 0
3/1 U 0 0 0 100
3/2 U 0 0 0 100
3/3 U 0 0 0 100
3/4 U 0 0 0 100
3/5 U 0 0 0 100
3/6 U 0 0 0 100
3/7 U 0 0 0 100
3/8 U 0 0 0 100
3/9 U 0 0 0 100
3/10 VE 100 0 0 0
.
.
.
58 Fabric Watch Administrator’s Guide
53-1000601-02
Page 73

Types of Fabric Watch reports
Tab le 14 describes the fields in the SAM report.
TABLE 14 SAM report information
Heading Meaning
Total Up Time (Percent) The percentage of time that the port is active.
Total Down Time (Percent) The percentage of time that the port experiences faults.
Down Occurrence (Count) The number of faults experienced on the port.
Total Offline Time (Percent) The percentage of time that the port is inactive for reasons other than a
fault.
Switch health report
The switch health report lists the following information:
• Current health of each port, based on the currently-configured policy settings.
• High-level state of the switch, the power supplies, fans, and temperature monitor.
• All ports that are in an abnormal state and the current health state of each port.
The switch health report is available even without Fabric Watch, but for licensed Fabric Watch
users, the marginal and faulty ports are included in the report. The following is an example of a
switch health report.
4
NOTE
Switch health report details do not display the health status of GbE ports. Fabric Watch only
monitors and reports the status for physical and virtual FC ports.
Typ e the switchStatusShow command to generate a switch health report.
Example: Switch Health Report
cp0 login: admin
Password:
Sat 240 :admin> switchstatusshow
Switch Health Report Report time: 08/21/2006 05:23:22 PM
Switch Name: Sat 240
IP address: 1080::8:800:200C:417A
SwitchState: HEALTHY
Duration: 01:10
Power supplies monitor HEALTHY
Temperatures monitor HEALTHY
Fans monitor HEALTHY
WWN servers monitor HEALTHY
Standby CP monitor HEALTHY
Standby CP monitor HEALTHY
Core blade monitor HEALTHY
Blades monitor HEALTHY
Flash monitor HEALTHY
Marginal ports monitor HEALTHY
Faulty ports monitor HEALTHY
Missing SFPs monitor HEALTHY
All ports are healthy
The final portion of the report, detailing port health, is not available without a Fabric Watch license.
Fabric Watch Administrator’s Guide 59
53-1000601-02
Page 74

Types of Fabric Watch reports
4
Switch status policy report
The switch status policy report displays the current policy parameter.
The following example of the switchStatusPolicyShow command output is for modular switches
such as the Brocade 48000. For modular switches, the switch status policy report also contains
information on the WWN, Blade, and CP.
For non-modular switches such as the Brocade 4100 and 5000, the WWN, Blade, CP, and core
blade information is not displayed.
Typ e the switchStatusPolicyShow command to generate a switch status policy report.
Example: Switch status policy report
The current overall switch status policy parameters:
Down Marginal
----------------------------------
PowerSupplies 2 1
Temperatures 2 1
Fans 2 1
WWN 0 1
CP 0 1
Blade 0 1
CoreBlade 0 1
Flash 0 1
MarginalPorts 2 1
FaultyPorts 2 1
MissingSFPs 0 0
Port detail report
If the switch health report shows marginal throughput or decreased performance, use the port
detail report to see statistics on each port. The port detail report is a Fabric Watch licensed
product. You can also see port details by health. For example, you can see only healthy ports, only
marginal ports, only faulty ports, or only offline ports.
The following is an example of a port detail report. An “X” in the column for a condition indicates
that the condition has exceeded the threshold.
NOTE
Port detail reports do not display the health status of GbE ports. Fabric Watch only monitors and
reports the status for physical and virtual FC ports.
60 Fabric Watch Administrator’s Guide
53-1000601-02
Page 75

Types of Fabric Watch reports
Example: Port detail report
Port Detail Report Report time: 04/24/2007 03:40:10 AM
Switch Name:geo_hi
IP address:1080::8:800:200C:417A
Port Exception report [by All]
--------Port-Errors------------ -----SFP-Errors---Port# Type State Dur(H:M) LFA LSY LSI PER INW CRC PSC BLP STM SRX STX SCU
SVO
-----------------------------------------------------------------------------
--080 U OFFLINE 062:17 - - - - - - - - - - - - 081 U OFFLINE 062:17 - - - - - - - - - - - - 082 U OFFLINE 062:17 - - - - - - - - - - - - 083 U OFFLINE 062:17 - - - - - - - - - - - - 084 U OFFLINE 062:17 - - - - - - - - - - - - 085 U OFFLINE 062:17 - - - - - - - - - - - - 086 U OFFLINE 062:17 - - - - - - - - - - - - 087 F HEALTHY 062:17 - - - - - - - - - - - - 088 F HEALTHY 062:17 - - - - - - - - - - - - 089 U OFFLINE 062:17 - - - - - - - - - - - - 090 U OFFLINE 062:17 - - - - - - - - - - - - 091 U OFFLINE 062:17 - - - - - - - - - - - - 092 U OFFLINE 062:17 - - - - - - - - - - - - 093 U OFFLINE 062:17 - - - - - - - - - - - - 094 U OFFLINE 062:17 - - - - - - - - - - - - 095 DP OFFLINE 062:17 - - - - - - - - - - - - 208 G HEALTHY 000:00 - - - - - - - - - - - - 209 G HEALTHY 000:00 - - - - - - - - - - - - 210 G HEALTHY 000:00 - - - - - - - - - - - - 211 G HEALTHY 000:00 - - - - - - - - - - - - 212 G HEALTHY 000:00 - - - - - - - - - - - - 213 G HEALTHY 000:00 - - - - - - - - - - - - 214 G HEALTHY 000:00 - - - - - - - - - - - - 215 G HEALTHY 000:00 - - - - - - - - - - - - 216 VE HEALTHY 061:19 - - - - - - - - - - - - 217 VE HEALTHY 061:19 - - - - - - - - - - - - 218 VE HEALTHY 061:19 - - - - - - - - - - - - 219 VE HEALTHY 003:37 - - - - - - - - - - - - 220 VE HEALTHY 002:48 - - - - - - - - - - - - 221 VE HEALTHY 061:19 - - - - - - - - - - - - 222 VE HEALTHY 061:19 - - - - - - - - - - - - 223 VE HEALTHY 061:19 - - - - - - - - - - - - -
4
NOTE
Output of the Port Detail Report depends on the ports that belong to the current Admin Domain
context. If a port does not belong to the current Admin Domain, nothing other than port number is
displayed for that port.
Example:
“000 ----------------Not a member of current Admin Domain-------------------”
Fabric Watch Administrator’s Guide 61
53-1000601-02
Page 76

Viewing Fabric Watch reports using Telnet
4
Tab le 15 lists and describes each item in the port detail report.
TABLE 15 Port detail report columns
Report item Description
LFA Link Loss: the number of link loss occurrences out of range for a specified time period.
LSY Sync Loss: the number of sync loss occurrences out of range for a specified time period.
LSI Signal Loss: the number of signal loss occurrences out of range for a specified time period.
PER Protocol Error: the number of protocol errors out of range for a specified time period.
INW Invalid word. The number of invalid words out of range for a specified time period.
CRC Invalid CRC: the number of CRC errors out of range for a specified time period.
PSC Port hardware state changed too often due to fabric reconfiguration.
BLP Buffer limited port: the switch status changes when a port is in a buffer limited mode based
STM SFP temperature is out of specifications.
SRX SFP receive power is out of specifications.
STX SFP transmit power is out of specifications.
SCU SFP current is out of specifications.
SVO SFP voltage is out of specifications.
on the switch status policy.
Viewing Fabric Watch reports using Telnet
NOTE
You can also view Fabric Watch reports using Web Tools. For details about viewing and generating
Fabric Watch Reports using Web Tools, see the Web Tools Administrator’s Guide.
To view Fabric Watch reports using telnet, start a telnet session and enter the command (from
Tab le 16) corresponding to the report you want to view.
TABLE 16 Telnet commands for viewing Fabric Watch reports
Use the command To view
fwSamShow Port failure rate report
switchStatusShow Switch health report
switchStatusPolicyShow Switch status policy report
fwPortDetailShow
fwPortDetailShow --s h
fwPortDetailShow --s m
fwPortDetailShow --s f
fwPortDetailShow --s o
Port detail report
To view only health ports
To view only marginal ports
To view only faulty ports
To view only offline ports
62 Fabric Watch Administrator’s Guide
53-1000601-02
Page 77

DRAFT: BROCADE CONFIDENTIAL
Appendix
Default Threshold Values
In this appendix
•Overview. . . . . . . . . . . . . . . . . . . . . . . . . . . . . . . . . . . . . . . . . . . . . . . . . . . . . . 63
•Environment class. . . . . . . . . . . . . . . . . . . . . . . . . . . . . . . . . . . . . . . . . . . . . . 64
•Fabric class . . . . . . . . . . . . . . . . . . . . . . . . . . . . . . . . . . . . . . . . . . . . . . . . . . . 66
•Performance Monitor class. . . . . . . . . . . . . . . . . . . . . . . . . . . . . . . . . . . . . . . 67
•Port class . . . . . . . . . . . . . . . . . . . . . . . . . . . . . . . . . . . . . . . . . . . . . . . . . . . . . 68
•Resource class. . . . . . . . . . . . . . . . . . . . . . . . . . . . . . . . . . . . . . . . . . . . . . . . . 72
•Security class. . . . . . . . . . . . . . . . . . . . . . . . . . . . . . . . . . . . . . . . . . . . . . . . . . 72
•SFP class . . . . . . . . . . . . . . . . . . . . . . . . . . . . . . . . . . . . . . . . . . . . . . . . . . . . . 75
Overview
A
This appendix lists Fabric Watch default threshold values for all classes except the FRU class,
which has none.
The tables in the following sections list all of the default values used for the default Fabric Watch
configuration settings when running Fabric OS v6.1.0 on the following Brocade switches:
• Brocade 200E
• Brocade 300
• Brocade 4100
• Brocade 4900
• Brocade 5000
• Brocade 5100
• Brocade 5300
• Brocade 7500
• Brocade 7600
• Brocade 48000
• Brocade DCX
Values for earlier versions of Fabric OS might differ.
Fabric Watch Administrator’s Guide 63
53-1000601-02
Page 78

Environment class
Environment class
Tab le 17 provides default Environment class settings for all switches. Check the appropriate
hardware reference manual for differences in actual environmental requirements.
NOTE
For the Brocade 200E, there is no fan default threshold because the fans are not monitored by
Fabric Watch. You can use the fanShow command to view the Brocade 200E fan status.
TABLE 17 Environment class threshold defaults
Area Description Default threshold settings Default alarm settings Threshold state
DRAFT: BROCADE CONFIDENTIAL
Fan Monitors switch fan
speed in RPMs
Unit: RPM
Time Base: none
Brocade 300
Low: 0
High: 40
Buffer: 10
Brocade 4100
Low: 3000
High: 12000
Buffer: 3
Brocade 4900
Low: 4100
High: 8500
Buffer: 3
Brocade 5000
Low: 3000
High: 12000
Buffer: 3
Brocade 5100
Low: 0
High: 35
Buffer: 10
Brocade 5300
Low: 0
High: 34
Buffer: 10
Brocade 7500
Low: 5000
High: 16000
Buffer: 3
Brocade 7600
Low: 5000
High: 16000
Buffer: 3
Brocade 48000
Low: 1600
High: 3400
Buffer: 3
Brocade DCX
Low: 800
High: 16000
Buffer: 3
Changed: 0
Above: 3
Below: 3
In-Between: 1
Informative
Out_of_range
Out_of_range
In_range
64 Fabric Watch Administrator’s Guide
53-1000601-02
Page 79

DRAFT: BROCADE CONFIDENTIAL
Environment class
TABLE 17 Environment class threshold defaults (Continued)
Area Description Default threshold settings Default alarm settings Threshold state
Power Supply Monitors power supply
condition
Tem pe ra ture Mo ni to rs sw itch
temperature in Celsius
Time Base: none
OK: 1
Faulty: 0
Unit: degrees C
Time Base: none
Brocade 200E
Low: 0
High: 60
Buffer: 10
Brocade 300
Low: 0
High: 40
Buffer: 10
Brocade 4100
Low:0
High: 60
Buffer: 10
Brocade 4900
Low: 0
High: 47
Buffer: 10
Brocade 5000
Low:0
High: 60
Buffer: 10
Brocade 5100
Low: 0
High: 35
Buffer: 10
Brocade 5300
Low: 0
High: 34
Buffer: 10
Brocade 7500
Low: 0
High: 63
Buffer: 10
Brocade 7600
Low: 0
High: 63
Buffer: 10
Brocade 48000
Low: 0
High: 60
Buffer: 10
Brocade DCX
Low: 0
High: 70
Buffer: 10
Changed: 0
Below: 3
Above: 3
In-Between: 0
Changed: 0
Below: 3
Above: 3
In-Between: 3
Informative
Out_of_range
In_range
Informative
Informative
Out_of_range
Out_of_range
In_range
Fabric Watch Administrator’s Guide 65
53-1000601-02
Page 80

Fabric class
Fabric class
DRAFT: BROCADE CONFIDENTIAL
Tab le 18 provides default settings for areas in the Fabric class.
TABLE 18 Fabric class threshold defaults
Area Description Default threshold settings Default alarm
settings
Threshold state
Domain ID
Changes
SFP State Changes Monitors the insertion
Loss of E_Port Monitors E_Port and
Fabric Logins Monitors host device
Fabric
Reconfiguration
Segmentation
Changes
SFP State Changes Monitors SFP state
Zoning Changes Monitors changes to
Monitors forcible
DOMAIN ID changes
and removal of SFPs
VE_Port status
fabric logins
Monitors
configuration changes
Monitors
segmentation
changes
changes
currently enabled
zoning configurations
Unit: D_ID Changes
Time Base: none
Low: 0
High: 0
Buffer: 0
Unit: Changes
Time Base: none
Low: 0
High: 0
Buffer: 0
Unit: Downs
Time Base: none
Low: 0
High: 0
Buffer: 0
Unit: Logins
Time Base: none
Low: 0
High: 0
Buffer: 0
Unit: Reconfigs
Time Base: none
Low: 0
High: 0
Buffer: 0
Unit: Segmentations
Time Base: none
Low: 0
High: 0
Buffer: 0
Unit: Changes
Time Base:
Low: 0
High: 0
Buffer: 0
Unit: Zone changes
Time Base: none
Low: 0
High: 0
Buffer: 0
Changed: 0
Below: 0
Above: 0
In-Between: 0
Changed: 0
Below: 0
Above: 0
In-Between: 0
Changed: 0
Below: 0
Above: 0
In-Between: 0
Changed: 0
Below: 0
Above: 0
In-Between: 0
Changed: 0
Below: 0
Above: 0
In-Between: 0
Changed: 0
Below: 0
Above: 0
In-Between: 0
Changed: 0
Exceeded: 0
Below: 0
Above: 0
In-between: 0
Changed: 0
Below: 0
Above: 0
In-Between: 0
Informative
Informative
Informative
Informative
Informative
Informative
Informative
Informative
Informative
Informative
Informative
Informative
Informative
Informative
Informative
Informative
Informative
Informative
Informative
Informative
Informative
Informative
Informative
Informative
Informative
Informative
Informative
Informative
Informative
Informative
Informative
Informative
Informative
66 Fabric Watch Administrator’s Guide
53-1000601-02
Page 81

DRAFT: BROCADE CONFIDENTIAL
Performance Monitor class
Tab le 19 provides default settings for areas in the AL_PA Performance Monitor class.
TABLE 19 AL_PA Performance Monitor class threshold defaults
Area Description Default threshold settings Default alarm
Performance Monitor class
Threshold state
settings
AL_PA Invalid CRCs Monitors the number of
arbitrated loop physical
address CRC errors
Unit: Errors
Time Base: minute
Low: 0
High: 60
Buffer: 0
Changed: 0
Below: 0
Above: 0
In-Between: 0
Informative
Informative
Out_of_range
In_range
NOTE
End-to-end and AL_PA CRC counters are not supported on the Brocade 200E switch, 4100 switch,
and 48000 director.
Tab le 20 provides default settings for areas in the Customer-Defined Performance Monitor class.
TABLE 20 Customer-defined Performance Monitor class threshold defaults
Area Description Default threshold settings Default alarm
settings
Customer-Defined Filter Monitors the
number of frames
that are filtered
out by the port
Unit: Frames
Time Base: none
Low: 0
High: 0
Buffer: 0
Changed: 0
Below: 0
Above: 0
In-Between: 0
Threshold state
Informative
Informative
Informative
Informative
Tab le 21 provides default settings for areas in the End-to-End Performance Monitor class.
TABLE 21 End-to-end Performance Monitor class threshold defaults
Area Description Default threshold settings Default alarm
settings
Threshold state
End-to-End Invalid CRC
Count
End-to-End Receive
Performance
End-to-End Transmit
Performance
Fabric Watch Administrator’s Guide 67
53-1000601-02
Monitors the number
of CRC errors
between a SID_DID
pair in a port
Monitors the
receiving traffic
between a SID_DID
pair in a port
Monitors the
transmit traffic
between a SID_DID
pair in a port
Unit: Errors
Time Base: minute
Low: 1
High: 10
Buffer: 0
Unit: KBps
Time Base: none
Low: 0
High: 0
Buffer: 0
Unit: KBps
Time Base: none
Low: 0
High: 0
Buffer: 0
Changed: 0
Below: 0
Above: 0
In-Between: 0
Changed: 0
Below: 0
Above: 0
In-Between: 0
Changed: 0
Below: 0
Above: 0
In-Between: 0
Informative
Informative
Out_of_range
In_range
Informative
Informative
Informative
Informative
Informative
Informative
Informative
Informative
Page 82

Port class
Port class
DRAFT: BROCADE CONFIDENTIAL
Tab le 22 provides default settings for areas in the Port class.
TABLE 22 Port class threshold defaults
Area Description Default threshold settings Default alarm settings Threshold state
Invalid CRC Count Monitors the
number of CRC
errors
Invalid Transmission
Word
Link Failure Count Monitors the
Loss of Signal Count Monitors the
Loss of
Synchronization
Count
Primitive Sequence
Protocol Error
Receive Performance Monitors receive
State Changes Monitors state
Tra nsmit
Performance
Monitors the
number of invalid
words transmitted
number of link
failures
number of signal
loss errors
Monitors the
number of loss of
synchronization
errors
Monitors the
number of primitive
sequence errors
rate, by percentage
changes
Monitors
transmission rate,
by percentage
Unit: Errors
Time Base: minute
Low: 0
High: 1000
Buffer: 100
Unit: Errors
Time Base: minute
Low: 0
High: 1000
Buffer: 100
Unit: Errors
Time Base: minute
Low: 0
High: 1000
Buffer: 100
Unit: Errors
Time Base: minute
Low: 0
High: 5
Buffer: 0
Unit: Errors
Time Base: minute
Low: 0
High: 1000
Buffer: 100
Unit: Errors
Time Base: minute
Low: 0
High: 5
Buffer: 0
Unit: Percentage (%)
Time Base: minute
Low: 0
High: 100
Buffer: 0
Unit: Changes
Time Base: minute
Low:0
High: 5
Buffer: 0
Unit: Percentage (%)
Time Base: minute
Low: 0
High: 100
Buffer: 0
Changed: 0
Below: 0
Above: 0
In-Between: 0
Changed: 0
Below: 0
Above: 0
In-Between: 0
Changed: 0
Below: 0
Above: 0
In-Between: 0
Changed: 0
Below: 0
Above: 0
In-Between: 0
Changed: 0
Below: 0
Above: 0
In-Between: 0
Changed: 0
Below: 0
Above: 0
In-Between: 0
Changed: 0
Below: 0
Above: 0
In-Between: 0
Changed: 0
Below: 0
Above: 0
In-Between: 0
Changed: 0
Below: 0
Above: 0
In-Between: 0
Informative
Informative
Out_of_range
In_range
Informative
Informative
Out_of_range
In_range
Informative
Informative
Out_of_range
In_range
Informative
Informative
Out_of_range
In_range
Informative
Informative
Out_of_range
In_range
Informative
Informative
Out_of_range
In_range
Informative
Informative
Informative
Informative
Informative
Informative
Out_of_range
In_range
Informative
Informative
Informative
Informative
68 Fabric Watch Administrator’s Guide
53-1000601-02
Page 83

DRAFT: BROCADE CONFIDENTIAL
Port class
E_Port class
Tab le 23 provides default settings for areas in the E_Port class.
Port fencing can only be enabled or disabled for the following areas for the E_Port class:
• Link Failure Count
• Loss of Synchronization Count
• Primitive Sequence Protocol Error
• Invalid Transmission Word
• Invalid CRC Count
TABLE 23 E_Port class
Area Description Default threshold settings Default alarm settings Threshold state
Invalid CRC Count Monitors the number
of CRC errors
Invalid Transmission
Word
Link Failure Count Monitors the number
Loss of Signal Count Monitors the number
Loss of
Synchronization
Count
Primitive Sequence
Protocol Error
Receive
Performance
Monitors the number
of invalid words
transmitted
of link failures
of signal loss errors
Monitors the number
of loss of
synchronization
errors
Monitors the number
of primitive
sequence errors
Monitors the receive
rate, by percentage
Unit: Errors
Time Base: minute
Low: 0
High: 1000
Buffer: 100
Unit: Errors
Time Base: minute
Low: 0
High: 1000
Buffer: 100
Unit: Errors
Time Base: minute
Low: 0
High: 5
Buffer: 0
Unit: Errors
Time Base: minute
Low: 0
High: 5
Buffer: 0
Unit: Errors
Time Base: minute
Low: 0
High: 5
Buffer: 0
Unit: Errors
Time Base: minute
Low: 0
High: 5
Buffer: 0
Unit: Percentage (%)
Time Base: minute
Low: 0
High: 100
Buffer: 0
Changed: 0
Below: 0
Above: 0
In-Between: 0
Changed: 0
Below: 0
Above: 0
In-Between: 0
Changed: 0
Below: 0
Above: 0
In-Between: 0
Changed: 0
Below: 0
Above: 0
In-Between: 0
Changed: 0
Below: 0
Above: 0
In-Between: 0
Changed: 0
Below: 0
Above: 0
In-Between: 0
Changed: 0
Below: 0
Above: 0
In-Between: 0
Informative
Informative
Out_of_range
In_range
Informative
Informative
Out_of_range
In_range
Informative
Informative
Out_of_range
In_range
Informative
Informative
Out_of_range
In_range
Informative
Informative
Out_of_range
In_range
Informative
Informative
Out_of_range
In_range
Informative
Informative
Informative
Informative
Fabric Watch Administrator’s Guide 69
53-1000601-02
Page 84

Port class
DRAFT: BROCADE CONFIDENTIAL
TABLE 23 E_Port class (Continued)
Area Description Default threshold settings Default alarm settings Threshold state
State Changes Monitors state
changes
Tra nsmit
Performance
Utilization (VE_port) Monitors utilization
Packet Loss
(VE_port)
Monitors the
transmit rate, by
percentage
of VE-ports by
percentage
Monitors total packet
loss by percentage
Unit: Changes
Time Base: minute
Low: 0
High: 5
Buffer: 0
Unit: Percentage (%)
Time Base: minute
Low: 0
High: 100
Buffer: 0
Unit: Percentage (%)
Time Base: minute
Low: 0
High: 100
Buffer: 0
Unit: Percentage (%)
Time Base: minute
Low: 0
High: 100
Buffer: 0
Changed: 0
Below: 0
Above: 0
In-Between: 0
Changed: 0
Below: 0
Above: 0
In-Between: 0
Changed: 0
Below: 0
Above: 0
In-Between: 0
Changed: 0
Below: 0
Above: 0
In-Between: 0
F/FL_Port class
Tab le 24 provides default settings for areas in the F/FL_Port class.
Informative
Informative
Out_of_range
In_range
Informative
Informative
Informative
Informative
Informative
Informative
Informative
Informative
Informative
Informative
Informative
Informative
Port fencing can only be enabled or disabled for the following areas for the F/FL_Port class:
• Link Failure Count
• Loss of Synchronization Count
• Primitive Sequence Protocol Error
• Invalid Transmission Word
• Invalid CRC Count
70 Fabric Watch Administrator’s Guide
53-1000601-02
Page 85

DRAFT: BROCADE CONFIDENTIAL
TABLE 24 F/FL_Port class threshold defaults
Area Description Default threshold
settings
Port class
Default alarm settings Threshold state
Loss of
Synchronization
Count
Receive
Performance
State Changes Monitors state
Tra nsmit
Performance
Invalid CRC Count Monitors the
Invalid Transmission
Word
Link Failure Count Monitors the
Loss of Signal Count Monitors the
Primitive Sequence
Protocol Error
Monitors the
number of loss of
synchronization
errors
Monitors the receive
rate, by percentage
changes
Monitors the
transmit rate, by
percentage
number of CRC
errors
Monitors the
number of invalid
words transmitted
number of link
failures
number of signal
loss errors
Monitors the
number of primitive
sequence errors
Unit: Errors
Time Base: minute
Low: 0
High: 5
Buffer: 0
Unit: Percentage (%)
Time Base: minute
Low: 0
High: 100
Buffer: 0
Unit: Changes
Time Base: minute
Low: 0
High: 5
Buffer: 0
Unit: Percentage (%)
Time Base: minute
Low: 0
High: 100
Buffer: 0
Unit: Errors
Time Base: minute
Low: 0
High: 1000
Buffer: 100
Unit: Errors
Time Base: minute
Low: 0
High: 1000
Buffer: 100
Unit: Errors
Time Base: minute
Low: 0
High: 5
Buffer: 0
Unit: Errors
Time Base: minute
Low: 0
High: 5
Buffer: 0
Unit: Errors
Time Base: minute
Low: 0
High: 5
Buffer: 0
Changed: 0
Below: 0
Above: 0
In-Between: 0
Changed: 0
Below: 0
Above: 0
In-Between: 0
Changed: 0
Below: 0
Above: 0
In-Between: 0
Changed: 0
Below: 0
Above: 0
In-Between: 0
Changed: 0
Below: 0
Above: 0
In-Between: 0
Changed: 0
Below: 0
Above: 0
In-Between: 0
Changed: 0
Below: 0
Above: 0
In-Between: 0
Changed: 0
Below: 0
Above: 0
In-Between: 0
Changed: 0
Below: 0
Above: 0
In-Between: 0
Informative
Informative
Out_of_range
In_range
Informative
Informative
Informative
Informative
Informative
Informative
Informative
Out_of_range
In_range
Informative
Informative
Informative
Informative
Informative
Informative
Informative
Out_of_range
In_range
Informative
Informative
Out_of_range
In_range
Informative
Informative
Out_of_range
In_range
Informative
Informative
Out_of_range
In_range
Informative
Informative
Out_of_range
In_range
Fabric Watch Administrator’s Guide 71
53-1000601-02
Page 86

Resource class
Resource class
Tab le 25 provides default settings for areas in the Resource class.
TABLE 25 Resource class threshold defaults
Area Description Default threshold settings Default alarm settings Threshold state
DRAFT: BROCADE CONFIDENTIAL
Security class
Tab le 26 provides default settings for areas in the Security class.
TABLE 26 Security class threshold defaults
Flash Monitors the
percentage of
compact flash used
Unit: Percentage (%)
Time base: none
Low: 0
High: 85
Buffer: 0
Area Description Default threshold
settings
API Violations Monitors API
violations
DCC Violations Monitors DCC
violations
Front Panel Violations Monitors front panel
violations
HTTP Violations Monitors HTTP
violations
Illegal Commands Monitors illegal
commands
Incompatible Security DBMonitors
incompatible security
databases
Unit: Violations
Time Base: minute
Low: 1
High: 2
Buffer: 0
Unit: Violations
Time Base: minute
Low: 1
High: 4
Buffer: 0
Unit: Violations
Time Base: minute
Low: 1
High: 2
Buffer: 0
Unit: Violations
Time Base: minute
Low: 1
High: 2
Buffer: 0
Unit: Violations
Time Base: minute
Low: 1
High: 2
Buffer: 0
Unit: Violations
Time Base: minute
Low: 1
High: 2
Buffer: 0
Changed: 0
Below: 3
Above: 3
In-Between: 1
Default alarm
settings
Changed: 0
Below: 0
Above: 3
In-Between: 0
Changed: 0
Below: 0
Above: 3
In-Between: 0
Changed: 0
Below: 0
Above: 3
In-Between: 0
Changed: 0
Below: 0
Above: 3
In-Between: 0
Changed: 0
Below: 0
Above: 3
In-Between: 0
Changed: 0
Below: 0
Above: 3
In-Between: 0
Informative
Informative
Out_of_range
In_range
Threshold state
Informative
Informative
Out_of_range
In_range
Informative
Informative
Out_of_range
In_range
Informative
Informative
Out_of_range
In_range
Informative
Informative
Out_of_range
In_range
Informative
Informative
Out_of_range
In_range
Informative
Informative
Out_of_range
In_range
72 Fabric Watch Administrator’s Guide
53-1000601-02
Page 87

DRAFT: BROCADE CONFIDENTIAL
TABLE 26 Security class threshold defaults (Continued)
Area Description Default threshold
settings
Security class
Default alarm
settings
Threshold state
Invalid Certificates Monitors invalid
certificates
Invalid Signatures Monitors invalid
signatures
Invalid Timestamp Monitors invalid
timestamps
Login Violations Monitors login
violations
MS Violations Monitors MS
violations
No FCS Violations Monitors No FCS
violations
RSNMP Violations Monitors RSNMP
violations
SCC Violations Monitors SCC
violations
Serial Violations Monitors serial
violations
SES Violations Monitors SES
violations
Unit: Violations
Time Base: minute
Low: 1
High: 2
Buffer: 0
Unit: Violations
Time Base: minute
Low: 1
High: 2
Buffer: 0
Unit: Violations
Time Base: minute
Low: 1
High: 2
Buffer: 0
Unit: Violations
Time Base: minute
Low: 1
High: 2
Buffer: 0
Unit: Violations
Time Base: minute
Low: 1
High: 2
Buffer: 0
Unit: Violations
Time Base: minute
Low: 1
High: 2
Buffer: 0
Unit: Violations
Time Base: minute
Low: 1
High: 2
Buffer: 0
Unit: Violations
Time Base: minute
Low: 1
High: 2
Buffer: 0
Unit: Violations
Time Base: minute
Low: 1
High: 2
Buffer: 0
Unit: Violations
Time Base: minute
Low: 1
High: 2
Buffer: 0
Changed: 0
Below: 0
Above: 3
In-Between: 0
Changed: 0
Below: 0
Above: 3
In-Between: 0
Changed: 0
Below: 0
Above: 3
In-Between: 0
Changed: 0
Below: 0
Above: 3
In-Between: 0
Changed: 0
Below: 0
Above: 3
In-Between: 0
Changed: 0
Below: 0
Above: 3
In-Between: 0
Changed: 0
Below: 0
Above: 3
In-Between: 0
Changed: 0
Below: 0
Above: 3
In-Between: 0
Changed: 0
Below: 0
Above: 3
In-Between: 0
Changed: 0
Below: 0
Above: 3
In-Between: 0
Informative
Informative
Out_of_range
In_range
Informative
Informative
Out_of_range
In_range
Informative
Informative
Out_of_range
In_range
Informative
Informative
Out_of_range
In_range
Informative
Informative
Out_of_range
In_range
Informative
Informative
Out_of_range
In_range
Informative
Informative
Out_of_range
In_range
Informative
Informative
Out_of_range
In_range
Informative
Informative
Out_of_range
In_range
Informative
Informative
Out_of_range
In_range
Fabric Watch Administrator’s Guide 73
53-1000601-02
Page 88

Security class
DRAFT: BROCADE CONFIDENTIAL
TABLE 26 Security class threshold defaults (Continued)
Area Description Default threshold
settings
Default alarm
settings
Threshold state
SLAP Bad Packets Monitors SLAP bad
packets
SLAP Failures Monitors SLAP
failures
Telnet Violations Monitors telnet
violations
TS Out of Sync Monitors instances in
which the timestamp
is out of sync
WSNMP Violations Monitors WSNMP
violations
Unit: Violations
Time Base: minute
Low: 1
High: 2
Buffer: 0
Unit: Violations
Time Base: minute
Low: 1
High: 2
Buffer: 0
Unit: Violations
Time Base: minute
Low: 1
High: 2
Buffer: 0
Unit: Violations
Time Base: minute
Low: 1
High: 2
Buffer: 0
Unit: Violations
Time Base: minute
Low: 1
High: 2
Buffer: 0
Changed: 0
Below: 0
Above: 3
In-Between: 0
Changed: 0
Below: 0
Above: 3
In-Between: 0
Changed: 0
Below: 0
Above: 3
In-Between: 0
Changed: 0
Below: 0
Above: 3
In-Between: 0
Changed: 0
Below: 0
Above: 3
In-Between: 0
Informative
Informative
Out_of_range
In_range
Informative
Informative
Out_of_range
In_range
Informative
Informative
Out_of_range
In_range
Informative
Informative
Out_of_range
In_range
Informative
Informative
Out_of_range
In_range
74 Fabric Watch Administrator’s Guide
53-1000601-02
Page 89

SFP class
DRAFT: BROCADE CONFIDENTIAL
SFP class
Tab le 27 provides default settings for areas in the SFP class.
NOTE
SFPs connected to GbE ports are not monitored.
TABLE 27 SFP class threshold defaults
Area Description Default threshold settings Default alarm settings Threshold state
Current Monitors SFP current Unit: mA
Time Base: none
Low: 0
High: 50
Buffer: 1
Receive Power Monitors receive
power in µWatts
Supply Voltage Monitors SFP
electrical force in volts
Temperature Monitors SFP
Tem perature
Transmit Power Monitors transmit
power in µWatts
Unit: µWatts
Time Base: none
Low: 0
High: 5000
Buffer: 25
Unit: mV
Time Base: none
Low: 3150
High: 3600
Buffer: 10
Unit: Degrees C
Time Base: none
Low: -10
High: 85
Buffer: 3
Unit: µWatts
Time Base: none
Low: 0
High: 5000
Buffer: 25
Changed: 0
Below: 1
Above: 1
In-Between: 0
Changed: 0
Below: 1
Above: 1
In-Between: 0
Changed: 0
Below: 1
Above: 1
In-Between: 0
Changed: 0
Below: 1
Above: 1
In-Between: 1
Changed: 0
Below: 1
Above: 1
In-Between: 0
Informative
Out_of_range
Out_of_range
Informative
Informative
Out_of_range
Out_of_range
Informative
Informative
Out_of_range
Out_of_range
Informative
Informative
Out_of_range
Out_of_range
Normal
Informative
Out_of_range
Out_of_range
Normal
Fabric Watch Administrator’s Guide 75
53-1000601-02
Page 90

SFP class
DRAFT: BROCADE CONFIDENTIAL
76 Fabric Watch Administrator’s Guide
53-1000601-02
Page 91

DRAFT: BROCADE CONFIDENTIAL
Appendix
Basic Fabric Watch Configuration Guidelines
A default Fabric Watch configuration is available for the purpose of saving setup time. As you gain
familiarity with Advanced Fabric Watch features, they can be tailored to suit the fabric environment.
The custom settings available in Fabric Watch provide an advanced user much needed flexibility of
redefining boundary thresholds and alarm notification methods. The basic concept of Fabric Watch
is to monitor the health of an element by sampling the status, comparing the sample data, and if
found outside the threshold limits to notify the user of the event using one or more selected
methods.
Because Fabric Watch monitors a variety of classes and class elements, each element with a
unique trait must be evaluated prior to defining custom thresholds to meet a specific objective.
This section discusses some of the changes that one should consider implementing to improve the
overall efficiency of Fabric Watch.
Customization is recommended to achieve the following objectives:
• Selecting appropriate message delivery method for critical and non–critical events.
• Selecting appropriate thresholds and alarm levels relevant to each class element.
• Defining the appropriate Time Base event triggering based on the class element traits.
• Eliminating message delivery that has little or no practical value to the SAN administrator.
• Consolidating multiple messages generated from a single event.
When Fabric Watch is improperly configured, a large number of error messages can be sent over a
short period of time, making it difficult to find those messages that are actually meaningful. If this
happens, there are a few simple ways to improve the configuration.
B
When a large number of messages are sent that are not of importance, the source of the
messages can be identified from the error message. Examining error messages for the source can
identify those classes which need to be reconfigured.
When the messages are not desired or not of importance, consider the following options for
reconfiguration:
• Recheck the threshold settings. If the current thresholds are not realistic for the class and
area, messages may be sent frequently without need. For example, a high threshold for
temperature monitoring set to less than room temperature is probably incorrectly configured.
• If the event setting is continuous, consider switching to triggered. A continuous event setting
will cause error messages to be sent repeatedly as long as the event conditions are met. While
each message may be meaningful, a high volume of these messages could cause other
important messages to be missed.
• Examine the notification settings. If you are not interested in receiving messages under certain
conditions, ensure that the notification setting for that event is set to zero. For example, you
may not be interested in knowing when the sensed temperature is between your high and low
temperature settings, so setting the InBetween notification setting to zero for this area will
eliminate messages generated in this situation.
Fabric Watch Administrator’s Guide 77
53-1000601-02
Page 92

DRAFT: BROCADE CONFIDENTIAL
Basic Fabric Watch Configuration Guidelines
78 Fabric Watch Administrator’s Guide
53-1000601-02
Page 93

DRAFT: BROCADE CONFIDENTIAL
Appendix
Using Fabric Watch with Configuration Files
In this appendix
•Overview. . . . . . . . . . . . . . . . . . . . . . . . . . . . . . . . . . . . . . . . . . . . . . . . . . . . . . 79
•Configuration files . . . . . . . . . . . . . . . . . . . . . . . . . . . . . . . . . . . . . . . . . . . . . . 79
•Configuring Fabric Watch with a profile . . . . . . . . . . . . . . . . . . . . . . . . . . . . . 80
Overview
When you activate Fabric Watch, the software starts using the default settings described in “Basic
Fabric Watch Configuration Guidelines” on page 77. You cannot alter these default settings; if the
default values do not suit your specific needs, configure Fabric Watch to use more appropriate
settings.
When you configure the new settings for Fabric Watch, your switch stores the settings in the
configuration file. If you change or add settings directly into the configuration file, those settings
become your custom configuration.
C
The following sections discuss the two methods for configuration file usage: configuration files and
profiles.
Configuration files
You can manually edit the configuration file to ensure that the settings meet your needs.
NOTE
Fabric Watch supports non-disruptive configuration download. After downloading the configuration
file, a reboot is not required.
Configuring Fabric Watch with the configuration file
1. Type configUpload to upload your configuration file to your host.
2. Use a text editor to edit the Fabric Watch values for the elements you want to change.
3. Type configDownload to download the updated configuration to your switch.
4. Type fwConfigReload to reload the Fabric Watch configuration.
Fabric Watch Administrator’s Guide 79
53-1000601-02
Page 94

Configuration files
Configuring Fabric Watch with a profile
Brocade provides partial configuration files, or profiles, that help you configure Fabric Watch in a
way that is most appropriate to your particular SAN needs.
1. Upload the configuration file to the host by typing configUpload.
2. Open one of the profiles that appears on the Brocade Web site at
3. Open your configuration file in a text editor.
4. Copy the contents of the profile and append that information to the [Configuration] section of
5. To download your updated configuration to your switch, enter the configDownload command.
DRAFT: BROCADE CONFIDENTIAL
http://www.brocade.com/support/mibs_rsh/index.jsp
the configuration file.
The contents of the profile overwrite any duplicate information earlier in the configuration.
80 Fabric Watch Administrator’s Guide
53-1000601-02
Page 95

DRAFT: BROCADE CONFIDENTIAL
Appendix
Port fencing types
Tab le 28 lists and describes the set of port fencing types that are available in M-EOS and FOS 6.1.
TABLE 28 Port fencing types
Fencing Type Violation Subtype Description Firmware Class / Area FOS Support
Security Port Binding The login server detects a
Port Binding violation when
an attached device
attempts to FLOGI with a
port name WWN that does
not match the WWN in the
Port Binding configuration
for that F_Port.
Security Switch Binding The login server detects a
Switch Binding violation
when an attached device
attempts to FLOGI with a
port name that is not
contained in the Switch
Membership list.
Security Authentication Authentication violations
are detected by the
Authentication Services
subsystem (the Radius
feature) during an
authentication protocol
session initiated
immediately after an E_Port
or F_Port login.
Security N_Port connection Not
Allowed
Link Level (hot I/O) Link Transition Threshold
Exceeded
Protocol ISL Fencing An E_Port is bouncing due
When a device attempts to
log into a port not
configured for N_Port
support, the Login server
detects an N_Port
Connection Not Allowed
violation.
Repeated link transitions
between Active and Inactive
state caused by bad cables,
driver defects, and
hardware device protocol
errors.
to a loss of light/signal link
bouncing.
Security/DCC
violations
Security/DCC
violations
Security/SLAP failures DH-CHAP / FCA P port wil l be
Not supported FOS has locked L_Port,
Port/Link Loss Implemented in FOS 6.1.
E_Port/Link loss Implemented in FOS 6.1
DCC check disables the
port on failure, so no
additional port fencing is
required.
DCC check disables the
port on failure, so no
additional port fencing is
required.
segmented/disabled on
Auth failures, so no
additional port fencing is
required.
disabled E_Port, and locked
G_Port. These do not fall in
“Not configured for N_Port”
category.
D
Fabric Watch Administrator’s Guide 81
53-1000601-02
Page 96

DRAFT: BROCADE CONFIDENTIAL
Port fencing types
TABLE 28 Port fencing types
Fencing Type Violation Subtype Description Firmware Class / Area FOS Support
Protocol ISL Segmentation An E_Port has segmented,
exceeding the threshold
limit.
Security ISL Security Error The attached switch
previously placed in the
Invalid Attachment state
has persisted in consuming
switch resources and has
violated the threshold limit
of ISL Security Errors.
Protocol ISL Protocol Error The attached switch
previously placed in the
Invalid Attachment state
has persisted in consuming
switch resources and has
violated the threshold
number of ISL Protocol
Errors.
Security Fabric Binding Violation The attached device
previously placed in the
Invalid Attachment state
has persisted in consuming
switch resources and has
violated the threshold
number of Fabric Binding
violations.
Protocol FLOGI Repeated failed login
attempts.
This is similar to
Authentication
subtype.
E_Port/Protocol Error Implemented in FOS 6.1
Security/SCC
Violations
Not supported. FLOGI reject count per port
SCC check disables or
segments the port, so no
action is required.
is not available in FOS.
82 Fabric Watch Administrator’s Guide
53-1000601-02
Page 97

Index
A
above event triggers, 17
activating
with telnet, 25
activating Fabric Watch, 25, 25–??
advanced configuration
options, 35
alarms
configuring, 40
continuous, 2, 11, 40
notifications, 44
triggered, 2, 11, 40
areas, 5
assigning notification methods, 23
audit messages, 24
B
below event trigger, 17
buffer values, 13
commands
configdownload, 79
configupload, 79
fwclassinit, 26
fwconfigreload, 79
fwconfigure, 26
fwfrucfg, 26
fwmailcfg, 26
configdownload, 79
configupload, 79
configuration file
capabilities, 28
configuring events, 11
continuous event behavior, 11
D
data values, 12
default threshold values, 63
default values, ??–75
E
C
changed event trigger, 18
class
environment, 4
fabric, 4
FRU, 4
Performace Monitor, 4
port, 5
resource, 5
security, 5
SFP, 5
classes, 4
examples of, 4
subclasses, 4
Fabric Watch Administrator’s Guide 83
53-1000601-02
elements, 10
email alert, 23
environment class areas, 5
event behavior types, 11
event log
entry, 2
event settings, 16
F
fabric class areas, 6
Fabric Watch
activation, 25
Fabric Watch components, 1
fencing, port types, 81
FRU class areas, 6
Page 98

fsconfigure, 26
fwclassinit, 26
fwconfigreload, 79
fwfrusfg, 26
fwmailcfg, 26
H
port persistence, 20
R
RapiTrap, 22
resource class area, 8
high and low thresholds, 12
I
in-between triggers, 18
installing Fabric Watch, 1
interface types, 26
L
licenseAdd, 25
licenseShow, 25
M
messages
audit, 24
MIBS, 80
N
notification methods, 21
notifications
API, 44
email, 45
methods, 1
SNMP, 44
P
S
security class areas, 8
setting time base to none, 14
SFP class areas, 9
SNMP, 2
capabilities, 27
SNMP trap, 22
specifying a time base, 14
switch event (error) log entry, 22
switch policies, 24
switch status
down, 49
healthy, 49
marginal, 49
switch status policy, 49
T
Table, 7, 8
telnet
capabilities, 26
threshold
values, 63
threshold values, 12
thresholds
configuring, 33
disable by port, 43
disabling, 34
enable by port, 43
enabling, 34
time bases, 14
triggered event behavior, 11
performance monitor class areas, 7
port class areas, 7
port fencing
types, 81
port log lock, 22, 45
84 Fabric Watch Administrator’s Guide
U
user interfaces, 26
53-1000601-02
Page 99

using Fabric Watch
configuration file, 79
V
values, default, 63
Fabric Watch Administrator’s Guide 85
53-1000601-02
Page 100

86 Fabric Watch Administrator’s Guide
53-1000601-02
 Loading...