

Brocade Fabric Watch User Manual

53-1003142-01
27 June 2014
Fabric Watch
Administrators Guide
Supporting Fabric OS v7.3.0

©
2014, Brocade Communications Systems, Inc. All Rights Reserved.
Brocade, the B-wing symbol, Brocade Assurance, ADX, AnyIO, DCX, Fabric OS, FastIron, HyperEdge, ICX, MLX, MyBrocade, NetIron,
OpenScript, VCS, VDX, and Vyatta are registered trademarks, and The Effortless Network and the On-Demand Data Center are trademarks
of Brocade Communications Systems, Inc., in the United States and in other countries. Other brands and product names mentioned may be
trademarks of others.
Notice: This document is for informational purposes only and does not set forth any warranty, expressed or implied, concerning any
equipment, equipment feature, or service offered or to be offered by Brocade. Brocade reserves the right to make changes to this document
at any time, without notice, and assumes no responsibility for its use. This informational document describes features that may not be
currently available. Contact a Brocade sales office for information on feature and product availability. Export of technical data contained in
this document may require an export license from the United States government.
The authors and Brocade Communications Systems, Inc. assume no liability or responsibility to any person or entity with respect to the
accuracy of this document or any loss, cost, liability, or damages arising from the information contained herein or the computer programs that
accompany it.
The product described by this document may contain open source software covered by the GNU General Public License or other open
source license agreements. To find out which open source software is included in Brocade products, view the licensing terms applicable to
the open source software, and obtain a copy of the programming source code, please visit http://www.brocade.com/support/oscd.

Contents
Preface.....................................................................................................................................7
Document conventions......................................................................................7
Text formatting conventions.................................................................. 7
Command syntax conventions.............................................................. 7
Notes, cautions, and warnings.............................................................. 8
Brocade resources............................................................................................ 9
Contacting Brocade Technical Support.............................................................9
Document feedback........................................................................................ 10
About This Document.............................................................................................................. 11
Supported hardware and software.................................................................. 11
What's new in this document...........................................................................11
Fabric Watch...........................................................................................................................13
Fabric health................................................................................................... 13
Fabric Watch overview....................................................................................13
Role-based access control..............................................................................14
Fabric Watch licensing.................................................................................... 14
Reasons to customize Fabric Watch settings................................................. 14
Event behavior configuration...............................................................14
Alert configuration............................................................................... 15
Time base configuration......................................................................15
Threshold and action configuration..................................................... 15
Monitoring........................................................................................... 15
Post-processing of messages............................................................. 16
Class, area, and element hierarchy................................................................ 16
Switch monitoring components....................................................................... 16
Fabric events monitoring.....................................................................16
Performance monitoring......................................................................16
Security monitoring............................................................................. 17
SFP monitoring................................................................................... 17
Port monitoring....................................................................................17
System resource monitoring............................................................... 18
Switch policies.....................................................................................18
Logical switch support.....................................................................................19
Threshold monitoring using SNMP tables.......................................................19
MIB capability configuration parameters............................................. 19
Fabric Watch event settings............................................................................20
Fabric Watch notification types....................................................................... 20
E-mail alerts........................................................................................ 20
SNMP traps.........................................................................................20
RASLog for switch events................................................................... 21
Locked port log....................................................................................21
Fabric Watch audit messages.........................................................................21
Data values..................................................................................................... 22
Fabric Watch support in Access Gateway mode............................................ 22
Fabric Watch Administrators Guide
53-1003142-01
3

Fabric Watch Thresholds....................................................................................................... 25
Threshold values...........................................................................................25
In-between buffer values...................................................................25
Threshold triggers......................................................................................... 26
Above event trigger...........................................................................26
Below event trigger........................................................................... 27
Audit and RASLog messages........................................................... 27
Time bases....................................................................................................27
Time base set to none.......................................................................27
Time base set to other than none..................................................... 28
Fabric Watch alarm behavior........................................................................ 29
Fabric Watch Threshold Components.....................................................................................31
Fabric Watch classes, areas, and elements................................................. 31
Classes............................................................................................. 31
Class areas....................................................................................... 31
Elements........................................................................................... 32
Fabric Watch Activation.........................................................................................................35
Interfaces for activating Fabric Watch...........................................................35
Activating Fabric Watch using a Telnet session........................................... 35
Activating Fabric Watch using SNMP........................................................... 36
Activating Fabric Watch using Web Tools.....................................................38
Fabric Watch Configuration...................................................................................................41
Fabric Watch configuration tasks..................................................................41
Setting Fabric Watch custom and default values..........................................43
E-mail notification configuration.................................................................... 43
Showing e-mail configuration information......................................... 43
Disabling an e-mail alert....................................................................44
Enabling an e-mail alert.................................................................... 44
Sending a test e-mail message.........................................................44
Setting the recipient e-mail address for an e-mail alert.....................45
Setting the relay host IP address...................................................... 45
Displaying the relay host configuration............................................. 45
Removing the relay host configuration..............................................45
Notification configuration...............................................................................46
Configuring alarm notifications..........................................................46
Fabric, Security, SFP, and Performance Monitoring................................................................47
Fabric monitoring guidelines and default settings.........................................47
Fabric class areas.............................................................................47
Fabric monitoring setting guidelines..................................................48
Fabric class default settings..............................................................48
Security monitoring guidelines and default settings......................................50
Security class areas..........................................................................50
Security monitoring default settings.................................................. 50
SFP monitoring guidelines and default settings............................................52
SFP class areas................................................................................53
SFP monitoring default settings........................................................ 53
Performance monitoring guidelines and default settings.............................. 54
4
Fabric Watch Administrators Guide
53-1003142-01

Performance Monitor class areas....................................................... 55
Performance monitoring setting guidelines......................................... 55
Performance Monitor class default settings........................................ 55
thConfig command.......................................................................................... 56
thConfig command examples..............................................................57
16 Gbps SFP and QSFP monitoring................................................... 58
Recommended settings for Fabric, SFP, Performance, and Security
classes.......................................................................................................62
Port Monitoring.......................................................................................................................65
Port class areas.............................................................................................. 65
Port class guidelines and default settings....................................................... 66
Physical port setting guidelines...........................................................67
Port class default settings................................................................... 67
Port configuration............................................................................................ 69
Custom port settings........................................................................... 69
Using the nosave command................................................................69
portThConfig command procedures................................................................69
Port type: physical port........................................................................70
E_Port subclass setting guidelines..................................................... 71
E_Port class default settings...............................................................72
FOP_Port and FCU_Port subclass setting guidelines........................ 74
FOP_Port and FCU_Port subclass default settings............................ 75
VE_Port class default settings............................................................ 78
Port type: E_Port, FOP_Port, or FCU_Port.........................................79
Setting the port persistence time.........................................................79
Port fencing .................................................................................................... 79
Port fencing configuration .................................................................. 80
Port fencing configuration using BNA................................................. 82
Port health and CRC monitoring..................................................................... 83
Recommended port configuration settings......................................................83
System Monitoring..................................................................................................................87
Environment monitoring.................................................................................. 87
Environment class area.......................................................................87
Environment monitoring setting guidelines......................................... 87
Environment class default settings......................................................87
Resource class settings.................................................................................. 88
Resource class area........................................................................... 88
Resource class default settings.......................................................... 89
System monitoring using the sysMonitor command........................................89
Using the nosave command................................................................90
Examples of the sysMonitor command............................................... 90
Recommended environment and resource monitoring settings......................92
Switch monitoring............................................................................................92
Switch status policy planning.............................................................. 93
FRU monitoring............................................................................................... 95
FRU class areas..................................................................................95
Configuring FRUs................................................................................95
Specifying triggers for FRU alarms..................................................... 96
Recommended FRU settings.............................................................. 97
Fabric Watch Configuration Using Web Tools........................................................................... 99
Using Web Tools to configure Fabric Watch...................................................99
Opening the Fabric Watch window..................................................... 99
Fabric Watch Administrators Guide
53-1003142-01
5

System monitoring using Web Tools...............................................100
Fabric Watch threshold configuration using Web Tools..............................101
Configuring threshold traits............................................................. 101
Configuring threshold alarms.......................................................... 102
Enabling or disabling threshold alarms for individual elements...... 102
Configuring alarms for FRUs using Web Tools...........................................103
Configuring alarm filters using Web Tools.................................................. 104
Fabric Watch alarm information.................................................................. 104
Viewing an alarm configuration report............................................ 104
Displaying alarms............................................................................104
E-mail notification using Web Tools............................................................105
Configuring the e-mail server on a switch.......................................105
Enabling the e-mail alert ................................................................ 106
Disabling the e-mail alert.................................................................106
Fabric Watch Reports..........................................................................................................107
Fabric Watch reports ..................................................................................107
Switch Availability Monitor report................................................................ 108
Generating a Switch Availability Monitor report.............................. 108
Switch Health report....................................................................................108
Generating a Switch Health report..................................................109
Switch Status Policy report......................................................................... 109
Generating a Switch Status Policy report........................................109
Port Detail report.........................................................................................110
Generating a Port Detail report....................................................... 110
Index..................................................................................................................................113
6
Fabric Watch Administrators Guide
53-1003142-01

Preface
● Document conventions......................................................................................................7
● Brocade resources............................................................................................................ 9
● Contacting Brocade Technical Support.............................................................................9
● Document feedback........................................................................................................ 10
Document conventions
The document conventions describe text formatting conventions, command syntax conventions, and
important notice formats used in Brocade technical documentation.
Text formatting conventions
Text formatting conventions such as boldface, italic, or Courier font may be used in the flow of the text
to highlight specific words or phrases.
Format
bold text
italic text
Courier font
Description
Identifies command names
Identifies keywords and operands
Identifies the names of user-manipulated GUI elements
Identifies text to enter at the GUI
Identifies emphasis
Identifies variables and modifiers
Identifies paths and Internet addresses
Identifies document titles
Identifies CLI output
Identifies command syntax examples
Command syntax conventions
Bold and italic text identify command syntax components. Delimiters and operators define groupings of
parameters and their logical relationships.
Convention
bold text Identifies command names, keywords, and command options.
italic text Identifies a variable.
Description
Fabric Watch Administrators Guide 7
53-1003142-01
Notes, cautions, and warnings
Convention Description
value In Fibre Channel products, a fixed value provided as input to a command
[ ] Syntax components displayed within square brackets are optional.
option is printed in plain text, for example, --show WWN.
Default responses to system prompts are enclosed in square brackets.
{ x | y | z } A choice of required parameters is enclosed in curly brackets separated by
x | y A vertical bar separates mutually exclusive elements.
< > Nonprinting characters, for example, passwords, are enclosed in angle
...
\
vertical bars. You must select one of the options.
In Fibre Channel products, square brackets may be used instead for this
purpose.
brackets.
Repeat the previous element, for example, member[member...].
Indicates a “soft” line break in command examples. If a backslash separates
two lines of a command input, enter the entire command at the prompt without
the backslash.
Notes, cautions, and warnings
Notes, cautions, and warning statements may be used in this document. They are listed in the order of
increasing severity of potential hazards.
NOTE
A Note provides a tip, guidance, or advice, emphasizes important information, or provides a reference
to related information.
ATTENTION
An Attention statement indicates a stronger note, for example, to alert you when traffic might be
interrupted or the device might reboot.
CAUTION
A Caution statement alerts you to situations that can be potentially hazardous to you or cause
damage to hardware, firmware, software, or data.
DANGER
A Danger statement indicates conditions or situations that can be potentially lethal or
extremely hazardous to you. Safety labels are also attached directly to products to warn of
these conditions or situations.
8 Fabric Watch Administrators Guide
53-1003142-01

Brocade resources
Visit the Brocade website to locate related documentation for your product and additional Brocade
resources.
You can download additional publications supporting your product at www.brocade.com. Select the
Brocade Products tab to locate your product, then click the Brocade product name or image to open the
individual product page. The user manuals are available in the resources module at the bottom of the
page under the Documentation category.
To get up-to-the-minute information on Brocade products and resources, go to MyBrocade. You can
register at no cost to obtain a user ID and password.
Release notes are available on MyBrocade under Product Downloads.
White papers, online demonstrations, and data sheets are available through the Brocade website.
Contacting Brocade Technical Support
Brocade resources
As a Brocade customer, you can contact Brocade Technical Support 24x7 online, by telephone, or by email. Brocade OEM customers contact their OEM/Solutions provider.
Brocade customers
For product support information and the latest information on contacting the Technical Assistance
Center, go to http://www.brocade.com/services-support/index.html.
If you have purchased Brocade product support directly from Brocade, use one of the following methods
to contact the Brocade Technical Assistance Center 24x7.
Online Telephone E-mail
Preferred method of contact for nonurgent issues:
• My Cases through MyBrocade
• Software downloads and licensing
tools
• Knowledge Base
Required for Sev 1-Critical and Sev
2-High issues:
• Continental US: 1-800-752-8061
• Europe, Middle East, Africa, and
Asia Pacific: +800-AT FIBREE
(+800 28 34 27 33)
• For areas unable to access toll
free number: +1-408-333-6061
• Toll-free numbers are available in
many countries.
support@brocade.com
Please include:
• Problem summary
• Serial number
• Installation details
• Environment description
Brocade OEM customers
If you have purchased Brocade product support from a Brocade OEM/Solution Provider, contact your
OEM/Solution Provider for all of your product support needs.
• OEM/Solution Providers are trained and certified by Brocade to support Brocade® products.
• Brocade provides backline support for issues that cannot be resolved by the OEM/Solution Provider.
Fabric Watch Administrators Guide 9
53-1003142-01

Document feedback
• Brocade Supplemental Support augments your existing OEM support contract, providing direct
access to Brocade expertise. For more information, contact Brocade or your OEM.
• For questions regarding service levels and response times, contact your OEM/Solution Provider.
Document feedback
To send feedback and report errors in the documentation you can use the feedback form posted with
the document or you can e-mail the documentation team.
Quality is our first concern at Brocade and we have made every effort to ensure the accuracy and
completeness of this document. However, if you find an error or an omission, or you think that a topic
needs further development, we want to hear from you. You can provide feedback in two ways:
• Through the online feedback form in the HTML documents posted on www.brocade.com.
• By sending your feedback to documentation@brocade.com.
Provide the publication title, part number, and as much detail as possible, including the topic heading
and page number if applicable, as well as your suggestions for improvement.
10 Fabric Watch Administrators Guide
53-1003142-01

About This Document
● Supported hardware and software.................................................................................. 11
● What's new in this document...........................................................................................11
Supported hardware and software
Although many different software and hardware configurations are tested and supported by Brocade
Communications Systems, Inc. for Fabric OS 7.2.0, documenting all possible configurations and
scenarios is beyond the scope of this document.
What's new in this document
• Supported hardware and software on page 11
• No other new content. Bug fixes to the following sections:
• Activating Fabric Watch using a Telnet session on page 35
• Activating Fabric Watch using SNMP on page 36
• E_Port subclass setting guidelines on page 71
• FOP_Port and FCU_Port subclass default settings on page 75
• Recommended port configuration settings on page 83
Fabric Watch Administrators Guide
53-1003142-01
11

What's new in this document
12 Fabric Watch Administrators Guide
53-1003142-01

Fabric Watch
● Fabric health................................................................................................................... 13
● Fabric Watch overview....................................................................................................13
● Role-based access control..............................................................................................14
● Fabric Watch licensing.................................................................................................... 14
● Reasons to customize Fabric Watch settings................................................................. 14
● Class, area, and element hierarchy................................................................................ 16
● Switch monitoring components....................................................................................... 16
● Logical switch support.....................................................................................................19
● Threshold monitoring using SNMP tables.......................................................................19
● Fabric Watch event settings............................................................................................20
● Fabric Watch notification types....................................................................................... 20
● Fabric Watch audit messages.........................................................................................21
● Data values..................................................................................................................... 22
● Fabric Watch support in Access Gateway mode............................................................ 22
Fabric health
Fabric health refers to the capability of the fabric to route data. A healthy fabric enables effective data
transmission between networked devices.
One of the more obvious criteria for fabric health is the condition of the network hardware. A switch or
port failure can prevent data packets from reaching their destination. Network traffic can also influence
fabric health.
If the number of packets routed through a port exceeds the port bandwidth, it causes network delays
and packet loss. Receive (Rx) and Transmit (Tx) performance areas are used to monitor the bandwidth
utilization to help keep traffic flowing to avoid congestion.
Because of the varied factors involved in determining fabric health, Fabric Watch can help you to detect,
identify, and resolve fabric health issues by continuously monitoring possible issues and reporting any
potential concerns. Fabric Watch automatically provides detailed reports on detected issues and helps
you correct failures.
Fabric Watch overview
Fabric Watch is an optional storage area network (SAN) health monitor that allows you to enable each
switch to constantly monitor its SAN fabric for potential faults and automatically alerts you to problems
long before they become costly failures.
Fabric Watch tracks a variety of SAN fabric elements and events. Monitoring fabric-wide events, ports,
and environmental parameters enables early fault detection and isolation as well as performance
measurement. You can configure fabric elements and alert thresholds on an individual-port basis and
you can also easily integrate Fabric Watch with enterprise system management solutions.
Fabric Watch Administrators Guide
53-1003142-01
13

Role-based access control
Fabric Watch provides customizable monitoring thresholds. You can configure Fabric Watch to provide
notification before problems arise, such as reporting when network traffic through a port is
approaching the bandwidth limit. This information enables you to perform pre-emptive network
maintenance, such as trunking or zoning, and avoid potential network failures.
Fabric Watch lets you define how often to measure each switch and fabric element and specify
notification thresholds. Whenever fabric elements exceed these thresholds, Fabric Watch
automatically provides notification using several methods, including e-mail messages, SNMP traps,
and log entries.
Role-based access control
Role-Based Access Control (RBAC) defines the capabilities that a user account has based on the role
the account has been assigned. For each role, there is a set of predefined permissions on the jobs
and tasks that can be performed on a fabric and its associated fabric elements. Fabric OS v6.1.0 and
later use RBAC to determine which commands a user can issue.
Each feature is associated with an RBAC role and you will need to know which role is allowed to run a
command, make modifications to the switch, or view the output of the command. To determine which
RBAC role you need to run a command, review the section "Role-Based Access Control (RBAC)" of
the Fabric OS Administrator’s Guide .
Fabric Watch licensing
Fabric Watch is an optionally licensed feature of Fabric OS. Refer to the Fabric OS Software Licensing
Guide for more information about licensing and how to obtain the Fabric Watch license key.
Reasons to customize Fabric Watch settings
Customization is recommended to achieve the following objectives:
• Selecting one or more event settings
• Selecting an appropriate message delivery method for critical and noncritical events
• Selecting appropriate thresholds and alarm levels relevant to each class element
• Defining the appropriate Time Base event triggering based on the class element traits
• Eliminating message delivery that has little or no practical value to the SAN administrator
• Consolidating multiple messages generated from a single event
Before you begin an implementation, make some decisions surrounding the major configuration tasks:
monitoring and configuring thresholds, actions, events, time bases, and alerts. These tasks are
discussed in the following sections.
Event behavior configuration
You must first use the fwSetToCustom command to switch from default to custom settings, and then
use the advanced configuration options provided with the portThConfig, thConfig, and sysMonitor
commands to configure event behavior, actions, and time bases at the port level.
14 Fabric Watch Administrators Guide
53-1003142-01

Alert configuration
Alert configuration
When Fabric Watch is improperly configured, a large number of error messages can be sent over a
short period of time, making it difficult to find those messages that are actually meaningful. If this
happens, there are a few simple ways to improve the configuration.
When large numbers of unimportant messages are received, examining the source can identify those
classes that need to be reconfigured. To reduce the number of unimportant messages, consider the
following reconfiguration options:
• Recheck the threshold settings. If the current thresholds are not realistic for the class and area,
messages may be sent frequently without need. For example, a high threshold for temperature
monitoring set to less than room temperature is probably incorrectly configured. These messages
could cause other important messages to be missed.
• Examine the notification settings. If you are not interested in receiving messages under certain
conditions, ensure that the notification setting for that event is set to zero.
Brocade recommends using either SNMP trap alerting to your system management console or event
log entry in conjunction with syslog forwarding configured on your switches.
Time base configuration
The time base specifies the time interval between two samples to be compared. The fwSetToCustom
command allows you to switch from default to custom settings. Valid intervals are day, hour, or minute.
Refer to Setting Fabric Watch custom and default values on page 43 for more information.
Threshold and action configuration
Before you begin to configure thresholds, decide if you want to have different levels of alerts for
E_Ports, FOP_Ports, and FCU_Ports, and configure the ports individually. Always set up thresholds
one fabric at a time and test the configuration before you apply the threshold configuration to more
switches or fabrics.
NOTE
You cannot configure different thresholds for server and storage ports, because threshold configuration
is an area-wide setting and cannot be configured on an element (port).
Monitoring
Do you want to monitor all class areas, or implement the monitoring in incremental stages? If you
monitor class areas incrementally, you should configure Fabric Watch to monitor the classes in the
following order:
1. Monitor Fabric class areas using the thConfig command.
Refer to Fabric, Security, SFP, and Performance Monitoring on page 47 for details.
2. Monitor Port class areas using the portThConfig command.
Refer to Port Monitoring on page 65 for details.
3. Monitor FRU class areas using the fwFruCfg command.
Refer to System Monitoring on page 87 for details.
Fabric Watch Administrators Guide 15
53-1003142-01

Post-processing of messages
NOTE
For each class area, there are setting guidelines and recommendations for whether you should
leave the setting at the default or change the settings. If a change is recommended, the reason for
the change and the suggested settings are provided in each of the configuration chapters. The
default settings are listed in these chapters as well.
Post-processing of messages
After you have configured thresholds and alerts, determine to where the messages will be sent. Then,
monitor the messages frequently and take the appropriate actions.
Class, area, and element hierarchy
Fabric elements and events are organized in a hierarchy by class, area, and element. There is a class,
area, and element associated with every monitored behavior. Classes are the highest level in the
system, subdivided into one or more areas. Areas contain one or more elements.
Here is an example of a very simple Class –> Area –> Element hierarchy:
Port –> Cyclic redundancy check (CRC) –>port 0
Switch monitoring components
Fabric Watch software enables you to monitor the independent components that are listed in this
section.
Fabric events monitoring
The Fabric class groups areas of potential problems arising between devices, such as zone changes,
fabric segmentation, E_Port down, fabric reconfiguration, domain ID changes, and fabric logins. A
Fabric-class alarm alerts you to problems or potential problems with interconnectivity. You can
customize Fabric class and area parameters using the thConfig command.
For complete information about fabric monitoring, refer to Fabric monitoring guidelines and default
settings on page 47.
Performance monitoring
Performance monitoring groups areas that track the source and destination of traffic. Use the
Performance Monitor class thresholds and alarms to determine traffic load and flow and to reallocate
resources appropriately.
You can customize Performance Monitor class and area parameters using the thConfig command.
The fmConfig command Manages frame monitor configuration, replacing deprecated advanced
performance monitoring commands. Use the fmConfig command to configure, install, and display
frame monitors across port ranges on a switch. Refer to the Fabric OS Command Reference for
details.
The Performance Monitor class is divided into the following areas:
16 Fabric Watch Administrators Guide
53-1003142-01

Security monitoring
• EE (end-to-end) Performance Monitor - Monitors RX and TX performance between two devices.
• Filter Performance Monitor - Measures the number of frames transmitted through a port that match
specific values in the first 64 bytes of the frame. Because the entire Fibre Channel frame header and
many of upper protocol's header fall within the first 64 bytes of a frame, filter-based monitoring can
measure different types of traffic transmitted through a port.
NOTE
Performance Monitoring is not supported on VE_Ports, EX_Ports, and VEX _Ports.
For complete information about performance monitoring, refer to Performance monitoring guidelines
and default settings on page 54.
Security monitoring
The Security class monitors different security violations on the switch and takes action based on the
configured thresholds and their actions. You can customize Security class and area parameters using
the thConfig command.
For complete information about security monitoring, refer to Security monitoring guidelines and default
settings on page 50.
SFP monitoring
The SFP class groups areas that monitor the physical aspects of an SFP, such as voltage, current,
RXP, and TXP for physical ports, E_Ports, FOP_Ports, and FCU_Ports. An SFP class alarm alerts you
to an SFP fault. You can customize SFP class and area parameters using the thConfig command.
Use the thMonitor command to monitor the Brocade 10 Gbps and 16 Gbps SFP modules and 16 Gbps
QSFPs. By default, the 10 Gbps SFP and the 16 Gbps SFP and QSFP are disabled. Refer to 16 Gbps
SFP and QSFP monitoring on page 58 for more information.
NOTE
SFPs connected to any GbE ports are not monitored by Fabric Watch.
For complete information about SFP monitoring, refer to SFP monitoring guidelines and default settings
on page 52.
Port monitoring
Port monitoring monitors port statistics and takes action based on the configured thresholds and
actions. You can configure thresholds per port type and apply the configuration to all ports of the
specified type using the portThConfig command. Configurable ports include physical ports, E_Ports,
optical F_Ports (FOP_Ports), copper F_Ports (FCU_Ports), and Virtual E_Ports (VE_Ports).
NOTE
The execution of the portThConfig command is subject to Virtual Fabric or Admin Domain restrictions
that may be in place. Refer to the Fabric OS Command Reference for more information and for details
about the portThConfig command.
For complete information about port monitoring, including configuration examples, port setting
guidelines, and default settings, refer to Port Monitoring on page 65.
Fabric Watch Administrators Guide 17
53-1003142-01

Port persistence
Port persistence
The data collected in port monitoring can vary a great deal over short time periods. Therefore, the port
can become a source of frequent event messages (the data can exceed the threshold range and
return to a value within the threshold range).
Fabric Watch uses port persistence for a port event that requires the transition of the port into a
marginal status. Fabric Watch does not record any event until the event persists for a length of time
equal to the port persistence time. If the port returns to normal boundaries before the port persistence
time elapses, Fabric Watch does not record any event.
To set the port persistence time, refer to Setting the port persistence time on page 79.
Port fencing
A port that is consistently unstable can harm the responsiveness and stability of the entire fabric and
diminish the ability of the management platform to control and monitor the switches within the fabric.
Port fencing is a Fabric Watch enhancement that takes the ports offline if the user-defined thresholds
are exceeded. Supported port types include physical ports, E_Ports, optical F_Ports (FOP_Ports),
copper F_Ports (FCU_Ports), and Virtual E_Ports (VE_Ports).
NOTE
Port fencing is not enabled by default. You must manually enable port fencing. Refer to Port fencing
configuration on page 80 for instructions.
When a port that has exceeded its user-defined thresholds is fenced by the software, the port is
placed into the disabled state and held offline. After a port is disabled, the user must manually enable
the port for frame traffic to resume on the port.
System resource monitoring
System resource monitoring enables you to monitor your system’s RAM, flash, and CPU. You can use
the sysMonitor command to perform the following tasks:
• Configure thresholds for Fabric Watch event monitoring and reporting for the environment and
resource classes. Environment thresholds enable temperature monitoring, and resource thresholds
enable monitoring of flash memory.
• Use the RAM to configure memory or CPU usage parameters on the switch or display memory or
CPU usage. Configuration options include setting usage thresholds which, if exceeded, trigger a set
of specified Fabric Watch alerts. You can set up the system monitor to poll at certain intervals and
specify the number of retries required before Fabric Watch takes action.
For complete information about system resource monitoring, including setting guidelines and default
settings, refer to System monitoring using the sysMonitor command on page 89.
Switch policies
Switch policies are a series of rules that define specific health states for the overall switch. Fabric OS
interacts with Fabric Watch using these policies. Each rule defines the number of types of errors that
transitions the overall switch state into a state that is not healthy. For example, you can specify a
switch policy so that if a switch has two port failures, it is considered to be in a marginal state; if it has
four failures, it is in a down state. You can define these rules for a number of classes and field
replaceable units, including ports, power supplies, and flash memory.
Refer to Switch status policy planning on page 93 for information on configuring switch policies.
18 Fabric Watch Administrators Guide
53-1003142-01

Refer to Fabric Watch reports on page 107 for information on viewing the current switch policies using
the Switch Status Policy report.
Logical switch support
Fabric Watch can monitor the switch health on eight logical switches. You can configure thresholds and
notifications for ports that belong to a particular logical switch. Each logical switch has its own Fabric
Watch configuration and triggers notifications based on its local configuration.
Fabric Watch supports port movement from one logical switch to another. Whenever a port is moved,
thresholds associated with the port are deleted from the logical switch from which the port was moved,
and created for the logical switch to where the port is moved.
On logical interswitch links (LISLs), Fabric Watch supports state change notifications in the same
manner as for normal E_Ports and uses the same threshold values for LISLs as for E_Ports, but does
not support threshold areas such as link loss or signal loss.
Logical switch support
Threshold monitoring using SNMP tables
Understanding the components of SNMP makes it possible to use third-party tools to view, browse, and
manipulate Brocade switch variables remotely. Every Brocade switch and director supports SNMP.
When an event occurs and its severity level is at or below the set value, the Event Trap traps
(swFabricWatchTrap), are sent to configured trap recipients.
Once the switch status policy changes, Fabric Watch sends a connUnitStatusChange SNMP trap, and
any existing Fabric Watch RASLog is converted into an swEventTrap.
Refer to the Fabric OS release notes, the Fabric OS Administrator's Guide, and the MIB files
themselves for information about the following:
• Understanding SNMP basics
• How to enable or disable the sending of traps from the various MIBs
• SNMP trap bitmask values
• Loading Brocade Management Information Bases (MIBs)
MIB capability configuration parameters
The mibCapability option turns certain MIBs and associated SNMP traps on or off. If a specific MIB is
disabled, the corresponding traps are also disabled. If any trap group is disabled, the corresponding
individual traps are also disabled.
Refer to the Fabric OS release notes, the Fabric OS Administrator's Guide, and the MIB files
themselves for detailed information about the following SNMP tables that can be used to manage
thresholds:
• swFwClassAreaTable
• swFwThresholdTable
Fabric Watch Administrators Guide 19
53-1003142-01

Fabric Watch event settings
Fabric Watch event settings
Fabric Watch uses two types of settings: factory default settings and user-defined custom settings.
• Factory default settings are automatically enabled. These settings vary depending on hardware
platform, and cannot be modified.
• You can create custom configurations to suit your unique environment.
You must first use the fwSetToCustom command to switch from default to custom settings, and then
use the advanced configuration options provided with the portThConfig , thConfig , and sysMonitor
commands to configure event behavior, actions, and time bases at the port level.
Use the advanced configuration option provided with the portThConfig , thConfig , and sysMonitor
commands to view and modify custom and default values for specified classes and areas in Fabric
Watch. You can customize the information reported by Fabric Watch by configuring event behavior
types, threshold values, time bases, and event settings. These area attributes are used to define and
detect events in Fabric Watch.
Fabric Watch notification types
Fabric Watch provides event notifications in several different formats to ensure that event details are
accessible from all platforms and operating systems. In response to an event, Fabric Watch can
record event data as any (or all) of the following alarm options.
E-mail alerts
An e-mail alert sends information about a switch event to a one or multiple specified e-mail addresses.
An e-mail alert can send information about any error from any element, area, and class (only one email recipient can be configured per class). The e-mail specifies the threshold and describes the
event, much like an error message. You can configure multiple e-mail recipients per class using the
fwMailCfg command. You must separate the e-mail addresses with a comma and include the
complete e-mail address. For example, abc@12.com is a valid e-mail address; abc@12 is not.
For a recipient to receive the e-mail alert, you must configure one of the following settings:
• Use the dnsConfig command to configure DNS settings to connect the switch to a DNS server.
• In case a DNS server is not available, e-mail alerts can be forwarded through a relay host. You can
configure the relay host IP address using the fwMailCfg command.
Enabling e-mail alerts for the Changed threshold state in several areas can quickly result in a
significant amount of e-mail. Fabric Watch discards e-mail alerts when more than 100 are generated
within a minute, which minimizes memory use.
SNMP traps
In environments where you have a high number of messages coming from a variety of switches, you
might want to receive them in a single location and view them using a graphical user interface (GUI).
In this type of scenario, the Simple Network Management Protocol (SNMP) notifications might be the
most efficient notification method. You can avoid having to log in to each switch individually as you
would have to do for error log notifications.
SNMP performs an operation called a trap that notifies a management station using SNMP when
events occur. Log entries can also trigger SNMP traps if the SNMP agent is configured. When the
20 Fabric Watch Administrators Guide
53-1003142-01

SNMP trap counters
SNMP agent is configured to a specific error message level, error messages at that level trigger SNMP
traps.
An SNMP trap forwards the following information to an SNMP management station:
• Name of the element whose counter registered an event
• Class, area, and index number of the threshold that the counter crossed
• Event type
• Value of the counter that exceeded the threshold
• State of the element that triggered the alarm
• Source of the trap
You must configure the software to receive trap information from the network device. You must also
configure the SNMP agent on the switch to send the trap to the management station. You can configure
SNMP notifications using the snmpConfig command and you can configure notifications using Fabric
Watch.
For information on configuring the SNMP agent using the snmpConfig command, refer to the Fabric
OS Command Reference.
SNMP trap counters
• When a counter is in the "in-between" state, Fabric Watch sends an informational SNMP trap. Refer
to In-between buffer values on page 25 for an explanation of the concepts of "in-between"
boundaries and above high, below high, above low, and below low thresholds.
• When a counter is above the high threshold or below the low threshold, Fabric Watch sends a
warning SNMP trap except for the power supply area of the environment (ENV), CPU, and Memory
classes. The severity of a Fabric Watch SNMP trap for CPU and memory will always be
informational.
Refer to Threshold values on page 25 for a more thorough explanation of thresholds.
RASLog for switch events
Following an event, Fabric Watch adds an entry to the internal event log for an individual switch. The
RASLog stores event information but does not actively send alerts. Use the errShow command to view
the RASLog.
Locked port log
Following an event, the port log locks to retain detailed information about an event, preventing the
information from being overwritten as the log becomes full. This notification audit stores event
information but does not actively send alerts, which is done automatically when some thresholds are
exceeded and an alert is triggered.
For more information about locking, unlocking, and clearing the port log, refer to the Fabric OS
Command Reference.
Fabric Watch audit messages
Fabric Watch events caused by configuration value changes are tagged as Audit messages. When
managing SANs you may want to filter or audit certain classes of events to ensure that you can view
and generate an audit log for what is happening on a switch, particularly for security-related event
Fabric Watch Administrators Guide 21
53-1003142-01

Data values
Data values
changes. These events include login failures, zone configuration changes, firmware downloads, and
other configuration changes; in other words any critical changes that have a serious effect on the
operation and security of the switch.
Important information related to event classes is also tracked and made available. For example, you
can track changes from an external source by the user name, IP address, or type of management
interface used to access the switch.
NOTE
Audit messages are generated for port fencing configuration changes, whether port fencing is enabled
or disabled.
You can set up an external host to receive Audit messages so you can easily monitor unexpected
changes. For information on error messages generated by Fabric Watch, refer to the Fabric OS
Message Reference. For information on configuring an Audit Log, refer to the "Audit Log
Configuration" section of the Fabric OS Administrator's Guide.
A data value represents a measured value or a state value, described as follows:
• Measured value — The current, measurable value of a fabric or fabric element, such as
environmental temperature.
• State value — The only qualitative data value information on the overall state of a fabric component.
Instead of numerical data, state values contain information on whether components are faulty,
active, or in another state.
NOTE
Either measured values or state values can be used; mixed values are not supported.
Fabric Watch compares the measured values to a set of configurable limits to determine whether
fabric monitoring has occurred and whether to notify you. You must set appropriate threshold
boundaries to trigger an event.
State values are handled differently, as Fabric Watch monitors state values for certain states which
you can select. When a state value transitions to one of the monitored states, an event is triggered.
Time bases specify the time interval between two samples to be compared. You can set the time base
to day (samples are compared once a day), hour (samples are compared once an hour), or minute
(samples are compared every minute). Second samples are not advisable. This configurable field
affects the comparison of sensor-based data with user-defined threshold values.
Refer to Time bases on page 27 for more information.
Fabric Watch support in Access Gateway mode
Both the Advanced Performance Monitoring (APM) license and the Fabric Watch license must be
installed on the platform configured in Access Gateway (AG) mode to use the frame monitoring and
end-to-end (EE) monitoring capabilities. The APM license provides the counters and the Fabric Watch
license provides the monitoring and alert mechanisms for these counters. Refer to Setting the high
threshold of the RX area of an EE monitor on page 57 for configuration information.
22 Fabric Watch Administrators Guide
53-1003142-01

The following classes are not supported in Access Gateway mode:
• Fabric
• Security
• E_Port (Port subclass)
• VE_Port (Port subclass)
Fabric Watch
Fabric Watch Administrators Guide 23
53-1003142-01

Fabric Watch support in Access Gateway mode
24 Fabric Watch Administrators Guide
53-1003142-01

Fabric Watch Thresholds
● Threshold values.............................................................................................................25
● Threshold triggers........................................................................................................... 26
● Time bases......................................................................................................................27
● Fabric Watch alarm behavior.......................................................................................... 29
Threshold values
High and low threshold values are the values at which potential problems might occur. For example, in
configuring a temperature threshold, you can select the temperatures at which a potential problem can
occur because of overheating or freezing.
With Fabric Watch v6.4 and later, there are four threshold categories:
• Above high threshold — Fabric Watch takes this action when the current value is above the high
threshold.
• Below high threshold — Fabric Watch takes this action when the current value is between the high
and low threshold.
• Above low threshold — This action is only applicable to port classes (physical port, FOP_Port,
FCU_Port, and VE_Port). Fabric Watch takes this action when the current value crosses the low
threshold towards the high threshold.
• Below low threshold — Fabric Watch takes this action when the current value is below the low
threshold.
NOTE
The above low threshold action applies only to the portThConfig command. It does not apply to the
thConfig and sysMonitor commands.
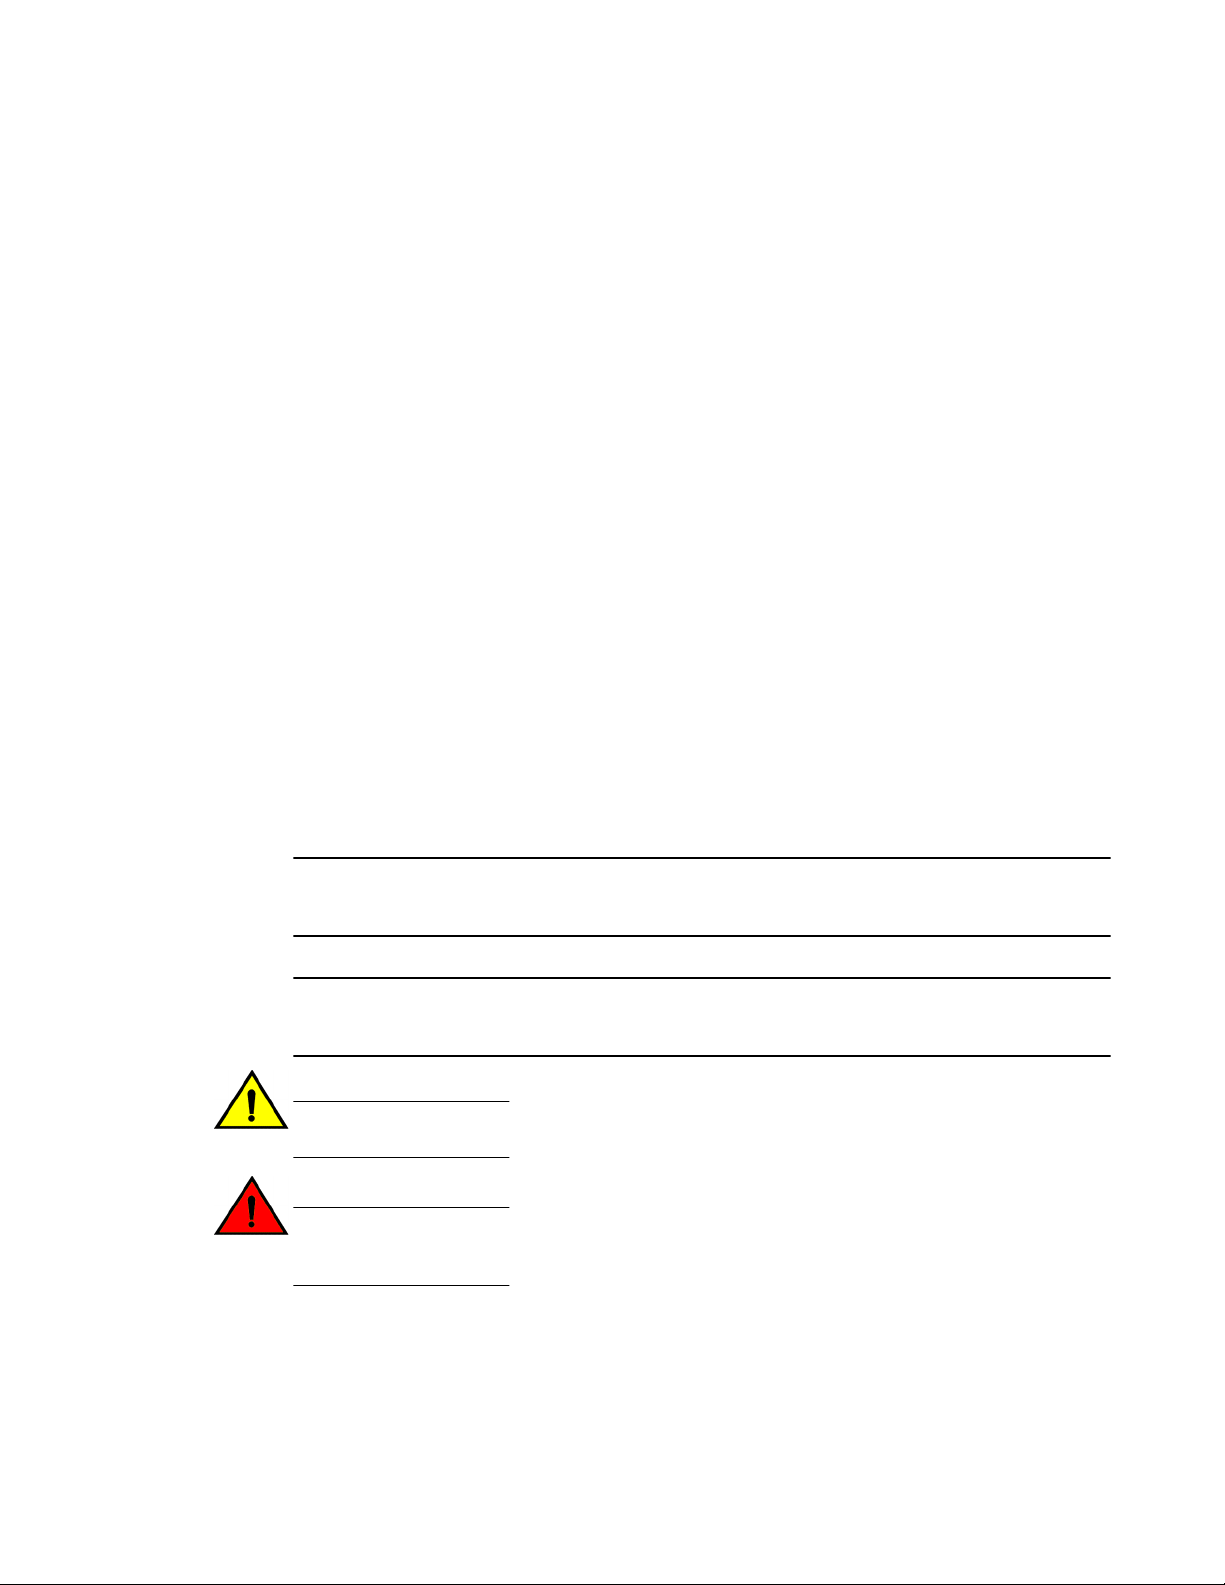
In-between buffer values
The below high threshold is the term used to configure "in between" buffer values, as shown in the
figure below.
The following example the high threshold value is 5 and the buffer value is 1. Therefore, the "inbetween" boundary value is 4.
switch:admin> portthconfig --set port -area crc -highth -value 5 -trigger below action raslog -buffer 1
Fabric Watch Administrators Guide
53-1003142-01
25
Threshold triggers
FIGURE 1 In-between buffer values
Threshold triggers
This section describes how Fabric Watch compares a fabric element’s data value against a threshold
value to determine whether or not to trigger an event. It describes how a specified buffer zone affects
event triggering.
For Fabric Watch to monitor data values for one of the following conditions, the alarm setting must be
set to a nonzero value.
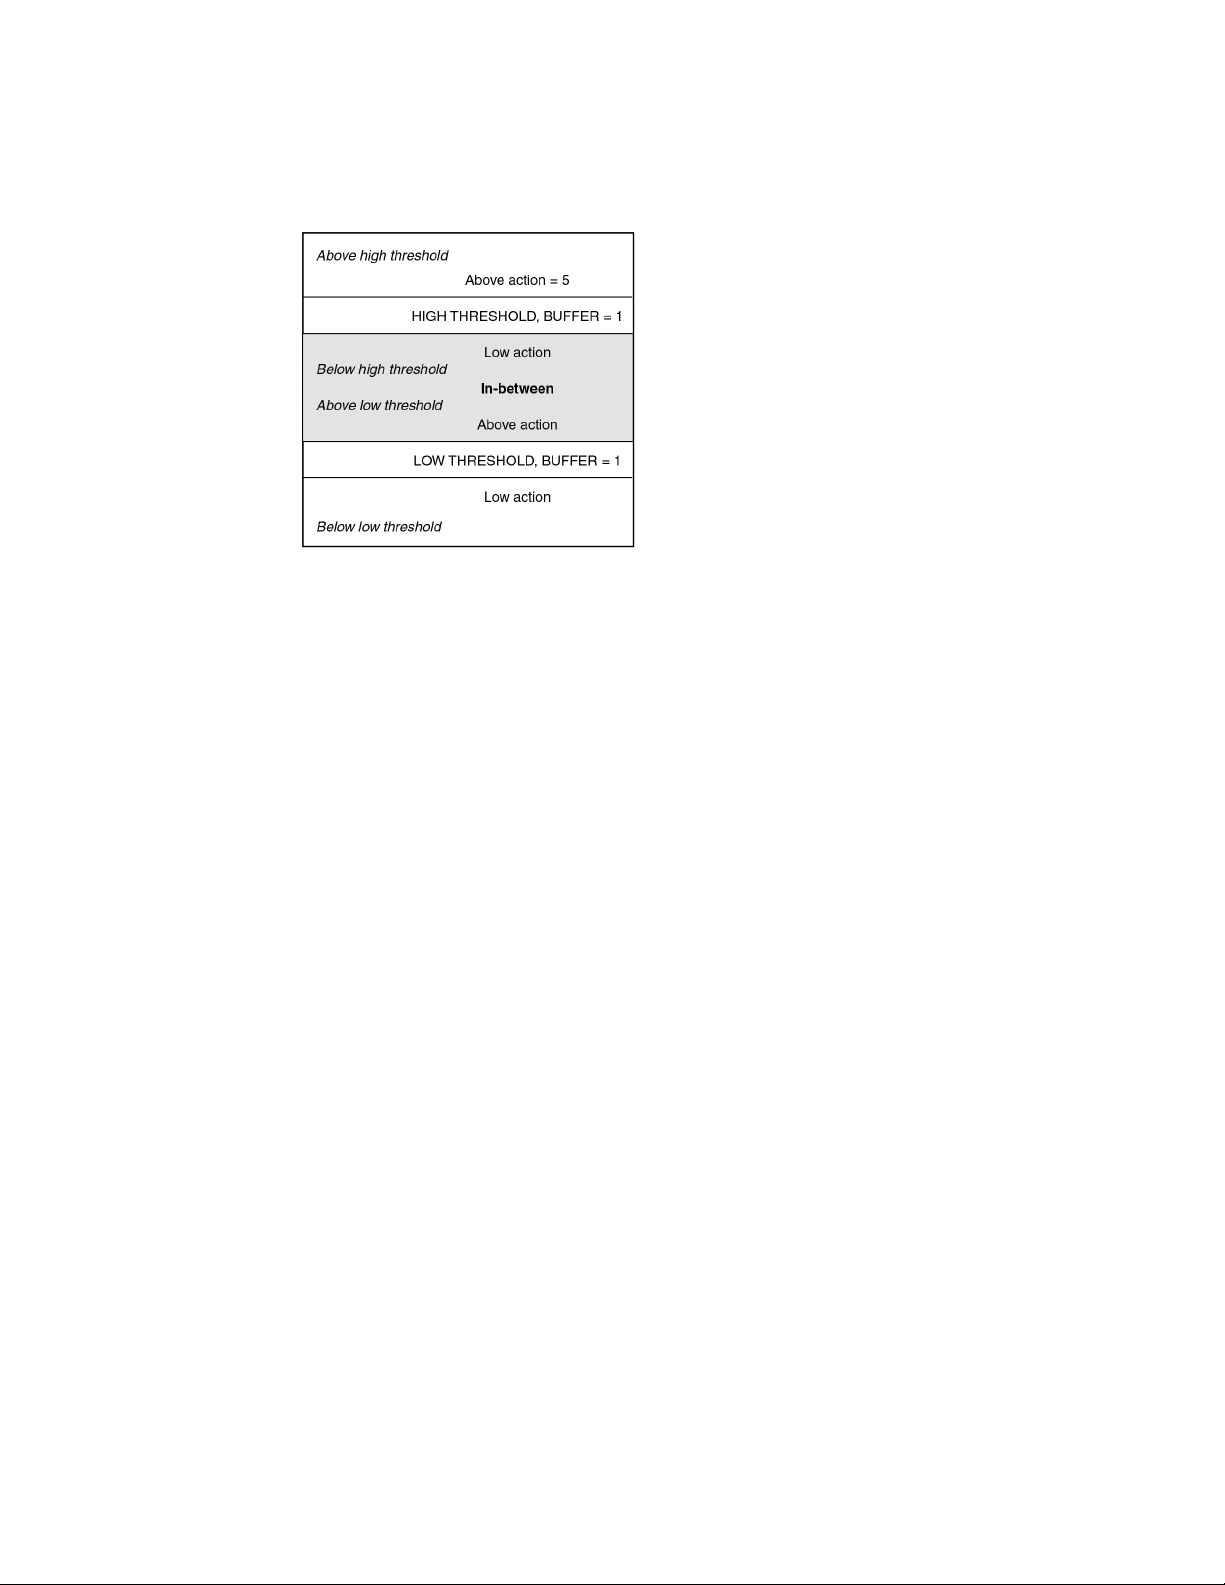
Above event trigger
Set the Above event trigger for an element that requires only high threshold monitoring. In the Above
event trigger, Fabric Watch triggers an event immediately after the data value becomes greater than
the high threshold.
Define a buffer zone within the operational limit of an area to suppress multiple events when the
counter value goes above the high threshold and fluctuates around it. The next event will not occur
until the counter value falls below the buffer zone created by the high threshold. The figure below
shows an Above event trigger with a buffer zone. The Above event trigger occurs when the counter
crosses the high threshold (event 1 in the figure below). When the data value becomes less than the
high threshold and buffer value, Fabric Watch triggers a second event (event 2) to indicate that it has
returned to normal operation. The second event will not be triggered until the counter value falls below
the high threshold and buffer values.
26 Fabric Watch Administrators Guide
53-1003142-01
Below event trigger
FIGURE 2 Above event trigger with buffer zone
Below event trigger
The Below event trigger generates an event when a data value becomes less than the low threshold
boundary.
When a buffer is defined, the event will be triggered only when the value goes below the lower
threshold. A second event will not be generated until the value crosses the buffer region set above the
lower threshold.
Time bases
Audit and RASLog messages
Fabric Watch generates an Audit message along with a RASLog message when the current threshold
exceeds the high threshold limit configured for the following thresholds:
• SCSI reservation
• Class 3 discards (C3TXT0)
• Switch memory usage
• Switch flash usage
• Switch CPU usage
Time bases specify the time interval between two samples to be compared. You can set the time base
to day (samples are compared once a day), hour (samples are compared once an hour), minute
(samples are compared every minute). This configurable field affects the comparison of sensor-based
data with user-defined threshold values.
Time base set to none
If you set a time base to none, Fabric Watch compares a data value against a threshold boundary level.
When the absolute value of the measuring counter exceeds the threshold boundary, an event is
triggered.
Fabric Watch Administrators Guide 27
53-1003142-01

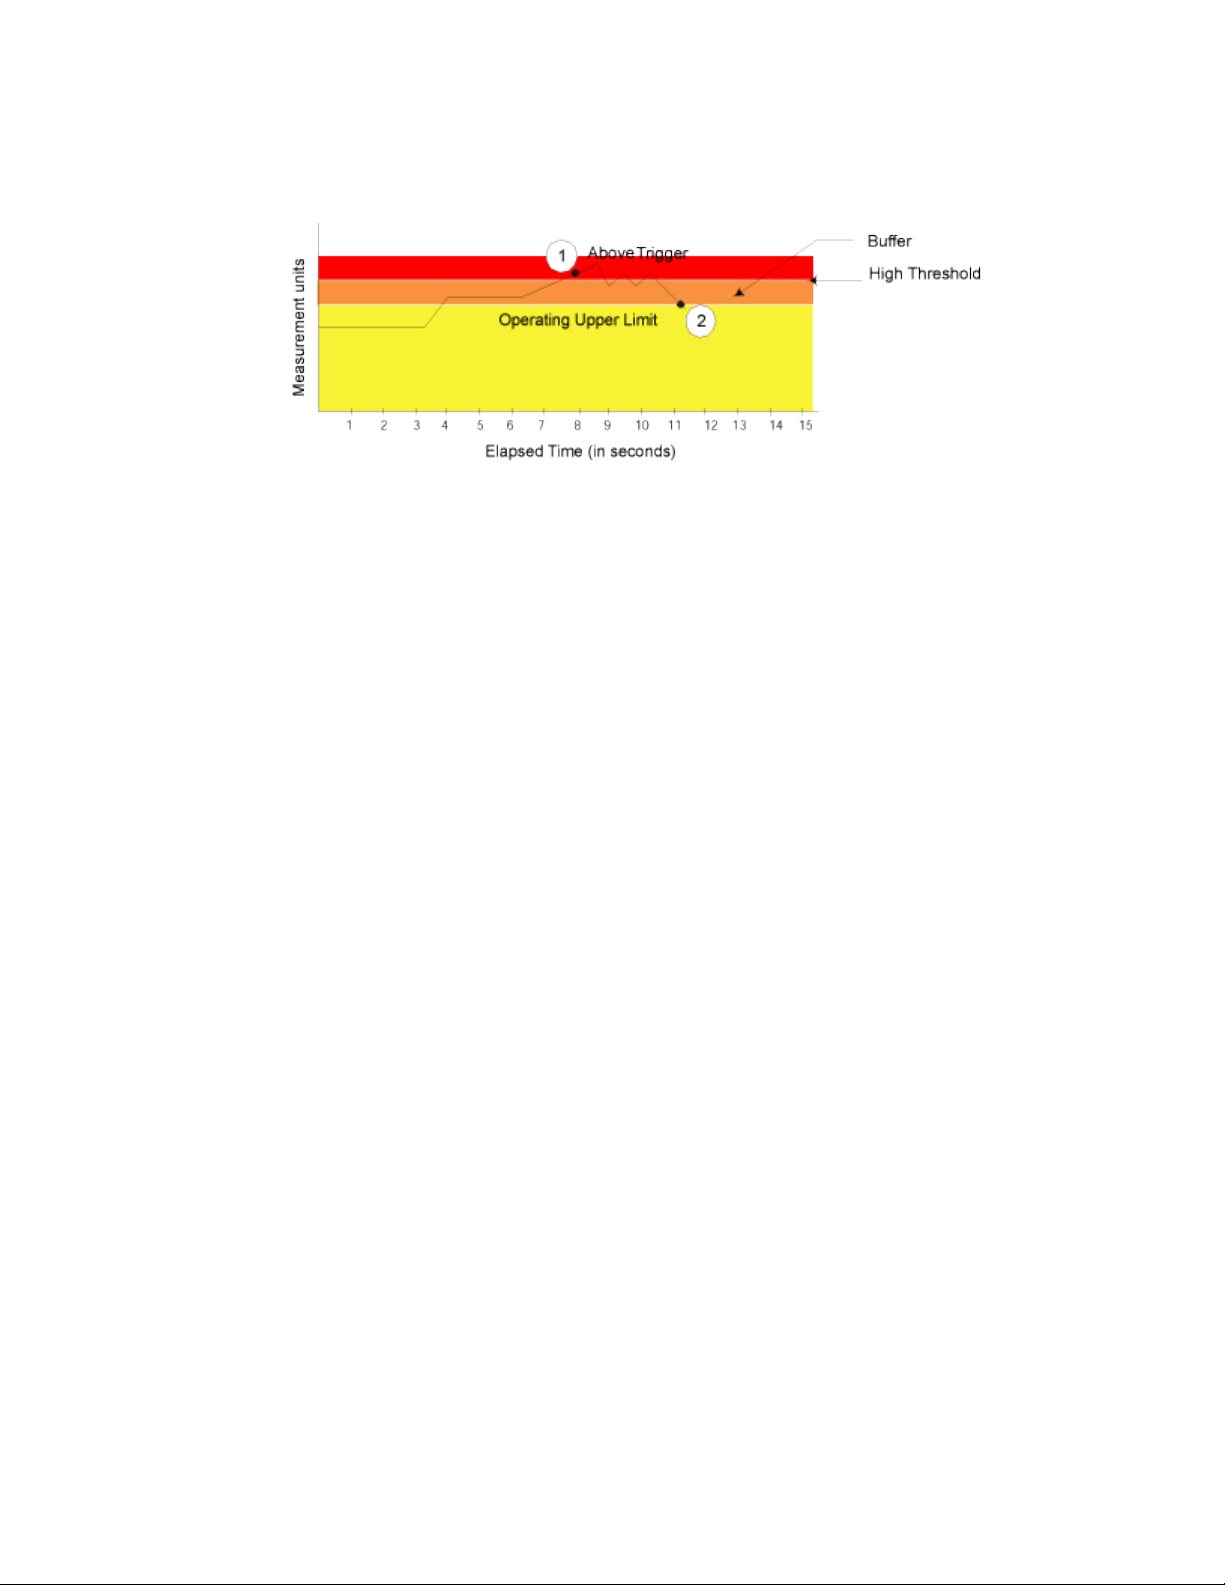
Time base set to other than none
The figure below shows a high limit of 65° Celsius placed on a counter measuring temperature. During
each sample period, Fabric Watch measures the temperature and compares it to the high threshold. If
the measured temperature exceeds the high threshold, it triggers an event.
FIGURE 3 Time base set to none
Time base set to other than none
If you specify a time base value other than none (minute, hour, or day), Fabric Watch does not use
the current data value. Instead, it calculates the difference between the current data value and the
data value as it existed one time base ago. It compares this difference to the threshold boundary limit.
For example, if you specify the time base minute, Fabric Watch calculates the counter value
difference between two samples a minute apart. It then compares the difference (current data value data value one minute ago) against the preset threshold boundary.
When you set a time base to a value other than none, there are two main points to remember when
configuring events:
• Fabric Watch triggers an event only if the difference in the data value exceeds the preset threshold
boundary limit.
• Even if the current data value exceeds the threshold, Fabric Watch does not trigger an event if the
rate of change is below the threshold limit.
The figure below shows a sample graph of data obtained by Fabric Watch (the type of data is
irrelevant to the example). A high threshold of 2 is specified to trigger an event. A time base of minute
is defined. An event occurs only if the rate of change in the specific interval (one minute in this
example) is across the threshold boundary. It should be either higher than the high threshold limit or
lower than the low threshold limit.
As illustrated on the tenth sample, the counter value changes from 0 to 1; thus the calculated rate of
change is 1 per minute. At the thirteenth sample, the rate of change is 2 per minute. The rate of
change must be at least 3 per minute to exceed the event-triggering requirement of 2, which is met on
the eighteenth sample.
28 Fabric Watch Administrators Guide
53-1003142-01
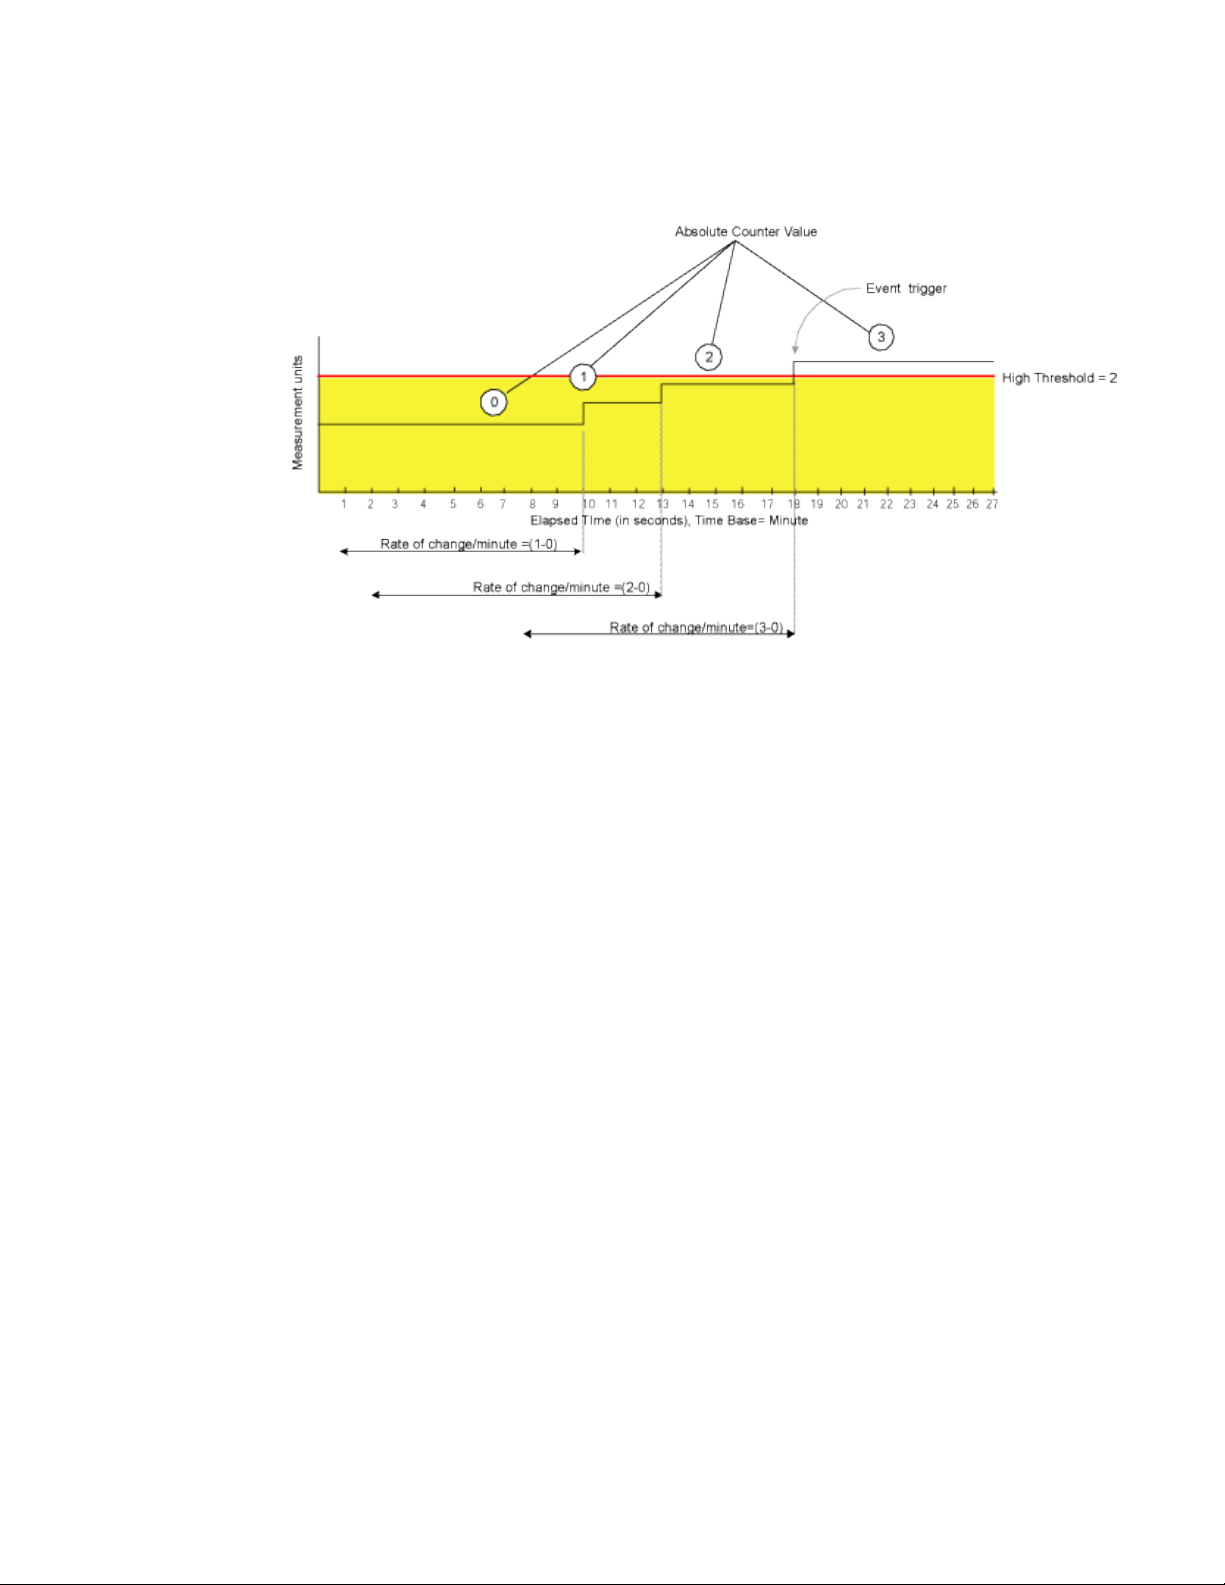
FIGURE 4 Event trigger
Fabric Watch alarm behavior
Fabric Watch alarm behavior
Fabric Watch alarm behavior depends on the threshold states associated with the Above, Below and
Changed thresholds. Threshold states can be INFORMATIVE, IN_RANGE, and OUT_OF_RANGE.
Notifications are generated only for the following transitions:
• IN_RANGE to OUT_OF_RANGE
• OUT_OF_RANGE to IN_RANGE
No alarm is generated for INFORMATIVE to IN_RANGE (or IN_RANGE to INFORMATIVE).
Fabric Watch Administrators Guide 29
53-1003142-01

Fabric Watch alarm behavior
30 Fabric Watch Administrators Guide
53-1003142-01
 Loading...