


MS2711A
Hand Held
Spectrum Analyzer
User's Guide
Hand-Held Spectrum Analyzer for Measuring,
Monitoring and Analyzing Signal Environments
color cover part #: 00986-00040


WARRANTY
The Anritsu product(s) listed on the title page is (are) warranted against defects in
materials and workmanship for one year from the date of shipment.
Anritsu's obligation covers repairing or replacing products which prove to be defec
tive during the warranty period. Buyers shall prepay transportation charges for
equipment returned to Anritsu for warranty repairs. Obligation is limited to the origi
nal purchaser. Anritsu is not liable for consequential damages.
-
-
LIMITATION OF WARRANTY
The foregoing warranty does not apply to Anritsu connectors that have failed due to
normal wear. Also, the warranty does not apply to defects resulting from improper or
inadequate maintenance by the Buyer, unauthorized modification or misuse, or op
eration outside the environmental specifications of the product. No other warranty is
expressed or implied, and the remedies provided herein are the Buyer's sole and
exclusive remedies.
-
TRADEMARK ACKNOWLEDGMENTS
MS-DOS, Windows, Windows for Workgroups, Windows NT, and Windows 95 are
registered trademarks of the Microsoft Corporation.
Anritsu and Cable Mate are trademarks of Anritsu Company.
NOTICE
Anritsu Company has prepared this manual for use by Anritsu Company personnel
and customers as a guide for the proper installation, operation and maintenance of
Anritsu Company equipment and computer programs. The drawings, specifications,
and information contained herein are the property of Anritsu Company, and any unauthorized use or disclosure of these drawings, specifications, and information is
prohibited; they shall not be reproduced, copied, or used in whole or in part as the
basis for manufacture or sale of the equipment or software programs without the
prior written consent of Anritsu Company.


Table of Contents
Chapter 1 - General Information 1-1
Introduction..................................1-1
Description ..................................1-1
Standard Accessories.............................1-1
Options ....................................1-2
Printers ....................................1-2
Optional Accessories .............................1-2
Performance Specifications .........................1-4
Preventive Maintenance ...........................1-6
Calibration ..................................1-6
Annual Verification..............................1-6
Anritsu Service Centers ...........................1-6
Chapter 2 - Quick Start Guide 2-1
Introduction..................................2-1
Turning the MS2711A On for the First Time ...............2-1
Front Panel Overview ............................2-2
Test Panel Connectors ............................2-5
Making Spectrum Analyzer Measurements ................2-6
Required Equipment......................................2-6
Procedure ............................................2-6
Making aMeasurement ....................................2-6
Selecting theFrequency ....................................2-6
Selecting theSpan .......................................2-6
Selecting theAmplitude ....................................2-7
Selecting BandwidthParameters . . .............................2-7
Selecting SweepParameters . . . . . .............................2-7
Adjusting Markers.......................................2-7
Adjusting Limits ........................................2-8
Adjusting AttenuatorSettings. ................................2-8
Making a Basic Measurement ........................2-9
Example – Measuring a 900 MHz signal ..................2-9
Set thecenter frequency ....................................2-9
Set thefrequency span ....................................2-10
Set theamplitude .......................................2-11
Activate themarker......................................2-12
Save theDisplay........................................2-13
Recall theDisplay .......................................2-13
Printing....................................2-13
Printer SwitchSettings ....................................2-13
Printing aScreen .......................................2-14
Determining Remaining Battery Life ...................2-15
Symbols ...................................2-16
Self Test ...................................2-16
June 2002 10580-00048
Copyright 2000-2002 Anritsu Company Revision: D
i

Error Codes .................................2-17
Self TestErrors ........................................2-17
Range Errors .........................................2-17
Using the Soft Carrying Case........................2-18
Chapter 3 - Key Functions 3-1
Introduction..................................3-1
Hard Keys............................................3-1
Soft Keys ............................................3-4
Chapter 4 - Advanced Measurement Fundamentals 4-1
Introduction..................................4-1
Advanced Measurement Fundamentals...................4-1
Chapter 5 - Field Measurements 5-1
Introduction..................................5-1
Occupied Bandwidth .............................5-1
XdB DownMethod.......................................5-1
N% Method...........................................5-1
Occupied Bandwidth Measurement with the MS2711A ..........5-1
Required Equipment......................................5-1
Procedure ............................................5-1
Adjacent Channel Power Leakage .....................5-2
Adjacent Channel Power Measurement with the MS2711A........5-2
Required Equipment......................................5-2
Procedure ............................................5-2
Out-of-Band Spurious Emission Measurements ..............5-3
Out-of-band Spurious Measurement with the MS2711A .........5-3
Required Equipment......................................5-3
Procedure ............................................5-3
In-Band/Out-Of-Channel Measurements..................5-4
In-band Spurious Measurement with the MS2711A ............5-4
Required Equipment......................................5-4
Procedure ............................................5-4
Field Strength.................................5-5
Required Equipment......................................5-5
Procedure ............................................5-5
ANTENNA CALCULATIONS . . . .............................5-6
Making Power Measurements with the Power Meter ...........5-7
Displaying Powerin dBm and Watts .............................5-7
Displaying RelativePower. . . . . . .............................5-7
AM/FM Demodulation ............................5-8
ii

Chapter 6 - Software Tools Program 6-1
Description ..................................6-1
Requirements .................................6-1
Communication Port Setting.........................6-1
Changing COM Port Settings–Windows 95/98/NT/2000 .........6-1
Software Installation .............................6-2
Plot Capture..................................6-3
Capture multipleto database . ................................6-3
Capture multipletraces to PC screen.............................6-4
Single tracecapture ......................................6-4
Program Operation..............................6-4
Entering Antenna Factors ..........................6-5
Uploading Antenna Factors .........................6-5
Saving a Plot as a Windows Metafile ....................6-6
Saving Data to a Spreadsheet ........................6-6
Saving Data as a Data File ..........................6-6
Saving Data to a Database ..........................6-6
“Drag-n-Drop” ................................6-7
Printing ....................................6-7
iii

Chapter 1 General Information
MODE
FREQ / SPAN
AMPLITUDE
MS2711A
BW/SWEEP
1
TRACE MEAS
3
RECALL
SAVE
SETUP
SETUP
5
LIMIT
MARKER
7
RECALL
SAVE
DISPLAY
DISPLAY
9
PRINT
ON
OFF
ESCAPE
CLEAR
2
4
6
ENTER
8
SINGLE
CONT
+
0
-
/
SYS
.
Figure 1-1. Anritsu MS2711A Hand Held Spectrum Analyzer™
1-0

Chapter 1
General Information
Introduction
This chapter provides a description, performance specifications, optional accessories, pre
ventive maintenance, and calibration requirements for the Anritsu Hand Held Spectrum An
alyzer model listed below. Throughout this manual, this instrument may be referred to as an
Anritsu HHSA.
Model
MS2711A 100 kHz to 3000 MHz
Frequency Range
Description
The Anritsu HHSA is a synthesized-based hand held spectrum analyzer that provides quick
and accurate signal results. Measurements can be easily made by using the main instrument
functions: frequency, span, amplitude and bandwidth. Dedicated keys for common functions and a familiar calculator type keypad are available for fast data entry. Automatic time
and date stamping of measurement data of up to 200 results is provided as is storage and recall of up to 10 different measurement setups. A large, high-resolution liquid crystal display
(LCD) provides easy viewing in a variety of lighting conditions. The Anritsu HHSA is capable of up to two and one-half hours of continuous operation from a fully charged battery
and can be operated from a 12.5 Vdc source (which will also simultaneously charge the battery). Built-in energy conservation features can be used to extend battery life over an
eight-hour workday.
The Anritsu HHSA is designed for monitoring, measuring, and analyzing signal environments. Typical measurements include: in-band interference, transmit spectrum analysis, an
tenna isolation and cell area interference. A full range of marker capabilities such as peak,
center and delta functions are provided for faster, more comprehensive measurement of dis
played signals. Limit lines are available for creating quick, simple pass/fail measurements.
A menu option provides for an audible beep when the limit value is exceeded. To permit
use in low-light environments, the LCD can be back lit using a front panel key.
-
-
1
-
-
Standard Accessories
Anritsu HHSA Software Tools, a PC based software program, provides an on-line database
record for storing measurement data. Software Tools can also convert the Anritsu HHSA
display to a Microsoft Windows 95/98ä graphic. Measurements stored in the Anritsu
HHSA internal memory can be down-loaded to a PC using the included null-modem serial
cable. Once stored, the graphic trace can then be displayed, scaled, or enhanced with mark
ers and limit lines. Historical graphs can be overlaid with current data using the PC mouse
in a drag-and-drop fashion. The underlying data can be extracted and used in spreadsheets
or for other analytical tasks.
-
1-1

Chapter 1 General Information
The following standard accessories are supplied with the MS2711A:
Soft Carrying Case
·
AC-DC Adapter
·
Automotive Cigarette Lighter 12 Volt DC Adapter
·
CD ROM containing the Software Tools program.
·
Serial Interface Cable (Null Modem Type)
·
Rechargeable NiMH Battery
·
One year Warranty (includes battery, firmware, and software)
·
User's Guide
·
Options
Option 5 — Add RF Wattmeter Power Monitor (RF detector not included)
·
Printers
2000-766 HP DeskJet Printer, with Interface Cable, Black Print Cartridge,
·
and U.S. Power Cable
2000-753 Serial-to-Parallel Converter Cable
·
2000-661 Black Print Cartridge
·
·
2000-662 Rechargeable Battery for DeskJet Printer
·
2000-663 Power Cable (Europe) for DeskJet Printer
·
2000-664 Power Cable (Australia) for DeskJet Printer
·
2000-665 Power Cable (U.K.) for DeskJet Printer
·
2000-667 Power Cable (So. Africa) for DeskJet Printer
·
2000-1008 Sieko DPU-414-30BU Thermal Printer with Internal
Battery, Thermal Printer Paper, Serial Cable, Power Cable
·
2000-755 Five rolls of Thermal Paper
·
2000-1002 U.S. Adapter for Seiko DPU-414-30B
·
2000-1003 Euro Adapter for Seiko DPU-414-30B
·
2000-1004 Battery Pack Adapter for Seiko DPU-414-30B
·
2000-1012 Serial 9-pin male to 9-pin female cable for Seiko DPU-414-30B
·
2000-1046 Serial-to-parallel Converter Cable w/ DIP switch labeling, 36-pin
female Centronics to DB25 female
Optional Accessories
Optional Accessories are shown in Table 1-1
1-2

Chapter 1 General Information
Table 1-1. Optional Accessories
Part Number Description
5400-71N50
42N50A-30
15NN50-1.5A Test Port Cable Armored, 1.5 meter, N(m) to N(m), 3.5 GHz
15NN50-3.0A Test Port Cable Armored, 3.0 meter, N(m) to N(m), 3.5 GHz
15NN50-5.0A Test Port Cable Armored, 5.0 meter, N(m) to N(m), 3.5 GHz
15NNF50-1.5A Test Port Cable Armored, 1.5 meter, N(m) to N(f), 3.5 GHz
15NNF50-5.0A Test Port Cable Armored, 3.0 meter, N(m) to N(f), 3.5 GHz
15NNF50-3.0A Test Port Cable Armored, 5.0 meter, N(m) to N(f), 3.5 GHz
15ND50-1.5A Test Port Cable Armored, 1.5 meter, N(m) to 7/16 DIN(m), 3.5 GHz
15NDF50-1.5A Test Port Cable Armored, 1.5 meter, N(m) to 7/16 DIN(f), 3.5 GHz
800-109 Detector Extender Cable, 7.6m (25 ft.)
800-110 Detector Extender Cable, 15.2m (50 ft.)
800-111 Detector Extender Cable, 30.5m (100 ft.)
800-112 Detector Extender Cable, 61m (200 ft.)
510-90 Adapter 7-16 (f) to N(m), 3.5 GHz
510-91 Adapter 7-16 (f) to N(f), 3.5 GHz
510-92 Adapter 7-16 (m) to N(m), 3.5 GHz
510-96 Adapter 7-16 DIN (m) to 7/16 DIN (m), 3.5 GHz
510-97 Adapter 7-16 DIN (f) to 7/16 DIN (f), 3.5 GHz
1091-26 Adapter, DC to 18 GHz, 50 Ohm, N(m)-SMA(m)
1091-27 Adapter, DC to 18 GHz, 50 Ohm, N(m)-SMA(f)
1091-172 Adapter, DC to 1.3 GHz, 50 Ohm, N(m)-BNC(f)
34NN50A Precision Adapter, DC to 18 GHz, 50 Ohm, N(m)-N(m)
34NFNF50 Precision Adapter, DC to 18 GHz, 50 Ohm, N(f)-N(f)
48258 Spare Soft Carrying Case
40-115 Spare AC/DC Adapter
806-62 Spare Automotive Cigarette Lighter/12 Volt DC adapter
800-441 Spare Serial Interface Cable
760-215A Transit Case for Anritsu Hand Held Spectrum Analyzer
633-27 Rechargeable Battery, NiMH
2300-347 Anritsu Hand Held Spectrum Analyzer Software Tools
10580-00048 Anritsu HHSA User’s Guide, Model MS2711A
10580-00049
10580-00050
2000-1029 Battery Charger (NiMH), with Universal Power Supply
2000-1030 Portable Antenna, 50 Ohm, SMA (m), 1.71 to 1.88 GHz
2000-1031 Portable Antenna, 50 Ohm, SMA (m), 1.85 to 1.99 GHz
2000-1032 Portable Antenna, SMA (m), 2.4 to 2.5 GHz, 50 Ohm
2000-1034 Portable Antenna, 50 Ohm, SMA (f), 806-960 MHz
2000-1035
70-28
RF Detector, N(m), 50 ohm, 1 to 3000 MHz
Attenuator, 30 dB, 50 Watt, bi-directional
Anritsu HHSA Programming Manual, Model MS2711A
Anritsu HHSA Maintenance Manual, Model MS2711A
Portable Antenna, 50 Ohm, SMA (m), 902-960 MHz
Headset
1-3

Chapter 1 General Information
Performance Specifications
Performance specifications are provided in Table 1-2. Unless otherwise noted, specified
values are obtained after a five minute warmup period at a constant ambient temperature.
The typical values are provided for reference, and are not guaranteed.
Table 1-2. Performance Specifications (1 of 2)
Description Value
Frequency
Frequency Range 100 kHz to 3.0 GHz
Frequency Reference
Aging
Accuracy
Frequency Span 100 kHz to 3 GHz in 1, 2, 5 step selections in auto mode,
Sweep Time ³ 650 ms full span; 400 ms zero span
SSB Phase Noise –75 dBc/Hz, 30 kHz offset@1GHz
Spurious Responses
Input Related £-45 dBc
Spurious
Residual Responses £-95 dBm
±1 ppm/yr
±2 ppm
plus zero span
Resolution Bandwidth
Selections 10 kHz, 30 kHz, 100 kHz and 1 MHz
Accuracy
Video Bandwidth
Selection 100 Hz to 300 kHz in 1-3 sequence
Amplitude
Measurement Range +20 dBm to –97 dBm
Displayed Average Noise
Level: £ –97 dBm (full span) typical
Dynamic Range > 65 dB
Total Level Accuracy ±2 dB ³ 200 kHz, typical
Maximum Safe Input Level +20 dBm, maximum measurable safe input
Amplitude Units
Log Scale Mode dBm, dBV, dBmV, dBmV
Display Range 2 to 15 dB/division, in 1 dB steps, 10 divisions displayed
Attenuator Range: 0 to 50 dB, selected manually or automatically
± 20% typical
±3 dB < 200 kHz, typical
+27 dBm, maximum damage
+27 dBm, peak pulse power
+50 Vdc
coupled to the reference level. Resolution in 10 dB steps.
1-4

Chapter 1 General Information
Table 1-2. Performance Specifications (2 of 2)
Description Value
Display
Type Monochrome LCD with back light capability
Resolution 640 ´ 480
Marker Modes Standard
delta
marker to peak
marker to center
Memory
Trace Storage 200 traces
Setup Storage 10 setups
Displayed Traces 2 traces
Inputs
RF Input 50 W
Connector Female, Type N
Maximum Input Level + 20 dBm, + 50 Vdc
RF Input VSWR 2.0:1
RS232 Interface
Type Null modem
Baud Range 9600 to 56k baud
Printer Interface
Drivers Epson ESC/P
Epson ESC/P RAST
Epson ESC/P2
HP PCL3
General Characteristics
Dimensions 10 ´ 7 ´ 2.25 inches
25.4 ´ 17.8 ´ 6.1 centimeters
Weight 4 pounds (1.8 kg) including battery
Power Requirements NIMH battery: 10.8 volts, 1800 mA maximum
External DC input: +11 to +15 Vdc, 1250 mA max.
Temperature Operating: 0 to +50° C, 85% or less humidity
Non-operating: –20 to +75° C
Electromagnetic Compatibility Meets European community requirements for CE marking
Safety Conforms to EN 61010-1 for Class 1 portable equipment
1-5

Chapter 1 General Information
Preventive Maintenance
Anritsu HHSA preventive maintenance consists of cleaning the unit and inspecting and
cleaning the RF connector on the instrument and all accessories.
Clean the Anritsu HHSA with a soft, lint-free cloth dampened with water or water and a
mild cleaning solution.
CAUTION: To avoid damaging the display or case, do not use solvents or abra
sive cleaners.
Clean the RF connectors and center pins with a cotton swab dampened with denatured alco
hol. Visually inspect the connectors. The fingers of the N (f) connectors and the pins of the
N(m) connectors should be unbroken and uniform in appearance. If you are unsure whether
the connectors are good, gauge the connectors to confirm that their dimensions are correct.
Visually inspect the test port cable(s). The test port cable should be uniform in appearance,
not stretched, kinked, dented, or broken.
Calibration
The Anritsu HHSA loads factory calibration data during start-up, eliminating the need for
daily calibration checks.
Annual Verification
Although the Anritsu HHSA does not require daily field calibration, Anritsu recommends
an annual calibration and performance verification by local Anritsu service centers. Anritsu
service centers are listed in Table 1-3 beginning on the following page.
The Anritsu HHSA itself is “self calibrating”, meaning that there are no field-adjustable
components.
-
-
Anritsu Service Centers
Table 1-3 provides a listing of the Anritsu Service Centers.
1-6

Table 1-3. Anritsu Service Centers
Chapter 1 General Information
UNITED STATES
ANRITSU COMPANY
685 JarvisDrive
Morgan Hill,CA 95037-2809
Telephone: (408)776-8300
FAX: 408-776-1744
ANRITSU COMPANY
10 NewMapleAve., Suite305
Pine Brook,NJ 07058
Telephone: 973-227-8999
FAX: 973-575-0092
ANRITSU COMPANY
1155E. Collins Blvd
Richardson, TX75081
Telephone: 1-800-ANRITSU
FAX: 972-671-1877
AUSTRALIA
ANRITSU PTY.LTD.
Unit 3,170 Foster Road
Mt Waverley,VIC 3149
Australia
Telephone: 03-9558-8177
FAX: 03-9558-8255
BRAZIL
ANRITSU ELECTRONICALTDA.
Praia deBotafogo 440. Sala 2401
CEP22250-040,Rio deJaneiro,RJ,
Brasil
Telephone: 021-527-6922
FAX: 021-53-71-456
CANADA
ANRITSU INSTRUMENTSLTD.
700 SilverSeven Road, Suite 120
Kanata, OntarioK2V 1C3
Telephone: (613)591-2003
FAX: (613) 591-1006
CHINA (SHANGHAI)
ANRITSU ELECTRONICSCO LTD
2F,Rm.B, 52Section Factory Bldg.
NO 516Fu Te Road (N)
Waigaoqiao Free Trade Zone
Pudong, Shanghai200131
PR CHINA
Telephone: 86-21-58680226
FAX: 86-21-58680588
FRANCE
ANRITSU S.A
9 Avenue du Quebec
Zone deCourtaboeuf
91951 LesUlis Cedex
Telephone: 016-09-21-550
FAX: 016-44-61-065
GERMANY
ANRITSU GmbH
Grafenberger Allee54-56
D-40237 Dusseldorf
Germany
Telephone: 0211-968550
FAX: 0211-9685555
INDIA
MEERA AGENCIES (P) LTD
A-23 HauzKhas
New Delhi,India 110 016
Telephone: 011-685-3959
FAX: 011-686-6720
ISRAEL
TECH-CENT, LTD
4 RaulValenberg St.
Tel-Aviv,Israel 69719
Telephone: 972-36-478563
FAX: 972-36-478334
ITALY
ANRITSU Sp.A
Rome Office
Via E. Vittorini, 129
00144 RomaEUR
Telephone: (06)50-2299-711
FAX: 06-50-22-4252
JAPAN
ANRITSU CUSTOMER SERVICELTD.
1800 OnnaAtsugi—shi
Kanagawa-Prf. 243Japan
Telephone: 0462-96-6688
FAX: 0462-25-8379
KOREA
ANRITSU SERVICE CENTER
8F SanwonBldg.
1329-8 Seocho-Dong
Seocho-Ku
Seoul, Korea137-070
Telephone: 82-2-581-6603
FAX: 82-2-582-6603
SINGAPORE
ANRITSU (SINGAPORE)PTE LTD
10, HoeChiang Road
#07-01/02
Keppel Towers
Singapore 089315
Telephone:65-282-2400
FAX:65-282-2533
SOUTH AFRICA
ETESCSA
12 SurreySquare OfficePark
330 SurreyAvenue
Ferndale, Randburt,2194
South Africa
Telephone: 011-27-11-787-7200
Fax: 011-27-11-787-0446
SWEDEN
ANRITSU AB
Botvid Center
Fittja Backe13A
145 84
Stockholm, Sweden
Telephone: (08)534-707-00
FAX: (08)534-707-30
TAIWAN
ANRITSU CO.,LTD.
6F, No.96, Section 3
Chien KuoN. Road
Taipei, Taiwan, R.O.C.
Telephone: (02)515-6050
FAX: (02) 509-5519
UNITED KINGDOM
ANRITSU LTD.
200 CapabilityGreen
Luton, Bedfordshire
LU1 3LU,England
Telephone: 015-82-43-3200
FAX: 015-82-73-1303
1-7

Chapter 2 Quick Start Guide
MS2711A
MODE
FREQ / SPAN
AMPLITUDE
BW/SWEEP
Figure 2-1. MS2711A Power ON/OFF Key
1
TRACE MEAS
3
RECALL
SAVE
SETUP
SETUP
5
LIMIT
MARKER
7
RECALL
SAVE
DISPLAY
DISPLAY
9
PRINT
ON
OFF
ESCAPE
CLEAR
2
4
6
ENTER
8
SINGLE
CONT
+
0
-
/
SYS
.
ON/OFF Key
2-0

Chapter 2
Quick Start Guide
Introduction
This chapter provides a brief overview of the Anritsu MS2711A HHSA. The intent of this
manual is to provide the user with a starting point for making basic measurements. For
more detailed information, users may want to consult Chapter 3, Key Functions or Chapter
4, Advanced Measurement Functions.
Turning the MS2711A On for the First Time
The Anritsu MS2711A HHSA is a lightweight, hand held, battery operated unit designed
specifically for field environments and applications requiring mobility. It is capable of up to
2.5 hours of continuous operation from a fully charged, field-replaceable battery. Built-in
energy conservation features allow battery life to be extended over an eight-hour workday.
The Anritsu MS2711A HHSA can also be operated from a 12.5 Vdc source (which will
also simultaneously charge the battery). This can be achieved with either the Anritsu
AC-DC Adapter (P/N 40-115) or 12.5 Vdc Automotive Cigarette Lighter Adapter (P/N
806-62). Both items are included as standard accessories (see Chapter 1).
2
Press the ON/OFF front panel button (Figure 2-1, facing page).
The HHSA takes about five seconds to perform a series of self-diagnostic and
adjustment routines. At completion, the screen displays the Anritsu logo, the
model number, the version of firmware. It also prompts you to press ENTER to
continue.
The Anritsu HHSA is now ready for operation. No additional keystrokes or in
stallation are required. For information on making measurements with the
Anritsu HHSA, refer to “Making a Basic Measurement,” on page 2-9. For ad
vanced applications, refer to Chapter 4, “Advanced Measurement
Fundamentals.”
-
-
2-1

Chapter 2 Quick Start Guide
Front Panel Overview
The Anritsu HHSA menu-driven user interface is easy to use and requires little training.
Hard keys on the front panel are used to initiate function-specific menus. There are four
function hard keys located below the display, Mode, Frequency/Span, Amplitude and Band
width/Sweep.
-
There are seventeen keypad hard keys located to the right of the display. Twelve of the key
pad hard keys are dual purpose, depending on the current mode of operation. The dual pur
pose keys are labeled with one function in black, the other in blue.
There are also six soft keys that change function depending upon the current mode selec
tion. The current soft key function is indicated in the active function block to the right of
the display. The locations of the different keys are illustrated in Figure 2-2, below.
Soft Keysctive Function Block
MODE
FREQ / SPAN
AMPLITUDE
MS2711A
BW/SWEEP
TRACE MEAS
SAVE
SETUP
LIMIT
SAVE
DISPLAY
ON
OFF
ESCAPE
CLEAR
2
1
3
4
RECALL
SETUP
6
5
MARKER
ENTER
8
7
SINGLE
RECALL
CONT
DISPLAY
PRINT
+
0
-
/
SYS
.
9
Keypad Hard Keys
-
-
Function Hard Keys
Figure 2-2. MS2711A Soft Keys
Figures 2-3 and 2-4 illustrate the menu structures and soft key labels for each menu selec
tion. Refer to Chapter 3, Key Functions, for more detailed hard and soft key descriptions.
2-2
-

MODE MENU SOFT KEYS
A
SPECTRUM
NALYZER
(DEFAULT)
FREQ/SPAN
CENTER
START
STOP
SPAN
CENTER SPAN START
GHz
EDIT
MHz
FULL
ZERO
STOP
kHz
Chapter 2 Quick Start Guide
Hz
SPAN
UP
1-2-5
SPAN
DOWN
1-2-5
BACK
AMPLITUDE
ATTEN
UNITS
BW/SWEEP
RBW
VBW
POWER
MONITOR
DETECTION
POWER MONITOR
REF
LEVEL
AUTO
dBm
RBW
AUTO
AUTO
POSITIVE
PEAK
UNITS REL
SCALE
MANUAL
dBV
VBW
MANUAL
MANUAL
AVERAGE
ATTEN
dBmV dBuV
MAX
HOLD
NEGATIVE
PEAK
OFFSET ZERO
EDIT
EDIT
EDIT
UNITS
DETEC-
TION
BACK
BACK
BACK
BACK
Figure 2-3. Function Hard Keys Menu Structure
2-3

Chapter 2 Quick Start Guide
A
MODE MENU SOFT KEYS
SPECTRUM
NALYZER
(DEFAULT)
TRACE
TRACE
RESET
A
B
VIEW
A->B
B
CLEAR
A-B
->
A
RECALL
B
TRACE
->B
A+B
->
A
TRACE
B
BACK
%
TYPE
MAIN
BW
EDIT
2
2
AM/FM
DEMOD
VOLUME
CHANNEL
MULTIPLE
LOWER
LIMITS
SEGMENT
SEGMENT
M3
MEAS
FIELD
STRNGTH
OBW
AM/FM
DEMOD
ACP
LIMIT
SINGLE
LIMIT
MULTIPLE
UPPER
LIMITS
MULTIPLE
LOWER
LIMITS
MARKER
FIELD
STRNGTH
ON/OFF
METHOD
ON/OFF
CENTER
FREQ
SINGLE
LIMIT
ON/OFF
SEGMENT
SEGMENT
M1
1
1
OBW
SELECT
ANTENNA
DEMOD
CHANNEL
MULTIPLE
UPPER
LIMITS
SEGMENT
SEGMENT
M2
dBc
ADJ
BW
BEEP
AT
LEVEL
3
3
CHANNEL
POWER
CHANNEL
SPACING
LIMIT
BEEP
SEGMENT
4
SEGMENT
4
M4
ACP
MEASURE
MEASURE
SEGMENT
5
SEGMENT
5
ALL
OFF
BACK
BACK
BACK
BACK
BACK
BACK
BACK
ON/OFF
ON/OFF
OPTIONS
PRINTER
HOUR
SYS
OPTIONS
CLOCK
M1
M2
M3
M4
Figure 2-4. Keypad Hard Keys Menu Structure
2-4
EDIT
EDIT
CLOCK
CHANGE
DATE
FORMAT
MINUTE
DELTA
(Mx - M1)
SELF
TEST
MONTH
MARKER
TO
PEAK
MARKER
TO
PEAK
DAY
MARKER
FREQ TO
CENTER
MARKER
FREQ TO
CENTER
YEAR
BACK
BACK
BACK

Chapter 2 Quick Start Guide
Test Panel Connectors
The connectors and indicators located on the test panel are listed and described below.
12.5-15VDC
(1100 mA)
When using the AC-DC Adapter, always use a three-wire power cable con
nected to a three-wire power line outlet. If power is supplied without grounding
the equipment in this manner, there is a risk of receiving a severe or fatal electric
shock.
Battery
Charging
External
Power
Headphone
Jack
Serial
Interface
RF In 50-Ohm RF input for spectrum analysis and stimulus-response measurements.
RF Det RF detector input for the Power Monitor (Option 5).
DC input to power the unit or for battery charging.
Input is 12.5 to 15 Vdc @ 1100 mA.
WARNING
-
Indicator light to show that the battery is being charged. The indicator light auto
matically shuts off when the battery is fully charged.
Indicator light to show that the Anritsu is being powered by the external charg
ing unit.
Allows connection of audio headphones for monitoring AM/FM demodulation.
RS232 DB9 interface to a COM port on a personal computer (for use with the
Anritsu Software Tools program). Also provides a serial interface to a printer.
-
-
Battery
Compartment
Contains the NiMH battery, part number 633-27. To open, turn the fastener
¼-turn counter-clockwise, pull up and remove the battery compartment door.
Remove the battery by pulling straight up on the battery lanyard. Replacement is
the opposite of removal.
2-5

Chapter 2 Quick Start Guide
Making Spectrum Analyzer Measurements
Required Equipment
MS2711A Hand Held Spectrum Analyzer
·
Test Port Extension Cable, Anritsu 15NNF50-1.5A
·
Procedure
Step 1. Press the ON/OFF key.
Step 2. Press the MODE key and use the Up/Down arrow key to select Spectrum Ana
lyzer mode. Press ENTER to set the mode.
Making a Measurement
Step 1.
Step 2. Locate and display the signal(s) of interest by selecting the desired frequency,
Connect the input cable to the RF In test port.
span, and amplitude value.
Selecting the Frequency
Step 1.
Step 2.
Press the FREQ/SPAN key to display the Frequency menu.
To enter a center frequency, select the CENTER soft key and enter the desired
center frequency on the keypad. Select the GHz, MHz, kHz,orHz softkey to
accept the center frequency input.
or
To set a specific frequency band, select the START soft key and enter the desired start frequency on the keypad. Select the GHz, MHz, kHz,orHz softkey
to accept the start frequency input. Then select the STOP soft key and enter the
desired stop frequency on the keypad. Select the GHz, MHz, kHz,orHz softkey
to accept the stop frequency input.
Selecting the Span
-
Step 1.
Step 2.
Step 3.
NOTE: To quickly move the span value up or down, select the SPAN UP 1-2-5
or SPAN DOWN 1-2-5 soft keys. These keys facilitate a zoom-in, zoom-out in a
1-2-5 sequence.
Press the FREQ/SPAN key to display the Frequency menu.
Press the SPAN soft key to display the Span menu.
For a full span, select the FULL soft key.
or
For no span, select the ZERO soft key.
or
To set a specific span, select the EDIT soft key and enter the desired span on the
keypad. Select the GHz, MHz, kHz,orHz soft key to accept the span.
2-6

Selecting the Amplitude
Chapter 2 Quick Start Guide
Step 1.
Step 2.
Step 3.
Step 4.
Step 5.
NOTE: Select AUTO coupling to help insure that harmonics and spurs are not
introduced into the measurements.
Press the AMPLITUDE key.
Press the REF LEVEL soft key and use the up/down arrow key or directly enter
the desired reference level from the keypad. Press ENTER to set the amplitude
level.
Press the SCALE soft key and use the up/down arrow key or directly enter the
desired scale from the keypad. Press ENTER to set the scale.
Press the UNITS soft key and select the desired units from the soft keys pre
sented. Press ENTER to set the units selection.
Press the ATTEN soft key to set the attenuation. Select either the AUTO or
MANUAL soft key. AUTO automatically couples the attenuator setting to the
reference level. MANUAL allows editing of the attenuator setting. Press the
EDIT soft key and use the up/down arrow key to select the attenuator level.
Press ENTER to set the attenuator level.
Selecting Bandwidth Parameters
Step 1.
Step 2.
Press the BW/SWEEP key to display the bandwidth menu.
To select the resolution bandwidth, press the RBW soft key.
-
Step 3.
Step 4.
Step 5.
Select AUTO for automatic resolution bandwidth selection, or select EDIT and
use the Up/Down arrow key to select the resolution bandwidth. Press ENTER to
set the resolution bandwidth.
To select the video bandwidth, press the VBW soft key.
Select AUTO for automatic video bandwidth selection, or select EDIT and use
the Up/Down arrow key to select the video bandwidth. Press ENTER to set the
video bandwidth.
Selecting Sweep Parameters
Step 1.
Step 2.
To toggle maximum hold ON or OFF, press the MAX HOLD soft key. Maxi
mum hold displays the maximum response of the input signal.
To set the detection method, press the DETECTION soft key and select either
POSITIVE PEAK, AVERAGE, or NEGATIVE PEAK detection.
Adjusting Markers
Step 1.
Step 2.
Step 3.
Press the MARKER key to call up the Markers menu.
Press the M1 soft key to select the M1 marker function.
Press the EDIT soft key and enter an appropriate value using the keypad or
Up/Down arrow key. Select the GHz, MHz, kHz,orHz softkey to accept the
marker frequency input. Pressing the ON/OFF soft key activates or deactivates
the M1 marker function.
-
2-7

Chapter 2 Quick Start Guide
Step 4.
Step 5. Repeat the steps for markers M2, M3, and M4.
Press the BACK soft key to return to the Markers Menu.
Adjusting Limits
Step 1.
Step 2. Enter the desired numerical value using the keypad or Up/Down arrow key.
Step 3.
Press the LIMIT key.
Press ENTER when the data entry is complete.
Adjusting Attenuator Settings
Step 1.
Step 2.
Step 3.
Step 4.
NOTE: AUTO coupling helps insure that harmonics and spurs are not introduced into the measurements.
Press the AMPLITUDE key.
Press the ATTEN soft key.
Select AUTO to automatically couple the attenuator setting to the reference
level.
Select EDIT to adjust the attenuation setting. Use the Up/Down arrow key to se
lect the attenuation setting and press ENTER to set.
-
2-8

Chapter 2 Quick Start Guide
Making a Basic Measurement
Making a basic measurement with the Anritsu HHSA is similar to conventional spectrum
analyzers. Users need simply to power-on and tune the Anritsu Hand Held Spectrum Ana
lyzer to locate and display a signal on the screen of the hand held spectrum analyzer. Once
a signal is displayed the user can measure the signal input in four simple steps to determine
the frequency and amplitude of the signal.
These steps include:
Setting the center frequency.
r
Setting the frequency span.
r
Setting the amplitude.
r
Activating the marker.
r
-
NOTE: Frequency, span and amplitude are the fundamental functions for spec
trum analyzer measurements. However, by using marker functions, you are
able to easily read out frequencies and amplitudes on the spectrum analyzer
trace. This lets you make relative measurements, automatically locate the signal of the highest amplitude on a trace, and tune the spectrum analyzer to track
a signal automatically. For more information, please refer to Chapter 4, “Advanced Measurement Fundamentals.”
Example – Measuring a 900 MHz signal
Step1.
Step2. Connect a signal generator to the input of the Anritsu HHSA and configure it to
Set the center frequency
Step1.
Step2.
NOTE: To set the center frequency to 900 MHz, use the numerical keypad to
the right of the display. The data keys allow you to select the exact numeric
value of the active function, which in this example is the center frequency.
When activating the center frequency function, the hand held spectrum ana
lyzer is set to the center-frequency span mode.
Press the ON/OFF key, then the ENTER key when prompted.
provide a -10dBm, 900 MHz signal.
Press the FREQ/SPAN key.
Press the CENTER frequency soft key.
-
-
Step3.
Enter 900 on the keypad and select the MHz soft key . Observe that the signal
resembles that shown in Figure 2-5.
2-9
Chapter 2 Quick Start Guide
Figure 2-5. Signal at 900 MHz
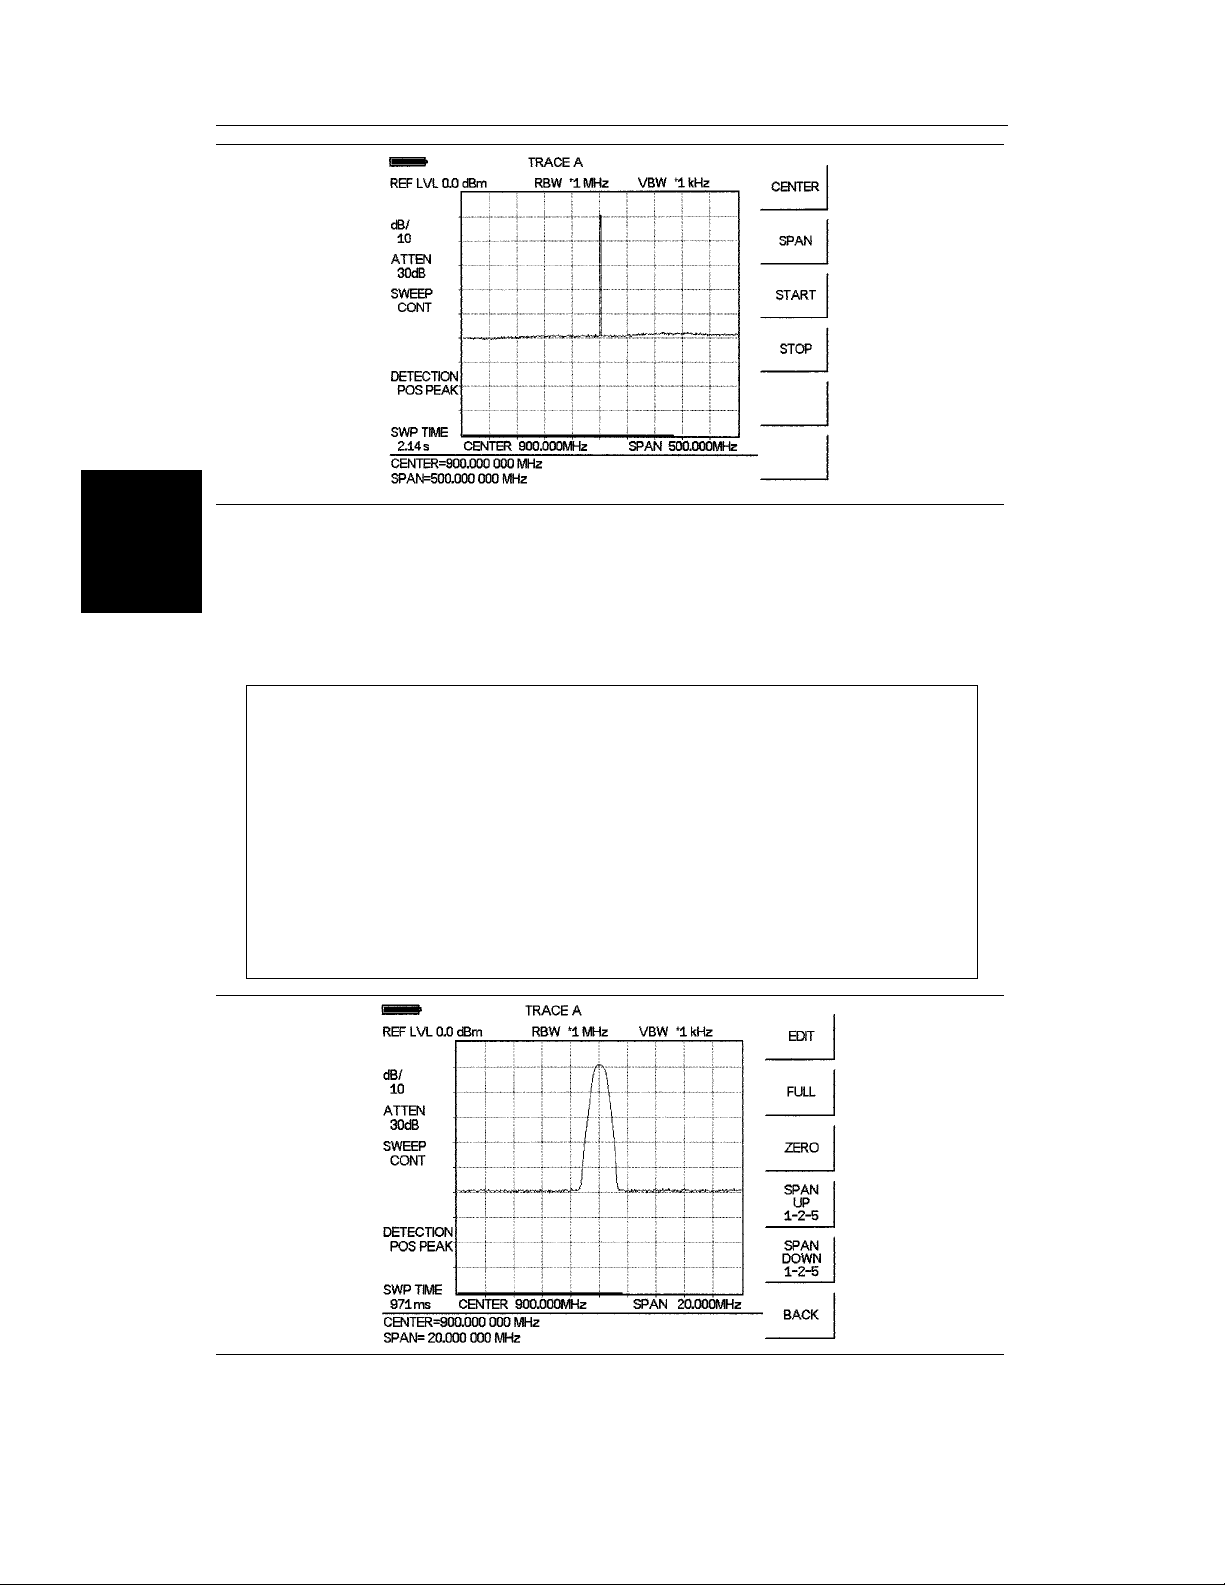
Set the frequency span
Step 1. Press the FREQ/SPAN key.
Step 2.
The Span menu is now displayed in the active function block. When activating
the span function, the hand held spectrum analyzer is set to the center-frequency span mode.
Choices within the span menu include EDIT, ZERO, FULL SPAN, SPAN UP
1-2-5, and SPAN DOWN 1-2-5. The span can be set to 0 Hz using either the
data keys or activating ZERO SPAN in the span menu. To reduce the frequency span ¾ for example, to 20 MHz ¾ either press 20 on the keypad and
press the MHz soft key, or use the down arrow key to “step down” to the value.
(Like data keys, step keys can also be used to change the numeric value of the
active function.) A span of 20 MHz is shown in Figure 2-6.
Press SPAN soft key.
Figure 2-6. 20 MHz Frequency Span
2-10

Set the amplitude
Chapter 2 Quick Start Guide
Generally, placing the signal peak at the reference level provides the best measurement ac
curacy. The following steps will adjust the signal peak to the reference level (Figure 2-7).
Step 1. Press the AMPLITUDE key.
Step 2.
Step 3.
Step 4. Press the +/– key and 10 on the keypad and press ENTER to set the reference
Press the ATTEN soft key and the AUTO soft key to select automatic attenua
tion.
Press BACK soft key and then the REF LEVEL soft key.
level to –10 dBm. Observe that the display resembles that shown in Figure 2-7.
-
-
Figure 2-7 Reference Level set at –10 dBm
Step 5.
Step 6.
Press the SCALE soft key and use the key pad or up/down arrow key to select a
scale of 10 dB/. Press the ENTER key to set the scale.
Press the UNITS soft key and select dBm as the amplitude units.
2-11

Chapter 2 Quick Start Guide
Activate the marker
The marker reads both the frequency and the amplitude, and it displays these values in the
message area at the bottom of the display. In this case, the marker will read 900 MHz and
–10.00 dBm, as shown in Figure 2-8.
Step 1. Press the MARKER key.
Step 2.
Step 3.
Step 4.
Step 5. Read both frequency and the amplitude values identified by the selected marker.
Press the M1 soft key .
Press the ON/OFF soft key to activate the selected marker.
Press the MARKER TO PEAK soft key to set marker M1 to the highest point
on the trace.
These values are displayed in the message area at the bottom of the display
(Figure 2-8).
Figure 2-8. Activated Normal Marker
NOTE: Marker’s can be placed the peak of the signal by pressing PEAK, or by
using the up/down arrow key to move the marker manually.
When using more than one marker, it may be desirable to use the marker delta
function, defined as delta (M1–Mx) in the active function box. The marker delta
function reads the difference in amplitude and frequency between two signals
and displays the values in the area below the display.
2-12

Save the Display
Chapter 2 Quick Start Guide
Step 1.
Step 2. To enter a name for the display, press the soft key letter group that contains the
Step 3.
Press the SAVE DISPLAY key.
desired letter, then select the soft key for that letter. Continue to select letters up
to a maximum of 16 characters.
Press ENTER to set the saved display name.
Recall the Display
Step 1.
Step 2. Select the desired display using the Up/Down arrow key.
Step 3.
Press the RECALL DISPLAY key.
Press ENTER to recall the selected display.
Printing
Printing is accomplished using the Seiko DPU-414 thermal printer, the Hewlett Packard
DeskJet 340 ink jet printer, or any printer listed in theMS2711A printer selection table .
Figure 2-9 shows a setup diagram for two types of printers. Refer to the printer manual for
setup details.
Printer Switch Settings
Set the switches on the serial-to-parallel interface cable to the HP Deskjet 340 ink jet
printer or other parallel interface printer as follows:
SW1 SW2 SW3 SW4 SW5 SW6 SW7 SW8
OFF ON OFF OFF OFF OFF ON OFF
Set the switches, SW1, SW2, and SW3, on the Seiko DPU-414 thermal printer as follows:
Switch
SW1 OFF ON ON ON ON OFF ON ON
SW2 ON ON ON ON ON ON ON OFF
SW3 ON ON ON OFF OFF ON ON ON
1 2 3 4 5 6 7 8
2-13

Chapter 2 Quick Start Guide
Printing a Screen
Step 1. Connect the printer as shown in Figure 2-9.
SEIKO
PRINTER
SERIAL CABLE
2000-756
HP 340
DESKJET
SERIAL-TO-PARALLEL
INTERFACE CABLE
2000-753
Figure 2-9. Printer Setup
Step 2. Obtain the desired measurement display
Step 3.
Step 4.
Press the SYS key and the OPTIONS soft key.
Press the PRINTER soft key and select from the displayed menu of supported
printers..
Step 5.
Step 6.
Press the PRINT key.
Press ENTER.
2-14

Chapter 2 Quick Start Guide
Determining Remaining Battery Life
When the AC-DC adapter is disengaged from the Site Master, a battery indicator symbol is
continuously displayed at the top-left corner of the display (Figure 2-10). A totally black
bar indicates a fully charged battery.
Battery Monitor
Figure 2-10. Battery Monitor
During operation, the battery condition can be viewed by pressing the SYS key and selecting the SELF TEST soft key. The battery condition will be displayed as a percentage of
charge remaining.
SELF TEST
VOLTAGE........ .BATTERY 11.1V
TEMPERATURE.... 24°C
BATTERY CAL......PASSED
MEMORY..........PASSED
LO................PASSED
BATTERY CHARGE = 84%
PRESS ENTER TO CONTINUE
Figure 2-11. Self Test Battery Condition Display
2-15

Chapter 2 Quick Start Guide
Symbols
Table 2-1 provides a listing of the symbols used as condition indicators on the LCD display.
Table 2-1. LCD Icon Symbols
Icon Symbol
Anritsu HHSA is in power conservation mode. To resume sweeping,
HOLD
T
press the ENTER key. After 10 minutes without a key press, the Anritsu
HHSA will automatically enter power conservation
Lock fail indication. Check battery. (If the Anritsu HHSA fails to lock
with a fully charged battery, call your Anritsu Service Center.)
Indicates the remaining charge on the battery. The inner white rectangle
grows longer as the battery charge depletes.
Self Test
At turn-on, the Anritsu HHSA runs through a series of quick checks to ensure the system is
functioning properly. Note that the battery voltage and temperature are displayed in the
lower left corner below the self test message. If the battery is low, or if the ambient temperature is not within the specified operational range, Self Test will fail. If Self Test fails AND
the battery is fully charged AND the Anritsu HHSA is within the specified operating range,
call your Anritsu Service Center.
2-16

Error Codes
Self Test Errors
A listing of Self Test Error messages is given in Table 2-2.
Table 2-2. Self Test Error Messages
Chapter 2 Quick Start Guide
Error Message
BATTERY LOW
EXTERNAL
POWER LOW
PLL FAILED
EEPROM R/W
FAILED
OUT OF TEMP.
RANGE
NOTE: A listing of current Anritsu service centers is givenin Table 1-3 , page 1-7.
Battery voltage is less than 10 volts. Charge battery. If condition per
sists, call your Anritsu Service Center.
External supply voltage is less than 10 volts. Call your Anritsu Ser
vice Center
Phase-locked loops failed to lock. Charge battery. If condition per
sists with a fully charged battery, call your Anritsu
Service Center
Non-volatile memory system has failed. Call your Anritsu Service
Center.
Ambient temperature is not within the specified operating range. If
the temperature is within the specified operating range and the condition persists, call your Anritsu Service Center.
Description
Range Errors
A listing of Range Error messages is given in Table 2-3.
Table 2-3. Range Error Messages
Error Message
Description
-
-
-
NO STORED
SWEEP AT THIS
LOCATION
USE OPTIONS
MENU TO
SELECT A
PRINTER
CANNOT ZERO
NO DETECTOR
INSTALLED
CANNOT ZERO
INPUT SIGNAL
TOO HIGH
POWER MONITOR
OPTION NOT
INSTALLED
Attempting to recall a display from a location that has not been previ
ously written to. That is, the location does not contain stored sweep.
Attempting to print a display with no printer selected. Select a printer,
then retry.
Attempting to perform a Power Monitor zero adjust function with no
RF detector connected to the Anritsu HHSA.
Attempting to perform a Power Monitor zero adjust function with an
input of greater than –20 dBm.
Attempting to enter Power Monitor mode with no option 5 installed.
2-17
-

Chapter 2 Quick Start Guide
Using the Soft Carrying Case
The soft carrying case has been designed such that the strap can be unsnapped to allow the
case to be easily oriented horizontally; thus allowing the Anritsu controls to be more easily
accessed (Figure 2-12).
Figure 2-12. Using the Soft Carrying Case
2-18

Chapter 3
Key Functions
Introduction
This chapter provides a description of the Anritsu MS2711A Hand Held Spectrum Analyzer
keypad controls. There are two kinds of keys available on the MS2711A front panel: Hard
Keys and Soft Keys.
Hard Keys
Hard keys are those keys on the front panel that are labeled in black or blue and perform
specific functions as explained below. There are four function hard keys, located below the
display, and seventeen keypad hard keys located to the right of the display. Twelve of the
keypad hard keys are dual purpose, depending on the current mode of operation.
Function Hard Keys
MODE Sets the Anritsu HHSA to a specific mode of operation. Use the Up/Down
arrow key to select either spectrum analyzer mode or power monitor mode
(if Option 5 is installed). Press the ENTER key to implement the selection.
3
FREQ/SPAN Activates a menu of frequency and span related functions for selection us-
ing the soft keys. Available choices from this menu include CENTER,
SPAN, START frequency and STOP frequency. Soft key selection of
any of these functions brings up a set of choices or selections specific to
that procedure.
AMPLITUDE
BW/SWEEP Activates a menu of bandwidth and sweep related functions including
Activates a menu of amplitude related functions including REF LEVEL,
SCALE, ATTEN, and UNITS. Soft key selection of any of these func
tions brings up a set of choices or selections specific to that procedure.
RBW, VBW, MAX HOLD, and DETECTION. Soft key selection of any
of these functions brings up a set of choices or selections specific to that
procedure.
-
3-1

Chapter 3 Key Functions
Keypad Hard Keys
The following keypad hard key functions are printed in black on the keypad keys.
0-9 These keys are used to enter numerical data as required to setup or per
form measurements.
+/–
·
ESCAPE
CLEAR
UP/DOWN
ARROWS
ENTER Implements the current action or parameter selection.
ON
OFF
SYS
The plus/minus key is used to enter positive or negative values as required
to setup or perform measurements.
The decimal point is used to enter decimal values as required to setup or
perform measurements.
Exits the present operation or clears the display. If a parameter is being
edited, pressing this key will clear the value currently being entered and
restore the last valid entry. Pressing this key again will close the parame
ter. During normal sweeping, pressing this key will move up one menu
level.
Increments or decrements a parameter value. The specific parameter value
affected typically appears in the message area of the LCD.
Turns the Anritsu HHSA on or off. When turned on, the system state at
the last turn-off is restored. If the ESCAPE/CLEAR key is held down
while the ON/OFF key is pressed, the factory preset state will be restored.
Allows selection of system setup parameters. Choices are OPTIONS,
CLOCK, and SELF TEST.
-
-
3
The following keypad hard key functions are printed in blue on the keypad keys.
Turns the liquid crystal display (LCD) back-lighting ON or OFF.
(Leaving back lighting off conserves battery power.)
LCD Contrast adjust. Use the Up/Down arrow key and ENTER to adjust
the display contrast to suit ambient conditions.
TRACE Activates a menu that allows comparison of a current runtime trace
(Trace A) to a saved trace (Trace B).
MEAS Activates a menu of measurement related functions including field
strength, occupied bandwidth (OBW), and AM/FM Demodulation.
SAVE
SETUP
RECALL
SETUP
Saves the current system setup to 1 of 10 internal non-volatile memory lo
cations. When the key is pressed, a Save Setup selection box appears on
the display. Use the Up/Down arrow key to select a setup location and
press the ENTER key to implement.
Recalls a previously saved setup from memory location 1 through 10.
When the key is pressed, a Recall Trace selection box appears on the dis
play. Select a setup using the Up/Down arrow key and press the ENTER
key to implement. Setup location 0 recalls the factory preset state.
3-2
-
-

Chapter 3 Key Functions
LIMIT Activates a menu of Limit functions including single limit, multiple upper
limits, multiple lower limits, and limit beep.
MARKER Activates a menu of marker functions for markers 1 through 4. Each
marker, when selected, activates marker to peak and marker frequency to
center functions. Markers 2 through 4 also include delta marker functions
referenced to M1.
SAVE
DISPLAY
RECALL
DISPLAY
SINGLE
CONT
PRINT Prints the current display to the selected printer.
Saves the displayed trace to non-volatile memory. When the key is
pressed, TRACE NAME: appears on the display. Select the alphanumeric
characters for that trace name and press ENTER key to implement.
Recalls a previously saved trace from memory. When the key is pressed, a
Recall Trace selection box appears on the display. Select a trace using the
Up/Down arrow key and press the ENTER key to implement.
Toggles the units sweep between continuous sweep mode and single
sweep mode. The default is continuous sweep. When single sweep is
selected, the Anritsu HHSA will sweep once and hold until activated. The
currently selected sweep mode appears on the LCD. Single sweep mode
can be used to conserve battery power.
3-3

Chapter 3 Key Functions
Soft Keys
Soft keys are the six unlabeled keys (see Figure 2-2, page 2-2) that perform different func
tions depending on the currently selected soft key menu. The available selections for the
softkeys are displayed in the active function block.
The following paragraphs relate the menus displayed in the active function block when the
various function hard keys or keypad hard keys are selected.
Frequency Menu
Pressing the FREQ/SPAN key activates a menu of frequency related choices in the active
function block. Use the corresponding softkey to select the desired function, explained
below. Use the keypad or Up/Down arrow key to change or enter values shown in the mes
sage area. Complete the entry by pressing the appropriate softkey frequency designation.
CENTER Activates the center frequency function and sets the Anritsu HHSA to the
center frequency. A specific center frequency can be entered by using the
keypad or Up/Down arrow key. Select the GHz, MHz, kHz,orHz
softkey to accept the center frequency input.
START Activates the start frequency and sets the Anritsu HHSA in the Start/Stop
mode. Select the desired start frequency and complete the entry by pressing the GHz, MHz, kHz,orHz softkey to accept the start frequency in-
put.
STOP Activates the stop frequency and sets the Anritsu HHSA in the Start/Stop
mode. Select the desired stop frequency and complete the entry by pressing the GHz, MHz, kHz,orHz softkey to accept the stop frequency input.
-
-
Span Menu
Pressing the SPAN soft key activates a menu of span related choices in the active function
block. Use the corresponding softkey to select the desired function, explained below. Use
the keypad or Up/Down arrow key to change or enter values shown in the message area.
EDIT Allows direct entry of a specific frequency span. Use the keypad or
Up/Down arrow key to select the span of choice and complete the entry
by pressing the GHz, MHz, kHz,orHz softkey.
FULL Sets the Anritsu HHSA to its maximum frequency span, 2.999 GHz.
ZERO Sets the span to 0 Hz.
SPAN
UP
1-2-5
SPAN
DOWN
1-2-5
BACK Returns to the previous menu level.
Activates the span function so that the span may be increased quickly in a
1-2-5 sequence.
Activates the span function so that the span may be reduced quickly in a
1-2-5 sequence.
3-4

Amplitude Menu
Chapter 3 Key Functions
Pressing AMPLITUDE activates a menu of amplitude related functions. Use the corre
sponding softkey to select the desired amplitude function.
REF LEVEL Activates the amplitude reference level function.
SCALE Activates the scale function in a 2 through 15 dB logarithmic amplitude
scale.
ATTEN Sets the Anritsu HHSA input attenuator so that it is either coupled auto
matically to the reference level (AUTO) or manually adjustable (MAN
UAL).
UNITS
Bandwidth Menu
Pressing BW/SWEEP activates a menu of bandwidth related functions. Use the corresponding softkey to select the desired bandwidth function.
RBW Sets the resolution bandwidth so that it is either coupled automatically to
Choose from the menu of amplitude related units. Selection of dBm sets
absolute decibels relative to 1 mW as the amplitude unit. Selection of
dBV, dBmV or dBmV sets absolute decibels relative to 1 volt, 1 millivolt,
or 1 microvolt respectively as the amplitude unit.
the span (AUTO) or manually adjustable (MANUAL).
-
-
-
VBW Sets the video bandwidth so that it is either coupled automatically to the
span (AUTO) or manually adjustable (MANUAL).
Sweep Menu
Pressing BW/SWEEP activates a menu of sweep related functions. Use the corresponding
softkey to select the desired sweep function.
MAX HOLD Displays and holds the maximum responses of the input signal.
DETECTION
BACK Returns to the previous menu level.
Trace Menu
Pressing the TRACE key activates a menu of trace related functions. Use the corresponding
softkey to select the desired trace function.
NOTE: For this function, Trace A is always the runtime trace, and Trace B is al
ways a saved trace. Refer to page 3-9 for information on saving and recalling
traces.
Accesses a menu of detector modes including POSITIVE PEAK detec
tion, AVERAGE detection and NEGATIVE PEAK detection.
-
-
3-5

Chapter 3 Key Functions
RESET
A
A ® B Stores the current runtime trace into the Trace B buffer.
A–B
®
A
A+B
®
A
TRACE
B
Measurement Menu
Pressing MEAS on the data keypad activates a menu of measurement related functions. Use
the corresponding softkey to select the measurement function.
Clears the current runtime trace.
Performs a subtraction trace math operation.
Performs an addition trace math operation.
Accesses a menu of saved trace options.
VIEW B - Provides a trace overlay of the saved trace with the current
runtime trace.
CLEAR B - Turns off trace overlay.
RECALL TRACE ® B - Recalls the saved trace B buffer.
BACK - Returns to the previous menu.
FIELD
STRENGTH
OBW
AM/FM
DEMOD
Accesses a menu of field strength measurement options.
ON/OFF - Turns field strength measurements on or off.
SELECT ANTENNA - Selects an antenna profile to be used for field
strength measurements.
BACK - Returns to the previous menu.
Activates the occupied bandwidth menu. Select either % or dBc method
of occupied bandwidth measurement.
Selecting % allows entry of the desired % of occupied bandwidth to be
measured.
Selecting dBc allows entry of the desired power level (dBc) to be mea
sured.
Accesses a menu of AM/FM demodulation options.
ON/OFF - Turns AM/FM demodulation on or off.
DEMOD TYPE - Selects the type of demodulation to perform:
FM - WIDE BAND
FM - NARROW BAND
AM
VOLUME - Adjust the demodulation speaker volume from 0 to 100.
BACK - Returns to the previous menu.
-
3-6

Chapter 3 Key Functions
CHANNEL
POWER
ACP Accesses a menu of Adjacent Channel Power ratio measurement options:
Save Setup Menu
Pressing SAVE SETUP on the data keypad saves the current system setup to 1 of 10 inter
nal non-volatile memory locations. When the key is pressed, a Save Setup selection box ap
pears on the display. Use the Up/Down arrow key to select a setup and press the ENTER
key to implement.
Recall Setup Menu
Activates Channel Power measurement. Channel power is measured in
dBm. Channel Power density is measured in dBm/Hz.
CENTER FREQ - Activates the center frequency function and sets the
Anritsu HHSA to the center frequency. A specific center frequency can be
entered using the keypad or Up/Down arrow key. Select the GHz, MHz,
kHz,orHz softkey to accept the center frequency input.
MAIN CHANNEL BW - Sets the bandwidth of the main channel.
ADJACENT CHANNEL BW - Sets the bandwidth of the adjacent chan
nel.
CHANNEL SPACING - Sets the channel spacing.
MEASURE - Begins the ACP measurement.
BACK - Returns to the previous menu.
-
-
-
Pressing RECALL SETUP on the data keypad recalls a previously saved setup from memory location 1 through 10. When the key is pressed, a Recall Trace selection box appears on
the display. Select a setup using the Up/Down arrow key and press the ENTER key to implement. Setup location 0 recalls the factory preset state.
Limit Menu
Pressing LIMIT on the data keypad activates a menu of limit related functions. Use the corresponding softkey to select the desired limit function. Then use the Up/Down arrow key to
change its value, which is displayed in the message area at the bottom of the display.
SINGLE
LIMIT
MULTIPLE
UPPER
LIMITS
Sets a single limit value in dBm. Menu choices are:
ON/OFF
EDIT
BEEP AT LEVEL
BACK
Sets multiple user defined upper limits, and can be used to create an upper
limit mask for quick pass/fail measurements. Menu choices are:
SEGMENT 1
SEGMENT 2
SEGMENT 3
SEGMENT 4
SEGMENT 5
BACK
3-7

Chapter 3 Key Functions
MULTIPLE
LOWER
LIMITS
LIMIT
BEEP
Marker Menu
Pressing MARKER on the data keypad activates a menu for the four different markers. Use
the corresponding softkey to select the desired marker. Then use the marker second level
menu to turn the markers on or off, and to edit marker parameters and values.
M1 Selects the M1 marker parameter, displays both amplitude and frequency,
M2 Selects the M2 marker parameter, displays both amplitude and frequency,
Set multiple user defined lower limits, and can be used to create a lower
limit mask for quick pass/fail measurements. Menu choices are:
SEGMENT 1
SEGMENT 2
SEGMENT 3
SEGMENT 4
SEGMENT 5
BACK
Turns the audible limit beep indicator on or off.
and opens the Markers second level menu.
and opens the Markers second level menu.
M3 Selects the M3 marker parameter, displays both amplitude and frequency,
and opens the Markers second level menu.
M4 Selects the M4 marker parameter, displays both amplitude and frequency,
and opens the Markers second level menu.
ALL OFF Turns off all markers.
Marker Menu Second Level Menu
The markers second level menu to turn the markers on or off, and to edit marker parameters
and values.
ON/OFF Turns the selected marker on or off.
EDIT Opens the selected marker parameter for data entry. Enter the desired
marker frequency using the keypad or Up/Down arrow key. Select the
GHz, MHz, kHz,orHz softkey to accept the marker frequency input.
DELTA Displays delta frequency and amplitude for the selected marker with re
spect to the M1 marker.
MARKER
TO
PEAK
Places the selected marker at the highest point on a trace.
-
3-8
MARKER
FREQ TO
CENTER
Places the selected marker equal to the center frequency

Chapter 3 Key Functions
Save Display Menu
Pressing the SAVE DISPLAY key saves the displayed trace to non-volatile memory. When
the key is pressed, “Trace Name:” appears on the display. Select the alphanumeric charac
ters for that trace name and press ENTER key to implement.
Recall Display Menu
Pressing the RECALL DISPLAY key recalls a previously saved trace from memory. When
the key is pressed, a Recall Trace selection box appears on the display. Select a trace using
the Up/Down arrow key and press the ENTER key to implement.
Single Continuous Menu
Toggles the units sweep from continuous sweep mode to single sweep mode, as indicated to
the left side of the display. The default is continuous sweep. When single sweep is acti
vated, the Anritsu HHSA will sweep once and hold until activated. Single sweep mode can
be used to conserve battery power.
Print Menu
Selecting the PRINT key prints the current display to the selected printer.
-
-
System Menu
Pressing SYS on the data keypad activates a menu of system related functions. Use the corresponding softkey to select the system function.
OPTIONS Displays a second level menu of options functions (see below).
CLOCK Displays a second level menu of clock functions (see below).
SELF TEST Starts an instrument self test featuring battery calibration, memory, and
local oscillator testing.
Options Menu Second Level
Provides access to a second level menu of options related functions. Use the corresponding
softkey to select the desired function.
PRINTER Displays a menu of supported printers. Use the Up/Down arrow key and
ENTER key to select the connected printer.
CHANGE
DATE
FORMAT
Clock Menu Second Level
Pressing this soft key changes the format of the date as displayed in the
message area. Choices are DD/MM/YYYY, YYYY/MM/DD,
MM/DD/YY, DD/MM/YY, or YY/MM/DD.
Provides access to a second level menu of clock related functions. Use the corresponding
softkey to select the desired function.
HOUR The hour is displayed in the message area. Enter the desired hour (0-23)
using the keypad and press ENTER to accept.
3-9

Chapter 3 Key Functions
MINUTE The minute is displayed in the message area. Enter the desired minute
(0-59) using the keypad and press ENTER to accept.
MONTH The month is displayed in the message area. Enter the desired month
(1-12) using the keypad and press ENTER to accept.
DAY The day as displayed in the message area. Enter the desired day (1-31) us
ing the keypad and press ENTER to accept.
YEAR The year as displayed in the message area. Enter the desired year
(1997-2038) using the keypad and press ENTER to accept.
BACK Returns user to the top-level systems menu.
Power Monitor Menu
When the mode of operation is changed to Power Monitor, the power monitor menu
provides for setting power monitor parameters.
UNITS Toggles between dBm and Watts.
REL Turns relative mode OFF, if currently ON. If relative mode is currently
OFF, turns it ON and causes the power level to be measured and saved as
the base level. Subsequent measurements are then displayed relative to
this saved value. With units of dBm, relative mode displays dBr; with
units of Watts, relative mode displays % (percent).
OFFSET Turns offset OFF, if currently ON. IF Offset is currently OFF, turns it ON
and opens the Offset parameter for data entry using the keypad. Press
ENTER when data entry is complete. Offset is the attenuation (in dB) inserted in the line between the DUT and the RF detector. The attenuation is
added to the measured input level prior to display.
-
ZERO Turns Zero OFF, if currently ON. IF Zero is currently OFF, turns it ON
and initiates collection of a series of power level samples, which are aver
aged and saved. This saved value is then subtracted from subsequent mea
surements prior to display.
3-10
-
-

Chapter 4
Advanced Measurement
Fundamentals
Introduction
This chapter demonstrates spectrum analyzer measurement techniques using the Anritsu
HHSA. Part I will focus on advanced measurement fundamentals. Part II will focus on mea
surement techniques with examples of typical applications. Each application focuses on dif
ferent features of the Anritsu HHSA. Measurement applications and procedures covered in
this section include:
Resolving Closely Spaced Signals
r
Harmonic Distortion
r
AM/FM Modulation
r
AM/FM Demodulation
r
Segmented Limit Lines
r
Trace Overlay
r
-
-
Advanced Measurement Fundamentals
Advanced measurements require the use of additional spectrum analyzer functions beyond
frequency, span, amplitude and marker functions. In particular, this section will focus on
resolution bandwidth, video bandwidth, sweep, and attenuator functions.
Effect of Resolution Bandwidth
Resolution Bandwidth is determined by the intermediate frequency (IF) filter bandwidth.
The spectrum analyzer traces the shape of its IF filter as it tunes past a signal. If more than
one IF is used in a spectrum analyzer, the narrowest one dominates and is considered the
resolution bandwidth.
The choice of resolution bandwidth depends on several factors. Filters take time to settle.
That is, when a signal first appears at the input of the filter, it will take a while before the
signal appears at the output. Additionally, the output of the filter will take some time to set
tle to the correct value, so that it can be measured. The narrower the filter bandwidth (reso
lution bandwidth) the longer the settling time.
The choice of resolution bandwidth will depend on the signal being measured. If two sig
nals are to be measured individually, then a narrow bandwidth is required. If a wider band
width is used, then the energy of both signals will be included in the measurement. Thus,
the wider bandwidth does not have the ability to look at frequencies selectively but instead
must measure across their entire frequency range at all times.
4
-
-
-
-
4-1

Chapter 4 Advanced Measurement Fundamentals
Therefore, a broadband measurement would include the fundamental frequency, harmonics,
spurious responses, and noise in the measurement. On the other hand a narrow-band mea
surement will filter out all but the desired frequency components, resulting in a measure
ment that includes only the fundamental. There are advantages to each. The ultimate
decision will be dependent on the type of measurement required by the user.
There is always some amount of noise present in a measurement. Noise is often broadband
in nature; that is, is exists at a broad range of frequencies in the frequency domain. If the
noise is included in the measurement, the measured value will be in error (too large) de
pending on the noise level. With a wide bandwidth more noise is included in the measure
ment. With a narrow bandwidth, very little noise enters the resolution bandwidth filter, and
the measurement is more accurate. If the resolution bandwidth is narrower, the noise floor
will drop on the display of the spectrum analyzer. This is because the IF filter of the ana
lyzer has been made narrower in bandwidth, which lets in less noise. As the measured noise
level drops, smaller signals that were previously obscured by the noise can now be mea
sured.
-
-
-
-
-
-
As a general rule of thumb, most field spectrum analyzer measurements are made at a reso
lution bandwidth of 30 kHz.
Effect of Video Bandwidth
Spectrum analyzers typically use another type of filtering after the detector called VIDEO
FILTERING. This filter also affects the noise on the display but in a different manner than
the resolution bandwidth. In video filtering, the average level of the noise remains the same
but the variation in the noise is reduced. Hence, the effect of video filtering is a “smoothing” of the signal noise. The resultant effect on the analyzer’s display is that the noise floor
compresses into a thinner trace, while the position of the trace remains the same. Thus,
changing the video bandwidth (VBW) does not improve sensitivity; however, it does improve discernability and repeatability when making low-level measurements.
As a general rule of thumb, most field spectrum analyzer measurements are made at a video
bandwidth that is a factor of 10 to 100 less than the resolution bandwidth. Thus, for a reso
lution bandwidth of 30 kHz, the typical video bandwidth setting options are either 3 kHz or
300 Hz.
Sweep Limitations
The user normally has control over the SWEEP TIME (the elapsed time of each sweep,
sometimes called SCAN TIME), the frequency range over which the analyzer sweeps, and
the resolution bandwidth. The analyzer cannot be swept arbitrarily fast while maintaining
its specified accuracy, but will have a sweep rate limitation depending on the resolution
bandwidth selected. The sweep rate is not usually chosen by the user but is determined by
the frequency range swept divided by the sweep time.
-
-
The limitation on sweep rate comes from the settling or response time of the resolution
bandwidth filter. If an analyzer is swept very quickly, the filter does not have time to re
spond, and the measurement is inaccurate. Under such conditions, the analyzer display
tends to have a “smeared” look to it, with the spectral lines being wider than normal and
shifted to the right. (Fortunately, the Anritsu Hand Held Spectrum Analyzer has mecha
nisms designed into it that unburden the user from having to calculate the sweep rate.)
4-2
-
-

Chapter 4 Advanced Measurement Fundamentals
Attenuator Functions
Attenuation adjusts the hand held spectrum analyzer input attenuator. In AUTO mode, the
input attenuator is coupled to the reference level. In manual (MANUAL) mode, the input at
tenuation can be adjusted by using the Up/down arrow key. The attenuator range is 0 to 50
dB, in 10 dB steps.
-
Attenuation is normally a coupled function and is automatically adjusted when the refer
ence level changes. The reference level will not change however, when the attenuator
changes. The attenuator should be adjusted so that the maximum signal amplitude at the in
put mixer is –30 dBm or less. For example, if the reference level is + 20 dBm, the attenua
tion is 50 dB for an input signal of –30 dBm at the mixer (20 – 50 = –30). This prevents
signal compression.
NOTE: It is best to begin all measurements in AUTO attenuation mode.
Example 1: Resolving Closely Spaced Signals
Signal resolution is determined by the intermediate frequency (IF) filter bandwidth. The
hand held spectrum analyzer, as do conventional spectrum analyzers, traces the shape of its
IF filter as it tunes past a signal. Thus, if two equal-amplitude signals are close enough in
frequency, the filter shapes for the two signals can fall on top of one another and appear as
a single response. Conversely, if two signals are not equal in amplitude but are still close together, the smaller signal can be hidden under the response of the larger one.
Measurement of Two Signals Having Equal Amplitudes
To resolve two signals of equal amplitude, the resolution bandwidth must be less than or
equal to the frequency separation of the two signals. For example, to resolve two signals of
equal amplitude with a frequency separation of 30 kHz, a resolution bandwidth of 30 kHz
or less should be used. However, most spectrum analyzer IF filter bandwidths are not exact,
varying by as much as ± 20%. This should be taken into consideration whenever testing for
closely spaced signals. Thus, you may want to select the resolution bandwidth within the
lower end of the specification (i.e., –20%, or 24 kHz) to ensure accurate measurements on
two signals spaced to within 30 kHz. In this case the next smallest resolution bandwidth
would be 10 kHz.
-
-
-
Example
Connect two signal sources to the spectrum analyzer input and set the frequency of one
source to 900.0 MHz and the other source to 900.030 MHz. Set both sources to the same
amplitude, preferably – 20 dBm. On the MS2711A HHSA:
Step 1. Set the span to 100 kHz.
Step 2. Set the resolution bandwidth to 30 kHz and the video bandwidth to 1 kHz.
The two signals should be easily observable on the spectrum analyzer display,
spaced 30 kHz apart.
Step 3. Change the resolution bandwidth to a wider value and note that you can no lon
ger see that there are two signals present.
4-3
-

Chapter 4 Advanced Measurement Fundamentals
Example
Keeping the same setup as the previous example, change the two source frequencies to
900.0 MHz and 900.020 MHz. Set both sources to the same amplitude, preferably –20
dBm.
Step 1. Set the span to 100 kHz
Step 2. Set the resolution bandwidth to 100 kHz, video bandwidth to 1 kHz.
Step 3. Change the resolution bandwidth from 100 kHz to 30 kHz then to 10 kHz to de
tect the presence of two signals.
Remember, the resolution bandwidth must be equal to or less than the frequency
separation of the signal. Therefore, a 10 kHz resolution bandwidth must be used.
The next larger filter, 30 kHz, would exceed the 20 kHz separation and thus
would not resolve the two signals. Also, keep in mind that noise side-bands
(phase noise) can also affect resolution.
Measurement of Two Signals Having Unequal Amplitudes
Typically, in real world environments, closely spaced signals do not have equal amplitudes.
Often, the difference between closely spaced signals can be as much as –90 dBm. To re
solve two signals of unequal amplitude, the resolution bandwidth must be less than or equal
to the frequency separation of the two signals (the same as resolving two equal amplitude
signals). However, in this case the largest resolution bandwidth that will resolve the two unequal signals is determined primarily by the shape factor of the IF filter, rather than by the 3
dB bandwidth. Shape factor is defined as the ratio of the 60 dB bandwidth to the 3 dB bandwidth of the IF filter.
Therefore, to resolve two signals of unequal amplitude, the half-bandwidth of a filter at the
point equal to the amplitude separation of the two signals must be less than the frequency
separation of the two signals. However, if you do not know the specific shape factor of the
IF Filter, not all is lost. Simply perform this measurement as if the signals had equal amplitudes but pay close attention to potential signals having unequal power levels that are
closely spaced. This will take some adjusting among the various resolution and video band
width and span functions.
-
-
-
4-4

Chapter 4 Advanced Measurement Fundamentals
Example
Connect two signal sources to the spectrum analyzer input. Set the frequency of one source
to 1900.0 MHz and the other source to 1900.100 MHz. Set one source to the + 20 dBm, and
the other to – 15 dBm.
Step 1. Set the span to 2 MHz
Step 2. Set the resolution bandwidth to 30 kHz and the video bandwidth to 300 Hz.
The two signals should be easily observable on the spectrum analyzer, each with
different amplitudes and spaced 100 kHz apart
Step 3. Change the frequency in the second source from 1900.100 MHz to 1900.050
MHz gradually by turning the knob on the signal source and observe the effect.
Step 4. Change the resolution bandwidth to 10 kHz.
The two signals should still be observable with the 10 kHz resolution band
width, but may be difficult to detect with the 30 kHz resolution bandwidth. Nar
rowing the span may help in detecting the differences in these two signals.
NOTE: Spectrum analyzer sweep time is inversely proportional to the square of
the resolution bandwidth. So, if the resolution bandwidth is reduced by a factor
of ten, the sweep time is increased by a factor of 100. For fastest measurement
times, use the widest resolution bandwidth that still permits resolution of all desired signals.
Example 2: Harmonic Distortion
Most transmitting devices and signal sources contain harmonics. Measuring the harmonic
content of such sources is frequently required. In fact, measuring harmonic distortion is one
of the most common uses of spectrum analyzers.
The following harmonic distortion measurement applies an important group of spectrum
analyzer operating skills: setting the frequency span, using start and stop frequencies; set
ting the video bandwidth; and making relative measurements using two markers. It also
demonstrates setting a signal to center frequency using a marker, and setting the frequency
step size to the value for the center frequency.
-
-
-
4-5

Chapter 4 Advanced Measurement Fundamentals
Example
Step 1. Connect a signal source to the Anritsu HHSA spectrum analyzer.
Step 2. Set the input frequency to 10 MHz and the signal level to + 20 dBm.
Step 3. Set the START frequency at 1 Mhz
Step 4. Set the STOP frequency to 100 MHz
Step 5. Set the resolution bandwidth to improve visibility by smoothing the noise:
a. Press BW/SWEEP
b. Press RBW, then MANUAL and EDIT.
Step 6. Use the step down (down arrow key) to select the desired resolution bandwidth,
100 kHz in this case.
Step 7. Press ENTER once the desired resolution bandwidth has been selected.
Step 8. Set the video bandwidth to improve visibility by smoothing the noise:
a. Press BW/SWEEP
b. Press VBW, then MANUAL and EDIT.
Step 9. Use the step down (down arrow key) to select the desired video bandwidth, 3
kHz in this case.
Step 10. Press ENTER once the desired video bandwidth has been selected.
Step 11. Press AMPLITUDE and then select REF LEVEL
Step 12. Key in the desired REF LEVEL (+20) on the data keypad and press ENTER.
Step 13. Press MARKER and select M1
Step 14. Activate M1 ON and press PEAK
Step 15. Press MARKER and select M2
Step 16. Activate M2 ON and use Up/Down key to place M2 to the center of the first har
monic
Step 17. Select DELTA (M2-M1) marker function. This will provide frequency and am
plitude information with respect to marker M1.
Step 18. Press MARKER and select M3
Step 19. Activate M3 ON and use Up/Down key to place M3 to the center of the second
harmonic
Step 20. Select DELTA (M3-M1) marker function. This will provide frequency and am
plitude information with respect to marker M1.
-
-
-
4-6

Example 3: AM/FM Modulation
Chapter 4 Advanced Measurement Fundamentals
Modulation is the process of translating some low frequency or baseband signal (voice, mu
sic, or data) to a higher frequency. In the modulation process, some characteristic of a car
rier signal (usually amplitude or frequency) is changed in direct proportion to the
instantaneous amplitude of the baseband signal.
The following procedure describes how to measure signals with AM and FM types of mod
ulation on them. It shows how to tune the signal on the spectrum analyzer display.
Amplitude Modulation
Step 1. Connect the signal source to the spectrum analyzer input.
Step 2. Set the source to a carrier frequency of 100 MHz with an amplitude modulation
of about 35 kHz
Step 3. Set the spectrum analyzer center frequency to 100 MHz. Set the span to 500
kHz.
Step 4. To determine the frequency of the carrier, press MARKER, activate M1 and
press PEAK, ENTER.
Additional modulation information can be easily determined from the carrier signal and
sideband. For example, the difference between the carrier frequency and the sideband frequency can be found by pressing MARKER, activating M2 and pressing DELTA, ENTER.
The markers read the frequency difference between the two signals, which is equal to the
modulating frequency. The marker also reads the difference in amplitude. This difference
in amplitude between the two signals can be used to determine the percentage of modulation.
-
-
-
NOTE: Unequal amplitudes of the lower and upper sidebands indicate incidental FM on the input signal. Incidental FM can reduce the accuracy of percent
age-of-modulation measurements.
Frequency Modulation
This section contains general information about frequency modulation, as well as a proce
dure for calculating FM deviation using a spectrum analyzer.
For sinusoidal modulation where either the modulation frequency or the FM deviation can
be varied, the spectrum analyzer can be used to accurately set up a modulation index corre
sponding to a Bessel null. The following example illustrates how to verify the FM deviation
accuracy of a signal generator with FM capability. We will use a carrier frequency of 100
MHz and test for a FM deviation accuracy at a 25 kHz rate using the modulation index for
the first carrier null (2.401).
Step 1. Connect the signal source to the spectrum analyzer input. Set the source to 100
MHz.
Step 2. Change the signal source settings as follows:
a. Set the carrier frequency to 100 MHz
b. Set Span to 100 kHz
-
4-7
-
-

Chapter 4 Advanced Measurement Fundamentals
c. Set resolution bandwidth to 10 kHz
d. Set video bandwidth to 1 kHz
NOTE: Incidental AM from a source signal can cause the frequency null to shift,
resulting in errors to the procedure above. Incidental AM is very low for most
RF signal generators but can be significant in microwave signal generators.
Non-symmetrical side lobes indicate the presence of incidental AM.
Example 4: AM/FM Demodulation
Amplitude modulation (AM) and frequency modulation (FM) are common modulation
techniques used to broadcast information. In the United States and Canada, the AM broad
cast band is 535 kHz to 1605 kHz, while the FM broadcast band covers 88 MHz to 108
MHz.
Demodulation of AM and FM signals can be done with any spectrum analyzer with zero
span capability and with a wide enough bandwidth to fully encompass the modulated sig
nal, provided that the spectrum analyzer has a speaker or headset jack and AM/FM demod
ulator. (The Anritsu HHSA comes standard with built-in AM/FM demodulator, internal
speaker and headset jack).
-
-
-
Example
Step 1. Provide a signal to the spectrum analyzer by connecting an antenna to the input
port of the spectrum analyzer.
Step 2. Tune to the FM band by pressing the MEASURE key.
Step 3. Press DEMOD TYPE
Step 4. Select FM WIDEBAND by using the appropriate softkey
Step 5. Activate FM demodulation ON by using the appropriate softkey.
Step 6. Select the appropriate resolution bandwidth, video bandwidth and reference
level to enhance the selection of desired signal. (For wide-band FM, the resolu
tion bandwidth should be 1 MHz. Reference level should be roughly –30 dBm)
Step 7. Position the marker on the signal of interest. If the signal of interest is the high
est in amplitude, press MARKER TO PEAK directly.
Step 8. To obtain continuous demodulation of the signal, set the span to zero span.
Step 9. Press FREQ/SPAN
Step 10. Select SPAN by using the appropriate softkey
Step 11. Select ZERO by using the appropriate softkey.
-
-
Setting the hand held spectrum analyzer to zero span will ensure continuous demodulation.
Otherwise, demodulation will occur only during the spectrum analyzer sweep.
4-8

Chapter 4 Advanced Measurement Fundamentals
Example 5: Field Strength Measurements
All antennas have losses or gain that can cause errors in measurements. The MS2711A can
correct for antenna loss or gain errors using Field Strength Measurements.
The antenna factors must be uploaded to the MS2711A using the Anritsu Software Tools
provided with the unit. These antenna factors can then be used to correct for the measure
ment error.
-
Step 1. Enter the antenna factor information for the specific antenna into the antenna ed
itor of the SW Tools.
Step 2. Upload the antenna factors to the MS2711A.
Step 3.
Step 4.
Step 5.
The MS2711A will now automatically scale the screen by the antenna factors entered.
Example 6: Creating a Spectral Mask
Quick go/no-go measurements can be performed by establishing test limits. When using
test limits, the user is able to quickly identify signals exceeding established limits as failing.
To aid users in establishing limits, the Anritsu HHSA features both single limit and multiple limit functions.
Example
Step 1. Connect a signal source to the Anritsu HHSA spectrum analyzer.
Step 2. Set the input frequency to 900 MHz and the signal level to - 20 dBm.
Press the MEAS function key on the MS2711A.
Select the FIELD STRENGTH soft key from the measurement menu.
Press the SELECT ANTENNA soft key and use the Up/Down arrow key to se
lect the desired antenna factor file. Press the ENTER key to select.
-
-
Step 3. Set the center frequency at 900 MHz, resolution bandwidth to 30 kHz, video
bandwidth to 300 Hz, and the span to 20 MHz.
Step 4. Press LIMIT and select MULTIPLE UPPER LIMITS using the appropriate
softkey.
Step 5. Select SEGMENT 1 using the appropriate softkey, and enter the start frequency,
start limit, end frequency, and end limit as prompted in the message area.
(Hint: span is ten divisions wide; therefore divide span by 10 to determine span
per division and desired starting point).
Enter start frequency = 890 MHz, start limit = -40, end frequency = 898 MHz,
end limit = -40.
Step 6. Select SEGMENT 2 using the appropriate softkey, and enter the start frequency,
start limit, end frequency, and end limit as prompted in the message area.
(Hint: start frequency and start limit should be equal to end frequency and end
limit of Segment 1).
4-9

Chapter 4 Advanced Measurement Fundamentals
Enter start frequency = 898 MHz, start limit = -40, end frequency = 899 MHz,
end limit = 0.
Step 7. Select SEGMENT 3 using the appropriate softkey, and enter the start frequency,
start limit, end frequency, and end limit as prompted in the message area.
(Hint: start frequency and start limit should be equal to end frequency and end
limit of Segment 2).
Enter start frequency = 899 MHz, start limit = 0, end frequency = 901 MHz, end
limit = 0.
Step 8. Select SEGMENT 4 using the appropriate softkey, and enter the start frequency,
start limit, end frequency, and end limit as prompted in the message area.
(Hint: start frequency and start limit should be equal to end frequency and end
limit of Segment 3).
Enter start frequency = 901 MHz, start limit = 0, end frequency = 902 MHz, end
limit = -40.
Step 9. Select SEGMENT 5 using the appropriate softkey, and enter the start frequency,
start limit, end frequency, and end limit as prompted in the message area.
(Hint: start frequency and start limit should be equal to end frequency and end
limit of Segment 4).
Enter start frequency = 902 MHz, start limit = -40, end frequency = 910 MHz,
end limit = -40.
Example 7: Trace Overlay
The MS2711A HHSA can be used to compare frequency spectrums.
Example:
Step 1. Connect a signal source to the Anritsu HHSA spectrum analyzer.
Step 2. Set the input frequency to 900 MHz and the signal level to –20 dBm.
Step 3. Set the center frequency at 900 MHz, resolution bandwidth to 30 kHz, video
bandwidth to 300 Hz, and the span to 20 MHz.
Step 4.
Step 5.
Step 6. Set the input frequency to 901 MHz and the signal level to –20 dB.
Step 7.
Step 8.
Press the TRACE key.
Select the A ® B soft key to save the current runtime trace to the Trace B
buffer.
Press the TRACE B soft key to go to the Trace B menu.
Select the VIEW B soft key to view the traces simultaneously.
4-10

Chapter 4 Advanced Measurement Fundamentals
Example 8: Power Monitor Measurements
A RF Wattmeter/Power meter option is also available on the Anritsu HHSA. Power meter
measurement is accomplished using a broadband (1 MHz to 3000 MHz) RF detector. Mea
sured power can be displayed in dBm or Watts.
Example
To use the power monitor, use must first set the Anritsu HHSA to the power monitor mode
and zero the power monitor.
Step 1. Press the MODE key
Step 2. With no applied power to the DUT, press ZERO soft key from the power menu.
Wait a few seconds while the Anritsu HHSA accumulates samples of the quies
cent power level. When complete, ZERO ADJ: ON is displayed in the message
area.
Step 3. Insert an attenuator between the DUT and the RF detector, sufficient to insure
that the power to the Anritsu HHSA is no greater than 20 dBm.
Step 4. Press the OFFSET soft key.
Step 5. Enter the attenuation in dB using the keypad. Press ENTER to complete the en-
try. The message area will show OFFSET in ON along with the entered value in
dB.
-
-
Step 6. Press the UNITS soft key to display power in Watts.
Step 7. With the desired base power level input to the Anritsu HHSA, press the REL
soft key. The message area will show REL: ON and the power reading will indicate 100%.
Step 8. Press the UNITS soft key to display power in dBm. Since REL is ON, the power
reading will be in dBr (relative to base power).
4-11/4-12

Chapter 5
Field Measurements
Introduction
This chapter provides examples of various field measurements:
Occupied Bandwidth
r
Power Monitor
r
Adjacent Channel Power
r
Out-of-Band Spurious Emissions
r
In-Band Spurious Emissions
r
Field Strength
r
AM/FM Demodulation
r
Occupied Bandwidth
A common measurement performed on radio transmitters is that of occupied bandwidth
(OBW). This measurement calculates the bandwidth containing the total integrated power
occupied in a given signal bandwidth. There are two different methods of calculation de
pending on the technique to modulate the carrier.
XdB Down Method
The occupied frequency bandwidth is defined as the bandwidth between the upper and
lower frequency points at which the signal level is XdB below the peak carrier level.
N% Method
The occupied frequency bandwidth is calculated as the bandwidth containing N% of the
power transmitted where N can be between 1% and 99%.
Occupied Bandwidth Measurement with the MS2711A
-
To make an occupied bandwidth measurement with the MS2711A hand held spectrum ana
lyzer, perform the steps below.
Required Equipment
r
MS2711A Hand Held Spectrum Analyzer
r
30 dB, 50 watt, Bi-Directional, DC – 18 GHz, N(m) – N(f), Attenuator
r
Test Port extension cable, Anritsu 15NNF50 – 1.5A
Procedure
Step 1. Using the test port extension cable and 30 dB, 50 watt, Bi-directional attenuator,
connect the MS2711A to appropriate transmit test port.
Step 2.
Step 3.
Press the ON/OFF key on the MS2711A.
Press the MODE key.
-
5
5-1

Chapter 5 Field Measurements
Step 4. Use the Up/Down arrow key to scroll to Spectrum Analyzer mode and press
ENTER.
Step 5. Enter the center frequency of interest.
Step 6. Select the appropriate span, amplitude level, resolution and video bandwidths.
Step 7.
Step 8.
Step 9. Select measurement method (dB Down or % of Power) in the active function
Step 10. Adjust the dBc or % by pressing the appropriate key.
Step 11.
Press the MEAS key.
Once in the Measurement menu, press the OBW soft key in the active function
block.
block by pressing the METHOD soft key.
Press MEASURE to initiate the measurement.
Adjacent Channel Power Leakage
Another common transmitter measurement is that of adjacent channel leakage power. This
is defined as the ratio of the amount of leakage power in an adjacent channel to the total
transmitted power. Therefore, this test measures the amount of integrated power within ad
jacent channel bandwidths. The resulting signal level is determined by this amount of isolation between channels. In order to calculate the upper and lower adjacent channel values,
the spectrum analyzer needs five parameters to be specified:
Channels separation
r
r
Measurement channel bandwidth
r
Adjacent channel bandwidth (if different from the measurement channel bandwidth), and the center frequency of the reference channel
-
r
Power level of the primary channel as well as the lower and upper adjacent
channels.
r
The adjacent channel power leakage measurement is applicable to both modu
lated and unmodulated signals and provides a means of assessing the transmit
ters selectivity.
Adjacent Channel Power Measurement with the MS2711A
To make a channel power measurement with the MS2711A hand held spectrum analyzer,
simply execute the following steps.
Required Equipment
r
MS2711A Hand Held Spectrum Analyzer
r
30 dB, 50 watt, Bi-Directional, DC – 18 GHz, N(m) – N(f), Attenuator
r
Test Port extension cable, Anritsu 15NNF50 – 1.5A
Procedure
Step 1. Using the test port extension cable and 30 dB, 50 watt, Bi-directional attenuator,
connect the MS2711A to appropriate transmit test port.
Step 2.
Press the ON/OFF key on the MS2711A.
-
-
5-2

Chapter 5 Field Measurements
Step 3.
Step 4. Use the Up/Down arrow key to scroll to Spectrum Analyzer mode and press
Step 5. Enter the center frequency for the channel of interest.
Step 6. Set the span wide enough to include the primary channel bandwidth and upper
Step 7. Select the appropriate amplitude level, resolution and video bandwidths.
Step 8. Use markers to read and compare to the specified power level for adjacent chan
Press the MODE key.
ENTER.
and lower channel bandwidths.
nel power compliance.
Out-of-Band Spurious Emission
Measurements
Out-of-band spurious measurements are made on signals outside the system band. These
signals, which can interfere with other communication systems, can be categorized into har
monics and unknown spurious emissions. Real time monitoring of spurious emissions from
a transmitter can uncover unwanted signals before they interfere with other users of the ra
dio spectrum, rendering the transmitting system non-compliant. In order to determine compliance with the allowable level of spurious emissions, the spectrum analyzer needs three
parameters to be specified:
-
-
-
Measurement channel bandwidth (in band, Figure 5-1)
r
r
Measurement channel bandwidth (out of band, Figure 5-1)
r
Allowable level of spurious emissions
Out-of-band Spurious Measurement with the MS2711A
To make an out-of-band spurious measurement with the MS2711A hand held spectrum ana
lyzer, simply execute the following steps.
Required Equipment
r
MS2711A Hand Held Spectrum Analyzer
r
30 dB, 50 watt, Bi-Directional, DC – 18 GHz, N(m) – N(f), Attenuator
r
Test Port extension cable, Anritsu 15NNF50 – 1.5A
Procedure
Step 1. Using the test port extension cable and 30 dB, 50 watt, Bi-directional attenuator,
connect the MS2711A to appropriate transmit test port.
Step 2.
Step 3.
Step 4. Use the Up/Down arrow key to scroll to Spectrum Analyzer mode and press
Press the ON/OFF key on the MS2711A.
Press the MODE key.
ENTER.
-
Step 5. Enter the center frequency for the channel of interest.
5-3

Chapter 5 Field Measurements
Step 6. Set the span wide enough to include the primary channel bandwidth and upper
and lower channel bandwidths.
Step 7. Select the appropriate amplitude level, resolution and video bandwidths.
Step 8. Use limit line and markers to read and compare observed signals to the specified
allowable level of out-of-band spurious emissions for the corresponding chan
nel transmit frequency.
In-Band/Out-Of-Channel Measurements
The in-band/out-of-channel measurements are those measurements that measure distortion
and interference within the system band, but outside of the transmitting channel. These
measurements include (1) in-band spurious emissions and (2) adjacent channel power ratio
(also called spectral regrowth). There are stringent regulatory controls on the amount of in
terference that a transmitter can cause to neighboring channels. The standards specify the
amount of interference allowed by the system. In order to determine compliance with the
allowable level of spurious emissions, the spectrum analyzer needs two parameters to be
specified:
-
-
Out-of-band In band Out of band
Figure 5-1. Example of In- and Out-of Bandwidth Signals
r
Measurement channel bandwidth
r
Allowable level of spurious emissions
In-band Spurious Measurement with the MS2711A
To make an out-of-band spurious measurement with the MS2711A hand held spectrum ana
lyzer, simply execute the following steps.
Required Equipment
r
MS2711A Hand Held Spectrum Analyzer
r
30 dB, 50 watt, Bi-Directional, DC – 18 GHz, N(m) – N(f), Attenuator
r
Test Port extension cable, Anritsu 15NNF50 – 1.5A
Procedure
Step 1. Using the test port extension cable and 30 dB, 50 watt, Bi-directional attenuator,
connect the MS2711A to appropriate receive test port.
-
5-4
Step 2.
Press the ON/OFF key on the MS2711A.

Chapter 5 Field Measurements
Step 3.
Step 4. Use the Up/Down arrow key to scroll to Spectrum Analyzer mode and press
Step 5. Enter the center frequency for the channel of interest.
Step 6. Set the span wide enough to include the primary channel bandwidth and upper
Step 7. Select the appropriate amplitude level, resolution and video bandwidths.
Press the MODE key.
ENTER.
and lower channel bandwidths.
Use limit line and markers to read and compare observed signals to the speci
fied allowable level of in-band spurious emissions for the corresponding chan
nel transmit/receive frequency.
Signal resolution is determined by the intermediate frequency (IF) filter band
width. The hand held spectrum analyzer, as does conventional spectrum analyz
ers, traces the shape of its IF filter as it tunes past a signal. Thus, if two
equal-amplitude signals are close enough in frequency, the filter shapes for the
two signals can fall on top of one another and appear as a single response. Con
versely, if two signals are not equal in amplitude but are still close together, the
smaller signal can be hidden under the response of the larger one.
Field Strength
-
-
-
-
-
The procedure below details how to make field strength measurements.
Required Equipment
r
MS2711A Hand Held Spectrum Analyzer
r
30 dB, 50 watt, Bi-Directional, DC – 18 GHz, N(m) – N(f), Attenuator
r
Test Port extension cable, Anritsu 15NNF50 – 1.5A
Procedure
Step 1. Use the antenna editor feature of the Software Tools to define an antenna (see
page 6-5).
Step 2. Upload the antenna information to the MS2711A HHSA (see page 6-5).
Step 3. Press the MEAS key.
Step 4. Select the FIELD STRENGTH soft key.
Step 5. Press the SELECT ANTENNA soft key.
Step 6. Use the Up/Down arrow key to choose the desired antenna and select by press
ing the ENTER key.
Step 7. To change the unit of measurement, press the AMPLITUDE hard key, then
press the UNITS soft key and select dB, dBV, dBmV or dBmV using the desig
nated soft key.
-
-
The MS2711A HHSA will automatically scale the display by the antenna factors selected.
5-5

Chapter 5 Field Measurements
ANTENNA CALCULATIONS
The following is a list of various antenna calculations should you find it necessary to con
vert from one to another:
Conversion of signal levels from mW to mV in a 50-ohm system:
2
V
P
=
R
where: P = power in Watts
V = voltage level in Volts
R = resistance in Ohms
-3
For power in milliwatts (10
V
dB V
()( )
Power density to field strength. An alternate measure of field strength to electric field is
power density:
Pd
=
where: E = field strength in V/m
P
=+107
dBmm
2
E
120p
P = Power density in W/m
W), and voltage in microvolts 10-6V:
2
-
Power density at a point:
PtG
P
d
In the far field, where electric and magnetic fields are related by the impedance of free
space:
P
d
Pt= power transmitted in Watts
G
r = distance from the antenna in meters
t
2
r=4
p
= power density in W/m
= gain of transmitting antenna
t
2
5-6

Chapter 5 Field Measurements
Making Power Measurements with the Power Meter
Power measurement is accomplished using a broadband (1 MHz to 3000 MHz) RF detector,
P/N 5400-71N50. The power monitor displays the measured power in dBm or Watts.
Entering Power Monitor Mode
Step 1.
Press the MODE key.
Zeroing the Power Monitor
Step 2.
With no power applied to the DUT, press the ZERO soft key from the Power
menu. Wait a few seconds while the Anritsu HHSA accumulates samples of the
quiescent power level. When complete, ZERO ADJ: ON is displayed in the mes
sage area.
Measuring High Input Power Levels
Step 3. Insert an attenuator between the DUT and the RF detector, sufficient to insure
that the input power to the Anritsu is no greater the 20 dBm.
Step 4.
Step 5.
Press the OFFSET soft key.
Enter the attenuation in dB using the keypad. Press ENTER to complete the en-
try. The message area will show OFFSET is ON along with the entered value in
dB.
Displaying Power in dBm and Watts
Step 6.
Press the UNITS soft key to display power in Watts.
Displaying Relative Power
-
Step 7.
Step 8.
With the desired base power level input to the Anritsu HHSA, press the REL
soft key. The message area will show REL: ON and the power reading will indi
cate 100%.
Press the UNITS soft key to display power in dBm. Since REL is ON, the
power reading will be in dBr, relative to the base power level.
5-7
-

Chapter 5 Field Measurements
AM/FM Demodulation
Amplitude modulation (AM) and frequency modulation (FM) are common modulation
techniques used to broadcast information. In the United States and Canada, the AM broad
cast band is 535 kHz to 1605 kHz, while the FM broadcats band covers 88 MHz to 108
MHz.
Demodulation of AM and FM signals can be accomplished with the MS2711A hand held
spectrum analyzer using zero span and a wide enough bandwidth to fully encompass the
modulated signal. An alternative, and possibly easier, method of examining a demodulated
signal with the MS2711A is to use the built-in AM/FM demodulator and speaker or op
tional external headset.
The following example illustrates the use of the MS2711A built-in AM/FM demodulator
and speaker. The example includes tunning the hand held spectrum analyzer to the band of
interest, activating and moving a marker to the signal that is to be demodulated, selecting
the appropriate zero span, and demodulating and listening to the signal of interest with the
built-in demodulator and speaker. To find the signal of interest for demodulation:
Step 1. Connect an antenna to the input port of the MS2711A.
-
-
Step 2.
Step 3.
Step 4.
Step 5.
Step 6.
Step 7.
Step 8.
Step 9.
Step 10.
Press the FREQ/SPAN key
Press the START soft key and enter 88 MHz
Press the STOP soft key and enter 108 MHz
To demodulat an FM signal, you must first locate the signal you are trying to demodulate. Using a marker will facilitate this process:
Press the MARKER key.
Select the M1 soft key and then the ON/OFF soft key to activate marker 1.
Select the EDIT soft key and set marker M1 to the signal of interest (if the signal
of interest is the highest in amplitude, press the MARKER TO PEAK key).
The marker frequency should correspond to the desired signal of interest, and
now becomes the center frequency which must be entered. To improve chances
of receiving the desired signal, the attenuation setting should be set to zero and
the resolution bandwidth should bet wide enough to encompass the entire de
modulated signal, i.e., 1 MHz.
Press the MEAS key and select AM/FM DEMOD to activate the demodulation
function.
Press the ON/OFF soft key to turn AM/FM demodulation on.
Press the DEMOD TYPE soft key and select WIDE BAND FM.
-
5-8
Step 11.
Step 12.
Step 13.
Press the VOLUME soft key, use the Up/down arrow key to adjust the volume
setting and press ENTER
Press the FREQ/SPAN key and the SPAN soft key.
Select the ZERO soft key to select zero span.

Chapter 6
Software Tools Program
Description
The Anritsu Software Tools program provides the means for transferring the measured
trace, along with any applied markers and/or limit line, to the screen of a personal computer
(PC) running Windows 95/98/NT/2000.
Requirements
The Anritsu Software Tools program will run on any computer that runs Windows
95/98/NT/2000. Typically, this means having a PC with the following characteristics:
Pentium or better microprocessor running enhanced mode (100 MHz or better,
·
recommended).
32 MBytes of memory, minimum.
·
Hard Disk Drive, with approximately 15 MBytes of available space.
·
Communication Port Setting
The Anritsu Software Tools communicates with the Anritsu through a standard COM port
on the PC. It is important that your Windows COM port settings conform to the actual
hardware settings. Since various add-in devices such as sound cards, modems, and network
cards use IRQ (interrupts), it is possible that your computer has non-standard COM port
settings. Please consult your computer vendor for COM port address and IRQ information.
Changing COM Port Settings–Windows 95/98/NT/2000
Refer to Figure 5-1 while performing the following procedure.
Step 1.
Step 2.
Step 3.
Step 4.
Step 5.
NOTE:
If Windows doesn’t show any available COM Ports, consult your computer
manufacturer.
Open the Windows Control Panel.
Double click on the SYSTEM icon. The System Properties window appears.
Select Device Manager. The Device List appears.
Double click on the item Ports (COM & LPT) in the device list.
Double click on the Communications Port you want to set. The
Communications Port Properties window appears.
6
Step 6.
Choose Port Settings, then change to the following settings if necessary.
Baud Rate: 9600
6-1
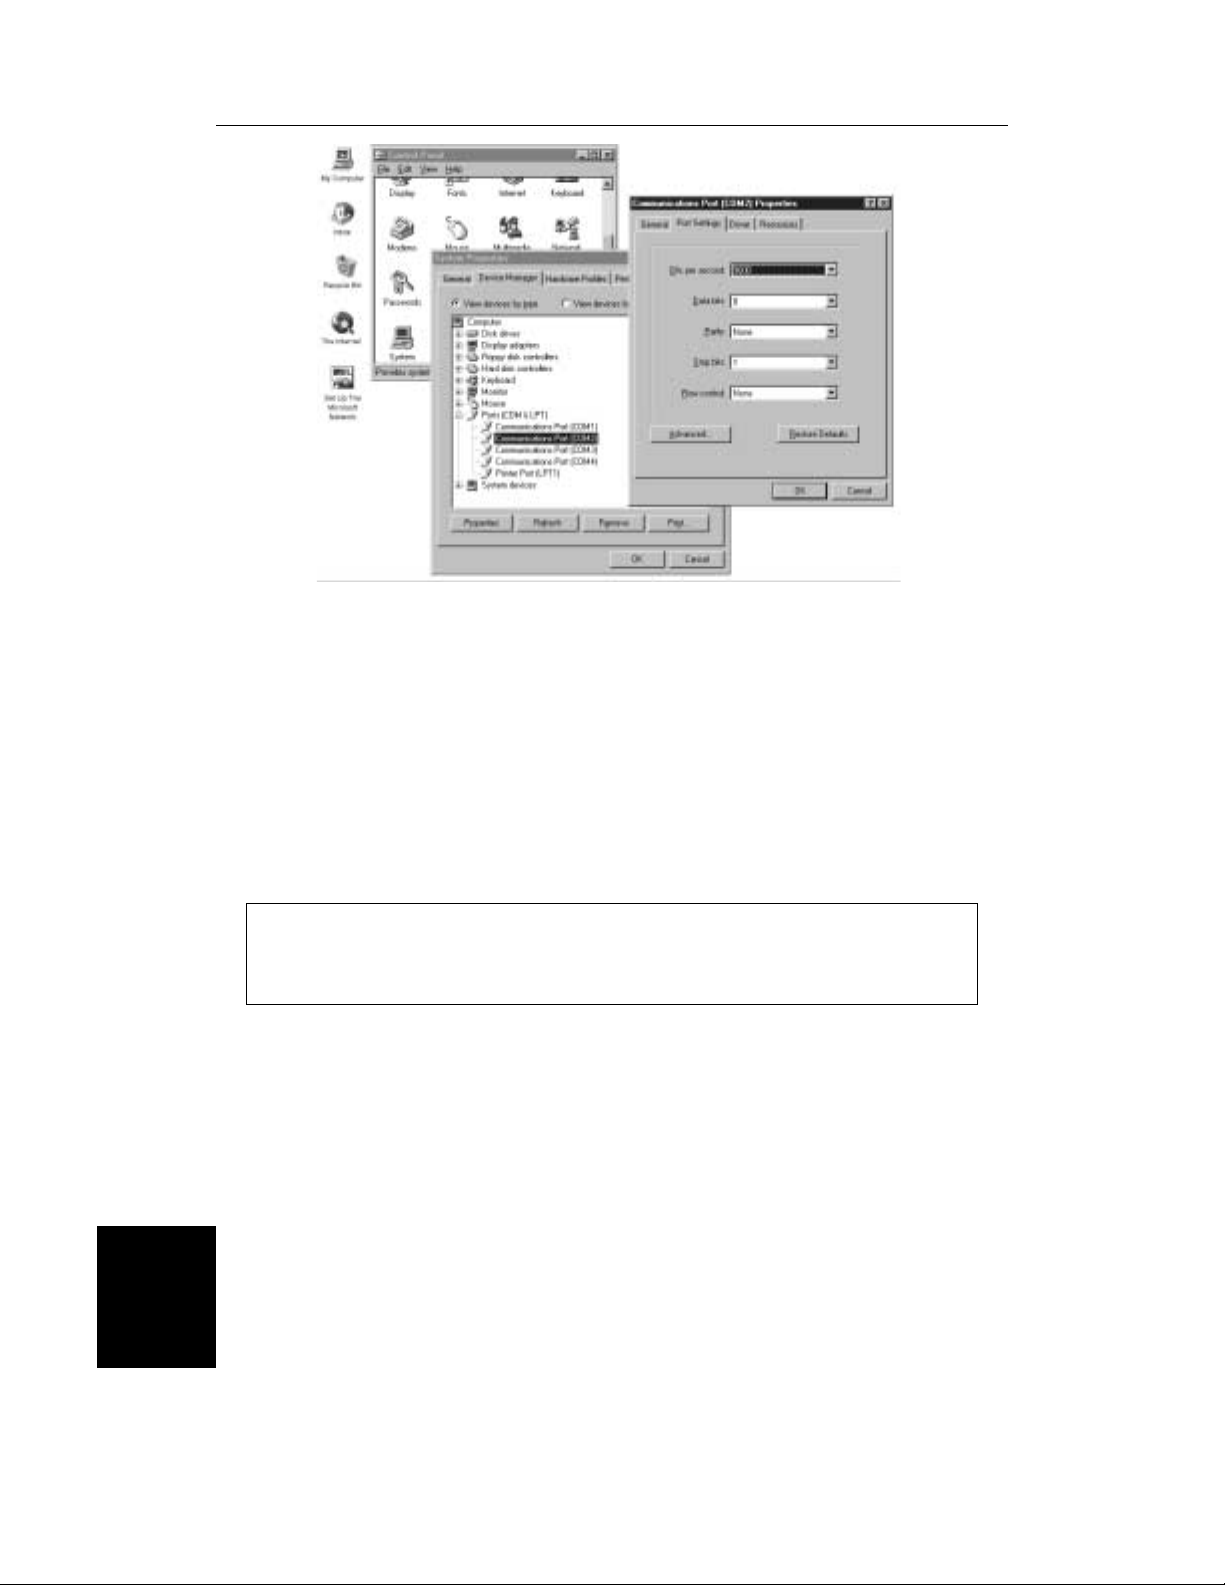
Chapter 6 Software Tools Program
Figure 6-1. Windows 95 COM Port Setting Dialog Boxes
Data Bits: 8
Parity: None
Stop Bits: 1
Flow Control: None
Step 7.
Step 8.
NOTE:
If you changed the COM Port Base Address and/or IRQ, you will need to restart
Windows.
Choose Resource and verify the COM Port Base Address and IRQ. Click OK
when done.
Click OK again to close the System Properties window.
Software Installation
The Anritsu Software Tools program is a conventional Microsoft Windows program.
Installation is similar to all other such programs. For users new to Windows, a detailed
procedure is given below.
Step 1. Insert the Anritsu Anritsu Software Tools CD For Windows disk into the CD
drive.
Step 2. Select Run under the Start menu.
Step 3. Type D: \SETUP.EXE, when the dialog box appears (Assumes CD ROM is
drive D:).
Step 4.
Press the Enter key to select the default directory, C:\PROGRAM
FILES\SITEMASTER SOFTWARE TOOLS, and begin the Setup routine.
6-2
Step 5. When the Setup program prompts for the Program Group, select “Site Master
Software Tools” and select CONTINUE.

Chapter 6 Software Tools Program
NOTE: The Setup routine will create a new Program Manager Group named
“Site Master Software Tools”.
Step 6.
Step 7. Double-click on the “Anritsu Software Tools ” icon to open the Software Tools
Step 8.
When the installation is complete, click OK.
program.
Click on Settings, in the top menu bar, and select Communications. Select the
appropriate COM port number for the serial interface cable (null modem type).
Plot Capture
Plots (traces) can be captured either individually from the Anritsu HHSA display or in
multiples from one or more stored-display locations. Both methods are described below.
The recommended method is the Capture Multiple Traces option in the Capture
pull-down menu. Using this method, you can download to the Software Tools program in
one operation all of the data residing in the up-to-70 Stored Display memory locations. The
downloaded traces can be stored in a database or appear in cascade on the PC screen.
NOTE: Trace scale can be captured as per Anritsu HHSA or as autoscale by the
capture program. To select per Anritsu HHSA or autoscaling, click on Settings
and Default Plot Settings from the top menu bar and pull-down menu.
Capture multiple to database
Step 1. Connect the supplied cable.
Step 2. Open the “Anritsu Software Tools” group, in the Windows Program Manager.
(Select the Windows pull-down menu from the Program Manager menu bar,
and select Anritsu Software Tools.)
Step 3.
Step 4.
Step 5. Follow the database instructions to download the plot(s) to either a new database
Step 6. Enter the number(s) of the stored-display memory location(s) (1 to 50) from
Step 7. Observe that the “Acquiring Control” box appears on the screen, then disappears
Double-click on the “Anritsu Software Tools” icon to open the program.
Click on Capture, in the top menu bar, and select Capture Multiple to
Database from the drop-down menu.
or an existing database.
which you wish to store to the database, and click “OK”.
as traces are automatically acquired. The “Database” box appears when the
plot(s) has been completely captured into the database.
6-3

Chapter 6 Software Tools Program
Capture multiple traces to PC screen
Step1. Perform steps 1, 2, and 3 of the capture-multiple-to-database procedure.
Step2.
Step3. Enter the number (or numbers) of the stored-display memory location(s) (1 to
Step4. Select “OK.”
Step5. Observe that the “Acquiring Control” box appears on the screen, then disappears
Click on “Capture Multiple Traces” icon or click on Capture, in the top menu
bar, and select Capture Multiple Traces from the drop-down menu.
50) from which you wish to display traces in Anritsu Software Tools or select
from the drop-down list.
as the traces are automatically acquired.
Single trace capture
Step1. Perform steps 1, 2, and 3 of the capture-multiple-to-database procedure.
Step2.
Step3. Observe that a “Waiting for Data” box appears on the screen.
Step4. On the Anritsu HHSA,
Step5. Capture a new trace and store it to a memory location.
Step6. Recall the stored plot to the screen.
Step7.
Click on “Start a Plot Capture” icon or click on Capture, in the top menu bar,
and select Start Capture from the drop-down menu.
Press the ENTER key (on the Anritsu HHSA) to start the screen capture.
NOTE: The ENTER key on the Anritsu HHSA must be pressed while the PC
screen shows “Waiting for Data” for the transfer of information to be complete.
Step 8. On the PC, observe that the “Waiting for Data” box disappears and the trace
capture process begins. Within a short time, the Anritsu HHSA trace will
appear.
Program Operation
The captured trace on the PC can be scaled and have its limit line, markers, and properties
changed. (Select Plot Properties under the View menu to make these changes.) The
operation of the various menus that allow these operations to be accomplished is
straightforward. To read about the operation of the menus, refer to the on-line help screens.
They can be accessed from the Help menu, in the top menu bar.
6-4

Chapter 6 Software Tools Program
Entering Antenna Factors
The antenna factor is a parameter of an antenna that is used in the calculation of field
strength during radiated emissions measurement. It relates the voltage output of the
measurement antenna to the value of the incident field producing that voltage. The units are
volts output per volt/meter incident field or reciprocal meters. Antennas used for radiated
emissions testing are individually calibrated (the antenna factor is directly measured) at all
appropriate distances. The calibrations produce values that are defined as the “equivalent
free space antenna factor.” The calibration procedure corrects for the presence of the
reflection of the antenna in the ground plane, giving the value that would be measured if the
antenna were in “free space.”
Step 1. Once the Site Master Software Tools has been opened, select Antenna Editor
from the Tools menu on the tool bar. A pop-up box will appear on the screen of
the PC.
Step 2. Click on “Edit Antenna” to enter an antenna name, description, frequencies, and
antenna factors. Enter the frequencies in ascending order, starting with lowest
frequency first. A maximum of 60 antenna factors may be entered. Use the
arrow keys on the keyboard to move between entries.
NOTES: Only one input of frequency and antenna factor is allowed per row.
Multiple antenna factors for a single antenna must be entered individually. For
example, an antenna having an antenna factor of 5 from 2.0 to 2.25 GHz and
an antenna factor of 4 from 2.25 to 2.5 GHz should be entered as follows:
Frequency (MHz) Antenna Factor
2000 5
2251 4
2500 4
If necessary, an antenna factor of zero (0) may be entered.
Step 3. Select Save from the File menu to save the antenna factors to the hard disk.
Uploading Antenna Factors
To upload antenna information from Software Tools to the MS2711A:
Step 1. Connect the RS232 cable between the PC and the MS2711A.
Step 2. Click on the “Upload” button on the tool bar (or select Upload from the Tools
menu). It is important to note that the MS2711A should sweep very quickly
during the data transfer, at least at 5 seconds, otherwise the Software Tools
program will default to a “time-out” condition (to improve chances of successful
upload, increase RBW and VBW settings to the maximum position).
Step 3. To determine if the antenna information has been successfully uploaded to the
MS2711A, press the measure function key (#4 key) and activate the field
strength measurement by pressing the ON/OFF soft key.
6-5

Chapter 6 Software Tools Program
Saving a Plot as a Windows Metafile
Plots can be saved as Windows Metafiles (.WMF). The metafile may be imported into other
graphic programs, but cannot be reloaded into the Anritsu Software Tools program.
To save a plot as a Windows Metafile, click on File, in the top menu bar, and select Save as
Metafile from the drop down menu.
Saving Data to a Spreadsheet
The data points from a plot can be exported to a spreadsheet via the clipboard. To transfer
data to a Windows spreadsheet program:
Step 1.
Step 2. Capture or load the desired plot.
Step 3.
Step 4. Open the spreadsheet program and place the cursor where the first data point
Step 5.
Select Settings and Clipboard Format from the top menu bar and pull-down
menu and choose Formatted Text.
Copy the data to the clipboard by selecting the “Copy to Clipboard” icon or
Copy from the Edit menu.
should appear.
Select Paste from the spreadsheet program’s Edit menu.
Saving Data as a Data File
The data points from a plot can be saved as a data file (.dat).
Step 1.
Step 2.
Step 3. Enter a file name and location.
Step 4.
Select the File menu.
Select Save.
Click OK.
Saving Data to a Database
Plots can be saved to a database. Comments can be added to the plot data saved. Queries of
the database provide a means of comparing plots in the database. Refer to the on-line help
screens for operating instructions.
To save a plot to a database, click on File, in the top menu bar, and select Save Plot to
Database from the drop-down menu.
6-6

Chapter 6 Software Tools Program
“Drag-n-Drop”
Anritsu Software Tools is Windows based. Graphs can “Drag-n-Drop” onto each other.
Anritsu Software Tools allows quick comparison of “before” and “after” measurements.
Recent data is compared to a historical PC database record, which is usually recorded
during site installation/commissioning.
Printing
Captured traces may be printed from a PC using Anritsu Software Tools. Once a captured
trace has been downloaded choose Print under the File menu for printing options. The
printer setup can be altered, plots can be scaled, and multiple plots can be printed from the
Print dialog box.
6-7/6-8


 Loading...