

Page 1

MS2650/MS2660B/C Series
Spectrum Analyzer
Operation Manual
Vol. 2
(Detailed Operating Instructions
10th Edition
•
For safety and warning information, please read this
manual before attempting to use the equipment.
•
Additional safety and warning information is
provided within the MS2650/MS2660B/C Series
Spectrum Analyzer Operation Manual Vol. 1 (Basic
Operating Instructions). Please also refer to this
document before using the equipment.
•
Keep this manual with the equipment.
)
ANRITSU CORPORATION
Document No.: M-W1251AE-10.0
Page 2

Safety Symbols
To prevent the risk of personal injury or loss related to equipment malfunction, Anritsu Corporation uses the
following safety symbols to indicate safety-related information. Ensure that you clearly understand the meanings
of the symbols BEFORE using the equipment. Some or all of the following symbols may be used on all Anritsu
equipment. In addition, there may be other labels attached to products that are not shown in the diagrams in this
manual.
Symbols used in manual
DANGER
WARNING
CAUTION
This indicates a very dangerous procedure that could result in serious injury or
death if not performed properly.
This indicates a hazardous procedure that could result in serious injury or death if
not performed properly.
This indicates a hazardous procedure or danger that could result in light-to-severe
injury, or loss related to equipment malfunction, if proper precautions are not taken.
Safety Symbols Used on Equipment and in Manual
The following safety symbols are used inside or on the equipment near operation locations to provide information
about safety items and operation precautions. Ensure that you clearly understand the meanings of the symbols
and take the necessary precautions BEFORE using the equipment.
This indicates an obligatory safety precaution. The obligatory operation is
This indicates a warning or caution. The contents are indicated symbolically in or
This indicates a note. The contents are described in the box.
These indicate that the marked part should be recycled.
This indicates a prohibited operation. The prohibited operation is indicated
symbolically in or near the barred circle.
indicated symbolically in or near the circle.
near the triangle.
MS2650/MS2660B/C Series
Spectrum Analyzer
Operation Manual Vol. 2 (Detailed Operating Instructions)
14 March 1997 (First Edition)
7 March 2008 (10th Edition)
Copyright © 1997-2008, ANRITSU CORPORATION.
All rights reserved. No part of this manual may be reproduced without the prior written permission of the
publisher.
The contents of this manual may be changed without prior notice.
Printed in Japan
ii
Page 3

Equipment Certificate
Anritsu Corporation certifies that this equipment was tested before
shipment using calibrated measuring instruments with direct
traceability to public testing organizations recognized by national
research laboratories, including the National Institute of Advanced
Industrial Science and Technology, and the National Institute of
Information and Communications Technology, and was found to meet the
published specifications.
Anritsu Warranty
Anritsu Corporation will repair this equipment free-of-charge if a
malfunction occurs within one year after shipment due to a manufacturing
fault, under the condition that this warranty is void when:
The fault is outside the scope of the warranty conditions described in
•
the operation manual.
The fault is due to mishandling, misuse, or unauthorized modification
•
or repair of the equipment by the customer.
The fault is due to severe usage clearly exceeding normal usage.
•
The fault is due to improper or insufficient maintenance by the
•
customer.
The fault is due to natural disaster including fire, flooding,
•
earthquake, etc.
The fault is due to use of non-specified peripheral equipment,
•
peripheral parts, consumables, etc.
The fault is due to use of a non-specified power supply or in a
•
non-specified installation location.
In addition, this warranty is valid only for the original equipment
purchaser. It is not transferable if the equipment is resold.
Anritsu Corporation shall assume no liability for injury or financial loss of
the customer due to the use of or a failure to be able to use this equipment.
Anritsu Corporation Contact
In the event that this equipment malfunctions, contact an Anritsu
Service and Sales office. Contact information can be found on the last
page of the printed version of this manual, and is available in a separate
file on the CD version.
iii
Page 4

r
r
Notes On Export Management
This product and its manuals may require an Export License/Approval by
the Government of the product's country of origin for re-export from you
country.
Before re-exporting the product or manuals, please contact us to confirm
whether they are export-controlled items or not.
When you dispose of export-controlled items, the products/manuals need
to be broken/shredded so as not to be unlawfully used for military purpose.
Disposal Procedure
The product that you have purchased contains a rechargeable battery.
The battery is recyclable. At the end of its useful life, under various
state and local laws, it may be illegal to dispose of this battery into the
municipal waste stream. Check with your local solid waste officials fo
details in your area for recycling options or proper disposal.
iv
Page 5

Front Panel Power Switch
To prevent malfunction caused by accidental touching, the front power switch of this
equipment turns on the power if it is pressed continuously for about one second in the
standby state. If the switch is pressed continuously for one second in the power-on state,
the equipment enters the standby state.
In the power-on state, if the power plug is removed from the outlet, then reinserted into it,
the power will not be turned on. Also, if the lines is disconnected due to momentary power
supply interruption or power failure, the power will not be turned on (enters the standby
state) even if the line is recovered.
This is because this equipment enters the standby state and prevents incorrect data from
being acquired when the line has to be disconnected and reconnected.
For example, if the sweep time is 1,000 seconds and data acquisition requires a long time,
momentary power supply interruption (power failure) might occur during measurement
and the line could be recovered automatically to power-on. In such a case, the equipment
may mistake incorrect data for correct data without recognizing the momentary power
supply interruption.
If this equipment enters the standby state due to momentary power supply interruption or
power failure, check the state of the measuring system and press the front power switch to
restore power to this equipment.
Further, if this equipment is built into a system and the system power has to be
disconnected then reconnected, the power for this equipment must also be restored by
pressing the front power switch.
Consequently, if this equipment is built into remote monitoring systems that use MODEMs,
the standby function of this equipment must be modified.
v
Page 6

ABOUT DETECTION MODE
This instrument is a spectrum analyzer which uses a digital storage system. The spectrum
analyzer makes level measurements in frequency steps obtained by dividing the frequency
span by the number of measurement data points (501). This method of measurement
cannot detect the signal peak level if the spectrum of a received signal is narrower than
these frequency steps.
To resolve this problem, this instrument usually operates in positive peak detection mode
and normal detection mode. In the positive peak detection mode, the highest level within
the frequency range between the sample points can be held and traced. In the normal
detection mode, both the positive peak and the negative peak can be traced.
Positive peak detection mode should be used for almost all measurements including normal
signal level measurement, pulsed noise analysis, and others. It is impossible to measure
the signal level accurately in sample detection mode or in negative peak detection mode.
Use of sample detection mode is restricted to random noise measurement, occupied
frequency bandwidth measurement for analog communication systems, and
adjacent-channel leakage power measurement, etc.
Measurement Item
• Normal signal.................................................................................................. POS PEAK
• Random noise.................................................................................................. SAMPLE
• Pulsed noise..................................................................................................... NORMAL (POSI-NEG)
• Occupied frequency bandwidth, adjacent-channel leakage power.......... SAMPLE
(for analog communication systems)
• Occupied frequency bandwidth, adjacent-channel leakage power.......... POS PEAK or SAMPLE
(for digital communication systems)
When a detection mode is specified as one of the measurement methods, make the
measurement in the specified detection mode.
vi
Page 7
ABOUT THIS MANUAL
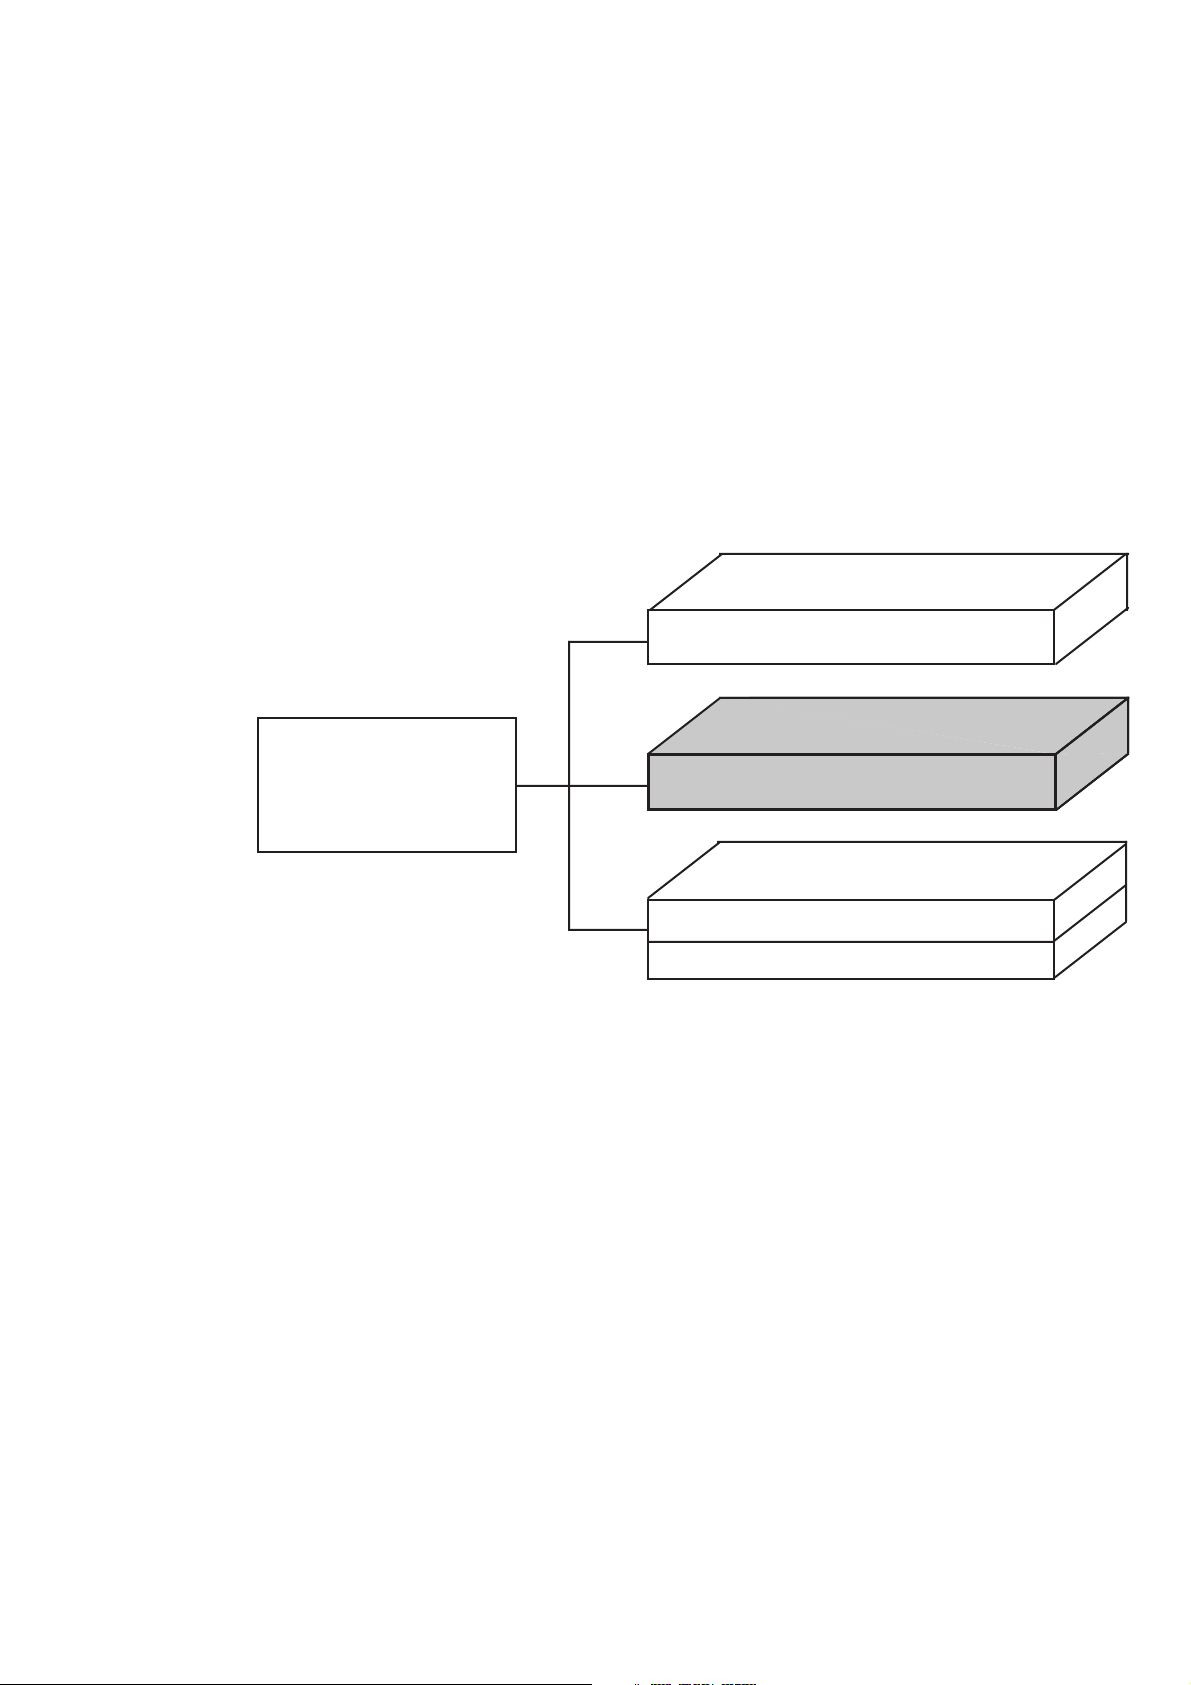
(1) Composition of MS2650/MS2660B/C series spectrum analyzer Operation Manuals
The MS2650/MS2660B/C Spectrum Analyzer operation manuals of the standard type are composed of the
following three documents. Use them properly according to the usage purpose.
Basic operating instruction part
Vol. 1
Detailed operating instruction part
Composition
of
Operation Manuals
Vol. 2
Programming part
Vol. 3
(Remote control part)
(PTA control part)
Basic operating instruction part: Basic Operating Instructions: Provides information on the MS2650/
MS2660B/C series outline, preparation before use, panel description,
basic operation, soft-key menu and performance tests.
Detailed operating instruction part: Detailed Operating Instructions: Provides information on the detailed
panel operating instructions on the spectrum analyzer that expand
on the basic operation and soft-key menu in the Basic Operating
Instruction Part.
Programming part: Composed of the Remote Control Part and PTA Control Part. The
Remote Control Part provides information on RS-232C remote
control GPIB remote control and sample programs, while the PTA
Control Part describes about PTA operation and PTL commands.
I
Page 8

TABLE OF CONTENTS
For Safety ................................................................................................................. iii
ABOUT THIS MANUAL.................................................................................................... I
SECTION 1 BASIC OPERATION PROCEDURE ........................................................ 1-1
Signal Display .............................................................................................................................. 1-3
Marker Operation ......................................................................................................................... 1-6
"Measure" Function Check .......................................................................................................... 1-8
Screen Hard Copy ........................................................................................................................ 1-9
SECTION 2 FREQUENCY/AMPLITUDE DATA ENTRY .......................................... 2-1
Setting Observation Frequency .................................................................................................... 2-3
Setting Level Range ..................................................................................................................... 2-8
Offsetting Reference Level ........................................................................................................ 2-13
SECTION 3 MARKER FUNCTIONS ......................................................................... 3-1
Changing Zone Marker Position and Width ................................................................................ 3-4
Marker Mode ............................................................................................................................... 3-7
Display Line ............................................................................................................................... 3-10
Multimarker ............................................................................................................................... 3-11
Marker Search ............................................................................................................................ 3-16
Setting Parameters Using Marker Values .................................................................................. 3-22
SECTION 4 SIGNAL SEARCH FUNCTION ............................................................. 4-1
Detecting Peaks ............................................................................................................................ 4-3
Moving the Measurement Point ................................................................................................... 4-5
II
Page 9

SECTION 5 SELECTING THE DISPLAY METHOD ................................................. 5-1
Display Mode ............................................................................................................................... 5-3
Storage Mode ............................................................................................................................. 5-15
Detection Mode .......................................................................................................................... 5-22
Time Domain ............................................................................................................................. 5-26
SECTION 6 SELECTING THE SWEEP METHOD ................................................... 6-1
Sweep Mode ................................................................................................................................ 6-3
Trigger Mode ............................................................................................................................... 6-5
Zone Sweep and Signal Tracking .............................................................................................. 6-12
Time Gate Function ................................................................................................................... 6-14
Domain Sweep ........................................................................................................................... 6-22
SECTION 7 COUPLED FUNCTION ......................................................................... 7-1
From Auto to Manual Operation ................................................................................................. 7-4
SECTION 8 AUTOMATIC CALIBRATION AND
LEVEL CORRECTION FUNCTIONS .................................................... 8-1
Automatic Calibration Function CAL ........................................................................................ 8-3
Preselector tuning ........................................................................................................................ 8-6
Measurement System Level Correction ....................................................................................... 8-8
SECTION 9 SYSTEM SETTING AND PRESET FUNCTION ................................... 9-1
Coupled Function Common/Independent Setting Mode ............................................................. 9-4
SECTION 10 SAVE/RECALL FUNCTION ................................................................ 10-1
Internal Register ......................................................................................................................... 10-4
Memory Card File Management .............................................................................................. 10-11
SECTION 11 COPY/SOUND MONITOR/TV IMAGE MONITOR .............................. 11-1
Direct Plotting ............................................................................................................................ 11-3
Saving Screen Image Data to Memory Card ............................................................................. 11-9
III
Page 10

Displaying a Title ..................................................................................................................... 11-11
SOUND Monitor ...................................................................................................................... 11-12
TV Image Monitor ................................................................................................................... 11-14
SECTION 12 PTA/DEFINE FUNCTIONS ................................................................. 12-1
PTA Program Editing and Loading ........................................................................................... 12-3
User-Definition Function ........................................................................................................... 12-6
SECTION 13 MEASUREMENT ................................................................................ 13-1
Measure Measurement Function ................................................................................................ 13-3
Measurement Examples ............................................................................................................. 13-8
SECTION 14 TRACKING GENERATOR .................................................................. 14-1
Tracking Generator Menus ........................................................................................................ 14-3
Normalize/Instant-Normalize Functions .................................................................................... 14-4
Transmission Characteristics Measurement .............................................................................. 14-6
Reflection Characteristics Measurement ................................................................................. 14-13
Notes on Active Device Measurement .................................................................................... 14-17
SECTION 15 EMC, Measurement of Field Strength ................................................. 15-1
Menu of EMC ............................................................................................................................ 15-3
Field Strength Measurement ...................................................................................................... 15-4
User Antenna Factor Setting, Save/Load to /from a Memory Card .......................................... 15-7
Caution: When Performing Field Strength Automatic Measurement ..................................... 15-13
EMC Measurement .................................................................................................................. 15-15
APPENDIX A SOFT-KEY MENU ............................................................................... A-1
Soft-key Menu List ..................................................................................................................... A-4
Menu Tree ................................................................................................................................... A-6
APPENDIX B KEYWORDS INDEX........................................................................... B-1
IV
.
Page 11

SECTION 1 BASIC OPERATION PROCEDURE
SECTION 1
BASIC OPERATION PROCEDURE
TABLE OF CONTENTS
Signal Display
Turn the power on
Execute automatic calibration
Set the signal to the center of the screen
Enlarge and display the signal
Marker Operation
Check of the zone marker function
The "marker → CF" function check
"Measure" Function Check
Screen Hard Copy
.....................................................................................................................................
.......................................................................................................................
................................................................................................................................
..................................................................................................................
...............................................................................................................................
.....................................................................................................
...................................................................................
....................................................................................................
1-3
1-3
1-4
1-4
1-5
1-6
1-8
1-9
1-1
Page 12

SECTION 1 BASIC OPERATION PROCEDURE
1-2
Page 13
SECTION 1 BASIC OPERATION PROCEDURE
SECTION 1
BASIC OPERATION PROCEDURE
The basic operation procedure of this equipment is
explained here. The operations are listed on the right.
Also, the explanation will advance assuming that a
500 MHz signal is applied to the input connector.
Please read this manual while operating this
equipment.
( : Panel key, : Soft key)
<Actual operations>
Signal Display
Turn the power on
Press the standby button on the rear panel, then
press the power switch (0) on the front panel. In
this case, continue pressing the power switch for
one second or more.
(I) Signal display
1) Turn the power on,
2) execute automatic calibration,
3) set the signal to the center of the screen, and
4) enlarge and display the signal.
(II) Marker operation
Check of the zone marker function.
The "marker → CF" function check.
(III) "Measure" function check
(IV) Screen hard copy
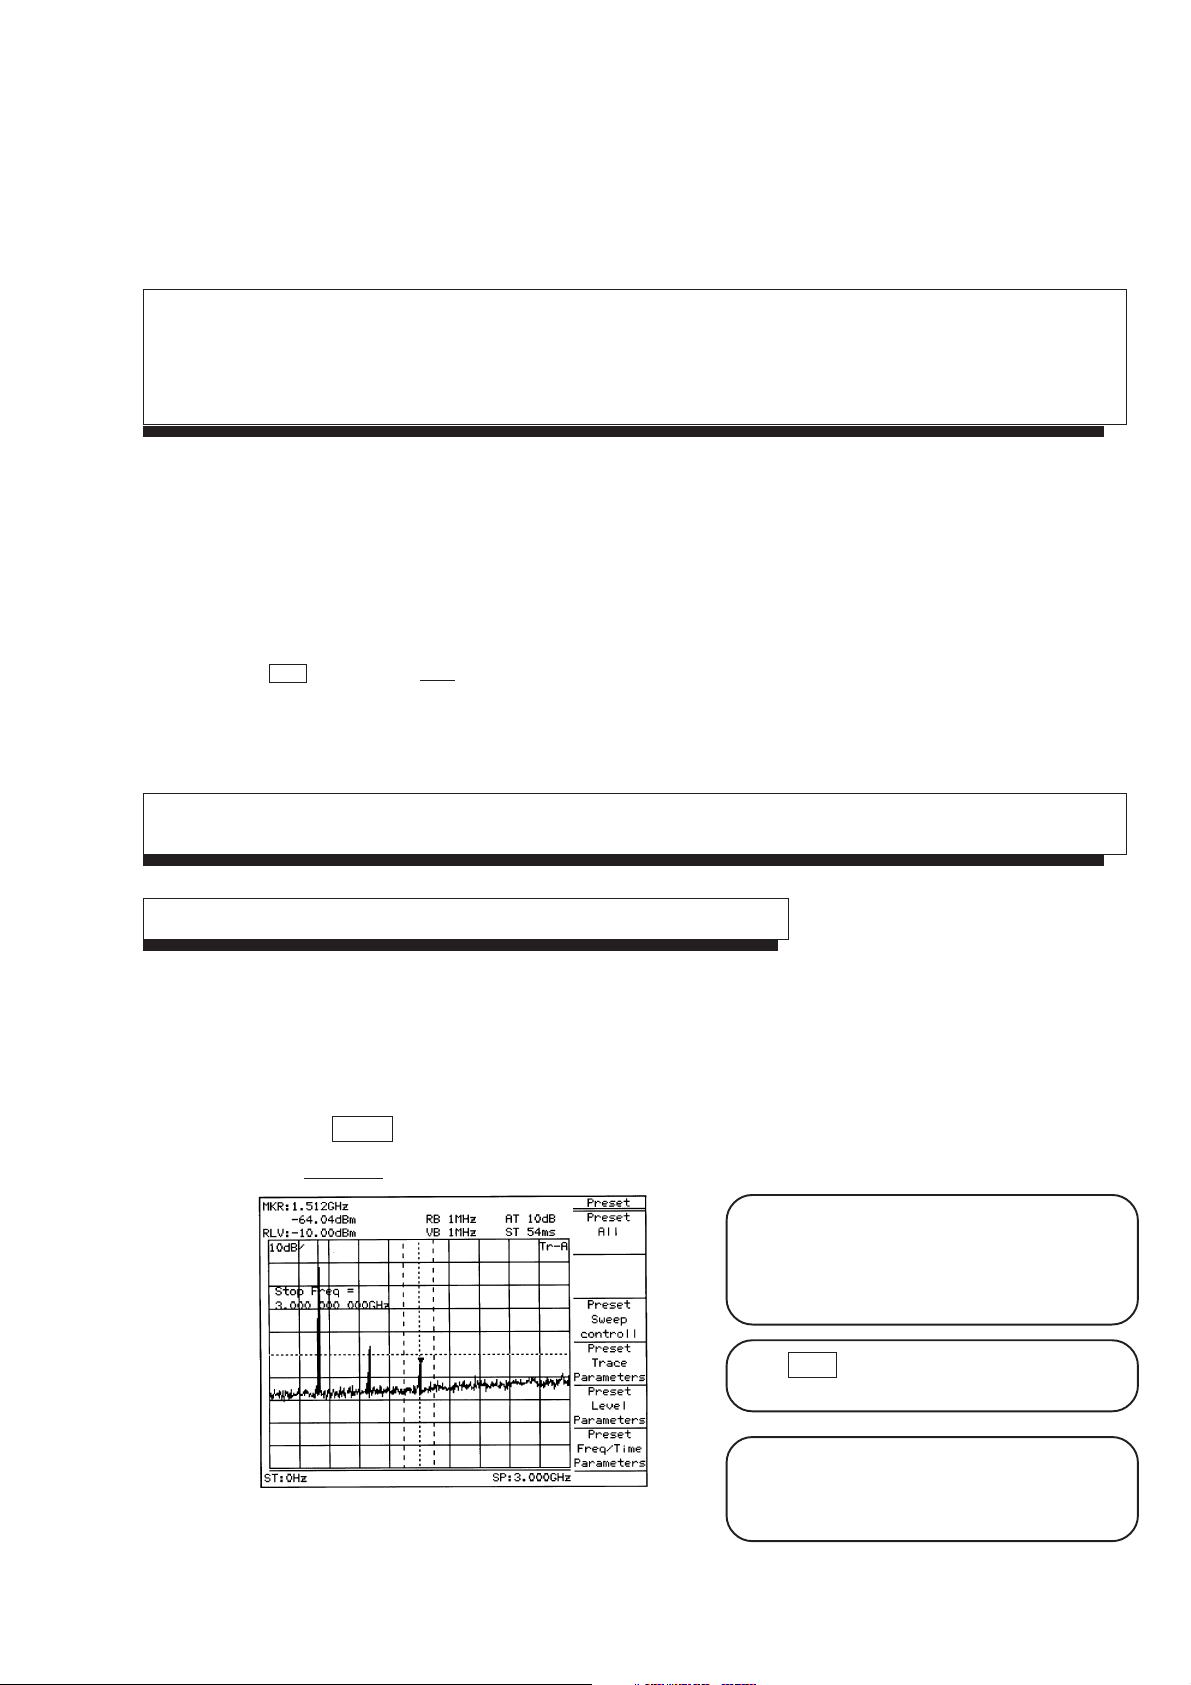
Press Preset key.
Press Preset All key in the menu.
Fig. 1-1
The power is turned on/off only when the power
switch is pressed for one second or more. This
prevents the power from being turned on/off easily
by mistake.
When panel key (hard key) is pressed, the related
soft key menu is displayed.
Partial resettings are enabled. This resetting
includes only the display-related resetting or the
resetting of special modes such as zone sweep.
1-3
Page 14
SECTION 1 BASIC OPERATION PROCEDURE
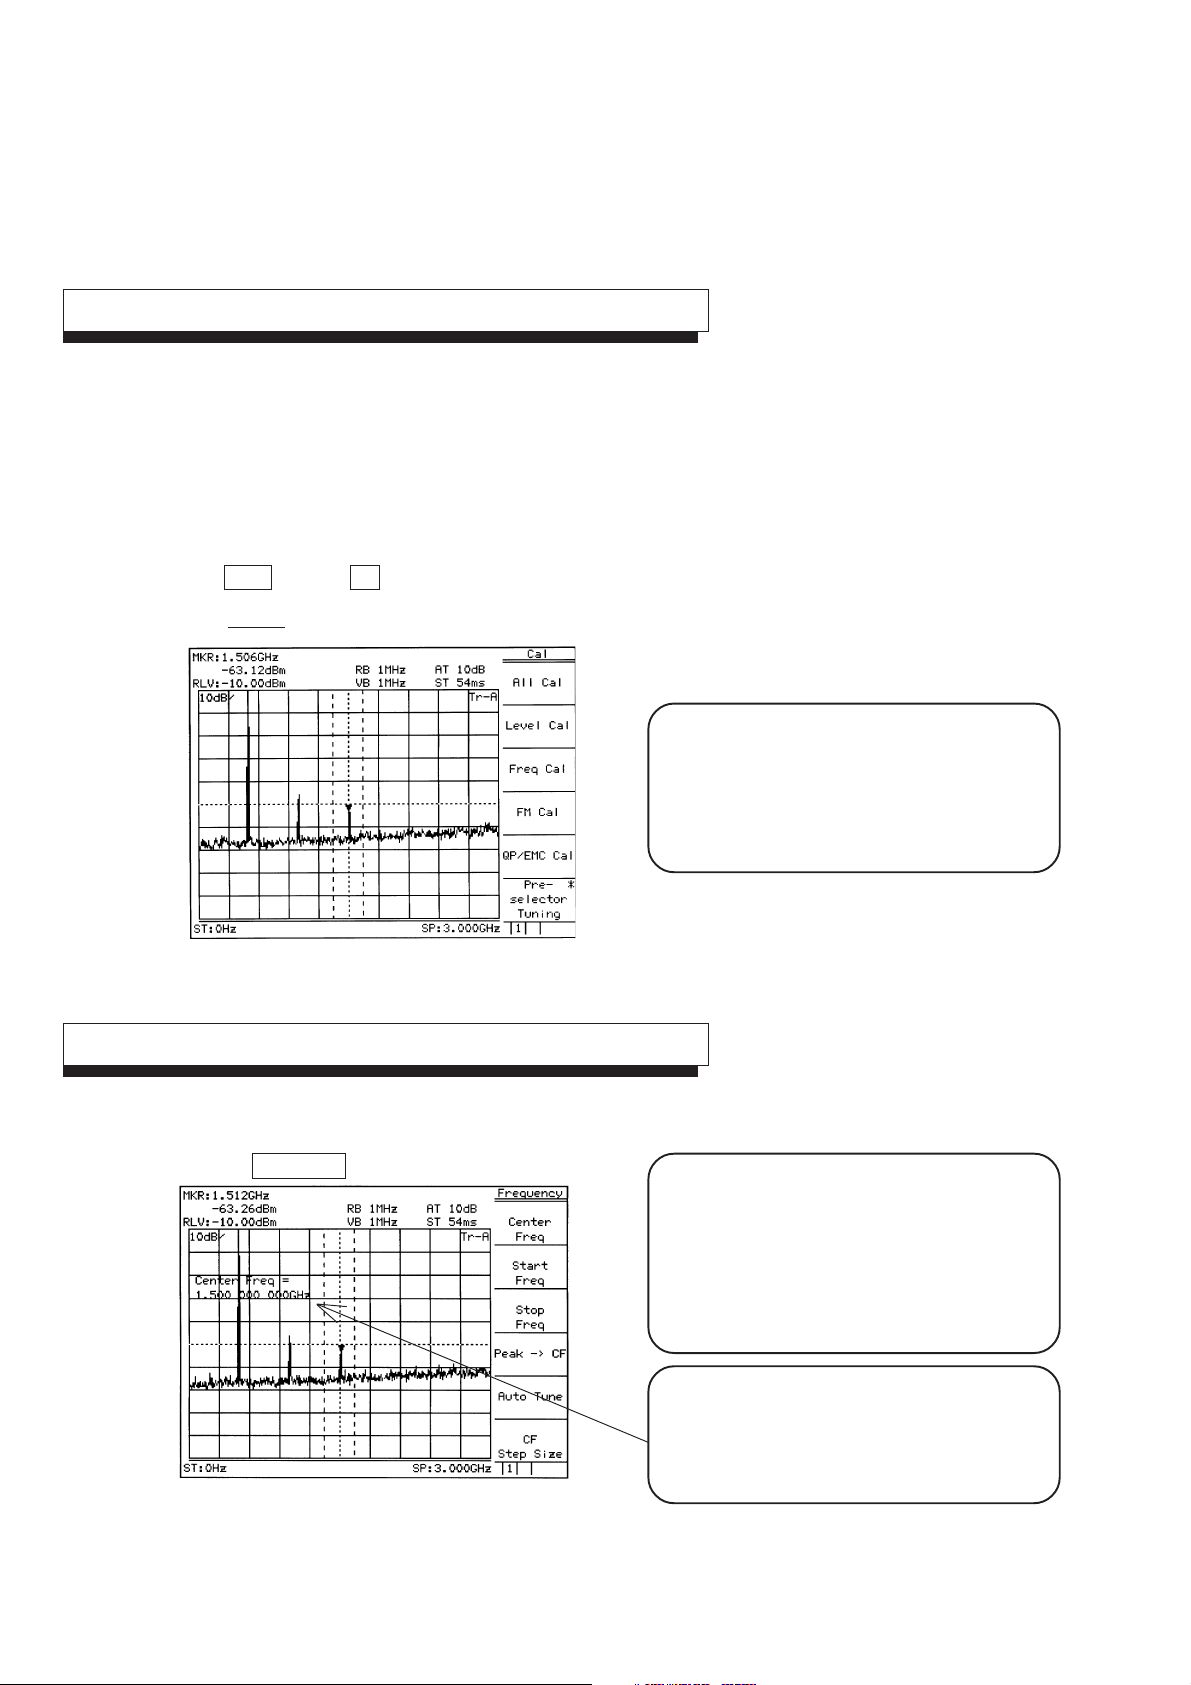
Execute automatic calibration
Wait after switching on the power supply of the
machine (warm up period) till the internal temperature
becomes stable. This period is approximately 10
minutes.
After warm up, execute automatic calibration.
CAL
Press Shift key then 0 key.
Select All Cal from the menu displayed on the display.
Fig. 1-2
Set the signal to the center of the screen
Automatic Calibration is carried out by using an
internal source without need for any external cable
connection.
See "Detailed Operation Instructions" for detail
information about contents of calibration.
1-4
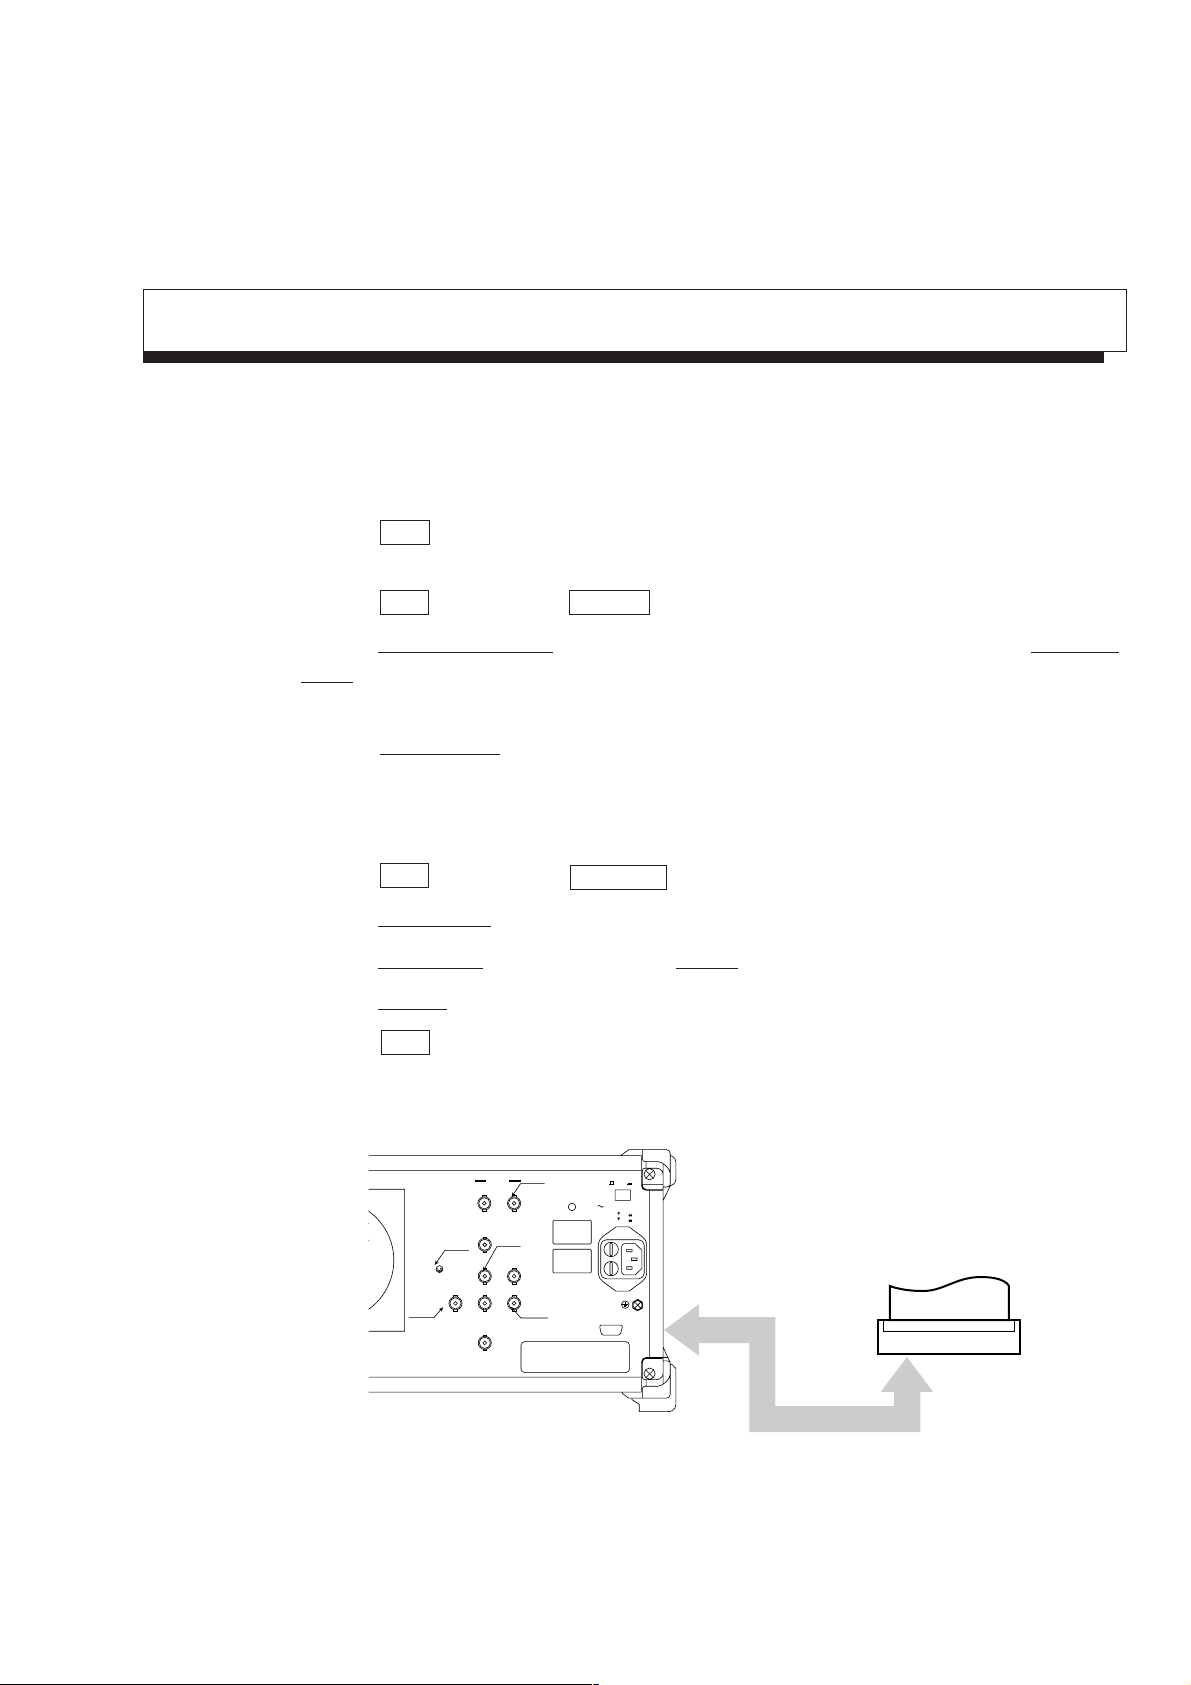
Press Frequency key.
Fig. 1-3
When pressing Frequency, Span, Amplitude or
Coupled Function key(s) which is used frequently,
Center Frequency, Span, Reference Level, RBW
or VBW function is selected and numeric value
for the function can be entered into Entry area.
This reduces key operation times.
This display section is called Entry area. Selecting
the menu displays the current set value of the
parameter. The set value can be changed by
entering data in Entry area.
Page 15

Press Menu On/Off key
Fig. 1-4
Press Menu On/Off key to return to previous screen.
Use the ten-key pad (numeric keys) to enter 500 MHz.
SECTION 1 BASIC OPERATION PROCEDURE
The display of the soft key menu can be switched
on/off using Menu On/Off key. When the menu
disappears, the scale is enlarged. Also, when the
menu is displayed, the scale is reduced.
Fig. 1-5
Enlarge and display the signal
Press Span key , then press the V down key several times to enlarge the signal display.
The following three methods to input numeric
values to parameters are provided: direct input by
the ten-key pad (numeric keys), up/down keys,
and rotary knob.
Fig. 1-6
1-5
Page 16

SECTION 1 BASIC OPERATION PROCEDURE
Marker Operation
Here, checks that the signal frequency and level are displayed in a marker display area. The zone marker
automatically fetches the highest level signal within the zone and displays the frequency and level.
Fig. 1-7
To check Marker→ CF function, shift the signal from the center intentionally.
Press Frequency key and More key in order, and then Scroll → key two times.
The soft key menu marked by an asterisk on the
upper right indicates that the menu can further be
opened by pressing the key. Adversely, the soft
key menu not marked indicates that the menu
cannot be opened any more, so to speak, the end
of menu opening.
The following items can easily be checked by the
soft key menu tab: How many pages of the soft
key menu being displayed currently are there?,
Fig. 1-8
and what page is displayed now?
To turn over the page, press More key.
1-6
Page 17

Press Peak Search key.
Fig. 1-9
The marker fetches the signal.
Press More to open 2nd page, and press Marker →
key.
SECTION 1 BASIC OPERATION PROCEDURE
*Advanced operation memo: It is convenient that
the page can also be turned over by repeatedly
pressing the panel key. This method is used when
key (s), such as Measure key, has a number of
pages. Besides, the Freq/Ampl and Marker-related
keys do not turn over the page by repeatedly
pressing the panel key. For these keys, because
the first page is important specially, it should always
be displayed when the panel key is pressed.
When the soft key menu is pressed, a menu of
function related to the menu is further displayed.
In this case, as shown in the figure on the left, the
thick line (the line on the preceding page) is
displayed at the left of the soft key menu. This
indicates that a new menu is overlapped with the
preceding page.
Fig. 1-10
Press marker → CF key.
The page opened by pressing the soft key can
return to the preceding page by the Return key.
Besides, it can be checked that which soft key
menu was pressed previously to open the current
menu, as the menu title is displayed on the upper
row of the soft key.
Fig. 1-11
Here, return to the screen of Fig. 1-8 and ensure that the screen changes to that of Fig. 1-11 only by pressing
the → CF key.
1-7
Page 18

SECTION 1 BASIC OPERATION PROCEDURE
"Measure" Function Check
Press Preset key and Preset All key in order.
Press Peak Search key.
If the zero beat signal level (local feed through) is larger than the signal level and the marker fetches the zero
beat level, press "Next peak" key and put the marker on the signal.
Fig. 1-12
Press the Measure key and Frequency Count key to set the function of high accuracy frequency measurement
of the marker points.
Then, press the Count On key and start measurement.
Fig. 1-13
The frequency of marker points is displayed at the top left of the screen.
Incidentally, the internal counter correctly operates even at the full span condition, so an operation to reduce
frequency span otherwise required is not necessary in this model.
The soft-key menu display can be switched On/
Off by the Menu On/Off key.
However, keys that condition setting is not
possible unless a menu is On unconditionally
make the soft-key menu display On when pressing
a panel key.
From the screen after executing measurement, press
another panel key and change parameters, and then,
pressing again the Measure key will automatically
return to the menu of this screen and not to page 1
of the menu (page learning function).
It is a useful function when repeating measurement.
1-8
Page 19
Screen Hard Copy
The screen can be hard-copied with the VP-600 printer (Epson) via an RS232C interface, and the procedures
are described below:
1) As illustrated below, connect the RS-232C connector and printer with an attached RS-232C cable.
2) Press the Copy key, and the currently displayed screen is hard-copied.
If the printed copy is improper, check if the RS-232C interface is correctly set in the following sequence.
3) Press the Shift key and then the Interface key.
4) Press the Connect to Controller key several times to get None on the display, and press the Connect to
Prt/Plt key several times and get RS-232C on the display.
Now the printer can be operated with RS-232C.
5) Press the RS232C Setup key and set so that (or check if) the setting of RS-232C interface is the same
between the main body and printer.
(For the setting/checking of the RS-232C interface on the printer side, refer to the instruction manual of
the printer.)
SECTION 1 BASIC OPERATION PROCEDURE
6) Press the Shift key and then the Copy Cont key.
7) Press the Printer/Plotter key and select Printer.
8) Press the Printer Setup key, and then press the VP-600 key.
9) Press the Magnify key several times and make the display 1×1.
10) Press the Copy key, and the currently displayed screen is hard-copied.
Rear panel
OPT01
OPT15
Phone
IF Out(455kHz/10.695MHz)
OPT07
Composite Out
10MHz STD
Ref In Buff Out
0dBm > 2Vp-p
OPT06
Trig/Gate In
(± 10V)
Sweep Status(Z)Video(Y)Sweep(X)
7.5Ω
Buff Out
OPT15
TTL0-0.5V0-10V
Freq Adj.
WARNING
CAUTION
Line Input 320VA Max
50/60/400Hz
100−120V 5A
200−240V 5A
RS−232C
Off
On
RS-232C cable
Printer
Fig. 1-14
1-9
Page 20

SECTION 1 BASIC OPERATION PROCEDURE
1-10
.
Page 21

SECTION 2 FREQUENCY/AMPLITUDE DATA ENTRY
SECTION 2
FREQUENCY/AMPLITUDE DATA ENTRY
This section describes the data entry function related to frequency and amplitude in the Freq/Ampl section on the front panel.
TABLE OF CONTENTS
Setting Observation Frequency
Center-Span Mode
Start-Stop Mode
Setting Step Size with Step Keys
Setting Frequency Scroll Step Size
Fixing the frequency bands
Setting Full Scan
Setting Zero Span
Setting Level Range
Setting Log/Linear Scale
Selecting Reference Level Units
Setting Reference Level
Setting Reference Level Step Size
Offsetting Reference Level
Setting Attenuator
Preamp Setting
Setting 50 Ω→75 Ω Impedance Transformer
Setting Level Frequency Correction Coefficient
......................................................................................................................
..........................................................................................................................
.........................................................................................................................
.......................................................................................................................
............................................................................................................................
.......................................................................................................................
...........................................................................................................................
...........................................................................................................
................................................................................................
.........................................................................................................
.............................................................................................................
.................................................................................................
..............................................................................................................
..................................................................................................................
............................................................................................
.............................................................................................
.............................................................................
..........................................................................
2-3
2-4
2-5
2-6
2-6
2-7
2-8
2-8
2-9
2-10
2-11
2-12
2-13
2-14
2-16
2-16
2-16
2-17
2-1
Page 22

SECTION 2 FREQUENCY/AMPLITUDE DATA ENTRY
2-2
Page 23

SECTION 2 FREQUENCY/AMPLITUDE DATA ENTRY
Trig/Gate
MS2661B
Spectrum Analyzer
9kHz–3GHz
RF Input 50Ω
+30dBm
±50V DC Max
+30dBm(PRE AMP On)
Local
Remote
Stby
On
Preset
Multi Mkr
Marker
Frequency
Span
Amplitude
Continuous
Single
Save
Recall
Measure
TG
A/B,A/BG
A,B
A/Time
Time
TV Monitor
CF RLV
Peak
Search
User
Marker
TG Output 50Ω
9kHz–3GHz
RVS PWR
+20dBm
0V DC Max
EntryMarkerFreq/Ampl
dBm
dB
V
sec
mV
msec
µV
µsec
0
Cal
.
– / +
BS
CE
8 9 GHz7
PTA
EMC
HoldDefine
.
Hz
EnterInterface Mem Card
2 3 kHz1
Sound System Title
5 6 MHz4
Copy
Copy Cont
Shift
Peak
Menu On/Off
More
F 1
F 2
F 3
F 4
F 5
F 6
RBW VBW Sweep Time Atten
Display
Coupled Finction
Memory Card
SECTION 2
FREQUENCY/AMPLITUDE DATA ENTRY
Setting Observation Frequency
The observation frequency of the spectrum analyzer is set in the following two modes:
• Center-Span
• Start-Stop
The frequency setting upper and lower limits are For the MS2651B/2661B/2661C, 0 to 3 GHz
For the MS2653B/2663B/2663C, 0 to 8.1 GHz, respectively.
The Frequency key is used as the header key for setting the frequency, and the Span key is used
as the header key for setting the frequency span.
Frequency
Span
2-3
Page 24

SECTION 2 FREQUENCY/AMPLITUDE DATA ENTRY
Center-Span Mode
(1) Setting center frequency
Frequency
(2) Setting frequency span
Span
TEN
KEY
TEN
KEY
Key
キー
キー
(1/2/5 sequence)
Key
(Use the CF Step Size key to set the step
size.)
2-4
Note: When frequency span is 200 kHz or less, warming up might be necessary until the observation
frequency becomes stable after turning on the power.
When "Warm Up" message is being indicated at the top right corner of the indicator, please wait
for approximately 3 minutes, and start the measurements after the message disappears.
Page 25
Start-Stop Mode
(1) Start frequency
SECTION 2 FREQUENCY/AMPLITUDE DATA ENTRY
Frequency
(2) Stop frequency
Frequency
Notes: • Because the and keys are the step keys for the center frequency, the start and stop
Start Freq
Stop Freq
TEN
KEY
TEN
KEY
frequencies are also changed.
• The stop frequency may also vary depending on the values of the frequency span setting resolution
and start frequency.
2-5
Page 26

SECTION 2 FREQUENCY/AMPLITUDE DATA ENTRY
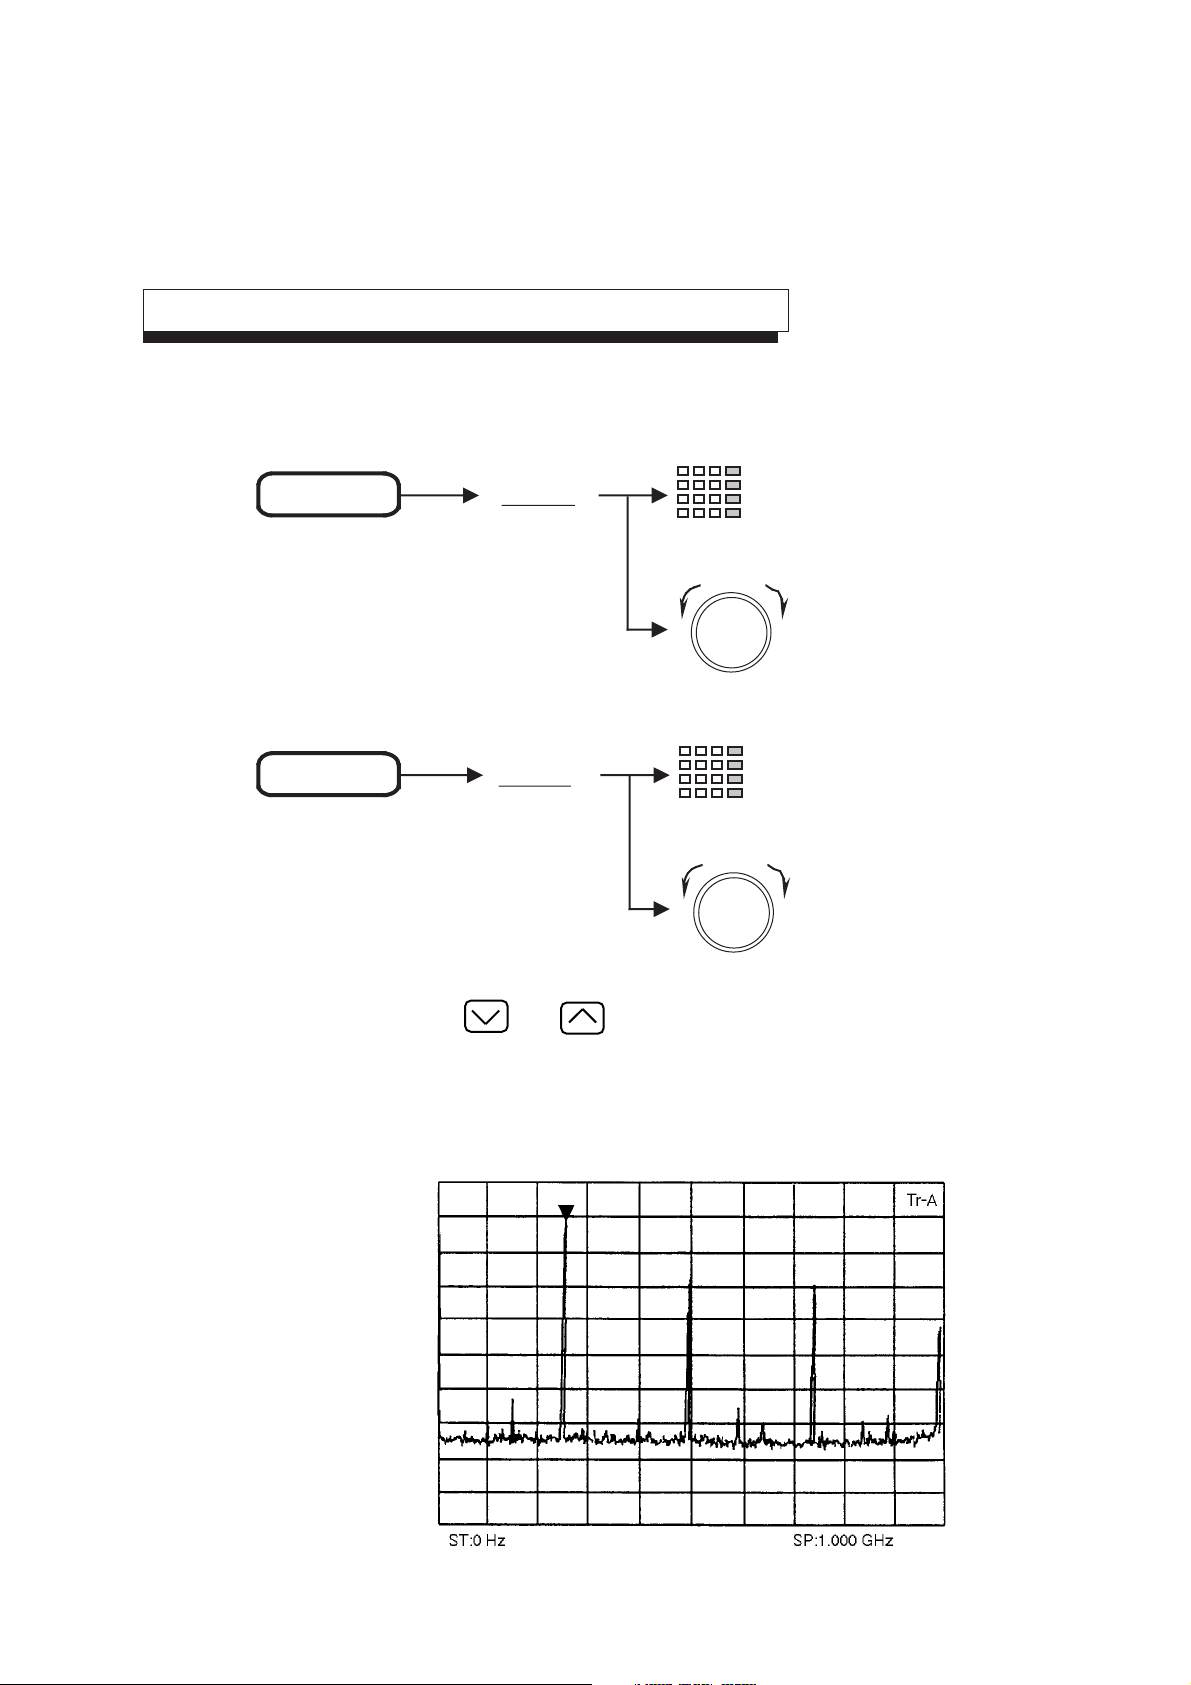
Setting Step Size with Step Keys
To use the keys to change the step size of the center frequency, register the step size as follows:
Frequency CF Step Size
Setting Frequency Scroll Step Size
Frequency
Scroll Step Size
Copy Cont
Stby
Spectrum Analyzer
MS2661B
Preset
Remote
Local
Copy
On
9kHz–3GHz
Memory Card
TEN
KEY
Menu On/Off
TG Output 50Ω
9kHz–3GHz
F 1
F 2
F 3
F 4
F 5
F 6
More
Frequency
Span
Amplitude
Peak
CF RLV
Save
Recall
Measure
Display
A/B,A/BG
A/Time
A,B
Time
Coupled Finction
RBW VBW Sweep Time Atten
RVS PWR
+20dBm
0V DC Max
1 div
2 div
EntryMarkerFreq/Ampl
PTA
8 9 GHz7
EMC
5 6 MHz4
Sound System Title
2 3 kHz1
Cal
0
.
.
CE
BS
HoldDefine
EnterInterface Mem Card
– / +
Hz
RF Input 50Ω
+30dBm
±50V DC Max
+30dBm(PRE AMP On)
Shift
dBm
dB
V
sec
mV
msec
µV
µsec
Multi Mkr
Marker
Marker
Peak
Search
Continuous
Single
TV Monitor
Trig/Gate
User
TG
Select a step size. The selected
scroll step size is highlighted.
5 div
10 div
2-6
2 div
Tr-A
return
Span
Return to the top menu.
Scroll→
The waveform scrolls 2 divs to the right.
Span
←Scroll
The waveform scrolls 2 divs to the left.
Page 27
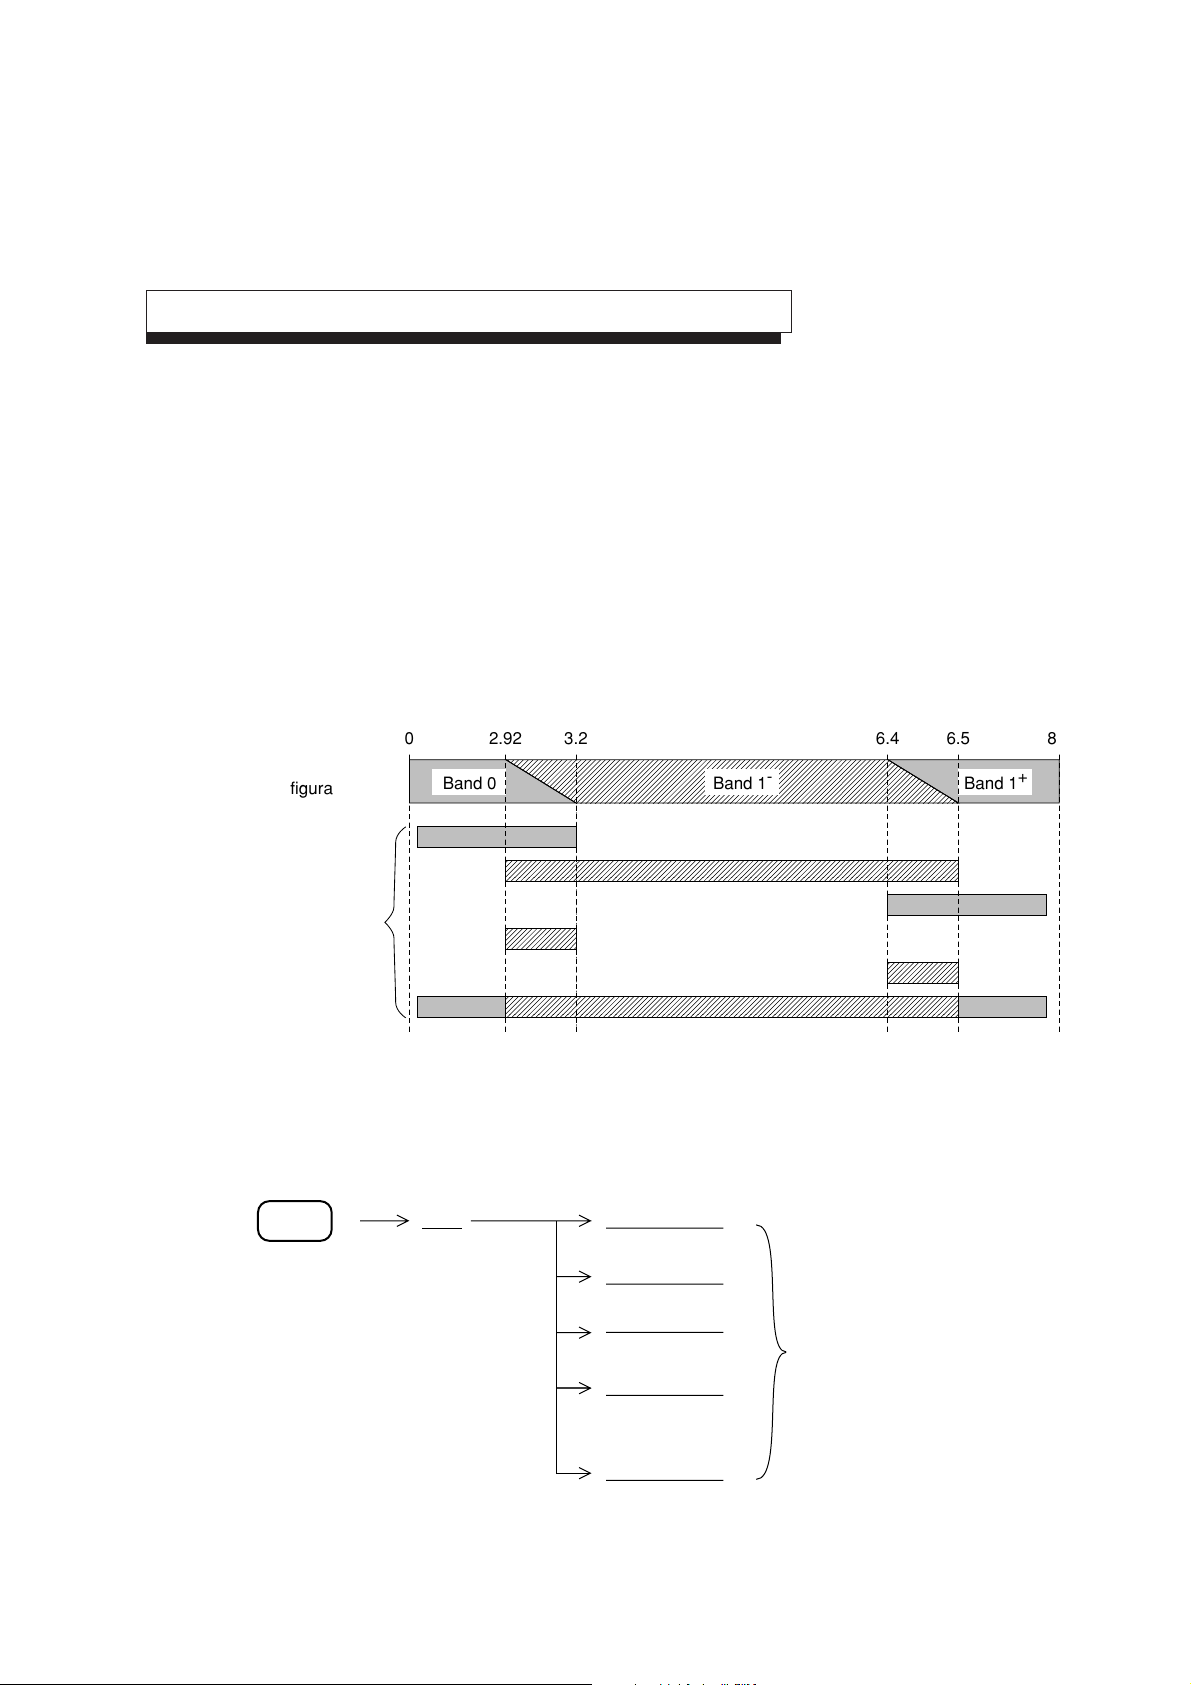
Fixing the frequency bands
This function is an MS2653B/2663B/2663C dedicated function. It cannot be used in the MS2651B/2661B/
2661C.
In the MS2653B/2663B/2663C, the 0 to 8.1 GHz frequency range consists of the following three bands:
• Band 0 .................. .0 to 3.2 GHz
• Band 1-................ 2.92 to 6.5 GHz
• Band 1+............... 6.4 to 8.1 GHz
In the initial state, the Auto Band mode that is operated by selecting the optional frequency band is selected
according to the range of frequencies to be observed.
SECTION 2 FREQUENCY/AMPLITUDE DATA ENTRY
Frequency band
configuration
Frequency range
to be observed
0 2.92 3.2 6.4 6.5 8.1
Band 0 Band 1
Band 1
(GHz)
+
Selection of frequency bands according to range of frequencies to be observed in Auto Band mode
Perform the following to set the frequency bands, for example, when the frequency bands are switched:
Span
Band
Auto Band
Manual Band 0
Manual Band 1
Manual Band 1
-
Select any of these buttons.
+
return
2-7
Page 28

SECTION 2 FREQUENCY/AMPLITUDE DATA ENTRY
Setting Full Scan
In the normal operating state, pressing
analyzer to be swept over the full span. However, this setting also initializes the parameters except the frequency
range.
To set the full span and leave the other parameters unchanged, perform the following key operations.
Span
For the MS2651B/2661B/2661C, 0 to 3 GHz
For the MS2653B/2663B/2663C Auto band, 0 to 8.1 GHz
For Band 0, 0 to 3.2 GHz
For Band 1-, 2.92 to 6.5 GHz
For Band 1+, 6.4 to 8.1 GHz
Setting Zero Span
The Spectrum Analyzer can operate as a selective level meter in which the horizontal axis is graduated as a
time axis by setting the frequency span to 0 Hz. The rising and falling edges of burst waves can also be
observed and measured.
Preset
the key allows the entire frequency range of the spectrum
Full Span
2-8
Performing any of the following key operations allows the spectrum analyzer to operate in the zero panel (time
domain) mode.
Hz
Time
Span
Span
0
Zero Span
•
•
•
For further details on the zero span (time domain) mode, see SECTION 5, "SELECTING THE DISPLAY
METHOD."
In the frequency and time domains, the RBW, VBW, Sweep time and other coupling functions time can be set
to different values. For further details, see SECTION 9, "SYSTEM SETTING AND PRESET FUNCTION."
Page 29
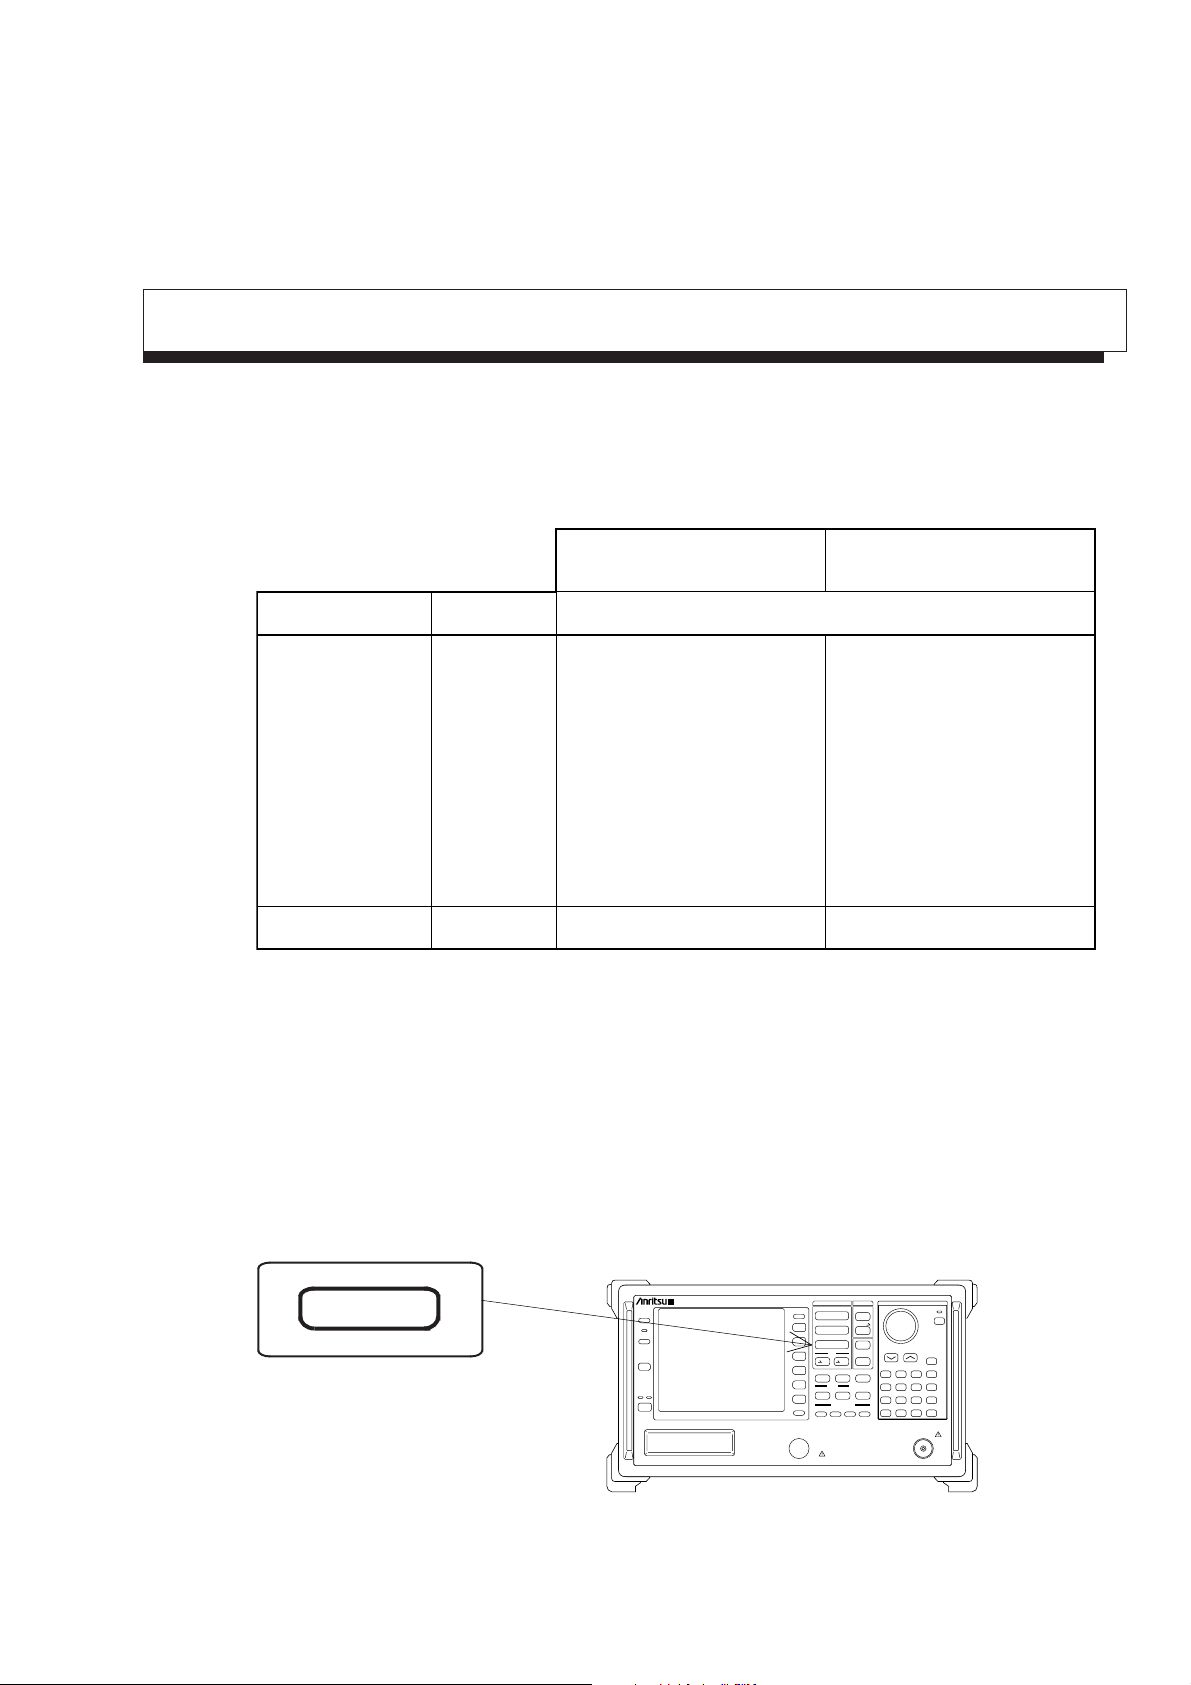
Setting Level Range
The table below shows the types of level display modes and the ranges of the reference level (top graticule of
the amplitude scale) for the different modes. When a preamp (Option) is used, the entire reference level range
is shifted 20 dB.
SECTION 2 FREQUENCY/AMPLITUDE DATA ENTRY
50 Ω (standard) 75 Ω (with Opt.22)
MS2651B/2661B/2661C only
Reference Level rangeUnitsDisplay mode
–100 to +25 dBm
+8.8 to +133.8 dBµV
–51.2 to 73.8 dBmV
2.74 µV to 4.87 V
+14.8 to +139.8 dBµV
100 fW to 316 mW
– – – – – –
274 µV to 4.87 V
Log scale
Linear scale
dBm
dBµV
dBmV
V
dBµV (emf)
W
dBµV/m
V
–100 to +30 dBm
+7 to +137 dBµV
–53 to 77 dBmV
2.24 µV to 7.07 V
+13 to +143 dBµV
100 fW to 1.0 W
– – – – – –
224 µV to 7.07 V
dBm: dBm unit system where 1 mW/50 Ω or 75 Ω is defined as 0 dBm.
dBµV: dBµV unit system where 1µV is defined as 0 dBµV, and the terminal voltage display is
terminated into 50 Ω or 75 Ω.
dBmV: dBmV unit system where 1 mV is defined as 0 dBmV, and the terminal voltage display is
terminated into 50 Ω or 75 Ω.
dBµV (emf): dBµV (emf) unit system based on the open-voltage display, and dBµV +6 dB is fed as the
output value.
The Amplitude key is used as the header key for setting the amplitude level.
Amplitude
Preset
Remote
Local
Copy Cont
Copy
Stby
Spectrum Analyzer
MS2661B
9kHz–3GHz
On
Memory Card
Menu On/Off
TG Output 50Ω
9kHz–3GHz
F 1
F 2
F 3
F 4
F 5
F 6
More
Frequency
Span
Amplitude
Peak
CF RLV
Save
Recall
Measure
Display
A/B,A/BG
A/Time
A,B
Time
Coupled Finction
RBW VBW Sweep Time Atten
RVS PWR
+20dBm
0V DC Max
Multi Mkr
Marker
Marker
Peak
Search
Continuous
Single
TV Monitor
Trig/Gate
User
TG
PTA
8 9 GHz7
EMC
5 6 MHz4
Sound System Title
2 3 kHz1
Cal
0
.
.
EntryMarkerFreq/Ampl
CE
BS
HoldDefine
EnterInterface Mem Card
– / +
Hz
RF Input 50Ω
+30dBm
±50V DC Max
+30dBm(PRE AMP On)
Shift
dBm
dB
V
sec
mV
msec
µV
µsec
2-9
Page 30
SECTION 2 FREQUENCY/AMPLITUDE DATA ENTRY
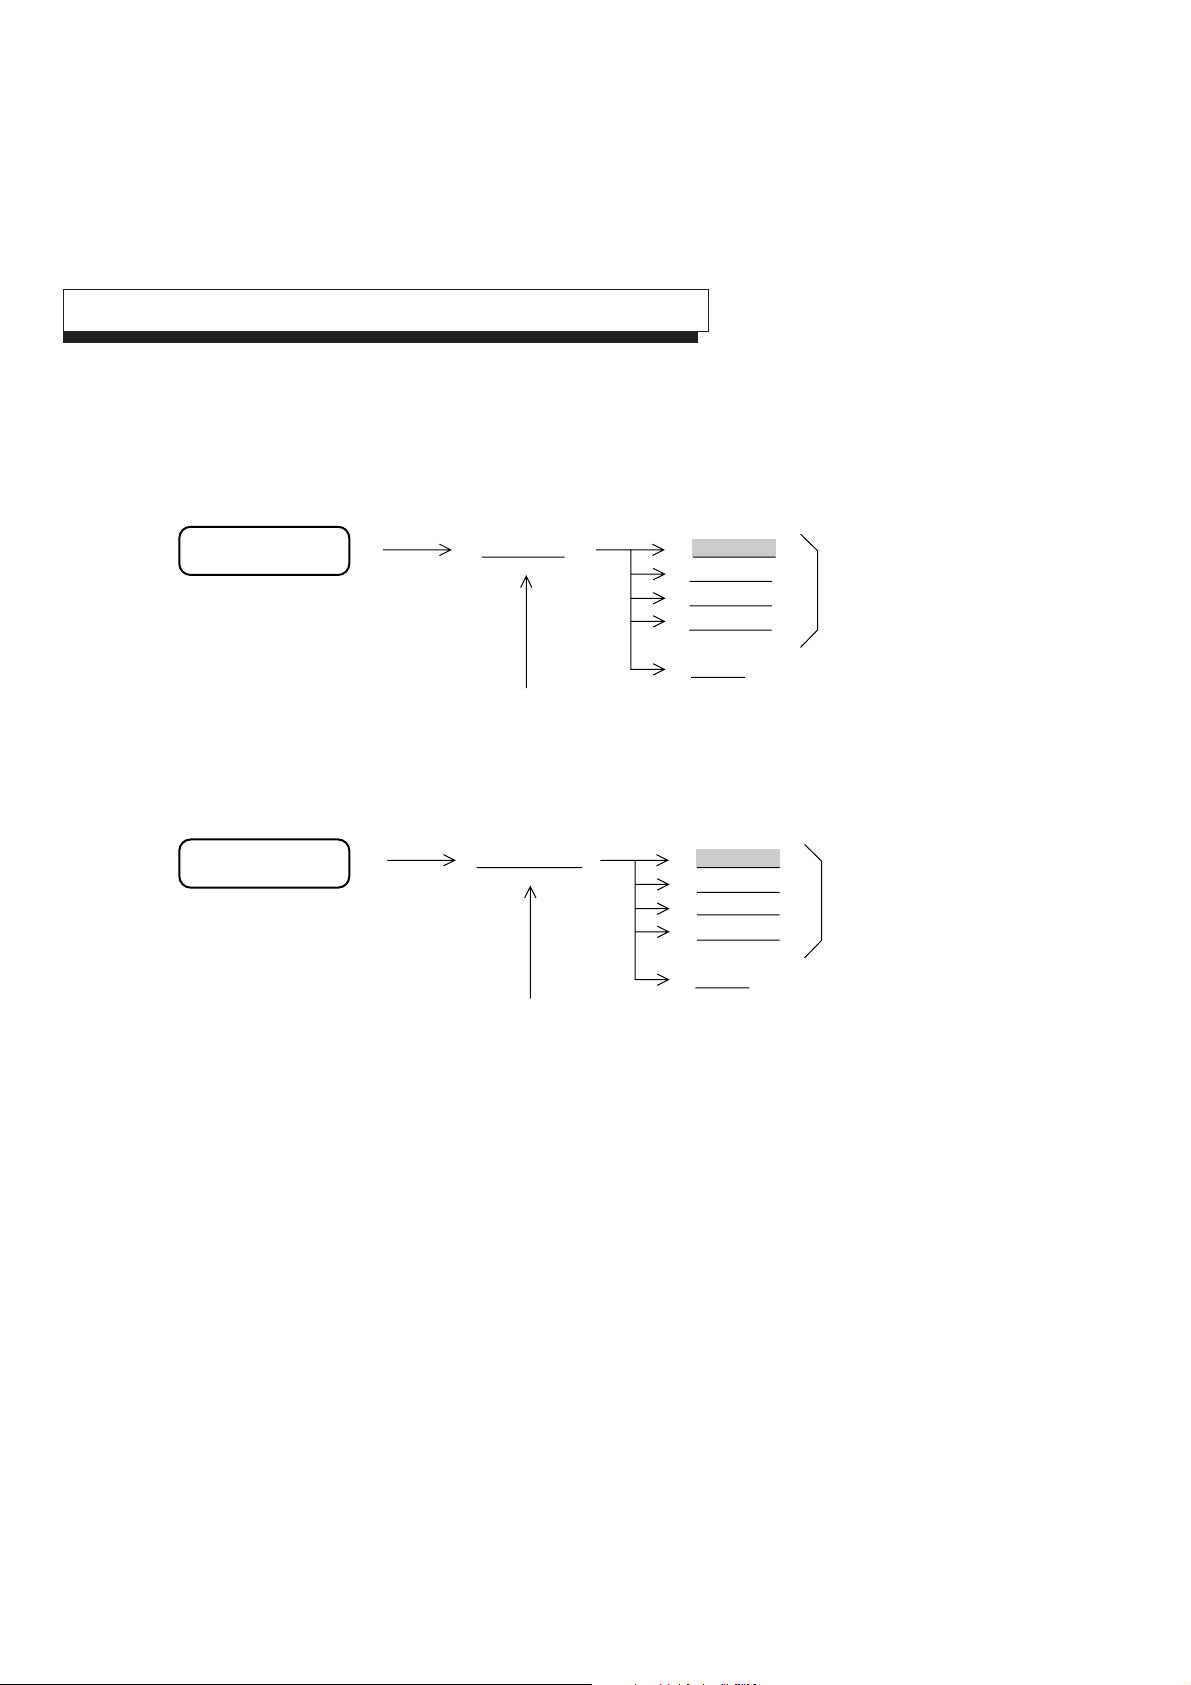
Setting Log/Linear Scale
To set the amplitude scale to log scale or linear scale, perform the following key operations.
(1) Setting log scale
Amplitude
(2) Setting linear scale
Amplitude
Log Scale 10 dB/div
The log scale is set when
this key is pressed.
Linear Scale 10%/div
The linear scale is set when
this key is pressed.
← Select one of the scales.
5 dB/div
2 dB/div
1 dB/div
Return
← Select one of the scales.
5%/div
2%/div
1%/div
Return
2-10
The reference level remains constant, independent of switching between log and linear scales.
When the reference level is set to less than –60 dBm in the log scale mode, the reference level of the linear
scale is switched to 224 µV/50 Ω or 274 µV/75 Ω.
Page 31

Selecting Reference Level Units
In the log scale mode, the spectrum analyzer provides six types of reference level units: dBm, dBµV, dBmV,
V, dBµV (emf), dBµV/m, and W. To select one of the reference level units, perform the following key
operations.
SECTION 2 FREQUENCY/AMPLITUDE DATA ENTRY
Amplitude
Because the reference level unit used for the linear scale is only V, there is nothing to select.
Selecting Input Impedance
This function is an standard: 50 Ω model dedicated function.
The input impedance of the spectrum analyzer is 50 Ω. Measurement with 75 Ω can be enabled by using 50
Ω→75 Ω Impedance Transformer. In this case, measured value is level converted.
When the input impedance is set to 75 Ω as shown in the figure below; measured value is level converted, and
displayed according to the level unit of the dBµV/dBmV/dBµV (emf)/V.
Unit dBm
dBuV
dBmV
dBuV (emf)
Input Impedance
Return
1
# To turn the page, press the More key.
dBuV/m
V
W
Return
2
#
← Select one of the units.
Amplitude
Unit 50 ohm
Input
Impedance
75 ohm
return
When the input impedance is set to 75 Ω, "75 ohm" is displayed at the top right of the waveform.
Select input
impedance.
2-11
Page 32

SECTION 2 FREQUENCY/AMPLITUDE DATA ENTRY
When the MA1621A is used as the 50 Ω→75 Ω Impedance Transformer, the insertion-loss frequency
characteristics of the MA1621A must be compensated. The spectrum analyzer has the level-compensation
function. (See p.2-16 "Setting 50 Ω→75 Ω Impedance Transformer (MA1621A)".)
Setting Reference Level
Select the reference level (top graticule of the amplitude scale) by performing the following key operations.
Amplitude
TEN
KEY
Key
キー
ステップサイズは、ログスケールの場合
When the log scale is selected, the value
はRefLevelStepSizeで指定した値、
set by Reference Level Step Size is used
as the step size. When the linear scale is
リニアスケールの場合は1div固定となり
selected, the step size is fixed at 1 division.
ます。
Use the unit key as follows, according to the set reference level unit.
dBm units
dBµV units
dBmV units
dBµV (emf) units
GHz
dBm
dB
2-12
V units
W units
dBµV/V units
MHz
kHz
Enter
Hz
(For W units, read V as W.)
V
sec
mV
msec
µV
µsec
Page 33

Setting Reference Level Step Size
To change the reference level with the keys, set the step size by performing the following key
operations.
(1) Log scale
SECTION 2 FREQUENCY/AMPLITUDE DATA ENTRY
(2) Linear scale
Fixed at 1 division.
Amplitude
Ref Level
Step Size *
Manually enter the step size in dB units from the ten keys.
1 Div
2 Div
5 Div
10 Div
Manual
Return
← Select one.
2-13
Page 34

SECTION 2 FREQUENCY/AMPLITUDE DATA ENTRY
Offsetting Reference Level
The reference level and waveform trace can be displayed by adding a given offset.
2-14
The # is displayed to the right of the reference level display above the scale.
Page 35

SECTION 2 FREQUENCY/AMPLITUDE DATA ENTRY
Turn the offset display On/Off and set its offset value by performing the following key operations.
Amplitude
Ref Level
Offset *
Ref Level Select reference level offset On or Off.
Offset
On Off
Ref Level
Offset
–10.05 dB
Return
Set the offset value (dB) with the ten keys, up-down
keys, or rotary knob.
The offset value setting range is from –100 to +100 dB. The offset value resolution is 0.01 dB.
The offset can be applied to each trace (A, B, BG, Time), but it cannot be applied when monitoring FM
demodulated waveforms and when using A–B→A function.
2-15
Page 36

SECTION 2 FREQUENCY/AMPLITUDE DATA ENTRY
Setting Attenuator
Press the Amplitude key, then press the Attenuator key.
Select manual setting or automatic setting.
For manual setting, enter the attenuator setting in dB units from the ten keys.
Preamp Setting
This function is an MS2651B/2661B/2661C dedicated function.
Press the Amplitude key, then press the Pre Ampl key.
Press the Pre Ampl On/Off key. The 20 dB preamp (Option) is turned On and Off. The preamp gain-frequency
curve is also compensated.
Setting 50 Ω→75 Ω Impedance Transformer
This function is an standard: 50 Ω model dedicated function.
When the optional MA1621A (75Ω→50Ω) impedance transformer is installed to the RF input attenuator (see
the figure below), set the input impedance to 75 Ω.
Press the Amplitude key, then press the Input Transformer key.
Set the MA1621A to On with the On Off key.
When the input impedance is set to On; it is assumed that a 25Ω resistor is connected in series with the input,
the level is converted for 75Ω, the insertion-loss frequency characteristic is corrected, and then the measured
result is displayed.
MA1621A MS2650/60 SPA
75 Ω
25 Ω
50 Ω
2-16
Page 37

SECTION 2 FREQUENCY/AMPLITUDE DATA ENTRY
Setting Level Frequency Correction Coefficient
This function corrects the level-frequency characteristics of the cables and pads (connected to the front end of
the RF Input connector) so that the level becomes flat. Correction tables are written via the RS-232C or GPIB
interface.
Amplitude
Correction *
Correctionb Select correction On or Off by pressing this key.
On Off
Select Corr *
Setup Corr *
Return
Load Corr Set
Display
Directory
/Next
Dir Disp
Detail
Outline
Select the correction table from among the five correction
tables (Corr-1 to 5).
Load the five correction tables from the memory card.
Display the directory on the screen.
When the entire directory cannot be displayed at one time,
display the remaining directory by holding down the key.
Select detailed/outline display by pressing this key.
For further details, see SECTION 8.
Save Corr Set
Load/Save
Media *
Return
Save the five correction tables to the memory card.
Select if memory card 1 or memory card 2 is to be loaded
and saved to the media.
2-17
Page 38

SECTION 2 FREQUENCY/AMPLITUDE DATA ENTRY
2-18
.
Page 39

SECTION 3 MARKER FUNCTIONS
SECTION 3
MARKER FUNCTIONS
This section describes the marker functions for improving the measurement efficiency, such as the zone marker, marker
mode menu, marker search, and the parameters set by marker value.
For a description of marker tracking and zone sweep setting, see SECTION 6 SELECTING THE SWEEP METHOD.
TABLE OF CONTENTS
Changing Zone Marker Position and Width
Changing Zone Marker Width
Changing Zone Marker Position
Marker Mode
Normal Marker
Delta Marker
Marker Off
Switching Marker Search Mode
Display Line
Setting Display Line
Multimarker
Highest 10 Multimarker
Harmonics Multimarker
Marker List
Manual Set
Multimarker Off
.......................................................................................................................................
............................................................................................................................
...............................................................................................................................
...................................................................................................................................
.........................................................................................................................................
.........................................................................................................................................
..................................................................................................................................
..................................................................................................................................
...........................................................................................................................
....................................................................................................................
.....................................................................................................
.................................................................................................
..................................................................................................
...............................................................................................................
...............................................................................................................
........................................................................................
3-4
3-4
3-6
3-7
3-7
3-8
3-9
3-9
3-10
3-10
3-11
3-11
3-12
3-12
3-13
3-14
Marker Search
Peak Search
Next Peak Search
Next Right Peak Search/Next Left Peak Search
Dip Search
.....................................................................................................................................
...............................................................................................................................
.......................................................................................................................
..................................................................................................................................
.........................................................................
3-15
3-15
3-16
3-17
3-18
3-1
Page 40

SECTION 3 MARKER FUNCTIONS
Next Dip Search
Setting Search Resolution
Setting Search Threshold
Setting Parameters Using Marker Values
Mkr → CF/Mkr → RLV
Mkr → CF Step Size
Delta Mkr → Span
Zone → Span
..........................................................................................................................
..........................................................................................................
...........................................................................................................
................................................................................................................
...................................................................................................................
.......................................................................................................................
..............................................................................................................................
...........................................................................................
3-19
3-19
3-20
3-21
3-22
3-23
3-24
3-25
3-2
Page 41

SECTION 3
MARKER FUNCTIONS
The keys inner section are used as the header keys for setting the marker functions.
SECTION 3 MARKER FUNCTIONS
Marker
Multi Mkr
Marker
Marker
Peak
Search
Preset
Remote
Local
Copy Cont
Copy
Stby
Spectrum Analyzer
MS2661B
9kHz–3GHz
On
Memory Card
Menu On/Off
F 1
F 2
F 3
F 4
F 5
F 6
More
TG Output 50Ω
9kHz–3GHz
Frequency
Span
Amplitude
Peak
CF RLV
Save
Recall
Measure
Display
A/B,A/BG
A/Time
A,B
Time
Coupled Finction
RBW VBW Sweep Time Atten
RVS PWR
+20dBm
0V DC Max
Multi Mkr
Marker
Marker
Peak
Search
User
Continuous
Single
TV Monitor
Trig/Gate
TG
PTA
8 9 GHz7
EMC
5 6 MHz4
Sound System Title
2 3 kHz1
Cal
0
.
.
EntryMarkerFreq/Ampl
CE
BS
HoldDefine
EnterInterface Mem Card
– / +
Hz
RF Input 50Ω
+30dBm
±50V DC Max
+30dBm(PRE AMP On)
Shift
dBm
dB
V
sec
mV
msec
µV
µsec
3-3
Page 42

SECTION 3 MARKER FUNCTIONS
Changing Zone Marker Position and Width
The part enclosed in dotted lines in the center of the screen shown in the figure below is called the zone marker.
The current marker within this zone marker normally moves to the maximum level.
The frequency (or time for time domain mode) and level at the current marker point (intensified point) are
displayed at the top left-hand corner of the screen.
Changing Zone Marker Width
The zone marker width is initially set to 1 division, but can be changed from 1 point to 10 divisions by
performing the following key operations.
Marker
The zone marker width can be arbitrarily set from 1 point to 10 divisions by rotary knob.
The zone marker width can be arbitrarily set from 1 point to 10 divisions by the corresponding frequency input
from the ten keys.
3-4
Zone Width *
Spot
1 Div
2 Div
5 Div
10 Div
return
Select one. The selected zone
width is highlighted.
Page 43

SECTION 3 MARKER FUNCTIONS
When the zone marker width is set to 1 point (Spot), the zone marker becomes a vertical line. This is called a
spot marker. Since the marker center frequency and the current marker frequency coincide, the level at the
desired frequency can be measured.
If the zone marker is set to 10 divisions when the zone center frequency is at the center of the frequency axis on
the screen, the current marker will always move to the maximum peak level over the entire range of the
observation frequency.
Since the zone width in the time domain mode always becomes 1 (Spot), it cannot be changed.
3-5
Page 44

SECTION 3 MARKER FUNCTIONS
Changing Zone Marker Position
The center frequency (time) of the zone marker is initially centered on the frequency (time) axis on the screen.
By performing the following key operations, the zone marker can be moved from the left end to the right end
of the frequency axis (time) on the screen.
Marker
TEN
KEY
(Use the ten keys to set the zone marker
position as frequency or time.)
(Use the up-down keys to move the zone
Key
キー
ステップサイズは、ログスケールの場合
marker position in 1 division steps.)
はRefLevelStepSizeで指定した値、
リニアスケールの場合は1div固定となり
ます。
In the delta marker mode, setting the zone marker center frequency (time) with the ten keys results in entry of
the delta marker value (difference between reference marker and current marker).
3-6
Page 45

Marker Mode
Three types of markers can be used with the spectrum analyzer: normal marker, delta marker, and multimarker.
Normal Marker
A single marker is indicated by ▼ at the maximum level within the zone marker. The frequency and level at
that point are displayed digitally.
The normal marker is initially set to ON. When the current state is another marker mode, or when the normal
marker is set to OFF, perform the following key operations to set the normal marker to ON.
SECTION 3 MARKER FUNCTIONS
Marker
MRK : 1.023 GHz
Normal Marker
–32.6 dBm
Current marker
Tr-A
▼
The normal marker displays the absolute level. By setting a display line, the normal marker can also display
the level relative to a given level specified as a reference line.
3-7
Page 46

SECTION 3 MARKER FUNCTIONS
Delta Marker
The current marker position when the delta marker is set to On is fixed as the reference marker (reference
point). Then, as the current marker is moved, the reference marker and current marker frequency (time) and
level differences are displayed digitally as delta marker values.
In the delta marker mode, the reference marker is indicated by .
To set the delta marker to On, perform the following key operations.
Marker
Press the Delta Marker key in the delta maker mode. The reference marker moves to the current marker
position and switches to the delta marker mode with that point as the reference point.
Delta Marker
3-8
Varying the spectrum waveform in the delta marker mode does not change the marker frequency level. The
reference marker is not necessarily always on the waveform because it remains unchanged. Also, when the
reference marker cannot be positioned on the screen by changing the observation frequency and level and
range, it is at the edge of the scale lines.
The marker mode at delta marker-ON becomes the normal mode when the scale mode is changed from log
scale to linear scale and vice-versa. If the scale mode was changed, set the delta marker again.
Page 47

Marker Off
SECTION 3 MARKER FUNCTIONS
Marker
The marker disappears from the screen. When the Normal Marker key is pressed, the marker is displayed.
Marker Off
Switching Marker Search Mode
Searching the maximum value (Peak) or minimum value (Dip) in the zone marker is selected by pressing this
key. Usually select Peak.
Marker
Marker Search Peak Dip
(Display page 2 of the menu by pressing the More key.)
3-9
Page 48

SECTION 3 MARKER FUNCTIONS
Display Line
In the state in which a horizontal line which indicates a given level (frequency deviation for FM demodulated
waveform display) is displayed on the scale, the display line can be used as the frequency response measurement
guideline, or as the reference line of the marker level measurement or pass/fail judgement with a standard line.
Setting Display Line
To turn the display-line On and Off and to set the display-line level (frequency deviation), perform the following
key operations.
Marker
Display Line *
(Display page 2 of the menu by pressing the More key.)
Display Line Turn the display line On and Off by pressing this key.
On Off
Display Line Enter the display line level from the ten keys, etc.
Level
–50.00 dBm
Marker Level Select if the marker level is set by absolute value or relative
Abs Rel value (relative to display line) by pressing this key.
Return
Display-line On and Off are common to all traces (A, B, BG, Time). Also, the display-line level is common
except for FM demodulated waveform display.
3-10
The display-line level and Abs/Rel can be selected independently for each trace.
Page 49

Multimarker
The spectrum analyzer has a marker function which displays up to ten markers displayed simultaneously.
Multimarker can be set by the following four methods:
• Highest 10
• Harmonics
• Marker List
• Manual Set
Highest 10 Multimarker
Allocates up to 10 multimarkers in descending order of signal peak level displayed on the screen.
SECTION 3 MARKER FUNCTIONS
Multi Mkr
Shift
After executing Highest 10, an active marker (with the same functions as the current marker) moves to the
peak point of the maximum level signal.
Note: Each multimarker has a zone as the same as the current marker, and is positioned at the maximum
level point. So, when the next sweep is done after Highest 10 operation, each multimarker position
may be changed. To protect this, execute the Highest 10 after stopping the sweeping or after narrowing
the zone width.
Marker
Highest 10
3-11
Page 50

SECTION 3 MARKER FUNCTIONS
Harmonics Multimarker
Allocates multimarkers to the 2nd to the 10th harmonic signals of the active marker signal as the fundamental
signal.
Shift
Multi Mkr
Marker
Harmonics
Note: If the fundamental and second harmonic signals are not separated by more than the marker zone
Marker List
Shift
width, or when there are larger level signals other than harmonic signals in the frequency range of
the marker zone width centered at the harmonic signals, harmonic signals will be incorrectly detected.
In this case, narrow the marker zone width.
Multi Mkr
Marker List *
Marker List
On Off
Freq/Time
Abs Rel
Level
Abs Rel
Return
Marker
Turn the marker list display On and Off by pressing this key.
Select frequency/time as absolute value or relative value
(relative to frequency/time of active marker) display by pressing this key.
Select level as absolute value or relative value (relative to
active-marker level) display by pressing this key.
3-12
Page 51

SECTION 3 MARKER FUNCTIONS
In Freq/Time Rel mode, frequency and time of the markers
except active marker are displayed in relative values, and
“R” marks are appended at the left.
In Level Rel mode, level of the markers except active
marker are displayed in relative values,
2
4
1: 1.00000GHz
∗
2:R -1.31MHz
3:R 1.41MHz
4:R -2.00MHz
5:R 1.89MHz
6:R 2.20MHz
7:
8:
9:
10:
1
3
Marker List
-15.12dBm
-3.55dB
-3.61dB
-5.96dB
-6.21dB
-6.76dB
5
6
3-13
Page 52

SECTION 3 MARKER FUNCTIONS
Manual Set
Allocates up to 10 multimarkers to arbitrary frequencies or time points.
Shift
Change Active
Maker No
Multi Mkr
Marker
Manual Set *
Selects the active marker from among the markers that are
currently On. Each time this key is pressed, the markers are
scrolled and selected. #
Select Marker
No 4
On with
Auto Select
Off with
Auto Select
Specifies the marker number to be set to On or Off.
At the same time the marker number selected above is set to On,
the selected marker is made the active marker. If the selected
marker is already On, the next higher marker number of the markers
set to Off is set to On. By holding this key down, the multimarkers
are set to On one by one in ascending order of number.
<Example> When marker No.4 is selected when marker
Nos. 3, 4, 5, 8, and 9 are On, the markers are
turned On in No., 6, 7, 10, 1, 2 order.
Sets the marker of the selected No. to Off. If the selected
marker is already Off, the next smaller marker No. of the markers
set to On is set to Off. By holding down this key, the multimarkers
are set to Off one by one in descending order of number. When
the active marker is set to Off, the marker with the next smaller
number is made the active marker.
<Example> When marker No. 7 is selected to be set to Off when
marker Nos. 3, 4, 5, 8 and 9 are On and marker No. 5
is made the active marker, the markers are set to Off
in No. 6, 5, 4, 3, 9 order, then marker No. 8 becomes
the active marker.
3-14
# The active marker is indicated by the ▼ mark. The other
marker Nos. are indicated by the mark. The active marker
can be moved by using the ten keys, up-down keys, or rotary
knob.
Continued
Page 53

SECTION 3 MARKER FUNCTIONS
Clear All
Return
Leaves only the marker number currently made the active marker
and sets all the other multimarkers to Off. The active marker
number is then reset to 1.
Multimarker Off
To return from multimarker to normal marker, perform the following key operations.
Shift
Multi Mkr
Marker
Multi Marker On Off
3-15
Page 54

SECTION 3 MARKER FUNCTIONS
Marker Search
The spectrum analyzer has the following six marker search functions:
• Peak search
• Next Peak search
• Next Right Peak search
• Next Left Peak search
• Dip search
• Next Dip search
Peak Search
Peak Search detects the maximum level point from the entire trace in which a marker is displayed and moves
the marker to that point.
To Execute Peak search, perform the following key operations.
3-16
Page 55

Next Peak Search
Next Peak Search detects the next largest peak relative to the current marker level and moves the marker to that
point. (When there are two or more peaks with the same level on the screen, the leftmost peak is detected.)
Execute Next Peak search by performing the following key operations.
SECTION 3 MARKER FUNCTIONS
Next Peak
The next largest peaks can be detected and the marker can be moved to those peaks by executing Next Peak
Search consecutively.
3-17
Page 56

SECTION 3 MARKER FUNCTIONS
Next Right Peak Search/Next Left Peak Search
Next Right Peak search and Next Left Peak Search detect the adjacent peak level to the right or left of the
current marker and move the marker to that point.
To execute Next Right Peak Search and Next Left Peak Search, perform the following key operations.
Next Right Peak
Next Left Peak
3-18
The adjacent peak level to the right or left can be detected and the marker moved to that peak by executing
Next Right Peak Search or Next Left Peak Search consecutively.
Note: When marker search is executed, the marker is moved to the specified Peak or Dip point, and the
zone marker center frequency is simultaneously moved to the marker point. After that, when sweep
is executed within the zone marker, the marker moves to the maximum point within the zone marker.
Therefore, marker search other than Peak search should be executed with sweep stopped or with the
zone width set to 1 point (spot marker mode).
Page 57

Dip Search
Dip search detects the minimum level point from the entire trace in which a marker is displayed and moves the
marker to that point.
Execute Dip search by the performing the following key operations.
SECTION 3 MARKER FUNCTIONS
Peak
Search
▼
Dip Search
(Display page 2 of the menu by pressing the More key.)
Time domain waveform
Tr-Time
▼
3-19
Page 58

SECTION 3 MARKER FUNCTIONS
Next Dip Search
Next Dip Search detects the next smallest dip relative to the current marker level and moves the marker to that
point. (When there are two or more dips with the same level on the screen, the leftmost dip is detected.)
Execute Next Dip Search by performing the following key operations.
Peak
Search
Next Dip
(Display page 2 of the menu by pressing the MORE key.)
Time domain waveform
The next smallest peaks can be detected one by one and the marker moved to the detected peaks by executing
Next Dip Search consecutively.
Setting Search Resolution
Sets the Peak and Dip search resolution. When searching for the next peak, etc., the marker moves to the point
of the set resolution or higher.
3-20
Peak
Search
Resolution 1.23 dB
(Display page 2 of the menu by pressing the More key.)
Enter the resolution in dB units from the ten keys.
Page 59

Setting Search Threshold
Sets the display line to the threshold and searches for the level above or below the display line.
SECTION 3 MARKER FUNCTIONS
Peak
Search
Threshold *
(Display page 2 of the menu by pressing the More key.)
Treshold
On Off
Search
Above
Below
Threshold
Level
–50.00 dBm
Return
Turn threshold On and Off by pressing this key.
Select search above or below the display line by pressing this
key.
Sets the display line level.
3-21
Page 60

SECTION 3 MARKER FUNCTIONS
Setting Parameters Using Marker Values
The marker value can be set as the parameter value of the observation frequency, reference level, and so on.
This facilitates observation of the desired waveform.
To set parameters using the marker value, the following settings are possible:
• Mkr → CF Sets the marker frequency to the center frequency.
• Mkr → RLV Sets the marker level to the reference level.
• Mkr → CF Step Size Sets the marker frequency to the center frequency step size.
• Delta Mkr → Span Sets the reference marker and current marker frequency to the start frequency and
stop frequency, respectively.
• Zone → Span Sets the zone marker center frequency and zone width to the center frequency and
frequency span, respectively.
In the time domain mode, only Mkr → RLV is valid.
3-22
Page 61

Mkr → CF/Mkr → RLV
Sets the current marker frequency or level to the center frequency or reference level.
SECTION 3 MARKER FUNCTIONS
Marker
Marker → *
Mkr → CF
Mkr → RLV
3-23
Page 62

SECTION 3 MARKER FUNCTIONS
Mkr → CF Step Size
Sets the marker frequency to the center frequency step size (up-down keys resolution).
Marker
Marker → *
Mkr → CF Step Size
Although this action does not cause any change to appear on the screen, when the center frequency is changed
with the up-down keys, the center frequency is changed with the marker frequency as the step size. This
facilitates observation of harmonic waves.
3-24
Page 63

Delta Mkr → Span
In the delta marker mode, this operation sets the delta marker mode current marker frequency and reference
marker frequency to the start frequency and stop frequency, respectively.
SECTION 3 MARKER FUNCTIONS
Marker
Marker → *
Delta Mkr → Span
3-25
Page 64

SECTION 3 MARKER FUNCTIONS
Zone → Span
To set the zone marker center frequency and width to the center frequency and frequency span, respectively,
perform the following key operations.
Marker
Marker → *
Zone → Span
3-26
.
Page 65

SECTION 4 SIGNAL SEARCH FUNCTION
SECTION 4
SIGNAL SEARCH FUNCTION
Signal search facilitates extraction of the objective signal Although the functions of signal search are similar to the marker
function, this section only describes the Signal Search section
TABLE OF CONTENTS
Detecting Peaks
Detecting the Maximum Peak Signal by Automatic Tuning
Moving the Measurement Point
Peak → CF and Peak → RLV
..................................................................................................................................
..........................................................................................................
.....................................................................................................
........................................................
4-3
4-4
4-5
4-6
4-1
Page 66

SECTION 4 SIGNAL SEARCH FUNCTION
4-2
Page 67

SECTION 4
SIGNAL SEARCH FUNCTION
Detecting Peaks
The spectrum analyzer has the following three peak detection functions:
• Auto Tune
• Zone Marker
• Marker Tracking
SECTION 3 MARKER FUNCTION describes the Zone Marker function and SECTION 6 SELECTING THE
SWEEP METHOD describes the Marker Tracking function.
SECTION 4 SIGNAL SEARCH FUNCTION
4-3
Page 68

SECTION 4 SIGNAL SEARCH FUNCTION
Detecting the Maximum Peak Signal by Automatic Tuning
Frequency
Pressing the Auto Tune key detects the maximum peak signal within the Back Ground (BG) and sets that
signal frequency and level to the center frequency and reference level, respectively.
Notes: • When executed at a frequency span of more than 100 MHz, the frequency span is set to 100
MHz. When executed at a frequency span of less than 100 MHz, that value is retained.
• When the Display mode was executed by trace Time, the instrument switches to trace A/Time
and trace Time becomes the main trace. Also the Expand mode is set to Off.
• The input attenuator is set to Auto.
• In the initial state, the Auto Tune frequency range is set to 90 MHz to 3 GHz for the MS2651B/
MS2661B/2661C, and 250 MHz to 8.1 GHz for the MS2653B/MS2663B/2663C. By changing
the trace BG frequency range, the Auto Tune frequency range can also be set as follows:
Start frequency
Start frequency specified in trace BG
However, except the 0 Hz to 3/100 frequency span range.
Stop frequency
Stop frequency specified in trace BG.
Auto Tune
4-4
Page 69

Moving the Measurement Point
This function moves the spectrum on the screen to the center to facilitate measurement. The following five
functions can be used.
• Mkr → CF Sets the marker frequency to the center frequency.
• Mkr → RLV Sets the marker level to the reference level.
• Peak → CF Sets the frequency of the maximum point on the screen to the center frequency.
• Peak → RLV Sets the level of the maximum level point on the screen to the reference level.
• Scroll→, Scroll← Scroll the observation frequency.
SECTION 3 MARKER FUNCTIONS describes the Mkr → CF and Mkr → RLV functions. SECTION 2
FREQUENCY/AMPLITUDE DATA ENTRY describes the scroll function.
This section describes the Peak → CF and Peak → RLV functions.
SECTION 4 SIGNAL SEARCH FUNCTION
CF
Peak
RLV
Preset
Remote
Local
Copy Cont
Copy
Stby
Spectrum Analyzer
MS2661B
9kHz–3GHz
On
Memory Card
Menu On/Off
F 1
F 2
F 3
F 4
F 5
F 6
More
TG Output 50Ω
9kHz–3GHz
A/B,A/BG
RVS PWR
+20dBm
0V DC Max
Multi Mkr
Frequency
Marker
Marker
Peak
Span
Search
Amplitude
User
Peak
Continuous
CF RLV
Measure
Display
A/Time
Coupled Finction
Single
TV Monitor
Trig/Gate
Time
Save
Recall
A,B
RBW VBW Sweep Time Atten
TG
EntryMarkerFreq/Ampl
PTA
8 9 GHz7
EMC
5 6 MHz4
Sound System Title
2 3 kHz1
Cal
0
.
.
+30dBm(PRE AMP On)
HoldDefine
EnterInterface Mem Card
– / +
RF Input 50Ω
+30dBm
±50V DC Max
Shift
CE
BS
dBm
dB
V
sec
mV
msec
µV
Hz
µsec
4-5
Page 70

SECTION 4 SIGNAL SEARCH FUNCTION
Peak → CF and Peak → RLV
The Peak → CF and Peak → RLV functions set the maximum level value displayed on the screen to the center
frequency and reference level, respectively, and move the peak point to the center of the frequency axis on the
screen and to the top level axis, respectively.
(1) Peak→ CF
CF
Notes: • When the frequency at the maximum peak point is less than 0 Hz, the center frequency is set to 0
(2) Peak → RLV
Sets the maximum peak point and the zone marker to the center frequency.
Hz.
• If there are two or more maximum peak points with the same level on the screen, the peak point
with the lowest frequency is moved to the center frequency.
• Peak → CF does not operate in the following cases:
1
When zone sweep is On
2
In the time domain mode
3
When A<Time is specified in the A/Time mode
4-6
RLV
Note: • If the level at the peak point exceeds the permitted range for the reference level, the reference
.
Sets the maximum peak level to the reference level.
level is set to the maximum (minimum) reference level that can be set.
• If the level at the peak point exceeds the reference level (scale over), one operation of the
Peak→RLV may not be able to set the correct reference level. In this case, repeat the Peak→RLV
operations a few times.
Page 71

SECTION 5 SELECTING THE DISPLAY METHOD
SECTION 5
SELECTING THE DISPLAY METHOD
This sections gives a detailed description of the display modes (Trace A/B, A/B, A/BG, Trace Time, A/Time), storage modes
(Normal, Max Hold, Min Hold, Average, View, Cumulative, Overwrite), detection modes (Normal, Pos Peak, Sample, Neg
Peak) and time domain analysis.
TABLE OF CONTENTS
Display Mode
Trace A
Trace B
Moving the Trace
Trace Computation
Trace A and Trace B Overwrite Display
Setting Active Trace
Trace A/Trace B Top and Bottom Split Display
Setting Sub-trace Sweep
Trace A/Trace BG Top and Bottom Split Display
Trace Time
Trace A/Trace Time Top and Bottom Split Display
Storage Mode
Setting Storage Mode
Averaging Function
Max hold, Min hold Function
Detection Mode
Selecting Detection Mode
Selecting Measured Level by Detection Mode
......................................................................................................................................
.......................................................................................................................................
.......................................................................................................................................
........................................................................................................................
.....................................................................................................................
....................................................................................................................
............................................................................................................
..................................................................................................................................
......................................................................................................................................
.................................................................................................................
.....................................................................................................................
.......................................................................................................
...................................................................................................................................
...........................................................................................................
......................................................................................
..........................................................................
........................................................................
.....................................................................
............................................................................
5-3
5-5
5-6
5-6
5-7
5-8
5-8
5-9
5-10
5-11
5-12
5-14
5-15
5-17
5-18
5-21
5-22
5-23
5-24
Time Domain
Setting Time Domain
Setting Time Span
Time Domain Expanded Display
Monitoring FM Demodulated Waveforms
.......................................................................................................................................
..................................................................................................................
......................................................................................................................
.................................................................................................
...................................................................................
5-26
5-26
5-27
5-28
5-30
5-1
Page 72

SECTION 5 SELECTING THE DISPLAY METHOD
5-2
Page 73

SECTION 5 SELECTING THE DISPLAY METHOD
SECTION 5
SELECTING THE DISPLAY METHOD
The spectrum analyzer can display four trace modes (BG †, A, B, Time) in six Display modes (A, B, Time, A/
B, A/BG, A/Time).
In the Display mode, the two keys of the Display section shown below are used.
Preset
Remote
Local
Copy Cont
Copy
Stby
Display Mode
The following outlines the trace modes. The figure on the next pages shows the correlation between trace
modes.
Spectrum Analyzer
MS2661B
9kHz–3GHz
On
Memory Card
Menu On/Off
More
TG Output 50Ω
9kHz–3GHz
F 1
F 2
F 3
F 4
F 5
F 6
Frequency
Span
Amplitude
Peak
CF RLV
Save
Recall
Measure
Display
A/B,A/BG
A/Time
A,B
Time
Coupled Finction
RBW VBW Sweep Time Atten
RVS PWR
+20dBm
0V DC Max
Multi Mkr
Marker
Marker
Peak
Search
User
Continuous
Single
TV Monitor
Trig/Gate
TG
PTA
8 9 GHz7
EMC
5 6 MHz4
Sound System Title
2 3 kHz1
Cal
0
.
.
EntryMarkerFreq/Ampl
CE
BS
HoldDefine
EnterInterface Mem Card
– / +
Hz
RF Input 50Ω
+30dBm
±50V DC Max
+30dBm(PRE AMP On)
Shift
dBm
dB
V
sec
mV
msec
µV
µsec
Display
A/B,A/BG A/Time
A,B Time
• Trace BG .................. When the objective signal is measured in the trace A, B, or Time mode, the trace
BG mode allows the frequency range to be observed to be pre-set to a wide band.
The BG band is initially set to full span (0 to 3 GHz or 8.1 GHz).
• Trace A, trace B ........ Used to analyze signals in the normal frequency domain. The BG zone within
trace BG is expanded and displayed.
Different frequency range can be observed by Trace A and Trace B.
• Trace Time ............... Displays the time axis waveform at the center frequency of trace A. Trace Time
can also display FM and EXT TRIG input signals, when monitored.
† BG (Back Ground)
5-3
Page 74

SECTION 5 SELECTING THE DISPLAY METHOD
5-4
Page 75

Trace A
SECTION 5 SELECTING THE DISPLAY METHOD
Trace A is used to analyze signals in the normal frequency domain.
A,B
Trace A
5-5
Page 76

SECTION 5 SELECTING THE DISPLAY METHOD
Trace B
Like trace A, trace B is used to analyze signals in the normal frequency domain.
When used with trace A, it is possible to compare waveform A and waveform B.
A,B
Parameters of the trace A and trace B can be set independently.
Moving the Trace
Trace B
5-6
This function moves and adds the trace A and trace B displays once.
A, B
Trace Move *
A→B
B→A
A B
←→
A+B→A
Return
Moves trace A to trace B and displays it.
Moves trace B to trace A and displays it.
Swaps and displays trace A and trace B.
Adds trace A and trace B and displays the result at trace A.
Set the move-destination-trace storage mode to View, and stop the sweeping before moving the trace.
If the trace A or trace B threshold is set to any other mode, the trace data will be displayed once, then updated.
Page 77

Trace Computation
This function continuously displays the difference between trace A and trace B. Normally set trace B to the
View mode before executing this function.
SECTION 5 SELECTING THE DISPLAY METHOD
A, B
Trace Calc *
Normalize
(A–B+DL)
On Off
A–B→A
On Off
Ref Line
Return
Turn the mode that subtracts trace B from trace A and adds the
display line value and continuously displays it at trace A On and
Off by pressing this key.
Turn the mode that subtracts trace B from trace A and
continuously displays it at trace A On and Off by pressing this key.
Selects if the A–B computed value=0 line is to be displayed at the
top, middle, or bottom of the screen.
Top
Middle
Bottom
5-7
Page 78

SECTION 5 SELECTING THE DISPLAY METHOD
Trace A and Trace B Overwrite Display
Overwrites trace A and trace B on one screen. At this time, the trace B frequency range, reference level, and
other parameters are the same as trace A.
However, in the threshold mode and detection mode, the parameters can be set independently at trace A and
trace B. For instance, comparison measurement with a standard waveform and simultaneous
observation of the same waveform in a mode different from the normal mode and max hold (or averaging, etc.)
mode are possible.
A,B
Trace B
(max hold)
Trace A
(normal)
Setting Active Trace
Trace A on B
(Display page 2 of the menu by pressing the More key.)
5-8
When trace A and trace B were overwritten on the same screen, select the marker trace by pressing this key.
A, B
Active Trace A B
(Display page 2 of the menu by pressing the More key.)
Page 79

Trace A/Trace B Top and Bottom Split Display
When trace A and trace B are overwritten and displayed, the setup parameters are common. In this mode,
however, the frequency, reference level, and other parameters can be set independently.
For instance, the reference wave can be observed at trace A and harmonics can be simultaneously observed at
trace B.
When examining interference, the frequency that is the source of the interference and interference of a different
frequency that is generated by the effect of the source frequency can be simultaneously observed.
A/B, A/BG
Shift
A, B
SECTION 5 SELECTING THE DISPLAY METHOD
• The large display is called the main trace and the small display is called the sub-trace.
Trace A and trace B are displayed
at the top and bottom, respectively.
A/B (A<B)
A/B (A>B)
A/BG (A<BG)
A/BG (A>BG)
Swp Contl
Simultaneously display trace A and trace B at the top and
bottom. Display trace B larger than trace A.
Simultaneously display trace A and trace B at the top and
bottom. Display trace A larger than trace B.
Sub-trace
For A/B (A<B)
Main trace
5-9
Page 80

SECTION 5 SELECTING THE DISPLAY METHOD
Setting Sub-trace Sweep
To set the sub-trace storage mode, perform the following key operations.
A/B, A/BG
Shift
A, B
Swp Contrl *
Sub Trace Write
Sub Trace View
Stop
Continue
Restart
Return
Set the sub-trace to the Over Write mode.
Set the sub-trace waveform to the View mode (continuously
displayed without overwriting).
Temporarily stop sweeping without switching the storage
mode.
Release temporary stop and resume execution.
Erase the trace waveform and restart sweeping.
5-10
Page 81

Trace A/Trace BG Top and Bottom Split Display
This mode simultaneously displays trace A and trace BG. It is used to extract a specific signal from a wide
frequency range.
The conditions over a wide surrounding frequency range can be monitored while simultaneously observing the
selected signal in detail.
A/B, A/BG
Shift
A, B
A/B (A<B)
A/B (A>B)
A/BG (A<BG)
Simultaneously display trace A and trace BG at the top and
bottom. Display trace BG larger than trace A.
SECTION 5 SELECTING THE DISPLAY METHOD
A/BG (A>BG)
Swp Contl *
Simultaneously display trace A and trace B at the top and
bottom. Display trace A larger than trace BG.
Trace A and trace BG parameters other than reference level, vertical axis scale, and input attenuator settings
are used independently. Each parameter can be set in the main trace (larger displayed side).
Marker operation is available only for the main trace.
5-11
Page 82

SECTION 5 SELECTING THE DISPLAY METHOD
Trace Time
Trace Time displays the time axis waveform at the center frequency of trace A or trace B. To display trace
Time, press the
Time
key.
Time
Delay Time
10.0 ms
Time Span
200 us
Trigger
Freerun
Triggered
Trigger
Source *
Storage *
Detection *
1
FM Monitor *
Expand *
2
(Display page 2 of the menu by pressing the More key.)
Sets the delay time from trigger to sweep. When a negative
value is input, the waveform before the trigger is displayed up to
one screen. (See paragraph 6.12 of CHAPTER 6.)
Sets the time span (time domain sweep time).
Select freerun or trigger sweep by pressing this key.
Selects the trigger signal source.
Selects the storage display mode.
Selects the detection mode.
Displays the FM demodulated waveform.
Expands and displays part of the time domain waveform.
5-12
Page 83

SECTION 5 SELECTING THE DISPLAY METHOD
Trace-A center frequency and Trace-Time tuning frequency is always common. Other parameters can be set
independently. However, the following parameters can be used commonly by "Coupled function common/
independent setting mode" of Section 9.
• Resolution bandwidth (RBW)
• Video bandwidth (VBW)
• Sweep time (Sweep Time/Time Span)
5-13
Page 84

SECTION 5 SELECTING THE DISPLAY METHOD
Trace A/Trace Time Top and Bottom Split Display
Trace A/Trace Time top and bottom split display simultaneously displays trace A and trace Time.
A/Time
Shift
Time
A/Time
(A<Time)
A/Time
(A>Time)
Swp Contl *
Simultaneously display trace A and trace Time at the top and
bottom. Display trace Time larger than trace A.
Simultaneously display trace A and trace Time at the top and
bottom. Display trace A larger than trace Time.
(See Setting Sub-Trace.)
5-14
Each parameter can be set in the main trace (larger displayed trace). However, for common parameters (center
frequency, reference level, input attenuator, and when system setting is coupled mode resolution bandwidth,
video bandwidth, etc.), the sub-trace parameters can also be changed even when setting is performed at the
main trace. Marker operation is only available for the main trace.
Page 85

Storage Mode
The following seven storage modes can be selected for Display modes trace A, trace B, and trace Time.
SECTION 5 SELECTING THE DISPLAY METHOD
Types of Trace Modes (1/2)
NO. Mode
1 Normal
2 Max Hold
3 Min Hold
4 Average
Explanation Display example
Refreshes and displays the trace data at each sweep.
This is used for normal measurement.
At each sweep, compares the new trace data with
the old data at each X axis point, then displays the
larger value data.
It is used to record a frequency-drifting signal.
At each sweep, compares the new trace data with
the old data at each X axis point, then displays the
smaller value data.
At each sweep, calculates the average data at each
X axis point, then displays the averaged results.
This mode is used to improve the S/N ratio.
For further details on the averaging function, see
page 5-18.
5-15
Page 86

SECTION 5 SELECTING THE DISPLAY METHOD
NO. Mode
5 Cumulative
6 Over write
7 View
Explanation Display example
Displays the cumulative waveform at each sweep.
The waveform data, which are not connected by
lines, are displayed by plotting the data.
Displays the waveform overwritten without
deleting the old trace data.
Continues displaying the waveform as it is, without
refreshing the currently-displayed trace data.
This mode is used to observe waveforms with the
trace data stopped temporarily.
5-16
Page 87

Setting Storage Mode
(
)
The storage mode can be selected by operating the function keys shown below while the spectrum analyzer is
operating in the trace A, trace B, or trace Time mode.
A, B
SECTION 5 SELECTING THE DISPLAY METHOD
Time
Storage *
Normal
Max Hold *
Min Hold *
Average *
View
Return
1
Cumulative
Overwrite
Stop
Continue
Select the storage mode.
Select the storage mode.
Temporarily stop the sweeping without switching the mode.
Restart from temporary stop.
Restart
Return
2
Display page 2 of the menu by pressing the More key.
Restart.
5-17
Page 88

SECTION 5 SELECTING THE DISPLAY METHOD
Averaging Function
The digital averaging function calculates the average data at each X axis point at each sweep and displays the
results. It is executed by selecting Average in the trace A, trace B, and trace Time display modes.
A, B
Time
Storage *
Averaging
Count
256
Avg Mode
Stop
Non-Stop
Stop
Continue
Restart
Return
Average *
Set the averaging rate.
Set averaging Stop/Non-Stop after the number of times of
averaging rate by pressing this key.
Temporarily stop average-sweeping.
Resume from stop.
Delete the trace waveform and restart.
5-18
Page 89

SECTION 5 SELECTING THE DISPLAY METHOD
The averaging function improves the S/N ratio depending on the averaging rate and the number of sweep
repetitions as shown on the next page.
Digital video averaging is performed by the method shown below.
Averaging Rate = N
3 Restart
1 Stop
2 Continue
Number of
sweep repetitions
Measurement value
1
2
3
N–1
N
N + 1
N + 2
M ( 1 )
M ( 2 )
M ( 3 )
M ( N–1 )
M ( N )
M ( N +
1 )
M ( N + 2 )
Displayed value
Y ( 1 ) = M ( 1 )
Y ( 2 ) = Y ( 1 ) +
Y ( 3 ) = Y ( 2 ) +
M ( 2 )–Y ( 1 )
2
M ( 3 )–Y ( 2 )
3
Y ( N–1 ) = Y ( N–2 ) +
Y ( N ) = Y ( N–1 ) +
Y ( N + 1 ) = Y ( N ) +
M ( N )–Y ( N–1 )
N
M ( N + 1 )–Y ( N )
N
Y ( N + 2 ) = Y ( N + 1 ) +
M ( N–1 )–Y ( N–2 )
N–1
M ( N + 2 )–Y ( N + 1 )
N
1
Sweep stops after N repetitions. (When Avg Mode is Stop)
2
The above stop condition is released by restarting sweep by Continue. The averaging operation resumes,
while counting the number of sweep repetitions as N+1, N+2....
3
When Restart is performed during sweep or Stop, averaging is repeated from sweep count 1.
5-19
Page 90

SECTION 5 SELECTING THE DISPLAY METHOD
5-20
S/N Improvement by Digital Video Averaging
Averaging by video filter has the disadvantage that the sweep time becomes longer when the video bandwidth
is narrowed to improve the averaging effect.
On the other hand, digital video averaging smoothes the trace display by averaging the digital data after A/D
conversion at each sweep, without narrowing the video bandwidth (VBW). Since the video bandwidth (VBW)
gets comparatively wider and the time required for each sweep can be shortened, the entire spectrum image can
be verified quickly and the repetitive sweep can be stopped when the required smoothing has been obtained.
The problem of averaging with the video filter is that the time required for each sweep becomes longer and it
takes a long time to verify the entire spectrum image.
Since the averaging rate is initially eight, the above figure shows that an S/N improvement of 9 dB is obtained
with eight sweeps.
Page 91

Max Hold and Min Hold Functions
When Max Hold or Min Hold is selected, the sweeping can be performed by the number of specified repetitions,
and then stops.
A, B
SECTION 5 SELECTING THE DISPLAY METHOD
Time
Storage *
Sweep
Count
***
Endless
Sweep
Stop
Continue
Restart
Return
Max Hold *
Min Hold *
Set the number of sweeping repetitions.
After the set number of sweepings, the sweeping stops.
Continue sweeping, endlessly.
Stop sweeping, temporarily.
Resume sweeping from stop.
Delete the trace waveform and restart.
5-21
Page 92

SECTION 5 SELECTING THE DISPLAY METHOD
Detection Mode
The detection mode can be selected from among Normal, Pos Peak, Sample, and Neg Peak for trace A and
trace B.
Normal
Pos Peak
Sample
Neg Peak
Traces the maximum value and minimum value between sample points.
Traces the maximum value between sample points.
Traces the instantaneous value between sample points.
Traces the minimum value between sample points.
However, trace BG is fixed at Pos Peak.
When the time span is under 20 ms at trace Time, only Sample is available.
5-22
Page 93

Selecting Detection Mode
Select the detection mode for trace A, trace B, or trace Time by performing the following key operations.
A/B
SECTION 5 SELECTING THE DISPLAY METHOD
Time
Detection *
Normal
Pos peak
Sample
Neg Peak
Return
Select the detection mode.
Waveforms when trace A is in the Pos Peak mode and trace B is in the NegPeak mode
5-23
Page 94

SECTION 5 SELECTING THE DISPLAY METHOD
Selecting Measured Level by Detection Mode
The spectrum analyzer has 501 horizontal-axis measurement sample points. This corresponds to 501 storage
trace memories.
The detection mode determines what type of measured value should be stored in the trace memory at each
measurement sample point.
Detection mode Description
Normal
Pos Peak
Sample
Neg Peak
Stores both the maximum level and the minimum level present
between the current sample point and the next sample point and
displays them on the screen.
This mode is used in normal measurement.
Holds the maximum level present between the current sample point
and the next sample point, then stores the maximum value in the
trace memory corresponding to the current sample point.
Pos Peak is used to measure the peak value of signals near the
noise level.
Stores the instantaneous signal level at each sample point to
the trace memory. Sample is used for noise level measurement,
time domain measurement, and other measurements.
Holds the minimum level present between the current sample point
and the next sample point, then stores the minimum value to the
trace memory corresponding to the current sample point.
The Neg Peak mode is used to measure the lower envelope side
of a modulated waveform.
5-24
Page 95

SECTION 5 SELECTING THE DISPLAY METHOD
Note: When the detection mode is set to Sample or Neg Peak while the frequency span and resolution
bandwidth are set so that the spectrum is displayed as discrete vertical lines, the spectrum peak is
incorrectly displayed.
Sample point
Normal traces and displays both Pos Peak and Neg Peak.
Normal
Screen desplay
5-25
Page 96

SECTION 5 SELECTING THE DISPLAY METHOD
Time Domain
Since the spectrum analyzer stops sweeping the frequency when set to a frequency span of 0 Hz, the spectrum
analyzer becomes a selective level meter that continues to receive only the center frequency. In this case, the
horizontal axis of the time-axis sweep waveform is graduated in time and displayed on the spectrum analyzer
screen. This display method is called "time domain display".
The spectrum analyzer time domain display has an Expand function for expanding the waveform time axis to
create a more convenient display. It also has a special function for monitoring an FM demodulated waveform.
Setting Time Domain
The time domain can normally be set by pressing the
Time
key in the Display section. It can also be set by
setting the frequency span to 0 Hz in the frequency domain mode.
Frequency
domain
Span
(Trace A)
(Trace B)
Time
0
Time
domain
Hz
(Trace Time)
Zero Span
5-26
Page 97

The following parameters can be set independently in the frequency domain or time domain mode.
• Vertical scale mode (Log/Lin)
• Vertical scale range (10 dB/div, 10%/div, etc.)
• Storage mode (Normal, Max Hold, Average, etc.)
• Detection mode (Pos Peak, Sample, Neg Peak, Normal)
• Resolution bandwidth (RBW)
• Video bandwidth (VBW)
• Sweep time (Sweep Time/Time Span)
• Trigger switch (Freerun/Triggered)
The three parameters resolution bandwidth, video bandwidth, and sweep time can be selected in common or
independently in the frequency domain or time domain mode when setting the system.
Note: The time domain mode marker function uses a spot marker. A zone marker cannot be used.
Setting Time Span
SECTION 5 SELECTING THE DISPLAY METHOD
In the time domain mode, the measurement range on the horizontal axis does not set the frequency span, but
sets the time span. To set the time span, perform the following key operations.
Time
Time Span
TEN
KEY,
Unit key
key (1/2/5 sequence)
5-27
Page 98

SECTION 5 SELECTING THE DISPLAY METHOD
Time Domain Expanded Display
Part of the time domain time axis can be expanded and displayed.
Time
Expand *
Zone Start
Point
50
Zone Span
Point
50
Expand Zone
On Off
Expand
On Off
Return
Set the expansion zone start point.
Set the expansion zone width.
Select expansion zone marker display On or Off by pressing this
key.
Select expanded display On or Off by pressing this key.
Zone start
Zone span (zone marker)
Tr-time
5-28
Page 99

SECTION 5 SELECTING THE DISPLAY METHOD
Expansion
The Expand mode cannot executed under the following conditions.
• Trigger mode .............................................. Freerun
5-29
Page 100

SECTION 5 SELECTING THE DISPLAY METHOD
Monitoring FM Demodulated Waveforms
The spectrum analyzer contains an FM demodulator (Opt.05 FM demodulation waveform monitor) to display
demodulated waveforms.
Time
FM Monitor *
FM Monitor
On Off
Range
2kHz/Div
Demod
Coupling
AC DC
Return
Turn FM demodulated waveform display On and Off by pressing this
key.
Set the modulation frequency/division.
Select if the FM demodulation waveform is to be displayed by AC
or DC coupling by pressing this key.
5-30
By using the FM demodulated waveform monitor function, frequency deviation can be easily measured.
 Loading...