

Page 1

The Complete Wireless and
Advanced Intelligent Network
Test Solution
Agilent Technologies
Signaling Advisor --- 37907A
Technical Overview
The Agilent Technologies Signaling Advisor is a comprehensive and powerful
test and troubleshooting instrument. It enables the user to find problems in
today’s complex wireless and wire- line telephone networks faster. Businesses
and consumers are increasingly sensitive to even a minor deterioration in
service quality. To maintain customer satisfaction and loyalty, your
technology teams need tools that help identify potential problems and resolve
faults quickly and effectively… They need an Agilent Technologies Signaling
Advisor
The Signaling Advisor provides detailed test and analysis capabilities for
signaling on modern wireless and wire- line telephone networks such as SS7,
Cellular, PCS, GSM and GPRS networks. It provides robust and reliable
measurements and analysis that go beyond decoding and filtering data.
The Signaling Advisor mainframe is a robust dispatched trouble- shooting tool.
Add any appropriate optional decodes and link interface modules, and you
are ready to test across multiple links involving different protocol standards
for example, at access network interfaces. At the core of each Signaling
Advisor, the intuitive graphical user interface makes measuring and
understanding results easier for signaling engineers, enabling them to check
performance and troubleshoot problems in signaling systems quickly and
accurately.
Page 2

Signaling Advisor Key Benefits
A range of link interface modules (LIMs) provide the physical interface to
network equipment. Each LIM connects to one type of physical interface (e.g.,
E1 or T1), providing access to all signaling links on up to four bidirectional
bearers. The mainframe supports two LIMs (eight bidirectional bearers). An
optional undercradle expands capacity to four LIMs (16 bidirectional bearers).
The architecture of the software and mainframe makes it easy for you to
keep up with changing technologies and data rates, minimizing the need to
replace equipment. Simply add a LIM or decode to bring your instrument in
line with new needs. High performance and flexibility are built into the
Signaling Advisor mainframe enabling it to cater for today’s and tomorrow’s
applications. Separate processors (with independent memory) handle data
acquisition and user interface, allowing optimum performance to be achieved.
EmuLite is a software option which allows the Signaling Advisor to be
upgraded to a fully integrated monitor and emulation solution.
EmuLite creates and executes tests faster through use of its graphical
message and sequence editors. This allows engineers more time to diagnose
signaling problems without the need for programming.
Have new equipment and services installed faster and have them operate
correctly the first time.
• Install new services more efficiently
Quickly, easily, and thoroughly test new services before installation by using
the Signaling Advisor’s graphical emulation environment.
• Maximize revenue per subscriber
Optimize networks by monitoring performance and utilization quicker and
easier. Trends in network performance and subscriber behavior can easily be
examined using the Signaling Advisor’s statistical functions.
• Attract and retain customers
For the highest quality of service and reliability, monitor all parts of the
network and rapidly highlight any problems using the Signaling Advisor.
• Maintain a more profitable network
Be sure that the engineering staff is as productive as possible and customers
have as few problems as possible. Find problems and solve them faster with
the Signaling Advisor.
Page 2 of 16
Page 3

Signaling Advisor
Features and Functionality
General Feature summary
• Dedicated software for Cellular, PCS/GSM, GPRS, UMTS, cdma2000 and
SS7 signaling networks
• Windows 98® based operation
• Multitasking applications (protocol analysis, statistics, call trace)
• Real- time or post- capture analysis
• Connect to up to 16 duplex physical bearers (E1 or T1, DS0, V.35, RS- 232,
RS- 449)
• Analyze up to 32 duplex signaling links (8, 16, 32, 48, 56, and 64 kb/s)
• Analyze full duplex Ethernet/Fast Ethernet GSM sub- rate signaling
• (8, 16, 32 Kb/s) and TRAU decode support
• Analyze ATM signaling links, including Iu, Iub and Iur for W- CDMA
• Analyze Frame Relay and ISDN connections for WAN
• UMTS (E1/T1 ATM and STM- 1/OC- 3 ATM)
• Monitor up to 4 full rate GPRS Gb duplex bearers
• Monitor up to 3 full rate high speed SS7 bearers
• Chinese language GUI option
• Voice monitoring
• Link Status view
• Alarm View
• Auto- configuration identifies signaling links and protocol stacks
• Graphical configuration and measurement setup
• Triggers and filters (logging and display)
• On- line and context sensitive help
• Protocol help
Monitoring Features
• Graphical call trace with filters and alarms
• User- configurable columnized traffic overview and columnized color coded,
protocol decodes
• Graphical (or tabular) time- based statistics with thresholds
• Automatic message and sequence validation
• Point code interpretation
• Storage of captured data and configurations to disk
• Stand- alone PC software for post- capture analysis
• Timestamping up to 12 microsecond resolution
• Remote Control
• Compatible with capture file formats of Agilent Advisor and Network
• Analyzer protocol analyzers, acceSS7 monitoring system and Agilent
37900D signaling test set
• Export data to CSV file for further ‘off- site’ analysis
EmuLite Features
• Automatic test creation - copy messages and their sequence from call
trace
• Graphical editor - quickly create messages - no more programming!
• Intelligent protocol field- based editor - correctly build complex signaling
messages - not just in hex!
• Intelligent built in test manager - easily manage the execution of tests
• Graphical analysis tools - instantly identify failed tests and why they
failed
• Easily verified network element responses
• Test all non- IP based GPRS interfaces
• Test SS7, GSM, GPRS, IS- 41, CDMA, ISDN plus many more
Page 3 of 16
Page 4
SS7 Monitoring
The Signaling Advisor makes it easy for you to start monitoring, even if you
don’t know what timeslots or protocols are being used for signaling. The auto
configure tool configures the instrument’s receiver to match the bearer and
then searches the bearer for signaling links (timeslots that are carrying
signaling information). The correct protocol stack will be built based on
signaling messages.
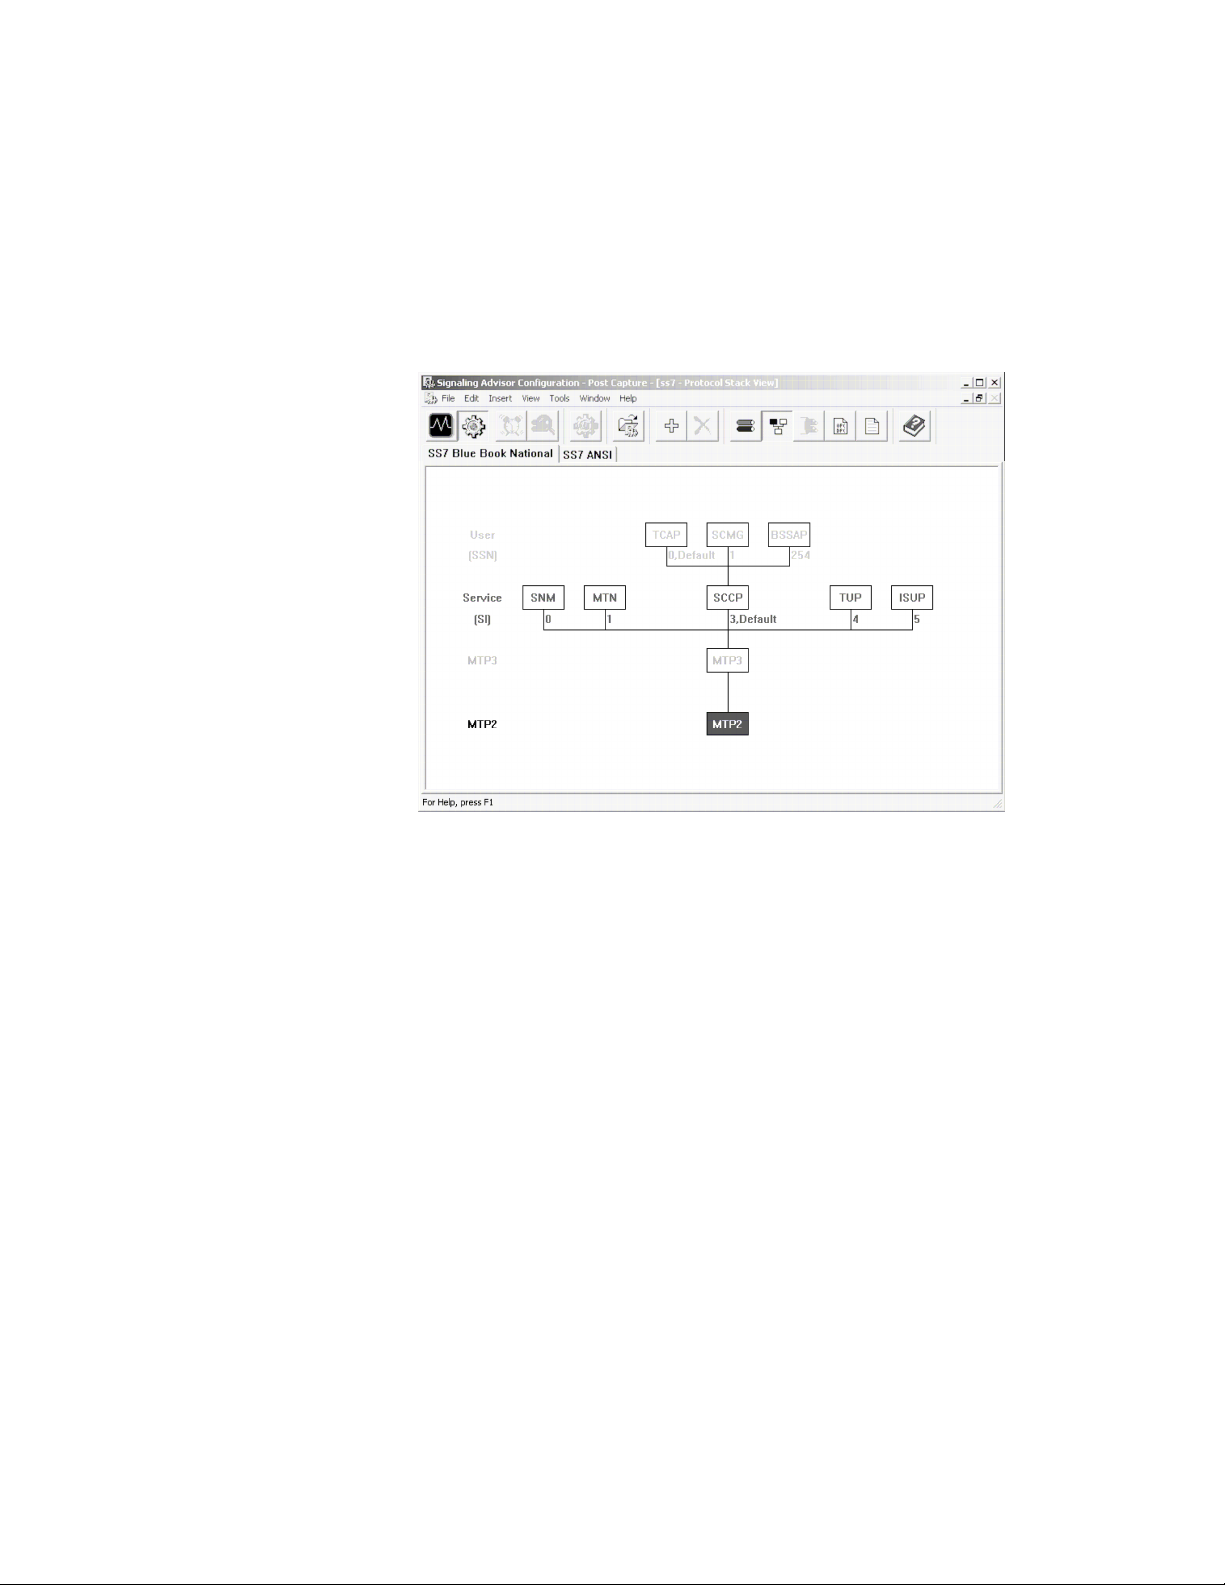
If the default protocol stacks do not match the signaling being tested, or a
special variant is required, you can quickly change the assigned protocol
stack graphically. Figure 1 shows a typical protocol stack.
Figure 1: Protocol Stack configuration
Real-time Analysis
The SS7 Signaling Advisor monitors up to 16 bidirectional bearers and up to
32 duplex signaling links simultaneously (spread across one or more bearers).
Each signaling link can carry a different protocol. Monitored data is
processed then automatically stored to hard disk.
Post-capture Analysis
All of the capabilities available for real- time analysis are also available for
use on previously logged data. The user may perform the same operations as
in real time.
Applications
In addition to the default protocol analysis application, it is possible to setup
multiple applications for statistical analysis or call traces.
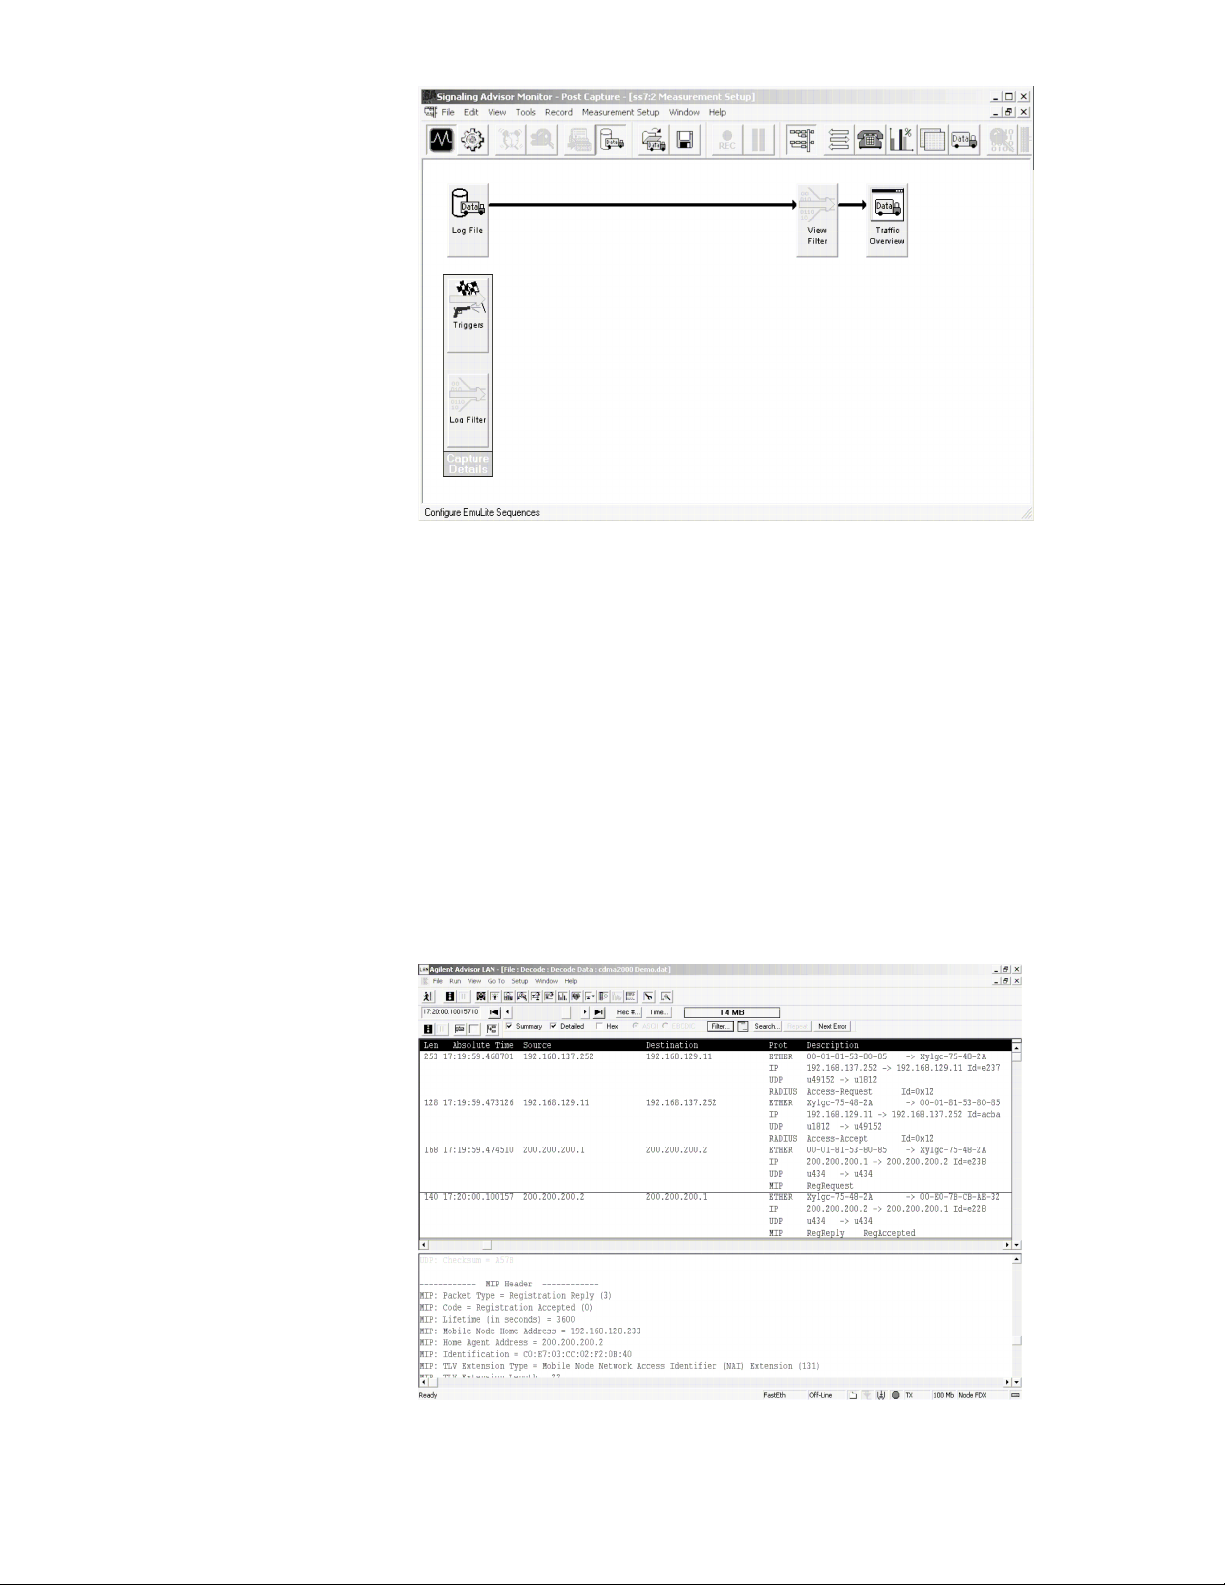
Figure 2 shows a typical real- time measurement setup.
A wide variety of measurement triggers and filters can be set based on
almost any interesting variable or event.
Page 4 of 16
Page 5
Ethernet Monitoring
GPRS and cdma2000
Figure 2: Measurement setup display.
The Fast Ethernet interface and software provides real- time and post
capture analysis of Ethernet protocols. Use the powerful Agilent
Advisor 10/100 LAN software to analyze your IP links with the
Signaling Advisor. The software also offers eight built- in analysis
tools:
1. Expert analyzer
2. Node statistics
3. Node and connection statistics
4. Protocol stack statistics
This software can also set filters on a wide variety of variables,
protocols or events. Automatic Ethernet link negotiation for physical
interface line rate and a range of stimulus and response tests are
important and powerful features of the 10/100 Ethernet software.
The software also supports cdma2000 protocols over 10/100 Ethernet.
5. Protocol commentators
6. Node discovery
7. Protocol vitals
8. Decodes
Figure 3: cdma2000 decode.
Page 5 of 16
Page 6

ATM Monitoring
The ATM interfaces and software provides real time and post capture
analysis ATM and encapsulated LAN protocols, including high speed SS7 and
W- CDMA UMTS as well as cdma2000. Monitor and troubleshoot all aspects of
the UMTS Radio Access Network (Iu, Iub and Iur interfaces). Use the
powerful Agilent Advisor ATM software
with the Signaling Advisor to analyze your ATM links. Agilent Advisor has
the most comprehensive and extensive layer 1 and 2 test capabilities for ATM
available today. The software also offers (14) built in analysis tools:
1. Line Vital Statistics
2.Filters/Counters Statistics
3. Optical Power and Pulse Amplitude Meter
4. Line Status View with Statistics
5. VP.VC Autodiscovery and Statistics
6. Traffic Generation
7. Quality of Service Application
8. Policing and Traffic Contract Measurements
9. UNI 3.0, 3.1 and 4.0 Signaling and Call Placement
10. Real time IP over ATM filtering
11. Expert Analysis of LAN traffic within ATM Cells
12. LAN over ATM Commentators
13. Health Monitor
14. Decodes
The ATM software has powerful post processing capabilities.
Post processing display filters let you quickly zoom in on selected criteria.
You’ll spend less time searching through frames and more time focusing on
problems. See related literature for more information.
Figure 4: 3G UMTS decodes.
Page 6 of 16
Page 7

Monitor Tool
Viewing Messages
The main traffic overview display shows (chronologically) every message
captured for each signaling link. This overview display shows one line of
essential information for each message. The type and format of information is
displayed in columns and is controlled by the user. Each message can be
decoded further to show a one line description per octet/field. Figure 4
shows a typical traffic overview.
Time Stamping
Each captured message is given a timestamp. The timestamp reference is the
instrument’s internal clock.
Alarm View
If a physical layer alarm occurs (e.g., AIS), a pop- up alarm view window
appears showing software LEDs for all bearers. This view can be expanded to
show individual alarm conditions.
Link Status and Message Validation
Link status view and link loading information is available for each link under
test. The software can highlight message- encoding errors found in received
messages. In the traffic overview display, a message with an error is
highlighted in red. The ‘‘message sequence validation’’ function advises the
user of errors in message sequences (e.g., messages which do not fit into a
normal call pattern). The erroneous messages are highlighted in red.
Data Import
It is possible to import data from the Agilent acceSS7 monitoring system or
from the Agilent 37900D signaling test set or from a text file into the
Signaling Advisor.
Figure 5: Traffic overview display.
Page 7 of 16
Page 8
Call Trace Tool
Call Trace Overview
The graphical call trace application traces calls (or message sequences) across
all links and groups the messages together. It is
therefore a very powerful facility for troubleshooting, particularly since it
operates in both real- time and post- capture modes.
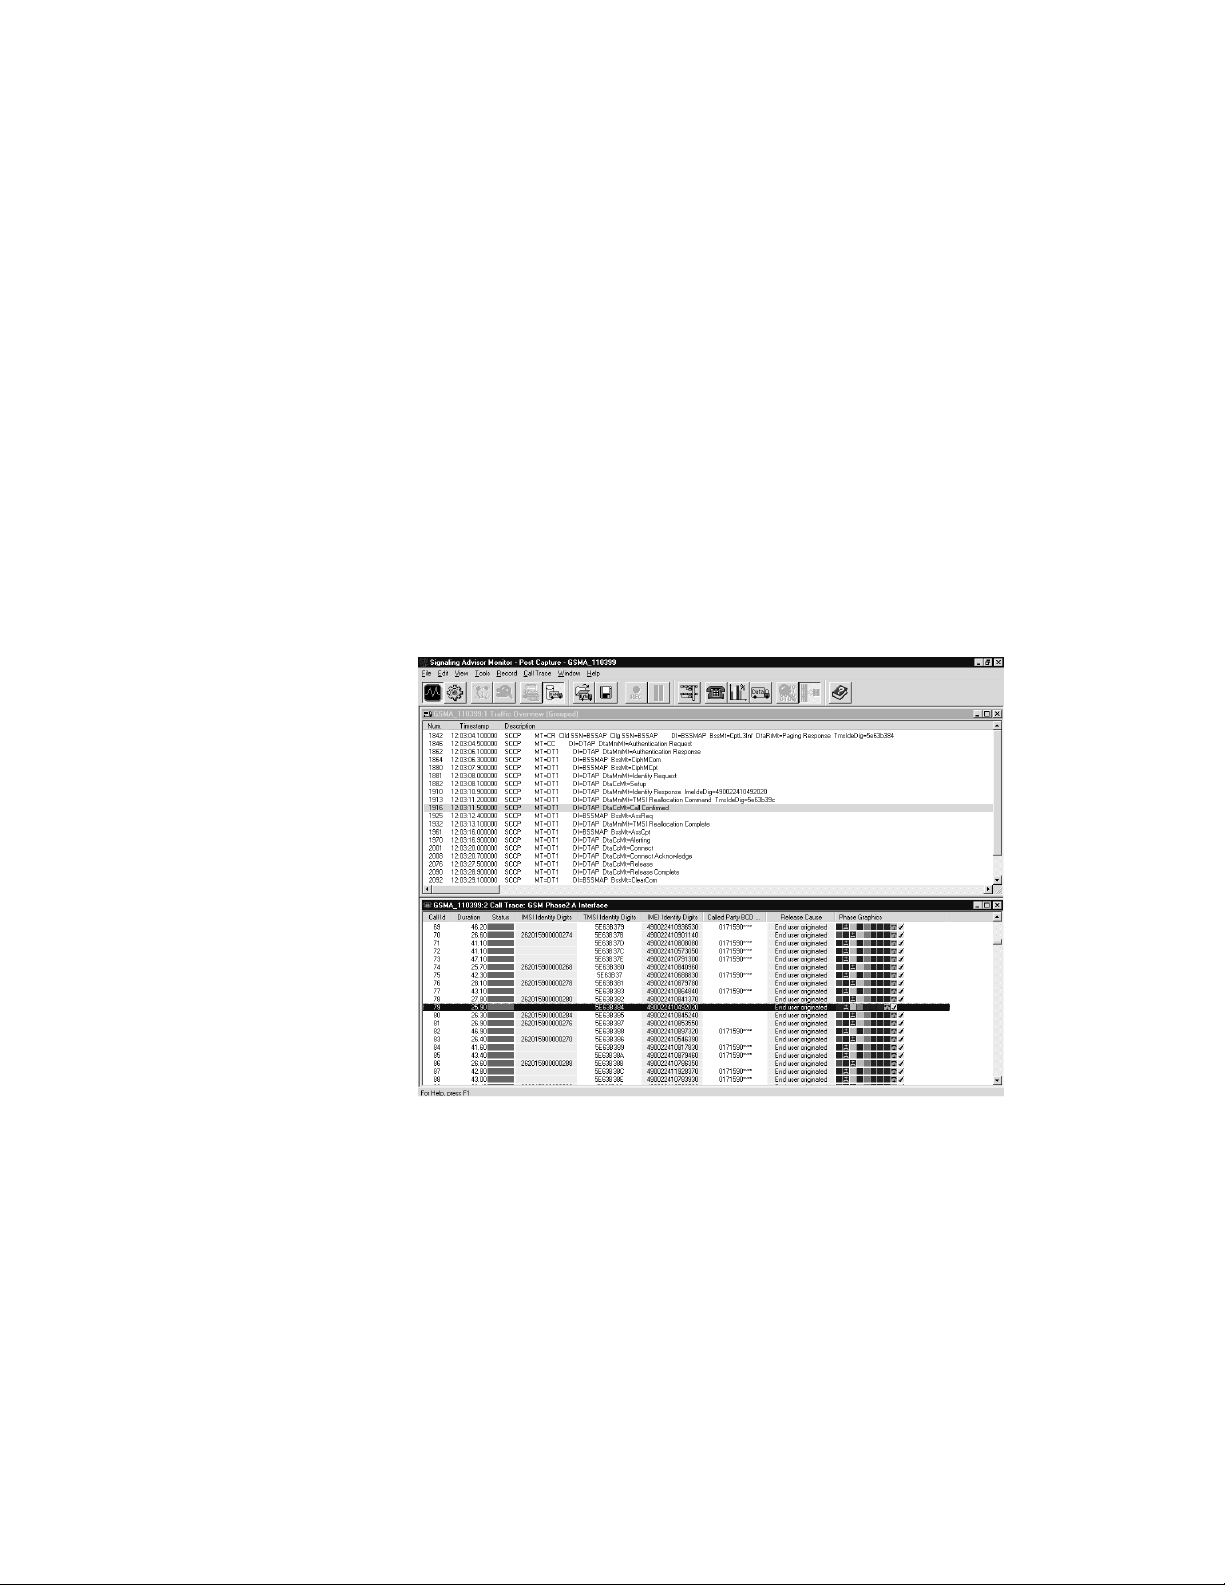
The application produces a user- configurable window which contains one line
for each call. For example in the case of ISUP, this window would typically
show:
• Call identifier
• Call status
• Call duration
• Call setup time
• Call cleardown time
• Called party number
• Calling party number
• OPC/DPC/CIC
• Release cause
• Graphical representation of call phases
Call Trace Tool
Figure 6: Call trace display.
Page 8 of 16
Page 9

Statistics Tool
Graphical Statistics
User-definable graphical statistics are available in real-time or postcapture modes. There are
several SS7 message transfer part (MTP) statistics, as well as user part specific statistics (e.g.,
message types or release causes). Statistics are typically counts or ratios. The statistics may be
displayed graphically as:
• 2D Bar charts
• Radar diagram
Figure 7: Shows a typical statistics graph.
Tabular Statistics
Tabular statistics are drawn by call traces. This provides a more detailed and
dynamic view of network performance, incorporating several programmed
measures (handovers, errors, call success rates etc).
Time-based Statistics
It is possible to produce the graphical statistics as a tabular time series,
where the intervals can be set from one minute to 24 hours.
Statistics Thresholds
The user can set lower and upper thresholds which, when exceeded, will
result in color changes to the statistical graphs to highlight ‘‘alarm’’
conditions.
Page 9 of 16
Page 10

Call-based Statistics
The most advanced statistics features involve using the call trace application
to evaluate call based statistics such as call completion ratio, min/mean/max
call setup times, and min/mean/max call durations.
Data Export
Statistics can be exported to a CSV (Comma Separated Value) file for further
analysis in another application (e.g., spreadsheet or database).
Figure 8: Graphical statistics display.
Page 10 of 16
Page 11

EmuLite
Emulation is the ability to define and send signaling messages in a predefined
sequence to a unit under test and respond to received messages.
Traditional emulation tools require complex programs to be written to perform
even the simplest of tasks. Writing programs using a programing language is
time consuming, error prone and distracts engineers from solving signaling
problems rather then solving programming problems.
EmuLite revolutionizes the way in which emulation is performed through use of
its key capabilities which are summarized in this section.
Graphical Message Editor
The EmuLite intelligent field based message editor allows message creation and
modification using familiar protocol field names. When creating a message, users
are shown the valid selections from which they can choose, significantly
reducing the possibility of error. Message fields can be saved into variables.
EmuLite automatically updates all lengths, pointers and odd or even indicators.
Figure 9: Message editor.
Page 11 of 16
Page 12

Graphical Sequence Editor
Tests are configured using ‘drag and drop’ icons such as arrows, branches and
timers. These automatically generate test scripts -- a time- consuming and
complicated task if programmed manually. More time can therefore be spent
diagnosing signaling problems without the need for programming.
Call Simulation
Users can generate test sequences automatically from previously captured data
as opposed to entering all the data manually. A sequence of related messages
captured using the call trace function can be copied directly to the EmuLite
sequence editor. This sequence and the messages within it can then be modified,
if required, to create a test ready for execution.
Conformance and Compatibility Tests
NIIF (formerly NOF) tests and high- speed SS7 sequences are included -- ready
to run.
Test Manager
The test manager allows single or multiple tests to be selected and run
sequentially. Results are stored in the test log and can be optionally logged to a
.CSV file during execution. The EmuLite status view shows the progress of each
test by displaying the messages and a PASS or FAIL indicator.
Graphical Test Analysis
EmuLite’s status view identifies all tests which have failed. Advanced decode
analysis tools allow messages to be examined in detail providing quick fault
identification.
Fully Integrated with Monitor
EmuLite is fully integrated with the Signaling Advisor’s monitor software. All
analysis tools such as call trace, statistics and decodes are available for use. The
flexibility of this software also allows existing monitor- only customers to
upgrade easily to EmuLite.
Figure 10: Test analysis display.
Page 12 of 16
Page 13

You Don't Need To Be A
Signaling Expert to Operate
the Signaling Advisor
Today, more developers and field engineers than ever are faced with the
challenge of effectively analyze signaling networks. For Signaling Advisor, ease of
use was one of the primary design goals. A graphical and self- explanatory user
interface allows the user to easily execute tests and identify problems quickly.
Find Problem Calls Faster
Signaling Advisor has graphical call trace, statistics and comprehensive filters to
allow rapid message isolation and decoding.
So, when you need to find one specific problem call amongst thousands you can
do it in only four mouse clicks. This means that you can resolve your customers’
problems fast.
Roll Out New Services Faster and Increase Revenue
Signaling Advisor has a unique ‘‘no- programming- needed’’ graphical emulation
environment -- EmuLite. You can even copy messages and calls from monitoring
sessions directly into EmuLite with just three mouse clicks.
When evaluating the operation of new network elements and services, you need
to develop test sequences very easily and quickly.
With EmuLite you can do just that -- no programming required. You can
complete more tests in less time.
Improve Productivity as Networks Become More Complex
Signaling Advisor features extreme ease- of- use. Automatic configuration, unique
Graphical Call Trace, GPRS session trace and intuitive statistics functions mean
that you don’t need to spend time reading the instruction book.
Even a nonexpert in signaling can easily interpret network behavior using
graphical cues. And experts can achieve even more every time they start testing.
Page 13 of 16
Page 14

Specifications for Mainframe
and Interfaces
37907A Signaling Advisor Mainframe
Number of LIM slots available: 2
Processing capacity: Up to 32 duplex signaling links (64 kb/s at 1 erlang)
Telephone handset connector: RJ11
Physical dimensions:
L × W × H (mm): 310 × 310 × 100
Weight: 7 kg
Volume: 10 liters
Power: 100-120Vac±10%, 220-240Vac±10%, 50-60Hz, 110VA max.
Operating Conditions
Temperature:
Operating: +5 ºC to +40 ºC (+41 ºF to +104 ºF)
Non-operating: ---25 ºC to +60 ºC (---13 ºF to +140 ºF)
Humidity:
Operating: 20% to 80% relative humidity
Non-condensing to 40 ºC. Storage: 10% to 90% relative humidity to 60 ºC
Altitude:
Operation: 4,575 meters (15,000 feet); Storage 15,250 meters
(50,000 feet).
Safety conditions
This instrument is designed for indoor use. Safety class I
Page 14 of 16
Page 15

Related Literature
Agilent Signaling Advisor Configuration Guide 5988- 4929EN
Agilent Signaling Advisor Technical Specification 5988- 4930EN
Improving QoS in GSM
Networks
Isolating LNP Problems Product Note 5988- 2180EN
Testing GPRS Signaling Product Note 5988- 0304EN
Monitoring High Speed
SS7 Links
Creating Tests with Emulite Product Note 5988- 0944EN
ATM Product Overview 5968- 1437E
Agilent Advisor --
3G UMTS W- CDMA
Test Software J5458A
Creating Tests with Emulite Product Note 5988- 0944EN
Agilent Signaling Product Note 5988- 3055EN
Application Note
Product Note
Product Overview
Microsoft
Windows
Pentium
®
is a U.S. registered trademark of Microsoft Corp.
®
is a U.S. registered trademark of Microsoft Corp.
®
is a U.S. registered trademark of Intel Corp.
5988- 0305EN
5988- 1887EN
5988- 1164EN
Page 15 of 16
Page 16

www.agilent.com
Agilent Ordering Information
37907A Signaling Advisor mainframe
Undercradles
E7577A Link Expansion Undercradle
E7578A Fast Ethernet Undercradle
J2900A
J2912B Agilent Advisor OC-3/STM-1 plug-in module
J2294D E1/T1 DB-9/RJ-45 interface module
J2296D E1 BNC 75 ohm interface module
J2298D E1/T1 RJ-45/RJ-48C/mini-bantam interface
J2905B ISDN S/T/U Interface module
Line Interface Modules (LIMs)
E7573A T1 Link Interface Module
E7574A V.35 Link Interface Module
E7575A DS0/DS0A Link Interface Module
Software
37908A Signaling Advisor Base Software
Vendor Variants
37908A-051 Nokia A-bis protocol support
37908A-052 Ericsson A-bis protocol support
37908A-053 Alcatel A-bis protocol support
37908A-054 Nortel A-bis protocol support
37908A-055 Motorola A-bis protocol support
37908A-058 Ericsson INAP protocol support
37908A-059 Nortel INAP protocol support
37908A-060 Ericsson MAP/CS1+ Protcocol Support
Additional Capability
37908A-011 Access Network protocol support
37908A-012 GSM Phase 2 and 2+ protocol support
37908A-013 Cellular/PCS protocol support
37908A-043 GPRS decodes for the Gb interface
37908A-120 Emulite Graphical Emulation capability
Warranty and Support Services
Hardware 3 year
Software 90-day media replacement
Together with Agilent, gain the eXtreme Productivity Improvements that your
business demands!
Agilent Advisor high speed acquisition undercradle
Agilent instrument warranty and service plans
www.agilent.com/comms/XPI
You can also contact one of the following centers
and ask for a Communications Services Solutions
representative.
Argentina
Australia
Austria
Belgium
Brazil
Canada-English
Canada-French
China
Denmark
Finland
France
Germany
Hong Kong
India
Ireland
Israel
Italy
Japan
Luxemborg
Malaysia
Mexico
Netherlands
Norway
Philippines
Poland
Russia
Singapore
South Korea
Spain
Sweden
Switzerland-German
Switzerland-Italy
Switzerland-French
Taiwan
Thailand
United Kingdom
USA
Product specifications and descriptions in this document
subject to change without notice.
©Agilent Technologies, Inc. 2000-2004
Printed in Singapore Jan 01, 2004
+54 11 5811 7115
1 800 629 485
+43 (01) 25 125 7006
+32 (0) 2 404 9340
+55 11 4197 3600
877 894 4414
877 894 4414
800 810 0189
+45 70 13 15 15
+358 (0) 10 855 2100
+33 (0) 825 010 700
+49 (0) 18 05 24 63 33
800 930 871
1600 112 929
+353 1890 924 204
+972 3 6892 500
+39 02 92 60 8484
0120 421 345
+32 (0) 2 404 9340
1800 888 848
+52 01800 506 4800
+31 (0) 20 5472111
+47 23 25 3720
1800 1651 0170
+48 22 723 0066
+7 095 797 3963
1800 375 8100
080 769 0800
+34 91 631 3300
0200 88 22 55
+41 (0) 1 735 9300
+39 (0) 2 92 60 8484
+33 (0) 825 010 700
0800 047 866
1800 226 008
+44 (0) 7004 666666
800 452 4844
*5988-5330EN*
5988-5330EN
Page 16 of 16
 Loading...