

Page 1

User’s
Manual
GCMT Gas Chromatograph
Maintenance Terminal
Software Package
Operation Guide
IM 11B03G03-03E
IM 11B03G03-03E
4th Edition
Page 2

Introduction
Thank you for purchasing the GCMT Gas Chromatograph Maintenance Terminal Software Package.
The GCMT Gas Chromatograph Maintenance Terminal Software Package (hereafter, it is abbreviated as Maintenance Terminal) is used to monitor and maintain the GC1000 Mark II analyzer on
a personal computer by linking the computer to the analyzer through a communication line.
This guide describes the basic procedures for operating the Maintenance Terminal.
l Package Contents
Conrm that the purchased package contains the following:
• GCMT inatallation disks
• GCMT Gas Chromatograph Maintenance Terminal Software Package Operation Guide (IM
11B03G03-03E)
• “GCMT Capture It” software package manual (IM 11B3G1-02E)
l How to User This Guide
This guide rst describes how to install the Maintenance Terminal. Start at Chapter 1 after completing installation. The contents of each chapter are as follows:
i
• Chapter 1 .............an overview of the Maintenance Terminal and its basic operations
• Chapter 2 .............how to operate the LCD emulator
• Chapter 3 to 6 ......how to start the Maintenance Terminal and work with its respective panels
• Appendices ..........a functional ovweview of the Maintenance Terminal and list of its mes-
sages. Refer to the appendices for details on the menus and messages.
l Intended Readers
The description on installation assumes that reders have a basic knowledge of both the hardware
and software required for installing the Maintenance Terminal. This is also true for Chapter 1 and
subsequent chapters, as well as for the Windows™ operating system.
However, the basic operations of Windows™ are specically described in Chapter 1 so you can
work with it without prior knowledge. For the detailed operation of Windows, refer to the separate
appropriate manual.
l Priority
Precautions in operating and handling the Maintenance Terminal are also found in the online help
window of the Maintenance Terminal and the README.TXT le that is registered during installation, inaddition to this guide. The order of precedence among these information sources is:
(1) README.TXT
(2) Help (online manual)
(3) Operation guide (this document)
Media No. IM 11B03G03-03E 4th Edition : Mar. 2012 (YK)
All Rights Reserved Copyright © 2006, Yokogawa Electric Corporation
IM 11B03G03-03E
4th Edition : Mar. 21, 2012-00
Page 3

Safety Precautions
• In order to protect the system controlled by the product and the product itself and ensure
safe operation, observe the safety precautions described in this user’s manual. We assume
no liability for safety if users fail to observe these instructions when operating the product.
• Modication of the product is strictly prohibited.
n Notes on Handling User’s Manuals
• Please hand over the user’s manuals to your end users so that they can keep the user’s
manuals on hand for convenient reference.
• Please read the information thoroughly before using the product.
• The purpose of these user’s manuals is not to warrant that the product is well suited to any
particular purpose but rather to describe the functional details of the product.
• No part of the user’s manuals may be transferred or reproduced without prior written consent from YOKOGAWA.
• YOKOGAWA reserves the right to make improvements in the user’s manuals and product at
any time, without notice or obligation.
ii
• If you have any questions, or you nd mistakes or omissions in the user’s manuals, please
contact our sales representative or your local distributor.
n Warning and Disclaimer
The product is provided on an “as is” basis. YOKOGAWA shall have neither liability nor responsibility to any person or entity with respect to any direct or indirect loss or damage arising from
using the product or any defect of the product that YOKOGAWA can not predict in advance.
n Notes on Software
• YOKOGAWA makes no warranties, either expressed or implied, with respect to the software’s merchantability or suitability for any particular purpose, except as specied in the
terms of warranty.
• This product may be used on a machine only. If you need to use the product on another
machine, you must purchase another product.
• It is strictly prohibited to reproduce the product except for the purpose of backup.
• Store the CD-ROM (the original medium) in a safe place.
• It is strictly prohibited to perform any reverse-maintenance operation, such as reverse com-
pilation or reverse assembling on the product.
• No part of the product may be transferred, converted or sublet for use by any third party,
without prior written consent from YOKOGAWA.
IM 11B03G03-03E
4th Edition : Mar. 21, 2012-00
Page 4

Documentation Conventions
n Symbol Marks
Throughout this user’s manual, you will nd several different types of symbols are used to identify
different sections of text. This section describes these icons.
NOTE
Identies important information required to understand operations or functions.
TIP
Identies additional information.
SEE ALSO
Identies a source to be referred to.
HELP !
iii
Indicates text describing the action to be taken when a message or indication is displayed
during an operation.
n Keyboard Inscriptions
Keyboard operations are indicated in this manual as shown in the following example.
(Inscription example)
[Shift] + [F1]
(Meaning)
Indicates that the operator must press the [F1] key while pressing the [Shift] key.
n Menu Inscriptions
Menu operations are indicated in this manual as shown in the following example.
(Inscription example)
Click on [Connect] in the [System] menu.
(Meaning)
Click on the [System] menu, then click on the [Connect] command.
n Drawing Conventions
Some drawings may be partially emphasized, simplied, or omitted, for the convenience of description.
Some screen images depicted in the user’s manual may have different display positions or
character types (e.g., the upper / lower case). Also note that some of the images contained in this
user’s manual are display examples.
IM 11B03G03-03E
4th Edition : Mar. 21, 2012-00
Page 5

Copyright and Trademark Notices
n All Rights Reserved
The copyrights of the programs and on-line manual contained in the CD-ROM are reserved.
The on-line manual is protected by the PDF security from modication, however, it can be output
via a printer. Printing out the on-line manual is only allowed for the purpose of using the product.
When using the printed information of the on-line manual, check if the version is the most recent
one by referring to the CD-ROM’s version.
No part of the on-line manual may be transferred, sold, distributed (including delivery via a commercial PC network or the like), or registered or recorded on video tapes.
n Trademark Acknowledgments
• IBM is a registered trademark of International Business Machines Corporation.
• Microsoft and Windows are either registered trademarks or trademarks of Microsoft Corpo-
ration in the United States and/or other countries.
• Ethernet is a registered trademark of XEROX Corporation.
iv
• All other company and product names mentioned in this user’s manual are trademarks or
registered trademarks of their respective companies.
• We do not use TM or ® mark to indicate those trademarks or registered trademarks in this
user’s manual.
IM 11B03G03-03E
4th Edition : Mar. 21, 2012-00
Page 6

Toc-1
GCMT
Gas Chromatograph Maintenance Terminal Software Package
Operation Guide
IM 11B03G03-03E 4th Edition
CONTENTS
Introduction ..............................................................................................................i
Safety Precautions ..................................................................................................ii
Documentation Conventions ................................................................................iii
Copyright and Trademark Notices .......................................................................iv
Installing the Maintenance Terminal .....................................................................1
1.
2.
3.
Overview of Maintenance Terminal .......................................................... 1-1
1.1 How the Maintenance Terminal Works ........................................................... 1-1
1.2 Maintenance Terminal Group in Program Manager ...................................... 1-2
1.3 Notes Before Use .............................................................................................. 1-4
LCD Emulator Window ..............................................................................2-1
2.1 Starting and Exiting the LCD Emulator .......................................................... 2-1
2.2 Basic Operations .............................................................................................. 2-3
Analyzer Operation Window .....................................................................3-1
3.1 Starting and Exiting the Maintenance Terminal ............................................ 3-2
3.2 Layout of Analyzer Operation Window ........................................................... 3-5
3.3 Viewing the States of the Detector and Temperature Controller ................. 3-9
3.4 Changing the User Level ................................................................................ 3-11
3.5 Changing the Status/Operation Mode/Measurement Status ..................... 3-12
3.6 Changing the states of the Valves/Detectors/Temperature Controller ..... 3-15
3.7 Changing the Range ....................................................................................... 3-17
3.8 Changing the Valves and Peak Information ................................................. 3-19
3.9 Uploading and Downloading the Parameter Settings ................................ 3-20
3.10 Actions When Alarms Occur .........................................................................3-22
4.
5.
Chromatogram Window ............................................................................4-1
4.1 Opening and Closing the Chromatogram Window ....................................... 4-1
4.2 Window Layout ................................................................................................. 4-3
4.3 Viewing Chromatograms and Temperature Data .......................................... 4-4
4.4 Changing the Scale and Scrolling the Display .............................................. 4-9
4.5 Zooming and Temporarily Saving Chromatograms ................................... 4-10
4.6 Saving Chromatograms ................................................................................. 4-12
Alarm Windows ..........................................................................................5-1
5.1 Types and Layouts of Alarm Windows ........................................................... 5-2
5.2 Opening and Closing Alarm Windows ...........................................................5-3
IM 11B03G03-03E
4th Edition : Mar. 21, 2012-00
Page 7

Toc-2
5.3 Deleting the Records of Alarm History ........................................................... 5-6
5.4 Creating a User Alarm Description .................................................................5-6
6.
Analysis Results Windows .......................................................................6-1
6.1 Opening and Closing an Analysis Results Window .....................................6-2
6.2 Types and Layouts of Analysis Results Windows ........................................ 6-4
6.3 Switching Between Analysis Results Windows .......................................... 6-10
6.4 Saving and Retrieving Data ........................................................................... 6-11
6.5 Processing and Re-saving Data .................................................................... 6-14
6.6 Graphing Historical Data ................................................................................ 6-15
6.7 Resetting Historical Data ............................................................................... 6-18
6.8 Opening the Help Window of an Analysis Results Window.......................6-19
Appendix A Menus .............................................................................................A-1
Appendix B Messages Summary .....................................................................B-1
Revision Information ...............................................................................................i
IM 11B03G03-03E
4th Edition : Mar. 21, 2012-00
Page 8
<Installing the Maintenance Terminal>
Installing the Maintenance Terminal
This chapter describes the installation of the Maintenance Terminal (GCMT) in the
personal computer system being used. This installation assumes that your PC system
is already in the ready state under the following conditions and also that you have some
knowledge of how to use the system.
n SystemConguration
l Software conditions
Check that the software meets the following conditions:
Microsoft’s Windows 7 Professional 32bit Service Pack 1 or
Windows Vista Business Edition or
Windows XP Professional Service Pack 3
l Hardware conditions
Before installing GCMT, check that the hardware meets the following conditions:
• Models supported: IBM PC or computable machine that can run Microsoft Windows and for
which Ethernet is available
1
OS Windows 7, Windows Vista Windows XP
CPU 1 GHz or better Pentium II 350 MHz or better
HDD
RAM At least 1 GB At least 20 MB
Display
15 GB or more for OS
10 GB or more for application
680 x 480 VGA or higher,
and be viewable with equal to or more than 256 colors
128 MB or more
• For the hard disk, a data storage capacity should be secured separately according to your
PC system format, in addition to the capacity for the program.
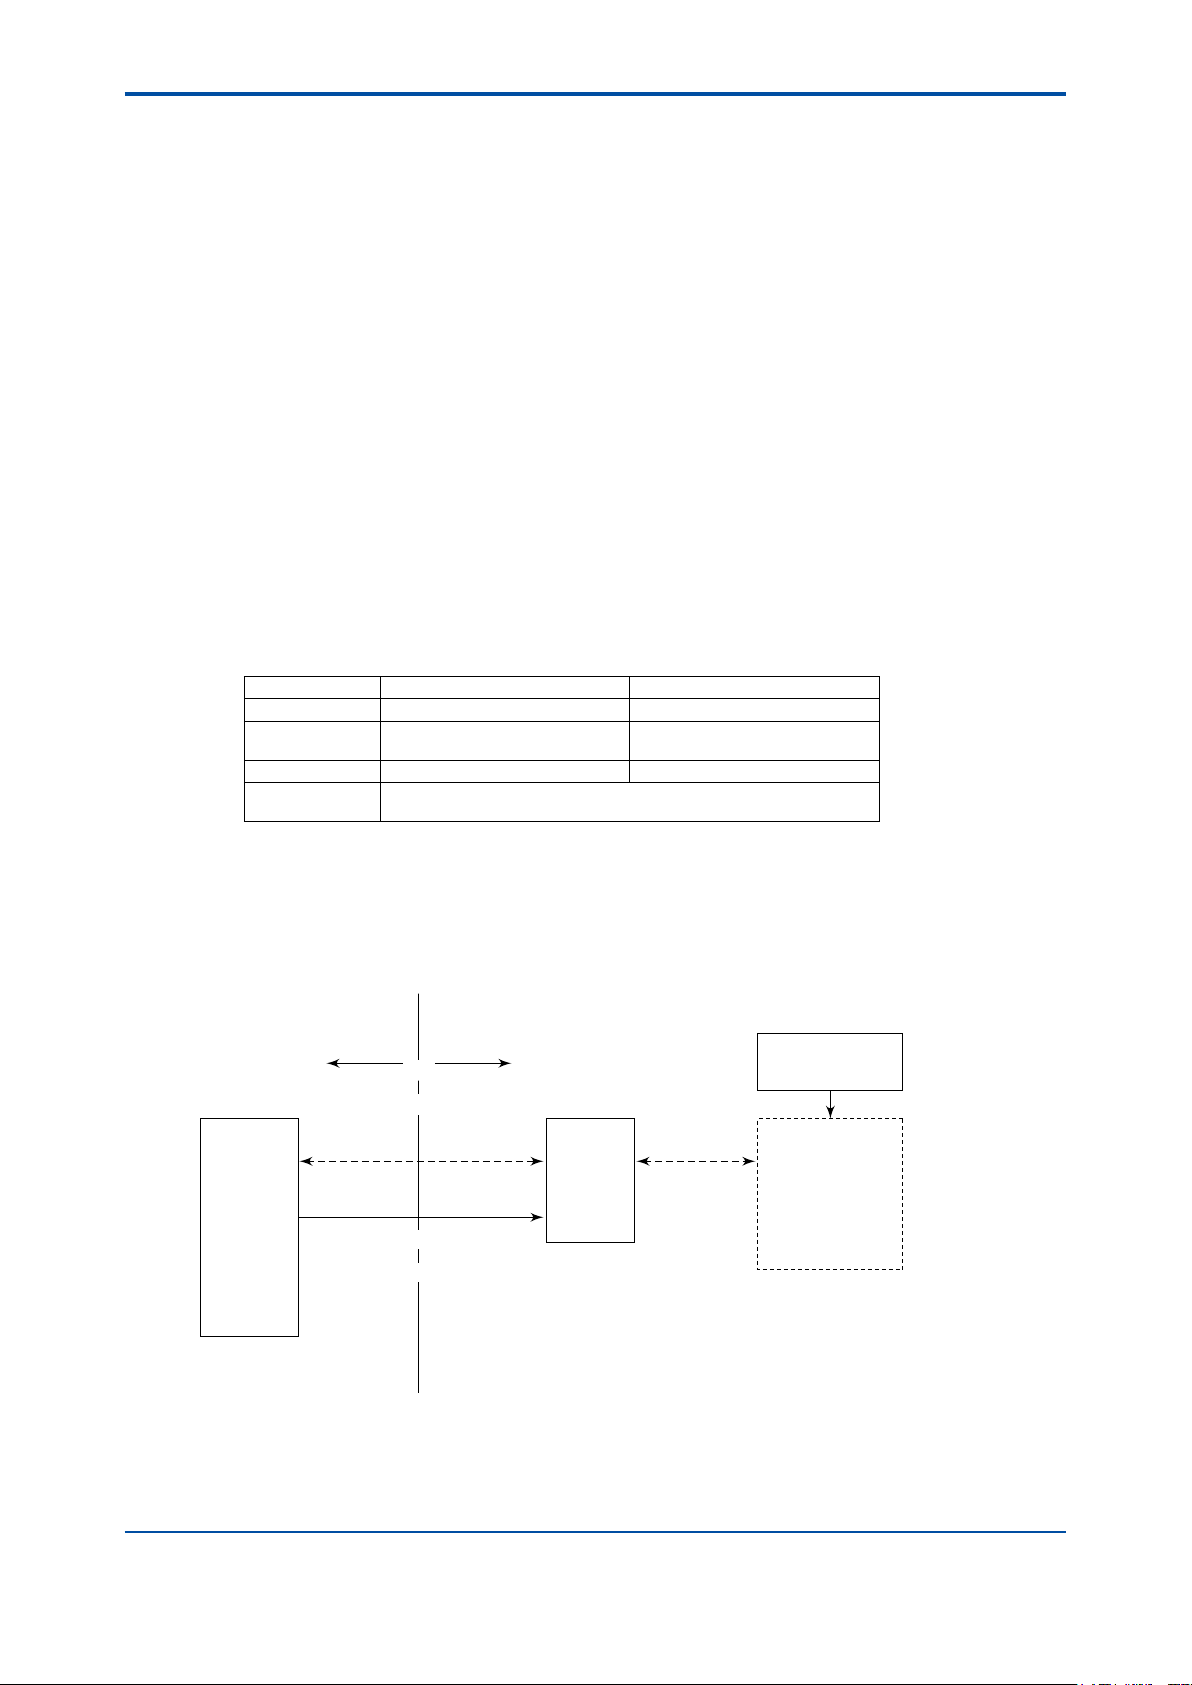
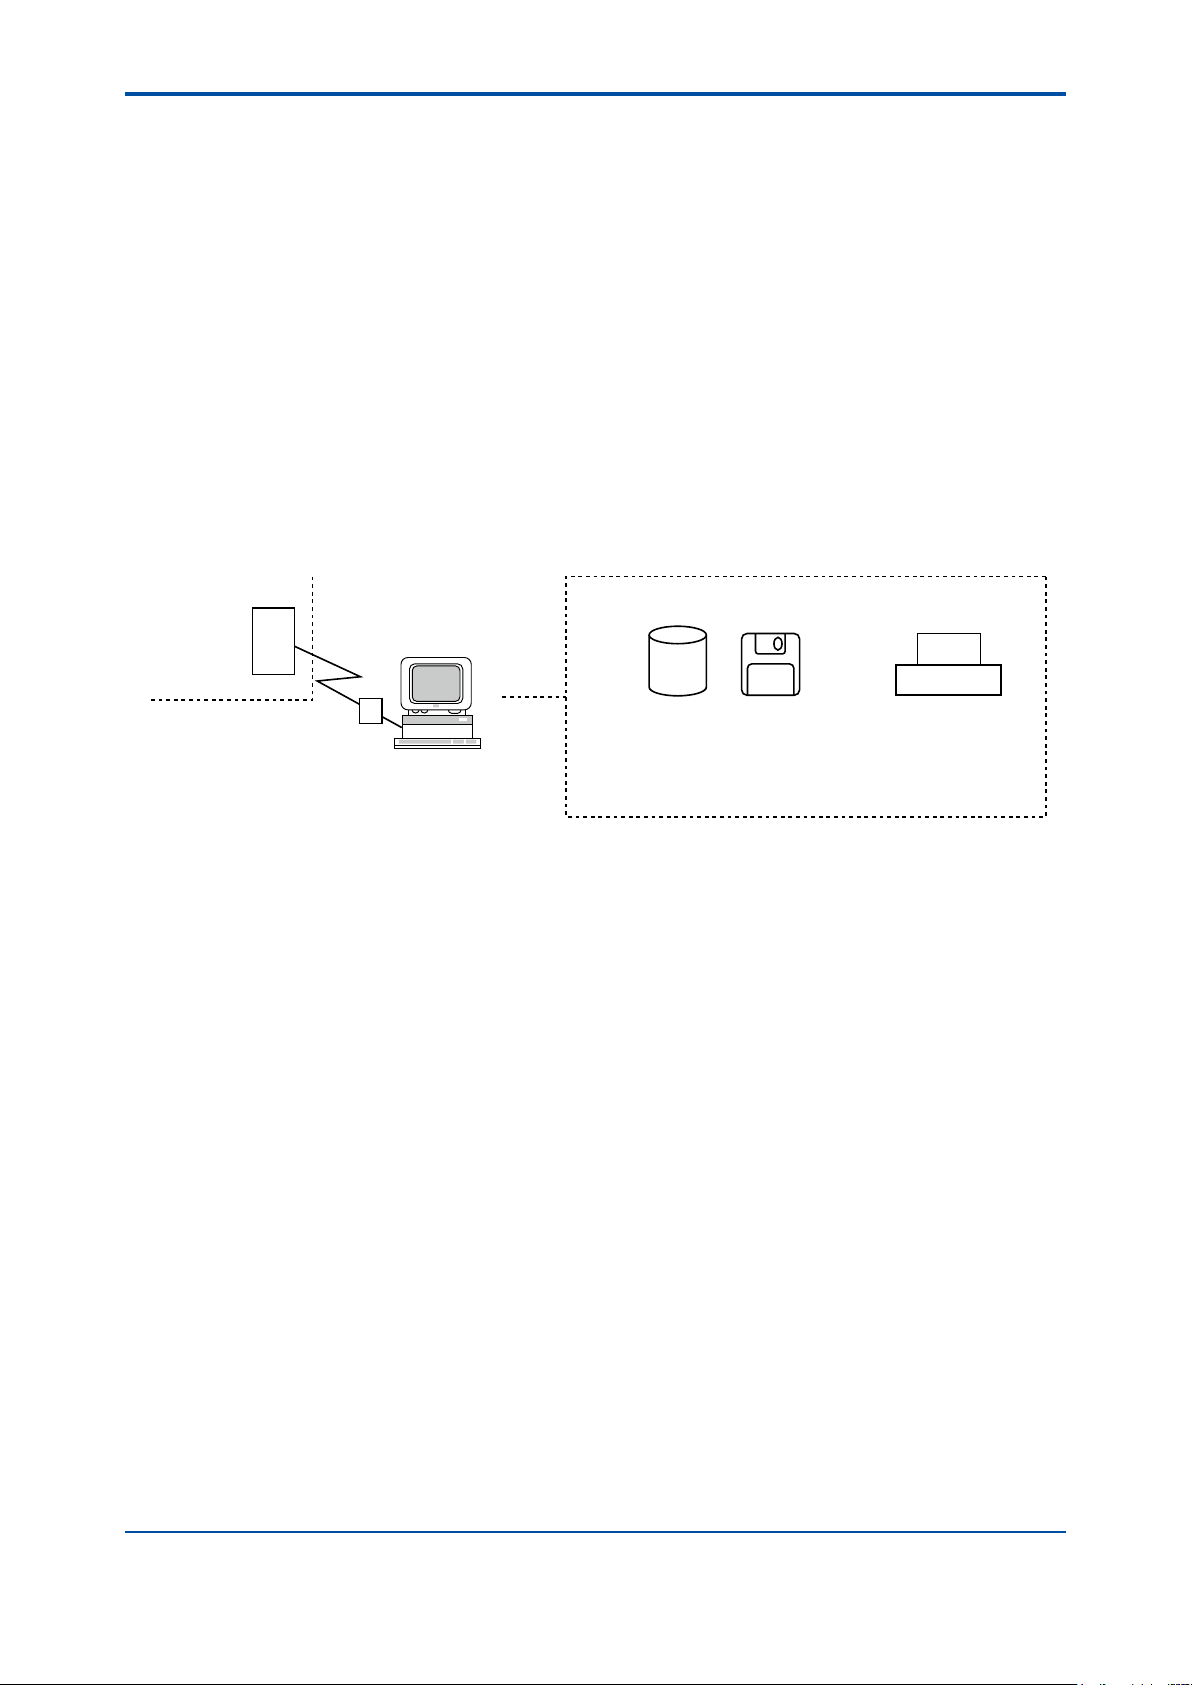
• Communication function: Make sure that the standard serial communication port is
connected to the analyzer via the communication converter (Model K9404LA provided with
a feature for maintaining the explosion-proof capabilities)-see the gure below.
Software package
GC1000
Mark II
analyzer
Field Instrument room
Communication
Serial
communication
RS-422
(up to 1 km)
Power-off signal
RS-422/RS-232C converter provided
with a feature for maintaining
explosion-proof capabilities
converter
K9404LA
Serial
communication
RS-232C
(up to 15 m)
GCMT
Installation
Personal computer
IM 11B03G03-03E
F01.ai
4th Edition : Mar. 21, 2012-00
Page 9
<Installing the Maintenance Terminal>
n Installation Procedure
NOTE
The user should log on with an administrator account in order to install and use GCMT. Proper
operation is not guaranteed when the user logs on with a limited user account.
l Installing GCMT on Computers Running Windows 7 or Windows Vista
(1) Prepare a personal computer which lls the specication and turn on the power.
Start Windows.
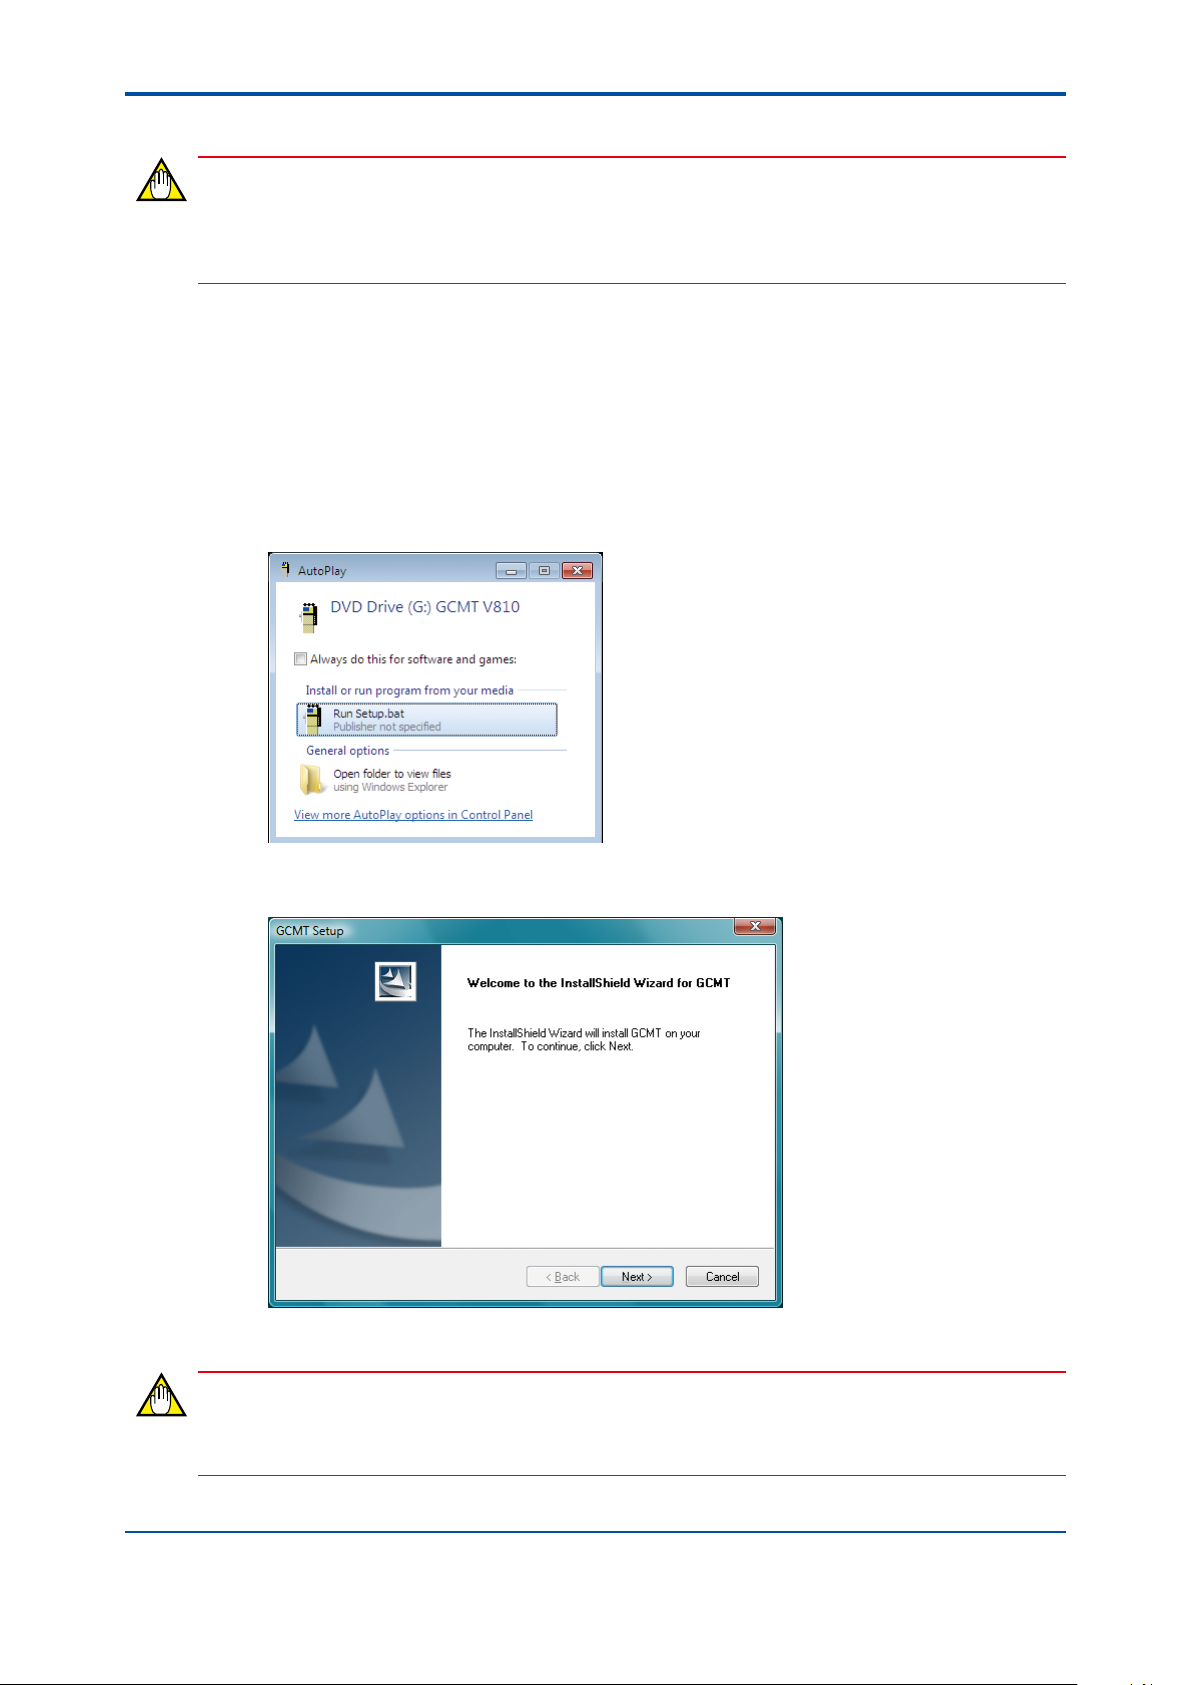
(2) Insert the installation disk into the CD-ROM drive.
(3) The install program is started automatically.
The following dialog box appears. Click [Run Setup.bat].
If it is not started automatically, run “setup.bat” le in the CD-ROM manually.
2
(4) The “Welcome to the InstallShield Wizard for GC Maintenance Terminal” dialog appears.
Click [Next].
(5) Hereafter, install according to the displayed instruction.
NOTE
Might be necessary to restart the personal computer at the end of installation.
IM 11B03G03-03E
4th Edition : Mar. 21, 2012-00
Page 10
<Installing the Maintenance Terminal>
n Disabling UAC
User Account Control (UAC) helps prevent unauthorized programs from being installed on the
system silently by viruses or malicious software. This feature is normally preferable, but in some
cases, it may interfere with system operation and settings, e.g., UAC may block installation of
some applications.
NOTE
UAC can be disabled at the user’s discretion. Yokogawa is not responsible for any problems that
may result from disabling UAC.
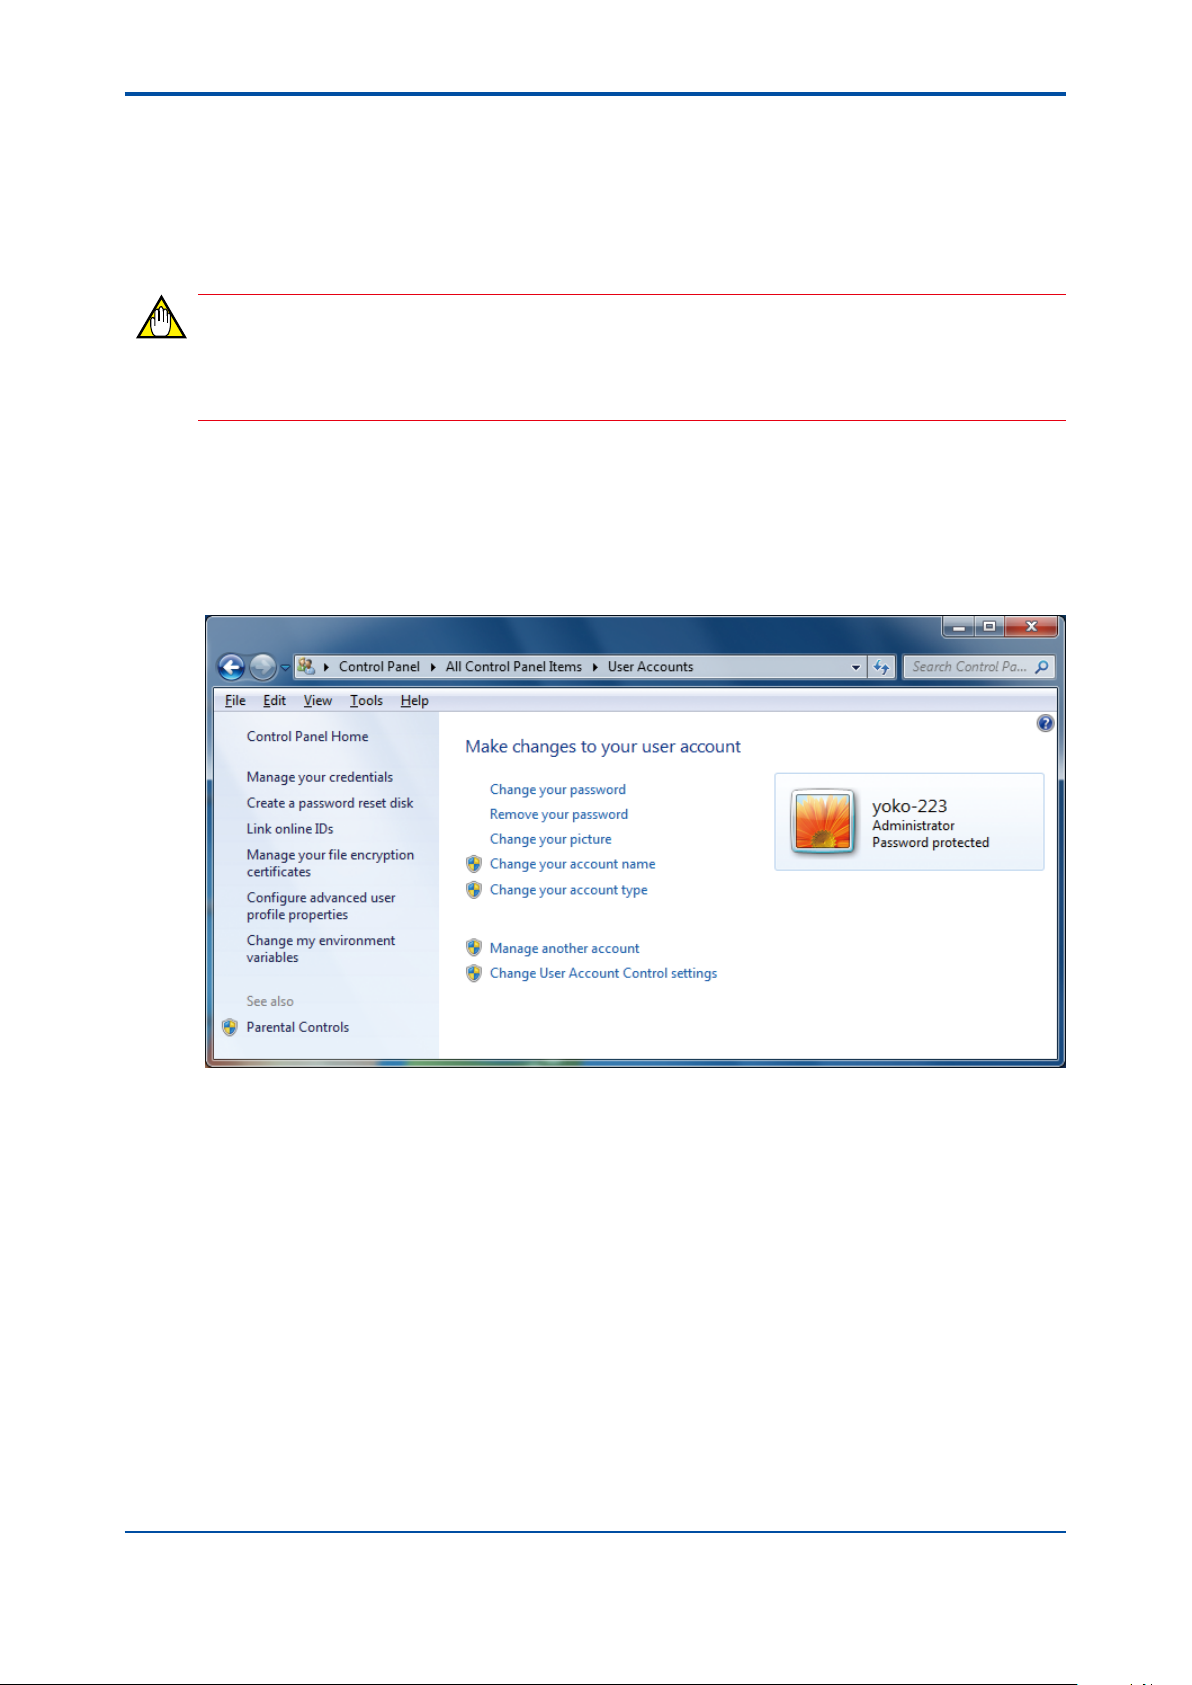
The UAC setting is enabled by default. To disable the setting, you must log on using an
administrator account. All the following steps should be done as an administrator account.
l for Windows 7
(1) Open the Control Panel and then User Accounts.
3
IM 11B03G03-03E
4th Edition : Mar. 21, 2012-00
Page 11
<Installing the Maintenance Terminal>
(2) Click [Change User Account Control settings].
4
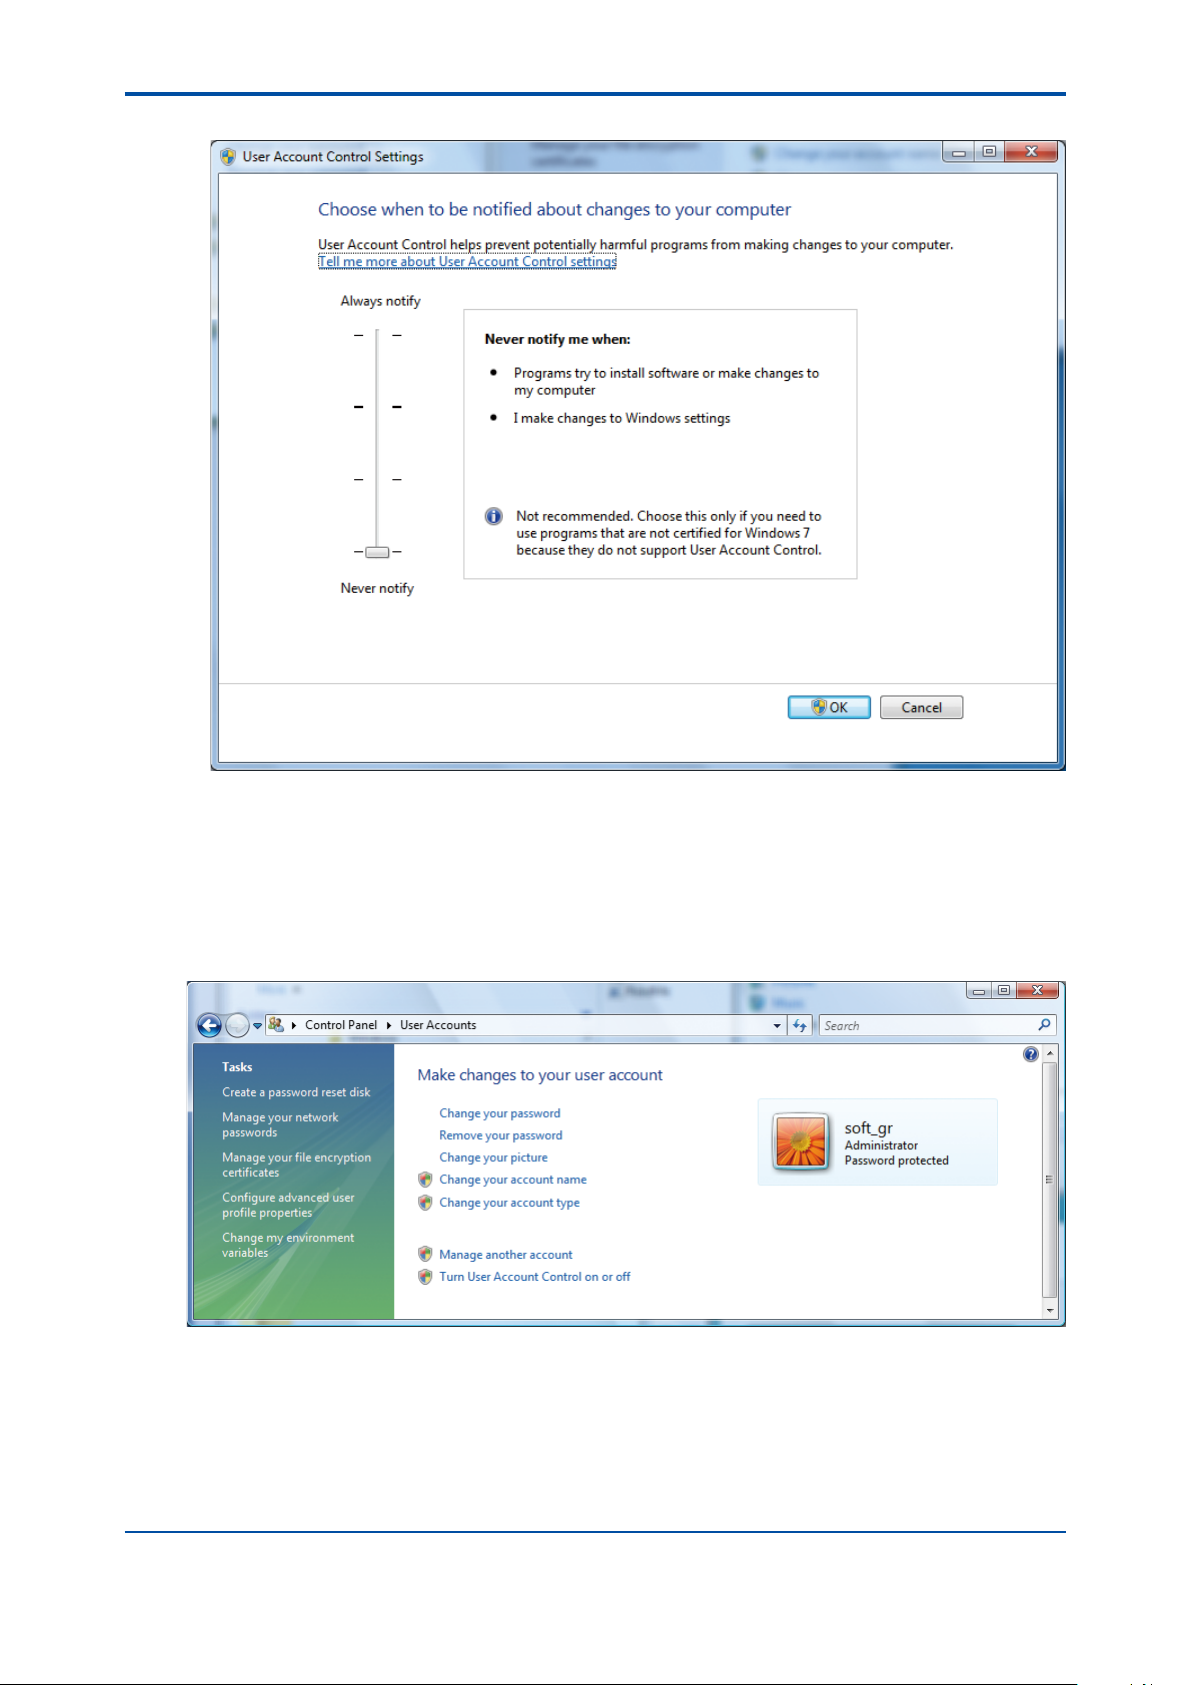
(3) Slide to [Never notify], and then click [OK].
Disabling UAC is now complete.
In order to re-enable UAC, slide the above level, and then click [OK].
l for Windows Vista
(1) Open the Control Panel and then User Accounts.
IM 11B03G03-03E
4th Edition : Mar. 21, 2012-00
Page 12
<Installing the Maintenance Terminal>
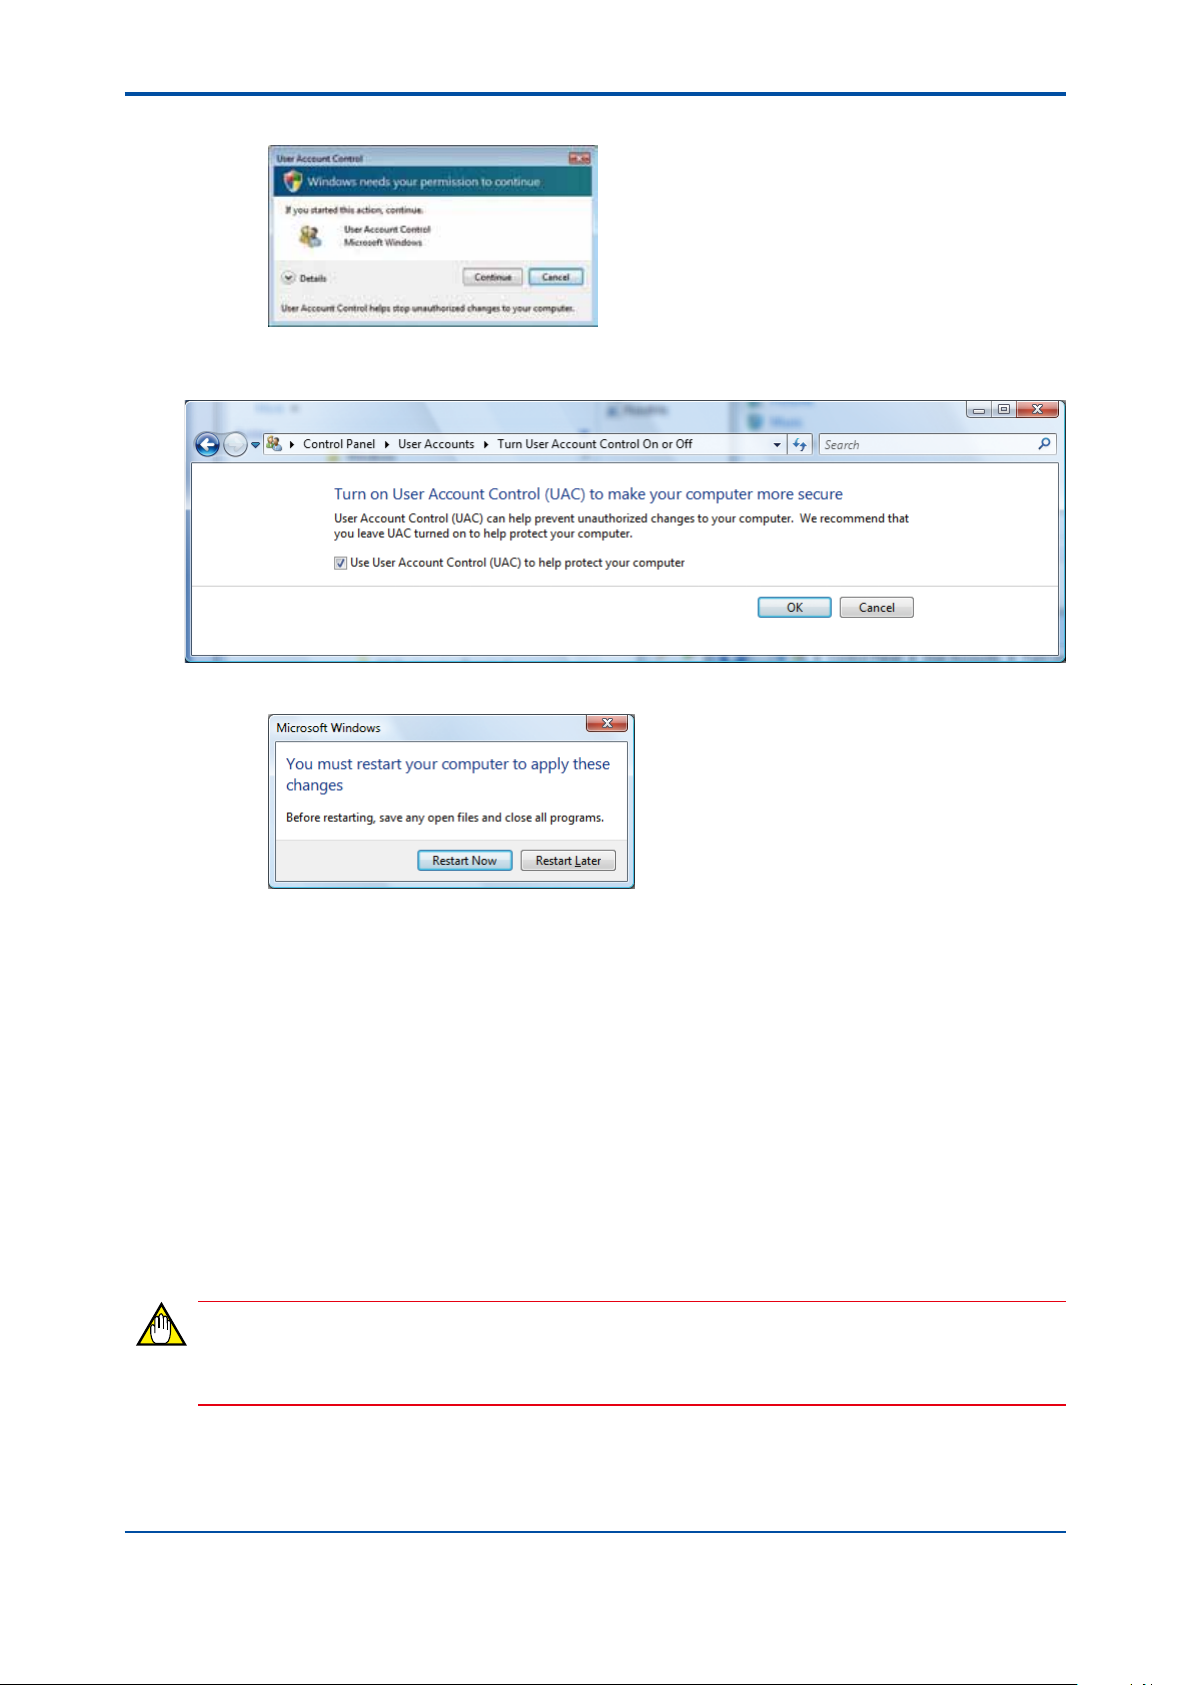
(2) Click [Turn User Account Control on or off]. The following dialog appears. Click [Continue].
(3) The [Turn User Account Control On or Off] dialog appears. Uncheck the [Use User Account
Control (UAC) to help protect your computer] check box, and then click [OK].
5
(4) The following dialog appears. Click [Restart Now] to restart the computer.
Disabling UAC is now complete.
In order to re-enable UAC, just select the above check box and reboot.
n Installing GCMT on Computers Running OSs Other Than Windows 7
or Windows Vista
(1) Prepare a personal computer which lls the specication and turn on the power.
Start Windows.
(2) Insert the installation disk into the CD-ROM drive.
(3) The install program is started automatically.
The steps after this are the same as those for installing on computers running Windows 7
OS.
NOTE
Might be necessary to restart the personal computer at the end of installation.
IM 11B03G03-03E
4th Edition : Mar. 21, 2012-00
Page 13

<Installing the Maintenance Terminal>
n PCCongurationforPowerManagement
It is recommended that the following items be set and conrmed after installation of GCMT.
NOTE
GCMT may not function properly while the sleep, standby and hibernation settings are enabled.
The settings above can be disabled in Windows. The setting procedure is as follows.
l for Windows 7
Log on as a user with administrator privileges, click the Start menu, select Control Panel,
Hardware and Sound, double-click Power Options to display the Power Options Properties dialog
box, and then make sure the following items are set as described below. Note that some of the
items described below may not be displayed depending on the conguration of the PC. If an item
is not displayed, the function is disabled.
• Choosewhatthepowerbuttondoes.
When I press the power button: Do nothing
When I press the sleep button: Do nothing
When I close the lid: Do nothing
• Choosewhattoturnoffthedisplay
Turn off the display: Never
6
l for Windows Vista
Log on as a user with administrator privileges, click the Start menu, select Control Panel, double-
click Power Options to display the Power Options Properties dialog box, and then make sure the
following items are set as described below. Note that some of the items described below may not
be displayed depending on the conguration of the PC. If an item is not displayed, the function is
disabled.
• SystemSettingswindow
When I press the power button: Do nothing
When I press the sleep button: Do nothing
When I close the lid: Do nothing
• EditPlanSettingswindow
Put the computer to sleep: Never
l for Windows XP
Log on as a user with administrator privileges, click the Start menu, select Control Panel, double-
click Power Options to display the Power Options Properties dialog box, and then make sure the
following items are set as described below. Note that some of the items described below may not
be displayed depending on the conguration of the PC. If an item is not displayed, the function is
disabled.
• PowerSchemesTab
System standby: Disabled
System hibernates: Disabled
• AdvancedTab
Some PC keyboards have a sleep button. Disable this key with the following setting in the
Power buttons area.
IM 11B03G03-03E
4th Edition : Mar. 21, 2012-00
Page 14
<Installing the Maintenance Terminal>
When pressing the sleep button on my computer: Do nothing
• HibernateTab
Enable hibernation: Unselected
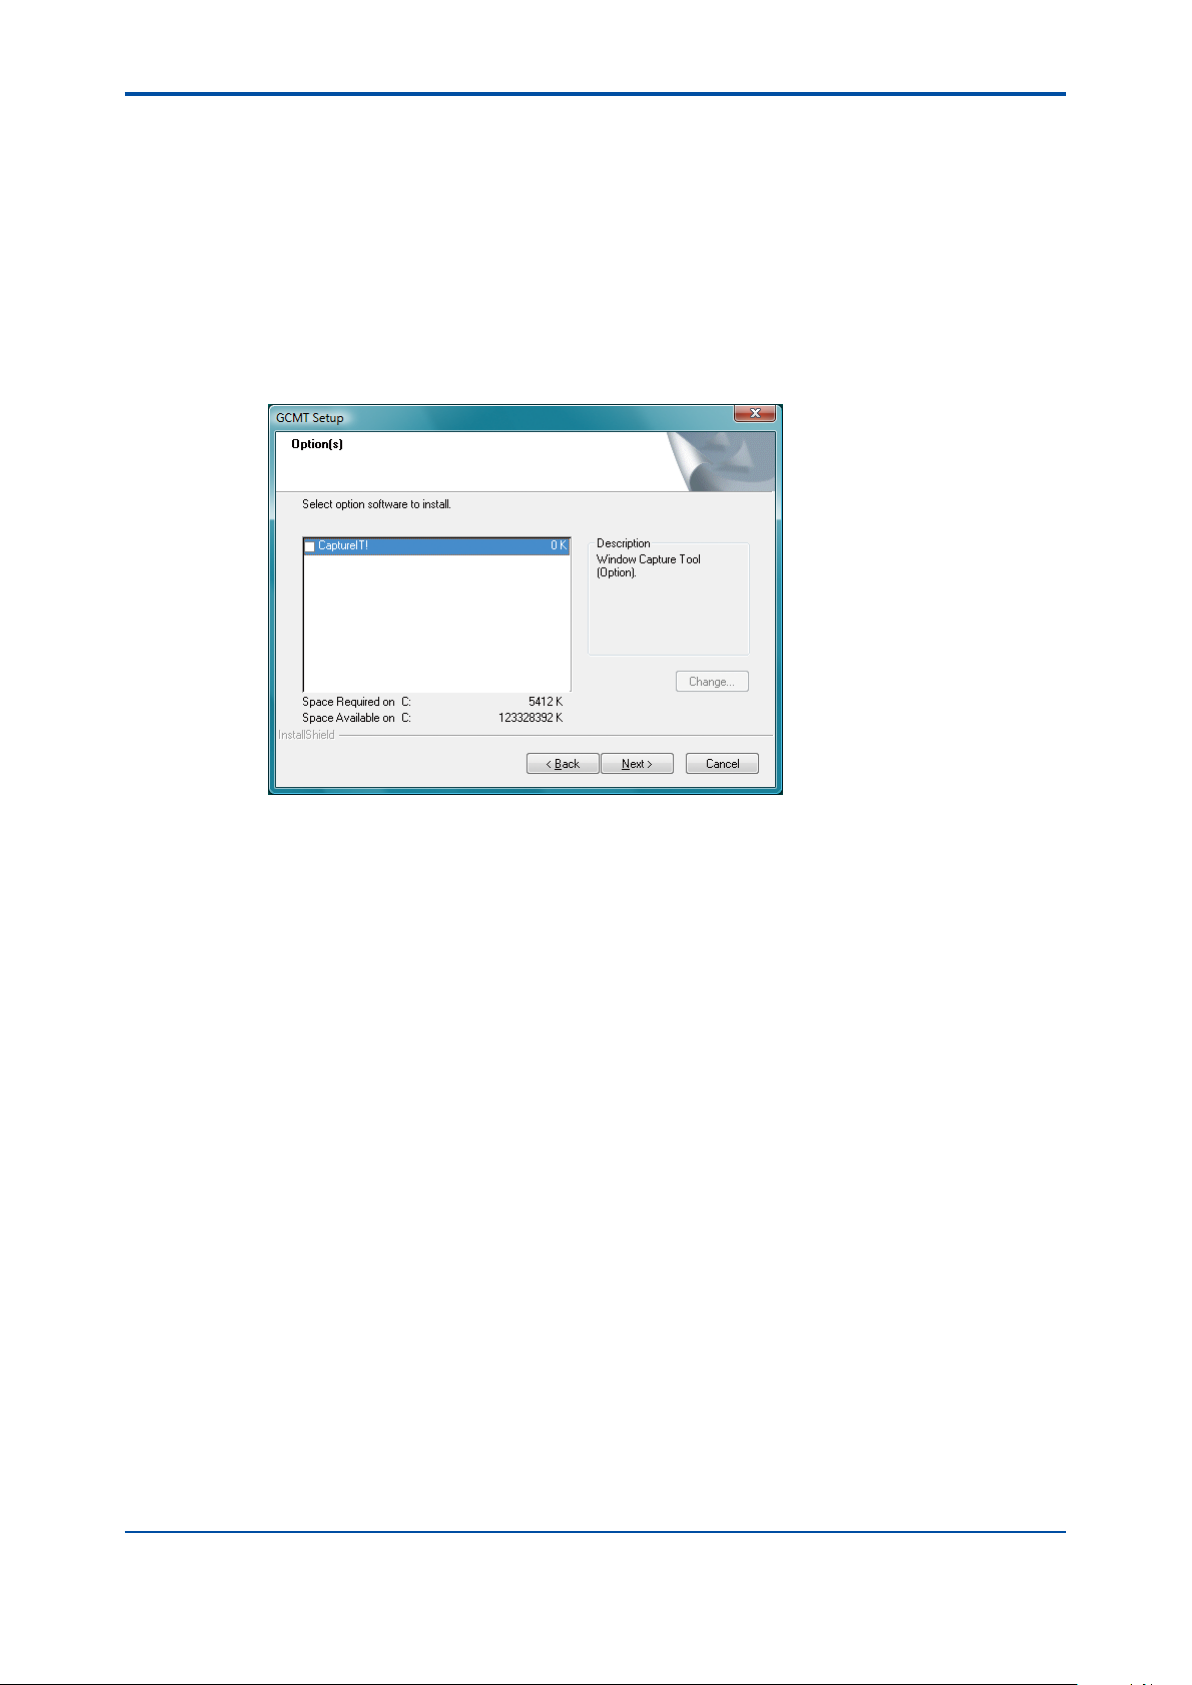
n CaptureIt! Installation
<Use the CaptureIt!>
You can select whether “CaptureIt!” capturing software at a below dialogue box in the installation
of GCMT.
7
You select whether to install “CaptureIt!” in the check column, and click on the “Next” button.
<Not use the CaptureIt!>
(1) Press the Print Screen key on your keyboard to copy the bitmap on the clipboard. It may be
labeled [PrtScn].
When you want to capture an active window, press and hold down the “Alt” key, and press
the “Print Screen” key on your keyboard to copy the bitmap on the clipboard.
(2) Open an image editing programme, such as Microsoft Paint.
Start the Paint accessory (Start -> Program -> Accessories -> Paint).
(3) Select [PASTE] from the [Edit] menu.
IM 11B03G03-03E
4th Edition : Mar. 21, 2012-00
Page 15
<Installing the Maintenance Terminal>
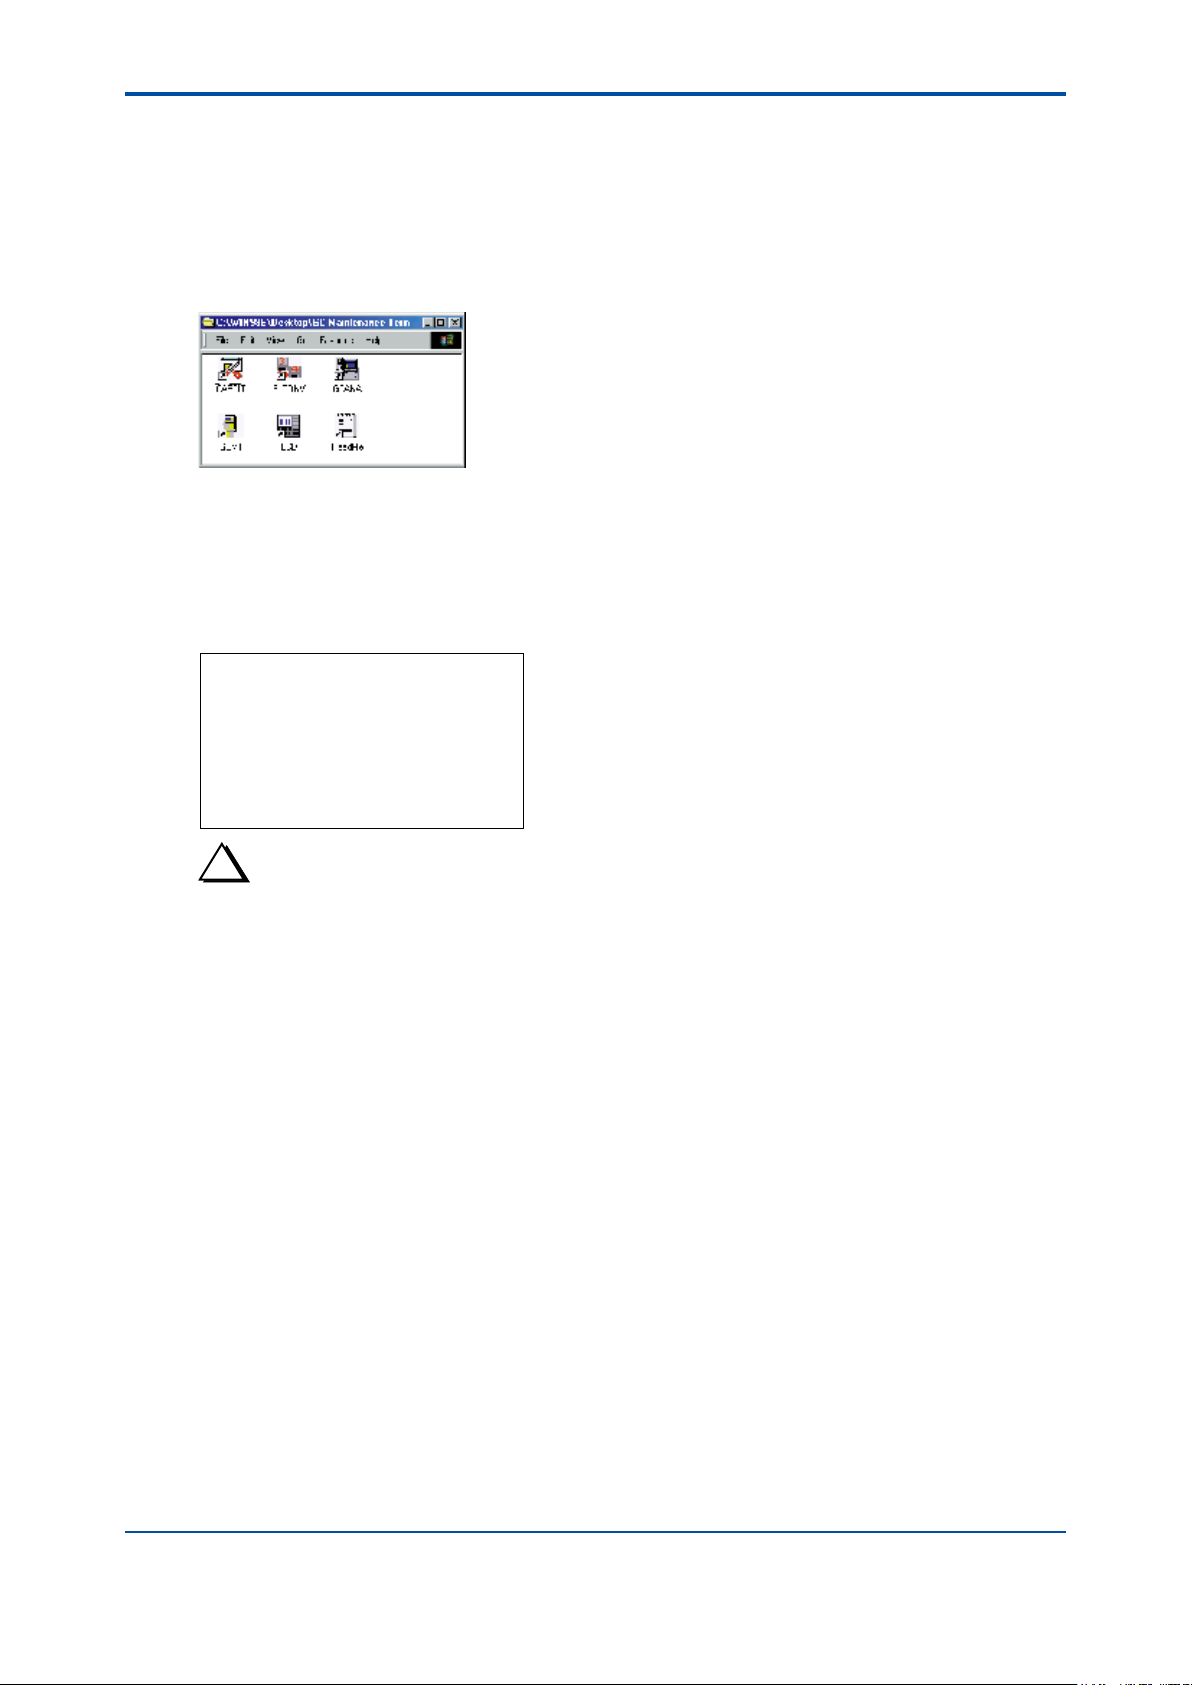
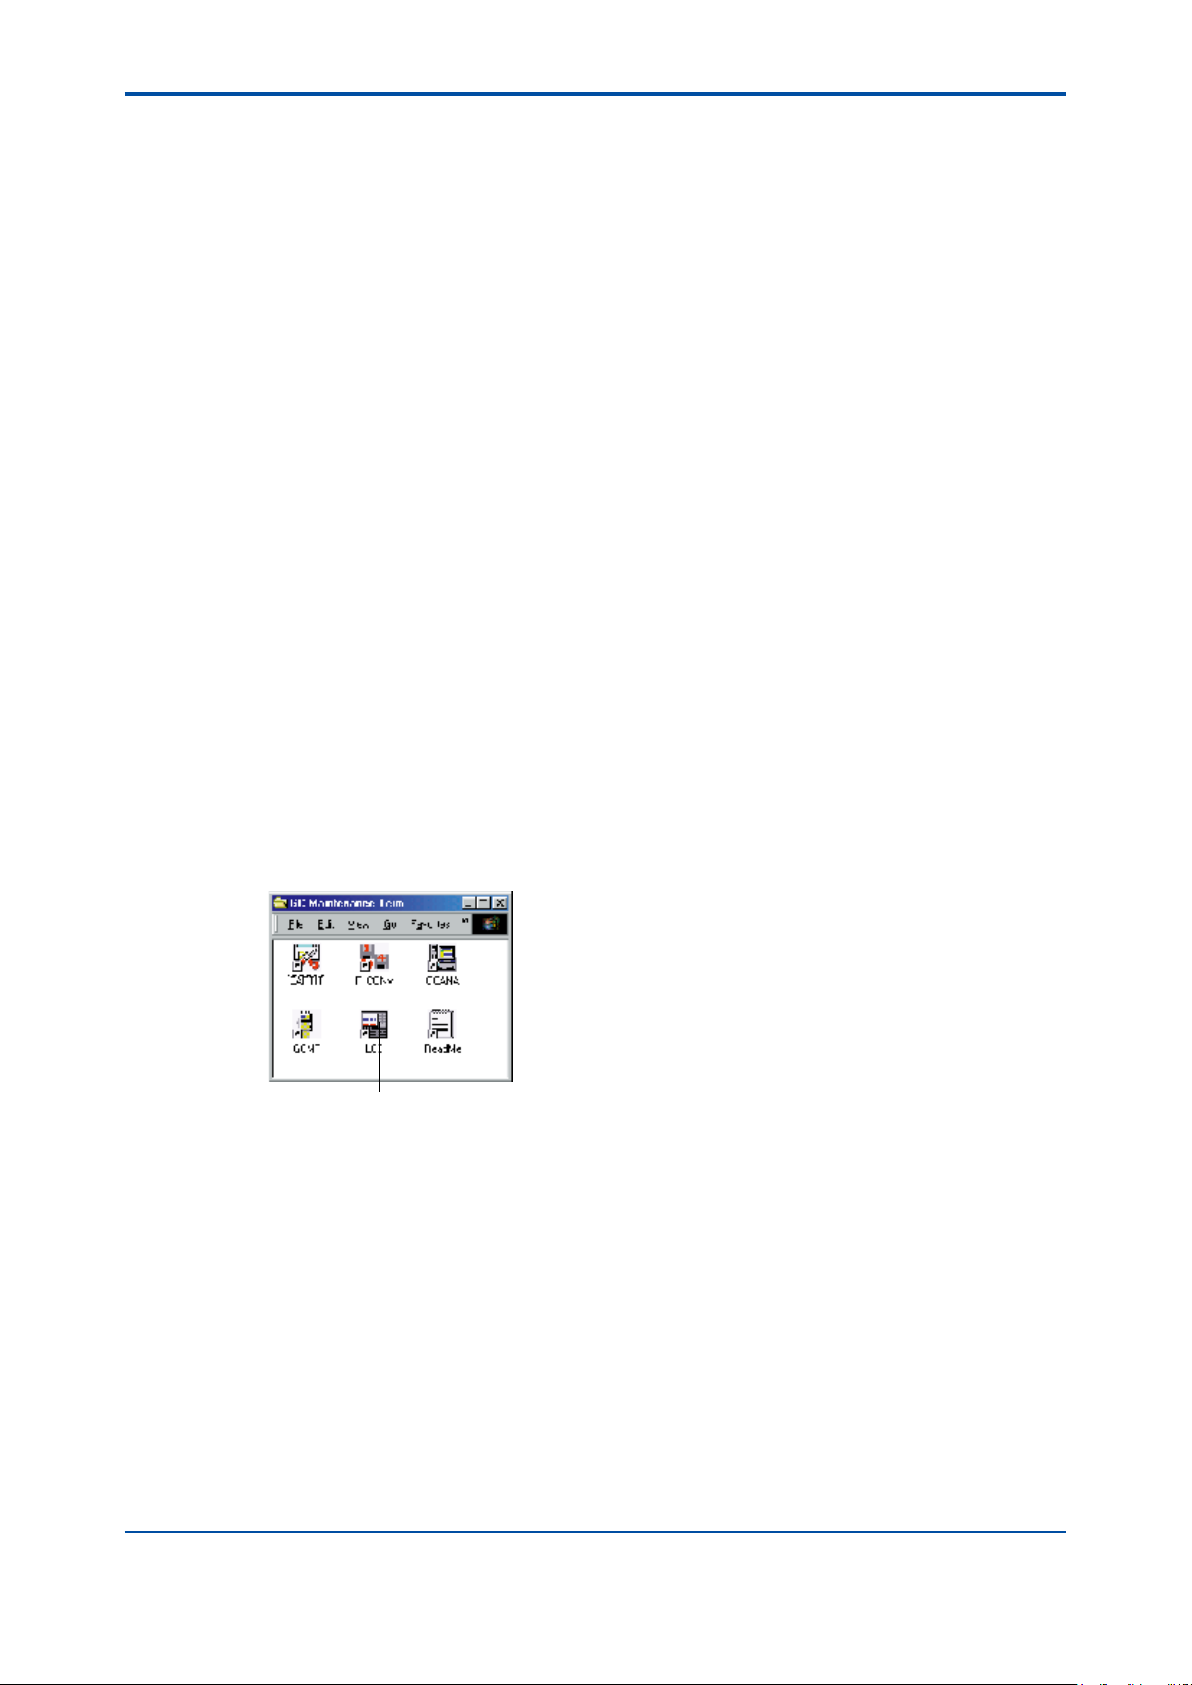
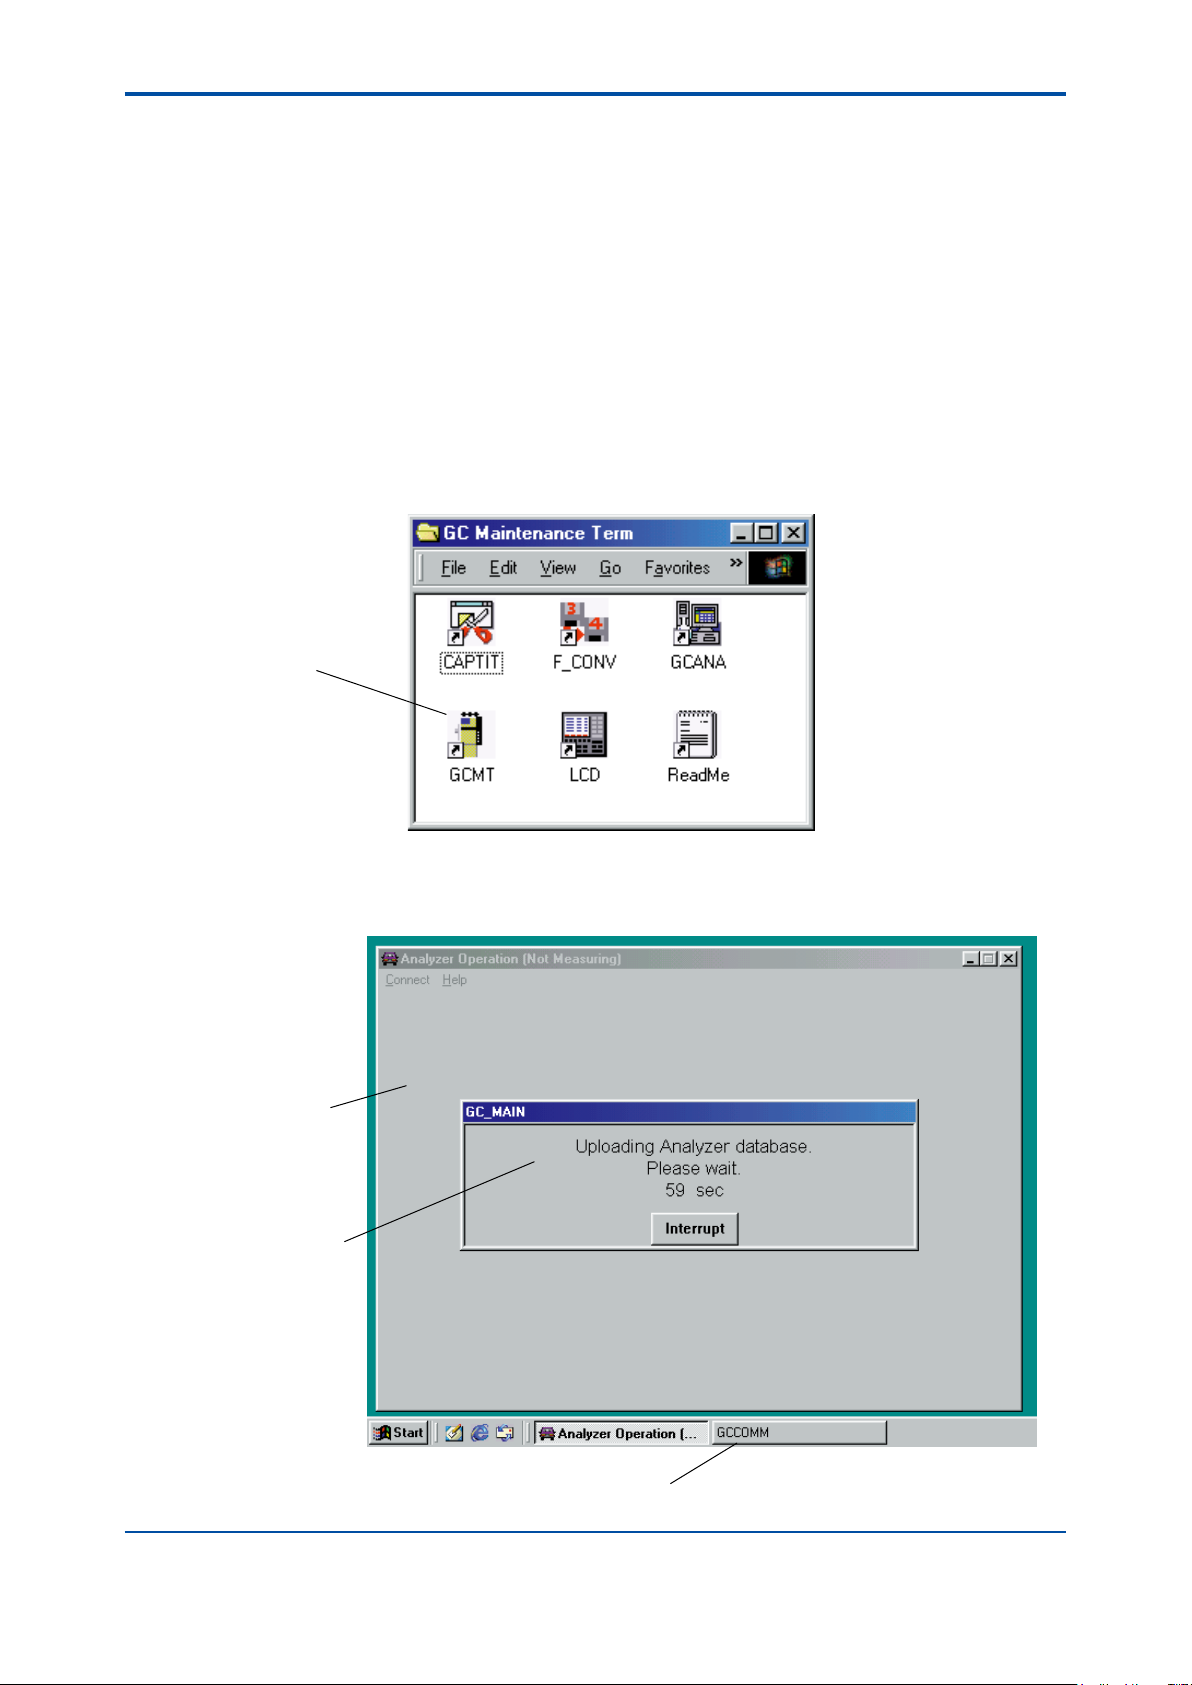
n Changes in the Windows Environment
When the GCMT is installed, the following changes are made to the Windows™ environment.
l “GC Maintenance Terminal” Group
When the GCMT is installed, a new “GC Maintenance Term.” group is registered. In the group,
the six icons, “CAPTIT”, “F_CONV”, “GCANA”, “GCMT”, “LCD”, and “ReadMe” are registered.
F09.ai
l GCMT.INI File
When the GCMT is installed, a “GCMT.INI” initialization le is created in the directory where
Windows™-executable les are located. However, if a GCMT.INI le already exists because of
a previous installation of the GCMT, for example, the installer asks whether to overwrite or not.
GCMT.INI contains the following major items of information:
8
[GC_COMM ]
ComPort=1
[ALARM_101
CODE=101
MESSAGE=#1 REAK CONC. ERR
Abnormal concentration of component #1
· · · · · ·
· · · · · · · · · · · · · · · ·
· · · · · · · · · · · · · · · ·
Type the communication port number (typically “1”).
Register the text describing a user-defined alarm.
TIP
About initialization les
• If you are upgrading the version of the Maintenance Terminal already in use or operating the Maintenance
Terminal with the default values, you need not make any changes to the initialization le.
• Changes to the le do not take effect until the system is restarted.
IM 11B03G03-03E
4th Edition : Mar. 21, 2012-00
Page 16
<Installing the Maintenance Terminal>
n StandardSpecications(CommunicationConverterK9404LA,
K9490LD, RS-232C, Communication cable, Figure, Wiring)
This communication converter converts communications from RS-422 to RS-232C for PC
or DCS communication and shuts off the communication signals when a power-off signal is
received from the analyzer. This maintains explosion-protection on the analyzer side.
l Signal terminal, to the GC1000 Mark II
M4 terminals
1 RS-422 SDA, SDB, RDA, RDB
2 D/I 12 V +, -
l Signal Terminals on the Communication Equipment
M4 terminals
RS-232C D-Sub25 female terminals
l Power supply
100 to 240 V AC ±10%, 50/60 Hz ±5%, 15 W Max., M4 terminals
9
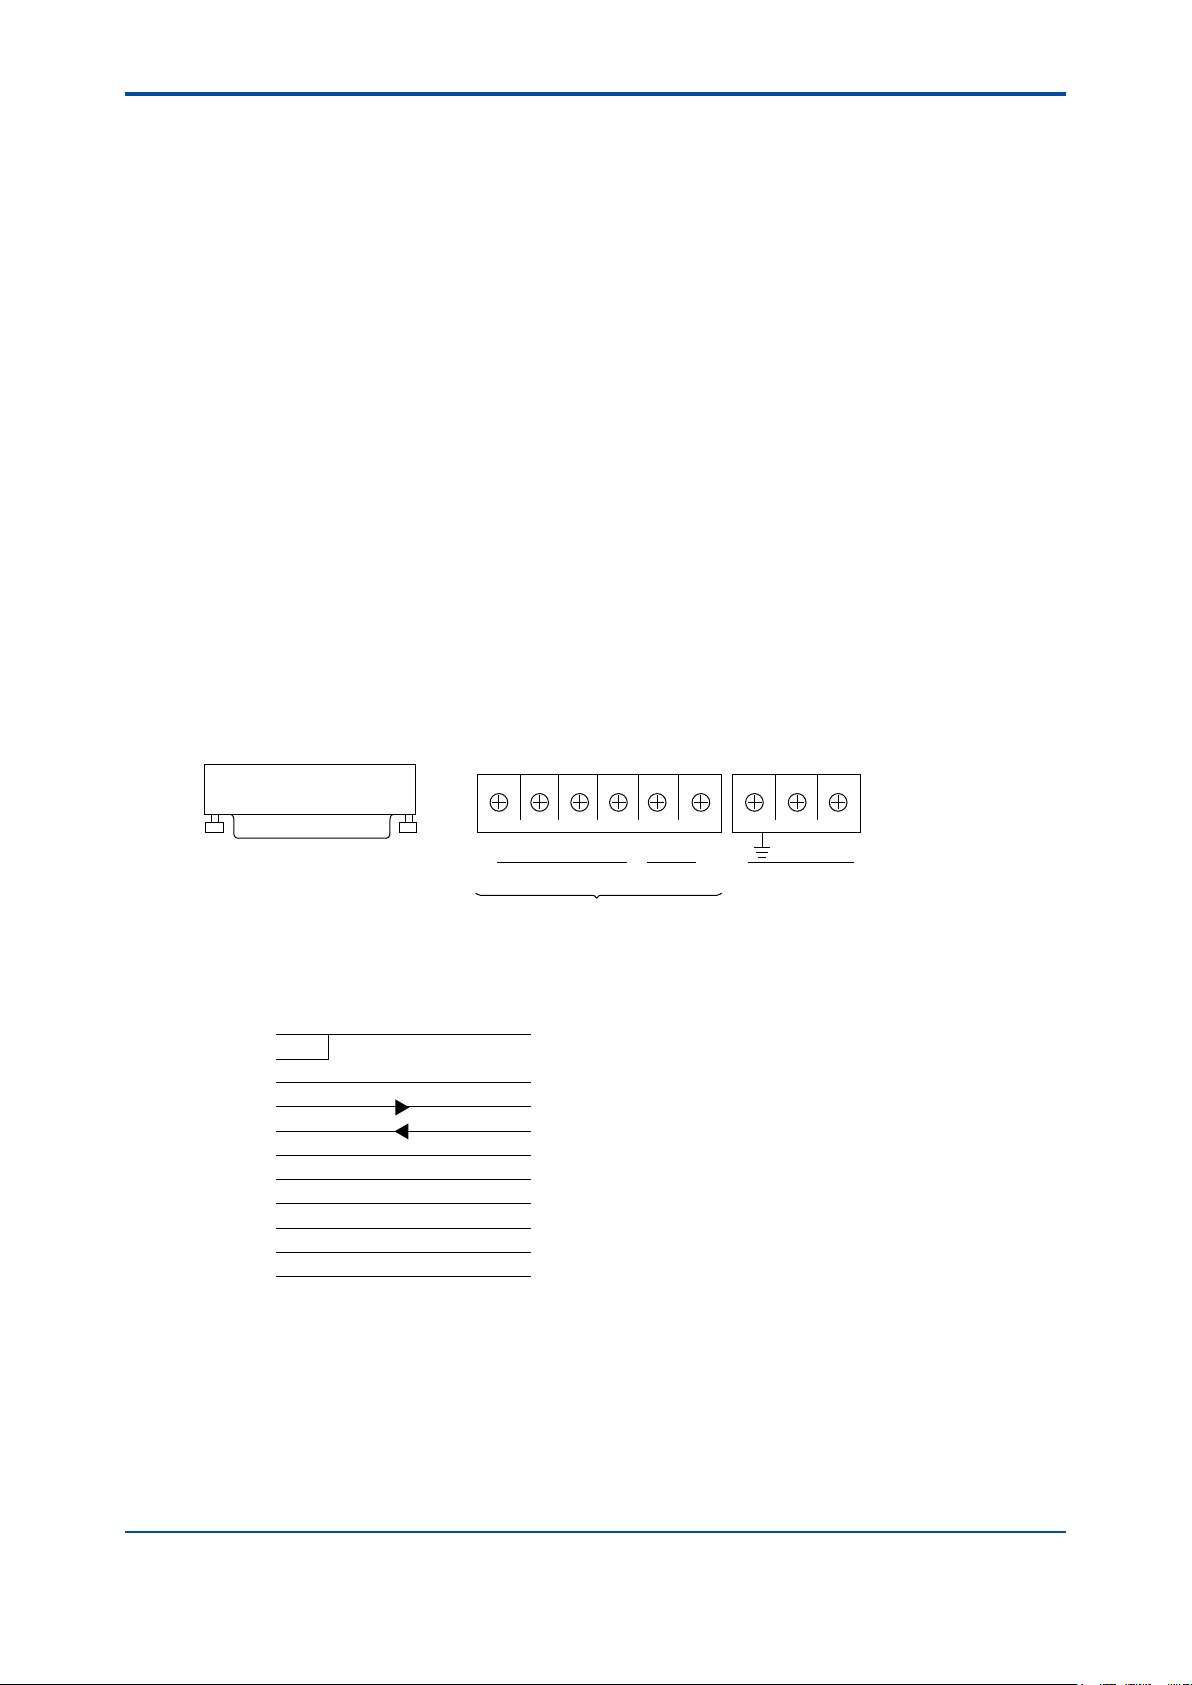
l Terminal Arrangement (common for K9404LA, K9404LD)
D-SUB female 25 pins Terminal: M4
RS-232C
CN1
SDA SDB RDA RDB
RS-422 D/I 12V
from the GC1000 analyzer
+ – N L
AC power supply
l PC Communication Cable (Straight type)
Internal wiring
GND
FG
1
CD
8
RD
3
SD
2
ER
20
SG
7
DR
6
RS
4
CS
5
CI
22
K9404LA Personal computer
GND
1
2
3
4
5
6
7
8
9
CD
RD
SD
ER
SG
DR
RS
CS
CI
F12.ai
CN2 CN3
F10.EPS
IM 11B03G03-03E
4th Edition : Mar. 21, 2012-00
Page 17
<Installing the Maintenance Terminal>
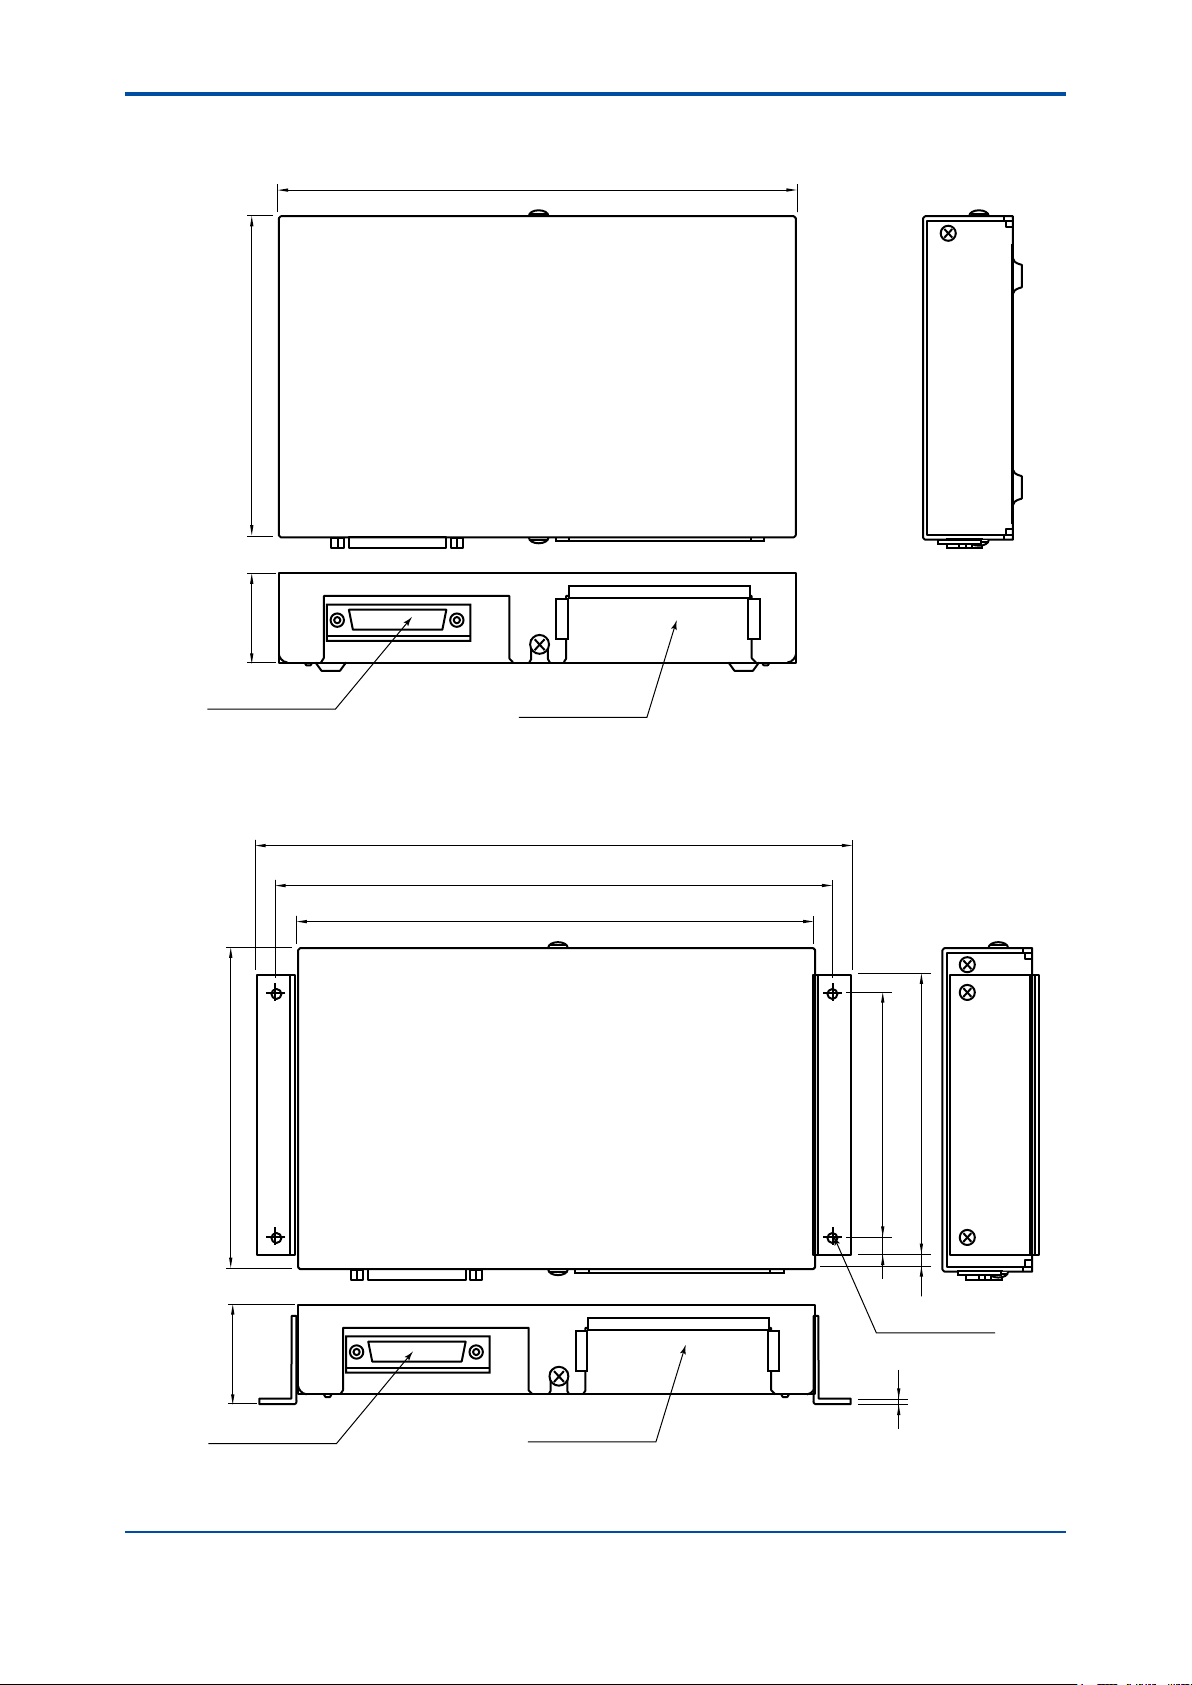
l External Dimensions (K9404LA)
10
12635
RS-232C
D-SUB 25P Socket
203
RS-422, D/I 12 V
Power supply
Unit: mm
Weight: approximately 2 kg
F11.ai
l External Dimensions (K9404LD)
233
218
203
126
40
110
967
5
4-ø4.5
Mounting holes
1.6
Unit: mm
RS-232C
D-SUB 25P Socket
RS-422, D/I 12 V
Power supply
Weight: approximately 2 kg
K9404LD.ai
IM 11B03G03-03E 4th Edition : Mar. 21, 2012-00
Page 18
<Installing the Maintenance Terminal>
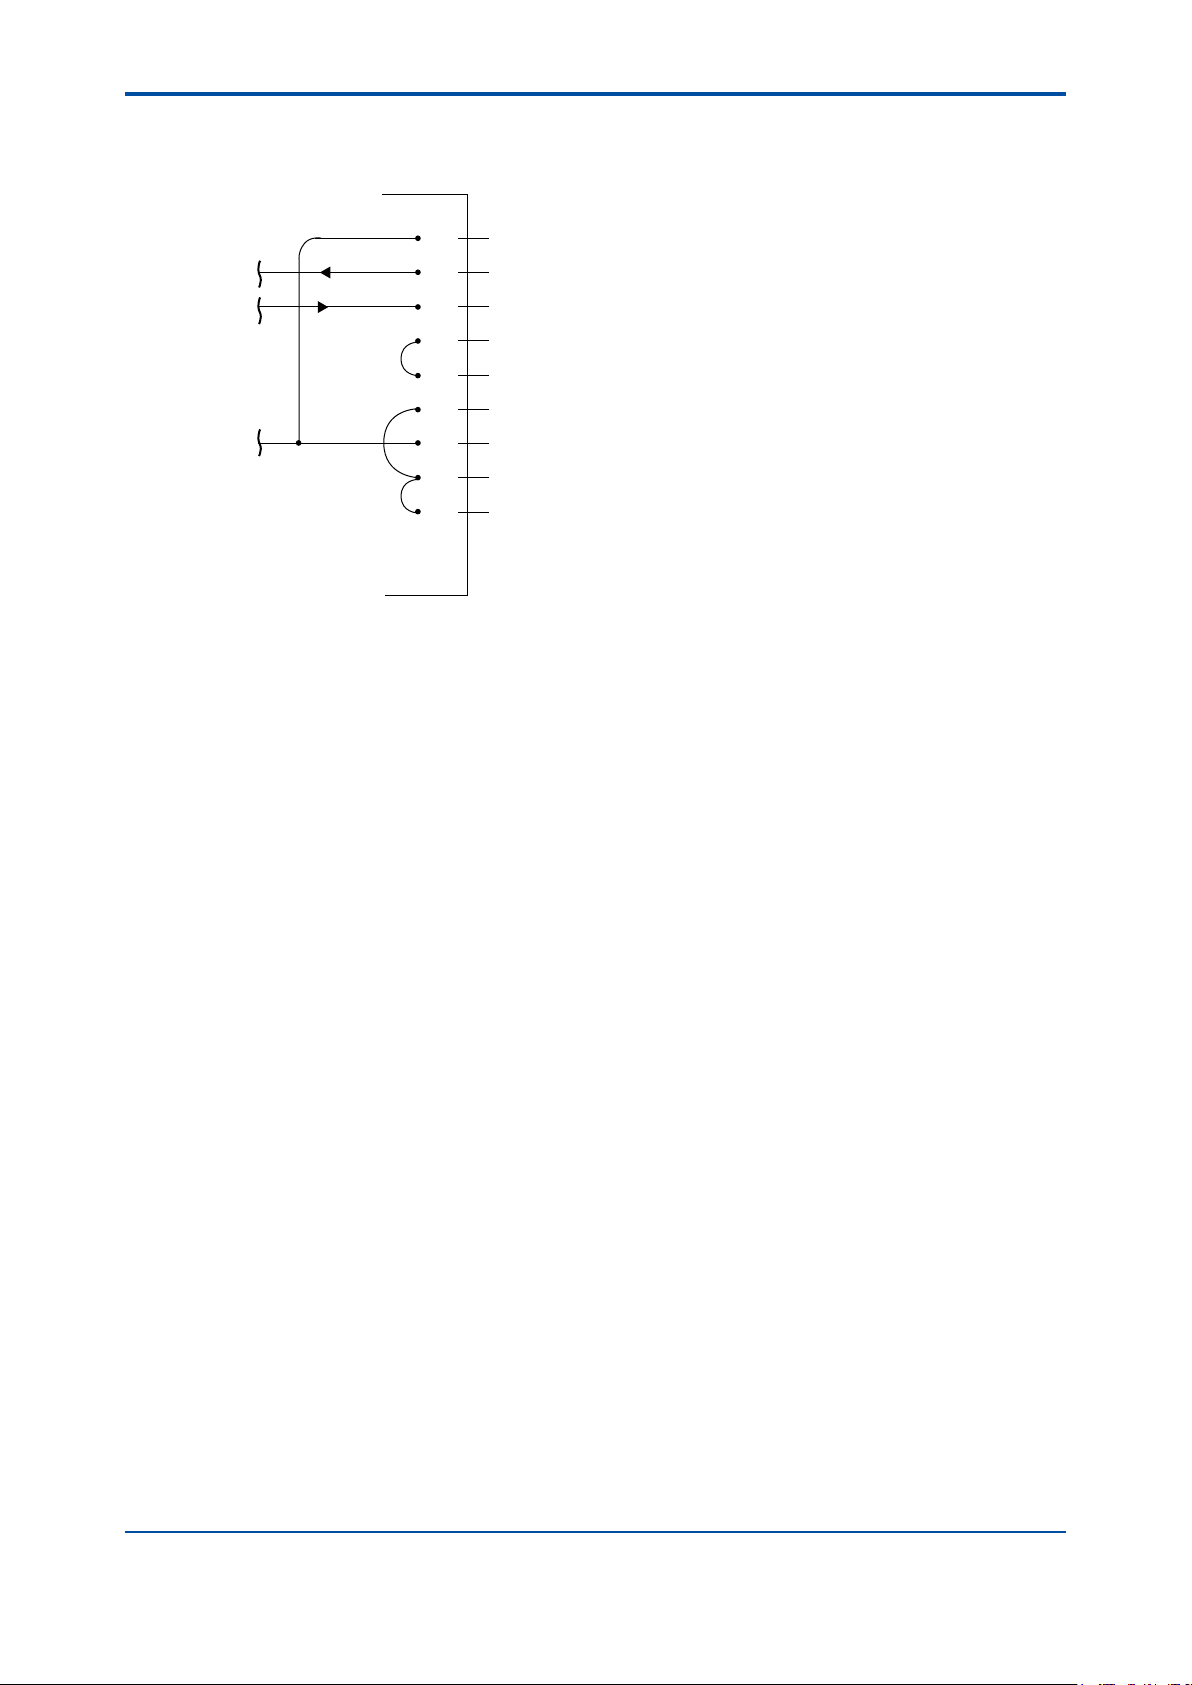
l Terminal RS-232C: Wiring in the inside of converter (K9404LA, K9404LD)
11
RS-232C
Other pins are open.
Wiring in the inside of converter
FG
1
SD
2
RD
3
RS
4
CS
DR
SG
CD
ER
5
6
7
8
20
Outside
RS-232C.ai
.
IM 11B03G03-03E
4th Edition : Mar. 21, 2012-00
Page 19

Blank Page
Page 20
<1. Overview of Maintenance Terminal>
1-1
1.
Overview of Maintenance Terminal
This chapter provides an overview of the Maintenance Terminal and basic information
required to operate the package.
1.1 How the Maintenance Terminal Works
In this section, you will learn how the Maintenance Terminal software package works before you
start using it.
n What Is the Maintenance Terminal?
The Maintenance Terminal (GCMT) is a software package used to monitor and maintain the
GC1000 Mark II analyzer (hereinafter referred to as the “analyzer”) on a personal computer by
linking the computer to the analyzer through a communication line. The gure below illustrates an
overview of the Maintenance Terminal.
Field
GC1000 Mark II
analyzer
RS-422/RS-232C converter
Instrument room/office
Personal computer
Analyzer monitoring and maintenance
Disk Printer
• The Maintenance Terminal reads
chromatograms and analysis
results and saves them on disks.
• The Maintenance Terminal reads
and writes parameter settings.
• The Maintenance
Terminal sends
chromatograms and
analysis results to a
printer.
F0101.ai
n Features of the Maintenance Terminal
The Maintenance Terminal features:
l Remote Operation of LCD Panel
The LCD screen of the analyzer is duplicated onto the CRT screen of your personal computer.
Thus, you can manipulate the LCD screen from a location distant from the eld.
l Analyzer Operation Window Presenting an Overall View
The current operation mode, valve and detector statuses, and a chromatogram are displayed in
one window (Analyzer Operation window). This gives a convenient view of the operating status at
a glance. Just click on an object in the window to change the mode, open and close valves, view
the detailed chromatogram, etc.
l Uploading and Downloading Analyzer Parameter Settings
Parameter settings can be uploaded and downloaded, thus allowing the parameters set on the
LCD panel to be also set in another analyzer.
l Detailed Chromatogram Display and Data Saving
A chromatogram is displayed in two ways: the Analyzer Operation window which shows
an overview of the chromatogram and the Chromatogram window which provides a more
detailed view of it. The Chromatogram window allows zooming, changing scales, and saving of
chromatogram data.
IM 11B03G03-03E
4th Edition : Mar. 21, 2012-00
Page 21

<1. Overview of Maintenance Terminal>
l Analysis Data Accumulation and Graph Creation
The results of analyses at the analyzer are gathered on an analysis history sheet. One history
sheet can hold the peak names of up to 255 analyses and analysis time data of 250 analyses.
The analysis history sheet can be saved, retrieved or graphed. In addition, the sheet can be
retrieved as a le format in Microsoft Excel™ for further advanced data processing.
l Data Acquisition for Maintenance
Personal computers and Windows™ have been designed with the assumption that they will
be used in a general ofce environment. Therefore, the Maintenance Terminal is aimed for use
on a daily basis in maintaining the analyzer. For continuous monitoring over a long period, it is
recommended that the process instruments be used for analog output, DCS communication and
as an analyzer bus server.
1.2 Maintenance Terminal Group in Program Manager
In this section, you will learn about the types of software composing the Maintenance Terminal
group and the windows conguring the Maintenance Terminal.
1-2
n SoftwareConguration
The Maintenance Terminal is composed of the following ve types of software:
Software Function
LCD emulator (LCD) This software functions independent of the Maintenance Terminal. It can
Maintenance
Terminal (GCMT)
Analysis result panel
(GCANA)
CAPTURE IT!
(CAPTIT)
GC communication
control (GCCOMM)
emulate (i.e., work in the same way as) the analyzer LCD panel, allowing the
operator to control the analyzer panel from a personal computer.
The main section of the Maintenance Terminal software package. It bases most
of its functions on the Analyzer Operation window which allows you to view the
analyzer status and operate the analyzer.
This panel stores the results of analysis. It is started automatically when the
Maintenance Terminal is activated.
This is a tool used to make hard copies. For more details, see the manual for
CAPTURE IT!.
The software used to carry out communication between the analyzer and
GCMT. This software starts up as an icon when LCD and GCMT are started.
The program runs in the background and is always invisible to users.
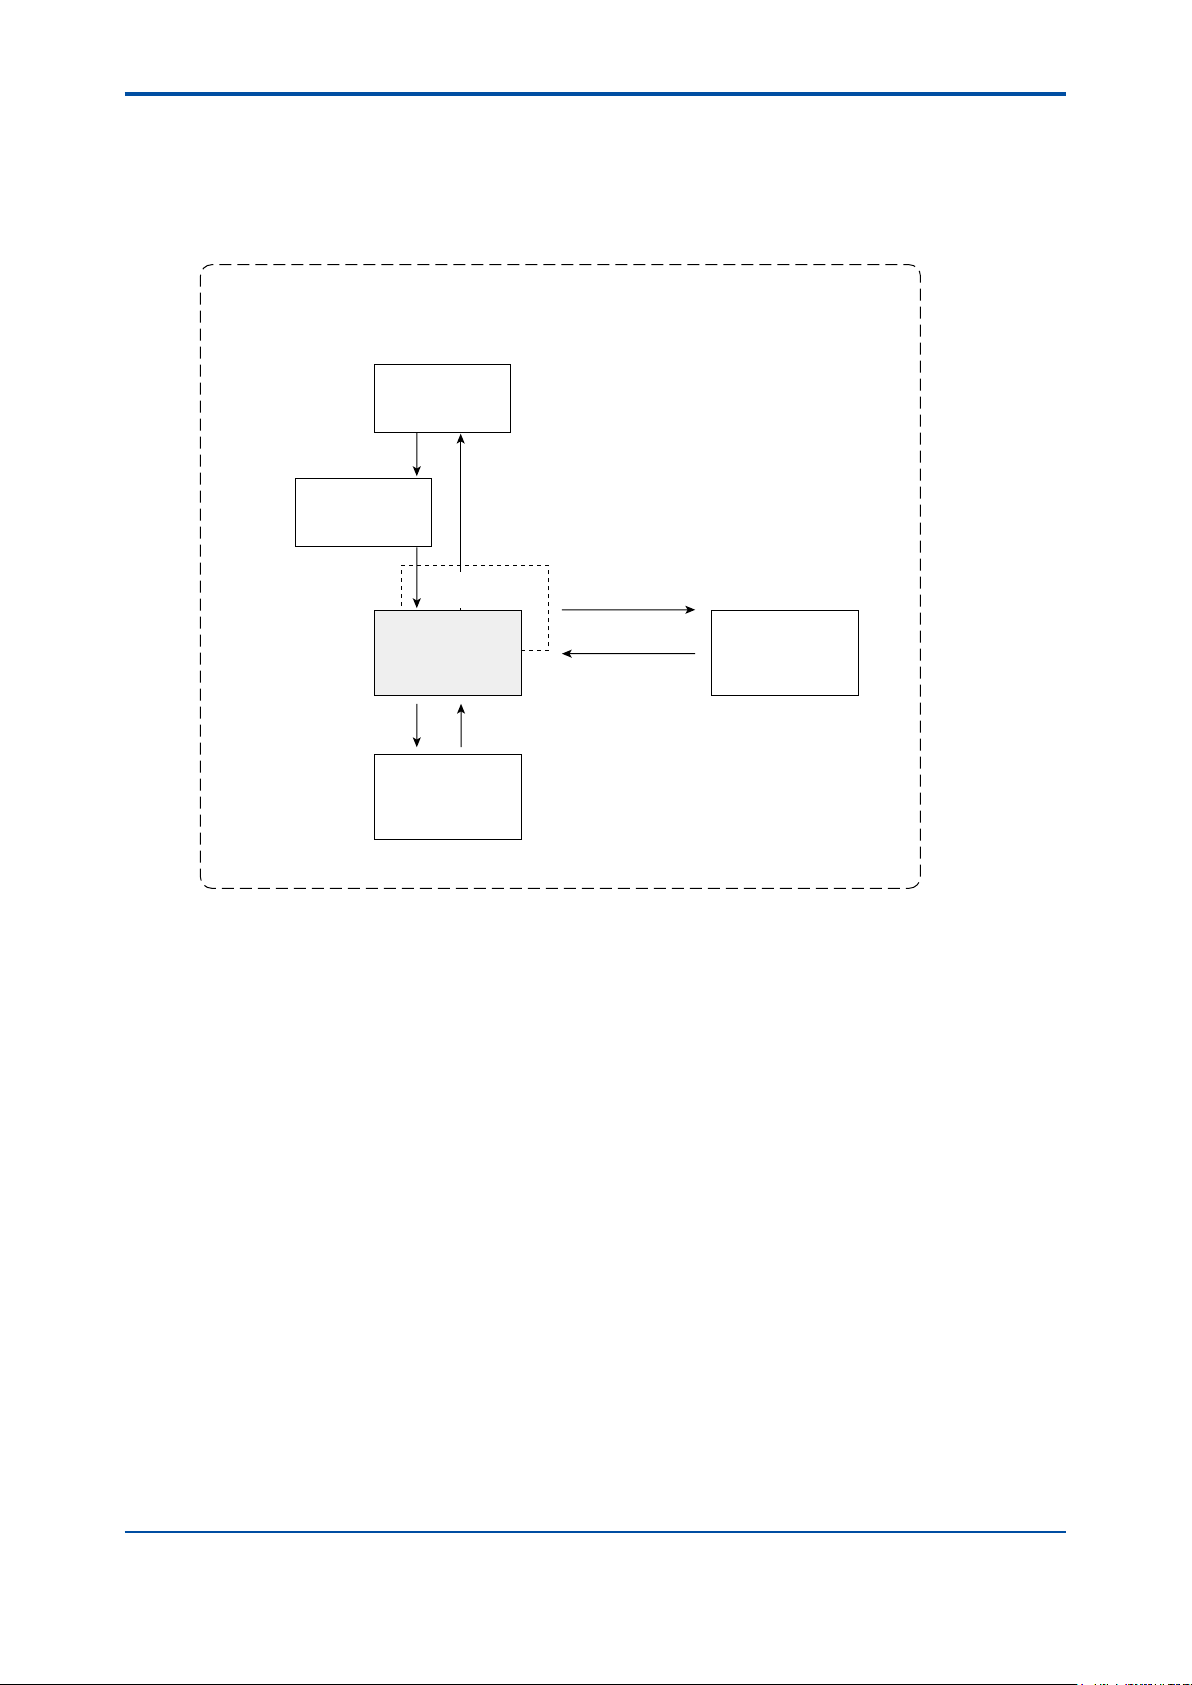
n Maintenance Terminal Window Layout
The Maintenance Terminal is composed of the following four windows:
Window Function
Analyzer Operation The basic Maintenance Terminal window. This displays the analyzer’s latest
Chromatogram Displays chromatograms in detail.
Alarm Displays alarm statuses in the analyzer.
Analysis Results This sheet automatically starts up when the Maintenance Terminal is started.
status and can be used to perform various operations.
It displays the latest analysis results.
IM 11B03G03-03E
4th Edition : Mar. 21, 2012-00
Page 22

<1. Overview of Maintenance Terminal>
The windows are interrelated as follows:
Chromatogram
window
Alarm Details window
Alarm History window
Analyzer Operation
window
Alarm Status window
Lab Analysis Results
window
Retention Time History
window
Concentration Analysis
History window
Latest Analysis
Results window
Alarm-related windows
Analysis Results window
F0102.ai
n Notes on Use
Note the following when using the LCD emulator and the Maintenance Terminal:
l Use this software with the analyzer in the Remote mode.
1-3
Unless the analyzer is in the Remote mode, you cannot start the LCD emulator. The display
function of the Maintenance Terminal can be used even in the Local mode. But if it is operated, a
message appears informing the user that operation is not accepted.
l The LCD emulator and Maintenance Terminal cannot be started at the same
time.
Therefore, if you want to use the Maintenance Terminal while the LCD emulator is still running,
rst quit the LCD emulator and then start the Maintenance Terminal.
n Notes before turning on the power switch
Please conrm all communication cables have been connected before turning on the power
switch.
Please turn on power switch in order of the GC1000 MarkII, the communication converter
(K9404LA), and personal computer. Please turn off the power switch by the opposite procedure.
n Notes concerning communication cables
Please do not take off or install the communication cables during the power supply turned on.
If it will be done, it may be needed to turn on the main power again because of communication
error when the GCMT is used next time.
IM 11B03G03-03E
4th Edition : Mar. 21, 2012-00
Page 23
<1. Overview of Maintenance Terminal>
1.3 Notes Before Use
The Maintenance Terminal is a software package which runs under Windows™. In this section,
you will learn basic operations common to the Windows™ software.
n Mouse
A mouse is used to work with the Maintenance Terminal.
l Basic Mouse Operations
The mouse cursor ( ) in the window moves as you move the mouse. Place the mouse cursor on
an item you want to select in a window and click the left mouse button to select it.
l Buttons
There are three ways to press mouse buttons:
Click: Press the left button and immediately remove your nger. Normally, most
clicking operations use the left button, but some may use the right button.
“Click” in this manual means to press the left button.
Double click: Press the left button twice in quick succession.
Drag: Move the mouse from a starting position to an ending position while pressing
down the left button, and then release your nger. This is used, for example, to
select a number of items at once.
1-4
n Window Layout
The gure below illustrates the window layout, using the Analyzer Operation window as an
example.
Minimize buttonTitle barControl menu box
Close button
Menu bar
Border line
IM 11B03G03-03E
F0103.ai
4th Edition : Mar. 21, 2012-00
Page 24
<1. Overview of Maintenance Terminal>
n How to Select Menus
l Menus
The menu bar and control menu box contain menu items necessary in working with the
Maintenance Terminal. A menu is a list of classied functions (commands). From a menu, you
select a command to be executed.
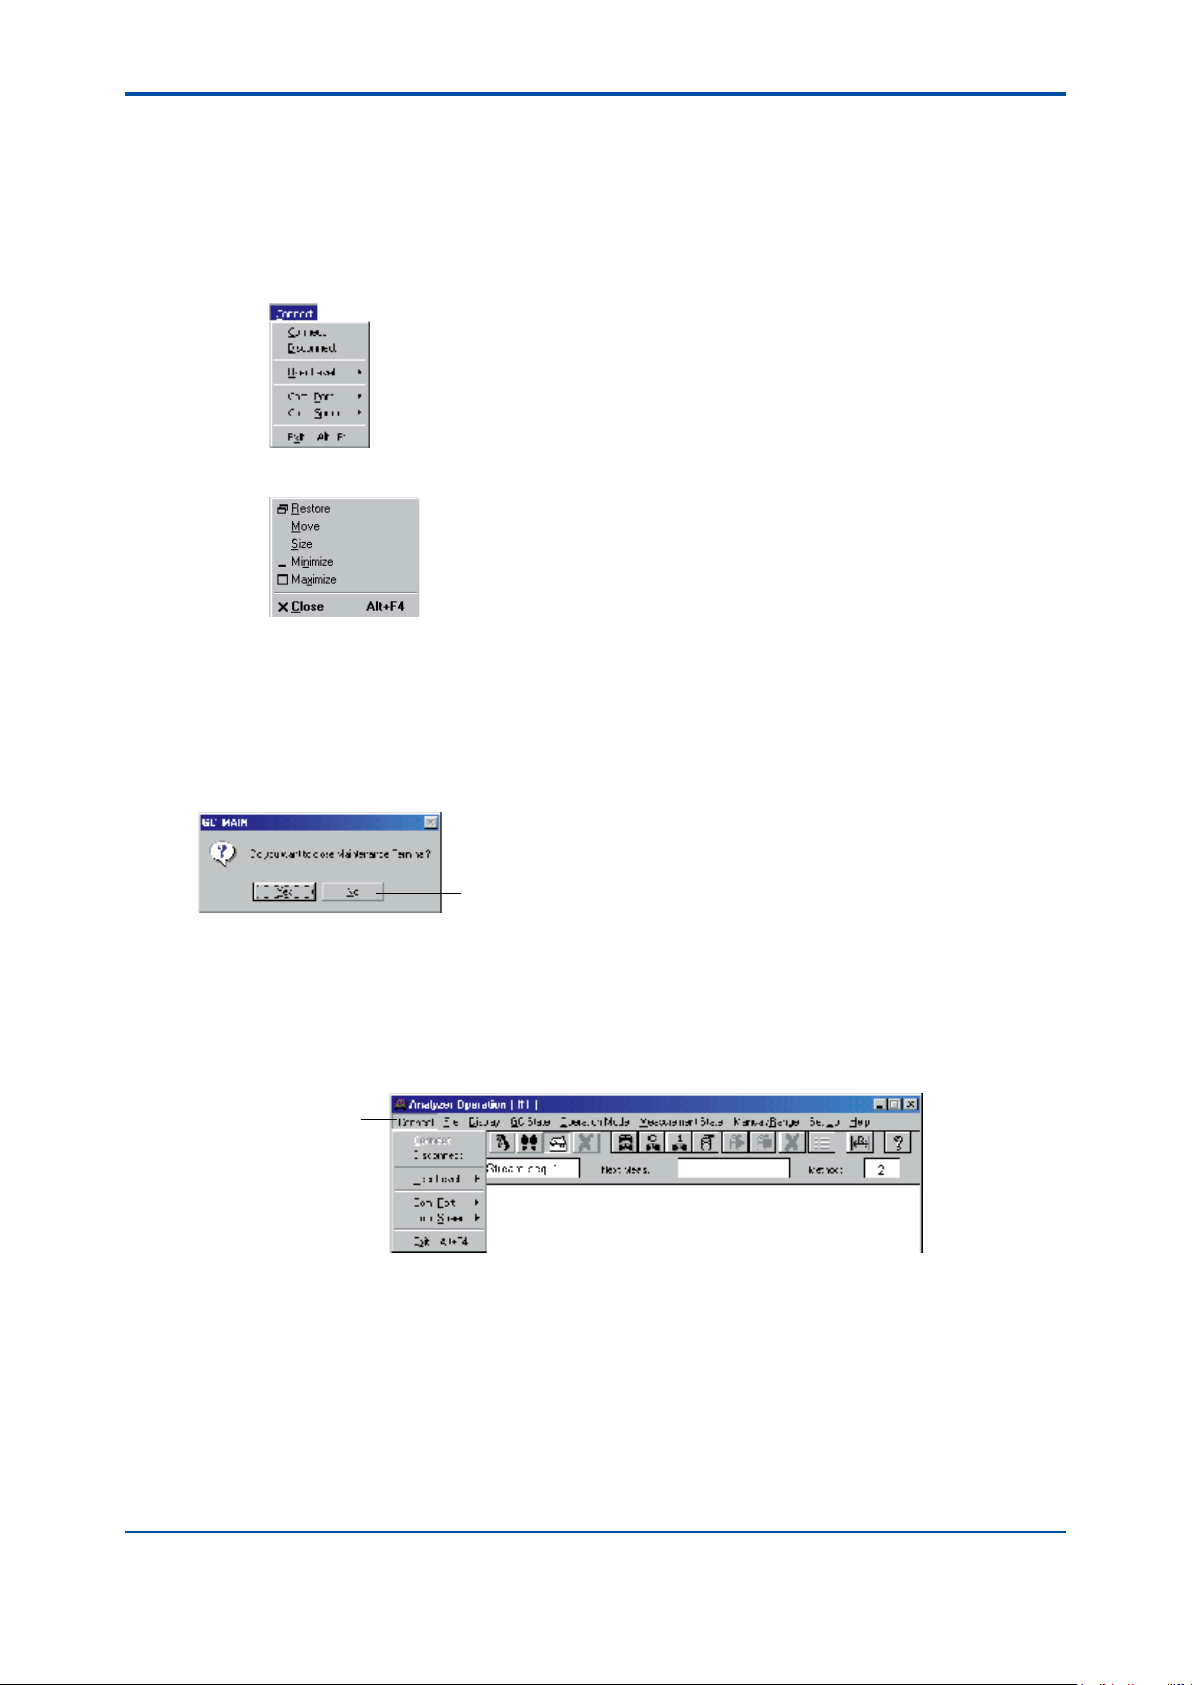
• [Connect]Menu
1-5
F0104.ai
• ControlMenu
F0105.ai
l Dialog Box and Buttons
When you select a command from a menu, a dialog box pops up to ask you to specify details
about the command. Give the details and then select the appropriate button to execute the
command.
DialogBoxtoConrmTermination
Button
F0106.ai
l Procedure
Example: To execute the [Disconnect] command in the Analyzer Operation window:
(1) Click on [Connect] on the menu bar.
The [Connect] menu opens.
Click here.
F0107.ai
• In a menu, selectable commands appear dark.
• The command can also be selected by typing the underlined letter with the [Alt] key held
down.
(2) Click on the [Disconnect] command.
A conrmation dialog box pops up.
(3) Click on the [OK] button.
The Disconnect command is executed.
IM 11B03G03-03E
4th Edition : Mar. 21, 2012-00
Page 25
<1. Overview of Maintenance Terminal>
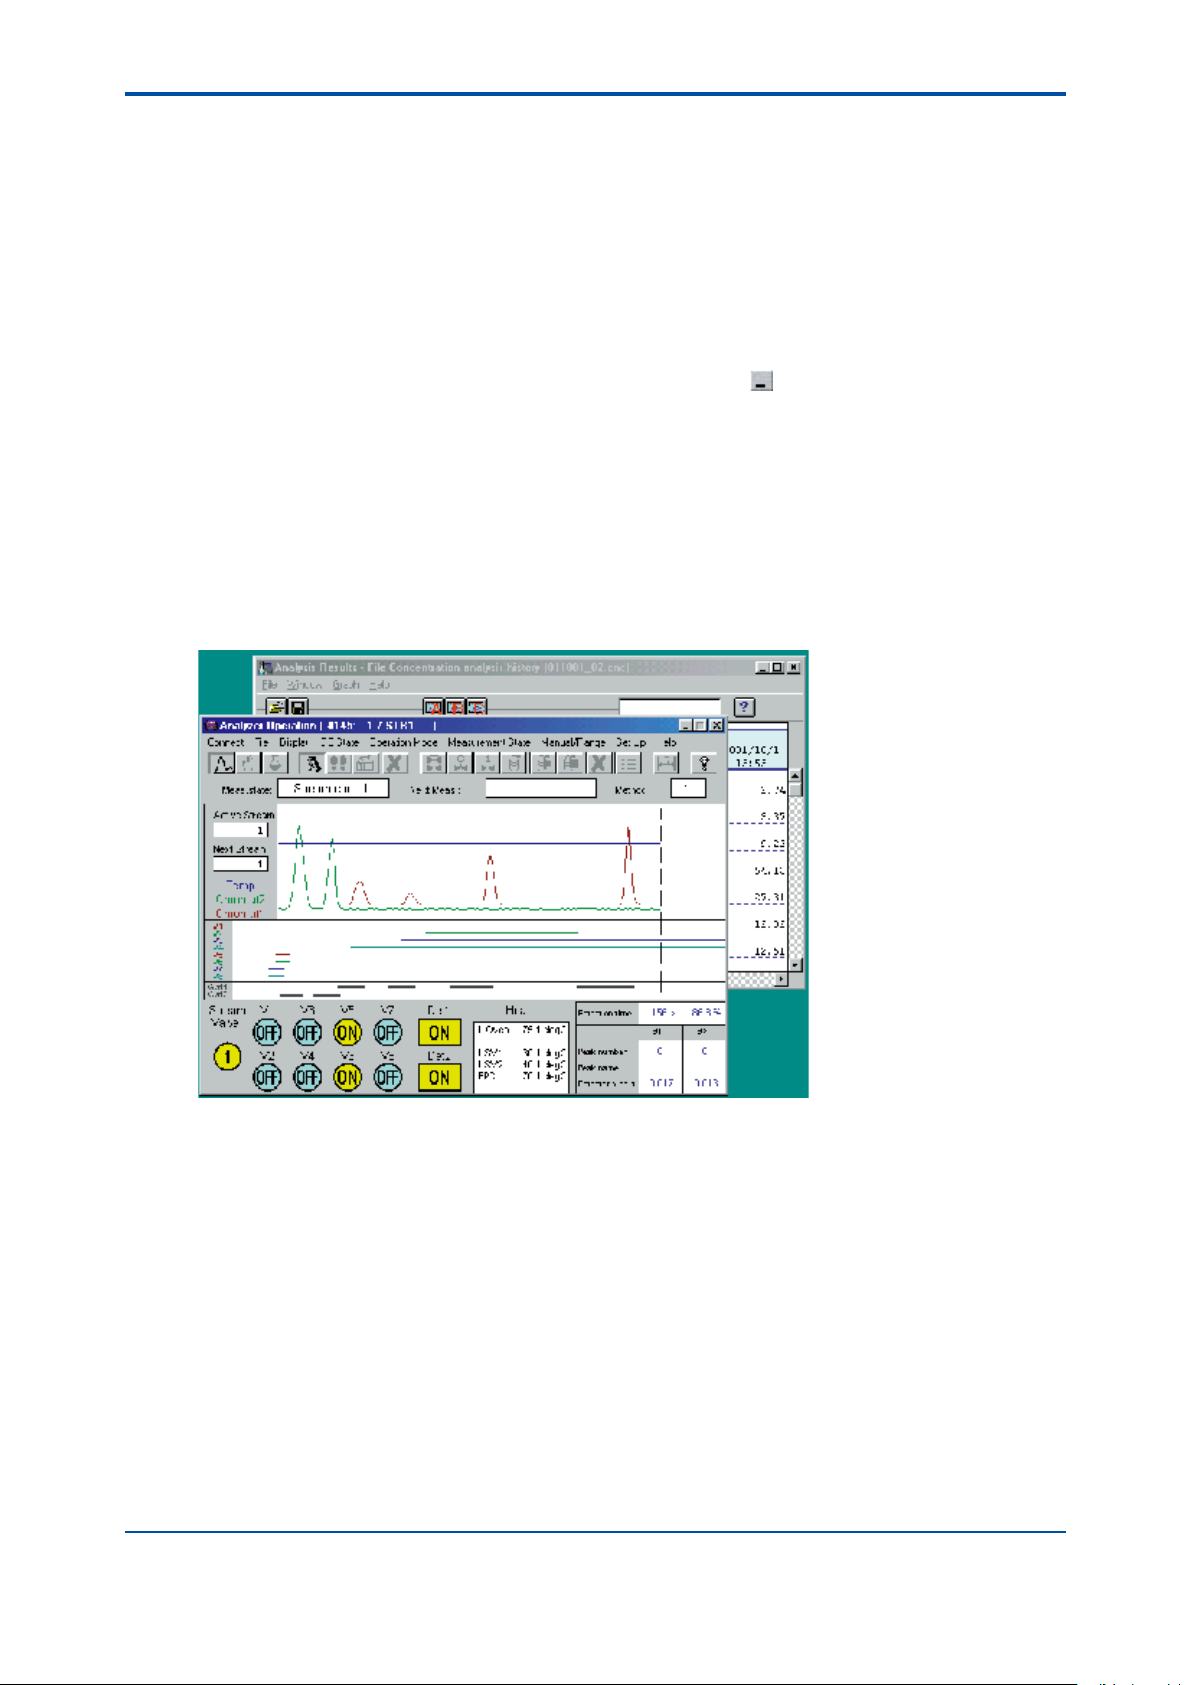
n Multi-windows
The windows of the Maintenance Terminal open in an overlapping manner on top of the Analyzer
Operation window. Thus, you can manipulate the windows properly to view multiple windows at
the same time.
l Window Operation
In a Maintenance Terminal window, the following operations are possible:
Resizing the window: Drag the window boundary. Only the Analysis Results windows and Alarm
windows can be changed in size.
Minimizing a window to an icon: Click on the minimize button (
double-click on the icon.
l Making the Window Active
The window that is currently operational is called the “active window.” The title bar of the active
window appears dark. When more than one window is open, click anywhere within the window
you want to work with. The window you click becomes an active window. You can then work with
the active window only.
l Example of Multi-windows
). To return to the original size,
1-6
F0108.ai
IM 11B03G03-03E
4th Edition : Mar. 21, 2012-00
Page 26
<2. LCD Emulator Window>
2-1
2.
LCD Emulator Window
The LCD emulator reproduces the LCD panel of the analyzer in the Windows™ operating
system.ThescreensandbuttonsontheLCDpaneloftheanalyzerinstalledintheeld
are drawn directly on a Windows™ display, and appear and function exactly the same way
as they do on the LCD panel. This chapter outlines the LCD Emulator window. For details,
see the GC1000 LCD Window Operation Manual, IM 11B03A03-05E.
l Prior to Operation
Before starting the emulator, always make sure that the:
• Maintenance Terminal is installed in your personal computer.
• analyzer and personal computer are linked through a communication line.
• analyzer is in the Remote mode.
2.1 Starting and Exiting the LCD Emulator
This section describes how to start and exit the LCD emulator.
n Starting
When the Maintenance Terminal is running, you cannot start the LCD emulator. Terminate the
Maintenance Terminal before you start the LCD emulator. You also cannot start the LCD emulator
unless the analyzer is in the Remote mode. Note that there is only one window from which the
LCD emulator can be started.
l Procedure
(1) Turn on the power to the personal computer, start up Windows™, and open the
Maintenance Terminal group window of Program Manager.
LCD emulator icon
F0201.ai
IM 11B03G03-03E
4th Edition : Mar. 21, 2012-00
Page 27
<2. LCD Emulator Window>
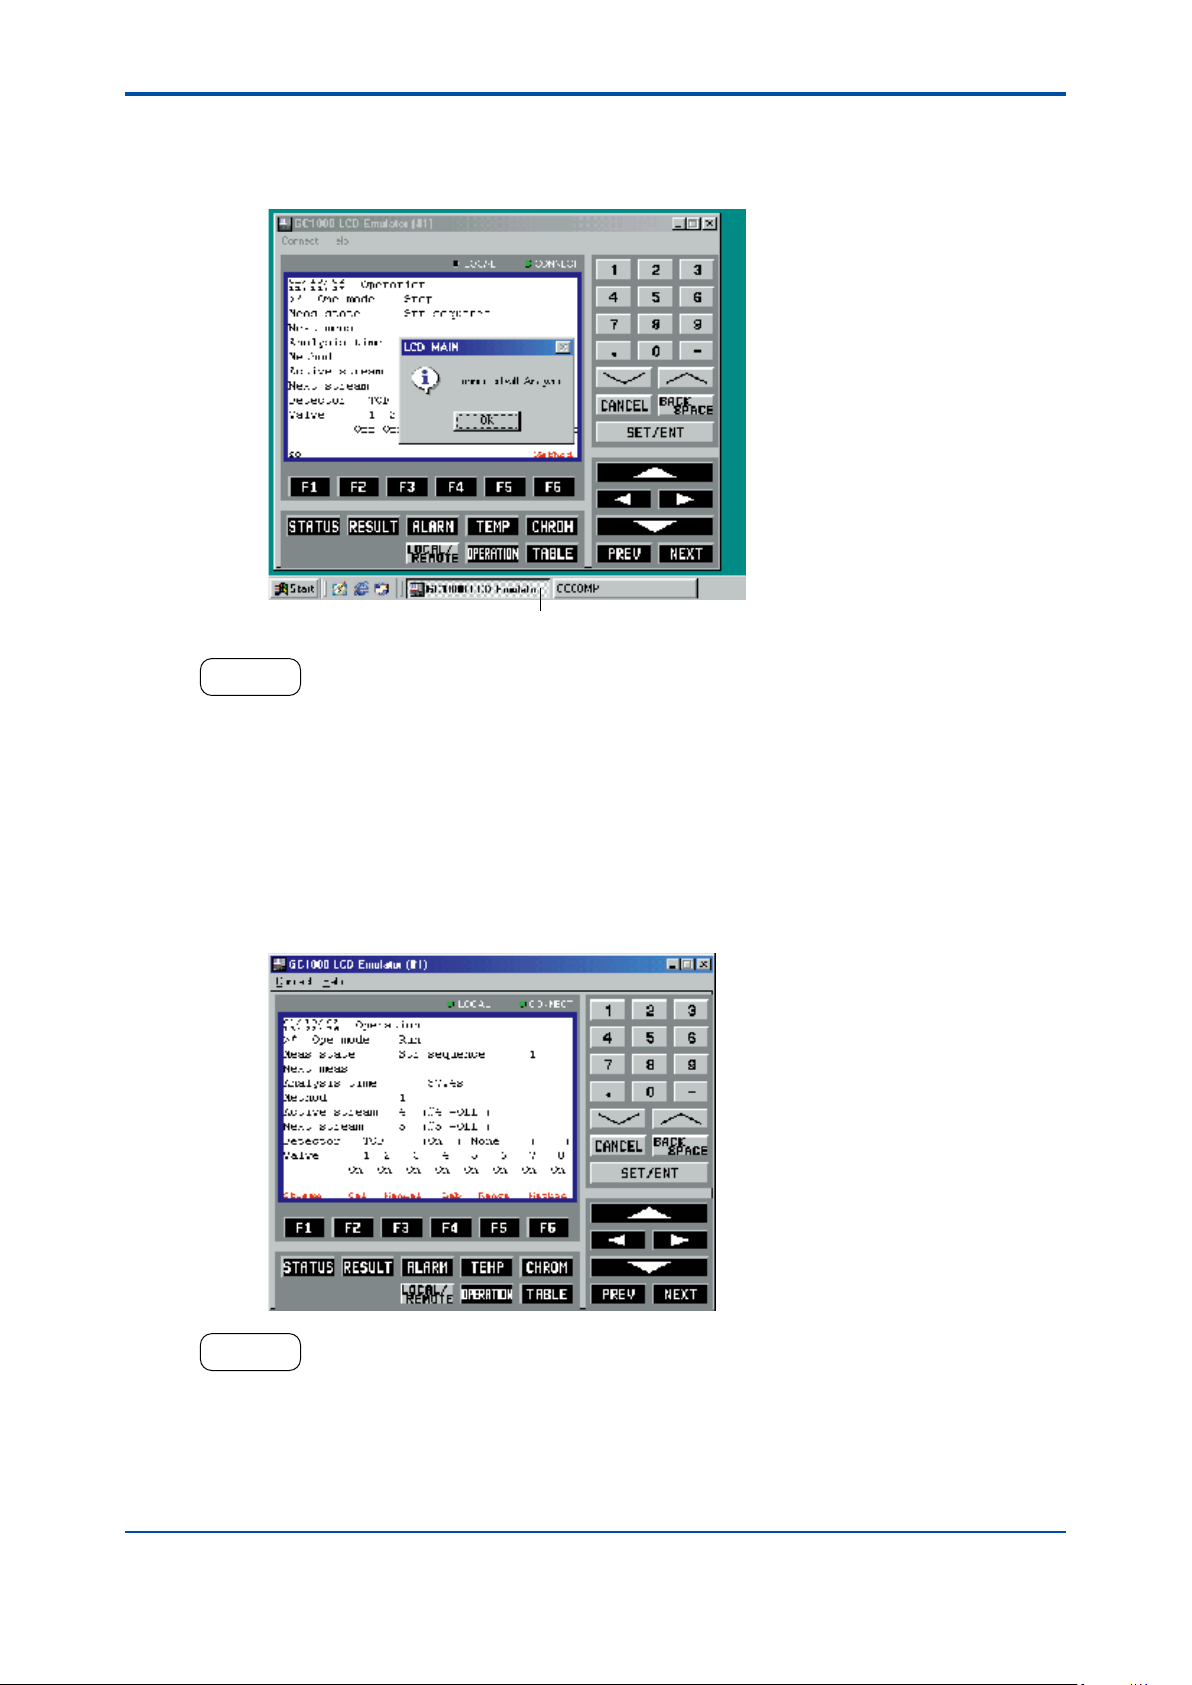
(2) Double-click on the LCD emulator icon.
This establishes a communication link with the analyzer. If the link ends successfully, the
CONNECT lamp of the LCD emulator lights up in green. The dialog box shown below then
pops up.
2-2
F0202.aiThe icon of analyzer communication task.
HELP !
If the window shows the message “Unsuccessful end of connection,” there may be three possible reasons:
(1) The analyzer cannot be connected temporarily via a communication cable due to noise, etc.
Corrective action: Execute the [Connect] command in the [Connect] menu on the menu bar to establish the
connection again via the communication cable.
(2) The analyzer is in the Local mode.
Corrective action: Set the analyzer to the Remote mode on the analyzer’s LCD panel and then connect it
again via the communication cable.
(3) There is a wrong connection in the wiring to the analyzer.
Corrective action: Check the wiring between the analyzer and your personal computer.
(3) Click on the [OK] button. The LCD Emulator window opens.
F0203.ai
HELP !
When the message “Exit command is received” appears in the LCD emulator window, establish a communication
link with the analyzer using the [Connect] command on the [Connect] menu after you have nished panel
operation on the analyzer.
IM 11B03G03-03E
4th Edition : Mar. 21, 2012-00
Page 28
<2. LCD Emulator Window>
n Exiting
l Procedure
(1) Click on the [Exit] command in the [Connect] menu.
A dialog box pops up asking you to conrm the termination of the LCD emulator.
2-3
F0204.ai
(2) Click on the [Yes] button.
Communication with the analyzer is dropped and the LCD emulator terminates.
(3) Either run other software or terminate Windows™, and then turn off the power.
2.2 Basic Operations
The LCD Emulator window is exactly the same as the LCD panel both in appearance
and function. Buttons in the window can be operated by using the mouse, or by pressing
corresponding keys on the keyboard.
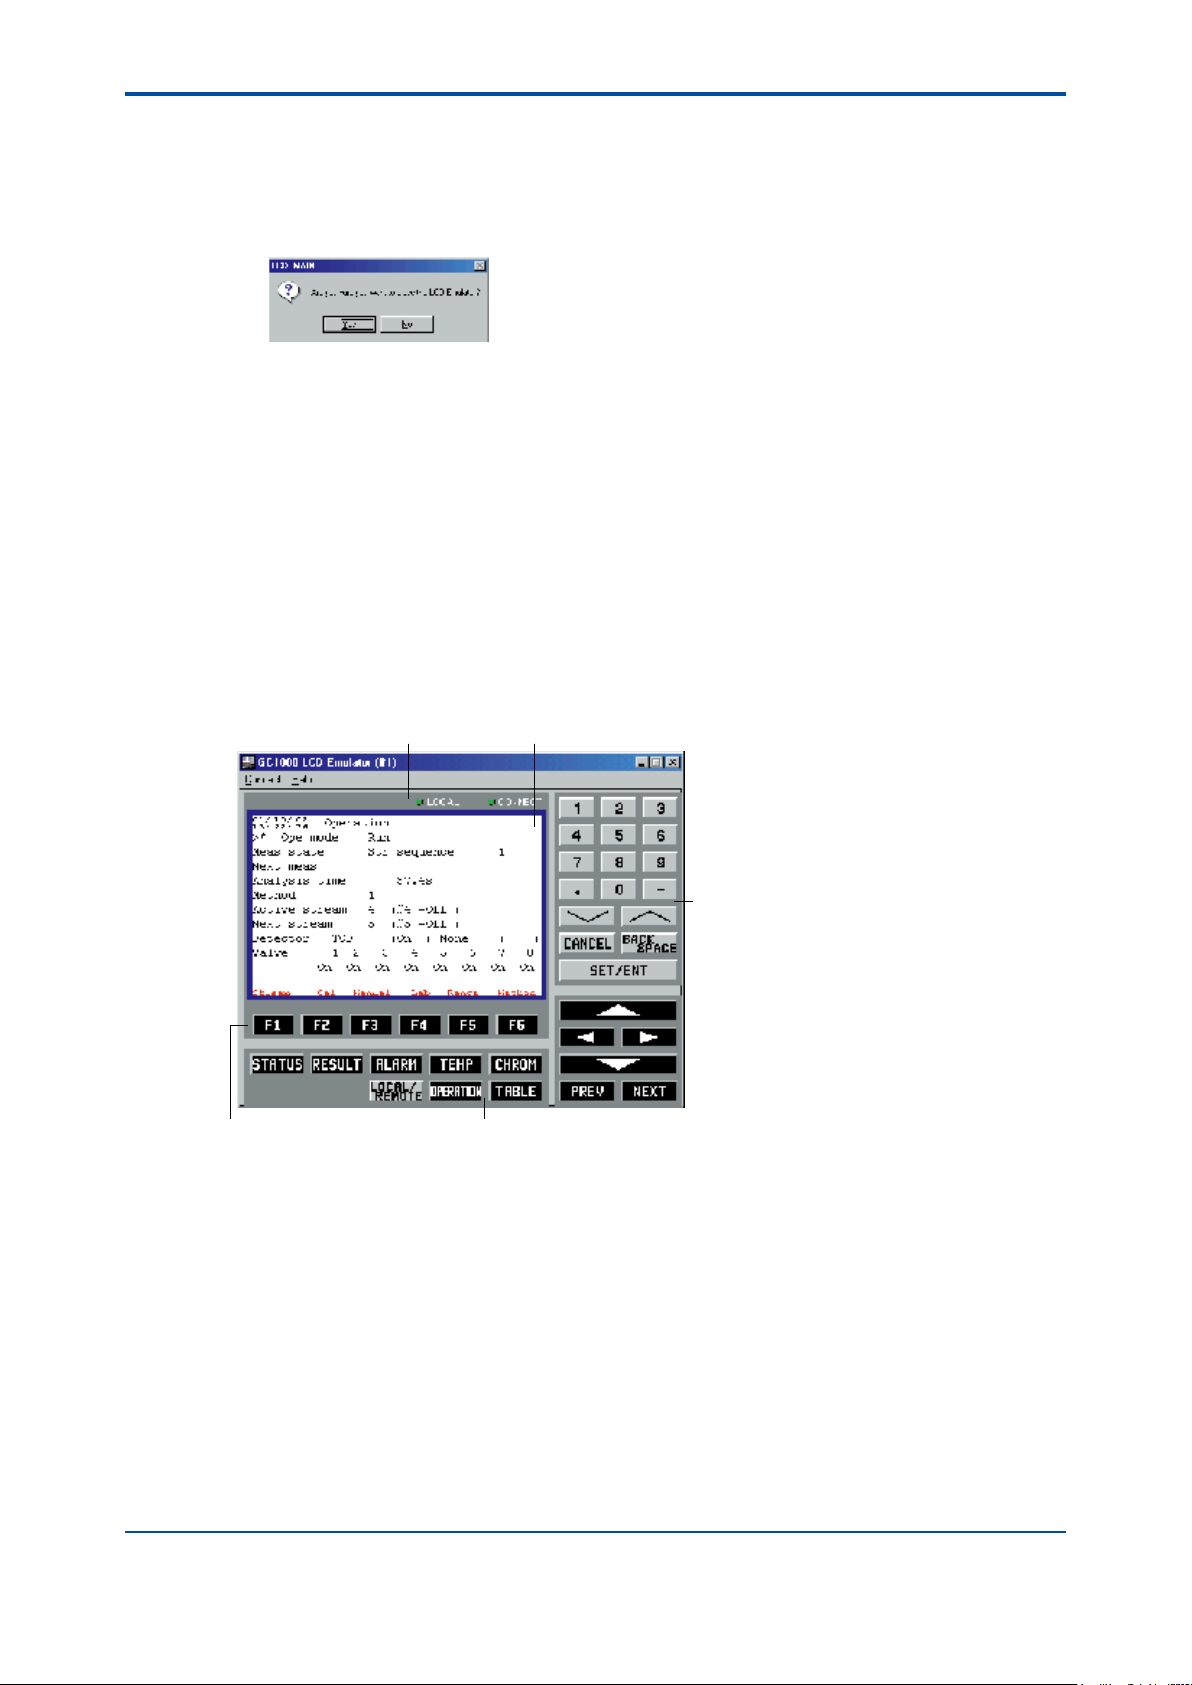
n Window Layout
The following gure shows the LCD Emulator window layout.
LED display area LCD display area
Setting keys
Function keys
n Window Operation
l Mouse Operation
Place the mouse cursor on the key to be operated and click the left mouse button. This allows the
same key operations as ones on the LCD panel.
l Keyboard Operation
Each window key corresponds to the keys on the keyboard, as shown in the following table.
Pressing these keys allows the same key operations as ones on the LCD panel.
Window switching keys
F0205.ai
IM 11B03G03-03E
4th Edition : Mar. 21, 2012-00
Page 29

<2. LCD Emulator Window>
Window Keys and Corresponding Keys on Keyboard
Window Keys Keyboard Equivalents
Function
[F1] to [F6] [F1] to [F6]
keys
Window
switching
keys
Setting
keys
[STATUS]
[RESULT]
[ALARM]
[TEMP]
[CHROM]
[LOCAL/REMOTE]
[OPERATION]
[TABLE]
Alphanumeric keys
[^] [v]
[CANCEL]
[BACK SPACE]
[SET/ENT]
[^] [<] [>] [v]
[PREV]
[NEXT]
[SHIFT] + [F1]
[SHIFT] + [F2]
[SHIFT] + [F3]
[SHIFT] + [F4]
[SHIFT] + [F5]
[SHIFT] + [F6]
[SHIFT] + [F7]
[SHIFT] + [F8]
Alphanumeric keys
[Page Down] [Page Up]
[ESC]
[BACK SPACE]
[ENTER]
Cursor keys
[CTRL] + [P]
[CTRL] + [N]
2-4
IM 11B03G03-03E
4th Edition : Mar. 21, 2012-00
Page 30
<3. Analyzer Operation Window>
3-1
3.
Analyzer Operation Window
The Analyzer Operation window opens when the Maintenance Terminal is started. This
chapter explains how to open and close this window, how the window is composed, how
to change the operation status, and how to upload and download parameter settings.
Windows™ Hierarchy
Program Manager
Maintenance
Terminal group
window
Startup
Initial Database
Loading window
Analyzer
Operation window
Termination
Analysis Results
window *1
[Alarm Status] or
[Alarm History]
command
Alarm window
[Close] command
[Chromatogram] menu [Exit] command
Chromatogram
window
*1: Appears as an icon
F0301.ai
l Prior to Operation
Before starting up the Maintenance Terminal, always make sure that the:
• Maintenance Terminal has been installed properly in your personal computer.
• analyzer has been connected to your personal computer properly via a communication
cable.
IM 11B03G03-03E
4th Edition : Mar. 21, 2012-00
Page 31
<3. Analyzer Operation Window>
3.1 Starting and Exiting the Maintenance Terminal
This section describes how to start and exit the Maintenance Terminal.
n Starting
While the LCD emulator is running, you cannot start the Maintenance Terminal. Exit the LCD
emulator before you start the Maintenance Terminal. You also cannot start the Maintenance
Terminal unless the analyzer is in the Remote mode. Note that there is only one window from
which the Maintenance Terminal can be started.
l Procedure
(1) Turn on the power to the personal computer, start up Windows™, and open the
Maintenance Terminal group window of Program Manager.
3-2
Maintenance
Terminal icon
F0302.ai
(2) Double-click on the Maintenance Terminal icon.
This establishes a communication link with the analyzer and the Initial Database Loading
window opens.
Initial database
loading window
Initial database
loading dialog
Analyzer communication task icon
IM 11B03G03-03E
F0303.ai
4th Edition : Mar. 21, 2012-00
Page 32
<3. Analyzer Operation Window>
HELP !
If the message “Unsuccessful end of connection” appears, check the communication line, the serial port number,
and the communication speed, and then try again to establish the communication
(3) The remaining time is counted down during initial-database loading.
• The initial database is the data other than measured values, and comprises xed data that
do not vary with time, such as the number and types of detectors, names of components
to be analyzed, and alarm history data. The Maintenance Terminal functions are not
executable until the initial database is loaded.
• It takes about 60 seconds to load the initial database (when the communication speed
is 38400 bps). If there is no change in the xed data, loading ends in about 10 seconds
because, in that case, only alarm data are loaded.
After loading is completed, the Analyzer Operation window opens. The Analysis Results
window also comes into operation and appears as an icon.
3-3
Analyzer
operation window
Analysis Results window icon
F0304.ai
• The Analyzer Operation window is the parent window in the Maintenance Terminal and must
always be open, irrespective of the type of Maintenance Terminal function being used. The
window can be minimized to an icon with the [Minimize] button.
• It takes a short while for the Analysis Results window to actually open after its startup.
HELP !
If the message “Communication link with the analyzer has been dropped” appears in the Analyzer Operation
window, reestablish a communication link with the analyzer using the [Connect] command in the [Connect] menu
after you have nished panel operation on the analyzer.
n Selecting a Serial Port for Communication
To select a serial port to be used for the communication, use the [Com. Port] command in
the [Connect] menu. From the pop-up menu a usable serial port can be selected. When this
command is executed, the current communication is aborted and then the communication is
started from the specied port.
IM 11B03G03-03E
4th Edition : Mar. 21, 2012-00
Page 33

<3. Analyzer Operation Window>
n Changing the Communication Speed
To change the communication speed between the analyzer and the Maintenance Terminal,
use the [Com. Speed] command in the [Connect] menu. If the analyzer connected is the GC
Mark II, select either 19200 bps or 38400 bps. If the analyzer connected is previous versions,
the communication speed should be 9600 bps. Note that the communication selected here
should be the same as the one set in the analyzer. When this command is executed, the current
communication is aborted and then the communication is started at the specied speed.
n Exiting
The Analysis Results window must be closed in order to exit the Analyzer Operation window.
Even if the Analysis Results window appears as an icon, it is recommended that you open the
window once, save the information or take a relevant action, and then close the window.
l Procedure
(1) Close all the windows except the Analyzer Operation window.
(2) Click on the [Exit] command in the [Connect] menu while the Analyzer Operation window is
open.
A dialog box pops up asking you to conrm termination of the Maintenance Terminal.
3-4
F0305.ai
(3) Click on the [Yes] button.
The communication link with the analyzer is dropped and the Maintenance Terminal
terminates.
(4) Quit Windows™ and turn off the power.
TIP
How to Use the [Disconnect] Command
• If you want to drop the communication link with the analyzer without exiting the Maintenance Terminal, use
the [Disconnect] command in the [Connect] menu.
• This is useful, for example, when using other software. In that case, however, measured values from the
analyzer are not transmitted.
IM 11B03G03-03E
4th Edition : Mar. 21, 2012-00
Page 34
<3. Analyzer Operation Window>
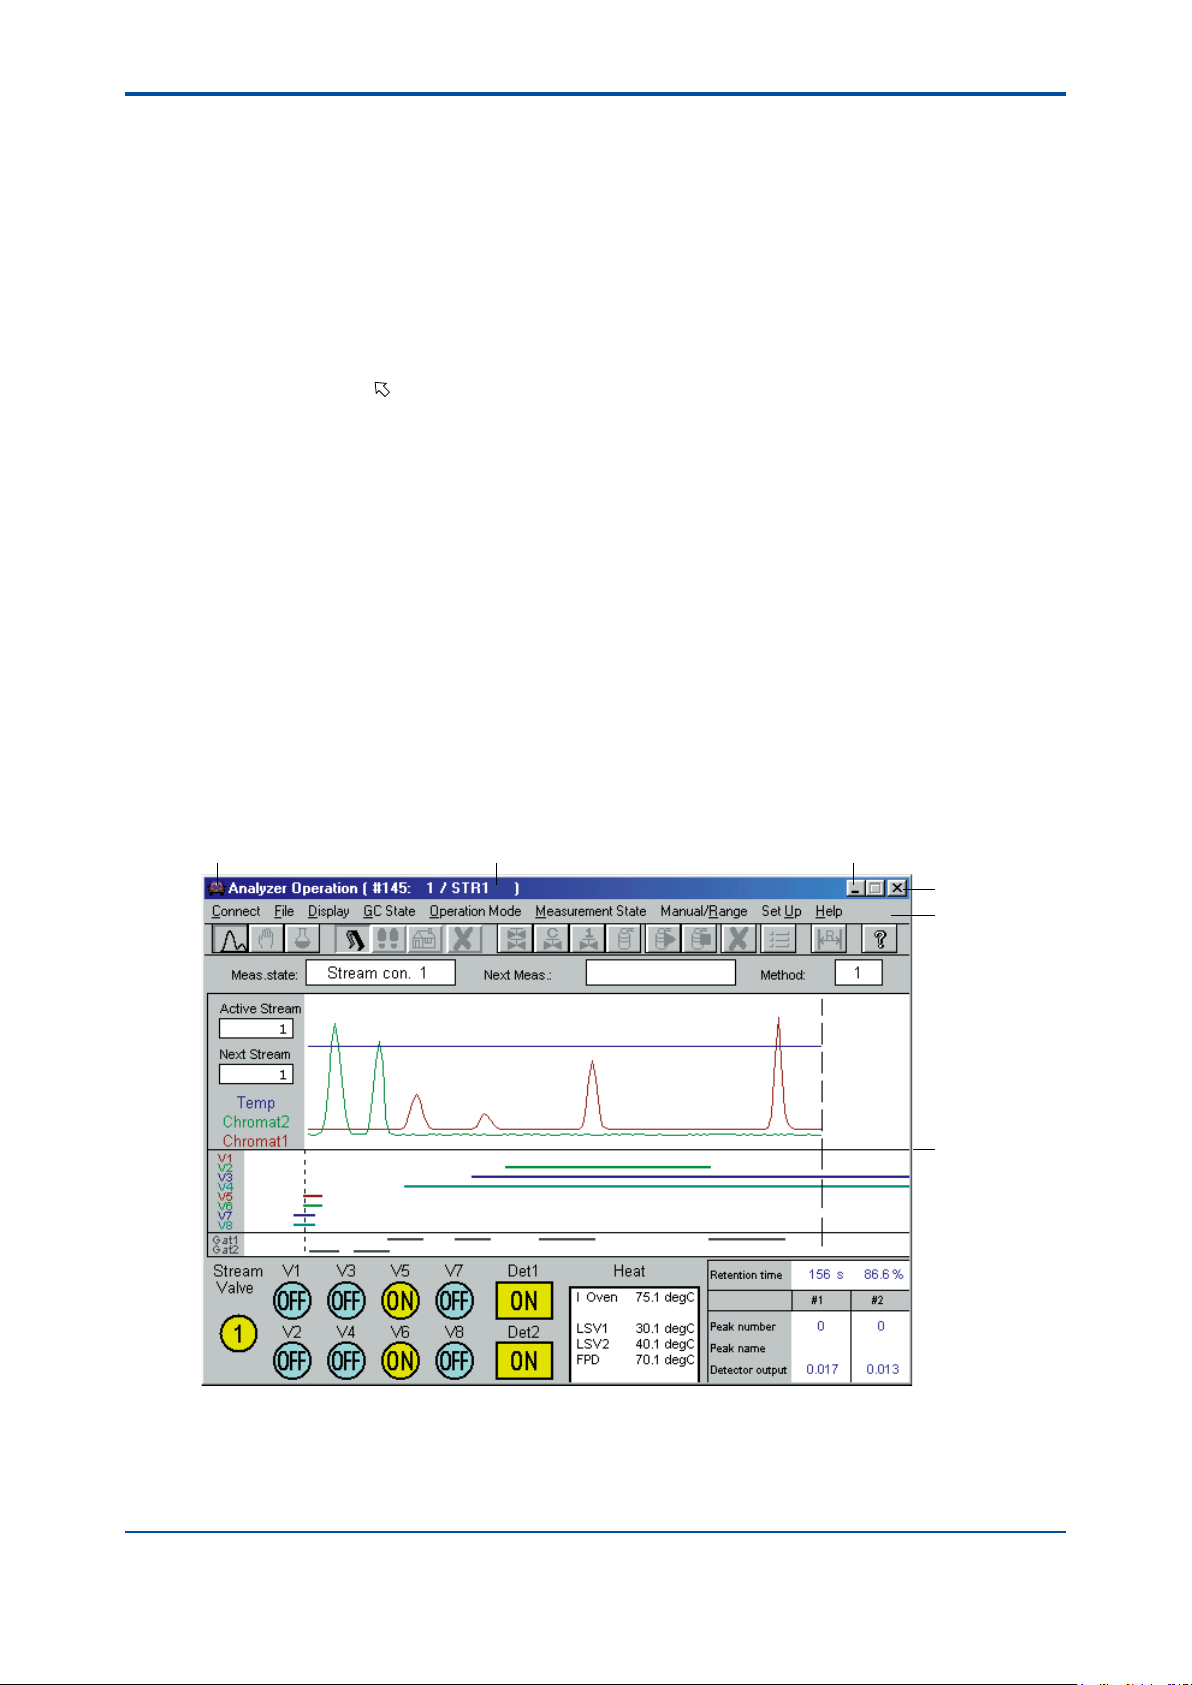
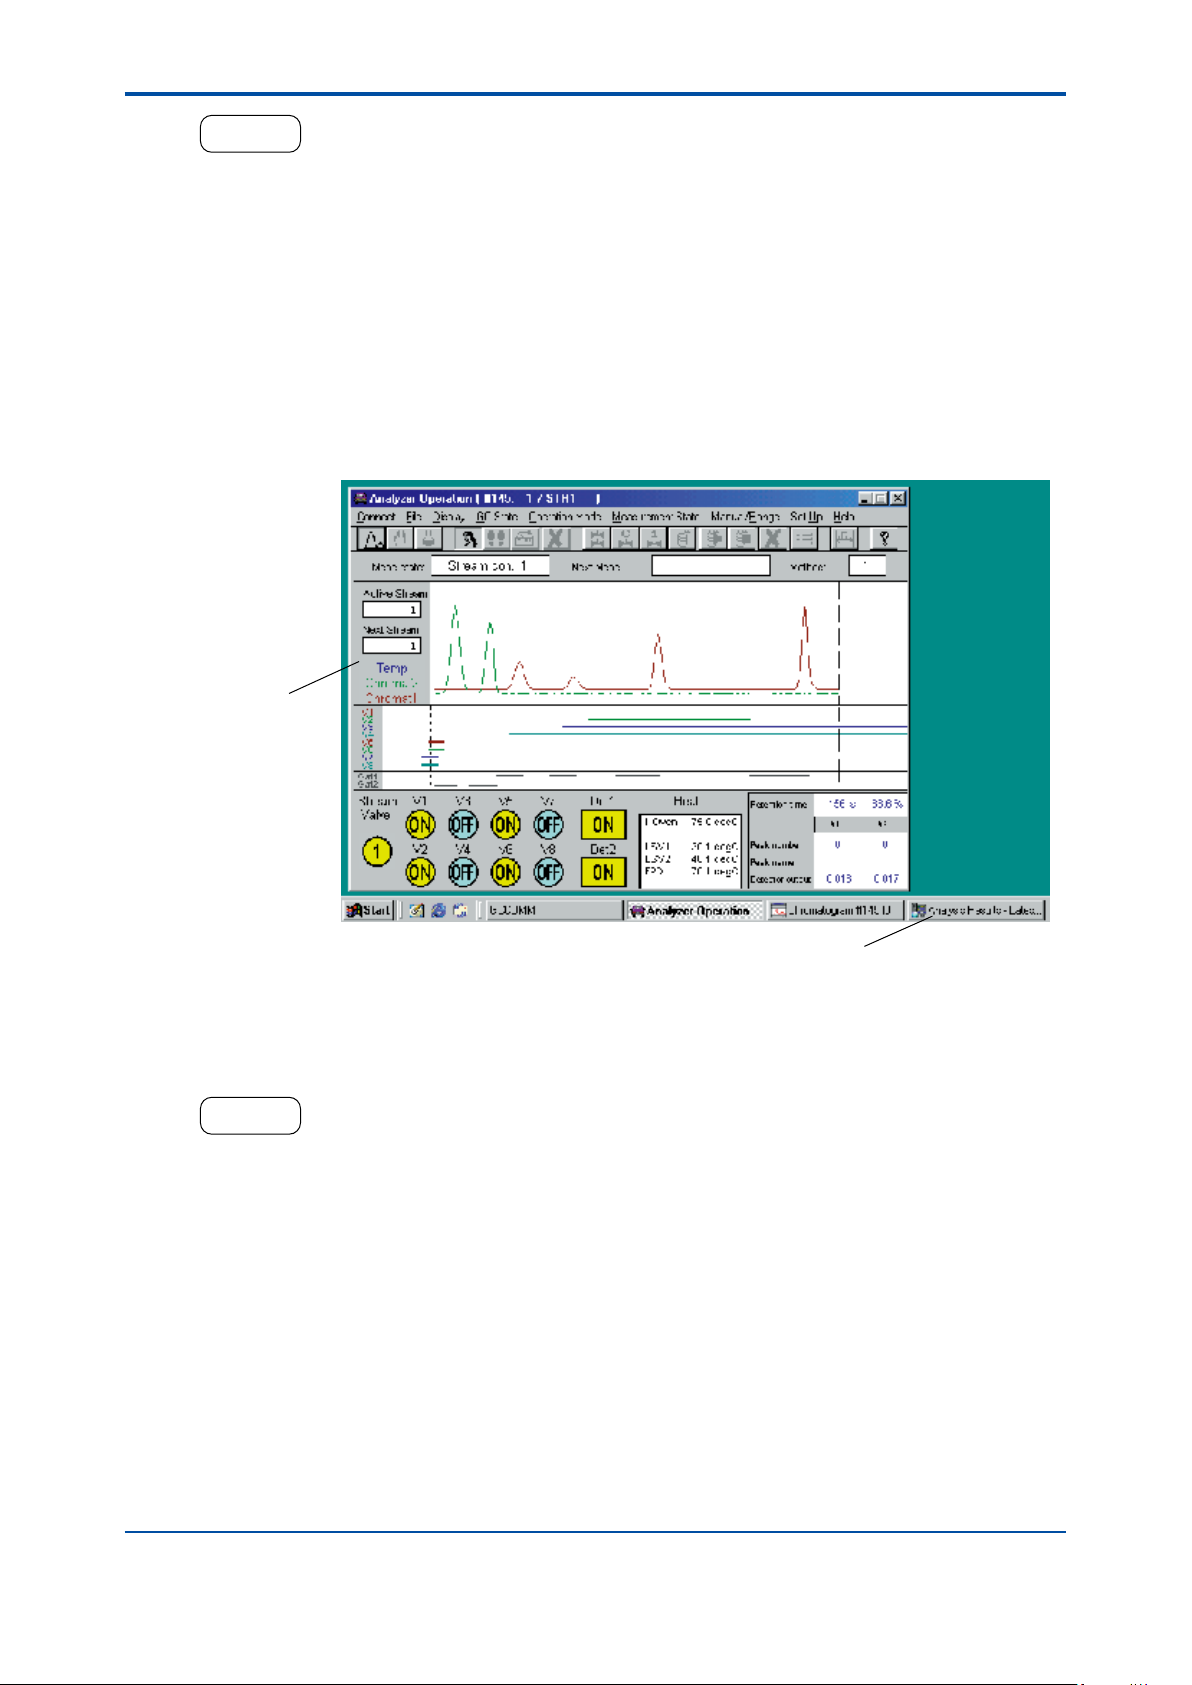
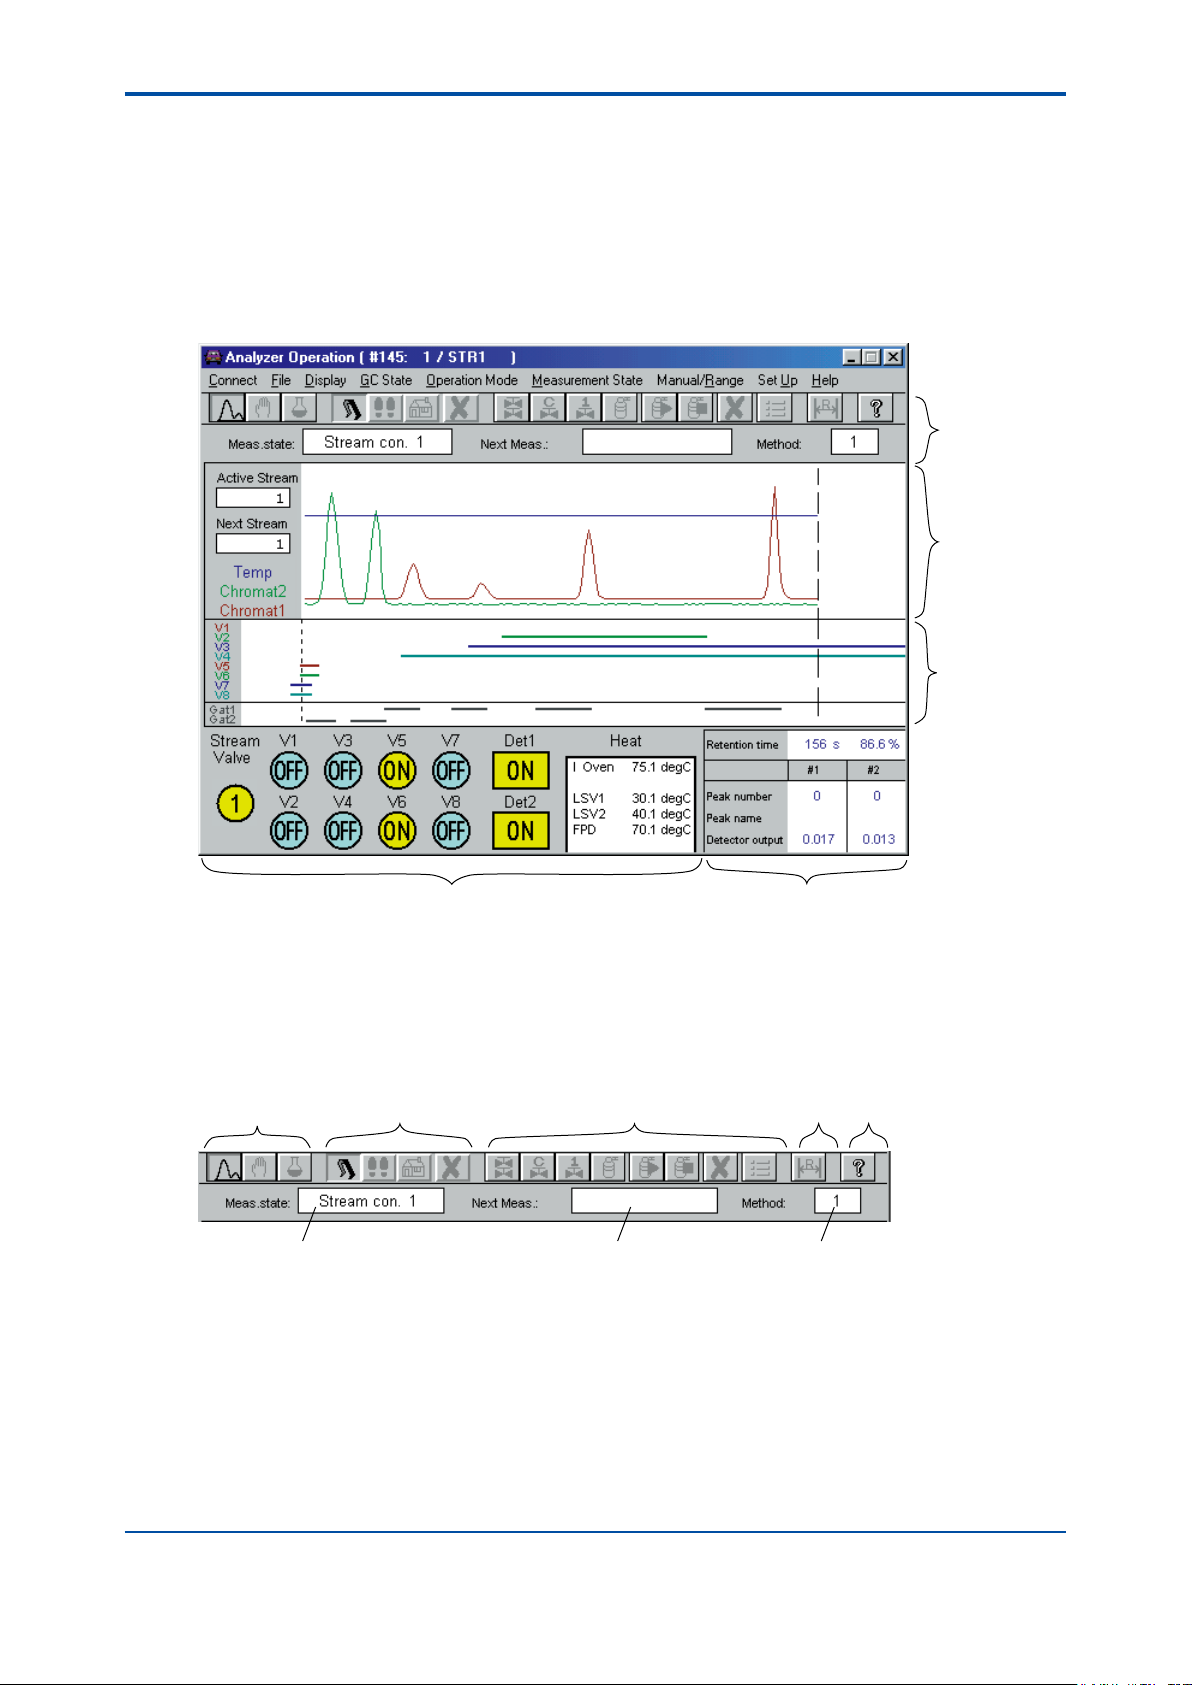
3.2 Layout of Analyzer Operation Window
The Analyzer Operation window is the parent window in the Maintenance Terminal. The window,
updated in one-second cycle, indicates the latest operating status and allows you to specify the
operation mode and others.
n Names of Main Areas
The following gure describes the names of the main areas of the Analyzer Operation window.
3-5
Operation status
display ribbon
Chromatogram
display area
Valve display/control area Data display area
n Operation Status Ribbon
This ribbon is a tool used to monitor and control the current operating status of the analyzer.
l Ribbon Layout
Timing dispay
area
F0306.ai
edcba
Measuring state
a: Status button
"Process" status
"Manual" status
"Lab" status
b: Operation mode button
"Run" mode
"Pause" mode
"Stop" mode
"Cancel"
Next measuring Method
c: Measuring status button
"Stream sequence"
"Stream (cont)"
"Stream (1cycle)"
"Cal(Val)"
"Cal(Val) start"
"Cal(Val) end"
"Cancel"
"Cal(Val) method"
d: Range change button
e: Help indicate button
F0307.ai
IM 11B03G03-03E
4th Edition : Mar. 21, 2012-00
Page 35

<3. Analyzer Operation Window>
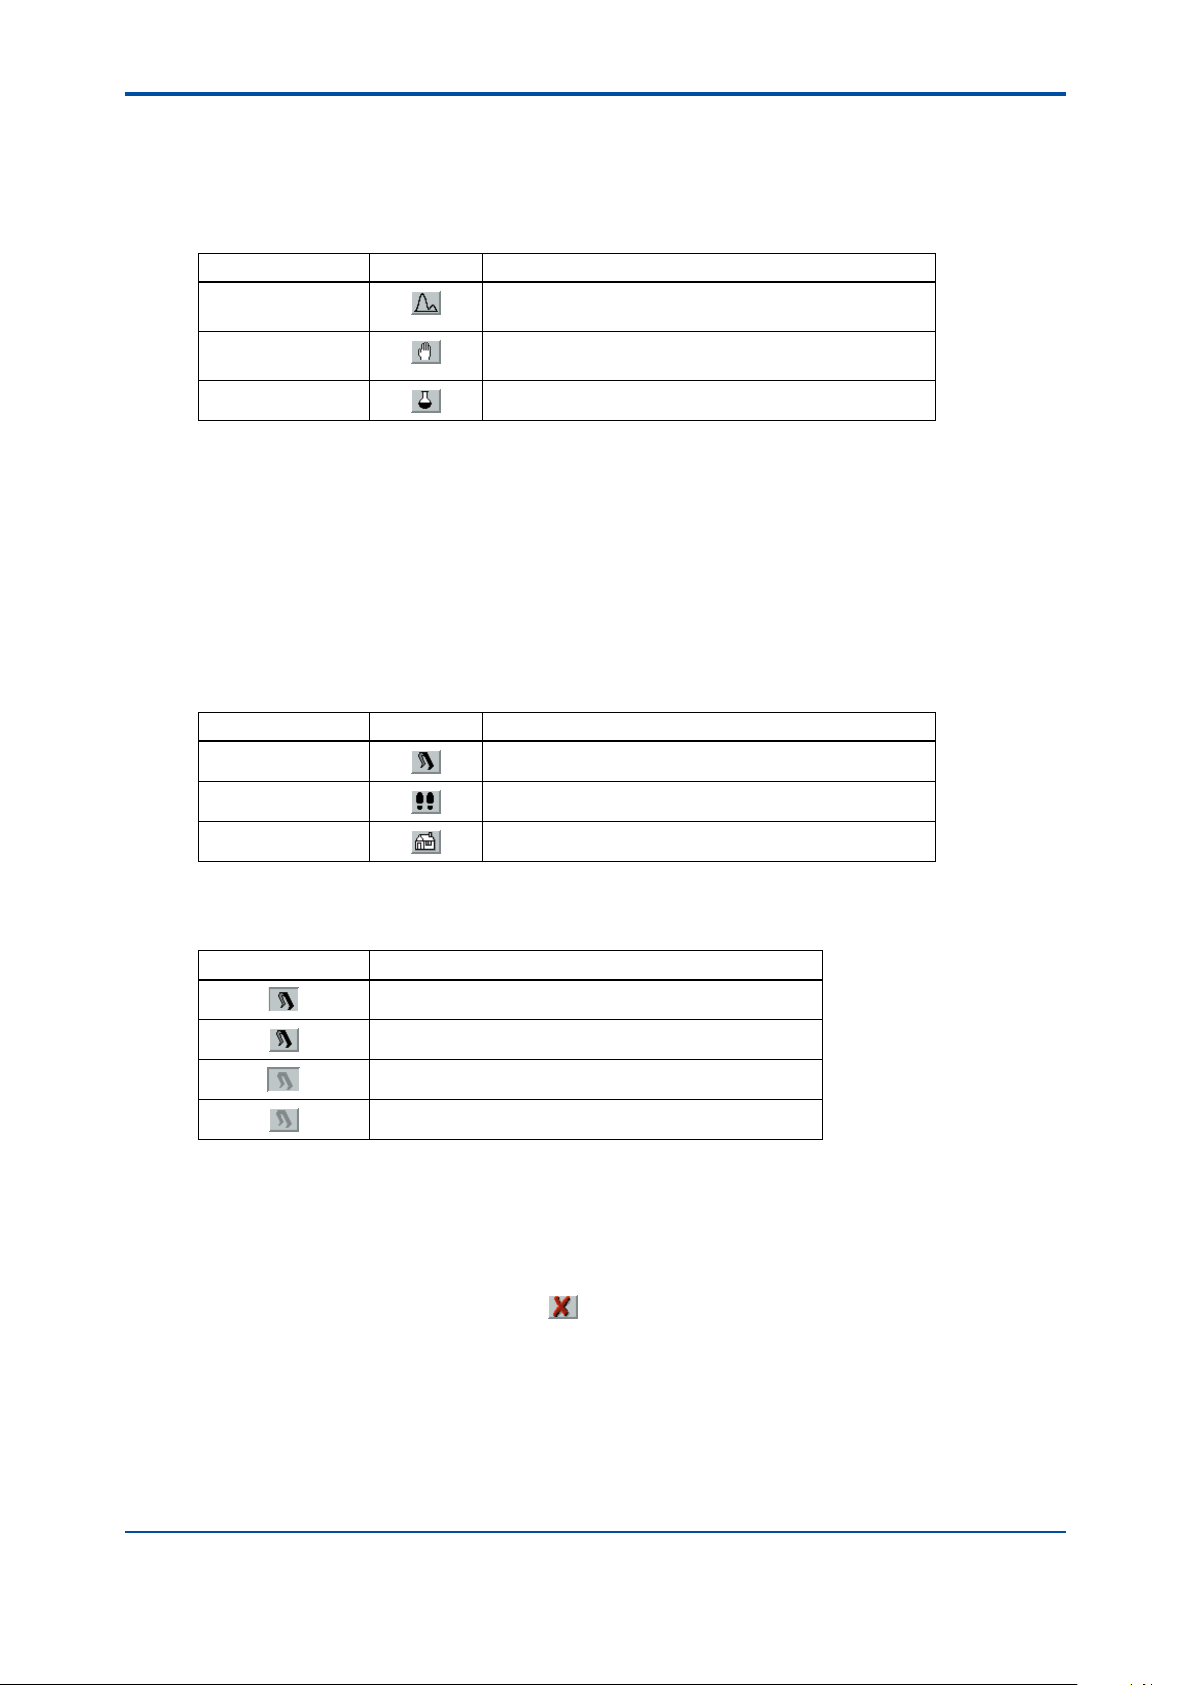
l Function of Buttons and Available Information
The following table summarizes the function of each button and the available information.
Button Function and Available Information
Status (command)
button
Operation mode
(command) button
Measuring status
button
Range change
button
Help indicate button Indicates hepl of GCMT.
Measuring state Indicates the current measuring state.
Next measuring Indicates the measuring state scheduled next, if the measuring state has been
Method Indicates the current method number.
Indicates the current mode of the analyzer. By clicking on the button of the desired
status, the status can be changed.
Indicates the current operation mode and the status in which a mode change is
commanded and reserved. By clicking on the button of the desired operation mode,
the mode can be changed. "Cancel" command button is used to cancel the reserved
operation mode.
Only used to command the measureing status by clicking on the button of the desired
measuring status. "Cal (Val) start" and "Cal (Val) end" buttons are used to start/end
the calibration/validation manually. "Cancel" command button is used to cancel the
scheduled measurement. "Cal (Val) mathod" button is used to change the calibration/
validation method.
Used to change the range.
changed.
3-6
HELP !
To be able to work with the operation status ribbon, the user level must be changed.
See Also
For details on how to change the user level, see Section 3.4.
n Chromatogram Display Area
This area displays the latest chromatogram(s) and the temperature pattern of the programmedtemperature oven (the dual oven) or of the isothermal oven (the single oven) by the analysis
cycle. If there are two detectors, the area shows two chromatograms.
Double-clicking in this area opens the Chromatogram window.
See Also
For details on the Chromatogram window, see Chapter 4.
l Area Layout
Chromatogram
Temperature
The time elapsed up to now is shown as a broken line.
IM 11B03G03-03E
F0308.ai
4th Edition : Mar. 21, 2012-00
Page 36

<3. Analyzer Operation Window>
l Descriptions of the Area
The scales are displayed in the following format:
Item Format
Horizontal scale Shows a chromatogram with the analysis period set on a task-by-task basis.
Vertical scale An automatic scale, which adjusts automatically so that the approximate data
deection up to that moment is 80 percent of full scale. This automatic scaling is set
separately for the chromatogram and temperature.
Active Stream Indicates the number of the stream being currently measured. Indicates "Disp.OK"
when sample displacement is ready (available only for manual calibration/validation
method).
Next Stream Indicates the number of stream scheduled next. For preparation status, (P) is added as
a sufx.
n Timing Display Area
This area displays a chart of the on/off times for each analyzer valve and gate according to the
analysis cycle. These times are preset. As for the on/off times for the gate, if two detectors are
used, this area shows the times separately for each detector.
l Area Layout
3-7
Indicates ON status.
l Descriptions of the Area
The following table summarizes the descriptions of the display.
Item Available Information
Horizontal scale Indicates the times of an analysis cycle set on a stream-by-stream basis.
Valve 1 to 8 Indicates on/off states of valves 1 to 8 in bar graph.
Gate or Gat1/Gat2 Indicates on/off state(s) of gate(s) in bar graph.
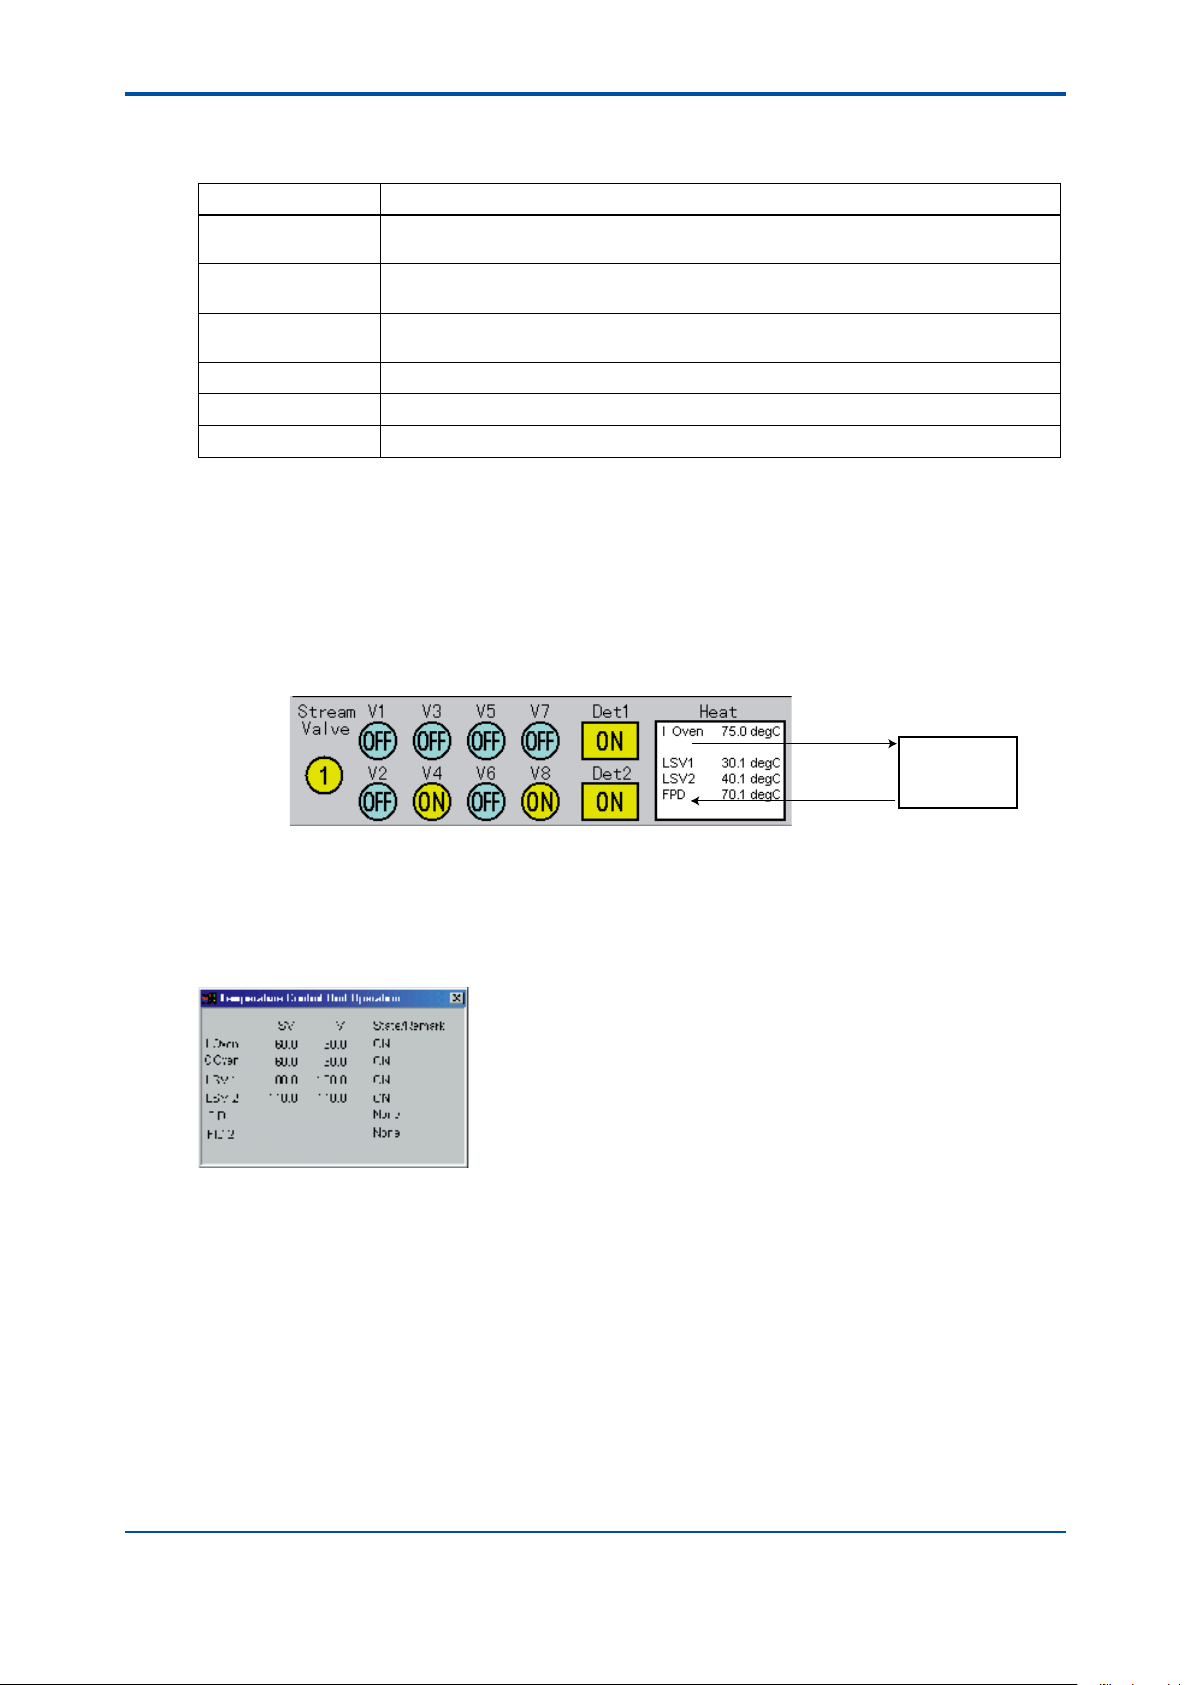
n Valve Display/Control Area
The Valve Display/Control area displays the state of the stream switching valve of the analyzer
(the currently active valve numbers or OFF), the on/off state of the analyzer valves and detectors,
and the state of the temperature controller. In this area, these states can be changed.
Indicates time elapsed.
Valve 1 to 8
Gate (one detector)
or
Gat1/Gat2 (two detectors)
F0309.ai
TIP
In order to actually operate valves, the system must be at user level C as well as in the Manual mode.
IM 11B03G03-03E
4th Edition : Mar. 21, 2012-00
Page 37

<3. Analyzer Operation Window>
l Area Layout
3-8
Stream valve
status
Valve status Detector
l Descriptions of the Area
The following table summarizes the descriptions of the display.
Item Available Information
Stream Valve Indicates the state of each stream switching valve. If all of the valves are turned
Valves 1 to 8 Indicate the on/off state of the valves 1 to 8 each.
Det 1/Det 2 Indicates the on/off state of the detector. Clicking the right mouse button on this
Heat Indicates the state of the temperature controller. Clicking the left mouse button
See Also
For information on the detailed display of the detector signal and temperature controller, see Section 3.3.
n Data Display Area
This area displays the retention time, peak number, peak name, and detector signal. The data is
updated in one-second cycle. If two detectors are used, this area shows data separately for each
detector.
Temperature controller
status
off, the area simply appears gray.
symbol opens the detector signal window.
on this symbol opens the Temperature Control Unit Operation window.
status
F0310.ai
l Area Layout
Common data area
Detector 1
data
Detector 2
data
F0311.ai
l Descriptions of the Area
The following table summarizes the descriptions of the display.
Item Available Information
Retention time Indicates the time elapsed since the start of analysis. Also indicates the ratio of
Peak number Indicates the number of the peak being analyzed.
Peak name Indicates the ID of the peak being analyzed.
Detector output Indicates the level of the detector signal in millivolts [mV]. The chromatogram in
the elapsed time to the analysis period in a percentage.
the chromatogram display area represents the pattern of this signal.
IM 11B03G03-03E
4th Edition : Mar. 21, 2012-00
Page 38

<3. Analyzer Operation Window>
3.3 Viewing the States of the Detector and Temperature Controller
To view the states of the detector signal and the temperature controller, click the right mouse
button on the detector symbol and click the left mouse button on the Heat symbol, respectively, in
the Valve Display/Control area. These displays are updated in threesecond cycle.
See Also
For details on the operations used to make changes in the Valve Display/Control area, see Section 3.6.
n Detailed Display of Detector Signals
l Procedure
If two detectors are used, you can choose either detector in the Valve Display/Control area.
(1) Place the cursor on the detector symbol in the Valve Display/Control area and click the right
mouse button. The Detector Signal window opens.
Valve display and operation area
3-9
[Close] command
Detector detailed
display window
Click the right mouse button
F0312.ai
(2) To close the Detector Signal window, click on the [Close] command in the control menu.
l Window Layout (Detector Signal Window)
F0313.ai
IM 11B03G03-03E
4th Edition : Mar. 21, 2012-00
Page 39
<3. Analyzer Operation Window>
l Descriptions
The following table summarizes the descriptions of the display.
Item Available Information
Type Indicates the type of detector. The window shows TCD, FID, FI-CONV (FID with
methane converter), FPD or None.
Input signal Indicates the value obtained by averaging the A-D converted analog signal of the
detector sampled every 20 msec by the value set in the sample rate.
Filtered signal Indicates the value obtained by ltering the input signal by the value set in the lter
constant in the detector signal setting.
Standard deviation Indicates the standard deviation of the output signals of the last 20 analysis.
Voltage Indicates the bridge current of the TCD (TCD only).
Current Indicates the bridge current of the TCD (TCD only).
n Detailed Display of Temperature Controller
l Procedure
(1) Place the cursor on the temperature controller symbol in the Valve Display/Control area and
click the left mouse button. The Temperature Control Unit Operation window opens.
Valve display and operation area
3-10
Click left
mouse button
[Close]
command
Temperature
status detailed
display window
F0314.ai
(2) To close the Temperature Control Unit Operation window, click on the [Close] command in
the control menu.
l Window Layout (Temperature Control Unit Operation Window)
F0315.ai
IM 11B03G03-03E
4th Edition : Mar. 21, 2012-00
Page 40

<3. Analyzer Operation Window>
l Descriptions
The following table summarizes the descriptions of the display. The display is different depending
on the conguration of the temperature controller used.
Item Available Information
SV* Indicates the temperature controller setpoint.
PV Indicates the value measured by the temperature controller (current temperature).
State/Remark Indicates the state of or comments on the temperature controller.
Programmed
temperature oven *
Constanttemperature oven *
LSV1/2 Indicates the temperature of the sampling valve.
FID1/2 Indicates the temperature of the detector only when the system uses a dualoven
FPD Indicates the temperature of the photomultiplier when the system uses a singleoven
*: The upper limit of the temperature setpoint varies depending on the type of explosion protection applied.
Indicates the temperature of the inner constant-temperature oven of a dualoven model.
Indicates the temperature of the outer constant-temperature oven of a dualoven model
or the temperature of a single-oven model.
model with a temperature-controlled FID.
model.
3.4 Changing the User Level
3-11
There are three user levels in the analyzer. The default is set to user level A which only allows the
user to view and conrm the information in the Analyzer Operation window. To set the system at a
level allowing analyzer operation, change the user level by entering the password.
n Types of User Level
There are three user levels: A, B and C. The following table summarizes the permissible
operations at each user level.
User Level
A Permits window viewing only; no
B Permits both window viewing and
C Permits both window viewing and
Analyzer Operation Window Alarm Window
operation is allowed on the analyzer.
changing the operation mode,
measuring state (except cancel
command) and range.
setting concerning all kinds of
operation with the analyzer.
Access Range
Inhibits deletion of any of the
records on alarm history.
Permits deletion of any of
the records on alarm history.
Permits deletion of any of
the records on alarm history.
Password Entry
During Level Shift
Unnecessary
Necessary
Necessary
IM 11B03G03-03E
4th Edition : Mar. 21, 2012-00
Page 41

<3. Analyzer Operation Window>
n Changing the User Level
In this example, you will learn how to change to user level C.
l Procedure
(1) Click on the [User Level] command in the [Connect] menu. The User Level submenu opens.
3-12
(2) Click on [User Level C]. The password entry dialog box pops up.
(3) Enter the password.
Example: The number of “1450” is entered as a password. The password eld now looks as
shown below:
• The four-digit password is represented by an equal number of asterisks.
(4) Click on the [Execute] button. A conrmation dialog box pops up.
(5) Click on the [OK] button. The user level is set to C.
Displays the user level currently set.
F0317.ai
F0318.ai
F0316.ai
3.5 Changing the Status/Operation Mode/ Measurement Status
By using the Operation Status ribbon in the Analyzer Operation window, the status/operation
mode/measurement status can be changed.
NOTE
The status/operation mode/measurement status can be changed only at the corresponding
required user level, B or C, depending on the parameter to be changed. This change cannot be
made unless the analyzer is in the Remote mode.
IM 11B03G03-03E
4th Edition : Mar. 21, 2012-00
Page 42
<3. Analyzer Operation Window>
n Types and Change of the Status
l Types of the Status
There are three types of the status, as shown below. A currently active status is represented by a
depressed button.
Status Button Description
Process
Manual
Lab
Performs an automatic analysis. Allows the selection of
the measuring status.
Performs a manual analysis. Allows the change status of
valve/detector/theperature controller only in this status.
Performs a laboratory analysis.
l Changing the Status
To change the status, click on the button of the status you want to select. Depending on the
current situation, operable buttons, which are indicated as darkened buttons, are different.
n Types and Change of the Operation Mode
3-13
l Types of the Operation Mode and Indications of the Current Status
There are three types of the operation mode, as shown below.
Mode Button Description
Run
Pause
Stop
Executes analyzer operation.
Pauses operation.
Stops operation.
Each state of the button indicates the current status of the operation mode.
Example: Run mode
Status of button Meaning
The Run mode is being executed.
Can be changed to the Run mode.
The Run mode is reserved.
Cannot be change to the Run mode.
l Changing the Operation Mode
To change the operation mode, click on the button of the operation mode you want to select.
Depending on the current situation, operable buttons, which are indicated as darkened buttons,
are different.
There is a [Cancel] command button
mode.
which is only used to cancel the reserved operation
IM 11B03G03-03E
4th Edition : Mar. 21, 2012-00
Page 43
<3. Analyzer Operation Window>
n Types and Change of the Measurement Status
l Types of the Measurement Status
There are four types of the measurement status, as shown below.
Measurement Button Description
Stream Sequence
Performs stream sequence measurement.
3-14
Stream (Continueous)
Stream (1 cycle)
Calibration (Validation)
Performs continuous measurements of the selected
stream.
Performs a single measurement of the selected stream.
Performs calibration or validation.
The current state of the measurement status is indicated in the bottom half of the Operation
Status ribbon and each button is only used for executing commands.
l Changing the Measurement Status
To change the measurement status, click on the button of the measurement status you want to
select. Depending on the current situation, operable buttons, which are indicated as darkened
buttons, are different.
There is a [Cancel] command button
which is only used to cancel the next measurement.
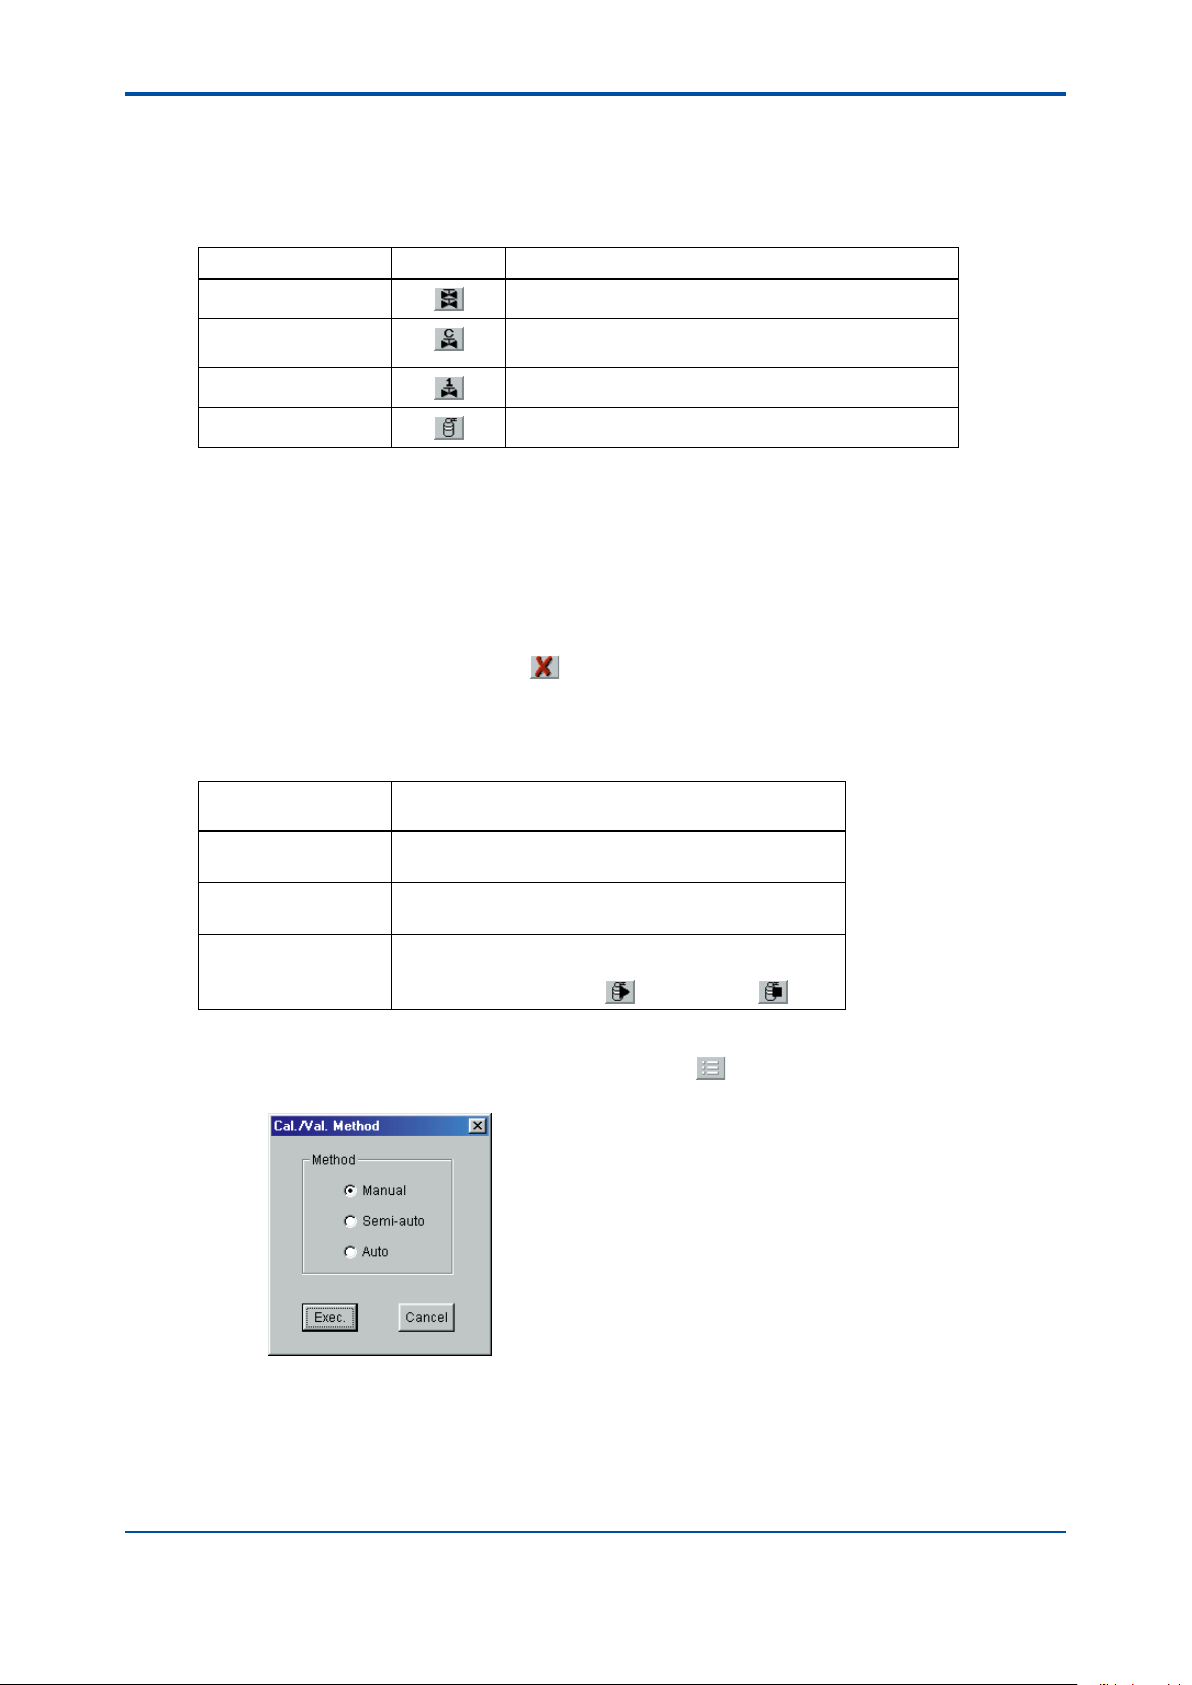
l Calibration (Validation) Method
There are three types of the calibration (validation) method, as shown below.
Calibration
(Validation) Method
Automatic Performs calibration (validation) automatically according
to the starting time and intervals specied in the analyzer.
Semi-automatic Performs calibration (validation) by clicking on the Cal
(Val) button and specifying the number.
Manual Performs calibration validation) manually by clicking on
the Cal (Val) button, arranging the conditions, and then
clicking on the start button
Description
and end button .
Take the following procedure to select the calibration (validation) method.
(1) Click on the [Calibration/Validation Method] button
. The Calibration/Validation Method
dialog pops up.
F0319.ai
IM 11B03G03-03E
4th Edition : Mar. 21, 2012-00
Page 44

<3. Analyzer Operation Window>
(2) Select the radio button of the calibration/validation method you want to specify, and then
click on the [Exec.] button. A conrmation dialog box pops up.
3-15
(3) Click on the [Yes] button.
(4) A message appears to inform you that the data has been changed successfully.
(5) Click on the [OK] button to nish.
F0320.ai
F0321.ai
3.6 Changing the states of the Valves/ Detectors/Temperature Controller
By clicking on the each symbol in the Valve Display/Control area, the state of the valves,
detectors, and temperature controller of each part can be turned on or off. This section explains
how to change the states.
NOTE
The states of the valves/detectors/temperature controller can be changed only at user level C. In
addition, the status must be in Manual. This change cannot be made unless the analyzer is in the
Remote mode.
n Changing the Stream Switching Valves
(1) Click on the Stream Valve symbol. The Stream Valve on/off dialog box pops up.
Click
IM 11B03G03-03E
F0322.ai
4th Edition : Mar. 21, 2012-00
Page 45

<3. Analyzer Operation Window>
(2) If you want to turn on the valve, click the [ON] radio button and then select the number of the
stream valve you want to switch to. If you want to turn off the valve, click on the [OFF] radio
button. Then click the [Exec.] button.
(3) The state of the stream valve will be changed to the specied one.
n Turning On/Off Valves 1 to 8
(1) Click on the symbol of the valve you want to turn on or off among the valves V1 to V8.
A conrmation dialog box pops up.
Click
3-16
(2) Click on the [Yes] button. The state of the valve will be changed to ON or OFF.
n Turning On/Off Detectors
(1) Click on the symbol of the detector you want to turn on or off. A conrmation dialog box pops
up.
(2) Click on the [Yes] button. The state of the detector will be changed to ON or OFF.
F0323.ai
Click
F0324.ai
IM 11B03G03-03E
4th Edition : Mar. 21, 2012-00
Page 46

<3. Analyzer Operation Window>
n Turning On/Off the Temperature Controller
(1) Click on the description of the temperature controller. The Temperature Control Unit
Operation window opens.
Click
(2) Click on the state under the State/Remark column of the temperature controller of interest. A
conrmation dialog box pops up.
3-17
F0325.ai
F0326.ai
(3) Click on the [Yes] button. The state marked under the State/Remark column will be changed
to ON or OFF.
3.7 Changing the Range
By using the range table set in the analyzer, the ranges of each peak can be changed. This
section explains how to change the range.
NOTE
The range can be changed only at user levels B or C. This change cannot be made unless the
analyzer is in the Remote mode.
IM 11B03G03-03E
4th Edition : Mar. 21, 2012-00
Page 47

<3. Analyzer Operation Window>
n Changing the Range
(1) Click on the [Range Select] command button .
(2) The Range Select dialog box pops up.
3-18
F0327.ai
Specify the stream number, peak number, and range number you want to change.
The information of the current state is displayed.
(3) Click on the [Exec.] button. A conrmation dialog box pops up.
F0328.ai
(4) Click on the [Yes] button.
(5) A message appears to inform you that the data has been changed successfully.
F0329.ai
(6) Click on the [OK] button to nish.
IM 11B03G03-03E
4th Edition : Mar. 21, 2012-00
Page 48
<3. Analyzer Operation Window>
3-19
3.8 Changing the Valves and Peak Information
The valve on/off timing set in the analyzer can be changed. The individual information (peak
names, gate time, etc.) set for each peak also can be changed. This section explains how to
change these settings.
NOTE
The valve and peak information can be changed only at user level C. This change cannot be
made unless the analyzer is in the Remote mode.
n Changing the Valve On/Off Setting
(1) Click on the [Valve] command in the [Set Up] menu.
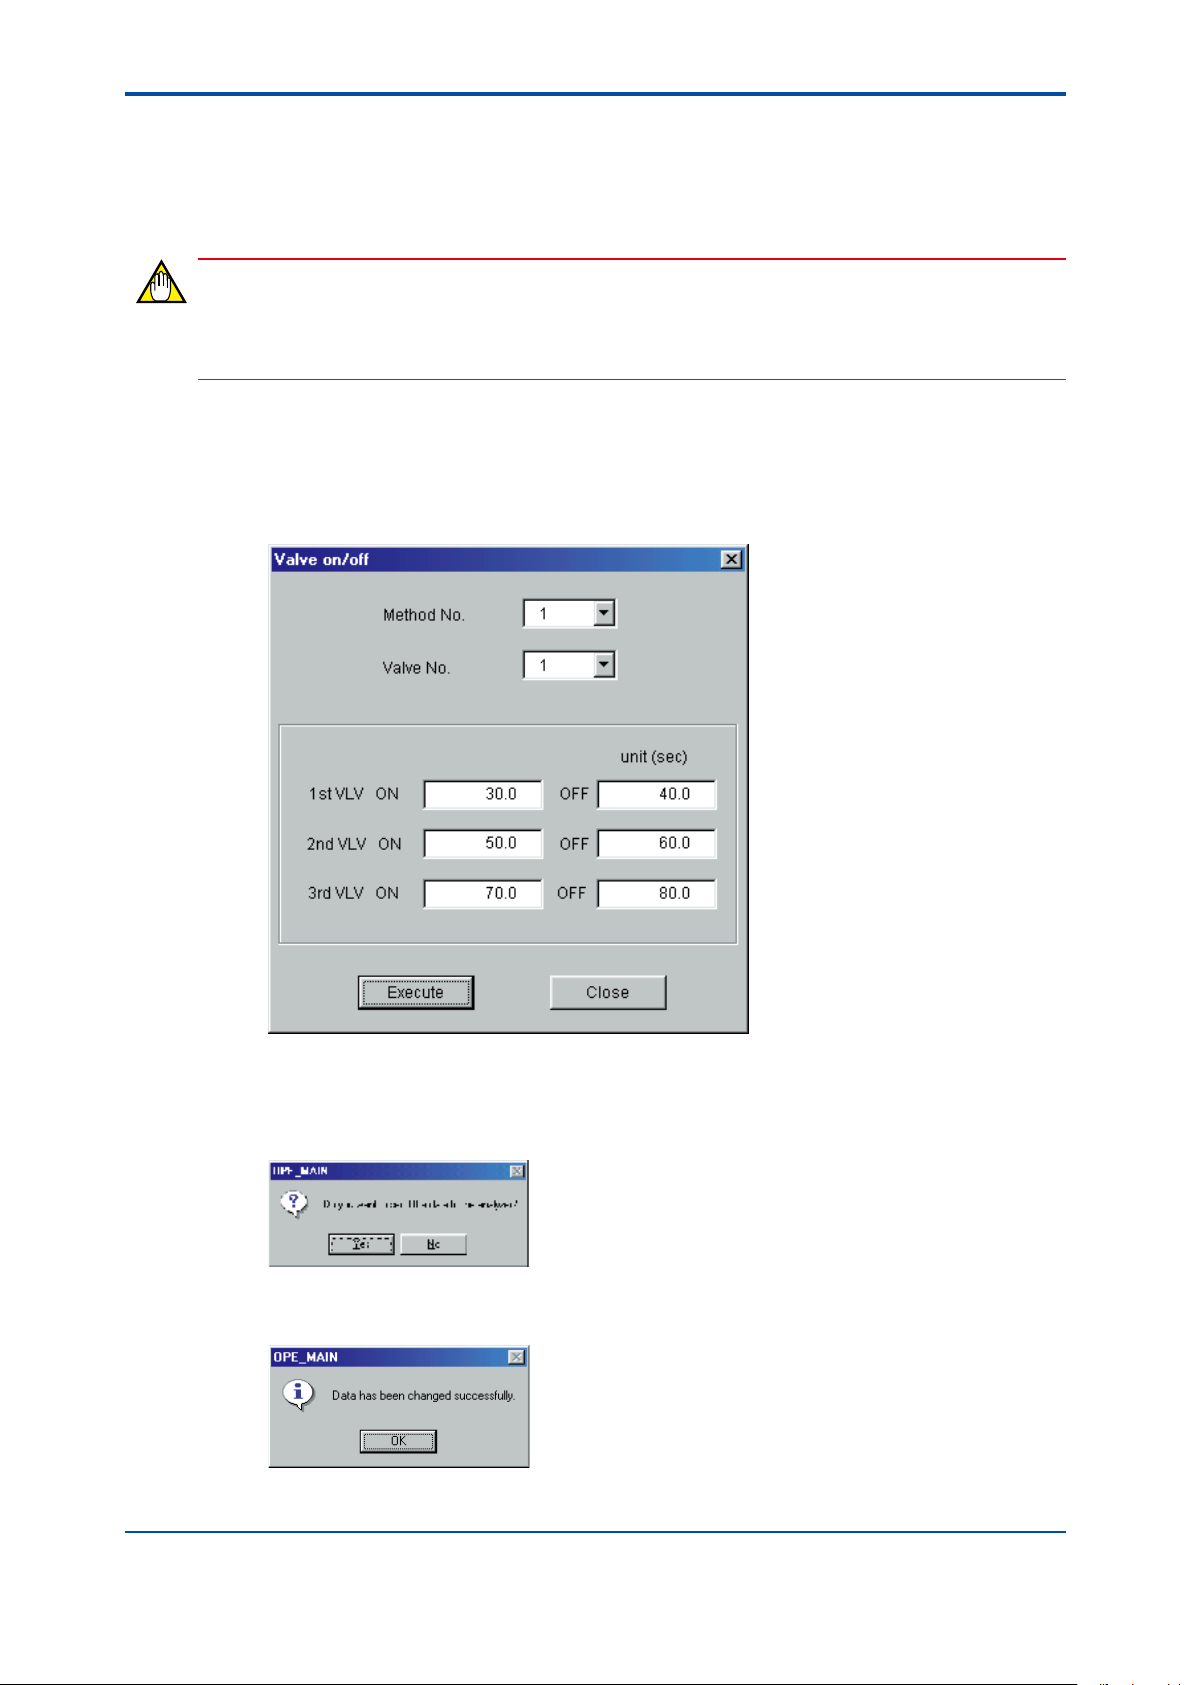
(2) The Valve on/off dialog box pops up.
F0330.ai
Specify the valve number you want to change. The information of the current state is
displayed.
(3) Change the on/off times of the valves, and then click on the [Execute] button. A conrmation
dialog box pops up.
F0331.ai
(4) Click on the [Yes] button.
(5) A message appears to inform you that the data has been changed successfully.
F0332.ai
(6) Click on the [OK] button to nish.
IM 11B03G03-03E
4th Edition : Mar. 21, 2012-00
Page 49

<3. Analyzer Operation Window>
n Changing the Peak Individual Setting
(1) Click on the [Peak] command in the [Set Up] menu. Click on the command of the information
you want to change, such as [Name] and [Gate Std/On/Off Time] commands.
(2) A dialog box (e.g., Name dialog box) pops up.
3-20
Specify the stream number and peak number you want to change. The information of the
current state is displayed.
(3) Change the information in the dialog box, and then click on the [Execute] button. A
conrmation dialog box pops up.
(4) Click on the [Yes] button.
(5) A message appears to inform you that the data has been changed successfully.
(6) Click on the [OK] button to nish.
F0334.ai
F0335.ai
F0333.ai
3.9 Uploading and Downloading the Parameter Settings
When duplicating the settings of the Parameter List Setup window on the LCD panel to another
analyzer or when making a backup of the settings to re-configure them, use the operations of
uploading/downloading parameters.
NOTE
Parameter settings can be uploaded or downloaded only at user level C and in the Stop mode in
either Process or Lab status.
IM 11B03G03-03E
4th Edition : Mar. 21, 2012-00
Page 50
<3. Analyzer Operation Window>
n Uploading
To upload and save parameter settings from the analyzer to a disk of the Maintenance Terminal,
take the following procedure.
l Procedure
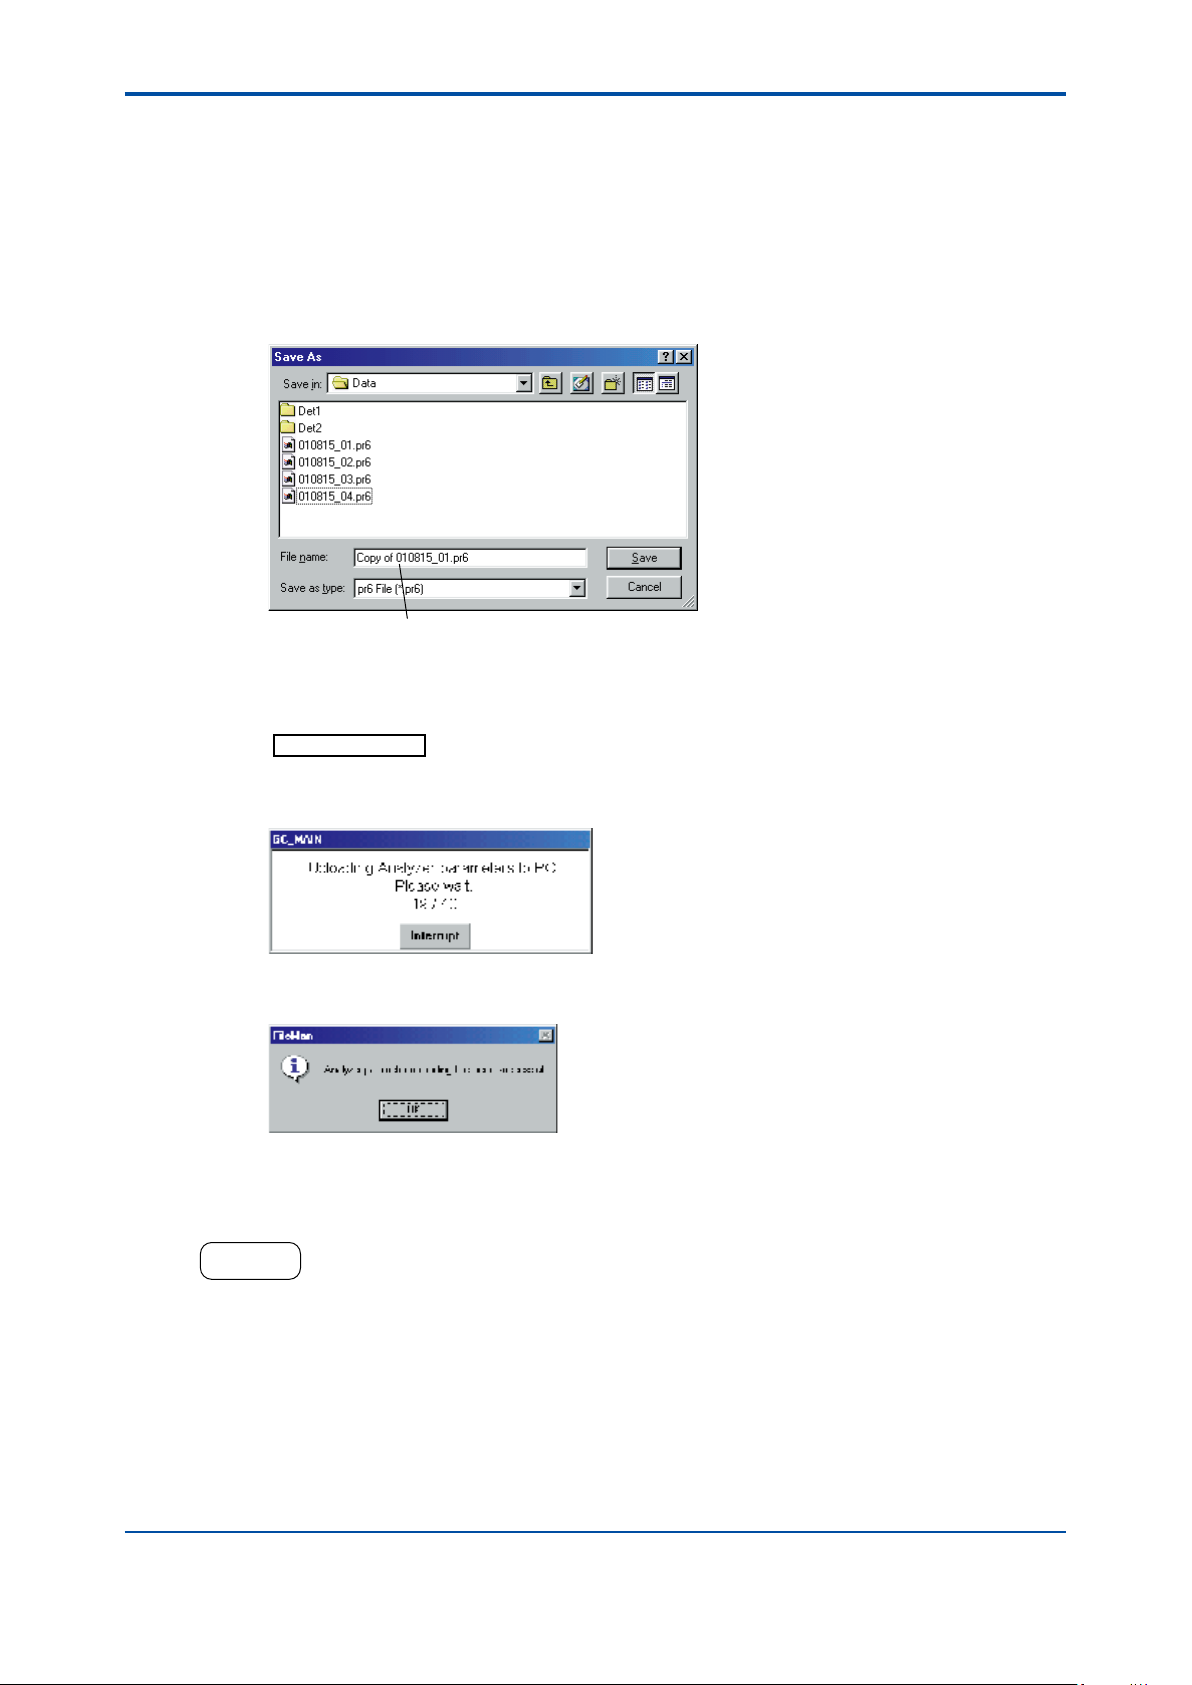
(1) Click on the [Upload to PC] command in the [File] menu. The Save As dialog box pops up
where you can specify the le name for the parameter setting information to be uploaded.
The default directory is “Data” right under the installation directory.
3-21
Input
F0336.ai
(2) Type the name of the le where you want to save the parameter settings, with an extension
of “.pr6” in the “File name” eld.
Example: When the le name is “system01”, type
system01.pr6
(3) Click on the [OK] button. A dialog box pops up to show the status of the transmission of the
parameter settings from the analyzer.
F0337.ai
When all parameter settings have been uploaded and saved in the le, the following dialog
box pop up.
F0338.ai
• It takes about 40 seconds for data transmission from the analyzer (if the communication
speed is 38400 bps).
(4) Click on the [OK] button. The uploading has been completed.
HELP !
To interrupt the uploading of parameter settings;
• Click on the [Interrupt] button in the dialog box showing the transmission status. A conrmation dialog box
pops up.
• Click on the [Yes] button.
IM 11B03G03-03E
4th Edition : Mar. 21, 2012-00
Page 51

<3. Analyzer Operation Window>
n Downloading
To download the parameter settings from a disk of the Maintenance Terminal to the analyzer, take
the following procedure.
l Procedure
(1) Click on the [Download to GC] command in the [File] menu. The le dialog box pops up
where you can specify the name of the le to be downloaded.
(2) Select the le name, and then click on the [OK] button. A dialog box pops up to show the
status of the transmission of the parameter settings to the analyzer.
3-22
F0339.ai
When all parameter settings have been downloaded from the disk of the Maintenance
Terminal to the analyzer, a dialog box pops up to notify you of the completion of the
transmission.
F0340.ai
• It takes about 60 seconds for data transmission from the analyzer (if the communication
speed is 38400 bps).
(3) Click on the [OK] button. The downloading has been completed.
• To interrupt the downloading of parameter settings, follow the instructions under
HELP !
in
the uploading procedure.
NOTE
The parameters in the initial database of the Maintenance Terminal may be inconsistent with those
of the analyzer after downloading the parameters, resulting in an incorrect display of parameters.
In that case, restart the Maintenance Terminal.
3.10 Actions When Alarms Occur
If an alarm occurs in the analyzer while the Maintenance Terminal is in use, an alarm message
box pops up to notify you of the alarm.
The alarm message box may appear behind the analysis result display. When it happens,
minimize the display.
n Alarm Message Box
If an alarm occurs, the following alarm message box pops up.
Ocuurrence time Alarm number
Alarm status
F0341.ai
IM 11B03G03-03E
4th Edition : Mar. 21, 2012-00
Page 52

<3. Analyzer Operation Window>
n Actions When Alarms Occur
If the alarm message box pops up, click on one of the buttons in the box depending on the details
of the alarm. This closes the message box and you will return to the parent window or the relevant
alarm window. The following table summarizes the function of each button.
Button Function
OK Returns to the parent window. Select this button if you do not need to make any
acknowledgment in the alarm window.
A. Status Switches to the Alarm Status window to show a list of current alarm statuses.
A. History Switches to the Alarm History window to show a list of previous alarms (up to 100).
A. Detail Switches to the Alarm Detail Description window to give a detailed description of the
alarms that have occurred.
See Also
For details on alarm windows, see Chapter 5, “Alarm Windows.”
3-23
IM 11B03G03-03E
4th Edition : Mar. 21, 2012-00
Page 53

Blank Page
Page 54

<4. Chromatogram Window>
4-1
4.
Chromatogram Window
The Chromatogram window displays chromatograms from the analyzer in detail. In addi-
tiontothemostrecentchromatogram,previouschromatogramssavedinalecanalso
be retrieved onto the display. This chapter describes how to open and close the Chromatogram window, how the window is composed, how to change the scale and zoom in the
window, and how to save and retrieve chromatograms.
Window Switching Sequence
Analyzer
Operation
window
Click on the
[Chromatogram]
menu
Chromatogram
window
[Exit] command
F0401.ai
4.1 Opening and Closing the Chromatogram Window
This section describes how to open and close the Chromatogram window.
n Opening the Window
The Chromatogram window can be opened from the Analyzer Operation window in two ways: by
using the command in the menu or by double-clicking anywhere in the Chromatogram Display
area.
NOTE
Only one Chromatogram window can be opened at a time.
l Procedure
(1) Click on the [Chromatogram] command in the [Display] menu in the Analyzer Operation
window or double-click anywhere in the Chromatogram Display area. The Chromatogram
window opens.
IM 11B03G03-03E
4th Edition : Mar. 21, 2012-00
Page 55
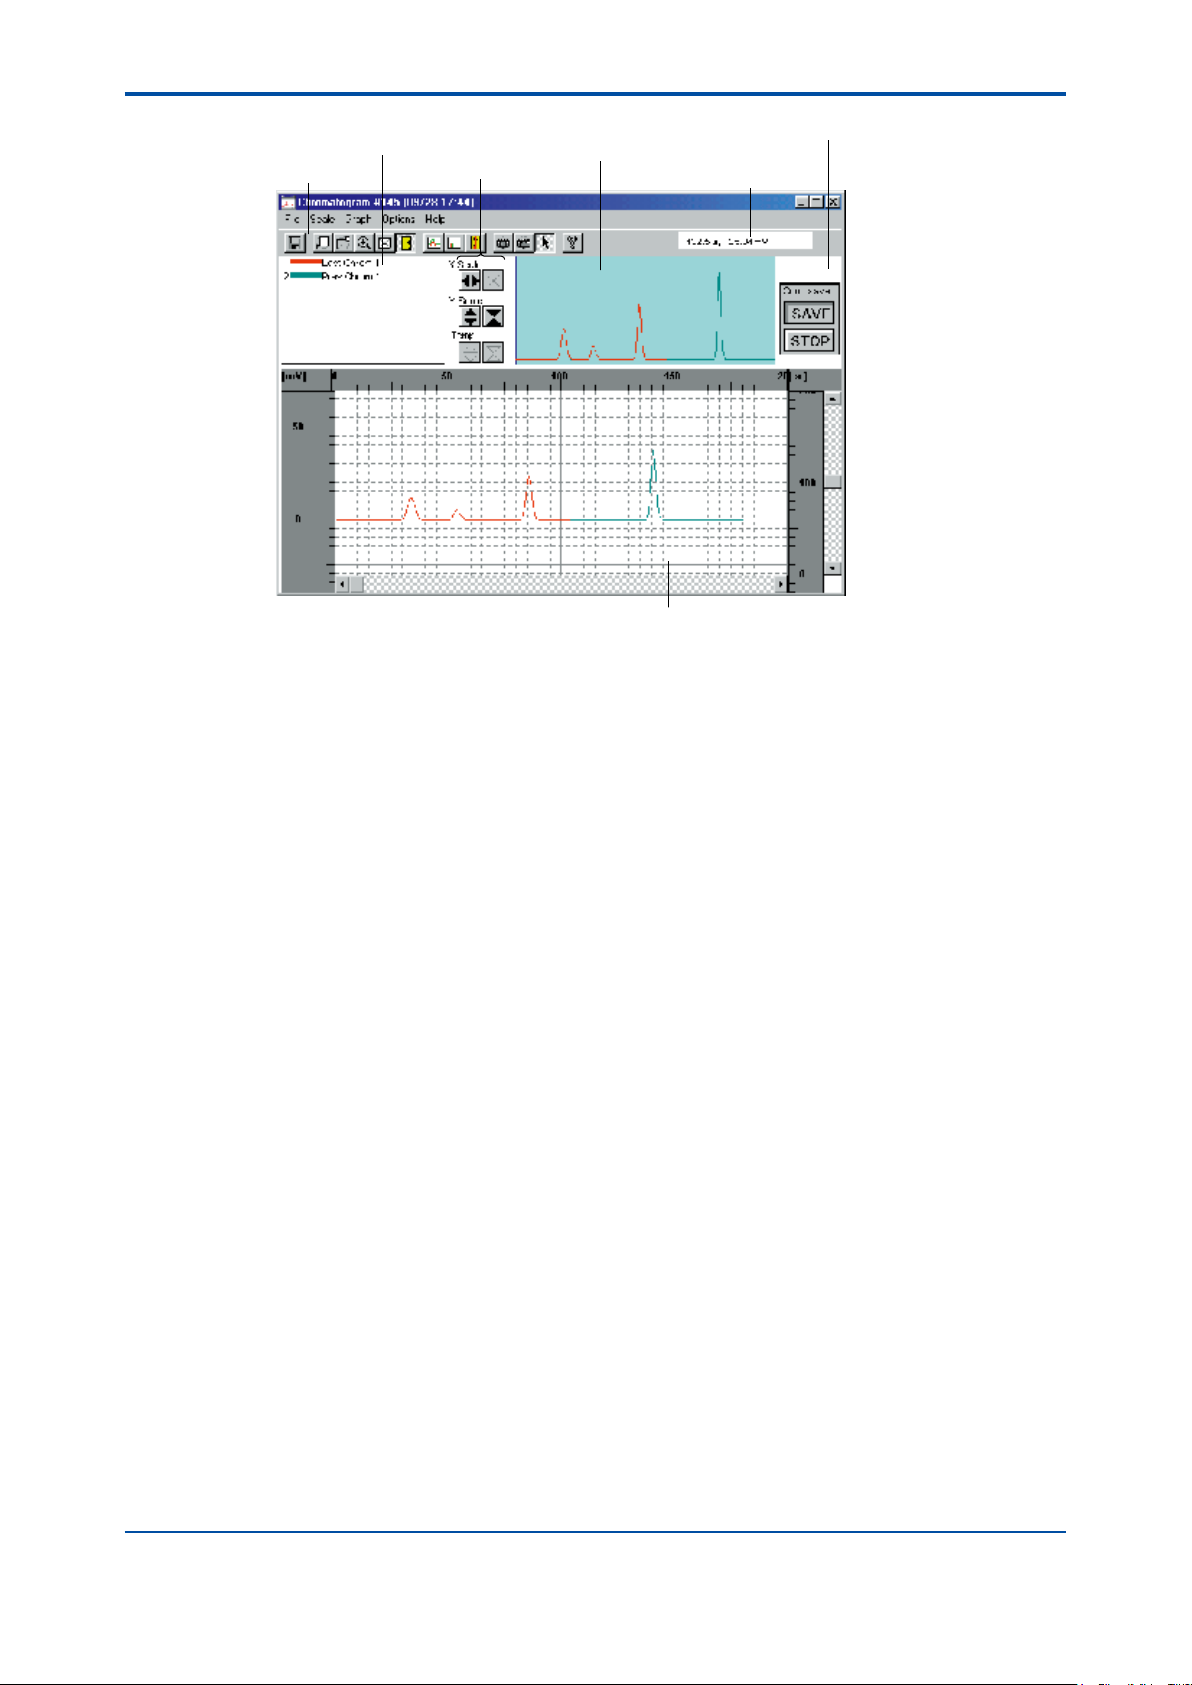
<4. Chromatogram Window>
4-2
Toolbar
Legend
Enlarge/reduce buttons
Overall view button
l Size and Location of the Window
Continuous-saving indication
Mouse position indication
Closeup window
F0402.ai
The Chromatogram window opens in the same size and location as the one when opened last
time.
l Sizing the Window
Drag the window border to enlarge or reduce the size of the window. The minimum window size
is 600 x 480.
n Closing the Window
l Procedure
Click on the [Exit] command in the [File] menu while the Chromatogram window is active. The
Chromatogram window closes.
IM 11B03G03-03E
4th Edition : Mar. 21, 2012-00
Page 56

<4. Chromatogram Window>
4.2 Window Layout
The Chromatogram window displays chromatograms in detail. In addition to the most recent
chromatogram, chromatograms previously saved in a le can also be retrieved and displayed in
the window.
n Toolbar
The most frequently used commands are provided as buttons on the toolbar.
l Toolbar Layout
The toolbar contains the following command buttons.
Overall view button
Auto-scale button
Snapshot 1
button
Mouse position button
4-3
Save Chromatogram
button
Zoom-in
button
n Closeup Window
The Closeup window displays chromatogram(s) and temperature(s).
l Window Layout
Zoom-out
button
X-axis scale
Part Zoom
button
Grid
Pen selection
button
Timing Mark
button
Temperature
button
Scroll barsY-axis scale
Snapshot 2
button
Temperature scale
Help button
F0404.ai
F0403.ai
l Display Description
Item Description
X-axis scale Scale for elapsed time [seconds]
Y-axis scale Scale for measured voltage [mV]
Temperature scale Scale for measured temperature [°C]
Scroll bars Scroll the chromatogram screen to view unseen parts of the chromatogram.
Grid Crossed auxiliary lines according with X- and Y-axis scales. Clicking on the
[Grid] command in the [Options] menu enables/disables grid indication.
IM 11B03G03-03E
4th Edition : Mar. 21, 2012-00
Page 57

<4. Chromatogram Window>
4-4
4.3 Viewing Chromatograms and Temperature Data
The Chromatogram window can display up to eight chromatograms and two graphs of
temperature data.
n Viewing Chromatograms
The following table summarizes the types of chromatograms you can view in the Chromatogram
window.
Type Description
Last chromatogram The chromatogram for the measurement currently in progress. This
Previous
chromatogram
Filed chromatogram A chromatogram uploaded from the analyzer to a PC. A sampling rate is the
Detail chromatogram A chromatogram saved in a le. The window can display up to eight led
Differential
chromatogram
chromatogram is updated at a specic interval. “Current chromatogram 1” and
“current chromatogram 2” refer to the current chromatograms acquired through
detector 1 and detector 2, respectively. A sampling rate is 80 ms.
The chromatogram acquired in the measurement carried out immediately
before. This chromatogram is updated at a specic interval. “Previous
chromatogram 1” and “previous chromatogram 2” refer to the previous
chromatograms acquired through detector 1 and detector 2, respectively. A
sampling rate is 80 ms.
same as the one of the analyzer.
chromatograms.
A chromatogram showing the differences between two on-screen
chromatograms. The window can display up to two chromatograms.
To view two differential chromatograms, select two different chromatograms, such as “differential
chromatogram 1” and “differential chromatogram 2.” You cannot select the same chromatogram
twice.
l Viewing the Last or Previous Chromatogram
(1) Click on either the [Pen Select] command in the [Graph] menu or the button on the
toolbar. The Pen Select dialog box pops up.
(2) From the list boxes appropriate for the colors being used, select “Last Chrom 1,” “Last
Chrom 2,” “Prev Chrom 1” or “Prev Chrom 2.” Then click on the [OK] button. The
selected chromatogram(s) appear. The legend now indicates the name(s) of the selected
chromatogram(s).
F0405.ai
IM 11B03G03-03E
4th Edition : Mar. 21, 2012-00
Page 58
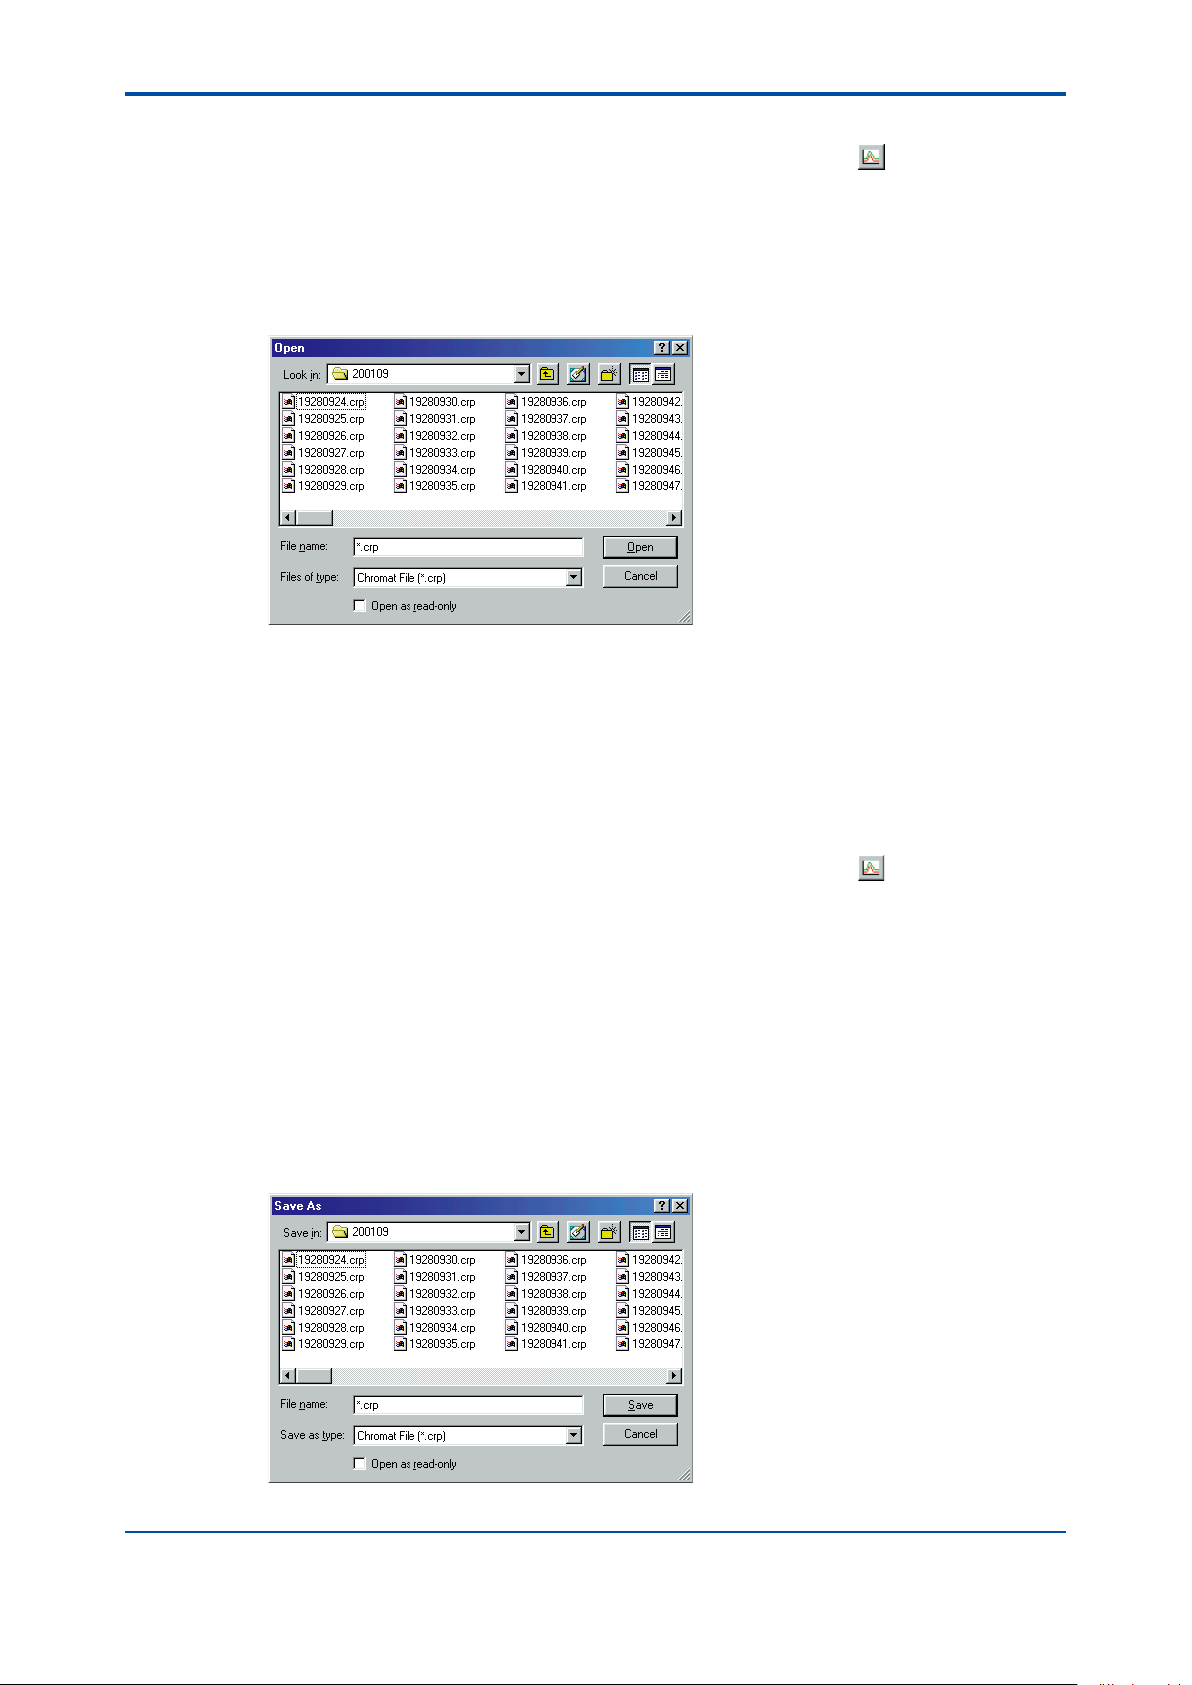
<4. Chromatogram Window>
l Viewing a Filed Chromatogram
(1) Click on either the [Pen Select] command in the [Graph] menu or the button on the
toolbar. The Pen Select dialog box pops up.
(2) From the list boxes appropriate for the colors being used, select “Filed Chrom.” A dialog box
pops up, asking you to specify the name of the le that contains the chromatogram to be
displayed. Extensions for chromatograms are as follows:
Chromatogram les of the GC1000: .cro
Chromatogram les of the GC1000 Mark II: .crp
4-5
F0406.ai
(3) Select the le for the chromatogram to be displayed and click on the [OK] button. This takes
you back to the Pen Select dialog box in Step 1.
(4) Click on the [OK] button. The chromatogram of the selected le appears. The legend now
indicates the name of the selected le.
l Viewing a Detail Chromatogram
(1) Before calling up the Pen Select dialog box, set the operation mode to Stop in either the
Process or Lab status.
(2) Click on either the [Pen Select] command in the [Graph] menu or the
toolbar. The Pen Select dialog box pops up.
(3) From the list boxes, select the detail chromatogram(s). Chromatogram(s) for the last four
times that have been saved by detector in the analyzer can be retrieved here.
Detail Chrom 1_1: A chromatogram of analysis performed one cycle before by detector 1
Detail Chrom 1_4: A chromatogram of analysis performed four cycles before by detector 1
Detail Chrom 2_1: A chromatogram of analysis performed one cycle before by detector 2
Detail Chrom 2_4: A chromatogram of analysis performed four cycles before by detector 2
(4) Wait until the detail chromatogram is uploaded from the analyzer. This processing time
depends on an analysis cycle, sampling rate, and communication speed.
(5) Upon the completion of uploading, the Save As dialog box pops up. If you want save the
detail chromatogram in a le, specify the name of the le, and then click on the [Save]
button. Press the [Cancel] button if you do not want to save it.
button on the
F0407.ai
IM 11B03G03-03E
4th Edition : Mar. 21, 2012-00
Page 59
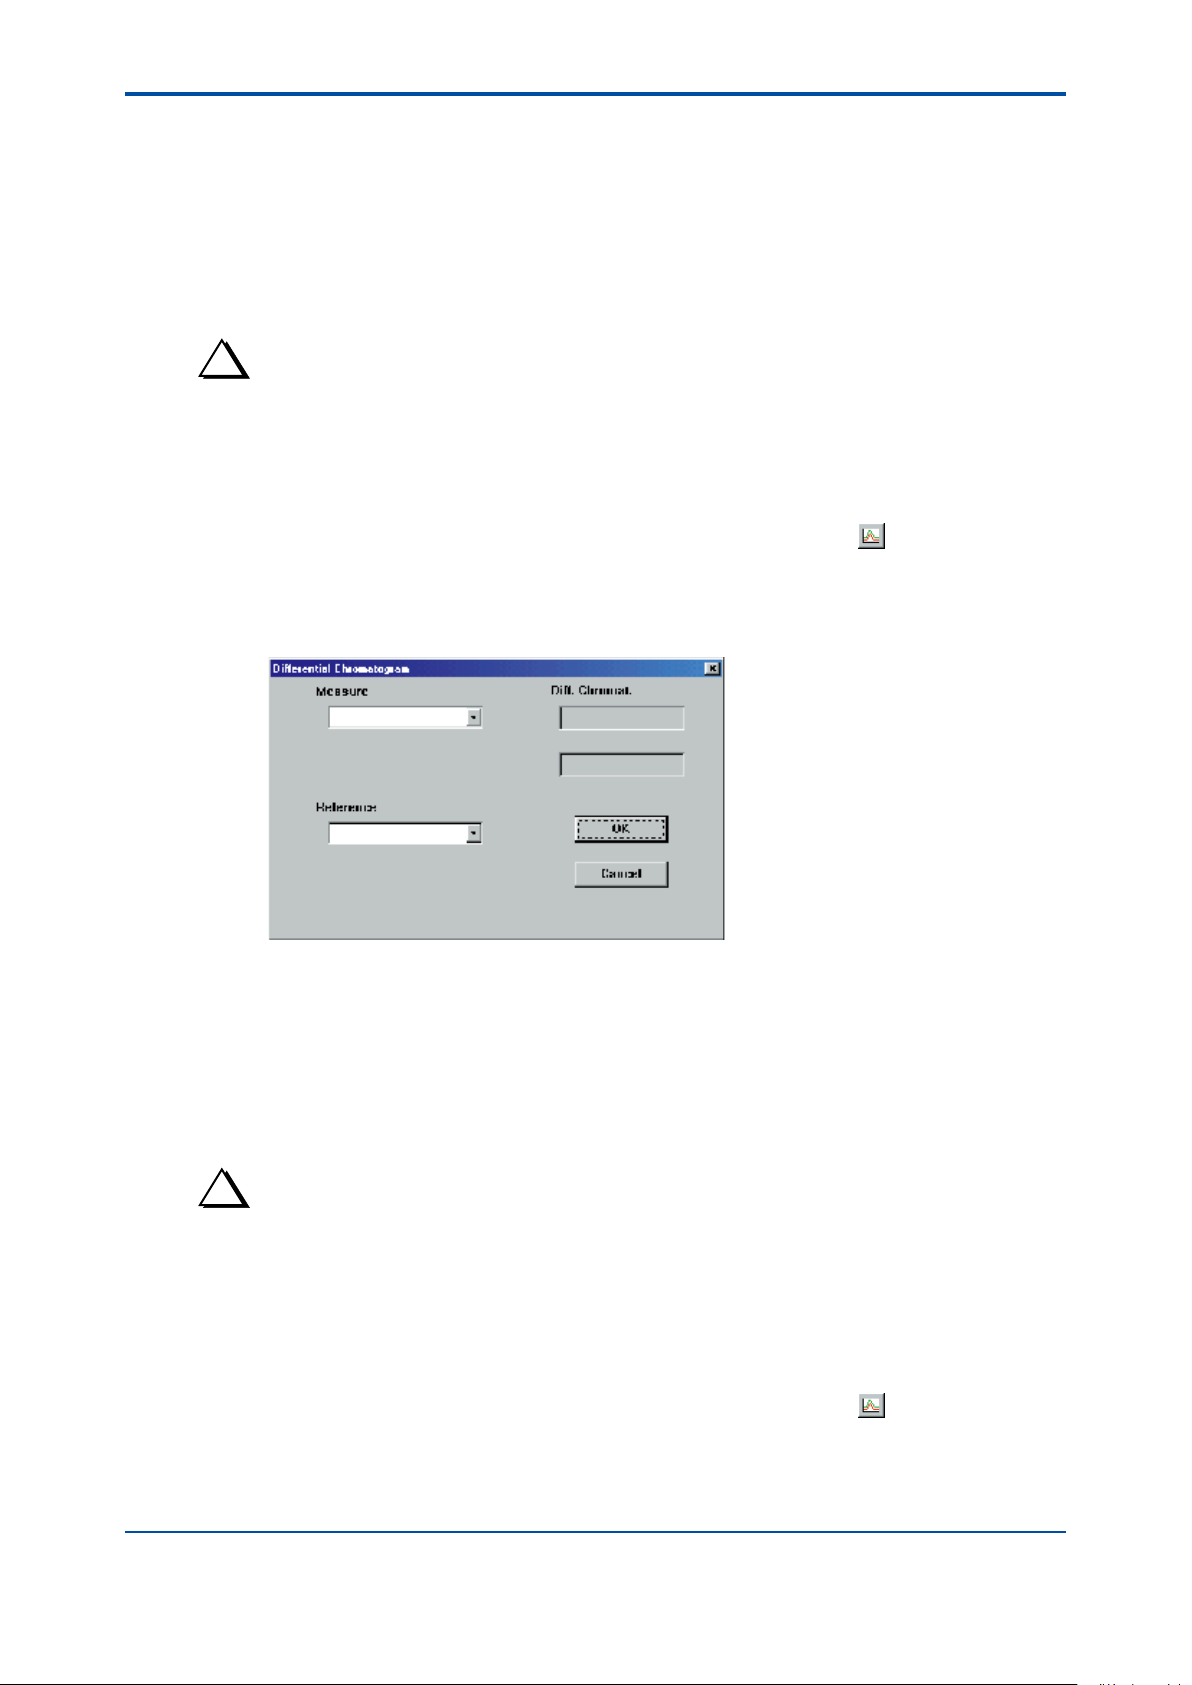
<4. Chromatogram Window>
(6) In the Pen Select dialog box, press the [OK] button to save the detail chromatogram.
The legend here indicates:
0107171205D1
01: Year (last two digits)
07: Month (two digits)
17: Day
12: Hour
05: Minute
D1: Detector No. (D1: Detector 1, D2: Detector 2)
TIP
If the analyzer is turned off, detail chromatograms that have been saved so far will be erased. When you
try to obtain a detailed chromatogram immediately after the power is turned on, a message box of “Detail
Chromatogram cannot upload.“ appears.
l Viewing a Differential Chromatogram
(1) Click on either the [Pen Select] command in the [Graph] menu or the button on the
toolbar. The Pen Select dialog box pops up.
(2) From the list boxes appropriate for the colors being used, select “Diff. Chromat. 1” or “Diff.
Chromat. 2.” A dialog box pops up, asking you to specify the two graphs from which you will
acquire a differential chromatogram.
4-6
F0408.ai
(3) From the list boxes of the Measure and Reference elds, select the graphs respectively to
be used to acquire the differential chromatogram. Click on the [OK] button.
This takes you back to the Pen Select dialog box. The list boxes now display the names of
the selected chromatograms, not the names “Diff. Chromat. 1” and “Diff, Chromat. 2.” The
differential chromatogram is derived by the formula “Measure graph” - “Reference graph.”
(4) Click on the [OK] button. The specied differential chromatogram appears. The legend
now shows the name of the chromatogram, such as “1-2,” used to acquire the differential
chromatogram.
TIP
For a comparison of two graphs with different analysis cycles, the Chromatogram window shows the differential
chromatogram corresponding to the shorter analysis cycle. Even if you have specied the current or previous
chromatogram to derive a differential chromatogram, the derived chromatogram is not updated at a specied
interval. The difference is obtained using the chromatograms selected when you clicked on the [OK] button in
step 3.
l Deleting an On-screen Chromatogram
(1) Click on either the [Pen Select] command in the [Graph] menu or the button on the
toolbar. The Pen Select dialog box pops up.
(2) From the list box(es) appropriate for the color(s) of the chromatogram(s) being deleted,
select “None.” Click on the [OK] button. The specied chromatogram(s) are deleted.
IM 11B03G03-03E
4th Edition : Mar. 21, 2012-00
Page 60
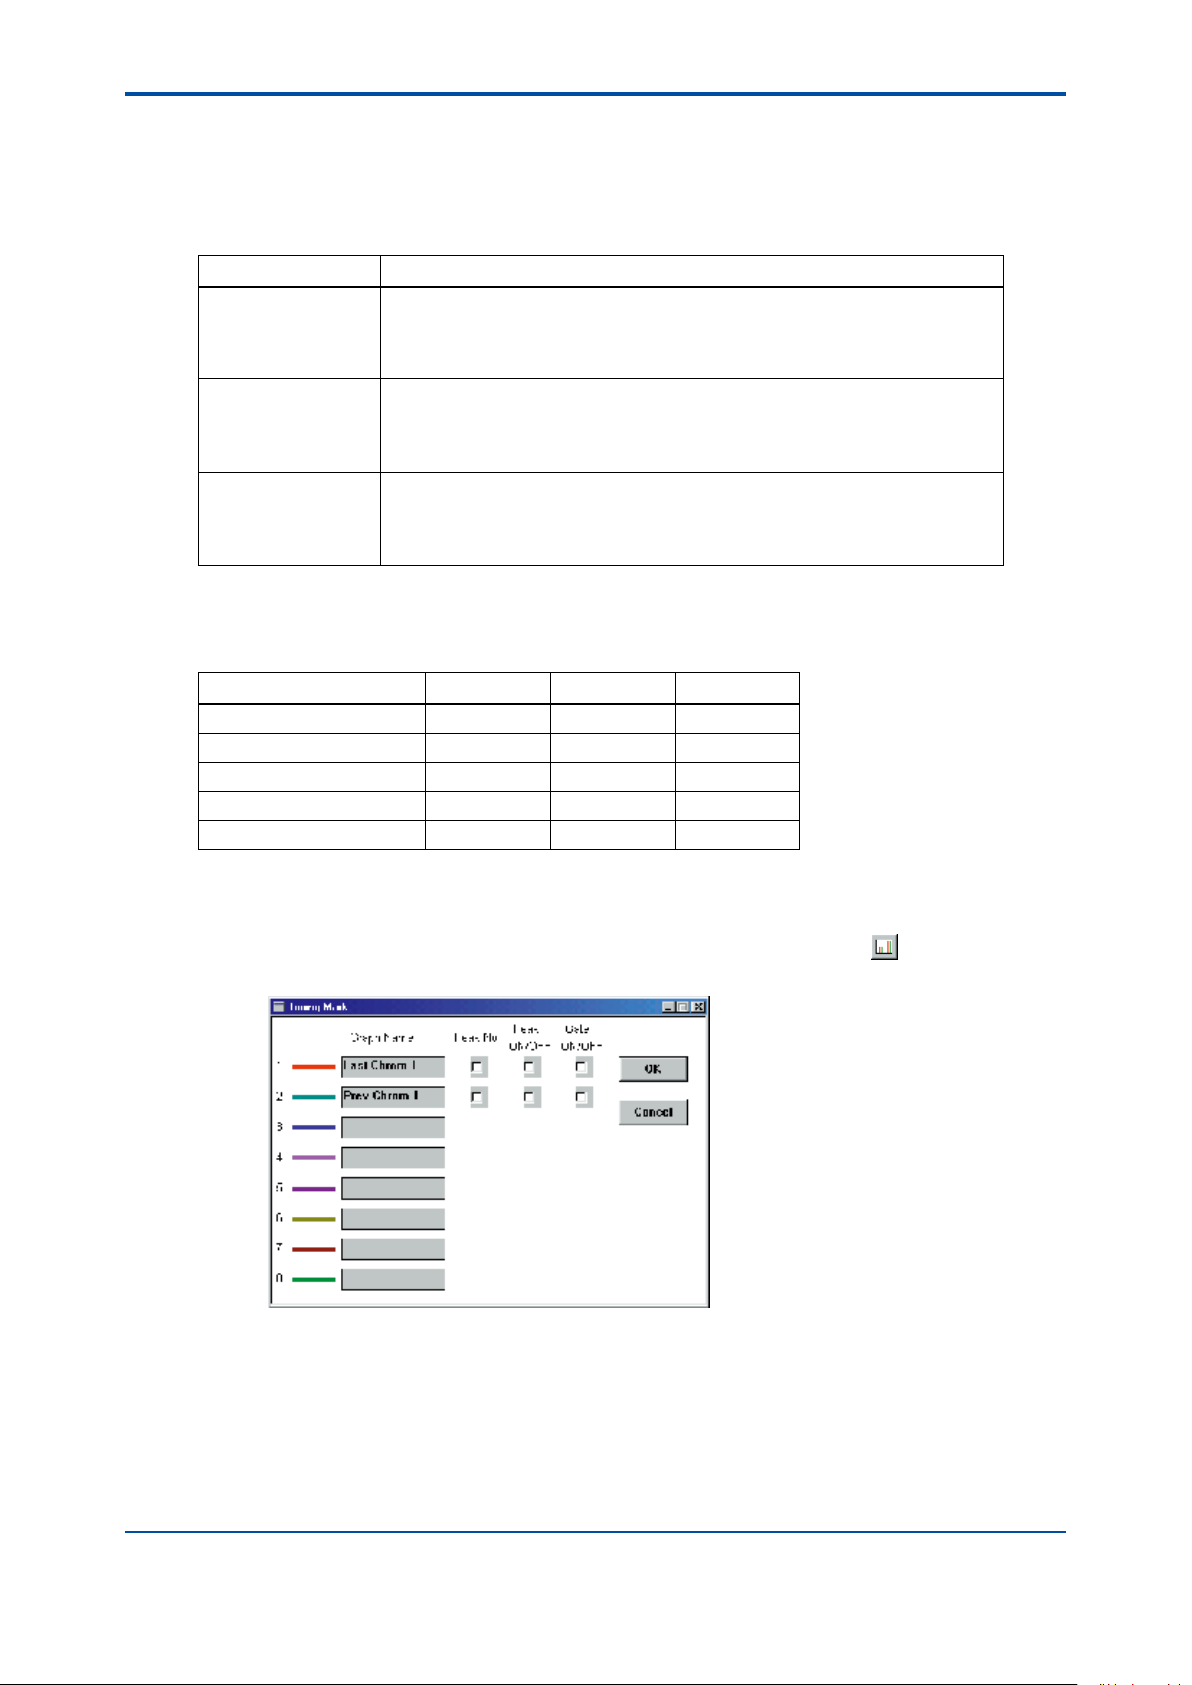
<4. Chromatogram Window>
n Mark Settings
l Types of Mark Information
You can edit the Timing Mark dialog box for each chromatogram to show or hide the information
listed in the following table.
Label Information Description
Peak No. The Chromatogram window shows the peak numbers at each peak of a
chromatogram. You can select the [Peak # Disp.] command in the [Options]
menu to choose the position of the peak number being indicated, either at the
top or the bottom of the chromatogram.
Peak on/off The Chromatogram window shows the starting and ending points of a peak, as
described below:
Starting point: a long arrow pointing downward
Ending point: a long arrow pointing upward
Gate on/off The Chromatogram window shows the on and off positions of a gate, as
described below:
ON: a short arrow pointing downward
OFF: a short arrow pointing upward
Each of the marks is the same color as the chromatogram in question.
Actual indications of the marks you have specied to display depends on the types of
chromatogram. The following table summarizes the rule.
4-7
Peak No. Peak On/Off Gate On/Off
Last chromatogram App. App. App.
Previous chromatogram App. App. App.
Filed chromatogram Cond. Cond. Cond.
Detail chromatogram N/A App. App.
Differential chromatogram N/A N/A N/A
App.: displayable; N/A: not displayable; Cond.: depends on the type of chromatogram saved
l Procedure
(1) Click on either the [Timing Mark] command in the [Graph] menu or the button on the
toolbar. The Timing Mark dialog box pops up.
F0409.ai
(2) For each chromatogram, check or leave unchecked the box under each marking, as
described below, to show or hide the information.
- Check to show.
- Leave unchecked to hide.
(3) Click on the [OK] button.
The mark(s) you have checked appear.
IM 11B03G03-03E
4th Edition : Mar. 21, 2012-00
Page 61

<4. Chromatogram Window>
l Setting the Position of a Peak Number
(1) Click on the [Peak# Disp.] command in the [Options] menu. The submenu of the command
opens.
Show the setting.
4-8
(2) Click on either [On the Chromatogram] or [Under the Chromatogram]. This determines the
position of the peak number on the graph.
n Viewing the Temperature Data
You can view the temperature data appropriate for the specied chromatogram in the Closeup
window. The temperature data appear as a broken line in the same color as the chromatogram in
question. The Chromatogram window can display up to two graphs of temperature data.
TIP
The chromatograms for which you can view temperature data are limited to the current chromatogram, previous
chromatogram, and led chromatograms which are other chromatograms that have already been saved in a
le. If you delete a chromatogram while its temperature data are displayed, the displayed data are also deleted
automatically.
l Procedure
(1) Click on either the [Temp./Press. Disp.] command in the [Graph] menu or the button on
the toolbar. The Temp./Press. Graph Selection dialog box pops up.
F0410.ai
F0411.ai
(2) From the list box, select the chromatogram appropriate for the temperature data being
shown. The list box lists the on-screen, current chromatogram, previous chromatogram, and
led chromatograms. To disable a display of the temperature data, select “None.”
(3) Check the Temp. box.
(4) Click on the [OK] button. This enables a display of the temperature data appropriate for the
chromatogram you specied. If you have selected “None” in step 2 above, a display of the
temperature data is disabled.
IM 11B03G03-03E
4th Edition : Mar. 21, 2012-00
Page 62
<4. Chromatogram Window>
4.4 Changing the Scale and Scrolling the Display
There are three scales on the chromatogram display: X-axis [sec], Y-axis [mV], and temperature
[°C]. These scales can be changed to the desired ones using the commands in the [Scale] menu
or Enlarge/Reduce buttons.
n Disabling and Enabling the Auto-scale Function
In the Chromatogram window scales are automatically set to display an overall view of the
chromatogram. This function is called “auto-scale”.
TIP
Changing the scale automatically disables the auto-scale function.
This section explains how to enable/disable the auto-scale function.
l Procedure
(1) To disable the auto-scale, click on either the [Auto Scale] command in the [Scale] menu or
the Auto-scale button on the toolbar. This enables the auto-scale, causing the check mark (
) next to the [Auto Scale] command to disappear and the Autoscale button to appear not-
depressed.
(2) To enable the auto-scale, click again on either the [Auto Scale] command in the [Scale]
menu or the Auto-scale button on the toolbar. This enables the auto-scale function again,
causing the check mark (
button to appear depressed.
) next to the [Auto Scale] command to appear and the Auto-scale
4-9
n Changing the Scale
l Enlarge/Reduce Buttons
Each clicking on the Enlarge/Reduce buttons changes the scale as shown in the following table.
buttons: reduces the scale
buttons: enlarges the scale
Scale Available Scale Increments
X-axis scale (sec) 0.2→0.5→1→2→5→10→20→50→100→200→500→1000→
Y-axis scale (mV) 0.1→0.2→0.5→1→2→5→10→20→50→100→200→500→1000
Temperature (°C) 10→50→100→200
The scales are common to both chromatograms and graphs of temperature data.
2000→5000→10000→20000→50000
n Scrolling the Display
Scrolling the display to view the chromatogram not shown on the display, typically when the
entire chromatogram cannot t in the display because of, for example, scale enlargement.
The display can be scrolled using either of the following two methods.
l Method 1
Click on the , , , or button at either end of the scroll bars. The chromatogram scrolls in
the direction of the arrow by one increment of the scale with each click.
IM 11B03G03-03E
4th Edition : Mar. 21, 2012-00
Page 63
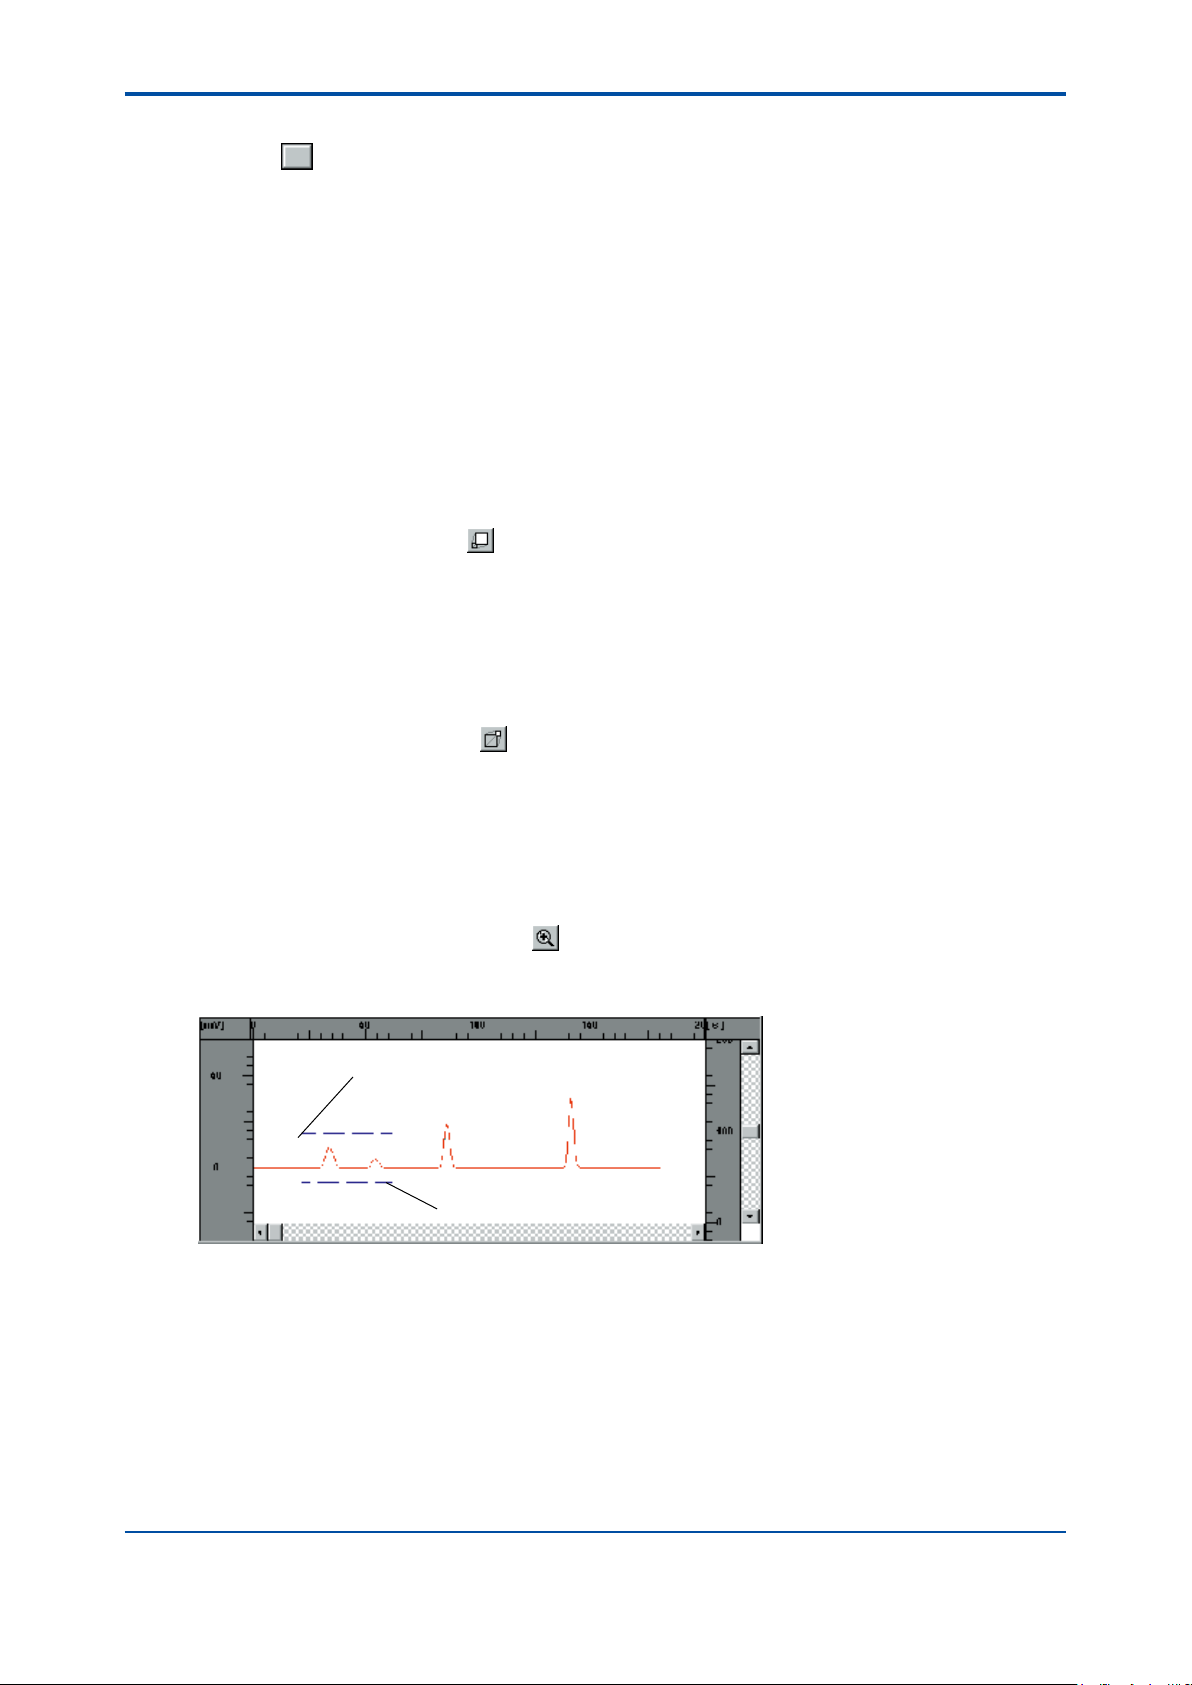
<4. Chromatogram Window>
l Method 2
Drag the button on the scroll bar. The chromatogram scrolls to the new position of the button.
4.5 Zooming and Temporarily Saving Chromatograms
In the Closeup window, a specic area of the chromatogram can be zoomed in (or enlarged) for
detailed view, and the enlarged part can be temporarily saved so that it can be viewed later, even
after the window has been updated. This section explains how to zoom in/out using the buttons
on the toolbar. Zooming can also be achieved by using the commands in the [Scale] menu.
n Zooming In
l Procedure
Click on the [Zoom-in] button ( ) on the toolbar. Both the X- and Y-axis scales expand by one
scale increment with the reference point at the center of the Closeup window. Zooming-in can
also be achieved by using the [Zoom In] command in the [Scale] menu.
4-10
n Zooming Out
l Procedure
Click on the [Zoom-out] button ( ) on the toolbar. Both the X- and Y-axis scales reduce in size
by one scale increment with the reference point at the center of the Closeup window. Zoomingout can also be achieved by using the [Zoom Out] command in the [Scale] menu.
n Partial Zooming In
l Procedure
(1) Click on the [Part Zoom] button ( ) on the toolbar.
(2) On the overall view area or Closeup window, drag the mouse diagonally from the starting to
the ending point of the area you want to zoom in.
Starting point
Ending point
F0412.ai
The specied area is enlarged to fully t in the Closeup window.
IM 11B03G03-03E
4th Edition : Mar. 21, 2012-00
Page 64
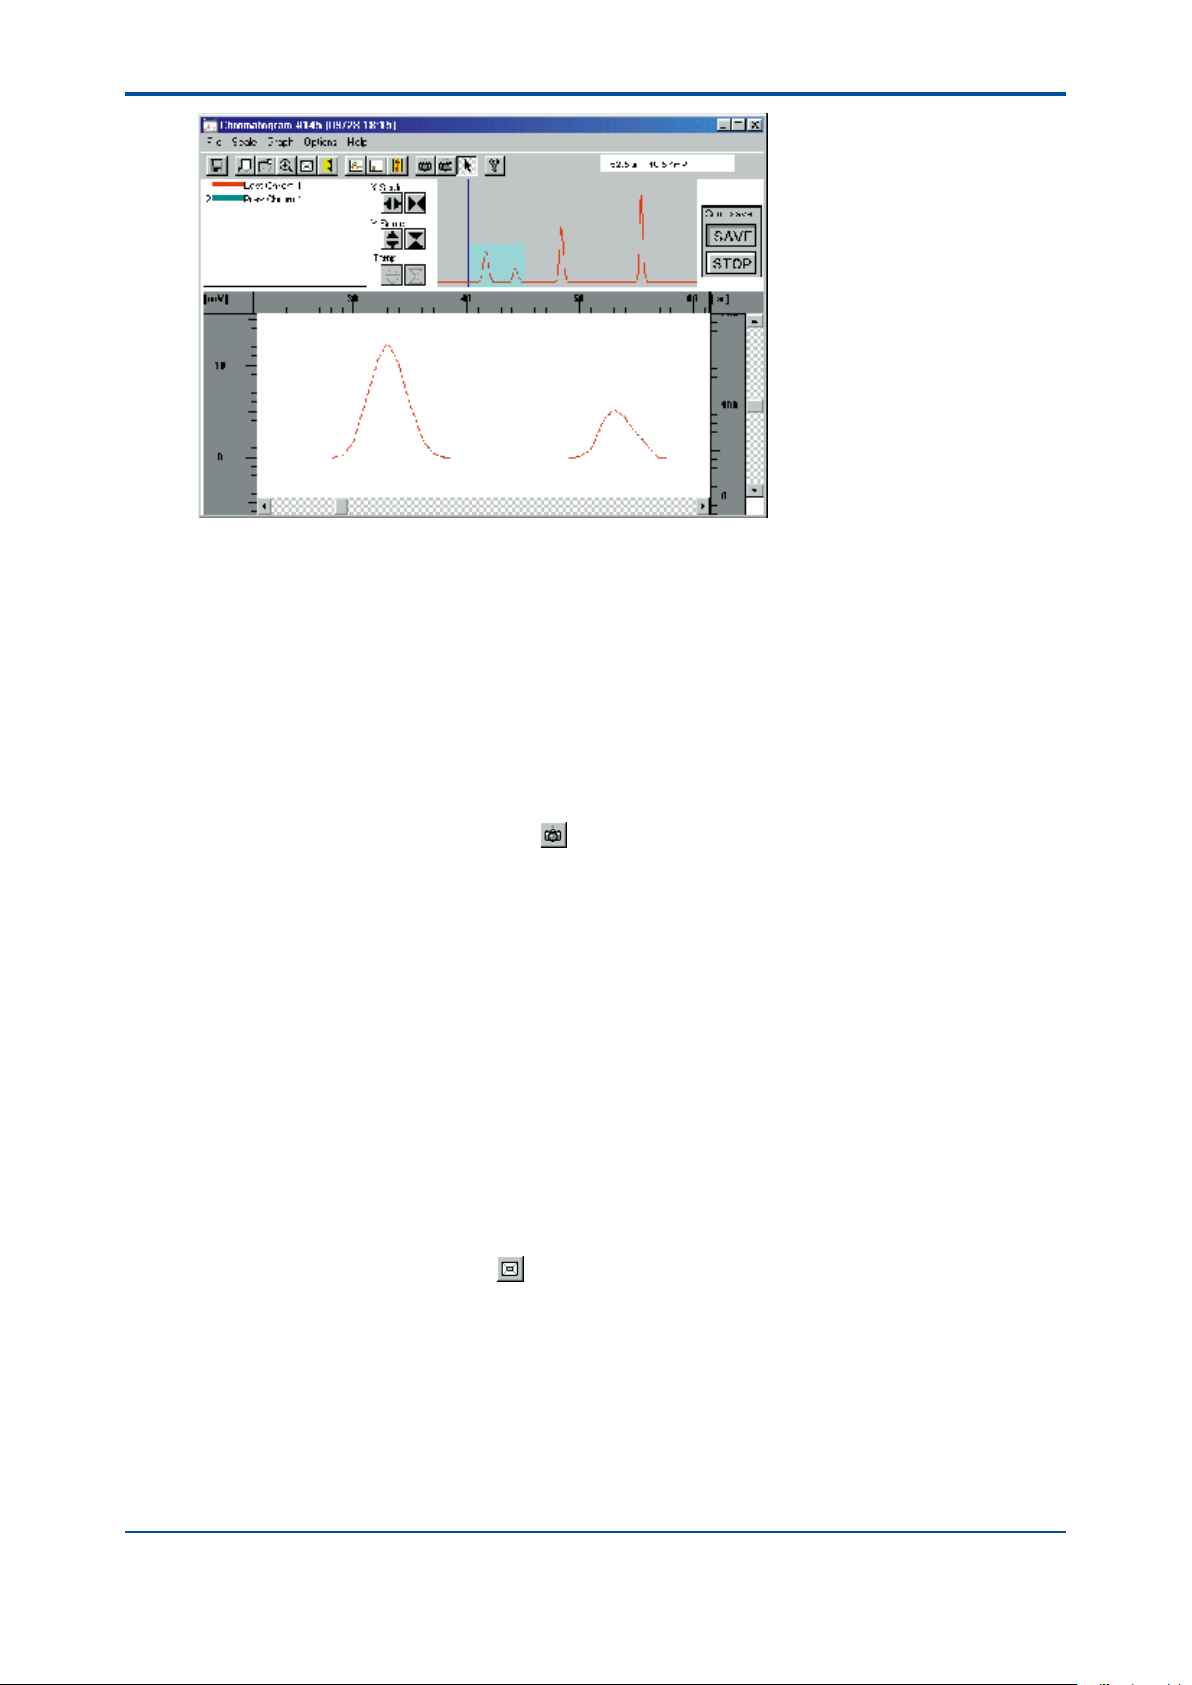
<4. Chromatogram Window>
F0413.ai
Selecting the [Part Zoom] button automatically disables the auto-scale. Partial zooming-in can
also be achieved by using the [Part Zoom] command in the [Scale] menu. The range of the
partially enlarged area specied in the above procedure may differ from the actual displayed
range shown in the Closeup window due to a programmatic reason.
4-11
n Temporary Saving (Snapshot)
This subsection explains how to temporarily save the partially enlarged chromatogram obtained
in the previous subsection.
l Procedure
(1) Click on the [Snapshot 1] button ( ) on the toolbar. The red lamp on the [Snapshot 1]
button turns on and the on-screen chromatogram is temporarily saved in memory.
(2) To view the temporarily saved chromatogram after changing the display back to the
previously opened one, click on the [Snapshot 1] button with red light. The chromatogram
saved as Snapshot 1 appears.
(3) To delete the temporarily saved chromatogram, click on the [Options] menu, point to [Snap
Shot], and then click on the [Clear] command. The saved chromatogram is deleted and the
red lamp on the [Snapshot 1] button turns off.
• Two different chromatograms can be saved temporarily as Snapshot 1 and Snapshot 2.
• The [Snap Shot] command in the [Options] menu can also be used for temporary saving.
• The images of Snapshot 1 and Snapshot 2 are automatically erased upon the start of each
new analysis cycle.
n Full Display
l Procedure
Click on the [Full Display] button ( ) on the toolbar. The position and scale of the chromatogram
are recalculated and the chromatogram returns to its original size.
• The [Full Disp] command in the [Scale] menu can also be used for viewing the full display.
IM 11B03G03-03E
4th Edition : Mar. 21, 2012-00
Page 65

<4. Chromatogram Window>
4.6 Saving Chromatograms
In the Chromatogram window, the chromatogram derived from the measurement in progress can
be viewed and also chromatograms saved in a le can be retrieved and viewed.
n Saving
l Saving Chromatograms
A currently displayed chromatogram can be saved in the hard disk of a personal computer.
Click on the [Save Chromatogram] button (
dialog box pops up.
) on the toolbar. The File Chromatogram Selection
F0414.ai
4-12
From the chromatograms shown in the list, select the one you want to save, and then click on the
[OK] button.
F0415.ai
In the File Name eld, type the le name, followed by an extension of “.crp”. Then click on the
[OK] button. The chromatogram is saved to that le.
l Continuous Saving of Chromatograms
The current chromatogram can be saved by analysis cycle in the hard disk of a personal
computer.
IM 11B03G03-03E
4th Edition : Mar. 21, 2012-00
Page 66

<4. Chromatogram Window>
l Starting Continuous Saving
There are two methods to start continuous saving:
(1) First, make sure that no check mark appears next to the [Continuous Saving] command in
the [File] menu. And then click on the [Continuous Saving] command.
(2) Click on the [SAVE] button in the Continuous-saving indication.
F0416.ai
l Stopping Continuous Saving
There are two methods to stop continuous saving:
(1) Click on the [Continuous Saving] command with a check mark.
(2) Click on the [STOP] button in the Continuous-saving indication.
4-13
In both cases, a message box of “Stop continuous saving?” appears. Click on the [Yes] button to
stop continuous saving. Note that the current chromatogram displayed when the stop command
is executed, is not saved.
l Filing of Continuously Saved Chromatograms
File names for continuously saved chromatograms are automatically created as follows.
Assuming that the starting time of an analysis is 15:12, June 16, 1999. The le name is:
96161512.crp
9: Year (last digit)
6: Month (hexadecimal notation: Oct=A, Nov=B, Dec=C)
16: Day
15: Hour
12: Minute
.crp: An extension for chromatogram les
Directories in which the les of continuously saved chromatograms are to be saved are
determined by the detector number and the starting month of analysis in the “DATA” directory
right under the install directory.
Assuming that the install directory is “C:\GC1000”, the detector number is 1, and the starting time
of an analysis is 15:12, June 16, 1999. The le is saved under:
C:\GC1000\DATA\Det1\199906\
NOTE
• Continuous saving of chromatograms is valid only when the system is in the Run mode
under either the Process or Lab status.
• If the operation mode is changed during continuous saving, the continuous saving is aborted
at that moment.
• Continuous saving is immediately aborted when the remaining free space of the hard disk
falls down to 1 MB or below.
IM 11B03G03-03E
4th Edition : Mar. 21, 2012-00
Page 67

<4. Chromatogram Window>
TIP
How to print chromatograms
• Use the CAPTURE IT! tool to make hard copies of chromatograms.
• See the Capture It Operation Manual, IM 11B3G1-02E, to learn more about the tool.
4-14
IM 11B03G03-03E
4th Edition : Mar. 21, 2012-00
Page 68

<5. Alarm Windows>
5-1
5.
Alarm Windows
Alarm windows show information on alarms which have occurred in the analyzer. There
are three types of alarm windows depending on the information presented: Alarm Status,
Alarm History, and Alarm Detail Description. This chapter describes the types and layouts
of alarm windows, how to open and close the windows, how to delete records on alarm
history,andhowtocreatedescriptionsforuserdenedalarms.
Window Switching Sequence
Analyzer
Operation
window
[Alarm Status]
command
Alarm
Status
display
[Alarm History]
command
[Alarm Status]
command
[Alarm History]
command
Alarm
History
window
[View]
command
[Alarm Details]
command
Alarm Number
Selection
dialog box
[Execute]
[Cancel]
[Close] command
Alarm Detail
Description
window
F0501.ai
IM 11B03G03-03E
4th Edition : Mar. 21, 2012-00
Page 69

<5. Alarm Windows>
5.1 Types and Layouts of Alarm Windows
There are three types of alarm windows: Alarm Status, Alarm History, and Alarm Detail
Description.
n Alarm Status Window
The Alarm Status window displays all the current alarms in chronological order. To view the
contents not shown on the initial screen, use the scroll bar.
l Window Layout
5-2
n Alarm History Window
The Alarm History window displays 100 most recent alarms which have occurred to date.
To view the contents not shown on the initial screen, use the scroll bar.
l Window Layout
Scroll bar
Scroll bar
F0502.ai
F0503.ai
IM 11B03G03-03E
4th Edition : Mar. 21, 2012-00
Page 70
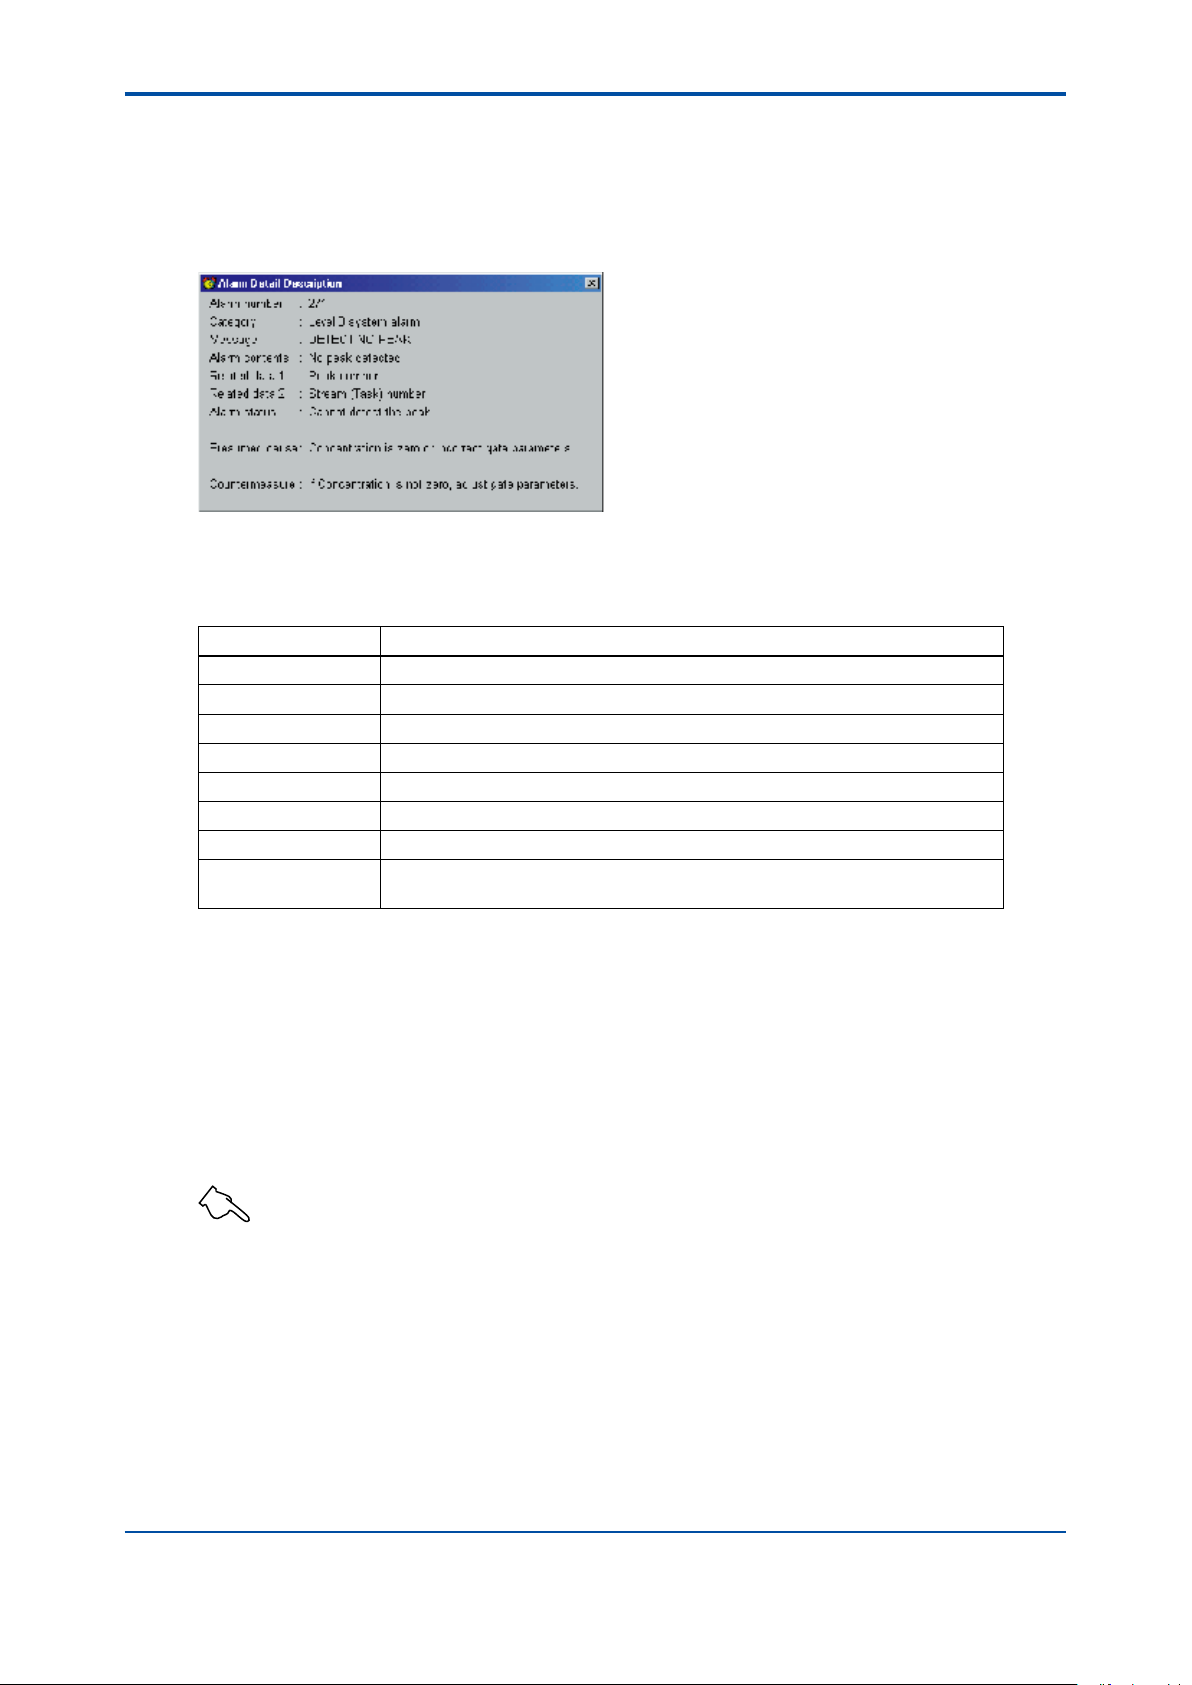
<5. Alarm Windows>
n Alarm Detail Description Window
The Alarm Detail Description window provides detailed information on the alarm specied by the
alarm number.
l Window Layout
F0504.ai
l Description of Items
The following table summarizes the details on the items in the window.
Item Description
Alarm number The alarm number specied when this window is opened.
Category Shows the alarm level (1-3) and type of alarm.
Message The same message as the one displayed on the LCD panel of the analyzer
Alarm contents Shows the meaning or purpose of the alarm.
Related data 1/2 Shows the meaning of related data and its scale if the alarm has a reference.
Alarm status Shows the alarm criteria and limit values.
Presumed cause Shows the likely cause of the alarm.
Countermeasure Suggests a fundamental countermeasure or a temporary corrective action
according to the likely cause.
5-3
5.2 Opening and Closing Alarm Windows
The alarm windows (Alarm Status, Alarm History, and Alarm Detail Description) can be opened
from any of the following windows or box.
• Analyzer Operation window
• Alarm message box
In addition, you can switch between the Alarm Status and Alarm History windows or open the
Alarm Detail Description window from either of these two windows.
See Also
See Section 3.8 for details on the alarm message box.
Note that you can exit any alarm window by using the general operation for closing a window.
IM 11B03G03-03E
4th Edition : Mar. 21, 2012-00
Page 71

<5. Alarm Windows>
n Opening Alarm Windows from the Analyzer Operation Window
l Opening the Alarm Status Window
In the Analyzer Operation window, click on the [Alarm Status] command in the [Display] menu.
The Alarm Status window opens.
5-4
l Opening the Alarm History Window
In the Analyzer Operation window, click on the [Alarm History] command in the [Display] menu.
The Alarm History window opens.
F0505.ai
F0506.ai
l Opening the Alarm Detail Description Window
(1) In the Analyzer Operation window, click on the [Alarm Details] command in the [Display]
menu. The Alarm Detail Description dialog box pops up, asking you to specify the alarm
number.
F0507.ai
IM 11B03G03-03E
4th Edition : Mar. 21, 2012-00
Page 72

<5. Alarm Windows>
(2) Type in the alarm number and click on the [Execute] button. The Alarm Detail Description
window for the specied alarm number opens.
5-5
F0508.ai
HELP !
If you have typed an unregistered alarm number, the number appears as an “undened alarm.” In that case, close
the Alarm Detail Description window, and then retype in the correct alarm number.
n Opening an Alarm Window from Another Alarm Window
l Opening the Alarm Status Window
While the Alarm History window is open, click on the [Alarm Status] command in the [View] menu.
The Alarm Status window opens.
l Opening the Alarm History Window
While the Alarm Status window is open, click on the [Alarm History] command in the [View] menu.
The Alarm History window opens.
l Opening the Alarm Detail Description Window
While the Alarm Status or Alarm History window is open, click the right mouse button on the
alarm number in question.
Click the right mouse button.
The Alarm Detail Description window for the specied alarm number opens.
• The Alarm Detail Description window can also be opened by clicking on the [Display]
command in the [Detail] menu.
n Closing the Alarm Window
While the alarm window is active, click on the [Close] command in the control menu.
The alarm window closes and the screen returns to the parent window.
F0509.ai
IM 11B03G03-03E
4th Edition : Mar. 21, 2012-00
Page 73

<5. Alarm Windows>
5.3 Deleting the Records of Alarm History
The displayed contents of the Alarm History window can be cleared to restart recording alarms.
NOTE
The contents of the Alarm History window can be erased only at user level B or C.
n Deleting Historical Alarms
l Procedure
In the Alarm Status or Alarm History window, click on the [Clear History] command in the [View]
menu. The contents of the Alarm History window are erased.
5.4 Creating a User Alarm Description
For user-dened alarms and alarms raised by an external contact (DI) (those set in the Alarm
Setting window on the LCD panel), the user can edit the contents of the alarms that are shown in
the Alarm Detail Description window.
5-6
NOTE
Messages for user-dened alarm must be dened here in the Maintenance Terminal, although
they can be dened from the LCD panel of the analyzer itself. User-dened alarms set in the
analyzer and in the Maintenance Terminal are independent of each other.
n DenedInformation
l User Alarm Description window
Use this window to dene the description of a user alarm.
F0510.ai
l DenedItems
The following table lists the items which can be dened in the User Alarm Description window.
IM 11B03G03-03E
4th Edition : Mar. 21, 2012-00
Page 74
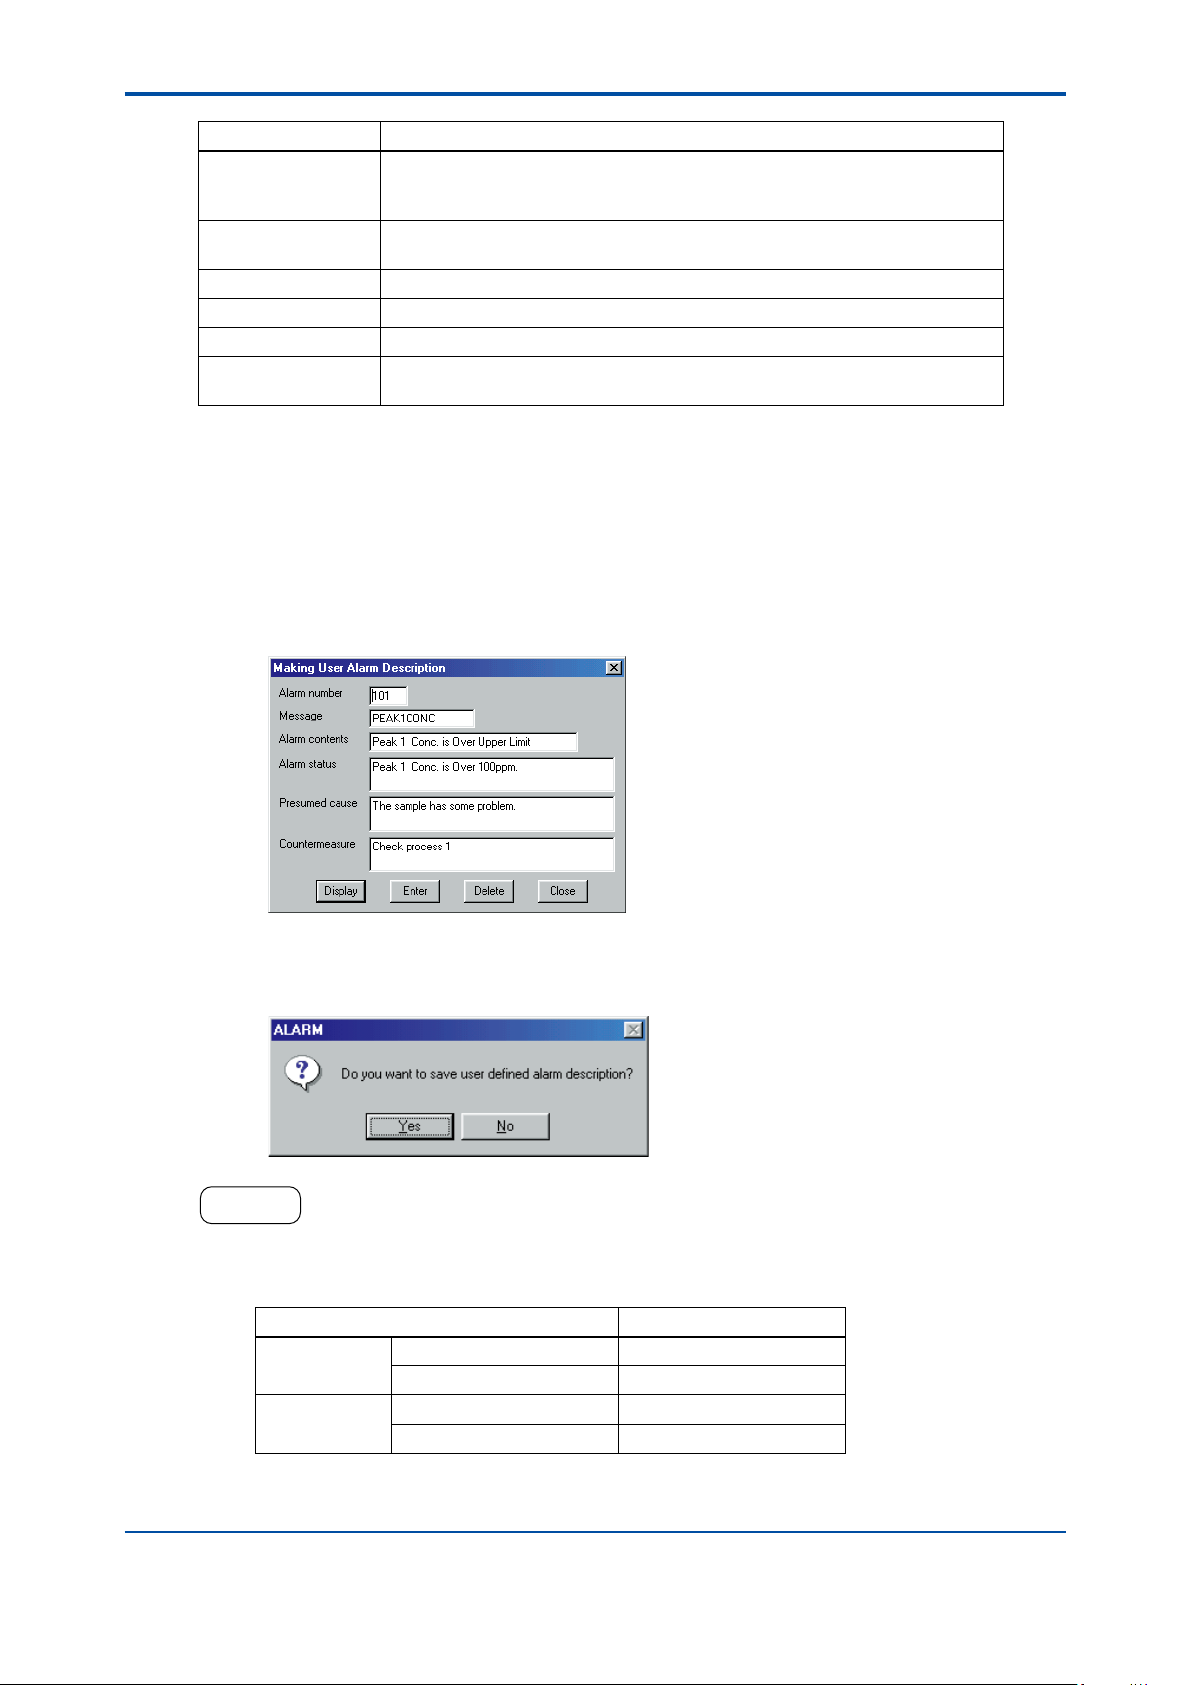
<5. Alarm Windows>
Item Description
Alarm number The number of the alarm for which the user alarm description has been
created. Type in one of the alarm numbers already registered with the Alarm
Setting window of the LCD panel.
Message Type in the alarm message (up to 16 letters). This item must be registered
independently of the one registered on the LCD panel of the analyzer.
Alarm contents Type in an explanation and/or the purpose of the alarm (up to 32 letters).
Alarm status Type in the alarm criteria and limit value(s) (up to 80 letters).
Presumed cause Type in the likely cause of the alarm (up to 80 letters).
Countermeasure Type in the fundamental countermeasure or temporary corrective action
according to the likely cause (up to 80 letters).
n DeningDetailedDescriptions
l Procedure
(1) In the Alarm Status or Alarm History window, click on the [Making User Alarm Description]
command in the [Detail] menu. The User Alarm Description window opens.
(2) Type in the alarm number, message, alarm contents, alarm status, presumed cause, and
countermeasure.
5-7
F0511.ai
• Enter an alarm number and then click on the [Display] button to view the previously dened
description for the alarm.
(3) Click on the [Enter] button. A conrmation dialog box pops up.
F0512.ai
HELP !
• If the alarm number entered is out of the scope of the numbers allocated for userdened alarms, a dialog
box of “UNDEFINED USER ALARM” pops up. Check the alarm number and reenter the correct one.
• The applicable ranges of used-dened alarm numbers are summarized in the following table.
Alarm Type Range of Alarm Numbers
Alarm level 2 User-dened alarms 101 to 132
Alarms generated by DI 141 to 148
Alarm level 3 User-dened alarms 201 to 232
Alarms generated by DI 241 to 248
(4) Click on the [OK] button. The dened, detailed description is written to an initialization le.
IM 11B03G03-03E
4th Edition : Mar. 21, 2012-00
Page 75

<5. Alarm Windows>
(5) Repeat steps 2 through 4 for dening descriptions for another user-dened alarms, if any.
(6) Click on the [Close] button to nish.
n Deleting a User Alarm Description
l Procedure
(1) In the Alarm Status or Alarm History window, click on the [Making User Alarm Description]
command in the [Detail] menu.
(2) Type in the alarm number and click on the [Display] button. The dened description for the
alarm number appears.
(3) Click on the [Delete] button. A conrmation dialog box pops up. If you want delete the on-
screen user alarm description, click on the [OK] button.
(4) The user alarm description of the specied alarm number is erased and deleted from
initialization le “GIMT.INI”.
(5) Click on the [Close] button to nish.
5-8
IM 11B03G03-03E
4th Edition : Mar. 21, 2012-00
Page 76

<6. Analysis Results Windows>
6-1
6.
Analysis Results Windows
Analysis Results windows display the data analyzed by the analyzer. They consist of a total of eight windows: four acquisition windows that acquire analysis results and four ref-
erencewindowsthatareusedtoopenandrefertoles.Also,onahistoryrecordwindow,
a graph window can be viewed at the same time. This chapter describes how to open and
closetheAnalysisResultswindows,thetypesandcongurationsofthewindows,how
to switch between the windows, how to save and read data, how to process and re-save
data, and how to graph and reset historical data.
Window Hierarchy
Analysis results
Analyzer Operation
Analysis results
windows
File reference
windows
window *1
window
Double-click on the analysis
results icon.
Analysis results window *2
Latest Analysis
Results window
Concentration Analysis
History window
Retention Time History
window
Lab Analysis Results
window
Filed Analysis
Results window
Filed Concentration
Analysis History
Filed Retention Time
History window
Filed Lab Analysis
Results window
Minimize
[Exit] command
on the [File] menu
window
End of the analysis
results window
Analyzer Operation
window
[OK]
Confirmation message
[Cancel]
History windows
[Draw] command
on the [Graph] menu *3
History windows with
graphic window
*1: Appears as an icon.
*2: Switch to each window using the [Window] menu.
*3: The [Graph] menu can be used in a history window.
F0601.ai
IM 11B03G03-03E
4th Edition : Mar. 21, 2012-00
Page 77
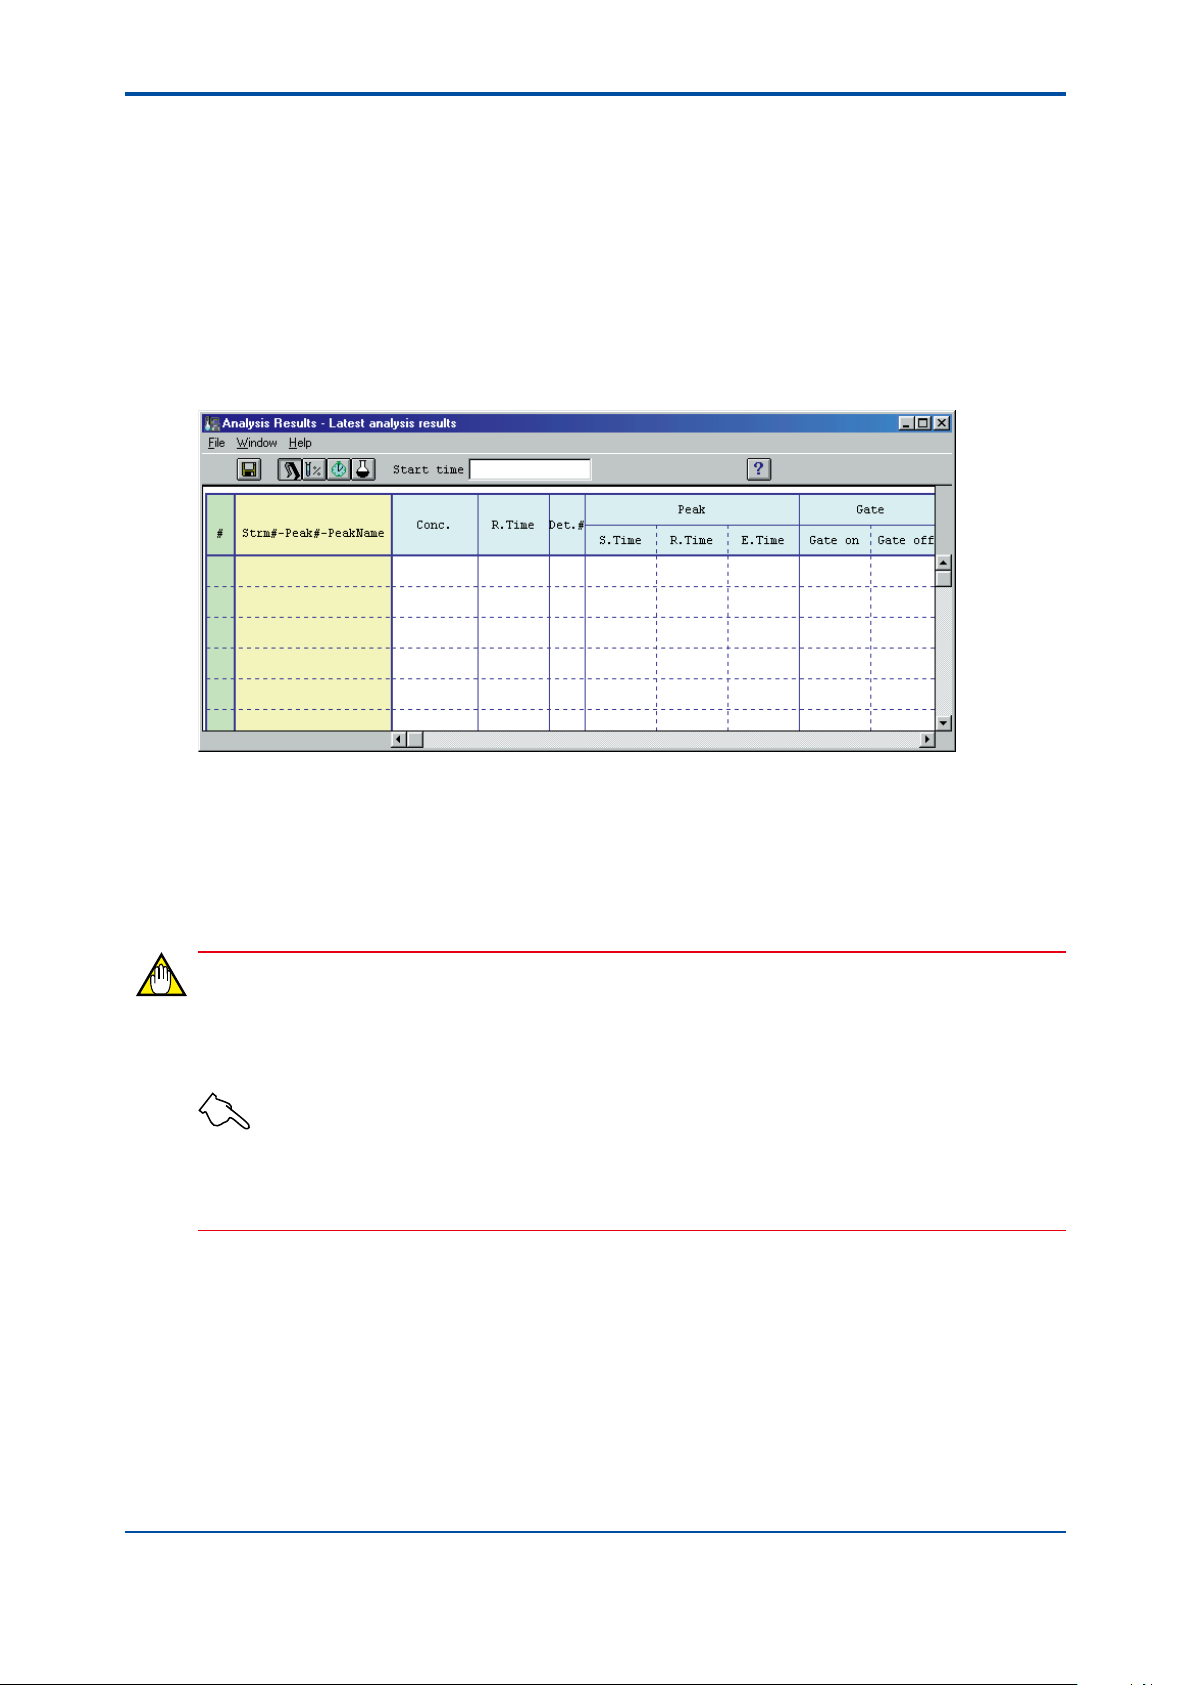
<6. Analysis Results Windows>
6.1 Opening and Closing an Analysis Results Window
The Latest Analysis Results window opens when the Analysis Results window is started.
n Opening the Window (Latest Analysis Results Window)
l Procedure
Double-click on the icon of the analysis results window while the Analyzer Operation window is
open. The Analysis Results window is activated and the Latest Analysis Results window opens.
6-2
n Closing the Window
l Before Closing the Window
When closing the Analysis Results window, take note of the following.
NOTE
• Only the concentration analysis history and the retention time history can be saved in the
window-closing procedure. If there are any other windows to be saved, save them before
closing the Analysis Results window.
See Also
For details on saving windows, see Section 6.4.
• Close the Analysis Results window at the same time as you close the Analyzer Operation window. When
not in use, the Analysis Results window should be minimized as icons.
F0602.ai
IM 11B03G03-03E
4th Edition : Mar. 21, 2012-00
Page 78
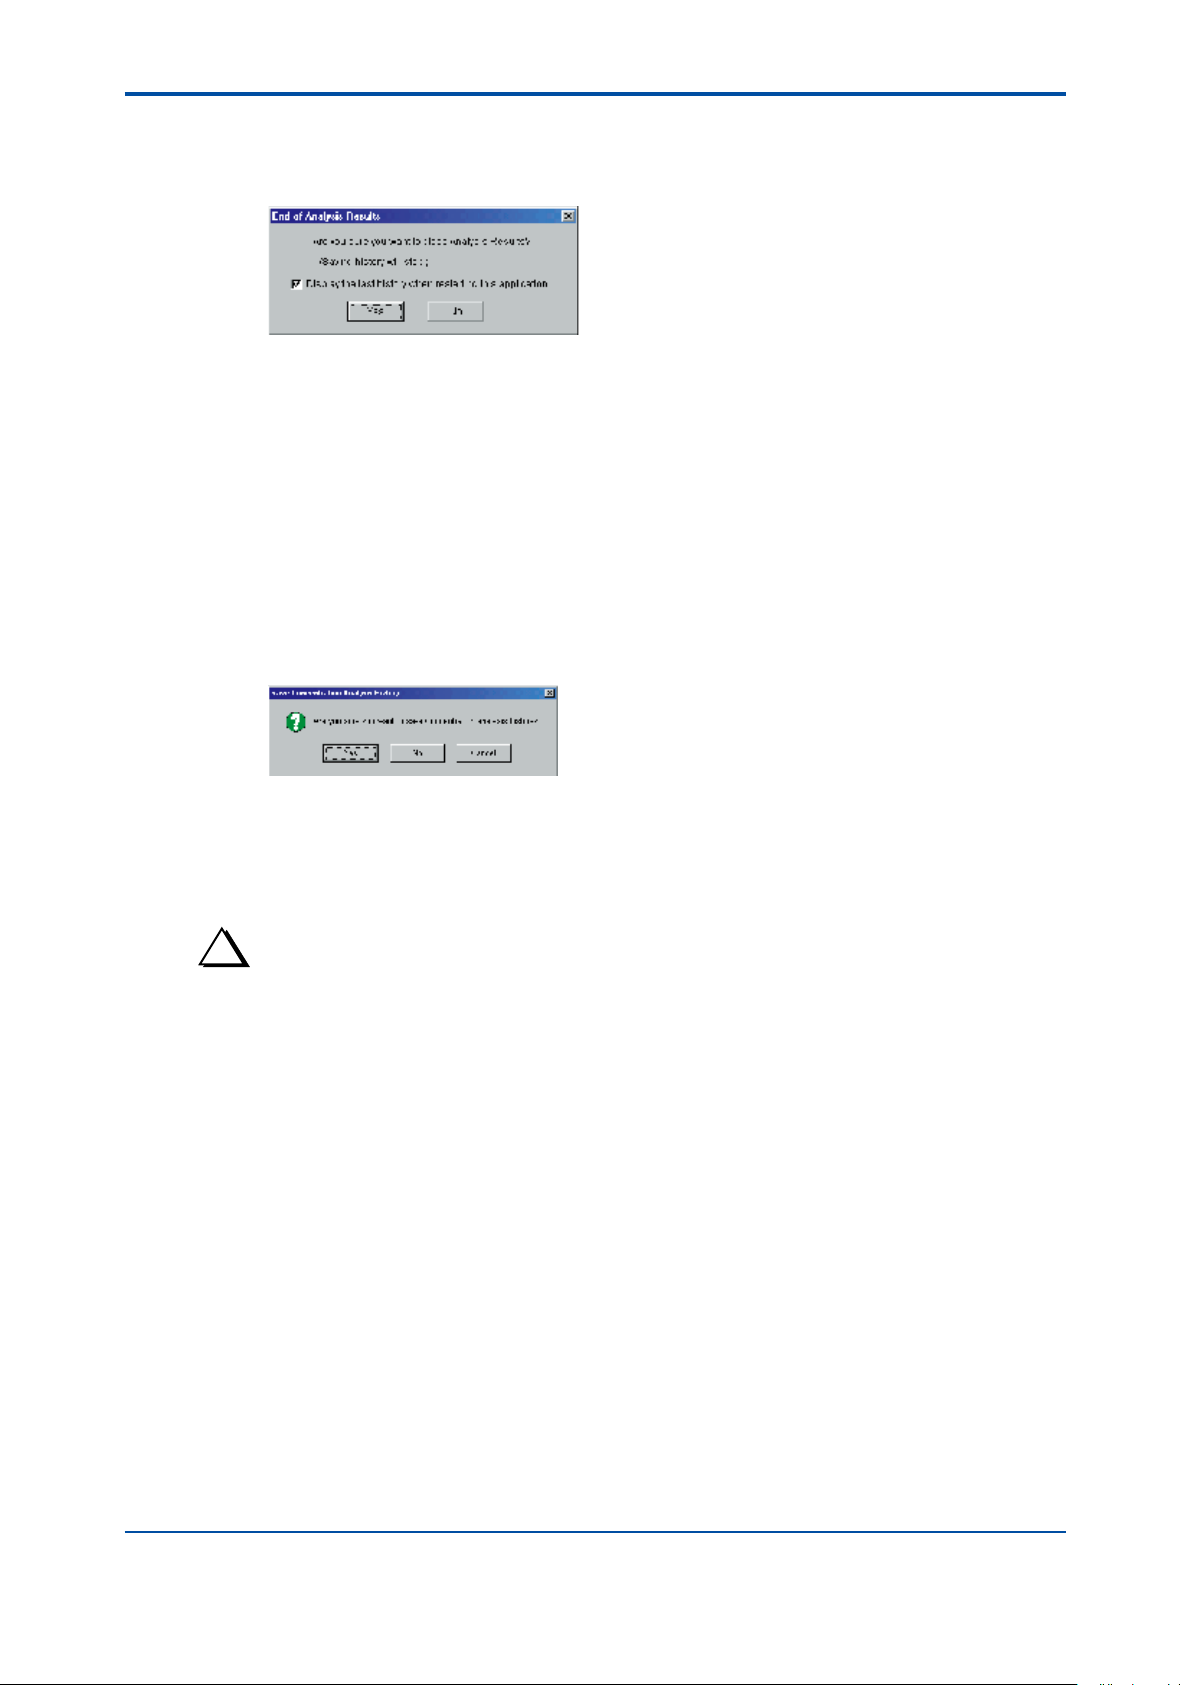
<6. Analysis Results Windows>
l Procedure
(1) Click on the [Exit] command in the [File] menu. A dialog box pops up to conrm the end of
the session.
6-3
F0603.ai
Checking the box next to “Display the last history when restarting this application”, allows
the last history data to be retrieved and included in analysis result data when the analysis
results window is opened next time. It is recommended that this function be enabled by a
checking mark here.
If the assigned total number has been changed by the time of the next startup, the last
history data will not be included even if the box next to “Display the last history when
restarting this application” is checked, and all the information will be reset. Note that all the
data that have not been saved before or at the last time the window is closed will be erased.
If the Analysis Results window is not closed in a normal way due to errors or other reasons,
the last history data will not be retrieved and all the information will be reset.
(2) Click on the [Yes] button.
A dialog box pops up to ask if you want to save the historical records on concentration
analysis, and then the historical records on retention time.
F0604.ai
(3) If you want to save the records, click on the [Yes] button. Type the destination for saving
in the dialog box. After saving, the Analysis Results window closes. If you do not want to
save them, click on the [No] button. The Analysis Results window closes without saving the
historical records.
To abort closing of the Analysis Results window, click on the [Cancel] button.
TIP
How to Minimize the Window to an Icon
• To minimize an Analysis Results window to an icon, click the Minimize button ( ) in the top right of the
window.
IM 11B03G03-03E
4th Edition : Mar. 21, 2012-00
Page 79
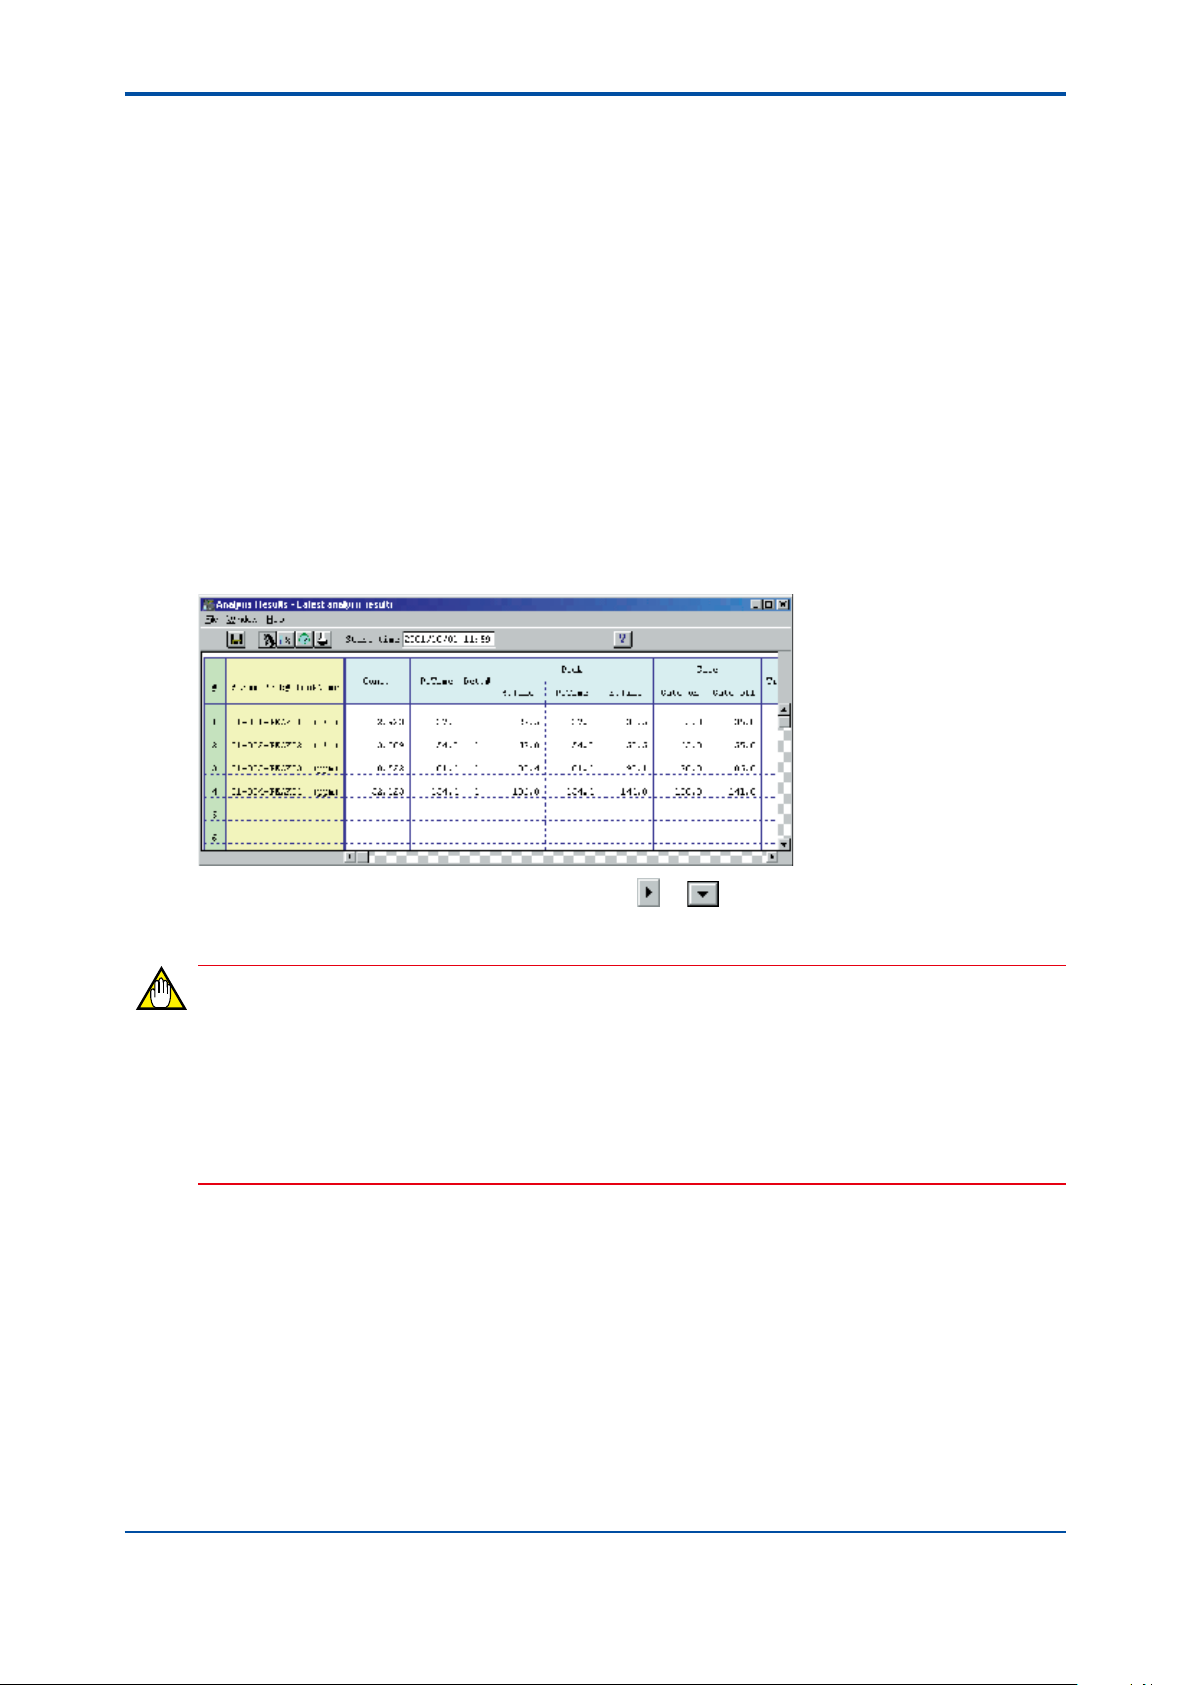
<6. Analysis Results Windows>
6.2 Types and Layouts of Analysis Results Windows
The Analysis Results windows consist of the windows for acquiring analysis results (Latest
Analysis Results, Concentration Analysis History, Retention Time History and Laboratory
Analysis Results windows) and the windows for referring to les (File Analysis Results, File
Concentration Analysis History, File Retention Time History and File Laboratory Analysis Results
windows). This section describes the layouts and contents of these windows.
n Latest Analysis Results Window
The Latest Analysis Results window displays the most recent results of analysis for the stream
done by the analyzer in the Process mode. The analysis results are updated each time the
analyzer completes an analysis. To record the current data for future reference, save this window.
To view the data not shown on the initial screen, use the scroll bar.
l Window Layout
The following gure shows the layout of the Latest Analysis Results window.
6-4
F0605.ai
To view the unseen parts of the data, click on the or buttons on the horizontal or vertical
scroll bar to scroll the page.
NOTE
If settings of the Stream Sequence or Peak are changed while the Analysis Results window is
active:
• Click on the [Exit] command in the [File] menu to close the Analysis Results window once.
Next, exit the Maintenance Terminal. And then, restart the Maintenance Terminal, and
reopen the Analysis Results window. Continuous operation without restarting the overall
functions of the Maintenance Terminal may result in incorrect data display.
IM 11B03G03-03E
4th Edition : Mar. 21, 2012-00
Page 80

<6. Analysis Results Windows>
l Contents of Information
The following table summarizes the contents of the data items shown in the Latest Analysis
Results window.
Item Description
Analysis start time Indicates the date and time when analysis of the on-screen data started.
# Indicates the relative number (1 to 255) of peaks (the serial number of all peaks of all
Stream# - Peak#
- Peak name
Concentration Indicates the concentration for each peak (the unit of concentration immediately
Retention time Indicates the retention time (in seconds) for each peak.
Det. # Indicates the detector number (1 or 2) for each peak.
Peak-peak start/
retention/peak end
Gate start/gate end Indicates the gate start time/end time (in seconds) for each peak.
Tracking Indicates the state of tracking for each peak as “Baseline”, “Tracking” or “None.”
Peak levelstart/
height/end
Area Indicates the integrated value (mV-sec) of the level for each peak.
Shape Indicates the state of data processing for each peak using a two-character code.
Half width Indicates the half width (in seconds) for each peak.
Tailing factor Indicates the tailing factor for each peak
Variation coefcient Indicates the concentration variation coefcient for each peak.
Method Indicates the concentration calculation method for each peak. Indicates Area
streams).
Indicates the peaks of the stream, in ascending order (in the order of their assignment)
of the peak number, in which the latest analysis has been executed.
The system uses dashes “-” to connect the stream number, peak number and
peak name in sequence, followed by the concentration unit (%, ppm or no unit) in
parentheses.
follows the peak name).
Indicates the starting time/retention time/ending time (in seconds) for each peak
processing.
Indicates the starting level/top level/ending level (mV) for each peak.
Indicates “p” if it is a tangent correction, or “H” if it is a vertical separation.
correction, Calibration, External third-order expression, External linearization, or
Indirect method, appropriate for the given concentration calculation method.
(There is no indication if there is no appropriate method.)
6-5
IM 11B03G03-03E
4th Edition : Mar. 21, 2012-00
Page 81
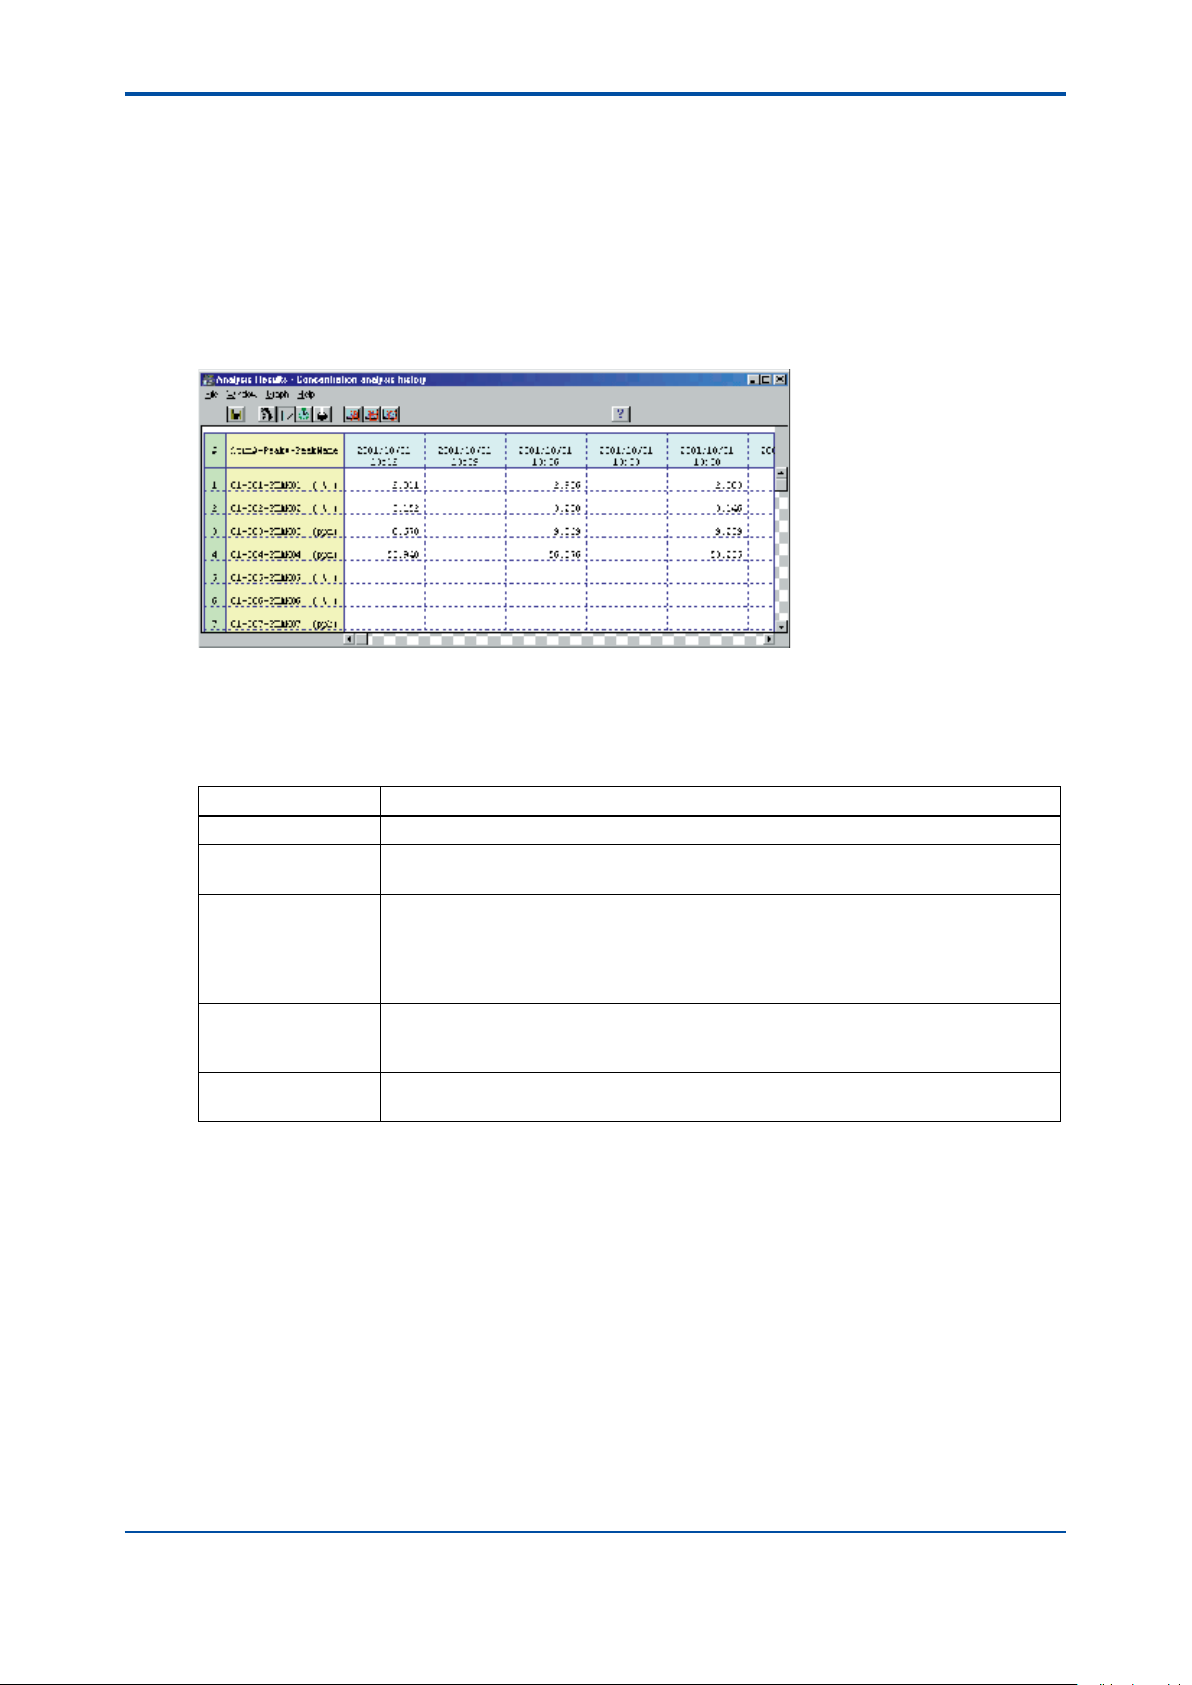
<6. Analysis Results Windows>
n Concentration Analysis History Window
The Concentration Analysis History window is used to view the trend of the concentration data
which the analyzer has analyzed to date in the Process mode. This window shows all the peaks
assigned at the startup of the Analysis Results window. The Concentration elds of peaks not
measured at the given time remain blank. To view the data not shown on the initial screen, use
the scroll bar.
l Window Layout
The following gure shows the layout of the Concentration Analysis History window.
F0606.ai
6-6
l Contents of Information
The following table summarizes the contents of the data items shown in the Concentration
Analysis History window.
Item Description
Analysis start time Indicates the date and time when analysis of the on-screen data started.
# Indicates the relative number (1 to 255) of peaks (the serial number of all peaks of all
Stream# - Peak#
- Peak name
Date/time Indicates the date (year/month/day) and time (hour/minute) when the analysis for each
Concentration Indicates the concentration for each peak (the unit of concentration immediately
streams).
Indicates the peaks of the stream, in ascending order (in the order of their assignment)
of the peak number, in which the latest analysis has been executed.
The system uses dashes “-” to connect the stream number, peak number and
peak name in sequence, followed by the concentration unit (%, ppm or no unit) in
parentheses.
cycle started (up to 250 date/time data items). If the number of data items exceeds
250, the oldest data item is discarded to make way for a new data item.
follows the peak name).
IM 11B03G03-03E
4th Edition : Mar. 21, 2012-00
Page 82

<6. Analysis Results Windows>
n RetentionTime History Window
The Retention Time History window is used to view the trend of the retention time data which the
analyzer has analyzed to date in the Process mode. This window shows all the peaks assigned
at the startup of the Analysis Results window. The Retention Time elds of peaks not measured
at the given time remain blank. To view the data not shown on the initial screen, use the scroll bar.
l Window Layout
The following gure shows the layout of the Retention Time History window.
F0607.ai
6-7
l Contents of Information
The following table summarizes the contents of the data items shown in the Retention Time
History window.
Item Description
# Indicates the relative number (1 to 255) of peaks (the serial number of all peaks of all
Stream# - Peak#
- Peak name
Date/time Indicates the date (year/month/day) and time (hour/minute) when the analysis for each
Retention time Indicates the retention time for each peak (in seconds).
streams).
Indicates the peaks of the stream, in ascending order (in the order of their assignment)
of the peak number, in which the latest analysis has been executed.
The system uses dashes “-” to connect the stream number, peak number and
peak name in sequence, followed by the concentration unit (%, ppm or no unit) in
parentheses.
cycle started (up to 250 date/time data items). If the number of data items exceed 250,
the oldest data item is discarded to make way for a new data item.
IM 11B03G03-03E
4th Edition : Mar. 21, 2012-00
Page 83

<6. Analysis Results Windows>
n Laboratory Analysis Results Window
The Laboratory Analysis Results window displays the most recent results of laboratory analysis
done by the analyzer in the Lab mode in the order that peaks are detected. The results of a
laboratory analysis are updated each time the analyzer completes a laboratory analysis. To
record the current data for future reference, save this window. To view the data not shown on the
initial screen, use the scroll bar.
l Window Layout
The following gure shows the layout of the Laboratory Analysis Results window.
F0608.ai
6-8
To view the unseen parts of the data, click on the or buttons on the horizontal or
vertical scroll bar to scroll the page.
l Contents of Information
The following table summarizes the contents of the data items shown in the Laboratory Analysis
Results window.
Item Description
Analysis start time Indicates the date and time when analysis of the on-screen data started.
# Indicates the number (1 to 255) of peaks (that have been detected).
Concentration Indicates the concentration (in percent) for each peak.
Retention time Indicates the retention time (in seconds) for each peak.Indicates the detector number
Det. # Indicates the starting time/retention time/ending time (in seconds) for each peak.
Peak-peak start/
retention/peak end
Tracking Indicates the starting level/top level/ending level (mV) for each peak.
Peak level start/
height/end
Area Indicates the state of data processing for each peak using a two-character code.
Shape Indicates “p” if it is a tangent correction, or “H” if it is a vertical separation.
Half width Indicates the half width (in seconds) for each peak.
Tailing constant Indicates the tailing constant for each peak
(1 or 2) for each peak.
Indicates the state of tracking for each peak as Baseline, Tracking or None.
Indicates the integrated value (mV-sec) of level for each peak.
IM 11B03G03-03E
4th Edition : Mar. 21, 2012-00
Page 84

<6. Analysis Results Windows>
n File Analysis Results Window
The File Analysis Results window is used to retrieve and refer to the data of the Latest Analysis
Results window saved in a le. (Other analysis results acquisition windows cannot be opened
from this window.) The information shown in this window is exactly the same as the one shown in
the Latest Analysis Results window.
See Also
For details on the contents of information, see “Latest Analysis Results Window,” in Section 6.2.
n File Concentration Analysis History Window
The File Concentration Analysis History window is used to retrieve and refer to the data of
the Concentration Analysis History window saved in a le. (Other analysis results acquisition
windows cannot be opened from this window.) The information shown in this window is exactly
the same as the one shown in the Concentration Analysis History window.
See Also
For details on the contents of information, see “Concentration Analysis History Window,” in Section 6.2.
6-9
n File Retention Time History Window
The File Retention Time History window is used to retrieve and refer to the data of the Retention
Time History window saved in a le. (Other analysis results acquisition windows cannot be
opened from this window.) The information shown in this window is exactly the same as the one
shown in the Retention Time History window.
See Also
For details on the contents of information, see “Retention Time History Window” in Section 6.2.
n File Laboratory Analysis Results Window
The File Laboratory Analysis Results window is used to retrieve and refer to the data of the
Laboratory Analysis Results window saved in a le. (Other analysis results acquisition windows
cannot be opened from this window.) The information shown in this window is exactly the same
as the one shown in the Laboratory Analysis Results window.
See Also
For details on the contents of information, see “Laboratory Analysis Results Window” in Section 6.2.
IM 11B03G03-03E
4th Edition : Mar. 21, 2012-00
Page 85

<6. Analysis Results Windows>
6.3 Switching Between Analysis Results Windows
In all cases, only one Analysis Results window can be opened at a time. To view a different
window, switch to it. However, this is not applied for graph windows created in the history record
windows (Concentration Analysis History, Retention Time History, File Concentration Analysis
History, and File Retention Time History windows), meaning that a graph window and its original
history record window that contains the data source for the graph can be viewed simultaneously.
TIP
Visible Graph Windows
• A graph window, which is created by executing any [Draw] command in the [Graph] menu while a history
record window is open, can be viewed together with the history record window that contains the data
source for the graph. If you switch from the data-source history record window to a different window, the
graph window open together with the history record window closes. If you switch back to the data-source
history record window, its graph window opens again.
n Window Menu
To switch between analysis results windows, use the [Window] menu. From this menu, select the
name of a window you want to open. A check mark (
open window.
) appears next to the name of a currently-
6-10
TIP
Switching Between the Analysis Results Acquisition Windows Using the Tool Buttons
• You can also switch between the analysis results acquisition windows by clicking on the buttons on the
toolbar.
To switch to Click on
Latest Analysis Results window
Concentration Analysis History window
Retention Time History window
Laboratory Analysis Results window
button
button
button
button
IM 11B03G03-03E
4th Edition : Mar. 21, 2012-00
Page 86

<6. Analysis Results Windows>
6.4 Saving and Retrieving Data
The data of the analysis results acquisition windows (Latest Analysis Results, Concentration
Analysis History, Retention Time History and Laboratory Analysis Results windows) are updated
each time the analyzer completes an analysis. The data can be saved in les, and retrieved in the
le reference windows (File Analysis Results, File Concentration Analysis History, File Retention
Time History or File Laboratory Analysis Results window) for future reference. In addition, the
data of a history record can automatically be saved at a xed interval.
n Saving Data of an Analysis Results Acquisition Window
l Procedure
(1) Open the analysis results acquisition window to be saved and click on either the [Save]
command in the [File] menu or the
A dialog box pops up to ask you to type in the save destination.
button on the toolbar.
6-11
F0609.ai
(2) After conrming the names of the drive and directory, type in a le name before the
extension code and click on the [OK] button. The data are written in the le and thus saved.
TIP
Extensions
• Extensions sufxed to le names during data saving are classied as shown below depending on the type
of window you work with. These extensions identify the type of the window in question.
Latest Analysis Results window: .ana
Concentration Analysis History window: .cnc
Retention Time History: .rtm
Laboratory Analysis Results window: .lab
Format of Files Saved
• Files are saved only in text format (comma-delimited format). Data can be retrieved in a general application
as well as in the le reference window of an Analysis Results window.
• The saved le is not displayed. For reference to the le, switch to the le reference window and call for the
le.
n Automatic Saving of a History Record Window
In the Concentration Analysis History or Retention Time History window, use the [Automatic
Saving] command in the [File] menu to save the data of both the concentration analysis history
and the retention time history at a xed interval. (Whichever in both windows the settings are
made, the same Automatic Saving dialog box appears that is used commonly for both history
data.)
IM 11B03G03-03E
4th Edition : Mar. 21, 2012-00
Page 87

<6. Analysis Results Windows>
l Procedure
(1) Open the Concentration Analysis History or Retention Time History window. Click on the
[Automatic Saving] command in the [File] menu. The Automatic Saving dialog box pops up.
6-12
F0610.ai
(2) Click on the [On] radio button in the Automatic Saving eld.
(3) Specify the automatic saving cycle in either a measurement cycle or a specic time for daily
saving in the Saving Cycle eld.
(4) Specify the directory where the data is to be saved in the Automatic Saving Directory eld.
The default setting is “\data” directory right under the installation directory.
(5) Click on the [OK] button. The data of the concentration analysis history and retention time
history will be simultaneously and automatically saved in two les as follows.
• Two les are saved with the following names again and again each time analysis ends. (The
les are overwritten every time so that the contents are always updated to the latest history
record data.)
Concentration Analysis History: C_NOW. TMP
Retention Time History: R_NOW. TMP
• In addition, the data are automatically saved in new les at every automatic-saving cycle.
The les are saved with a le name including the year (last one digit), month (1 to 9, a, b, c),
day, time information and the appropriate extension.
Assuming that the les are automatically saved after the history record data is acquired at
17:30, December 15, 1999, their le names are:
“9c151730.cnc” and “9c151730.rtm”
The data type is identied by the extension: “.cnc” represents the concentration analysis
history data and “.rtm” represents the retention time history data.
• Files to be automatically saved are saved under the directory specied in the Automatic
Saving Directory eld in the Automatic Saving dialog box.
• From the next transfer after clicking on [OK] in the dialog box, automatic saving is executed.
Re-specifying the automatic saving cycle resets the number of cumulative analyses to zero.
Counting restarts from zero for the re-specied cycle.
(6) To quit automatic saving, open the Concentration Analysis History or Retention Time History
window, and again click on the [Automatic Saving] command in the [File] menu. Then select
[Off] in the Automatic Saving dialog box.
NOTE
Automatic saving requires a certain free space in the hard disk. If the remaining free space
decreases, the automatic saving must be stopped.
IM 11B03G03-03E
4th Edition : Mar. 21, 2012-00
Page 88

<6. Analysis Results Windows>
n Retrieving (Opening) Files
Follow the procedure below to retrieve saved les in a le reference window.
l Procedure
(1) Open the le reference window appropriate for the desired analysis results acquisition
window. Click on the [Open] command in the [File] menu or the
A dialog box pops up asking you to specify the le to be retrieved.
button on the toolbar.
6-13
(2) Click on the le name and then the [OK] button.
The le is retrieved and thus the saved data is shown in the le reference window.
• Zero and negative numbers cannot be displayed correctly on a logarithmic scale.
Always select the linear scale for data including zero or negative numbers.
TIP
The data of an opened le can be processed.
See Also
For details on data processing, see Section 6.5.
n Closing Files in a File Reference Window
If you no longer need les retrieved onto a le reference window, close them taking the following
procedure.
l Procedure
Open the le reference window for the le you want to close. Click on the [Close] command in the
[File] menu. The le closes.
F0611.ai
TIP
• If you have made any changes to the le, a dialog box pops up to ask if you want to save the changes. Click
on the [Yes] button to close the box.
• Only one le can be opened in one le reference window. If you open another le, the previous le closes
automatically.
F0612.ai
IM 11B03G03-03E
4th Edition : Mar. 21, 2012-00
Page 89
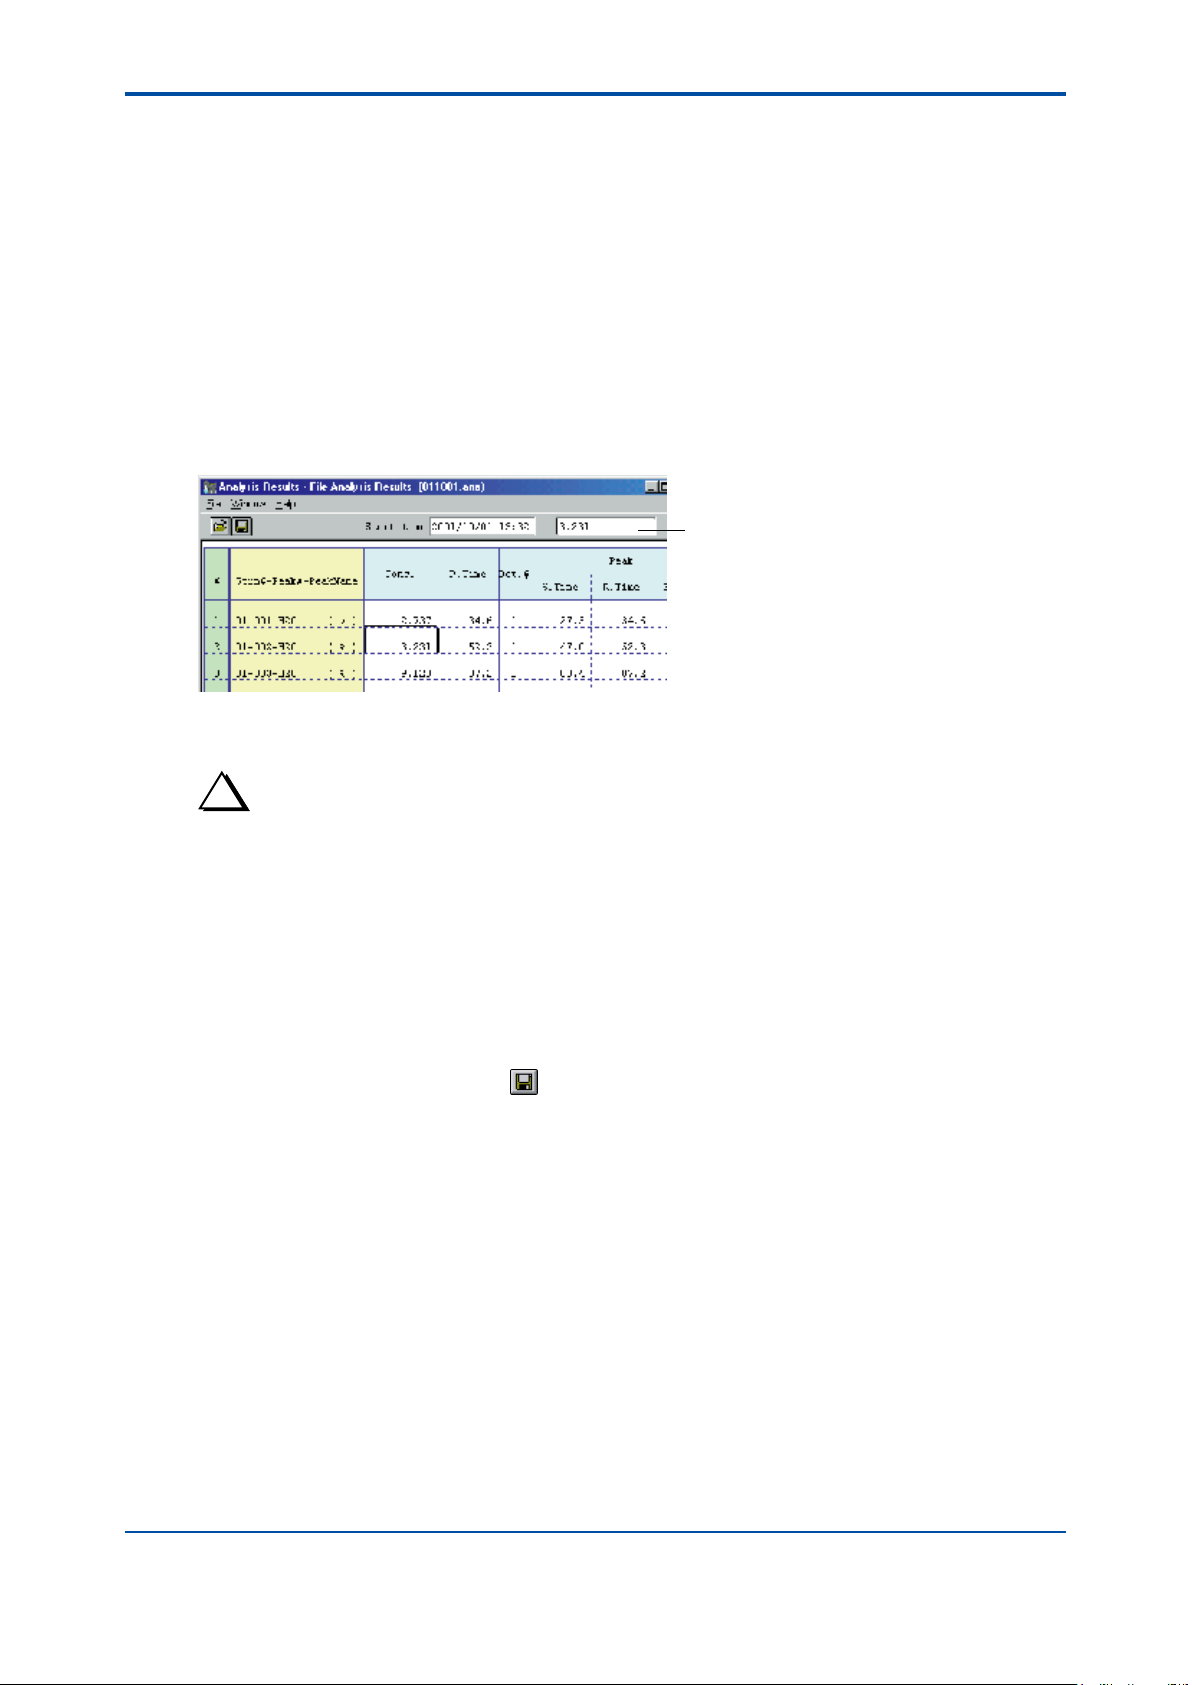
<6. Analysis Results Windows>
6.5 Processing and Re-saving Data
Data retrieved onto a le reference window (File Analysis Results, File Concentration Analysis
History, File Retention Time History or File Laboratory Analysis Results window) can be
processed. In addition, processed data can be re-saved ([Save] command) or saved in a le with
a different name ([Save As] command).
n Processing Data in a File Reference Window
l Procedure
(1) In the le reference window, select the cell you want to process and double-click on it (or
press the [F2] key). The data value of the selected cell appears in the Cell Contents eld on
the toolbar.
Cell contents field
6-14
F0613.ai
(2) Edit the cell contents in the eld and press the [Return] key. The new data value appears in
the cell. (To cancel editing, press the [ESC] key.)
TIP
Restriction on Data Processing
• Cell contents can be changed or erased. The cell itself, however, cannot be deleted.
How to Select a Cell
• To select a cell, move the mouse cursor to the desired cell and click on it, or using cursor keys.
n Overwriting and Saving Files in a File Reference Window
l Procedure
(1) Open the le reference window for the le you want to save. Click on the [Save] command in
the [File] menu or click on the
(2) In this case, no message appears in the window; the le is just overwritten and saved.
button on the toolbar.
IM 11B03G03-03E
4th Edition : Mar. 21, 2012-00
Page 90
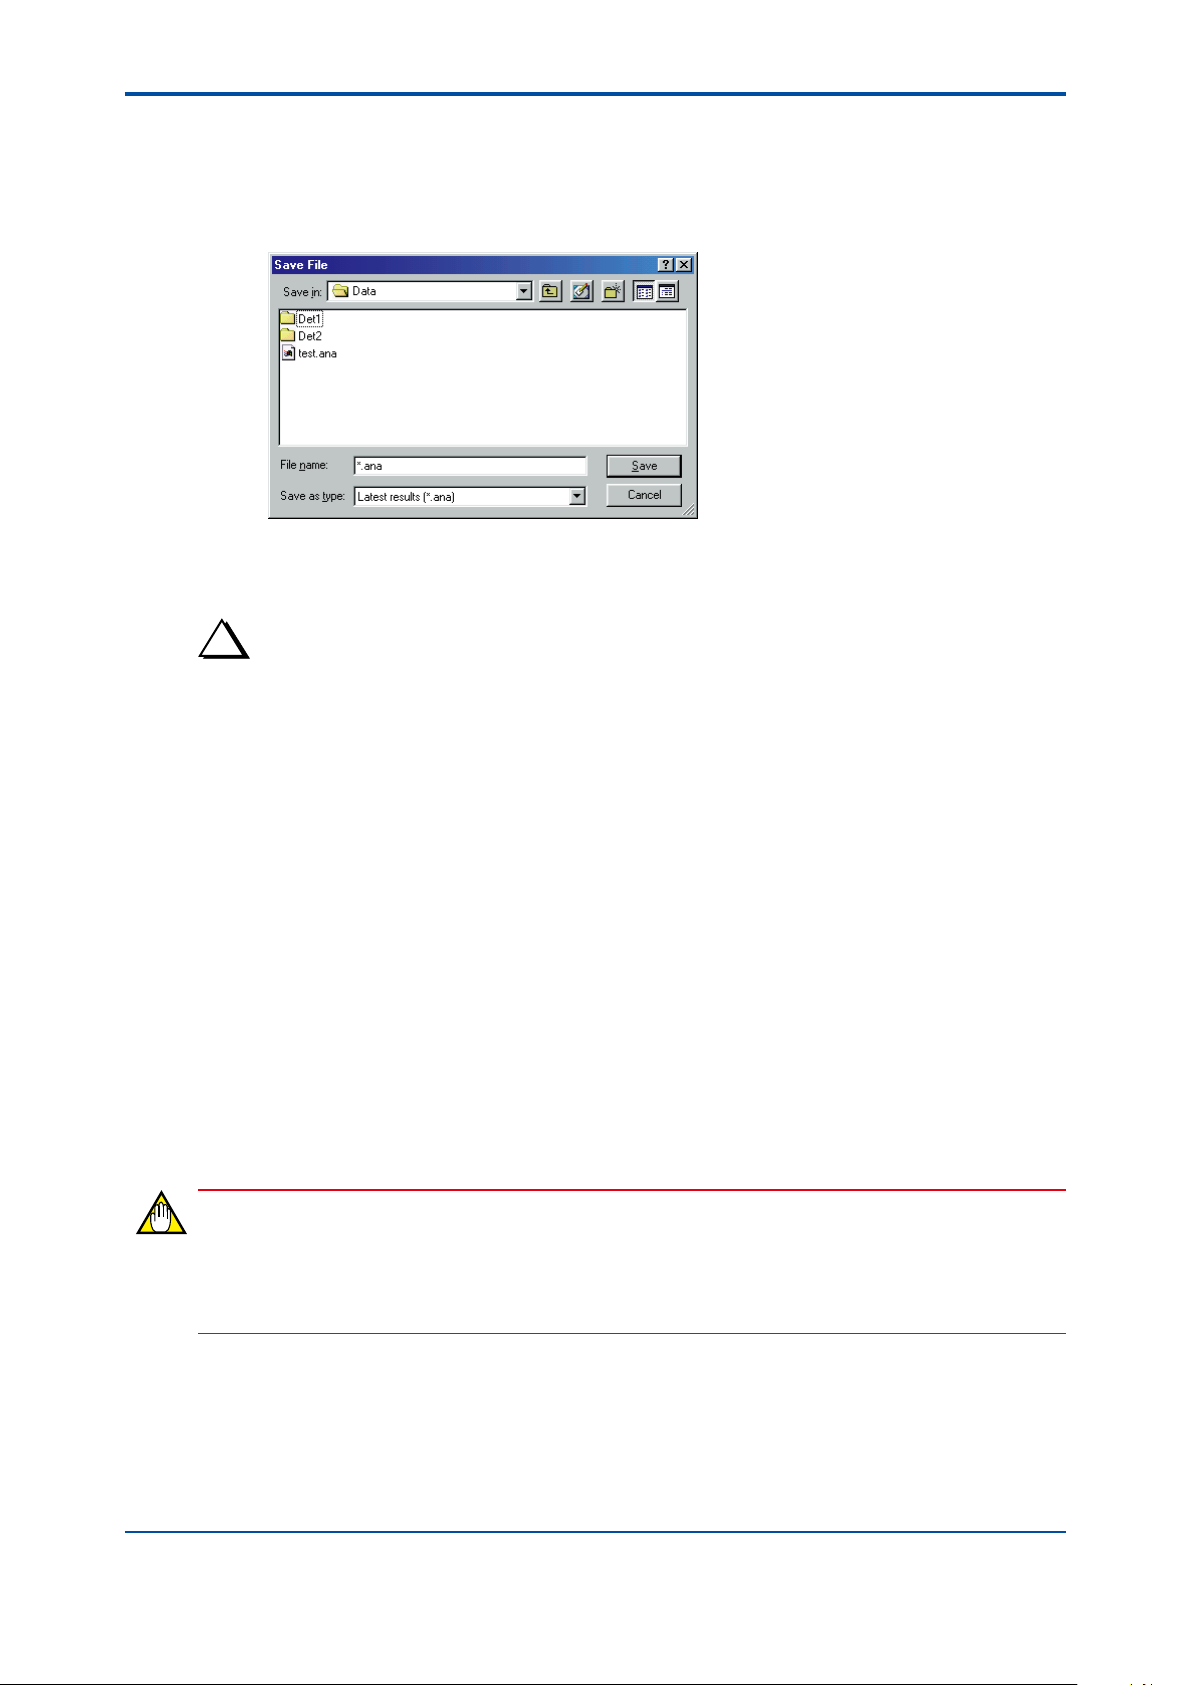
<6. Analysis Results Windows>
n Saving the File Under a Different Name in a File Reference Window
l Procedure
(1) Open the le reference window for the le you want to save. Click on the [Save As]
command in the [File] menu. A dialog box pops up to ask you to type the save destination.
6-15
(2) After having conrmed the drive and directory names, type the le name under which you
want the le saved before the extension code. Click on the [OK] button. The data in the
window are written to the new le and thus saved.
TIP
Extensions
• Extensions sufxed to le names during data saving are classied as shown below depending on the type
of window you work with. These extensions identify the type of the window in question.
Latest Analysis Results window: .ana
Concentration Analysis History window: .cnc
Retention Time History: .rtm
Laboratory Analysis Results window: .lab
Format of Files Saved
• Files are saved only in text format (comma-delimited format). Data can be retrieved in a general application
as well as in the le reference window of an analysis results window.
6.6 Graphing Historical Data
Graphs can be created from the data of a history record window (Concentration Analysis History,
Retention Time History, File Concentration Analysis History or File Retention Time Analysis
History window). Graphs can be created in windows A, B, and C simultaneously.
Graph windows which are no longer necessary can be closed.
F0614.ai
n Making New Graphs
NOTE
Graphs cannot be created from the data of windows other than history record windows (Latest
Analysis Results, Laboratory Analysis Results, File Analysis Results and File Laboratory Analysis
Results windows).
IM 11B03G03-03E
4th Edition : Mar. 21, 2012-00
Page 91
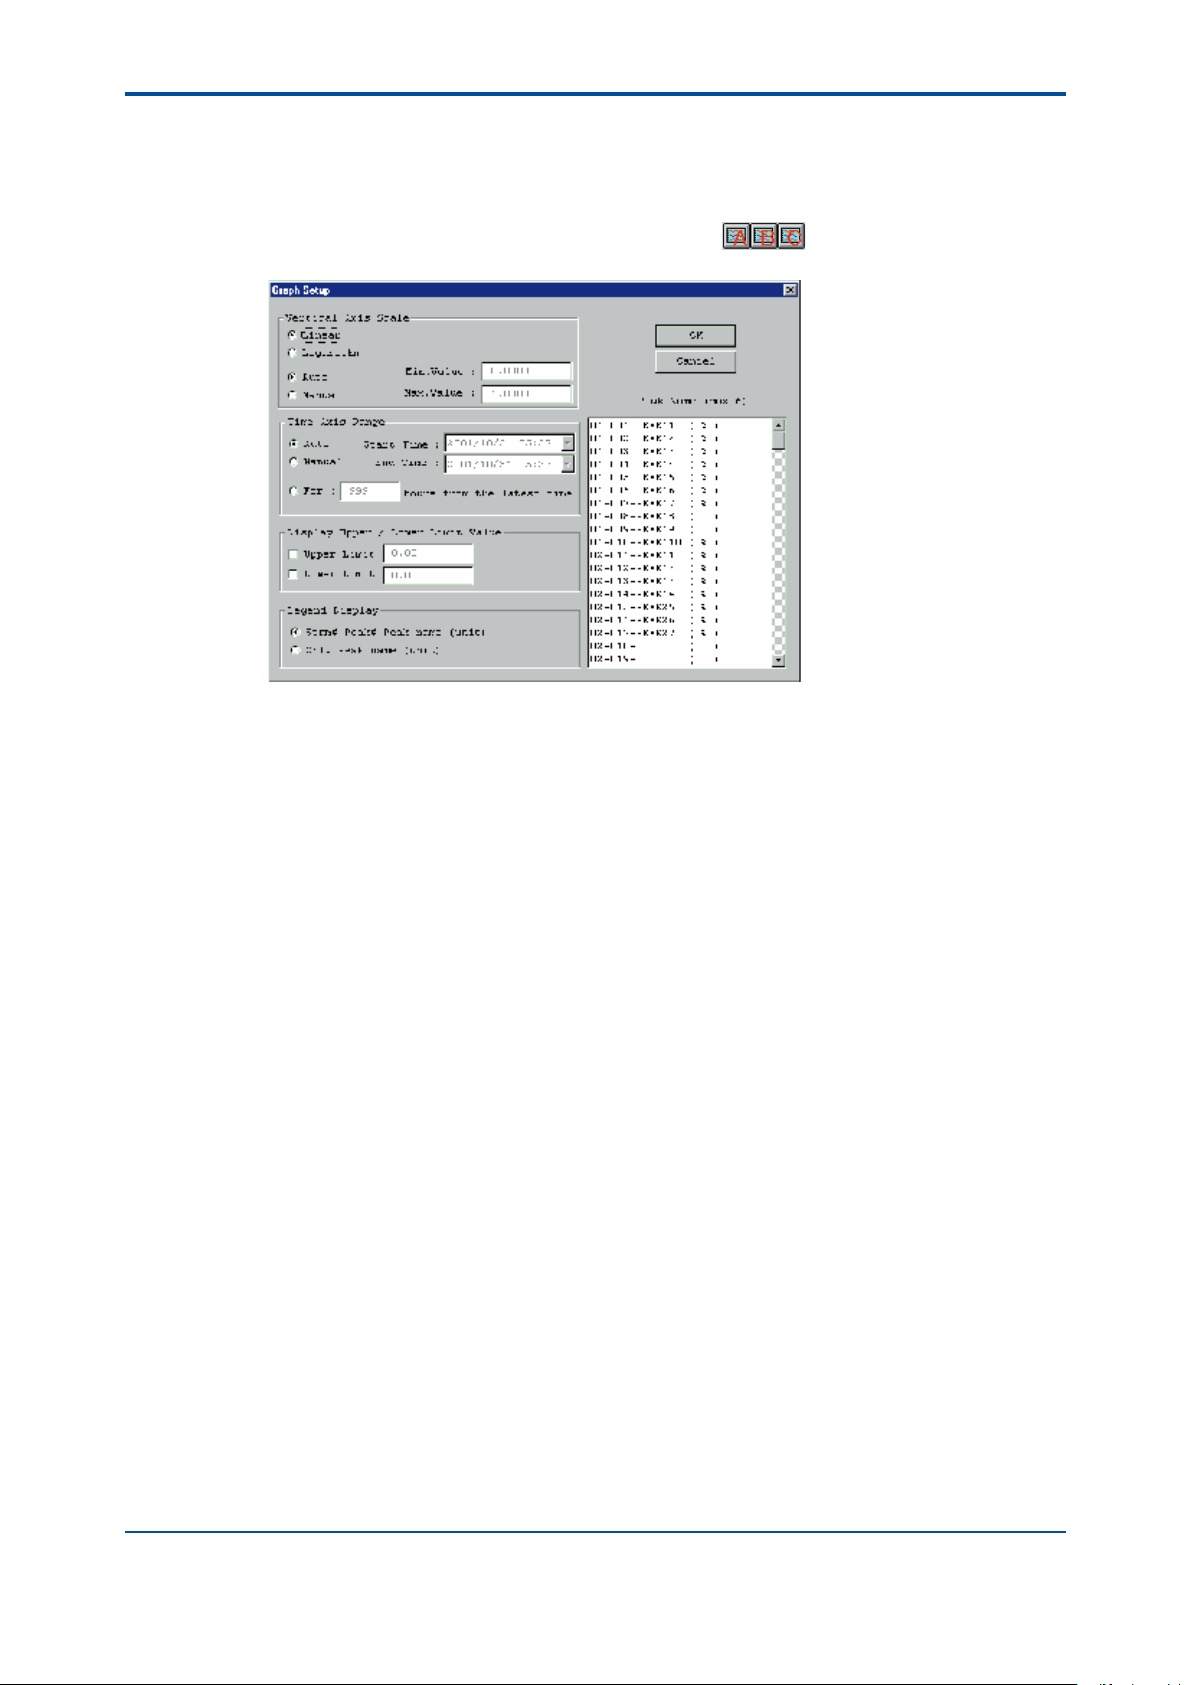
<6. Analysis Results Windows>
n Creating Graphs in a History Record Window
l Procedure
(1) While one of the four history record windows is open, click on the [Draw A], [Draw B], or
[Draw C] command in the [Graph] menu or any of the
Graph Setup dialog box pops up.
buttons on the toolbar. The
6-16
F0615.ai
(2) Select the peak names to be shown on a graph from the list box at the bottom right, as
described below.
Selecting consecutive peak names: Drag the mouse from the rst peak name to the last
one.
Selecting nonconsecutive peak names:
(a) Click on the rst peak name or the range of peaks.
(b) Click on the second peak name or the range of peaks while holding down the [CTRL]
key.
(c) Repeat step (b) to select all the necessary peak names.
The selected peak names will be highlighted.
• You can select a maximum of six peak names at one time.
• If you have selected the wrong range of peaks, make selection again.
(3) Set up the vertical axis scale (the concentration scale for the Concentration Analysis History
window and the retention time scale for the Retention Time History window).
(a) Select either Linear or Logarithmic scale.
(b) Select either Auto or Manual for the scale setting. In automatic scaling, the system
automatically sets the scale appropriate for the selected range of peaks. In manual
setting, the minimum and maximum values of the axis should be entered here.
• Zero and negative numbers cannot be indicated correctly in a logarithm scale. Always
select the linear scale if data values include zero or negative numbers.
(4) Set the range of the time axis.
(a) Select either Auto or Manual. In automatic setting, the system graphs the entire range
of the time shown in a history record window. In manual operation, select the starting
time and ending time from the drop-down list box. The system graphs the data within
the selected range only.
• The starting time must be earlier than the ending time.
(5) Select enabled/disabled display of upper/lower limits. To view upper/lower limits in the
graph, check the box next to Upper Limit and/or Lower Limit and enter the value(s).
The upper limit value is indicated in a red line, and the lower limit value is in a blue line. Both
or either of the limits can be viewed.
(6) For the format of the peak name displayed in the legend box, select either “Strm# - Peak#
- Peak name (unit)” or “Only Peak name (unit).”
IM 11B03G03-03E
4th Edition : Mar. 21, 2012-00
Page 92

<6. Analysis Results Windows>
(7) Make sure that all settings are completed and click on the [OK] button. The graph window
opens.
6-17
TIP
• A graph window always opens together with the history record window, the source of the graphed data.
• To change the contents of graph display, click on the
dialog box where you can make changes.
• A graph window cannot be saved. If necessary, save the history record window and recreate a graph.
n Closing a Graph Window
If you no longer need the graph window, close it taking the following procedure.
l Procedure
In the graph window you want to close, click on the [Close] command in the [Close] menu. The
graph window closes.
n Printing a Graph Window
l Procedure
In the graph window you want to print, click on the [Print] in the [Graph] menu. The graph will be
printed out. This can also be achieved by clicking on the
window.
Print orientation - portrait or landscape - can be set in the Print Setup dialog box which can be
accessed by clicking on the [Print Setup] command in the [Graph] menu.
F0616.ai
button on the toolbar to view the Graph Setup
button on the toolbar in the graph
F0617.ai
IM 11B03G03-03E
4th Edition : Mar. 21, 2012-00
Page 93
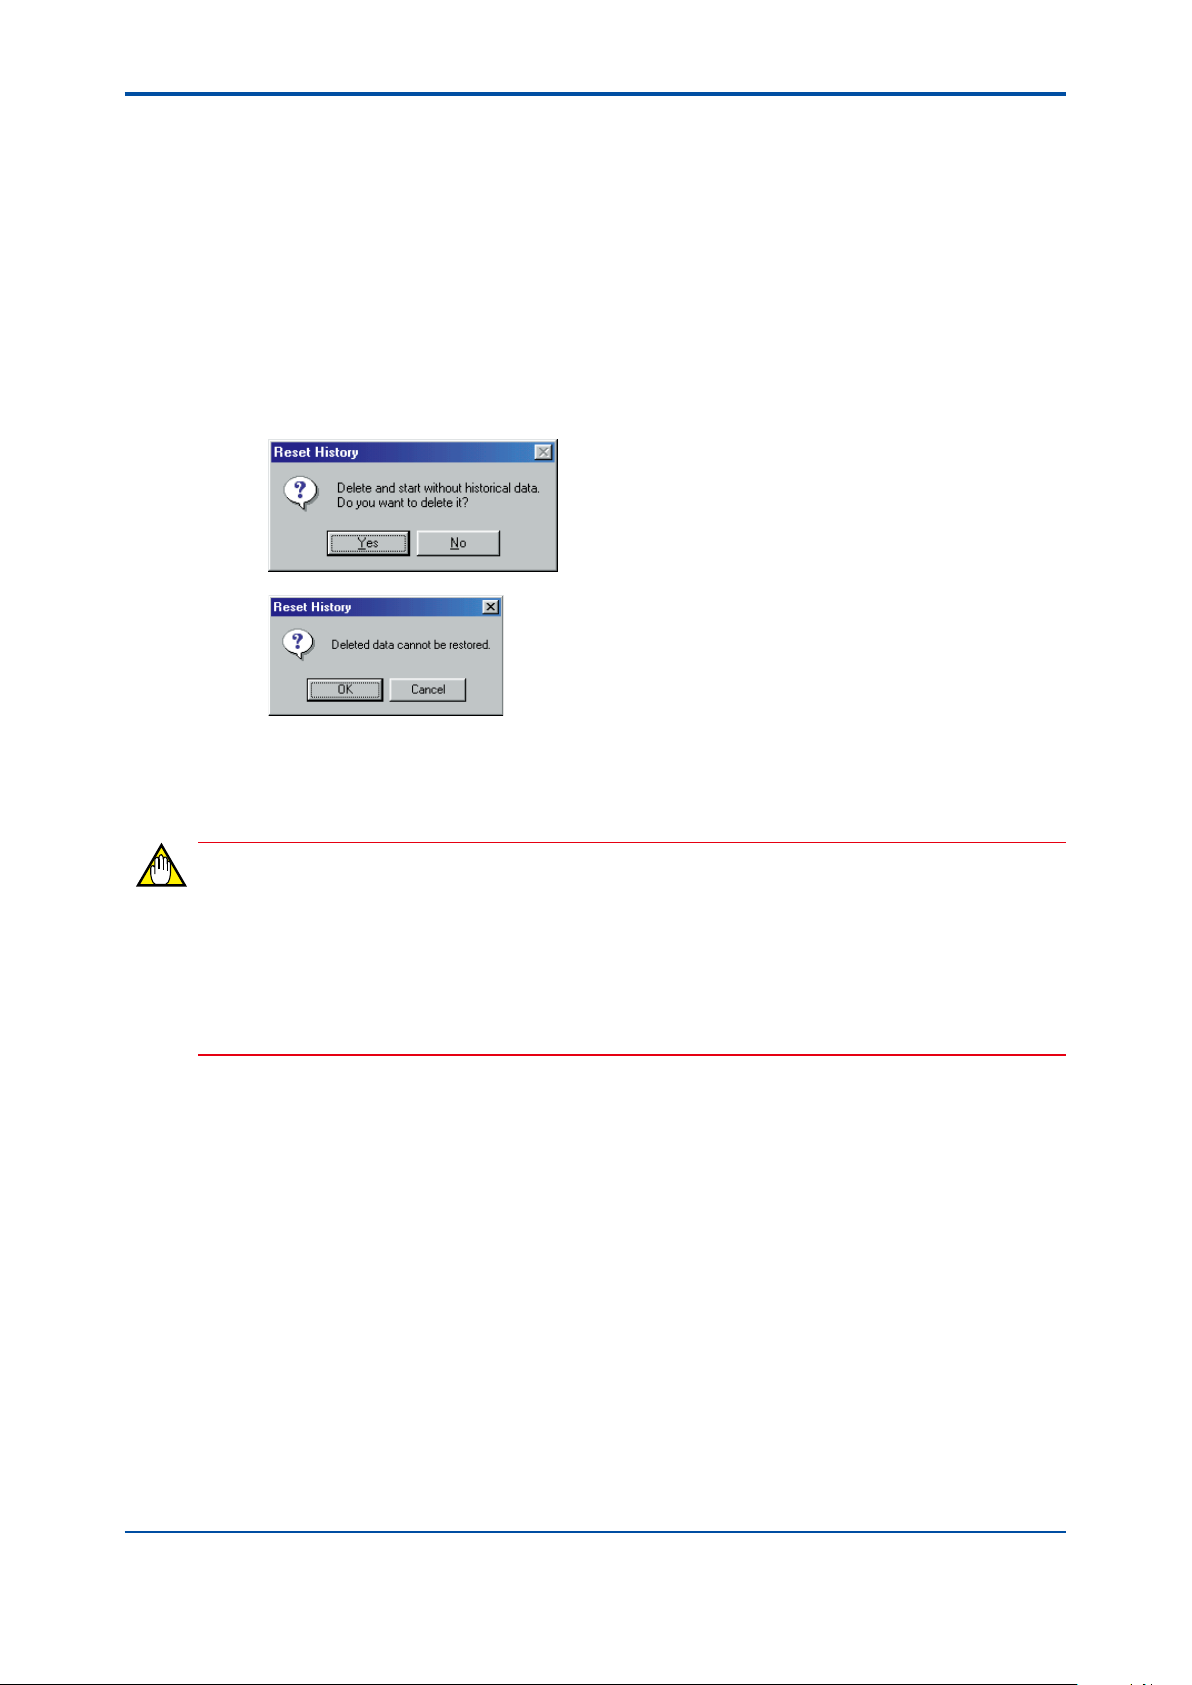
<6. Analysis Results Windows>
6-18
6.7 Resetting Historical Data
If you want to record data from scratch in the Concentration Analysis History and Retention Time
History windows, execute the [Reset History] command. Executing the command simultaneously
erases all data in both windows, regardless of the state of the analysis results windows.
n Resetting Historical Data in the Concentration Analysis History and
Retention Time History Windows
l Procedure
(1) Open the Latest Analysis Results window and click on the [Reset History] command in the
[File] menu. A dialog box pops up to ask you if you want to reset the historical data.
(2) Click on the [OK] button. This erases all data in the Concentration Analysis History and
Retention Time History windows.
• The heading “Strm#-Peak#-Peak Name” remains in the windows.
F0618.ai
F0619.ai
NOTE
If you have made any change to the operation pattern or peak settings while the Analysis Results
window is active:
• Execute the [Exit] command in the [File] menu to close the Analysis Results window once.
Next, exit the Maintenance Terminal. And then restart the Maintenance Terminal, and
reopen the Analysis Results window. Executing the [Reset History] command without exiting
the Analysis Results window results in incorrect data display.
IM 11B03G03-03E
4th Edition : Mar. 21, 2012-00
Page 94
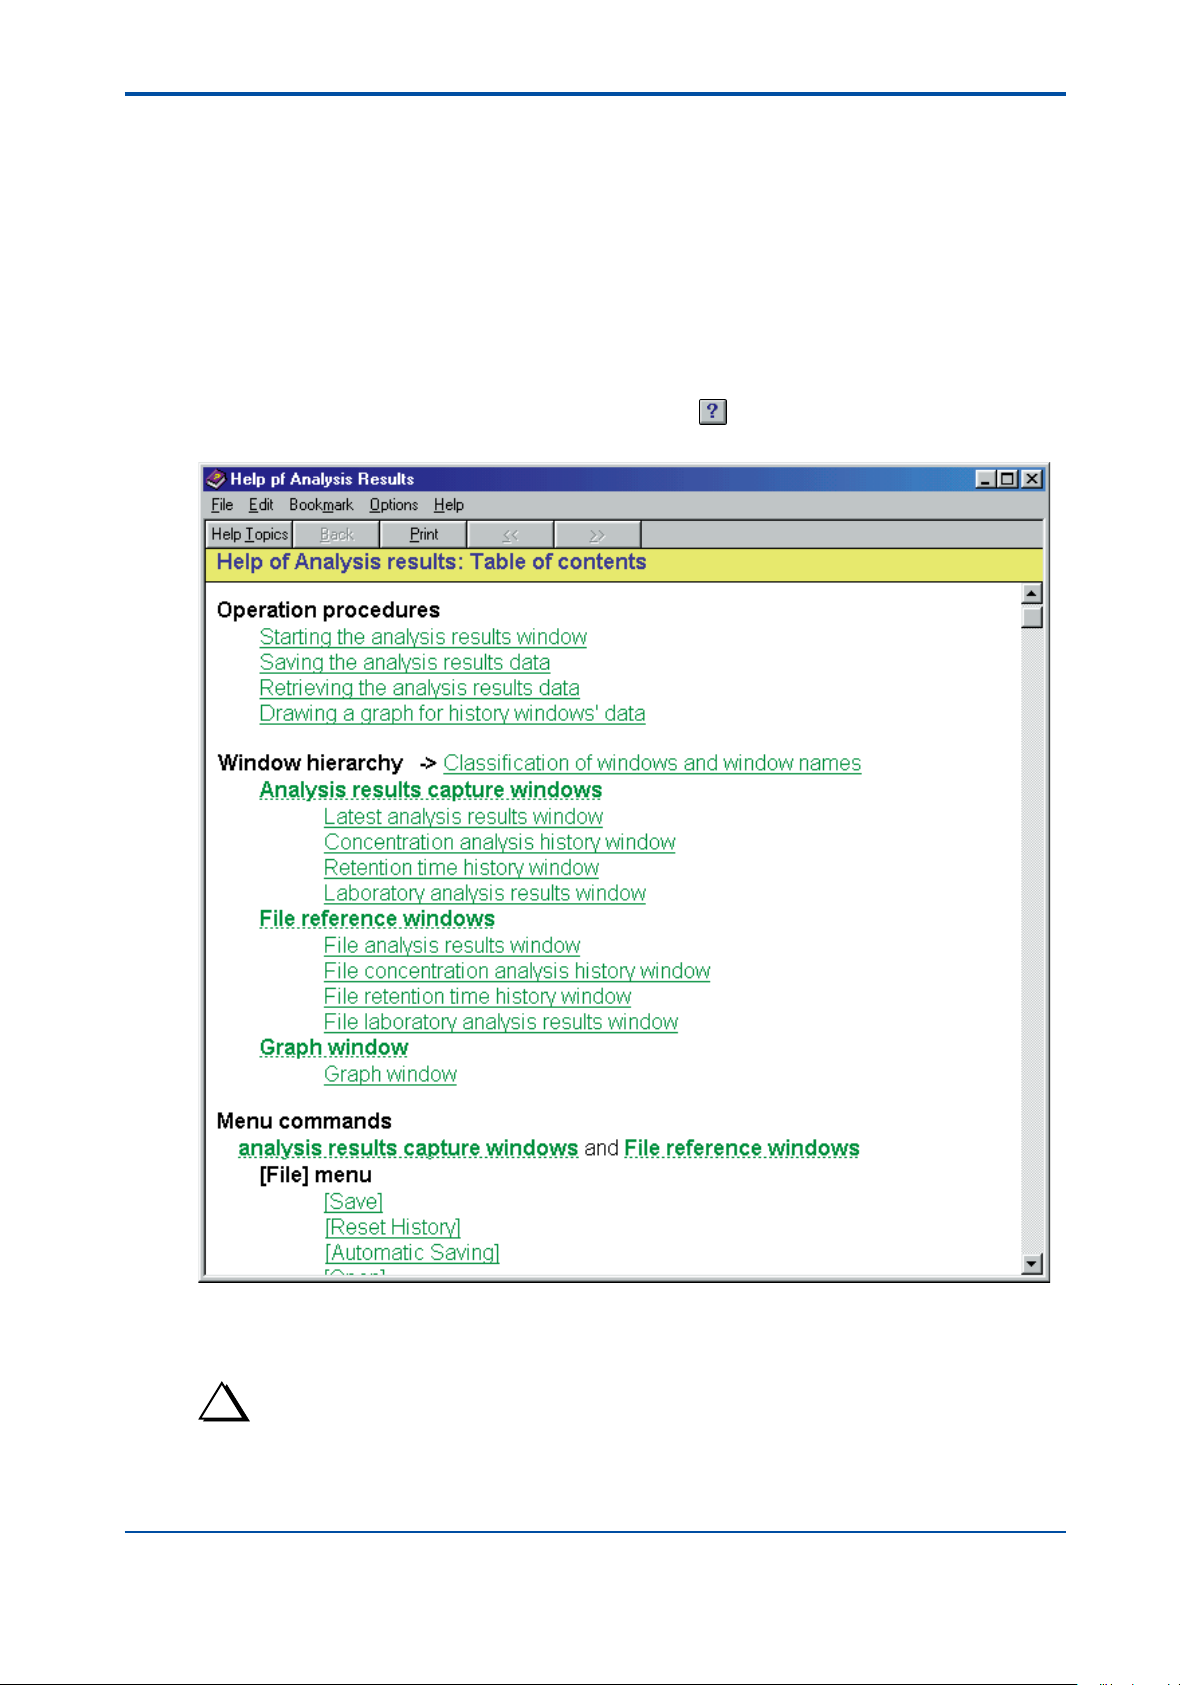
<6. Analysis Results Windows>
6.8 Opening the Help Window of an Analysis Results Window
Analysis results windows are provided with a help function. If you like to know how to operate
with the Analysis Results window or to learn more detailed instructions, you can get such
information from the Help window of the Analysis Results window, besides this operation guide.
n Opening the Help Window
l Procedure
(1) Click on the [Contents] command in the [Help] menu (this operation is accessible from any
window). The same can be done by clicking on the
The Help contents appear in the Help window.
button on the toolbar.
6-19
F0620.ai
(2) Click on the topic you want to look up so that you can view a more informative window.
(Clicking on the underlined topics in green allows you to view more information.)
TIP
Search by Keyword
• To search for the help topic you want to look up, click on the [Help Topics] command in the [Help] menu and
type in the keyword of the topic.
IM 11B03G03-03E
4th Edition : Mar. 21, 2012-00
Page 95

Blank Page
Page 96

<Appendix A Menus>
Appendix A Menus
This appendix summarizes the functions used in the Maintenance Terminal.
n LCD Emulator Window
A-1
Connect
Connect
Disconnect
Com. Port
Com. Speed
Disp. Reset
Exit Alt+F4
Help
How to Operat
About Topics
About LCD Emulator
COM1
COM2
COM3
COM4
9600bps
19200bps
38400bps
F01.ai
Menu Name Command Name Function
Connect Connect Establishes a communication link with the analyzer.
Disconnect Drops the communication link with the analyzer.
Com. Port Used to select a serial port for the communication with
the analyzer.
Com. Speed Used to select a communication speed to the analyzer.
Disp. Reset Turns off the LCD display and again opens the Analyzer
Status window.
Exit Exits the LCD emulator.
Help How to Operate Shows the operation procedures for the LCD emulator.
Help Topics Shows a Help topic appropriate for a typed-in keyword.
About LCD Emulator Displays the version information on the LCD Emulator
window.
n Analyzer Operation Window
Connect
Connect
Disconnect
User Level
Com. Port
Com. Speed
Exit Alt+F4
File
Upload to PC
Download to GC
User Level A
User Level B
User Level C
Display
Alarm Status
Alarm History
Alarm Details
Chromatogram
Analysis Results
GC State
Process
Manual
Lab
Operation Mode
Run
Pause
Stop
Command Cancel
Measurement State
Stream Sequence
Stream Select (Continuous)
Stream Select (One Cycle)
Calibration/Validation
Calibration/Validation Start
Calibration/Validation Stop
Selection Cancel
Calibration/Validation Method
Manual/Range
Manual
Range Select
Set Up
Valve
Peak
Stream VLV
VLV 1
VLV2
VLV3
VLV4
VLV5
VLV6
VLV7
VLV8
DET1
DET2
Heater
IM 11B03G03-03E
Help
Contents
Help Topics
About GCMT
Name
Gate Std/On/Off Time
Result Unit/Measuring Range
Ref Task Number/Ref Peak Number
Gate Cut Method/Integ Method
Std Conc/Std Area/Calib Factor
4th Edition : Mar. 21, 2012-00
F02.ai
Page 97

<Appendix A Menus>
Menu Name Command Name Function
Connect Connect Establishes a communication link with the analyzer.
Disconnect Drops a communication link with the analyzer.
User Level Sets a user level (A, B or C).
Com. Port Used to select a serial port for the communication with the
analyzer.
Com. Speed Used to select a communication speed to the analyzer.
Exit Exits the Maintenance Terminal.
File Upload to PC Uploads and saves parameter settings from the analyzer to
thedisk of the Maintenance Terminal.
Download to GC Downloads and saves parameter settings from the disk of
theMaintenance Terminal to the analyzer.
Display Alarm Status Opens the Alarm Status window.
Alarm History Opens the Alarm History window.
Alarm Details Opens the Alarm Details window.
Chromatogram Opens the Chromatogram window.
Analysis Results Opens an Analysis Results window.
GC State Process Commands to change to the Process mode.
Manual Commands to change to the Manual mode.
Lab Commands to change to the Lab mode.
Operation
Mode
Run Commands to change to the Run mode.
Pause Commands to change to the Pause mode.
Stop Commands to the Stop mode.
Command Cancel Cancels the operation mode reserved.
Measurement
State
Stream Sequence Commands to change to Stream Sequence.
Stream Select (Continuous) Commands to change to Stream (Continuous).
Stream Select (One Cycle) Commands to change to Stream (One cycle).
Calibration/Validation Commands to change to Calibration/Validation.
Calibration/Validation Start Commands to start the calibration/validation.
Calibration/Validation Stop Commands to stop the calibration/validation.
Selection Cancel Cancels the measurement scheduled.
Calibration/Validation Method Changes the calibration/validation method.
Manual/Range Manual Turns on or off valves and detectors in the Manual mode.
Range Select Changes the range.
Set Up Valve Change the timing for turning on/off the valve.
Peak Changes the peak information (peak name, gate time, etc.).
Help Contents Shows the Help contents of the GCMT.
Help Topics Shows a Help topic appropriate for a typed-in keyword.
About GCMT Displays version information on the GCMT.
A-2
IM 11B03G03-03E
4th Edition : Mar. 21, 2012-00
Page 98

<Appendix A Menus>
n Chromatogram Window
A-3
File
Save Chrom.
Continuous Saving
Exit Alt+F4
Scale
Zoom In
Zoom Out
Part Zoom
Full Disp
Auto Scale
Graph
Pen Select
Timing Mark
Temp./Press. Disp.
Options
Grid
Snap Shot
Cursor Pos.
Peak# Disp.
Help
Chromatogram Contents
Help Topics
ON
OFF
Snap 1
Snap 2
Clear
On the Chromatogram
Under the Chromatogram
F03.ai
Menu Name Command Name Function
File Save Chrom. Saves an on-screen chromatogram to the hard disk.
Continuous Saving Enables/Disables the automatic saving of chromato-
grams.
Exit Exits the Chromatogram window.
Scale Zoom In Enlarges both the X- and Y-axis scales in single-step
increments.
Zoom Out Reduces both the X- and Y-axis scales in single-step
increments.
Part Zoom Zoom in the area selected with the mouse.
Full Disp Brings the entire range of a chromatogram into view.
Auto Scale Switches Auto-scale on/off.
Graph Pen Select Correlates chromatograms with their colors for display.
Timing Mark Determines whether to show or hide the information
about the Peak No., Peak On/Off and Gate On/Off data
items for each chromatogram.
Temp./Press. Disp. Selects the chromatogram for which temperature/
pressure data are shown.
Option Grid - ON Shows the grid in the Closeup window.
Grid - OFF Hides the grid in the Closeup window.
Snap Shot - Snap 1 Saves the currently open Chromatogram window in
memory.
Snap Shot - Snap 2 Saves the currently open Chromatogram window in
memory.
Snap Shot - Clear Erases the window data saved as Snap 1 and Snap 2.
Cursor Pos. Turns on or off the display of the cursor position.
Peak# Disp.- On
Shows the peak number at the top of a chromatogram.
the chromatogram
Peak Disp.- Under
the chromatogram
Help Chromatogram
Shows the peak number at the bottom of a
chromatogram.
Shows the Help contents of the Chromatogram window.
Contents
Help Topics Shows a Help topic appropriate for a typed-in keyword.
IM 11B03G03-03E
4th Edition : Mar. 21, 2012-00
Page 99

<Appendix A Menus>
n Alarm Windows (Common to Both Alarm Status and Alarm History
Windows)
A-4
View
Alarm Status
Alarm History
Clear History
Alarm Message
Detail
Display
Making User Alarm Description
Help
Alarm Contents
Help Topics
F04.ai
Menu Name Command Name Function
View Alarm Status Opens the Alarm Status window.
Alarm History Opens the Alarm History window.
Clear History Erases the data of the Alarm History window.
Alarm Message Enables/Disables the display of an alarm message.
Detail Display Opens the Alarm Detail Description window.
Making User Alarm
Description
Used to set the detailed description for a user dened
alarm.
Help Alarm Contents Shows the Help contents of the Alarm window.
Help Topics Shows a Help topic appropriate for a typed-in keyword.
IM 11B03G03-03E
4th Edition : Mar. 21, 2012-00
Page 100
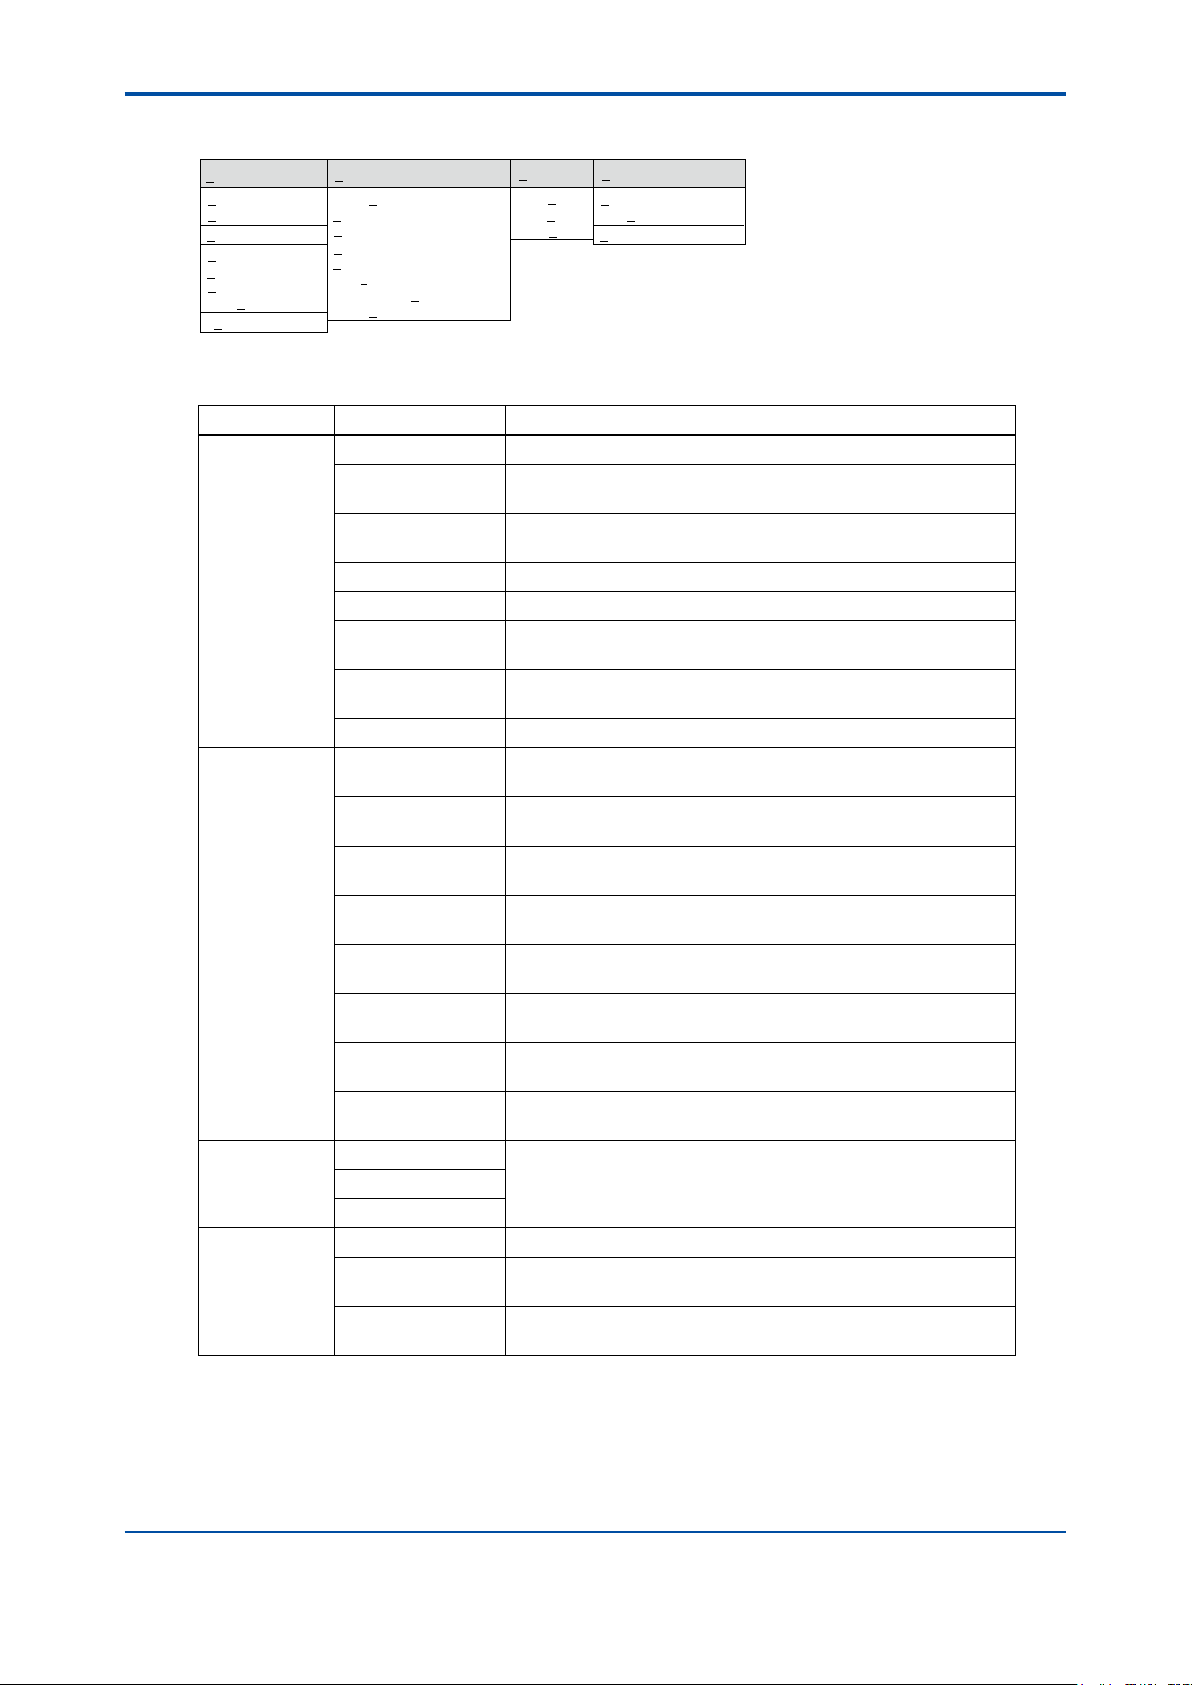
<Appendix A Menus>
n Analysis Result Window
A-5
File
Save
Reset History
Automatic Saving
Open
Close
Save
Save As
Exit
Note: Commands in menus vary depending on the type of the currently open analysis results window. The above table lists the com-
mands for all the types of analysis results windows.
Window
Latest Analysis Results
Concentration Analysis History
Retention Time History
Laboratory Analysis Results
File Analysis Results
File Concentration Analysis History
File Retention Time History
File Laboratory Analysis Results
Graph
Draw A
Draw B
Draw C
Help
Contents
Help Topics
About Analysis Results
F05.ai
Menu Name Command Name Function
File Save Saves the data of an analysis results acquisition window in les.
Reset History Simultaneously erases the data of both the Concentration
Analysis History and Retention Time History windows.
Automatic Savig Automatically saves the historical records on concentration
analysis and retention time at a xed interval.
Open Opens saved les in the le reference window.
Close Closes a le currently open in the le reference window.
Save Re-saves the currently open le of the le reference window with
the same name.
Save As Re-saves the currently open le of the le reference window with
another name.
Exit Exits the Analysis Results window.
Window Latest Analysis
Opens the Latest Analysis Results window
Results
Concentration
Opens the Concentration Analysis History window.
Analysis History
Retention Time
Opens the Retention Time History window.
History
Laboratory Analysis
Opens the Laboratory Analysis Results window.
Results
File Analysis
Opens the File Analysis Results window.
Results
File Concentration
Opens the File Concentration Analysis History window.
Analysis History
File Retention Time
Opens the File Retention Time History window.
History
File Laboratory
Opens the File Laboratory Analysis Results window.
Analysis Results
Graph Draw A Creates graphs using the historical records on concentration
Draw B
analysis, retention time, le concentration analysis, and le
retention time.
Draw C
Help Contents Displays the Help contents of an Analysis Results window.
Help Topics Opens the Help window where you can search for a Help topic
on an analysis results window by typing in a keyword.
About Analysis
Displays version information.
Results
IM 11B03G03-03E
4th Edition : Mar. 21, 2012-00
 Loading...