

Page 1

User’s
Manual
Model GA10/GA10CL/GA10UP
Data Logging Software
User’s Manual
IM 04L65B01-01EN
1st Edition
Page 2

Page 3
IMPORTANT
Introduction
This manual explains how to use Data Logging Software
GA10 (hereafter referred to as GA10). To ensure correct
use, please read this manual thoroughly before beginning
operation.
Downloading Manuals
You can download the latest user’s manuals from the following URL.
www.smartdacplus.com/manual/en/
• Electronic Manuals (this manual, and related
manuals)
Manual Title Manual No.
Model GA10/GA10CL/GA10UP
Data Logging Software User’s Manual (this manual)
SMARTDAC+STANDARD
Universal Viewer User’s Manual
• Paper Manuals (manuals supplied with the
product)
Manual Title Manual No.
GA10 Data Logging Software
Downloading the Latest Software and Manuals
Updating the Software
Download the latest version of the software from the following URL.
www.smartdacplus.com/software/en/
Notes
• The contents of this manual are subject to change
without prior notice as a result of continuing
improvements to the software’s performance and
functions.
• Every effort has been made in the preparation of
this manual to ensure the accuracy of its contents.
However, should you have any questions or find any
errors, please contact your nearest YOKOGAWA
dealer.
• Copying or reproducing all or any part of the contents
of this manual without YOKOGAWA’s permission is
strictly prohibited.
Trademarks
• vigilantplant and SMARTDAC+ are registered
trademarks of Yokogawa Electric Corporation.
• Microsoft and Windows are registered trademarks
or trademarks of Microsoft Corporation in the United
States and/or other countries.
• Modbus is a registered trademark of AEG Schneider.
• Adobe and Acrobat are registered trademarks or
trademarks of Adobe Systems Incorporated.
• Pentium is a trademark of Intel Corporation in the
United States and/or other countries.
• Kerberos is a trademark of Massachusetts Institute of
Technology (MIT).
IM 04L65B01-01EN
IM 04L61B01-01EN
IM 04L65B01-02Z2
• Company and product names that appear in this
manual are registered trademarks or trademarks of
their respective holders.
• The company and product names used in this manual
are not accompanied by the registered trademark or
trademark symbols (® and ™).
How to Use This Manual
Structure of the Manual
This manual contains the following seven chapters.
Chapter Title Description
1
2 Preparation
3
4
5
6 Managing Users
7 Troubleshooting
Before Using the
Product
Configuring and
Starting Data
Collection and
Recording
Monitoring Data
Collection
Managing
Recording Data
Scope of This Manual
This manual does not explain the operations of your PC’s
operating system. For this information, read the Windows
user’s guide or related materials.
Conventions Used in This Manual
Notes
Note
Reference Item
Conventions Used in the Procedural Explanations
Bold characters
Images
The images used in this manual may differ from those that
actually appear in the software. Such differences do not
affect the procedural explanation.
Version and Functions Described in This Manual
Edition Product Addition and Change Refer To
1 Version 1.01.xx — —
This chapter provides an overview of Data
Logging Software GA10. It also explains
the main specifications of the software and
the PC system requirements.
This chapter provides a flowchart and the
procedure to prepare the software for data
collection and recording.
This chapter explains two configuration
modes for data collection and recording
with GA10: Simple Settings and Detail
Settings.
This chapter explains how to use the
Monitor Page to monitor data collection.
This chapter explains how to edit recording
data files from a list and how to display
recording data files on a viewer.
This chapter explains how to register,
delete, and edit information of users that
will perform data collection and recording
with GA10.
This chapter provides messages that GA10
may display and how to deal with them
as well as answers to frequently asked
questions.
Identifies important information required to
understand operations or functions.
Calls attention to information that is important for
the proper operation of GA10.
Reference to related operation or explanation is
indicated after this mark.
Example: section 4.1
Indicates character strings that appear on the
screen.
Example: Voltage
1st Edition: February, 2014 (YK)
All Right Reserved, Copyright © 2014, Yokogawa Electric Corporation
IM 04L65B01-01EN
Revisions
1st Edition: February 2014
i
Page 4

Software License Agreement
IMPORTANT - PLEASE READ CAREFULLY BEFORE INSTALLING OR USING:
THANK YOU VERY MUCH FOR SELECTING SOFTWARE OF YOKOGAWA ELECTRIC CORPORATION (“YOKOGAWA”). BY INSTALLING OR OTHERWISE USING THE
SOFTWARE PRODUCT, YOU AGREE TO BE BOUND BY THE TERMS AND CONDITIONS OF THIS AGREEMENT. IF YOU DO NOT AGREE, DO NOT INSTALL NOR USE
THE SOFTWARE PRODUCT AND PROMPTLY RETURN IT TO THE PLACE OF PURCHASE FOR A REFUND, IF APPLICABLE.
1. Scope
This Agreement applies to the following software products and associated documentation of Yokogawa (collectively, “Software Product”). Unless otherwise provided by
Yokogawa, this Agreement applies to the updates and upgrades of the Software Product which may be provided by Yokogawa.
Software Product: SMARTDAC+ Data Logging Software (Model GA10)
2. Grant of License
2.1 Subject to the terms and conditions of this Agreement, Yokogawa hereby grants to you a non-exclusive and non-transferable right to use the Software Product on a single or,
the following specied number of, computer(s) and solely for your internal operation use, in consideration of full payment by you to Yokogawa of the license fee separately
agreed upon.
Granted number of License: the number of purchases
2.2 Unless otherwise agreed or provided by Yokogawa in writing, the following acts are prohibited:
a) to reproduce the Software Product, exce pt for one archival copy for backup purpose, which shall be maintained with due care subject to this Agreement;
b) to sell, lease, distribute, transfer, pledge, sublicense, make available via the network or otherwise convey the Software Product or the license granted herein to any other
person or entity;
c) to use the Software Product on any unauthorized computer via the network;
d) to cause, permit or attempt to dump, disassemble, decompile, reverse-engineer, or otherwise translate or reproduce the Software Product into source code or other human
readable format, or to revise or translate the Software Product into other language and change it to other formats than that in which Yokogawa provided;
e) to cause, permit or attempt to remove any copy protection used or provided in the Software Product; or
f) to remove any copyright notice, trademark notice, logo or other proprietary notices or identication shown in the Software Product.
2.3 Any and all technology, algorithms, know-how and process contained in the Software Product are the property or trade secret of Yokogawa or licensors to Yokogawa.
Ownership of and all the rights in the Software Product shall be retained by Yokogawa or the licensors and none of the rights will be transferred to you hereunder.
2.4 You agree to maintain the aforementioned property and trade secret of Yokogawa or licensors and key codes in strict condence, not to disclose it to any party other than your
employees, ofcers, directors or similar staff who have a legitimate need to know to use the Software Product and agreed in writing to abide by the obligations hereunder.
2.5 Upon expiration or termination of this Agreement, the Software Product and its copies, including extracts, shall be returned to Yokogawa and any copies retained in your
computer or media shall be deleted irretrievably. If you dispose of media in which the Software Product or its copy is stored, the contents shall be irretrievably deleted.
2.6 The Software Product may contain software which Yokogawa is granted a right to sublicense or distribute by third party suppliers, including afliates of Yokogawa (“Third
Party Software”). If suppliers of the Third Party Software (“Supplier”) provide special terms and conditions for the Third Party Software which differ from this Agreement, the
special terms and conditions separately provided by Yokogawa shall prevail over this Agreement. Some software may be licensed to you directly by Supplier.
2.7 The Software Product may contain open source software (“OSS”), for which the special terms and conditions separately provided by Yokogawa shall take precedence over
this Agreement.
3. Restrictions on Application
3.1 Unless otherwise agreed in writing between you and Yokogawa, the Software Product is not intended, designed, produced or licensed for use in relation to aircraft operation
or control, ship navigation or marine equipment control, or ground facility or device for support of the aforesaid operation or control, or for use in relation to rail facility, nuclear
related facility, radiation-related equipment, or medical equipment or facility, or under any other circumstances which may require high safety standards.
3.2 If the Software Product is used for the abovementioned purposes, neither Yokogawa nor Supplier assumes liability for any claim or damage arising from the said use and
you shall indemnify and hold Yokogawa, Supplier, their afliates, subcontractors, ofcers, directors, employees and agents harmless from any liability or damage whatsoever,
including any court costs and attorney’s fees, arising out of or related to the said use.
4. Limited Warranty
4.1 The Software Product shall be provided to you on an “as is” basis at the time of delivery and except for physical damage to the recording medium containing the Software
Product, Yokogawa and Supplier shall disclaim all of the warranties whatsoever, express or implied, and all liabilities therefrom. If any physical defect is found on the recording
medium not later than twelve (12) months from delivery, Yokogawa shall replace such defective medium free of charge, provided that the defective medium shall be returned to
the service ofce designated by Yokogawa at your expense within the said twelve (12) months. THIS LIMITED WARRANTY PROVIDED IN THIS CLAUSE IS IN LIEU OF ALL
OTHER WARRANTIES OF ANY KIND WHATSOEVER AND YOKOGAWA HEREBY DISCLAIMS ALL OTHER WARRANTIES RELATING TO THE SOFTWARE PRODUCT,
WHETHER EXPRESSED OR IMPLIED, INCLUDING WITHOUT LIMITATION, ANY IMPLIED WARRANTIES OF MERCHANTABILITY, FITNESS FOR ANY PARTICULAR
PURPOSE, NON-INFRINGEMENT, QUALITY, FUNCTIONALITY, APPROPRIATENESS, ACCURACY, RELIABILITY AND RECENCY. IN NO EVENT SHALL YOKOGAWA
WARRANT THAT THERE IS NO INCONSISTENCY OR INTERFERENCE BETWEEN THE SOFTWARE PRODUCT AND OTHER SOFTWARE NOR SHALL BE LIABLE
THEREFOR. The warranty provisions of the applicable law are expressly excluded to the extent permitted.
4.2 At the sole discretion of Yokogawa, Yokogawa may upgrade the Software Product to the new version number (“Upgrade”) and make it available to you at your expense or
free of charge as Yokogawa deems t. In no event shall Yokogawa be obliged to upgrade the Software Product or make the Upgrade available to you.
4.3 Certain maintenance service may be available for some types of Software Product at Yokogawa’s current list price. Scope and terms and conditions of the maintenance
service shall be subject to those separately provided by Yokogawa. Unless otherwise provided in Yokogawa catalogues or General Specications, maintenance services
will be available only for the latest version and the immediately preceding version. In no event will service for the immediately preceding version be available for more than 5
years after the latest version has been released. In addition, no service will be provided by Yokogawa for the Software Product which has been discontinued for more than 5
years. Notwithstanding the foregoing, maintenance service may not be available for non-standard Software Product. Further, in no event shall Yokogawa provide any service
for the Software Product which has been modied or changed by any person other than Yokogawa.
5. Infringement
5.1 If you are warned or receive a claim by a third party that the Software Product in its original form infringes any third party’s patent (which is issued at the time of delivery of
the Software Product), trade mark, copyright or other intellectual property rights (“Claim”), you shall promptly notify Yokogawa thereof in writing.
5.2 If the infringement is attributable to Yokogawa, Yokogawa will defend you from the Claim at Yokogawa’s expense and indemnify you from the damages nally granted by the
court or otherwise agreed by Yokogawa out of court. The foregoing obligation and indemnity of Yokogawa shall be subject to that i) you promptly notify Yokogawa of the Claim
in writing as provided above, ii) you grant to Yokogawa and its designees the full authority to control the defense and settlement of such Claim and iii) you give every and all
necessary information and assistance to Yokogawa upon Yokogawa’s request.
ii
IM 04L65B01-01EN
Page 5

Software Licensing Agreement
5.3 If Yokogawa believes that a Claim may be made or threatened, Yokogawa may, at its option and its expense, either a) procure for you the right to continue using the Software
Product, b) replace the Software Product with other software product to prevent infringement, c) modify the Software Product, in whole or in part, so that it become non-
infringing, or d) if Yokogawa believes that a) through c) are not practicable, terminate this Agreement and refund you the paid-up amount of the book value of the Software
Product as depreciated.
5.4 Notwithstanding the foregoing, Yokogawa shall have no obligation nor liability for, and you shall defend and indemnify Yokogawa and its suppliers from, the Claim, if the
infringement is arising from a) modication of the Software Product made by a person other than Yokogawa, b) combination of the Software Product with hardware or software
not furnished by Yokogawa, c) design or instruction provided by or on behalf of you, d) not complying with Yokogawa’s suggestion, or e) any other causes not attributable to
Yokogawa.
5.5 This section states the entire liability of Yokogawa and its suppliers and the sole remedy of you with respect to any claim of infringement of a third party’s intellectual property
rights. Notwithstanding anything to the contrary stated herein, with respect to the claims arising from or related to the Third Party Software or OSS, the special terms and
conditions separately provided for such Third Party Software or OSS shall prevail.
6. Limitation of Liability
6.1 EXCEPT TO THE EXTENT THAT LIABILITY MAY NOT LAWFULLY BE EXCLUDED IN CONTRACT, YOKOGAWA AND SUPPLIERS SHALL NOT BE LIABLE TO ANY
PERSON OR LEGAL ENTITY FOR LOSS OR DAMAGE, WHETHER DIRECT, INDIRECT, SPECIAL, INCIDENTAL, CONSEQUENTIAL OR EXEMPLARY DAMAGES,
OR OTHER SIMILAR DAMAGES OF ANY KIND, INCLUDING WITHOUT LIMITATION, DAMAGES FOR LOSS OF BUSINESS PROFITS, BUSINESS INTERRUPTION,
LOSS OR DESTRUCTION OF DATA, LOSS OF AVAILABILITY AND THE LIKE, ARISING OUT OF THE USE OR INABILITY TO USE OF THE SOFTWARE PRODUCT, OR
ARISING OUT OF ITS GENERATED APPLICATIONS OR DATA, EVEN IF ADVISED OF THE POSSIBILITY OF SUCH DAMAGES, WHETHER BASED IN WARRANTY
(EXPRESS OR IMPLIED), CONTRACT, STRICT LIABILITY, TORT (INCLUDING NEGLIGENCE), OR ANY OTHER LEGAL OR EQUITABLE GROUNDS. IN NO EVENT
YOKOGAWA AND SUPPLIER’S AGGREGATE LIABILITY FOR ANY CAUSE OF ACTION WHATSOEVER (INCLUDING LIABILITY UNDER CLAUSE 5) SHALL EXCEED
THE DEPRECIATED VALUE OF THE LICENSE FEE PAID TO YOKOGAWA FOR THE USE OF THE CONCERNED PART OF THE SOFTWARE PRODUCT. If the Software
Product delivered by Yokogawa is altered, modied or combined with other software or is otherwise made different from Yokogawa catalogues, General Specications,
basic specications, functional specications or manuals without Yokogawa’s prior written consent, Yokogawa shall be exempted from its obligations and liabilities under this
Agreement or law.
6.2 Any claim against Yokogawa based on any cause of action under or in relation to this Agreement must be given in writing to Yokogawa within three (3) months after the cause
of action accrues.
7. Export Control
You agree not to export or provide to any other countries, whether directly or indirectly, the Software Product, in whole or in part, without prior written consent of Yokogawa.
If Yokogawa agrees such exportation or provision, you shall comply with the export control and related laws, regulations and orders of Japan, the United States of America,
and any other applicable countries and obtain export/import permit and take all necessary procedures under your own responsibility and at your own expense.
8. Audit; Withholding
8.1 Yokogawa shall have the right to access and audit your facilities and any of your records, including data stored on computers, in relation to the use of the Software Product
as may be reasonably necessary in Yokogawa’s opinion to verify that the requirements of this Agreement are being met.
8.2 Even after license being granted under this Agreement, should there be any change in circumstances or environment of use which was not foreseen at the time of delivery
and, in Yokogawa’s reasonable opinion, is not appropriate for using the Software Product, or if Yokogawa otherwise reasonably believes it is too inappropriate for you to
continue using the Software Product, Yokogawa may suspend or withhold the license provided hereunder.
9. Assignment
If you transfer or assign the Software Product to a third party, you shall expressly present this Agreement to the assignee to ensure that the assignee comply with this
Agreement, transfer all copies and whole part of the Software Product to the assignee and shall delete any and all copy of the Software Product in your possession
irretrievably. This Agreement shall inure to the benet of and shall be binding on the assignees and successors of the parties.
10. Termination
Yokogawa shall have the right to terminate this Agreement with immediate effect upon notice to you, if you breach any of the terms and conditions hereof. Upon termination of
this Agreement, you shall promptly cease using the Software Product and, in accordance with sub-clause 2.5, return or irretrievably delete all copies of the Software Product,
certifying the same in writing. In this case the license fee paid by you for the Software Product shall not be refunded. Clauses 2.4 and 2.5, 3, 5, 6 and 11 shall survive any
termination of this Agreement.
11. Governing Law; Disputes
This Agreement shall be governed by and construed in accordance with the laws of Japan.
Any dispute, controversies, or differences which may arise between the parties hereto, out of, in relation to or in connection with this Agreement (“Dispute”) shall be resolved
amicably through negotiation between the parties based on mutual trust. Should the parties fail to settle the Dispute within ninety (90) days after the notice is given from either
party to the other, the Dispute shall be addressed in the following manner:
(i) If you are a Japanese individual or entity, the Dispute shall be brought exclusively in the Tokyo District Court (The Main Court) in Japan.
(ii) If you are not a Japanese individual or entity, the Dispute shall be nally settled by arbitration in Tokyo, Japan in accordance with the Commercial Arbitration Rules of
the Japan Commercial Arbitration Association. All proceedings in arbitration shall be conducted in the English language, unless otherwise agreed. The award of arbitration
shall be nal and binding upon both parties, however, each party may make an application to any court having jurisdiction for judgment to be entered on the award and/or for
enforcement of the award.
12. Miscellaneous
12.1 This Agreement supersedes all prior oral and written understandings, representations and discussions between the parties concerning the subject matter hereof to the extent
such understandings, representations and discussions should be discrepant or inconsistent with this Agreement.
12.2 If any part of this Agreement is found void or unenforceable, it shall not affect the validity of the balance of the Agreement, which shall remain valid and enforceable according
to its terms and conditions. The parties hereby agree to attempt to substitute for such invalid or unenforceable provision a valid or enforceable provision that achieves to the
greatest extent possible the economic, legal and commercial objectives of the invalid or unenforceable provision.
12.3 Failure by either party to insist on performance of this Agreement or to exercise a right when entitled does not prevent such party from doing so at a later time, either in relation
to that default or any subsequent one.
End of document
IM 04L65B01-01EN
iii
Page 6

Using Open Source Software
Heimdal
The password-management function of the following product uses Heimdal source code for
AES authentication key generation.
In accordance with the Heimdal license agreement, the copyright notice, redistribution
conditions, and license are listed below.
SMARTDAC+ STANDARD Universal Viewer
Copyright (c) 2006 Kungliga Tekniska Högskolan (Royal Institute of Technology, Stockholm,
Sweden). All rights reserved.
Redistribution and use in source and binary forms, with or without modification, are
permitted provided that the following conditions are met:
1. Redistributions of source code must retain the above copyright notice, this list of
conditions and the following disclaimer.
2. Redistributions in binary form must reproduce the above copyright notice, this list of
conditions and the following disclaimer in the documentation and/or other materials provided
with the distribution.
3. Neither the name of the Institute nor the names of its contributors may be used to endorse
or promote products derived from this software without specific prior written permission.
THIS SOFTWARE IS PROVIDED BY THE INSTITUTE AND CONTRIBUTORS "AS IS''
AND ANY EXPRESS OR IMPLIED WARRANTIES, INCLUDING, BUT NOT LIMITED
TO, THE IMPLIED WARRANTIES OF MERCHANTABILITY AND FITNESS FOR A
PARTICULAR PURPOSE ARE DISCLAIMED. IN NO EVENT SHALL THE INSTITUTE OR
CONTRIBUTORS BE LIABLE FOR ANY DIRECT, INDIRECT, INCIDENTAL, SPECIAL,
EXEMPLARY, OR CONSEQUENTIAL DAMAGES (INCLUDING, BUT NOT LIMITED TO,
PROCUREMENT OF SUBSTITUTE GOODS OR SERVICES; LOSS OF USE, DATA, OR
PROFITS; OR BUSINESS INTERRUPTION) HOWEVER CAUSED AND ON ANY THEORY
OF LIABILITY, WHETHER IN CONTRACT, STRICT LIABILITY, OR TORT (INCLUDING
NEGLIGENCE OR OTHERWISE) ARISING IN ANY WAY OUT OF THE USE OF THIS
SOFTWARE, EVEN IF ADVISED OF THE POSSIBILITY OF SUCH DAMAGE.
iv
IM 04L65B01-01EN
Page 7

Contents
1
Introduction ........................................................................................................................................... i
How to Use This Manual ....................................................................................................................... i
Software License Agreement ................................................................................................................ii
Using Open Source Software ..............................................................................................................iv
Chapter 1 Before Using the Product
1.1 Overview .............................................................................................................................1-1
Server and Client ................................................................................................................................... 1-1
Connectivity with Many Devices ............................................................................................................1-1
Data Collection Project ..........................................................................................................................1-2
Monitoring .............................................................................................................................................. 1-2
User Management .................................................................................................................................1-2
Features to improve reliability................................................................................................................1-3
Convenient Features ............................................................................................................................. 1-3
Connectable Devices and Software ......................................................................................................1-4
Main GA10 Specifications .....................................................................................................................1-4
1.2 MODEL and SUFFIX Codes ............................................................................................... 1-4
1.3 PC System Requirements ................................................................................................... 1-4
1.4 Menu and Icons ...................................................................................................................1-5
Chapter 2 Preparation
2.1 Preparation from Installation up to Data Collection and Recording ....................................2-1
2.2 Installation ...........................................................................................................................2-2
2.3 Registering the Administrator Password .............................................................................2-3
2.4 Registering Users ................................................................................................................2-4
2.5 Creating a Project ...............................................................................................................2-4
2.6 Other Operations If Necessary ............................................................................................2-5
2.6.1 Starting (Restarting) and Stopping the Server .......................................................................2-5
2.6.2 Changing the Server Port Number .........................................................................................2-6
2.6.3 Entering a License Number (GA10/GA10CL/GA10UP) ......................................................... 2-7
2.6.4 Uninstallation ..........................................................................................................................2-8
2.6.5 Checking the Maximum Number of Channels (Tags) That Can Be Used .............................. 2-8
2
3
4
5
6
7
Chapter 3 Configuring and Starting Data Collection and Recording
3.1 Simple Settings and Detail Settings ....................................................................................3-1
3.2 Easy Configuration (Simple Settings) .................................................................................3-2
3.2.1 Creating a Project ..................................................................................................................3-2
3.2.2 Registering Devices to Connect .............................................................................................3-2
3.2.3 Setting the Collection and Record Interval and Save Destination .......................................... 3-3
3.2.4 Starting Data Collection and Recording ................................................................................. 3-3
3.2.5 Closing a Project .................................................................................................................... 3-3
3.3 Detailed Configuration (Detail Settings) ..............................................................................3-4
3.3.1 Creating a Project ..................................................................................................................3-4
3.3.2 Starting Detail Settings ...........................................................................................................3-6
3.3.3 Registering Devices to Connect .............................................................................................3-7
3.3.4 Setting Tags ......................................................................................................................... 3-11
3.3.5 Setting Display Groups ........................................................................................................3-14
3.3.6 Registering Data Collection Method and Monitor Page .......................................................3-17
3.3.7 Setting the Data Recording Method ..................................................................................... 3-20
3.3.8 Configuring Mail Settings .....................................................................................................3-24
3.3.9 Setting Project Access Privileges .........................................................................................3-28
3.3.10 Starting Data Collection and Recording ...............................................................................3-31
3.4 Registering Modbus Devices ............................................................................................3-32
IM 04L65B01-01EN
v
Page 8

Contents
Chapter 4 Monitoring Data Collection
4.1 Monitoring on the Monitor Page ..........................................................................................4-1
4.2 Monitoring on the Trend Display ......................................................................................... 4-3
4.3 Monitoring on the Digital Display .........................................................................................4-7
4.4 Monitoring on the Meter Display .........................................................................................4-7
4.5 Monitoring Alarms ...............................................................................................................4-8
4.6 Checking Alarms .................................................................................................................4-9
4.7 Checking the Project Operation Status .............................................................................4-10
4.8 Controlling Devices during Data Collection ....................................................................... 4-11
4.9 Things to Consider ............................................................................................................4-12
4.10 Viewing the Log .................................................................................................................4-13
4.1.1 Displaying the Data Collection Status .................................................................................... 4-1
4.1.2 Displaying the Monitor Page ..................................................................................................4-2
4.1.3 Setting General Display Options ............................................................................................ 4-2
4.2.1 Displayed Content ..................................................................................................................4-3
4.2.2 Changing the Display ............................................................................................................. 4-3
4.2.3 Controlling the Y-axis .............................................................................................................4-4
4.2.4 Showing and Hiding Waveforms (Using the Legend).............................................................4-5
4.2.5 Viewing the Alarm Occurrence Status ....................................................................................4-5
4.2.6 Reading Values with Cursors .................................................................................................4-5
4.2.7 Adding Marks .........................................................................................................................4-6
4.3.1 Displayed Content ..................................................................................................................4-7
4.3.2 Showing and Hiding Alarm Indicators ....................................................................................4-7
4.4.1 Displayed Content ..................................................................................................................4-7
4.5.1 Group Overview .....................................................................................................................4-8
4.5.2 Tag Overview ......................................................................................................................... 4-8
4.5.3 Alarm Overview ......................................................................................................................4-8
4.6.1 Displaying the Alarm Overview Dialog Box ............................................................................4-9
4.6.2 Alarm Notification with Sound ................................................................................................4-9
4.6.3 Perform Alarm ACK Operations ............................................................................................. 4-9
4.7.1 Displayed Content ................................................................................................................4-10
4.8.1 Controlling Device Computation from GA10 ........................................................................4-11
4.9.1 Time Zone and Daylight Saving Time ..................................................................................4-12
4.9.2 Error Data .............................................................................................................................4-12
4.9.3 Reflecting Changes Made on the Monitor Page to the Setting Page ...................................4-12
4.9.4 Changing the Time on the Device after Starting Data Collection and Recording .................4-12
4.10.1 Displayed Content in the Log Dialog Box .............................................................................4-13
4.10.2 Opening the Log Dialog Box ................................................................................................4-13
Chapter 5 Managing Recording Data
5.1 Displaying a List of Data Files ............................................................................................. 5-1
5.1.1 Displayed Content ..................................................................................................................5-1
5.2 Displaying Recording Data ........................................................................................................ 5-2
Chapter 6 Managing Users
6.1 Administrator and Users ......................................................................................................6-1
6.2 Managing User Status .........................................................................................................6-2
6.2.1 Using the User Management Page ........................................................................................ 6-2
6.3 Changing User Information ................................................................................................. 6-2
6.3.1 How the Administrator Changes Other User Information .......................................................6-2
6.3.2 How Users Change Their Information ....................................................................................6-3
6.4 Registering and Deleting Users ..........................................................................................6-3
6.4.1 Registering a New Users .......................................................................................................6-3
6.4.2 Deleting a User ......................................................................................................................6-4
6.4.3 Changing a Project Owner ..................................................................................................... 6-4
6.4.4 Opening a Project at a Specific Privilege Level .....................................................................6-4
6.4.5 Unlocking a Project by Force .................................................................................................6-5
vi
IM 04L65B01-01EN
Page 9

Chapter 7 Troubleshooting
7.1 Messages That GA10 May Display ..................................................................................... 7-1
Messages .............................................................................................................................................. 7-1
Warning Messages ................................................................................................................................ 7-1
Error Messages ..................................................................................................................................... 7-1
7.2 Frequently Asked Questions (FAQ) ..................................................................................... 7-4
Contents
IM 04L65B01-01EN
vii
Page 10

Blank
Page 11
1.1 Overview
Chapter 1 Before Using the Product
Data Logging Software GA10 is used to collect data from measuring instruments and
controllers via communication and monitor and record the collected data. Recorded data can
be displayed and printed from the Viewer software.
To use GA10, you need a PC that can connect to target devices. The connection between
the PC and target devices is established through Ethernet or serial communication.
You can use the Simple Settings mode to easily start data collection.
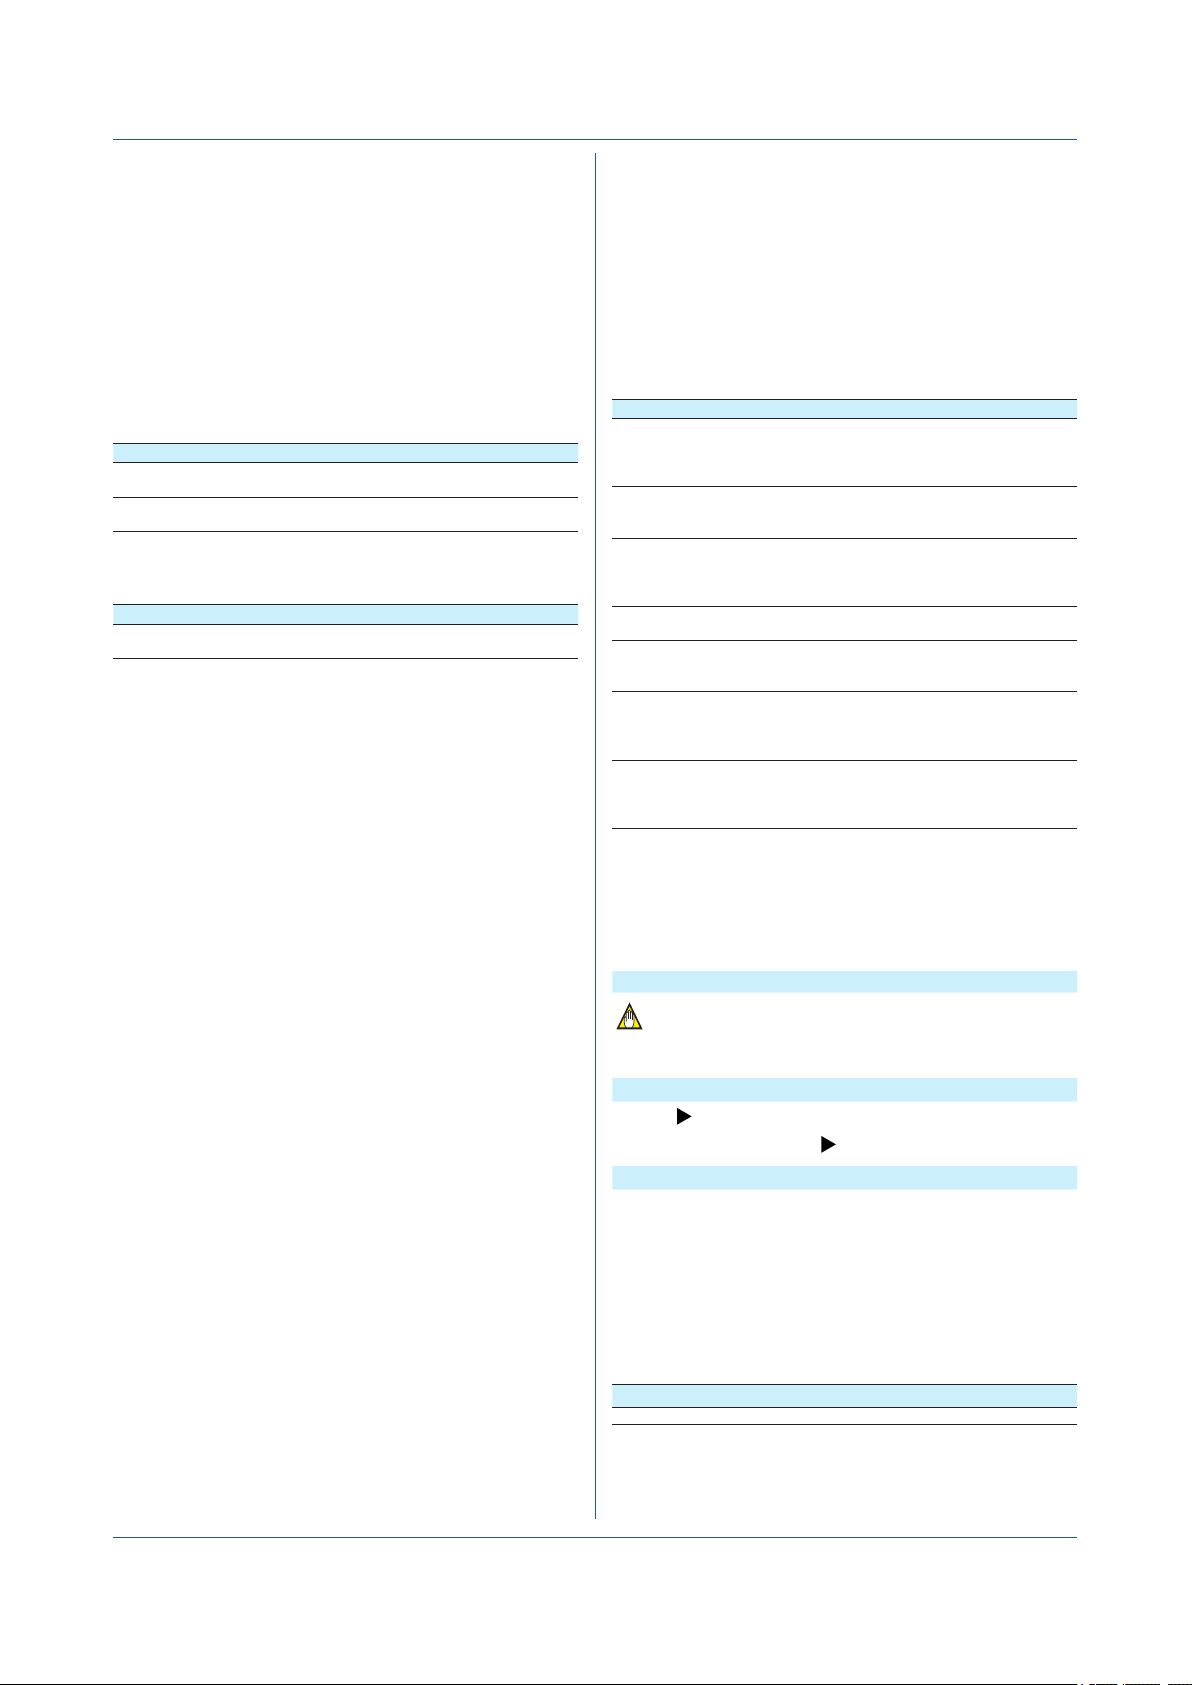
Server and Client
GA10 is a client-server software application. Users perform various server operations from a
client. The server collects, records, and manages data received from connected devices on
the basis of the instructions received from the client.
The client function and server function are installed together in a single PC. You can also
install GA10CL, which is a version that contains only the client function, in other PCs.
Multiple clients can simultaneously access a single server.
1
Before Using the Product
Data
collection
Data
collection
User
Operation
GA10CL
Client
GA10
Instruction to
the server
Response to
the client
Server
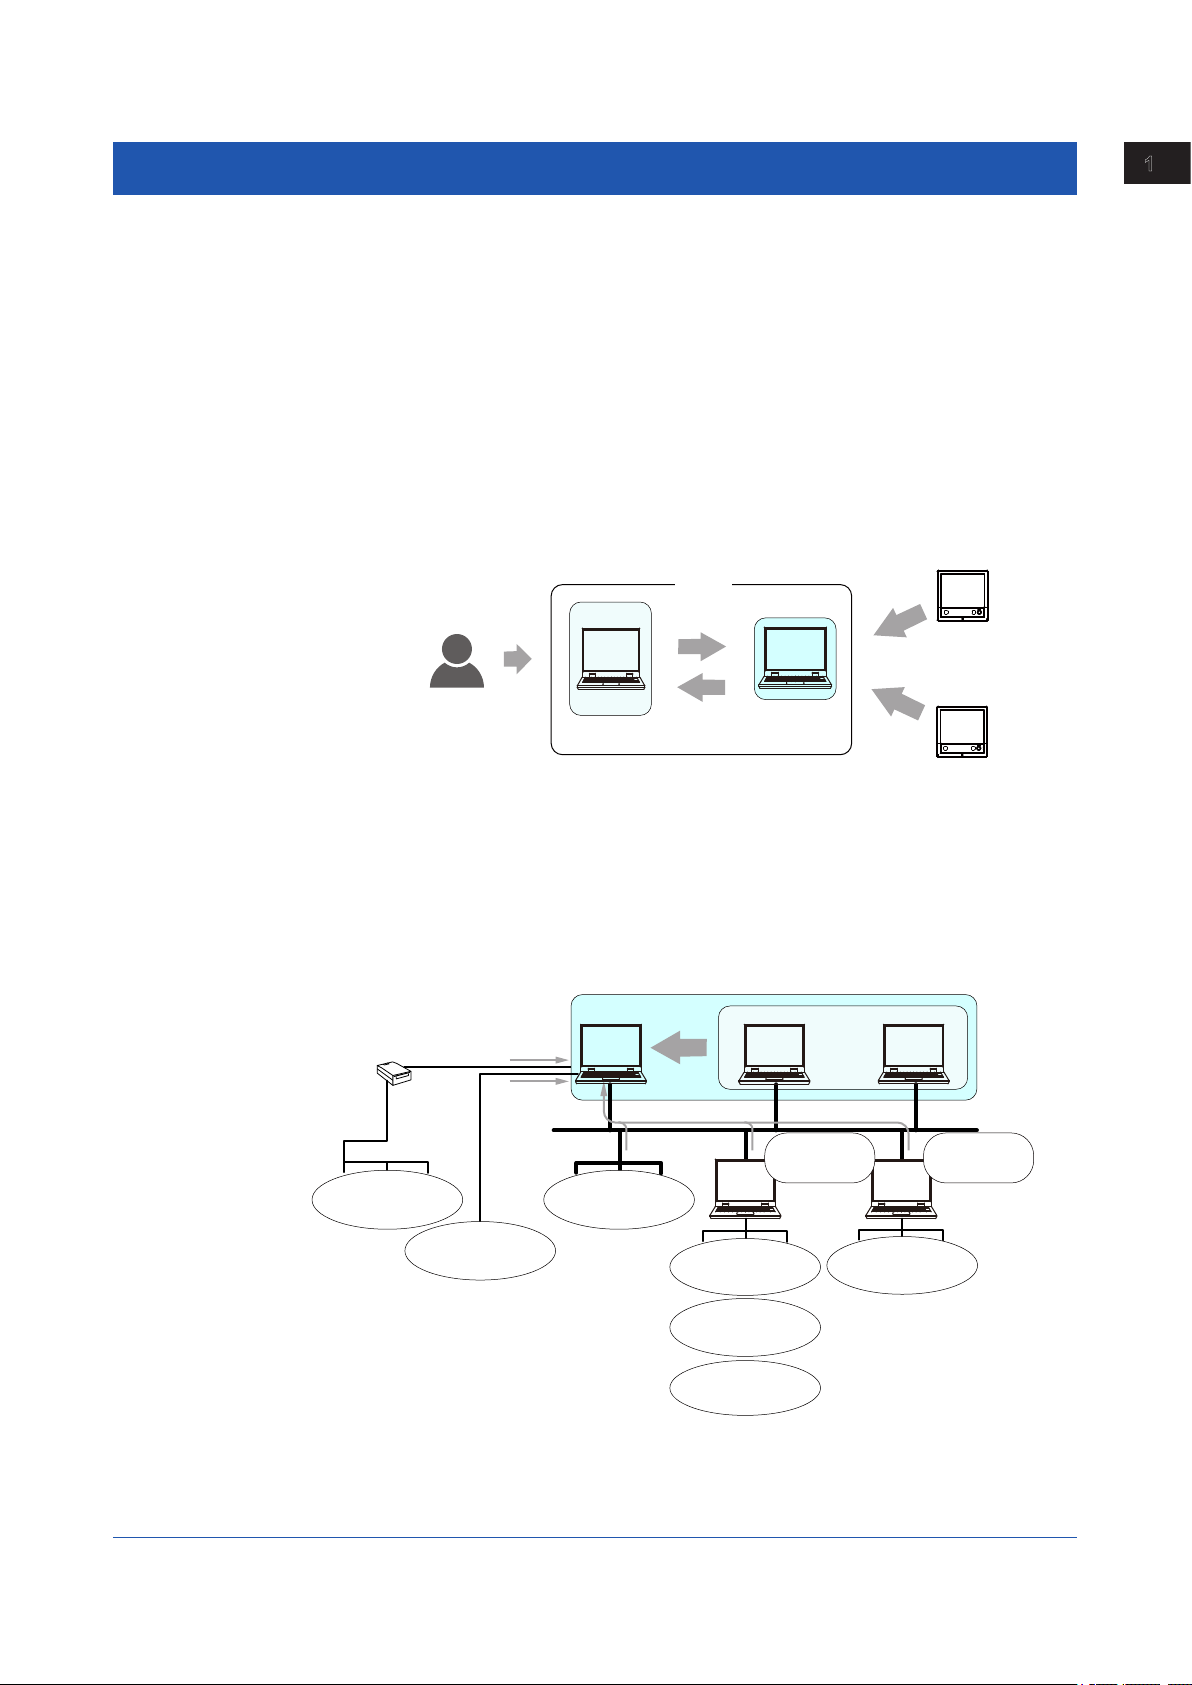
Connectivity with Many Devices
GA10 is a software application that consolidates various devices connected over a network
and performs data collection. GA10 can connect to YOKOGAWA recorders and data
loggers. It can also collect data that has been acquired by YOKOGAWA’s data acquisition
software (MXLOGGER, DAQLOGGER, and DAQ32Plus). Moreover, it supports the Modbus
protocol, enabling data collection from YOKOGAWA’s control instruments (temperature
controllers, signal conditioners, and power monitors). GA10 can also collect data from other
manufacturers’ devices that support Modbus communication.
Data Logging Software
Server Client Client
Converter
RS-422/485
Instruments supporting
RS-422/485
communication
supporting RS-232
Data collection
RS-232
Data collection
RS-232
Instruments
communication
Data collection
supporting Ethernet
communication
Operation
Instruments
Source devices for
MXLOGGER data
collection
Source devices for
DAQLOGGER data
collection
Source devices for
DAQ32Plus data
collection
MXLOGGER, DAQLOGGER, DAQ32Plus are YOKOGAWA’s data collection applications.
Gate Software is YOKOGAWA’s driver software.
. . .
MXLOGGER
DAQLOGGER
DAQ32Plus
Instruments
supporting Modbus
communication
Ethernet
Gate
Software
IM 04L65B01-01EN
1-1
Page 12

Chapter 1 Before Using the Product
Data Collection Project
GA10 collects data in units of projects. Projects are created by users to suite their purposes.
For example, a project named “Process A” can be created to collect measured data from a
process called “A.” In this way, a project can be created for each set of collected data.
For each project, the data to be collected, data to be recorded, the monitor page layout, and
the like are specified.
Multiple projects can be created in a single server.
Monitoring
Collected data can be monitored on the Monitor Page.
On the Monitor Page, you can arrange four types of displays (trend, digital, meter, and
alarm) in an easy-to-view layout. In addition, related data can be displayed in groups to
monitor measurements efficiently. In the trend display, you can refer to past data.
User Management
GA10 users can be registered and managed. There are two user levels: administrator and
user. Administrators are responsible for registering and deleting all users. Users enter their
IDs and passwords to access a server.
Of the users registered in a server, only those that have been granted privileges can access
projects. The operation scope of each user can be managed by assigning one of four levels:
owner, manager, operator, and monitor. If a user is accessing a project, other users cannot
access that project.
Register and delete users
Client
3
Data collection and recording
Server
Administrator:
Client Client
Server access privileges
Project operation privileges
Project1Project2Project
Monitoring
1-2
IM 04L65B01-01EN
Page 13
Chapter 1 Before Using the Product
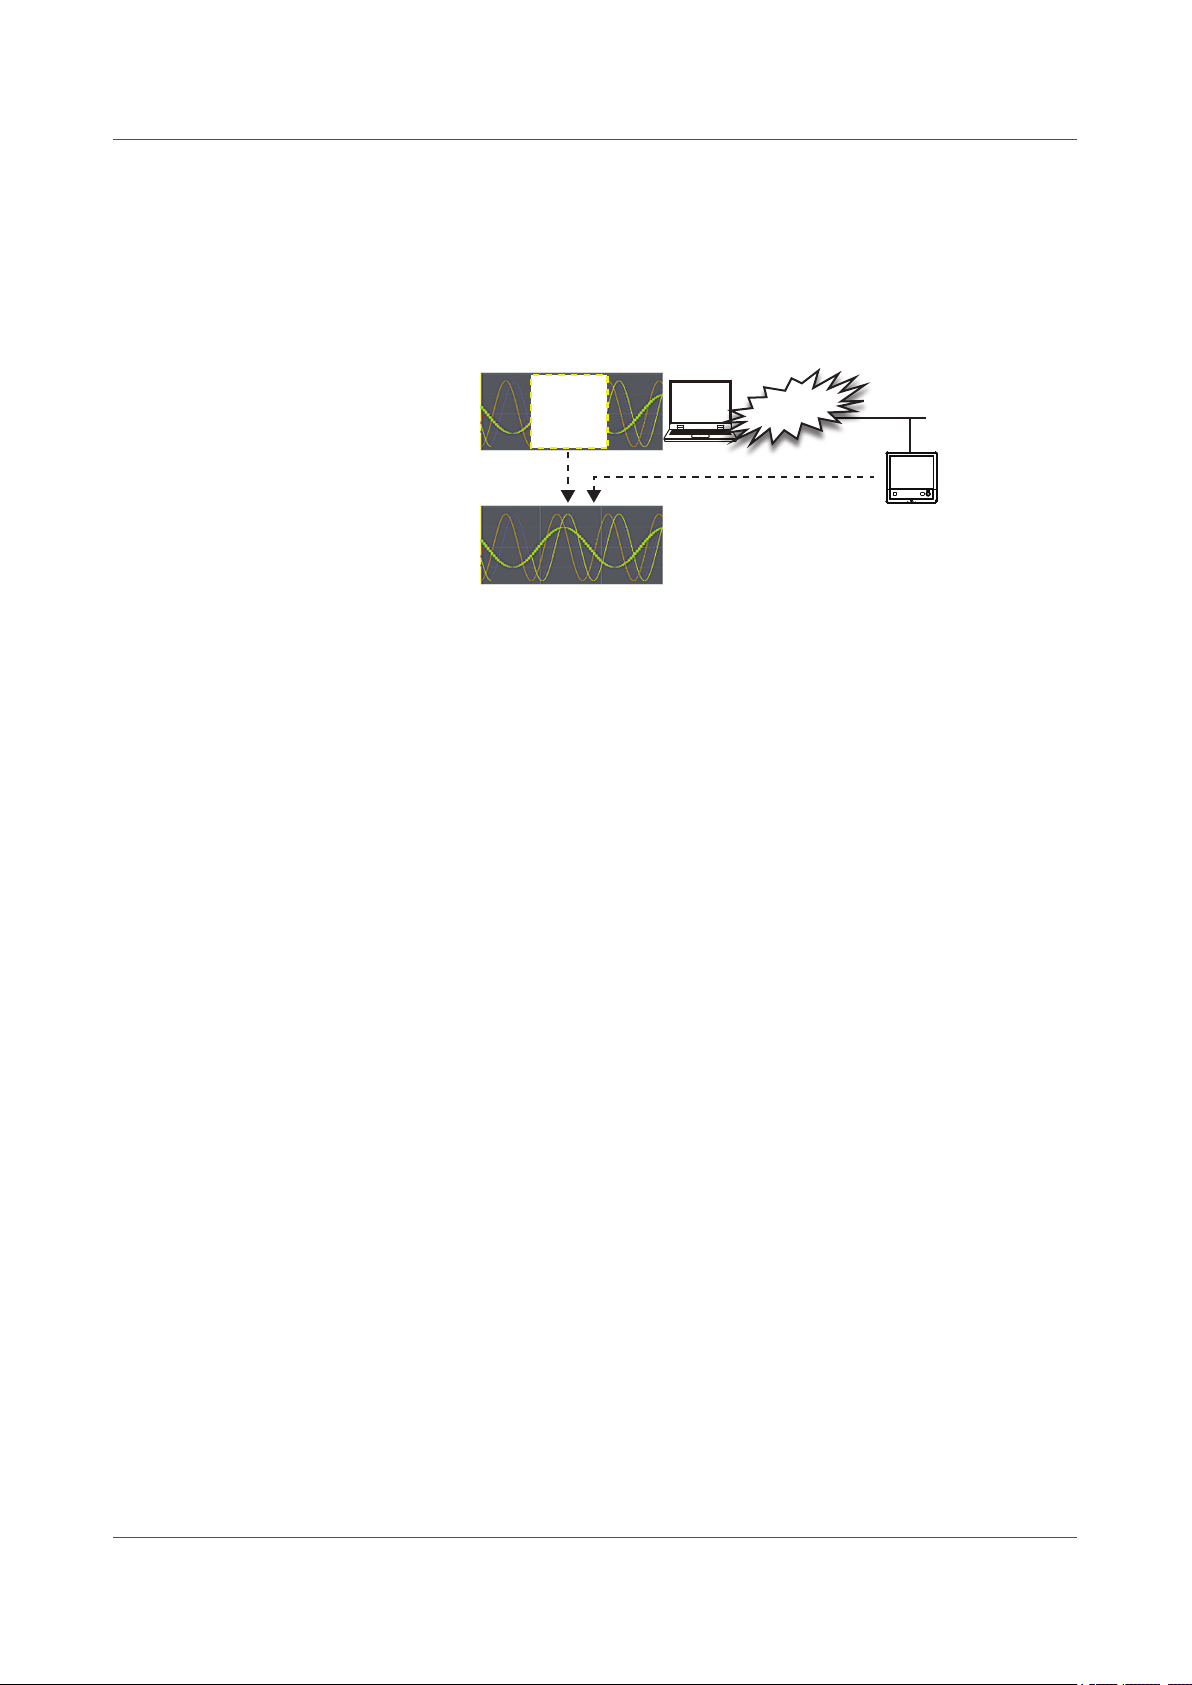
Data dropout
Features to improve reliability
GA10 features the following functions to ensure reliable data collection.
Data supplementing function (Backfill function)
If a data dropout occurs in the data file that is being recorded due to a communication
interference, this function automatically acquires data from the internal memory of the
device and restores the data loss in the file.
Interference
Restores the data loss. (Backfill)
Several conditions must be met for the backfill function to operate properly.
For details, see Q4 on page 7-4.
Auto reconnection when communication is disconnected
If the communication is disconnected and data collection is interrupted, communication
retry is performed every approximately 30 seconds. When communication recovers,
the server resumes data collection and recording. This allows data loss to be kept to a
minimum.
Protection of data files up to the moment of power failure
GA10 writes to the data file every approximately 10 seconds. This reduces the chances of
the data file being lost in the event the PC shuts down unexpectedly.
Convenient Features
• You can use the Simple Settings feature to easily start data collection.
• You can set the data timestamp to PC time or Device time.
• The DDE (Dynamic Data Exchange) server feature allows collected data to be loaded into
Excel and other applications.
• GA10 has a trial mode in which 100 channels can be used for 60 days without a license.
IM 04L65B01-01EN
1-3
Page 14
Chapter 1 Before Using the Product
Connectable Devices and Software
The following table lists the devices and software
applications that GA10 can connect to.
Registering devices for connection: page 3-2
Connectable devices and interfaces: page 3-10
Name Name
μR10000 MW100
μR20000 DA100
DX1000 DR130
DX1000N DR230
DX1000T DR240
DX2000 GX10
DX2000T GX20
CX1000 GP10
CX2000 GP20
FX1000 DAQLOGGER
MV1000 DAQ32Plus
MV2000 MXLOGGER
MX100 Devices supporting the Modbus
protocol. (Includes Yokogawa
control products.)
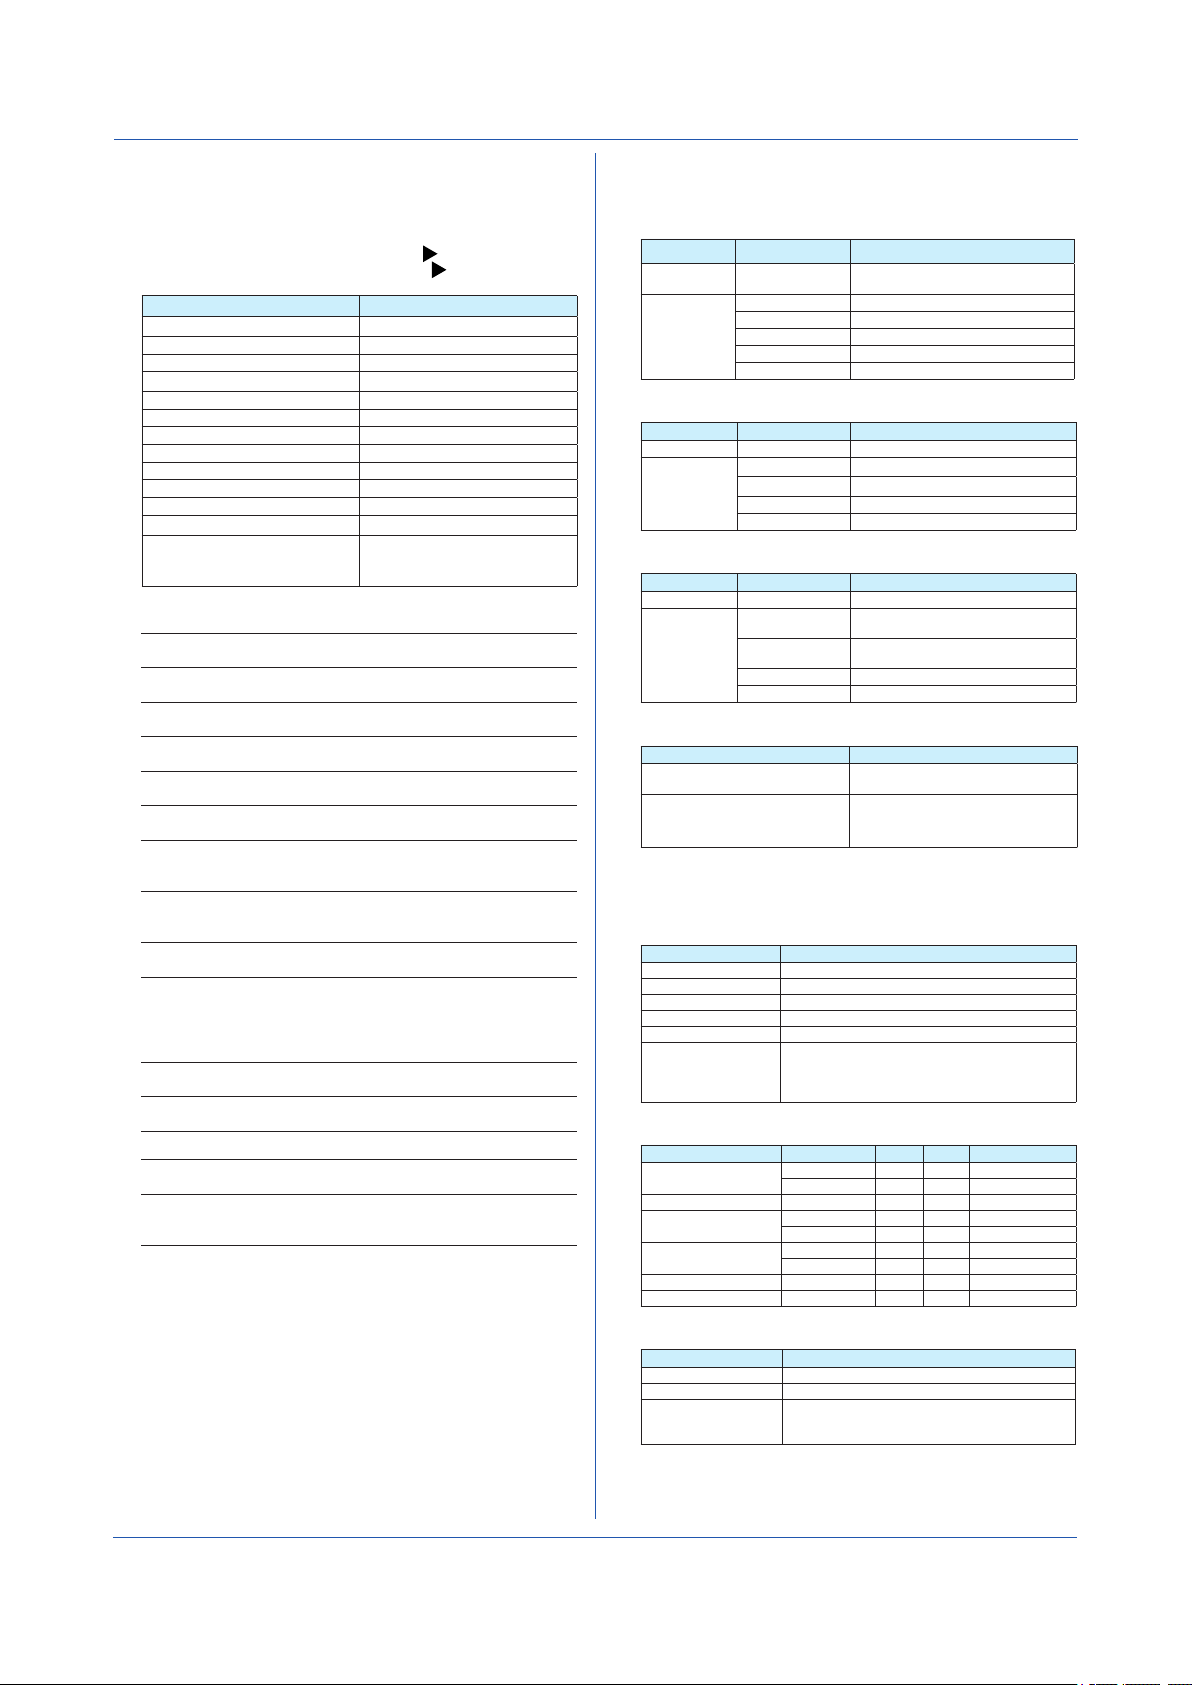
Main GA10 Specifications
Maximum number of simultaneous
device connections
Maximum number of simultaneous
client connections
Maximum number of simultaneous
operation projects
Maximum number of device
registrations
Maximum number of project
registrations
Maximum number of user
registrations
Maximum number of clients that
can run simultaneously on the
same PC
Scan interval
(when set to PC time)
Scan interval
(when set to device time)
Record interval
(when set to PC time)
Record interval
(when set to device time)
Maximum number of recording
channels (tags)
Number of display groups 50
Number of channels (tags) per
display group
Language
1
1 Make sure to use the same language setting for this software, Windows
OS, and the recorders that data is to be collected from.
100
No limit (operation guaranteed up
to 32 clients)
30
1000
10000
100
1
100 ms, 200 ms, 500 ms, 1 s,
2 s, 5 s, 10 s, 20 s, 30 s, 1 min,
2 min, 5 min, 10 min
The scan interval of each device
100 ms, 200 ms, 500 ms, 1 s,
2 s, 5 s, 10 s, 20 s, 30 s, 1 min,
2 min, 5 min, 10 min (limited to
an integer multiple of the scan
interval)
Same as the scan interval
2000
50
English, Japanese, Chinese,
French, German, Russian,
Korean
1.2 MODEL and SUFFIX Codes
• Basic Software
Model Suffix Code Name
GA10 Data Logging Software
Channels
-01
-02
-05
-10
-20
Basic license
100ch
200ch
500ch
1000ch
2000ch
• Additional Monitoring PCs (Clients)
Model Suffix Code Name
GA10CL Client license for GA10
Number of
licenses
-01
-05
-10
-50
1 license
5 licenses
10 licenses
50 licenses
• Additional Channels
Model Suffix Code Name
GA10UP
Upgrade
-01
-02
-03
-04
Channels upgrade license for GA10
100ch→200ch, 200ch→500ch,
500ch→1000ch, 1000ch→2000ch
100ch→500ch, 200ch→1000ch,
500ch→2000ch
100ch→1000ch, 200ch→2000ch
100ch→2000ch
• How the software is provided
Name Description
License sheet Contains the license keys. Check that the
GA10 Data Logging Software
Downloading the Latest Software and
Manuals
correct number of licenses are present.
1 sheet (A4 size)
1.3 PC System Requirements
• Hardware
Item Description
CPU Pentium 4, 3.2 GHz or faster
Internal memory 2 GB or more
Hard disk 200 MB or more of free space
Mouse Mouse compatible with the OS
Display 1024 x 768 dots or higher, 65536 colors or more
Communication ports RS-232 or Ethernet port compatible with the OS
• Operating System
OS Edition 32 bit 64 bit Service Pack
Windows XP Home Edition Yes No SP3
Windows Vista Home Premium Yes No SP2
Windows 7 Home Premium Yes Yes SP1
Windows 8 — Yes Yes No SP
Windows Server 2008 R2 No Yes SP1
Windows Server 2012 — No Yes No SP
To perform RS-232 communication or RS-422/485
communication with a connected device, the server
PC needs a RS-232 serial port.
Professional Yes No SP3
Professional Yes Yes SP1
Pro Yes Yes No SP
1-4
• Other Operating Environment
Item Description
Microsoft Office Excel 2007, 2010, 2013
Adobe Reader Adobe Reader X (latest version recommended)
RS-232-RS-422/485
converter
To perform RS-422/485 communication with a
connected device, use a converter. (YOKOGAWA
ML2 recommended)
IM 04L65B01-01EN
Page 15

Append mark to all groups
Chapter 1 Before Using the Product
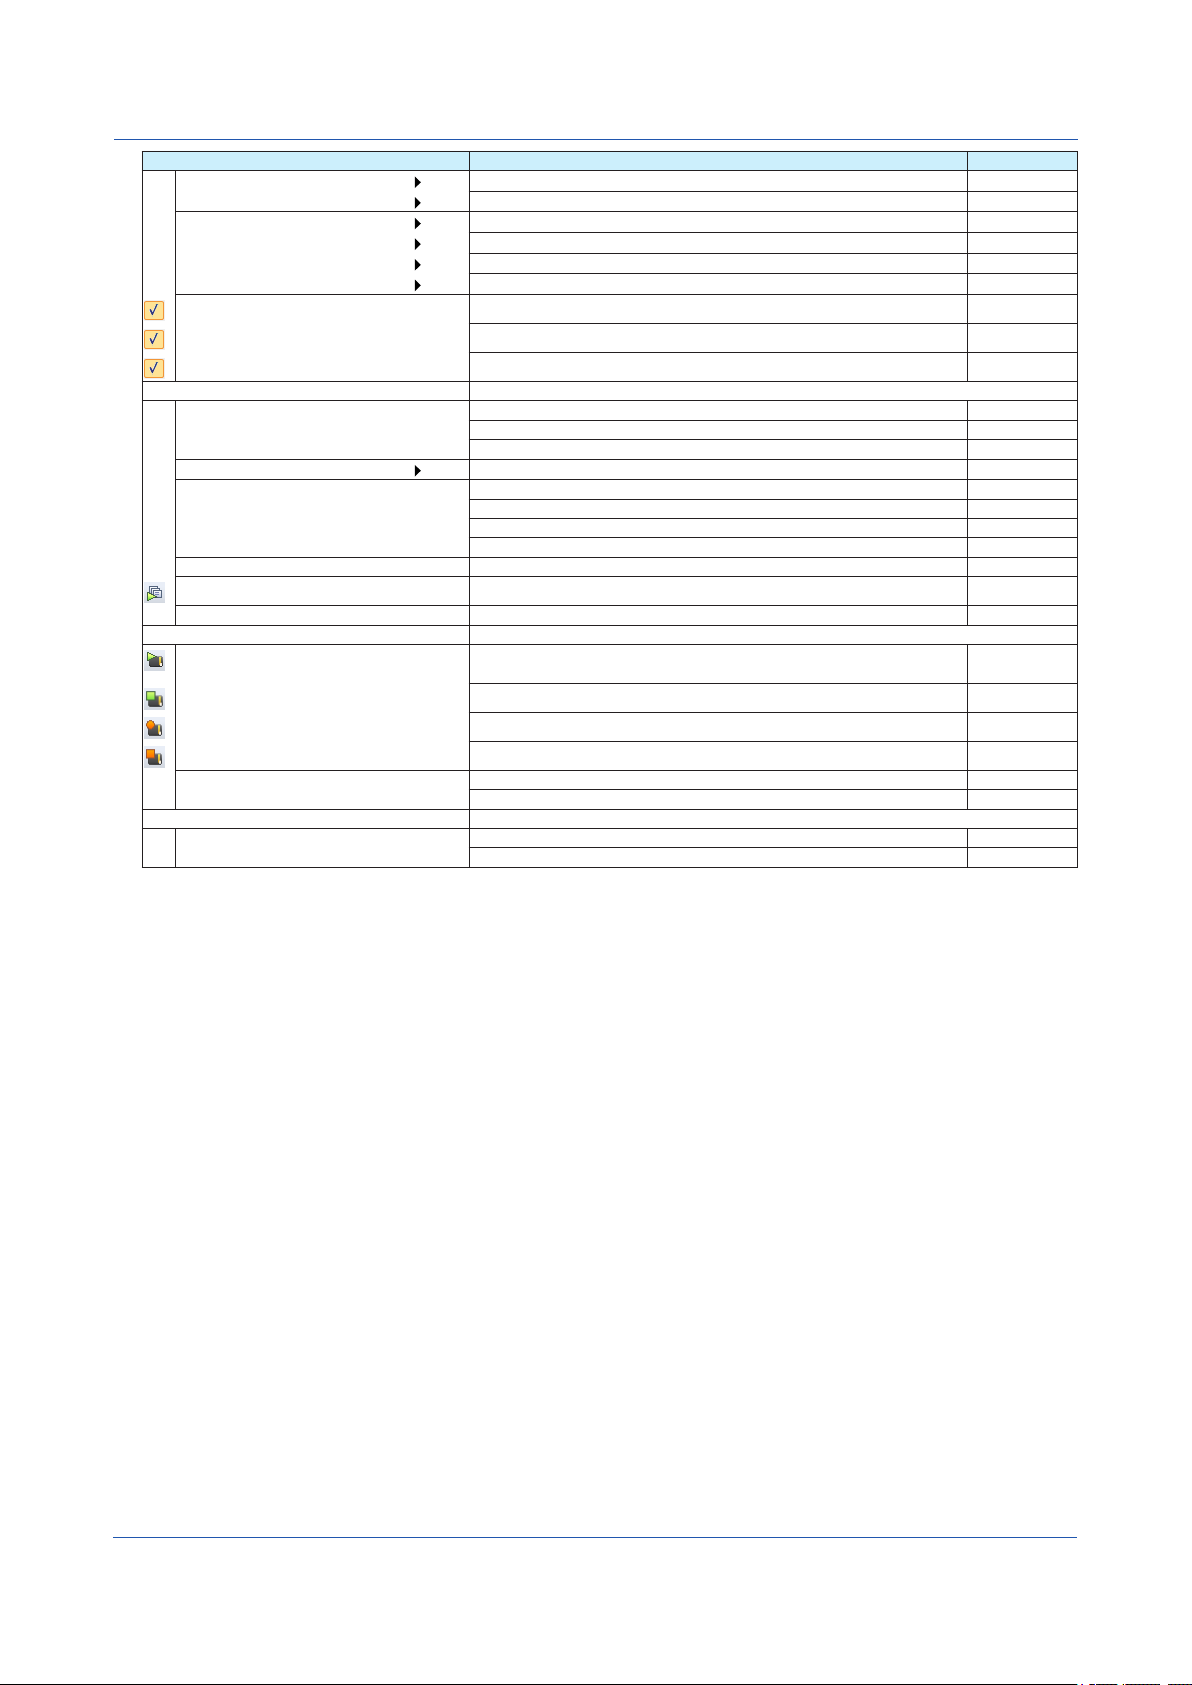
1.4 Menu and Icons
This section describes the GA10 menus and icons and page references on how to use them.
Menu before logging in
Tool Bar (see the table below)
Menu Description See pages...
File(F)
Login Login server 2-2
Exit Exit application -
View
Style
Tool Bar Show or hide the tool bar -
Help(H)
User's &Manual F1 Display user operation manual Input License Display license dialogue 2-7
Input Server License... Display server license dialogue 2-7
About... Display program information, version number and copyright 2-7
Server information... Display server version information dialogue 2-8
To Update Website Display website of Data Logging Software -
Switch the display style 2-3, 4-2
Menu after logging in
Append mark to the current group
Mark edit box
Tool Bar
Menu Description See pages...
File
Edit
View
(see the table below)
Logout... Logout from server 2-3
New Project... Create a Project 2-4, 3-2, 3-4
Import Project... Import Project information to create Project from file. 3-4
Export Project... Export Project information to file 3-4
Import tags... Import tags from tag information tag message file 3-13
Export tags... Export tags from tag information tag message file 3-13
Start DDE Start DDE service 3-30
Stop DDE Stop DDE service 3-30
Exit Exit application -
Copy Ctrl+C Copy the selection and put it on the Clipboard 3-5
Paste Ctrl+V Paste the copied content 3-5
Delete Delete Delete the selected content 3-3, 6-4
Project List Page Switch to Project list page 2-4, 3-4, 3-31, 4-1, 6-4
User Management Page Switch to user management page 2-4, 6-2
Log... Display log dialogue 4-13
Refresh Update the current page 5-2
Alarm Show or hide alarm 4-5
Alarm List... Show alarm list dialogue 4-8
Group Link Linkage shows when switching between different groups 4-2
Cursor value... Open the Cursor Window 4-5
Cursor Value Transparency
Erase Cursor Erase Cursor 4-5
Mark Bar
(see page 4-6)
Switch cursor value transparency 4-5
Turn alarm's sound off
Alarm ACK
Alarm Action Bar
(see page 4-9)
IM 04L65B01-01EN
1-5
Page 16
Chapter 1 Before Using the Product
Menu Description See pages...
Tag Display From.
User Display Form.
Style
Date Format
Month Display Form.
Decimal Point
Tool Bar Show or hide the tool bar -
Mark Bar Whether or not display the mark bar -
Alarm Action Bar Whether or not display the alarm action bar -
Project
Open with specified permission Open the project according to the specified permission 6-4
Modify Basic Information Modify project's basic information 3-6
Modify Owner Modify project's owner 6-4
Append Mark
Start Computing Start computing in the devices used in the Project 4-11
Stop Computing Stop computing in the devices used in the Project 4-11
Clear Computing Clear computing in the devices used in the Project 4-11
Clear&Start Computing Clear and start computing in the devices used in the Project 4-11
Alarm ACK Alarm ACK 4-9
Assign Tag Automatically... Assign tags automatically 3-15
Unlock Project Forcibly Change the project's lock state forcibly 6-5
Operation
Start Monitoring Simultaneously All opened Projects start monitoring simultaneously 3-31
Stop Monitoring Simultaneously All opened Projects stop monitoring simultaneously 3-31
Start Recording Simultaneously All opened Projects start recording simultaneously 3-31
Stop Recording Simultaneously All opened Projects stop recording simultaneously 3-31
Alarm Sound Alarm sounds when alarm happens 4-9
Turn Alarm's Sound Off Turn alarm's sound off 4-9
User
Change Information Change user's information 2-3, 6-2, 6-3
Register New User Register new user in server 2-4, 6-3
Switch tag display format 4-2
Switch user display format 4-2
Switch the display style 2-3, 4-2
Switch the date format 4-2
Switch the month display format 4-2
Switch the decimal point 4-2
Append mark to the current group or all groups 4-6
1-6
IM 04L65B01-01EN
Page 17

1
Chapter 2 Preparation
2.1 Preparation from Installation up to Data Collection and Recording
The following flowchart shows an outline of the procedure from GA10 installation up to data
collection and recording.
Create a project for data collection and recording.
Quickly start logging
Simple Settings
Sec. 3.2
Installation
Log in.
Register the administrator password.
Register users.
Create a new project?
YES
Select the
setting mode.
Switching not possible
Sec. 2.2
When installing GA10CL, or
GA10UP:
Sec. 2.2
Sec. 2.3
Sec. 2.4
Sec. 2.5
NO
Use existing projects.
• Export and import
Save and load projects (settings).
• Copy and paste
Copy and paste existing projects (settings).
Configure settings and
start logging.
Detail Settings
Sec. 3.3
2
Preparation
Sec. 2.6.3
Sec. 3.3.1
Register devices to connect.
Set the collection and
Set the data save destination.
Configuration Preparation
Start collection and recording.
record interval.
Sec. 3.2.2
Switching possible
Sec. 3.2.3
Sec. 3.2.3
Sec. 3.2.4
Register devices to connect.
Set tags.
Set display groups.
Set the data collection method.
Register monitoring.
Set data recording method.
Set mail settings.
Set project access privileges.
Sec. 3.3.4
Sec. 3.3.5
Sec. 3.3.6
Sec. 3.3.8
Start collection and recording.
Sec. 3.3.3
Sec. 3.3.6
Sec. 3.3.7
Sec. 3.3.9
Sec. 3.3.10
Monitor data. View recorded results. Manage users.
Chapter 6
2-1
IM 04L65B01-01EN
Chapter 4
Chapter 5
Page 18
Chapter 2 Preparation
2.2 Installation
The GA10 installer package includes a server, client, and
Universal Viewer programs. Executing the procedure
below installs all programs in a single PC.
The server runs as a Windows service and starts running
as soon as it is installed.
Note
• Install the programs as a Windows administrator.
For Windows XP, log on as an administrator. For
Windows Vista or later, start as step 2 in the following
procedure.
• Uninstall GA10 before reinstalling.
The procedure here is explained for Windows 7.
1
Double-click the downloaded file to extract the files.
2
In the extracted folder, right-click InstallE_x86.exe
(InstallE_x64.exe for a 64 bit edition), and click Run
as administrator.
3
The installation wizard starts.
If you accept the license agreement, click Next.
4
When the Customer Information dialog box appears,
enter the user name, company name, and license
number. Click Next.
Note
If you do not enter the license number, you can use GA10
as a trial version for 60 days.
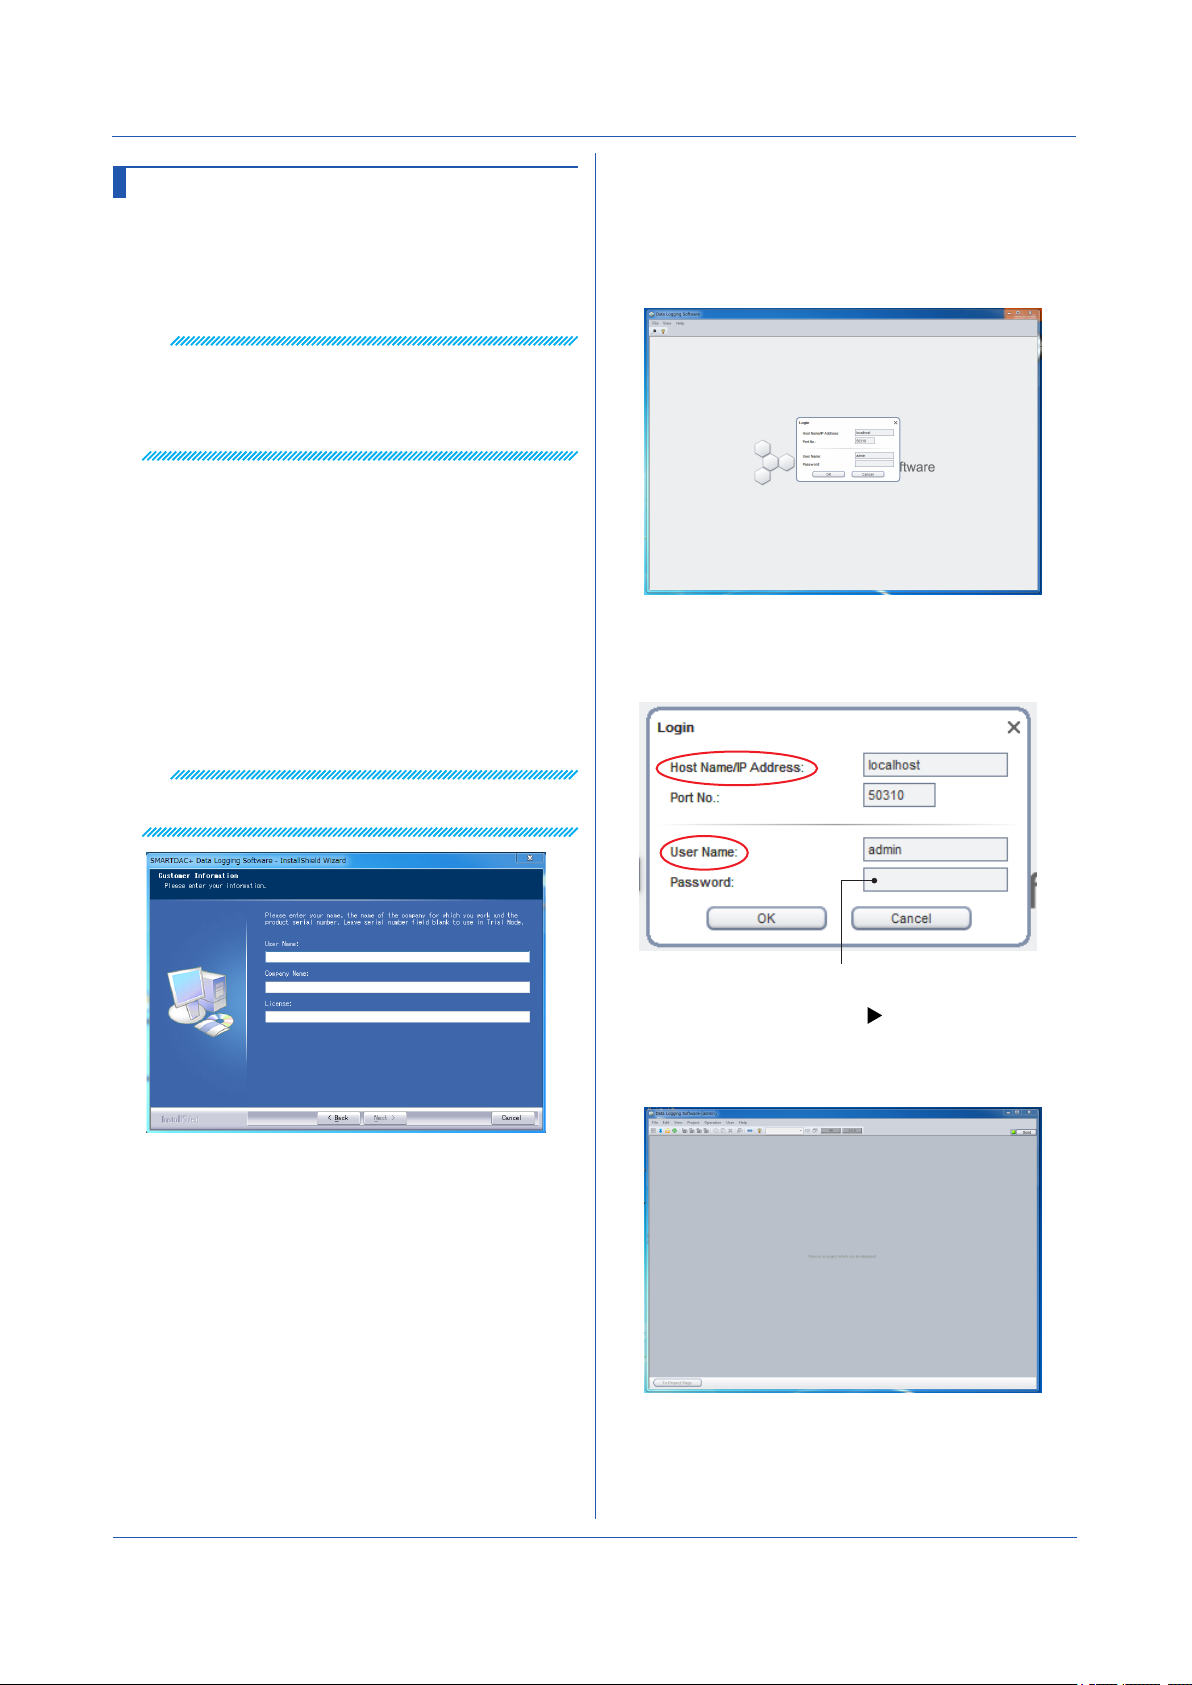
After the installation is complete, start the client, and log in
to the server.
7
On the Start menu, click All Programs,
SMARTDAC+ Data Logging Software, and Data
Logging Software.
The client starts, and the Login dialog box appears.
8
For the first login, enter the following information.
User name: admin
Password: (blank)
5
Continue to follow the instructions on the screen to
install the software.
6
When the installation is complete, click Finish.
Check that SMARTDAC+ Data Logging Soft-
ware has been added to the Start menu under
All Programs.
2-2
Do not enter the password for the first login.
To change the port number: page 2-6
9
Click OK.
The dialog box closes, the initial Project List Page
appears.
IM 04L65B01-01EN
Page 19
Chapter 2 Preparation
10
To continue with the procedure, proceed to next
section.
To log out, on the File menu, click Logout.
Note
You can change the background color from the two
available colors by using Style in the View menu.
The following figure shows the “dark” style window. (The
windows shown in all other figures of this manual is “light”
style.)
Setting general display options: page 4-2
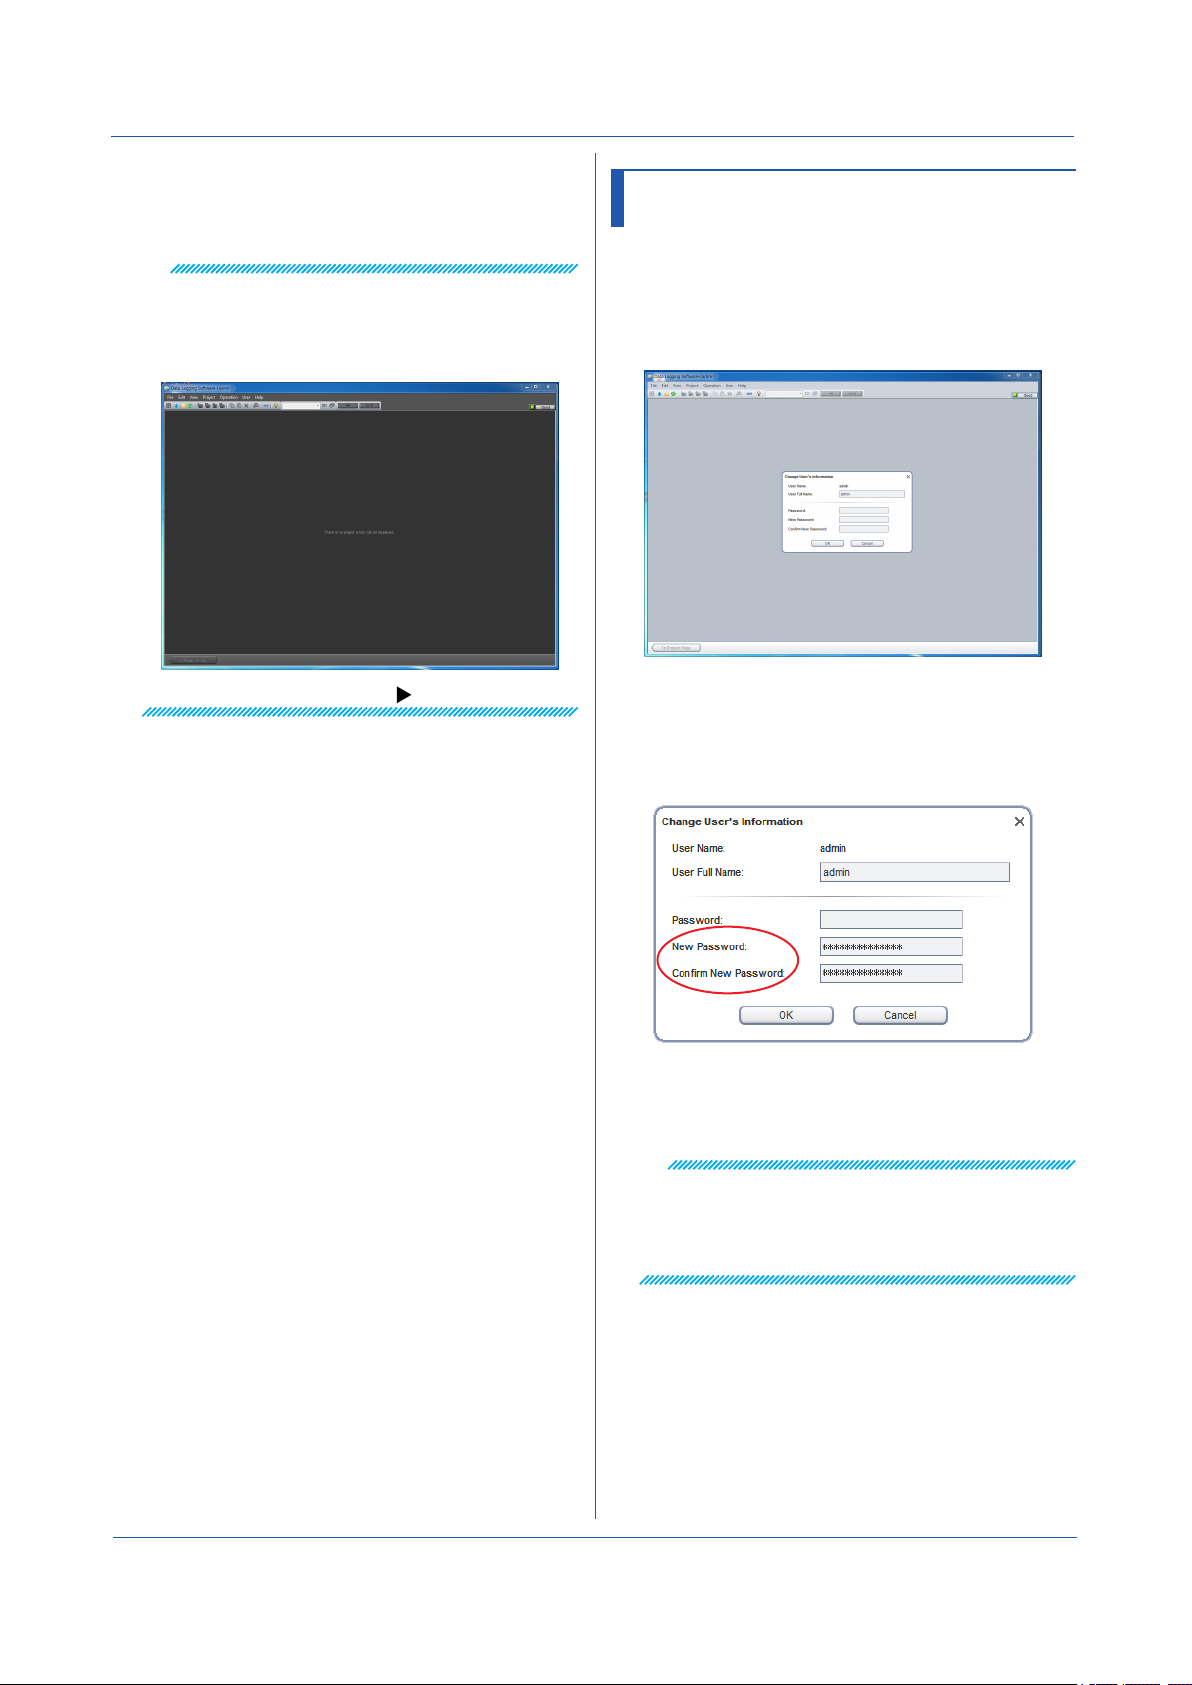
2.3 Registering the Administrator
Password
After installation, first set the administrator (admin)
password. The administrator can register and delete users
and initialize their passwords.
1
In the window shown in step 9 of section 2.2, click
Change Information on the User menu.
The Change User’s Information dialog box appears.
2
Enter the new password for the administrator, and
click OK.
Enter the password using 4 to 30 alphanumeric
characters.
IM 04L65B01-01EN
The Change User’s Information dialog box closes.
The new administrator password has been set.
Note
• After registering their passwords, users will need to
enter the passwords to log in to the server.
• If the administrator cannot log in, administrator
privileges cannot be used. Make a note of the
administrator password, and do not lose it.
2-3
Page 20

Chapter 2 Preparation
2.4 Registering Users
After registering the administrator, register users as
necessary. The administrator registers users.
1
Start the client, and enter the administrator
password that you set earlier to log in.
2
On the View menu, click User Management Page.
Or, click the
The User Management Page appears.
3
On the User menu, click Register New User.
The Change User’s Information dialog box appears.
4
Type the user name and user full name.
Enter up to 20 ASCII characters for the user
name.
icon.
Note
User names are case-sensitive.
Differences between the administrator and users and
changing and deleting users: page 6-1
2.5 Creating a Project
After logging in to the server, create a project to manage
data collection and recording.
You can create a project in one of the following ways.
• Create a new project: You can create a new data
collection project.
• Export and import: You can export and import a
project.
• Copy and paste: You can duplicate an existing project.
This section explains how to create a new project using
Simple Settings.
1
Switch from the User Management Page to the
Project List page.
On the View menu, click Project List Page. Or,
click the
Switch to Project List page
icon.
5
Click OK.
The user is registered, and an icon is added in the
window.
6
To add more users, repeat the procedure above.
Registered users will be able to log in, set their
passwords, and perform their assigned tasks.
2-4
The Project List Page appears.
The rst page that appears when you log in is
the Project List Page.
IM 04L65B01-01EN
Page 21

Chapter 2 Preparation
2
On the File menu, click New Project.
The Create New Project dialog box appears.
3.
Type the project name and comment. Set Settings
Mode to Simple Settings.
Simple Settings and Detail Settings: page 3-1
Type the project name and comment.
4
Click OK.
A new project is created in the Project List Page.
Differences between
Note
• You can enter up to 20 characters for Project's Name
and 60 characters for Comment. Following characters
are unavailable for Project's name: \ /:,;*?”<>|
• In Simple Settings, you only have to specify the data
collection source device, record interval, and data file
save destination to start collecting data.
• If you select Simple Settings, you can change to Detail
Settings while you are configuring a new project, but
you cannot change from Detail Settings to Simple
Settings.
2.6 Other Operations If Necessary
2.6.1 Starting (Restarting) and Stopping the
Server
To manually start or stop the GA10 server, follow the
procedure below.
Note
Before stopping the server, stop data collection and
recording, and log out.
• Starting (Restarting) or Stopping the Server
1
On the Start menu, click Control Panel and
Administrative Tools, and double-click Services.
2
In the Services window, choose DLGServer.
3
To stop the server, on the Action menu, click Stop.
The status turns blank.
4
To start the server, on the Action menu, click Start.
Click Restart to stop the server once and restart.
The status shows Started.
• Changing the Server Startup Type from Automatic to
Manual.
1
Carry out steps 1 to 3 in the previous section to stop
the server.
2
In the Services window, double-click DLGServer.
The DLGServer Properties appear.
3
Click the Startup type arrow, and click Manual.
4
Click OK to close the dialog box.
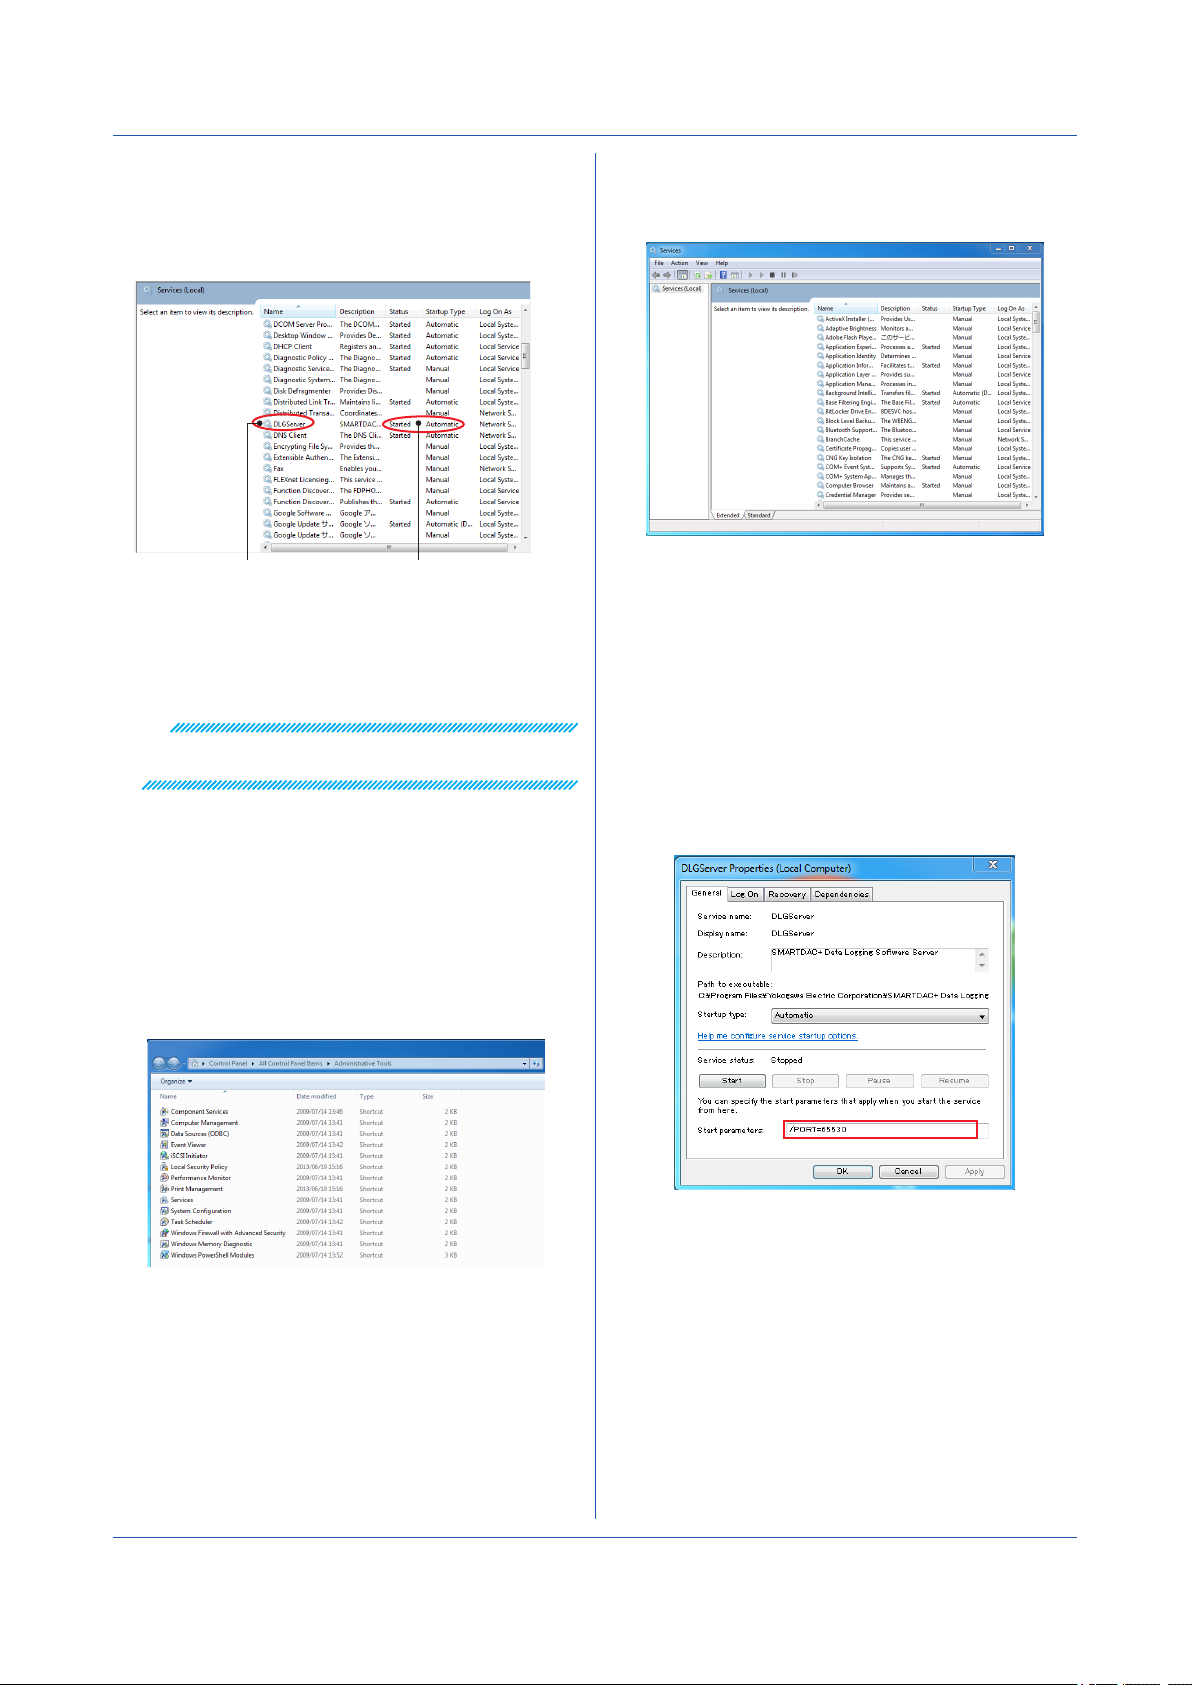
• Checking Whether the GA10 Server Is Running
After installation, to check whether the GA10 server
is running, follow the procedure below.
1
On the Start menu, click Control Panel and
Administrative Tools, and double-click Services.
The Services window appears.
A project that you create is shown in the Project List Page
along with the information about the project.
Access privilege
and the user name
The following types of access privileges are available.
Owner Manager Operator Monitor
Project access privileges: page 3-28
IM 04L65B01-01EN
Project name
Access
privilege
User who are locking
(accessing)
2-5
Page 22
Chapter 2 Preparation
2
Scroll down to find DLGServer in the Name column.
Check the Status column.
The DLGServer status should be indicating Started,
and Startup Type should be set to Automatic.
3
Double-click Services.
The Services window appears.
DLGServer
If the DLGServer status indicates Started, the
GA10 server is running.
3
After confirmation, close the window.
Status: Started
Startup Type: Automatic
Note
If Startup Type is set to Automatic, the server will start
and stop when Windows start and stop.
2.6.2 Changing the Server Port Number
By default, the GA10 server port number is set to
50310. If necessary, change the port number by
following the procedure below.
1
On the PC that the server is installed, open Control
Panel from the Start menu.
2
Click Administrative Tools to display a list of
available tools.
4
Choose DLGServer.
5
On the Action menu, click Stop to stop the server.
6
Double-click DLGServer.
The DLGServer Properties appear.
7
In Startup parameters, type the following character
string.
/PORT=Number
Specify the new port number in “Number.”
Specify the port number in the range of 1025 to
65535 (excluding 50311).
2-6
8
Click Start.
9
Click OK to close the window.
IM 04L65B01-01EN
Page 23

IMPORTANT
Chapter 2 Preparation
2.6.3 Entering a License Number (GA10/
GA10CL/GA10UP)
When entering a license number, use Windows
administrator privileges. If you are using Windows 7,
follow steps 1 and 2 below to start the software, and then
enter the license number.
• Checking the Remaining Trial Period
In the software, click About on the Help menu, and
check the remaining number of days in the dialog
box that appears.
• Entering a License Number during the Trial Period
1
Right-click Data Logging Software in the Start
menu.
2
On the shortcut menu, click Run as administrator.
Data Logging Software starts.
3
Log in to the server.
4
On the Help menu, click Input Server License.
A dialog box appears.
Maximum Number of Tags
Name
GA10UP
• Adding a Client (GA10CL)
To add a client, use the installer InstallClientE_x86.
exe, which installs only clients. (InstallClientE_x64.
exe for the 64 bit edition)
You can download the installer from the following
URL.
www.smartdacplus.com/software/en/
The installaion procedure is the same as with the
basic license.
Installation procedure: page 2-2
To register the license for the added client, click
Input License on the Help menu.
1 level upgrade 100 200
-01
-02 2 level upgrade 100 500
-03 3 level upgrade 100 1000
-04 4 level upgrade 100 2000
in a Project
Before After
200 500
500 1000
1000 2000
200 1000
500 2000
200 2000
5
Type the license number, and click Register.
The license number appears in the dialog box.
Note
After registering the license, you must restart the server.
For the procedure to restart the server, see Sec. 2.6.1.
• After the Trial Period Is Over
If the trial period expires, you will no longer be able
to log in. When you start the software, you will be
prompted to enter the license number. If you have
purchased a license, type the number.
• Upgrading to Increase the Number of Channels
(GA10UP)
To add an option that increases the number of
channels (tags), type the license number of the
option in the Input Server License dialog box shown
above.
The following table shows the maximum number of
tags in a project after adding options.
Do not change or delete les in the following folder: local
disk > ProgramData > Yokogawa > SMARTDAC+Data
Logging Software > Cong.
These les contain user information, project setting
information, project status information, and device
information.
IM 04L65B01-01EN
2-7
Page 24
Chapter 2 Preparation
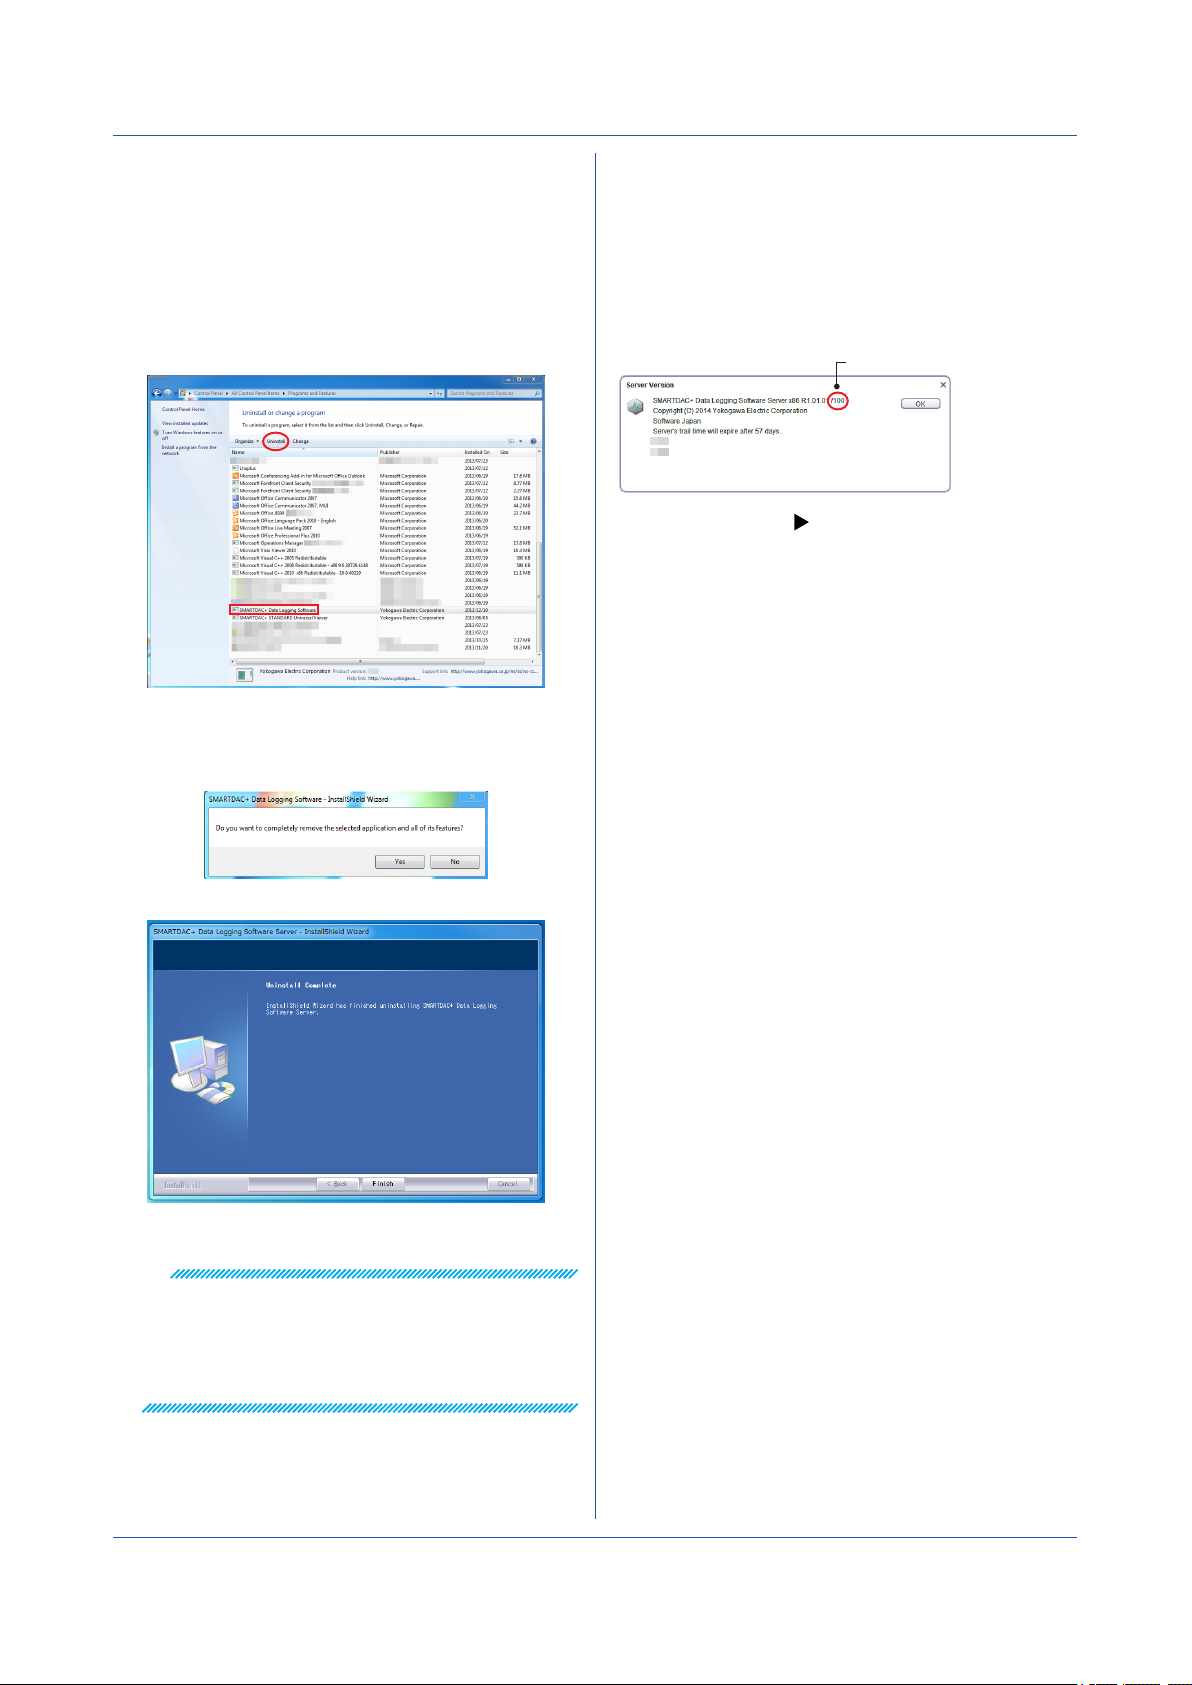
2.6.4 Uninstallation
To uninstall GA10, follow the procedure below.
1
On the Start menu, click Control Panel and
Programs and Features.
A list of programs installed in your PC appears.
2.
Select SMARTDAC+ Data Logging Software.
3
Click Uninstall.
4
A confirmation message appears. To proceed, click
Yes.
2.6.5 Checking the Maximum Number of
Channels (Tags) That Can Be Used
You can check the maximum number of channels
(tags) that can be used in the server information dialog
box.
On the Help menu, click Server Information to display
the information of the server that you are logged in to.
Maximum number of tags
To add channels: page 1-4
Uninstallation begins.
Uninstallation is complete when the progress bar
disappears.
Note
• On Windows XP
In step 2, choose Change or Remove Programs
instead of Programs and Features.
• On Windows 8
Click Settings, Control Panel, and Programs and
Features.
2-8
IM 04L65B01-01EN
Page 25
1
2
Chapter 3 Configuring and Starting Data Collection and Recording
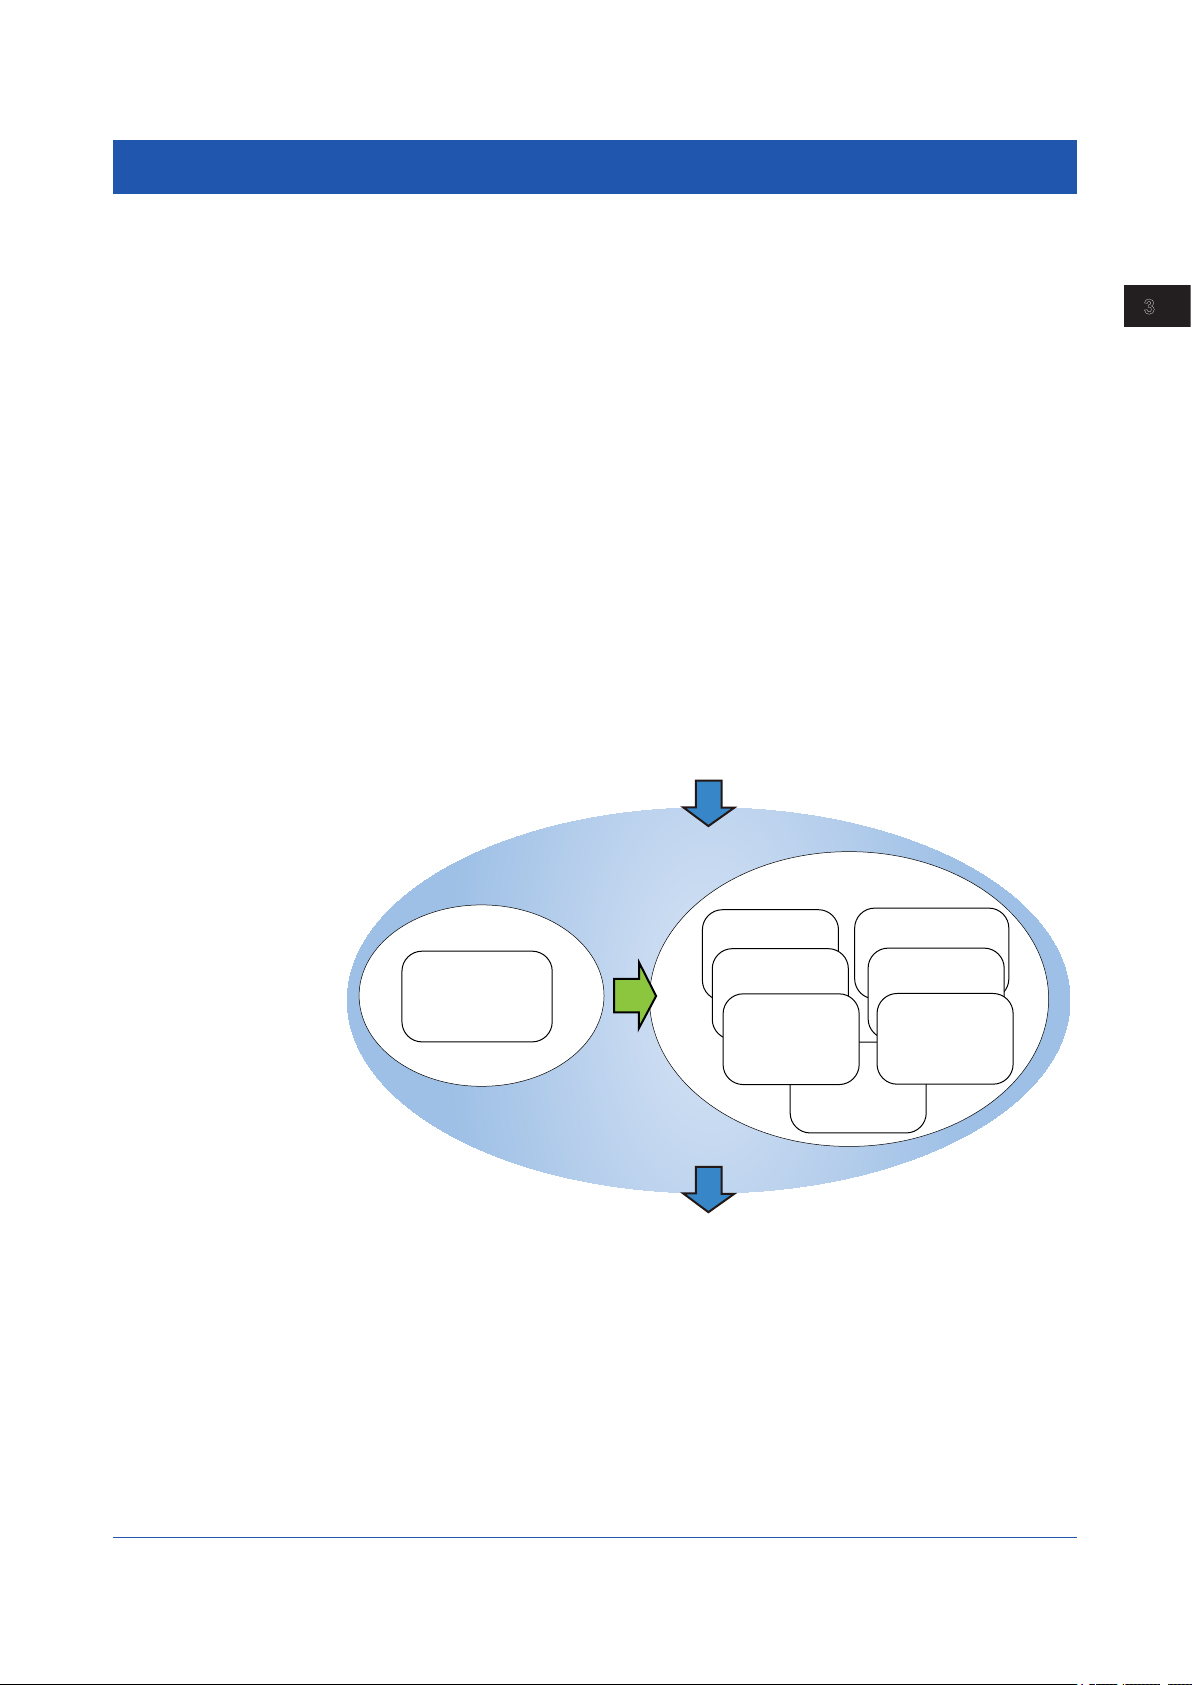
3.1 Simple Settings and Detail Settings
In GA10, you need to configure various project settings before beginning data collection
and recording. There are two modes to configure these settings: Simple Settings and Detail
Settings.
3
In Simple Settings mode, you only have to specify the device to connect to, data collection
and recording interval, and data file save destination in a single window to begin data
collection and recording.
In Detail Settings mode, you can configure settings in detail to customize data collection,
monitoring, and recording.
Detail Settings mode consists of the following seven Setting Pages that you switch between
to configure the settings.
• Device Setting Page
• Tag Setting Page
• Display Group Setting Page
• Collection & Monitor Page
• Record Setting Page
• Email Setting Page
• Access & Others Setting Page
You can select which setting mode to use when you create a project.
If you select Simple Settings, you can change to Detail Settings while you are configuring a
new project, but you cannot change from Detail Settings to Simple Settings.
Device connection
Project configuration
Detail Settings
Simple Settings
Simple Settings Page
Changeable
Device
Setting Page
Tag
Setting Page
Collection & Monitor Page
Setting Page
Record
Setting Page
Configuring and Starting Data Collection and Recording
Display Group
Setting Page
Access &
Others Setting Page
Data collection and recording
Email
Setting Page
IM 04L65B01-01EN
3-1
Page 26
Chapter 3 Configuring and Starting Data Collection and Recording
3.2 Easy Configuration (Simple
Note
Settings)
This section explains how to configure the settings in Simple
Settings mode before starting data collection.
To customize the settings and start data collection:
page 3-4
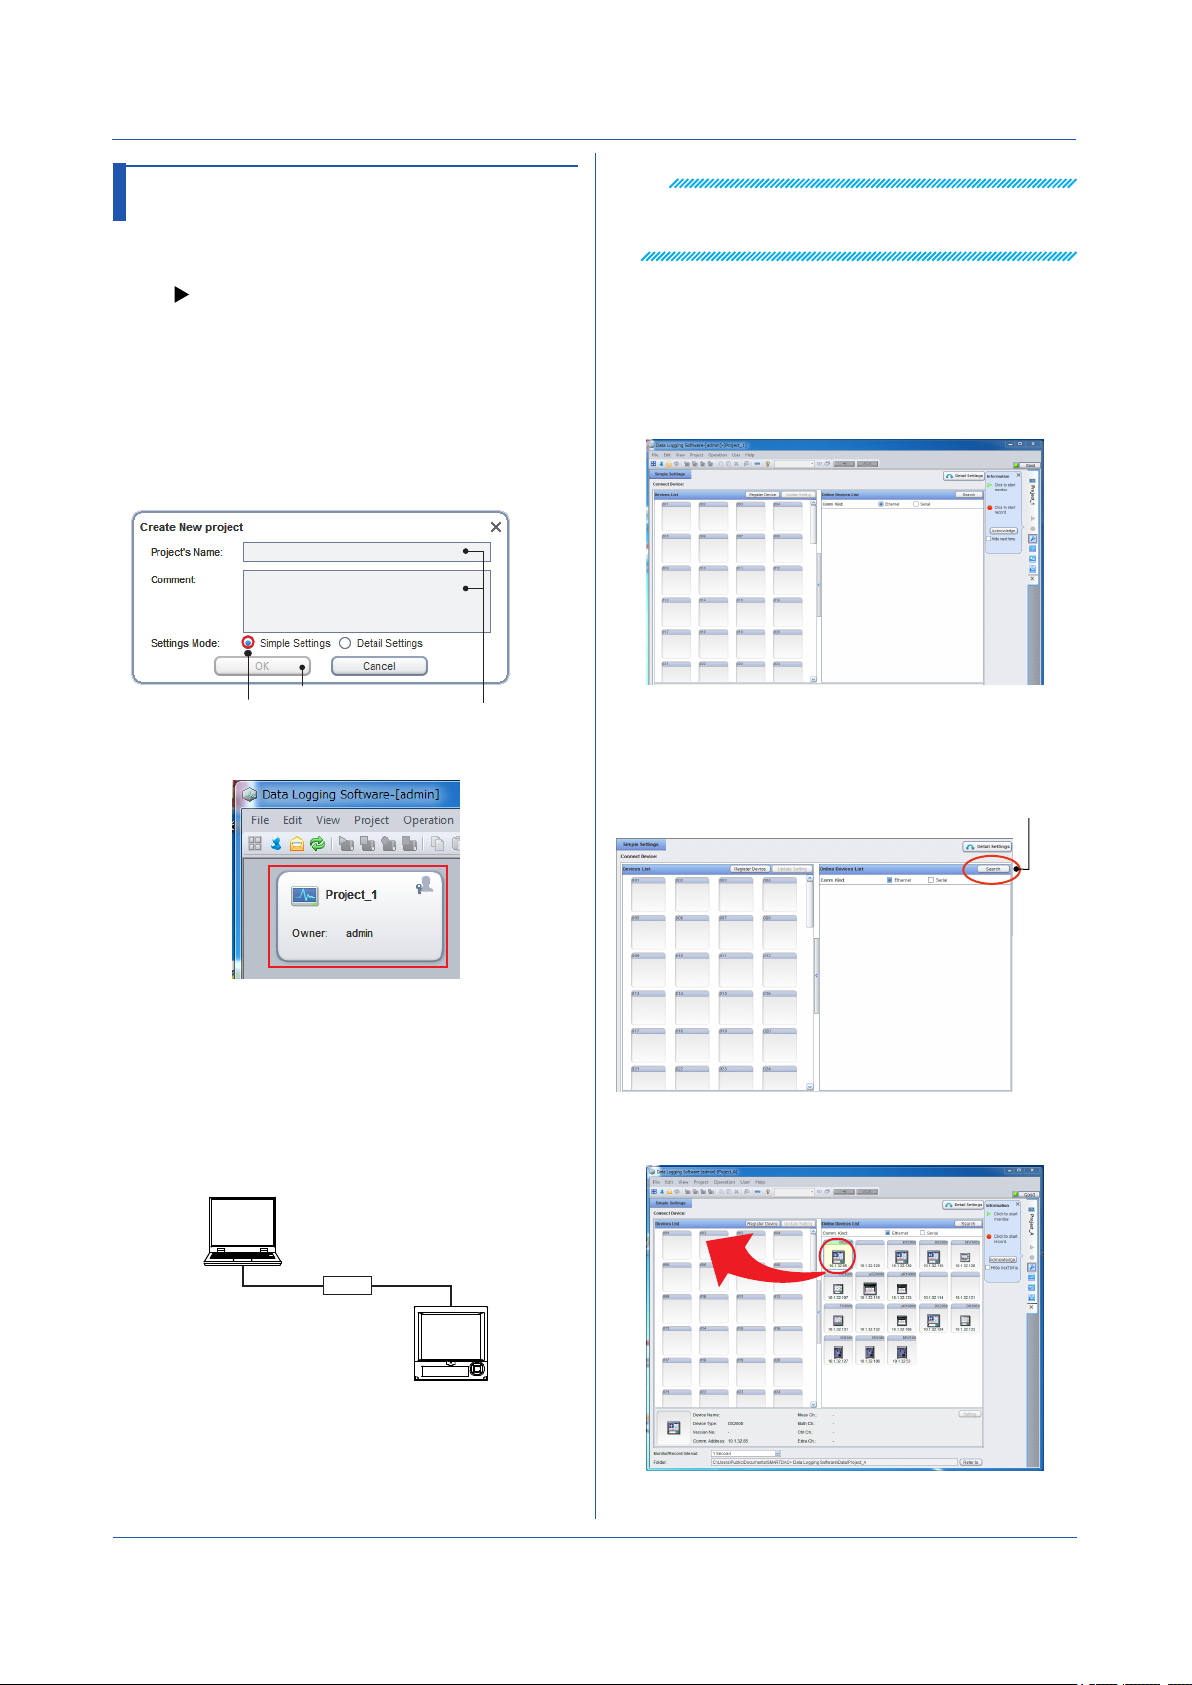
3.2.1 Creating a Project
1
Start the client, and log in by typing the user name
and password.
2
On the File menu, click New Project.
The Create New Project dialog box appears.
3.
Type the project name and comment. Leave
Settings Mode at Simple Settings.
3
Check that the PC and the device have been
4
Register the DX on the network in GA10. Double-
For details on where the Ethernet port is located and the
hierarchy of setting menus, see the user’s manual of the
relevant device.
connected.
You can check the connection using Windows Device Manager or from the command prompt.
click the project that you created in section 3.2.1.
The Simple Settings page opens.
Leave this at
Simple Settings.
A new project is created.
Click OK.
Type the project name
and comment.
3.2.2 Registering Devices to Connect
To register devices to the new project, you must connect
the devices to the network.
Below is an example of connecting a DX to the PC
through the Ethernet interface.
1
Connect the device and the PC through a network
using LAN cables.
PC
5
Click Search in the Online Devices List on the right
side of the page.
Devices connected to the network are detected and
displayed.
Click Search.
6
Drag & drop the icon of the device that you want to
register to the Device List on the left side of the page.
Ethernet
HUB
* The figure shows a one-to-one connection.
2
Configure the Ethernet settings on the device. Set
the device’s IP address and subnet mask.
On the DX
Press MENU, hold down FUNC for 3 s (to switch
to basic setting mode), and select the Menu tab >
Communication (Ethernet).
3-2
In the center of the page, a window appears showing
the details of the device that you are about to register.
IM 04L65B01-01EN
Page 27
Chapter 3 Configuring and Starting Data Collection and Recording
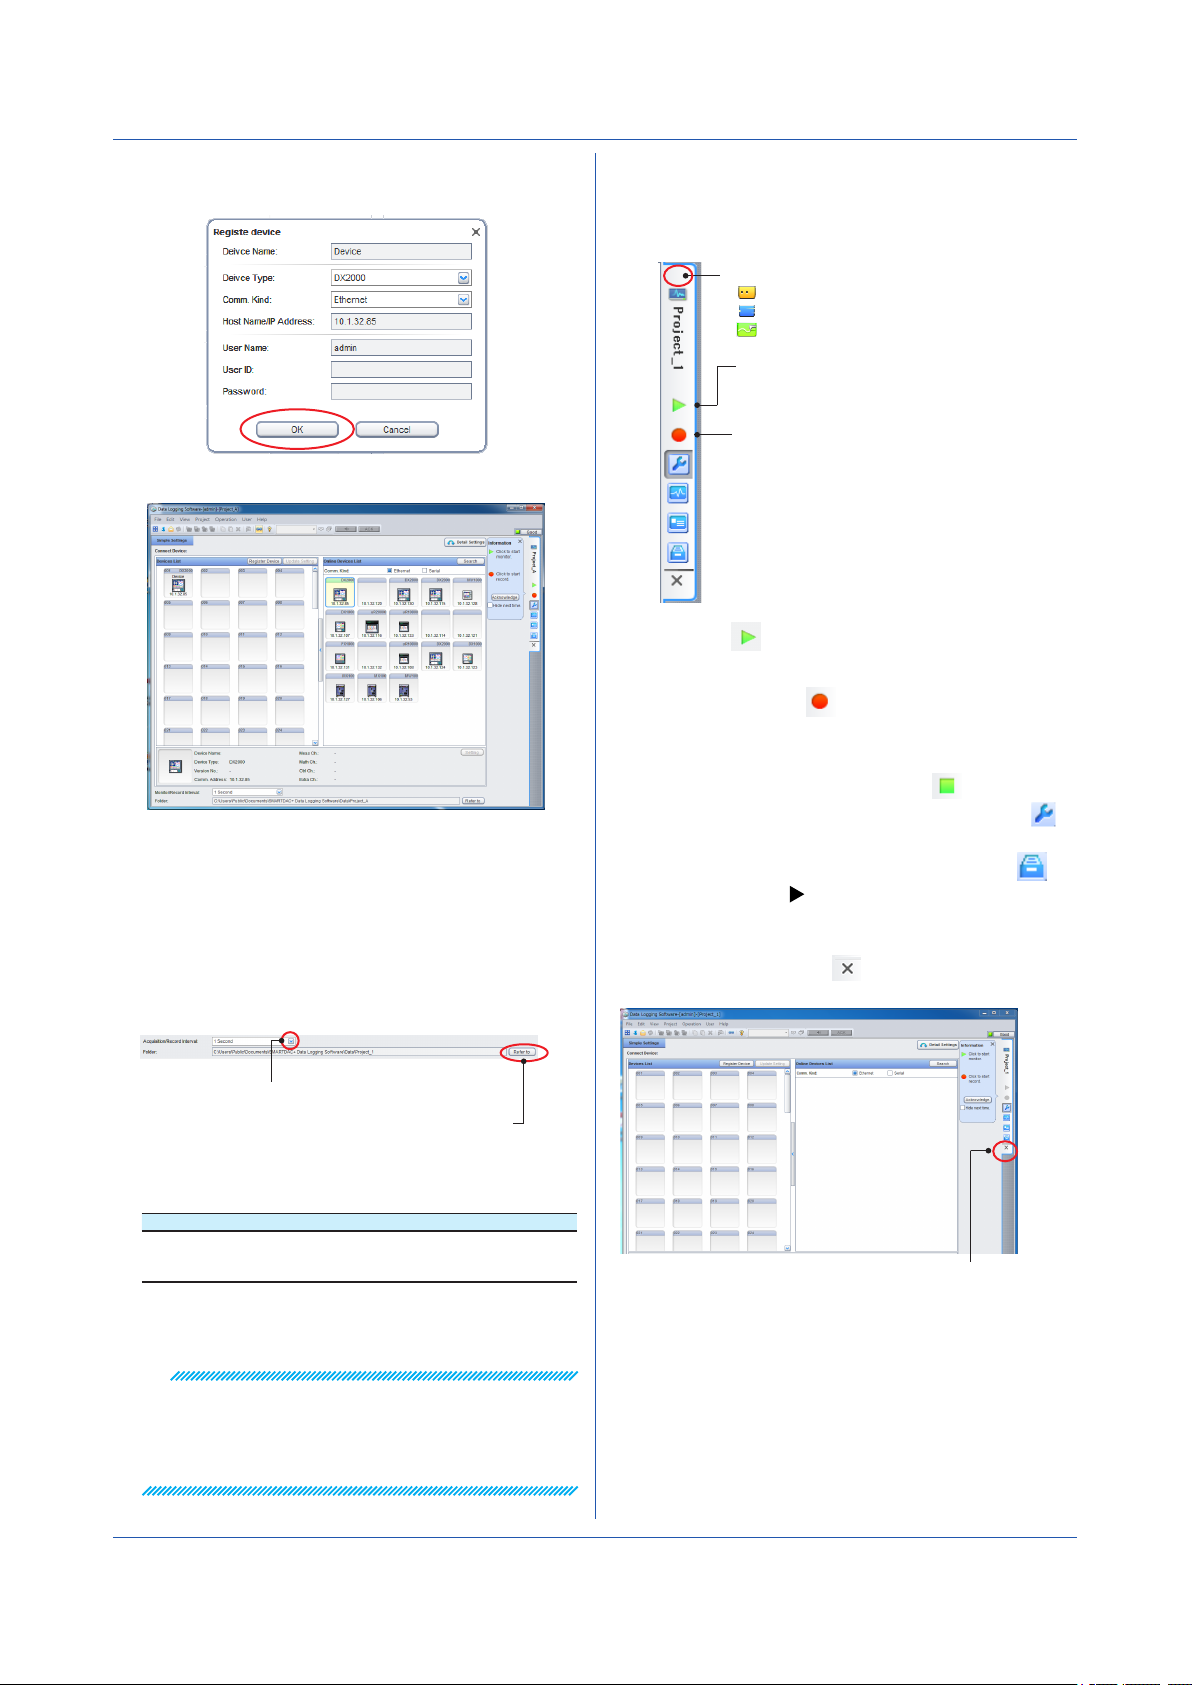
7
If the displayed information is correct, click OK.
The DX is added to the Device List.
• To delete a registered device, click the device icon to
select it, and click Delete on the Edit menu.
• You can also select the device icon and press the
Delete key.
3.2.3 Setting the Collection and Record Interval
and Save Destination
After registering the device, set the collection and record
interval and the measurement data save destination.
3.2.4 Starting Data Collection and Recording
Click the icons that are displayed on the tab on the right
side of the screen to collect or start and stop recording.
The status is displayed here.
Standby
Monitoring
Recording
Starts and stops data monitoring.
Starts data monitoring.
Click again to stop.
Starts and stops recording
Starts data monitoring and recording
to the data file at the same time.
Click again to stop only the recording.
1
Click the icon to start data collection.
2
Click again to stop.
3
Likewise, click the icon on the right to start
recording.
4
Click again to stop only the recording.
To also stop data monitoring, click
Monitoring. To return to the Setting Page, click
Setting Page.
Recorded data files are listed when you click
Data files Page. Chapter 5
Stop
3.2.5 Closing a Project
To close a project, click the icon on the right edge of
the page.
Click to select the interval.
Click to select the save destination.
1
Choose the interval from the Monitor/Record
Interval list at the bottom of the page.
Name Default Value Options
Acquisition/Record
Interval
2
Click Refer to, and select the directory for saving
recording files.
1 s 100 msec, 200 msec, 500 msec,
1 s, 2 s, 5 s, 10 s, 20 s, 30 s,
1 min, 2 min, 5 min, 10 min
Note
• The Refer to button for specifying the save destination
folder is available only when the server and client are
installed in the same PC.
• We recommend you use the default setting for the
data save destination folder. (See “Folder” on page 3-23.)
IM 04L65B01-01EN
Close the project.
• Note that clicking the close button in the upper right of
the window closes the software.
• An open project is locked (other users cannot edit it).
Display the Project List Page to view projects that are
locked.
3-3
Page 28
Chapter 3 Configuring and Starting Data Collection and Recording
Note
You cannot perform the following operations while data is
being collected.
• Register devices from the Online Devices List to the
Devices List
• Register a new device on the Devices List
• Change device registration positions on the Devices
List
• Delete registered devices from the Devices List
• Change the settings of registered devices on the
Devices List
• Specify the record interval
3.3 Detailed Configuration (Detail
Settings)
In Detail Settings mode, you can customize data
collection, monitoring, and recording. This section
explains how to configure the settings in Detail Settings
mode before starting data collection.
3.3.1 Creating a Project
New
Create a new project in Detail Settings mode.
1
Start the client, and log in.
The Project List Page appears.
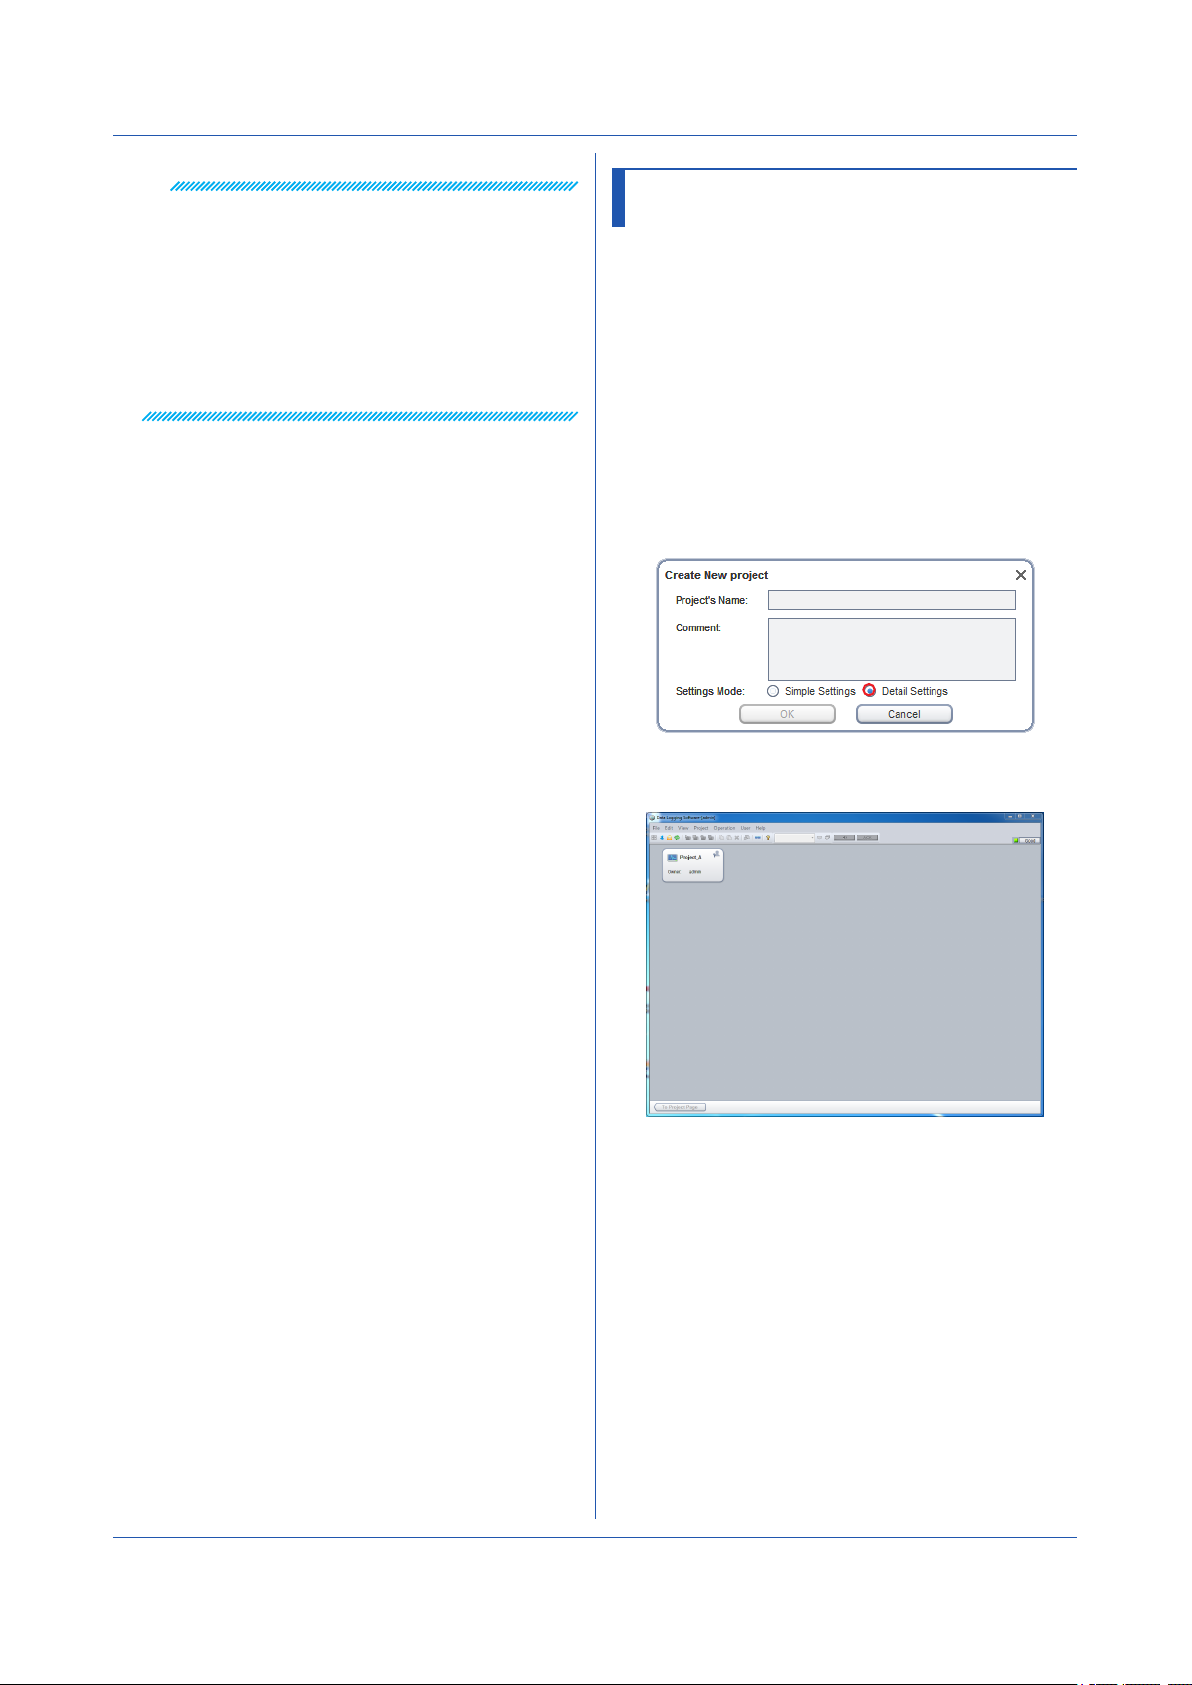
2
On the File menu, click Create New Project.
3
Type the project name and comment. Set Settings
Mode to Detail Settings.
4
Click OK.
A new project is created in the Project List Page.
Exporting and Importing
You can export the information of a created project
to a file (.pjf extension).
This file is referred to as the project information
file. The procedure to export and import a project is
explained below.
3-4
IM 04L65B01-01EN
Page 29
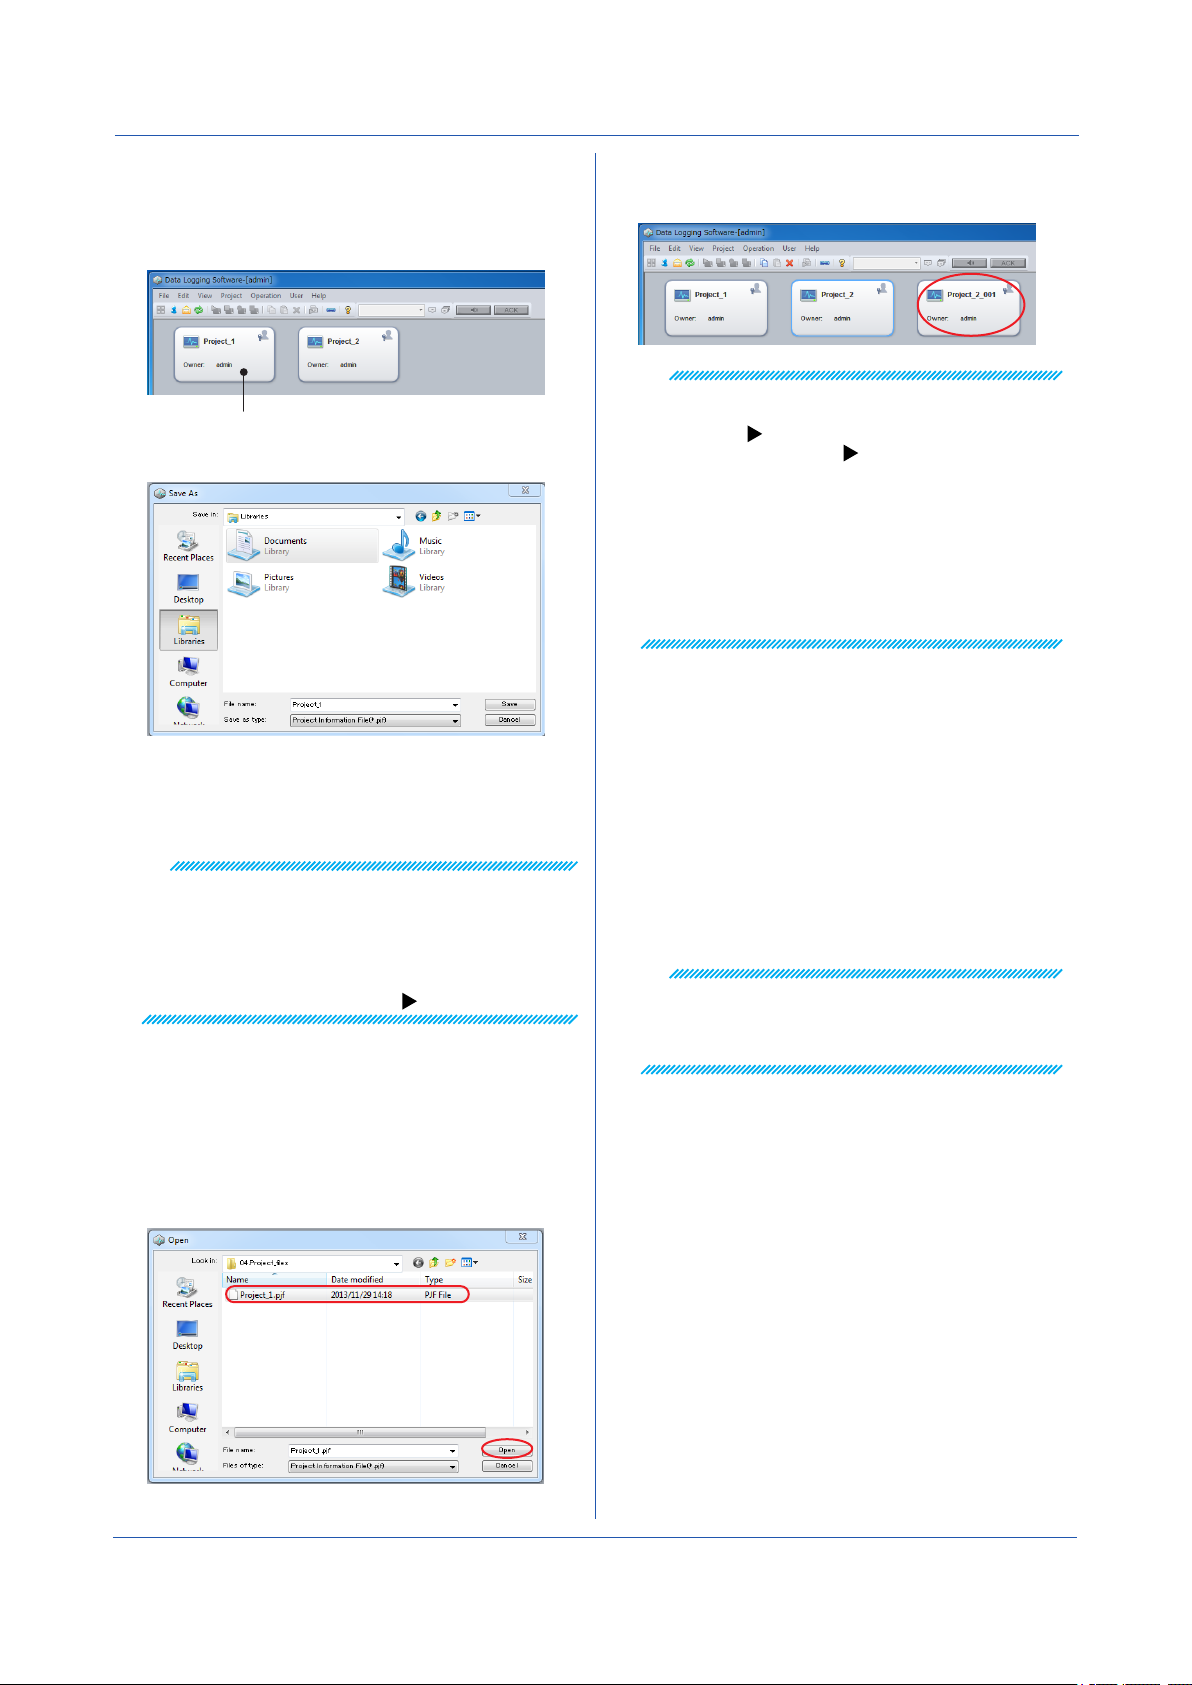
Chapter 3 Configuring and Starting Data Collection and Recording
• Export procedure
1
From the list of projects, select the project that you
want to export.
Click to select.
2
On the File menu, click Export Project.
3
Select the save destination, assign a name, and
save it.
The project information le (.pjf extension) is saved
to the specied location.
Note
• If you do not have access permission to the project,
you cannot export it.
• If the project contains Modbus device connections,
the register and channel information of the Modbus
devices are not exported. You must save the definition
files separately.
Modbus device definition file: page 3-32
• Import procedure
The imported project is added to the list of projects.
Note
When you import a project, you become the project
owner.
Owner: page 3-28
To modify the owner:
An error will occur in the following situations.
• If there are more tags in the imported project than
the number of tags that the server can handle
(If there are less tags, the insufficient tags are set to
default values.)
• If the server already has the maximum number of
project registrations
• If the server already has the maximum number of
device registrations
Copying and Pasting
You can easily copy and paste projects.
1
From the list of projects, select the project that you
want to copy.
2
On the Edit menu, click Copy, or press Ctrl+c on
the keyboard.
The project is copied.
3
To paste the copied project, on the Edit menu,
click Paste, or press Ctrl+v on the keyboard.
The project is pasted in the list.
page 6-4
Note
• The copied project is retained until you log out.
• When you import or paste a project, if the original
file is on the list, a serial number starting with 001 is
added to the original project name.
1
On the File menu, click Import Project.
An Open dialog box appears.
2
Select the file that you want to import (.pjf
extension), and click Open.
IM 04L65B01-01EN
3-5
Page 30

Chapter 3 Configuring and Starting Data Collection and Recording
Renaming a project
To rename a project, follow the procedure below.
1
From the list of projects, select the project that you
want to rename.
2
On the Project menu, click Modify Basic
Information.
A Change project’s Basic Information dialog box
appears.
3
Type the new project name or comment.
4
When you are finished, click OK.
The project name will change.
New name
3.3.2 Starting Detail Settings
After you create a project, configure it. Double-
click the project that you want to configure to open
the initial setting page. You can switch between
different setting pages by clicking the items in the left
navigator.
Configuration
navigation area
Setting page area
Expand/reduce button
A check mark appears when
you configure the settings.
Reduced
display
Expanded display
3-6
IM 04L65B01-01EN
Page 31

Registered Devices List
Chapter 3 Configuring and Starting Data Collection and Recording
3.3.3 Registering Devices to Connect
After you create a project, register the devices to collect and record data from.
The Device Setting Page that you use to register devices is composed of the following four
areas.
Devices List
Data collection devices
Devices registered in the server
Setting button
Basic Operation
Device information display area
Displays information of the selected device
Device icons (shown in the following figure) display the devices’ information. These icons are
used to register and delete devices between the Devices List, Registered Devices List, and
Online Devices List.
Device number (displayed only on the Devices List)
Frame turns blue
Selected Not selected
1
Search for devices connected to the network.
Click Search in the Online Devices List.
The connected devices will appear.
2
Register devices.
Select the icon of the device that you want to register to the project, and drag it to
the Devices List or click
If the device is already shown in the Registered Devices List, you can register it in the
same manner.
in the center of the page.
Online Devices List
Online devices over Ethernet or
serial communication
Model name
Device name
Device icon
Communication address
Displays the host name or IP address
IM 04L65B01-01EN
3
For a device that is not automatically detected in step 1, type in the information to
register them.*
On the Devices List, click Register Device, and enter the necessary information in
the displayed dialog box.
* For devices that cannot be detected, see Note on the next page.
3-7
Page 32

Select the device.
Type the name of the device
Chapter 3 Configuring and Starting Data Collection and Recording
Searching for Network Devices
Search for devices connected to the network to display
them in the Online Devices List. Simply click the button to
search and display the devices as icons in the list.
1
Set the search filter to Ethernet or Serial.
Search filter
2
Click Search.
The connected devices are detected and displayed
in the Online Devices List.
Registering Files to the Devices List
For the new project, register the devices from which you
want to collect and record data to the Devices List.
You can register devices in the following ways.
• Register a new device
• Register from the Online Devices List
• Register from the Registered Devices List
In addition, you can use the following operations to
register devices.
• Drag & drop
• Register button
• Type in the Register Device dialog box
Click here (register button)
or drag
Note
The icons of the following devices will not appear by
searching. To add them to the project, use the Register
Device button as explained in the next section.
Devices that cannot be detected on the Ethernet network
GX10, GX20, GP10, GP20 (up to R1.03.02)
DA100, DR130, DR230, DR240
DAQLOGGER, DAQ32Plus, MXLOGGER
Devices defined using Modbus device definition files
Devices that cannot be detected through the serial interface
MX100, MW100
DAQLOGGER, DAQ32Plus, MXLOGGER
Devices whose baud rate is not 9600 bps, parity is not even, or
stop bit is not 1.
Devices whose interface is RS-422 or RS-485
* Modbus device denition le: page 3-32
To add a device using the Register Device, follow the
procedure below.
1
Click Register Device at the top of the Devices List.
Register Device button
A Register device dialog box appears.
2
Enter the necessary information in the dialog box,
and click OK.
Because the available interface varies depending
on the device that you are connecting, the
communication parameters in the dialog box will
*
change according to the device.
to be registered.
Select the model.
Select the interface.
Type the communication
parameter.
3-8
Type the user information for accessing
the device to be registered.
The dialog box closes, and the device is registered
to the Registered Devices List.
IM 04L65B01-01EN
Page 33

Chapter 3 Configuring and Starting Data Collection and Recording
Connectable Devices and Interfaces
Name
μR10000 Yes Yes Yes 34260
μR20000 Yes Yes Yes 34260
DX1000 Yes Yes Yes 34260
DX1000N Yes Yes Yes 34260
DX1000T Yes Yes Yes 34260
DX2000 Yes Yes Yes 34260
DX2000T Yes Yes Yes 34260
CX1000 Yes Yes Yes 34260
CX2000 Yes Yes Yes 34260
FX1000 Yes Yes Yes 34260
MV1000 Yes Yes Yes 34260
MV2000 Yes Yes Yes 34260
MX100 No No Yes 34316
MW100 No No Yes 34316
DA100 Yes Yes Yes 34150
DR130 Yes Yes Yes 34150
DR230 Yes Yes Yes 34150
DR240 Yes Yes Yes 34150
2
GX10
2
GX20
2
GP10
2
GP20
DAQLOGGER No No Yes 50280
DAQ32Plus No No Yes 50278
MXLOGGER No No Yes 50284
Devices supporting the Modbus
protocol
1 Yes: Supported No: Not supported
2 The GX/GP version R1.03.03 and later supports auto searching on an
Ethernet network.
3 The communication port can be specied on the GX/GP, but GA10 only
supports the default value, 34434.
4 DAQWORX software requires a port number parameter when the interface
is specied. (The port numbers above are initial values.)
RS-232 RS-422
Yes Yes Yes 34434
Yes Yes Yes 34434
Yes Yes Yes 34434
Yes Yes Yes 34434
Yes Yes Yes 502
Interface
RS-485
1
Ethernet
(connection port
number)
If you change the device settings after registering it to
the Devices List, click Update Setting. The most recent
information will be retrieved from the device and applied.
Select the device, and
click the Update Setting button.
Registering Devices to the Registered Devices List
The Registered Devices List shows a list of devices
registered to the server. Therefore, in the initial page,
nothing will appear. When you add a new device to
the Devices List, it is also automatically added to the
Registered Devices List.
You can also drag a device from the Online Devices List
to register it.
3
3
3
3
4
4
4
Display filter
Click Update to retrieve the most recent list of devices
from the server.
You can set the Comm. Kind filter to display only the
devices using the specified interface. If you select Serial,
the devices connected to the serial port of the server PC
will be displayed.
Update
Note
• To connect to DAQLOGGER, DAQ32Plus, or
MXLOGGER, enter the IP address of the PC in which
the software is installed.
• To connect to DAQLOGGER or DAQ32Plus, leave the
System No. at zero (default value).
To connect to MXLOGGER, select the System No.
that is being used in MXLOGGER.
• To register any of the following instruments by
specifying “Comm. Kind: Serial” and “User,” set the
A/D scan interval and FIFO writing interval of the
device to the same value.
DX1000, DX1000N, DX1000T, DX2000, DX2000T,
MV1000, MV2000, CX1000, CX2000, FX1000
• When connecting to a DXAdvanced (DX1000,
DX1000N, DX1000T, DX2000, or DX2000T) with the
/AS1 advanced security option through the Ethernet
interface, log in as an administrator to access the DX.
In this situation, only one administrator will be able to
log in.
To register a Modbus device: page 3-10
Note
The following information associated with the devices
in the Registered Devices List are not automatically
updated.
• Channel positions
• Channel enabled/disabled state
• Tag and tag number information
If you change these pieces of information on the device,
re-register the device to the Registered Devices List.
Note that the device will be registered as a separate
device. Because it is difficult to distinguish such devices,
we recommend that you delete unneeded devices and
devices that you change the information of.
IM 04L65B01-01EN
3-9
Page 34

Chapter 3 Configuring and Starting Data Collection and Recording
Starting the Web Application (GX/GP Only)
Click Setting
area to start the Web application for configuring devices.
1
In the Project List Page, double-click the appropriate
project.
2
Change the project setting window to the Device
Setting Page.
3
Select the device that you want to change the
settings of.
The information of the selected device appears in
the bottom device information area.
4
Click Setting in the device information area.
The corresponding setting Web page will appear in
Windows Internet Explorer.
For details on how to use the Web application, see the
GX/GP User’s Manual (IM 04L51B01-01EN).
You can download the latest manual from the following
URL.
URL: www.smartdacplus.com/manual/en/
in the device information display
Limitations on the Device Setting Page
• The following operations cannot be executed on
the Device Setting Page while data collection is in
progress.
• Register devices from the Registered Devices List to
the Devices List
•
Register devices from the Online Devices List to the
Devices List
• Register a new device on the Devices List
• Change device registration positions on the Devices
List
• Delete registered devices from the Devices List
• Change the settings of devices on the Devices List
• The Web application can be started only when the
connected device is GX/GP and the interface is
Ethernet.
• If multiple devices use the same COM port, observe
the following rules.
• Do not mix Modbus devices with other devices.
• Use the same communication type.
• Use the same settings for baud rate, parity, and stop
bit.
3-10
IM 04L65B01-01EN
Page 35

Chapter 3 Configuring and Starting Data Collection and Recording
Select the device for the assigned channel.
3.3.4 Setting Tags
GA10 collects and records data from multiple connected devices. Tags are assigned to
channels of connected devices for identification.
After registering devices in a project, when you open the Tag Setting Page for the first
time, tags are assigned automatically to the channels of registered devices as default
assignments.
You can edit the assignments to customize the data collection.
Click here to display
the Tag Setting Page.
Configure the settings
of a tag (channel) on each line.
Basic Operation
1
Select a tag to use in data collection or recording. Click a box in the Collect column.
2
Set the tags.
Select the tags to use.
Action bar: Use to collectively edit the settings
of the selected lines.
Selected lines
To select consecutive boxes, click the rst cell, and then click the last cell while
holding down the SHIFT key.
Clicking a cell in a column other than Collect or Record displays a list box or a
window containing options. Select the desired setting. For the Tag No. and Tag
Comment cells, type text strings.
Select the channel
to assign.
Type the tag number and
comment string.
Select the data type.
Select the number of
decimal places.
IM 04L65B01-01EN
Tag selected
Click again to switch.
Multiple consecutive tags selected
3-11
Page 36

Chapter 3 Configuring and Starting Data Collection and Recording
Tag Settings
Tag settings are used to set display groups and other
settings in a project. Therefore, even if you change the
device channel assigned to a tag, there is no need to
change display group settings or other settings that use
tags.
The tag settings are explained below.
(1) Collect (tag index)
These are unique tag numbers assigned
sequentially starting with 0001. You cannot change
the numbers. Click the boxes to specify whether to
enable data collection.
(2) Record
Click the boxes to specify whether to enable data
recording.
(3) Device
Specify the names of the devices to assign to the
tags.
(4) Channel
Specify the channels to assign to the tags. Clicking
a button displays a separate window. Select a
channel number to apply it to the sheet.
(5) Tag No. and Tag Comment
Enter aliases for the tags as tag numbers and tag
comments. Specify up to 16 characters for tag
numbers and 32 characters for tag comments.
You can select which name to display (Tag Index,
Tag No., or Tag Comment) to suit your purpose. To
select which name to display, on the View menu,
click Tag Display Form.
(6) Type
Specify the tag data types. Click the arrows, and
select from the following data types.
Data Type Description
ANY Any data type
BOOL Boolean
SHORT 2-byte signed integer
USHORT 2-byte unsigned integer
LONG 4-byte signed integer
ULONG 4-byte unsigned integer
FLOAT 4-byte single-precision floating-point number
LOG (Old) Data type for LOG input channels (DXAdvanced
series)
LOG Data type for LOG input channels (FX1000 series)
3-12
Refer to the following table for the data types of the
channels on data source devices.
Model Channel Type Data Type
DAQLOGGER
DAQ32Plus
MXLOGGER
GX/GP
Devices defined
using Modbus device
definition files
Other Measurement channels SHORT
All channels LONG
Measurement channels
(excluding DI channels )
DI channels BOOL
Excluding the above Same as "Other"
All channels The type
Math channel LONG
Control channel SHORT
Extra channel SHORT
Math channel whose
input is LOG
LONG
specified in the
definition file
(FLOAT)
LOG
(7) Dec. Point
Specify the number of decimal places for tags. Click
the arrows to select the number of digits (0 to 5).
Select the same setting as the decimal place setting
specified on the device. Specify ANY to retrieve the
decimal place information from the device at the
start of data collection.(See below.)
Type, Dec. Point, and ANY
GA10 can continue data collection even if you
change the connected device in the middle of
data collection as long as the Type and Dec. Point
settings are the same. For example, if you set
the tag Type to SHORT and change the device
to another type in the middle of data collection
(for maintenance or other purpose), as long as
the measurement channels use the same Type
and Dec. Points settings, you can continue data
collection.
Note that the tag Type (6) and Dec. Point (7) options
include a value called ANY.
You can select ANY if you want to retrieve the
channel information from the device at the start of
data collection and use those settings to perform
data collection. However, if the data collection time
is set to PC time and the device is not connected
within 3 seconds after the start of data collection, the
channel information will not be retrieved at the start
of data collection even if ANY is specified.
In this situation, the channel information that was
retrieved from the device at the time of device
registration is used. This is not a problem as long as
the channel information at the start of data collection
is the same as the channel information that was
retrieved from the device at the time of device
registration.
Using ANY makes the data type and decimal place
settings easier. However, you cannot verify the
actual data type.
Related topic: Q11 in Section 7.2, “Frequently
Asked Questions (FAQ)”
Note
• If the data collection channel is LOG input, set the
data type to LOG. If set to LOG, the decimal place
setting is void.
• If the data type is set to BOOL, the decimal place
setting is void.
IM 04L65B01-01EN
Page 37

(1) Click the left edge of the first row.
Chapter 3 Configuring and Starting Data Collection and Recording
Collectively Editing Tags
To collectively edit setup data, you must select the target
setup data and then click a button on the action bar,
which is at the bottom of the window. The result varies
depending on the type of icon you click on the action bar
(see the following table).
Type Name Result
Enable or
disable
Increment Assigns increasing channel numbers starting
Copy Copies the settings of the first tag in the
Copy flag Switches between selected and unselected
You can also copy and paste selected content using the Edit
menu.
To select the range of setup data, follow one of the
methods below.
• Select by dragging
Click the first line you want to select. Drag to the
last line you want to select and release the mouse
button.
• Select using the Shift key
After selecting the first line you want to select, hold
down the Shift key, and click the last line you want
to select.
• Select all lines
Click the title area of the Collect column to select all
setup data.
Collective Editing
Switches the check box state between
selected and unselected.
If all the data values in the selected range are
the same, clicking this icon will switch all of
them in the same way.
If the data values in the selected range are
not all the same, clicking this icon will switch
all of them to match the first data value in the
selected range.
with the first tag in the selected range
selected range to the other tags in the
selected range
states for items to be pasted when copying
setup data. The items are normally selected
(pasted).
Clicking this button causes the corresponding
item to become unselected. The item will not
be pasted.
Exporting and Importing Tags
Tag information can be converted (exported) to a TSV file
You can edit the TSV file using an appropriate software
application and load (import) it back into GA10.
Note
Only tag numbers and tag comments are exported and
imported.
• Export Procedure
1
Display the Tag Setting Page of the project whose
tag information you want to save.
2
On the File menu, click Export tags.
3
Select the save destination, assign a name, and
save it.
The tag information le (.tsv extension) is saved to
the specied location.
Tag numbers and tag comments are exported in
pairs in separate lines as shown below.
• Import Procedure
1
Display the Tag Setting Page of the project whose
tag information you want to update.
2
On the File menu, click Import tags.
An Open dialog box appears.
3
Select the file that you want to import, and click
Open.
The content of the imported tag information TSV le
is applied to the Tag Setting Page.
1
Select the rows that you want to edit collectively.
(2)Dragandrelease.
2
Click an icon at the bottom for the column that you
want to edit.
The values in the selected range will be changed.
IM 04L65B01-01EN
3-13
Page 38

Chapter 3 Configuring and Starting Data Collection and Recording
Click here to display the Display Group Setting Page.
Vertical scroll bar
Specify the group name.
3.3.5 Setting Display Groups
The GA10 Monitor Page can display multiple channels in groups.
The Display Group Setting Page is used to group channels and set the tag data display
method. The Display Group Setting Page consists of multiple tabbed pages. Each tabbed
page shows the settings of each waveform in rows and the setup items in columns.
Group tab number
Configure the settings
of a waveform on each line.
Action bar: Use to collectively edit the settings
of the selected lines.
Basic Operation
1
Click the tab of the group you want to configure.
2
Edit the setup data as necessary. Click the No. cells (left-most column) to show or hide
the waveforms.
Details of settings: The details are provided on page 3-15 and subsequent pages. Use the
Note
On the initial Display Group Setting Page, tags are assigned automatically for each device (when
there are tags specified as data collection channels on the Tag Setting Page).
If you want to perform Assign Tag Automatically again, do this first before setting the displays.
Waveform
No.
numbers in the figure to reference the corresponding descriptions.
Group tab number
Specify the tag to assign to the waveform.
Specify the Y-axis grid line spacing.
Waveform display position
Specify the Y-axis.
Trip line settings
Waveform color
Horizontal scroll bar
Select fixed point
or floating point display.
Meter type
Type the display
range.
3-14
IM 04L65B01-01EN
Page 39

Chapter 3 Configuring and Starting Data Collection and Recording
Waveform Settings
Waveform settings are explained below.
(1) No.
These are waveform numbers assigned sequentially
starting with W01. You cannot change the numbers.
Click the boxes to specify whether to display the
waveform.
(2) Tag
Specify the tag to assign to the waveform. Clicking
a button displays a separate window. Select a tag
number to apply it to the sheet.
(3) Y-Axis
No.: Specify the Y-axis to use in the waveform
display.
Mode: Select Detail or Compact mode.
Type: Specify the type of scale to add to the Y-scale
of the waveform. Select Linear or Logarithmic.
Title: Type the Y-axis title of the waveform. Enter up
to 30 characters.
(4) Form.
Set the display format on the Monitor Page to fixed
point or floating point.
F: Fixed point display
E: Floating point display
(5) Meter
Specify the type of meter to display on the Meter
Monitor. Select bar meter
or analog meter .
(6) Scale MIN and MAX
Type the minimum and maximum values of the scale
on the Monitor Page to define the display range.
(7) Scale Interval
Set whether to specify the Y-axis scale interval of
the waveform. Leave unselected to use the default
scale interval. To specify the scale interval, select
the check box and enter a value.
(8) Zone
MAX: Specify the maximum Y-axis position for
displaying the waveform.
MIN: Specify the minimum Y-axis position for
displaying the waveform.
This determines the waveform display position.
(9) Color
Specify the waveform display color. To change the
color, click the appropriate cell to display a separate
window. Select a color to apply it to the sheet.
(10) Trip
Use: Click to use the waveform trip line.
Value: Type the value.
Color: Specify the trip line color. To change the
color, click the appropriate cell to display a separate
window. Select a color to apply it to the sheet.
Collectively Edit Setup Data
To collectively edit setup data, you must select the target
setup data and then click a button on the action bar,
which is at the bottom of the window. The result varies
depending on the type of icon you press on the action bar
(see the following table).
To select the range: The procedure is the same as
explained on page 3-13.
Type Name Result
Show or hide
Enable or disable
F-Type/E-Type
Increment Assigns increasing tag index numbers
Default Resets the value to default.
Y-axis grouping
(unit)
Y-axis grouping
(unit & scale)
Copy Copies the settings of the first tag in the
Copy flag Switches between selected and
You can also copy and paste selected content using the Edit
menu.
Switches the check box state between
selected and unselected.
Switches the item selection state.
If the data values in the selected range
are not all the same, clicking this icon will
switch all of them to match the first data
value in the selected range.
starting with the first tag in the selected
range.
Groups Y-ax es w hose unit is th e same
together.
Groups Y-axes whose unit and scale value
are the same together.
selected range to the other tags in the
selected range.
unselected states for items to be pasted
when copying setup data. The items are
normally selected (pasted).
Clicking this button causes the
corresponding column to become
unselected and will not be pasted to.
Assigning Tags Automatically
Tags assigned on the Tag Setting Page can be assigned
automatically to display groups.
There are two methods for automatic assignment.
• Assign According to Tag Number
When you specify the number of tags to assign to
each display group, the specified number of tags are
assigned in order from the first number of display
group 1 on the Tag Setting Page.
For example, if the total number of tags is 50 and
you set the number of tags to 10, 10 tags will be
assigned to each group from Group 1 to 5.
• Assign According to Device
The tags of a single device are assigned to each
display group. For each device (device number)
that a tag has been assigned to, assign the tag to
a display group. Tags are assigned in ascending
order by device number starting with display group
1. Within a display group, tags are assigned in
ascending order by tag number.
If the number of tags of a device is greater than the
number of waveforms in a display group, multiple
display groups will be used for the device.
IM 04L65B01-01EN
3-15
Page 40

Chapter 3 Configuring and Starting Data Collection and Recording
Specify the number
Note
• When you assign tags automatically, the settings of
all display groups are reset to their default conditions.
After automatic assignment, you must configure the
settings again.
• Tags that are automatically assigned are those whose
Collect item is selected on the Tag Setting Page and
whose channel is specified.
• Automatic Assignment Procedure
1
On the Project menu, click Assign Tag
Automatically.
An Assign Automatically dialog box appears.
2
Select the assignment method.
To assign according to
device, do not change.
3
To assign according to tag numbers, select Assign
According to Tag Number and type the number of
tags to share in each group.
of tags.
4
Click OK.
All display group settings are initialized, and tags
are assigned to display groups on the Display Group
Setting Page.
3-16
IM 04L65B01-01EN
Page 41

Area for setting data collection conditions
Click here to display the Collect & Monitor Page.
a: Data time c: Pre-set mark
e: Monitor splitting direction
Chapter 3 Configuring and Starting Data Collection and Recording
3.3.6 Registering Data Collection Method and Monitor Page
After setting the display groups, register the data collection method and monitor page.
Data collection is performed for tags that are set to collect data on the Tag Setting Page.
On the Collect & Monitor Page, set the data collection conditions, namely the type of
timestamps to attach to data and data collection interval. In addition, specify the number of
windows to divide the Monitor Page into and their layout.
The Collect & Monitor Page is divided into two areas: an area for setting data collection
conditions and another for configuring the monitor.
The details of each are provided in the following pages. Use the letters (a to j) in the figure to
reference the corresponding descriptions.
Collect area
Monitor area
Area for setting the Monitor Page
b: Monitor interval
d: Number of Monitor Sets
Area for checking the Monitor Page layout
h: Resize the Monitor Set
i: Alarm shape
j: Alarm color
f: Number of sets in
the splitting direction
IM 04L65B01-01EN
g: Monitor Set type
3-17
Page 42

Chapter 3 Configuring and Starting Data Collection and Recording
Setting Data Collection Conditions
a Data time
Timestamps are attached to data that GA10 collects
from devices. You can set the type of timestamp to use
to Device time or PC time. Device time is the time
information that the data collection device uses. PC time
is the time information that the PC in which the server is
installed uses.
• If Device time is selected
By selecting Device time, you can synchronize the
data in GA10 with the data in the corresponding
device.
In addition, the backfill function becomes available.
However, if data is collected from multiple devices,
time offset can occur between the devices and
the collection interval may be different. In other
words, data cannot be collected simultaneously with
synchronized timestamps.
What is the backfill function: page 7-4
Note
Data collection using device time has the following
limitations.
• You cannot specify the data collection and record
interval on GA10. The interval of each device is used.
• If different acquisition intervals are used during
recording in different devices or even within the same
device, the collected data will be saved to separate
files according to the intervals.
• The trend monitor on the Monitor Page displays data
based on a single time axis. Therefore, if there are
multiple devices whose time or interval is different in
a display group, the Monitor Set will be divided and
waveforms in the display group will be displayed in
windows divided at the interval level. Only up to four
divided windows can be displayed. Anything in excess
will not be displayed.
• A similar behavior will also occur in alarm lists. The
page will be divided, and the lists will be displayed
separately at the device level. If there are multiple
acquisition intervals in the same device, the page will
not be divided at the interval level but at the device
level.
• If PC time is selected
If PC time is selected, data will be created using
synchronized timestamps. You can specify the data
collection interval and record interval, and save data
to a single data file during recording. There are no
display limitations on the Monitor Page.
Note
• Data collected using PC time will not necessarily be
the same as those of the corresponding devices:
Q9
• The timestamps attached to data in PC time mode are
determined so that data collection would always occur
at 0:00 am (00:00:00).
b Monitor Interval
Click the arrow, and select from the following intervals.
If Data time is set to Device time, you cannot specify the
Scan Interval.
Interval: 100 ms, 200 ms, 500 ms, 1 s, 2 s, 5 s, 10 s,
20 s, 30 s, 1 min, 2 min, 5 min, 10 min
c Pre-set mark
Specify text strings to assign to marks if you want to add
marks on the Trend Monitor Page.
You can assign up to 32 characters to each mark. You can
register up to five marks.
When you register text strings here, they appear in a list
on the Monitor Page as shown below, allowing you to
easily add marks.
When you register text strings here,
they appear in the mark list on the Monitor Page.
Configuring the Monitor Page
The GA10 Monitor Page can display four types of displays
(referred to as Monitor Sets): trend, digital, meter, and
alarm. A total of up to 16 Monitor Sets can be arranged on
the Monitor Page.
To display multiple Monitor Sets simultaneously, specify
how to divide the page and where to arrange each Monitor
Set.
When you specify items d to g below, a display layout
appears in the Monitor Set Layout area. By dragging the
splitters that appear between rows and columns when you
move the pointer over the boundaries, you can adjust the
size of Monitor Sets.
d Monitor Set Number
Select a number between 1 and 16.
e Splitting Direction of Monitor Set
Set the direction to arrange the Monitor Sets to
Horizontal or Vertical.
f Set Number in Splitting Direction
Select a number between 1 and 16. Options that
exceeds the Monitor Set Number are not displayed.
g Monitor Set Type
Assign Trend, Digital, Meter, or Alarm to each
Monitor Set.
3-18
IM 04L65B01-01EN
Page 43

Chapter 3 Configuring and Starting Data Collection and Recording
15 monitor sets total with 4 sets arranged horizontally
The Monitor Sets can be arranged vertically or horizontally
on the page.
The following figure shows the layout when the Monitor
Sets are arranged horizontally. The number of vertical
divisions is determined by the number of Monitor Sets in
the horizontal direction and the total number of Monitor
Sets on the entire Monitor Page. (When arranged
vertically, the horizontal and vertical arrangement of the
Monitor Sets is swapped.)
Example (all trend displays)
The last row is divided equally.
Vertical splitter:
The boundary of the
divided areas can be
moved left and right.
Horizontal splitter:
The boundary of the
divided areas can be
moved up and down.
h Resize the Monitor Set
When set to On, you can make fine adjustments to the
arrangement also on the Monitor Page.
i Alarm Shape
You can set the shape of the alarm display area to circle
(¡) or rectangular (¨).
j Alarm Color
You can change the color that appears when alarms are
active (On) and when alarms are inactive (Off). Clicking a
color displays a Color Setting dialog box where you can
select the color.
IM 04L65B01-01EN
3-19
Page 44

Chapter 3 Configuring and Starting Data Collection and Recording
Recording standby
Recording standby Recording standby
Click here to display the Record Setting Page.
3.3.7 Setting the Data Recording Method
GA10 saves the data collected at the collection interval to data files at a specific record
interval. The instantaneous values of data are recorded. The collected data at each record
interval is saved to files without any data processing.
The figure shows an example of how data is recorded when the collection interval is 1
second, the record interval for instantaneous values is 5 seconds, and recording is started
at 0:00:00. In instantaneous-value recording, the collected data at 0:00:00, 0:00:05, and
0:00:10 are saved as record data. The first collected data is called “recording start point.”
Recording
data
Collected
data
0:00:00 0:00:05 0:00:10 0:00:15 0:00:20 0:00:25
Collection interval (1 sec)
Record interval of instantaneous values (5 sec)
▲
Recording start point
Time
Click the Start Recording button to start data recording.
Note that the actual recording of data to data files starts when the recording start conditions
are met. Therefore, GA10 may enter the recording standby state when the Start Recording
button is clicked.
The following figure shows an example of how GA10 operates when an interval (everyday,
every week, every month) and start time are specified as recording start conditions.
Start
Recording
clicked
Start Recording
Recording start
condition met
Start of recording
to file 1
Recording stop
condition met
End of recording
to file 1
Recording start
condition met
Start of recording
to file 2
Recording stop
condition met
End of recording
to file 2
Repeated from
this point
Recording data
Collected data
Various data recording settings are specified on the Record Setting Page.
3-20
IM 04L65B01-01EN
Page 45

Chapter 3 Configuring and Starting Data Collection and Recording
The following settings are available on the Record Setting Page.
The details of each are provided in the following pages.
• Recording Interval
• Record File Type
• Start/Stop Condition
• File Division
• Number of Files
• Folder
• File Name
• Comment
Note
• The data recording settings vary depending on whether the data collection condition was set to
PC time or Device time. Also, the handling of alarm information and the number of record data
files vary. page 3-23
• If the server stops for some reason during recording, recording will resume when the server
recovers. However, if the server is stopped manually, or if the PC in which the server is installed
stops, the data file is cut at this point and saved. Recording will not resume even if the server is
restarted. When the server stops: page 7-4
IM 04L65B01-01EN
3-21
Page 46

Chapter 3 Configuring and Starting Data Collection and Recording
Recording Interval
Select the interval from the drop-down list.
Options: 100 ms, 200 ms, 500 ms, 1 s, 2 s, 5 s, 10 s, 20 s,
30 s, 1 min, 2 min, 5 min, 10 min
The intervals that are displayed in the list are integer
multiples of the collection period specified on the Monitor
Page. If Data time is set to Device time, you cannot
specify the record interval.
Record File Type
Specify the data output format.
You can save the recorded file in binary format (.dld
extension) or Excel format (.xlsx extension).
Start Condition
You can specify the following for the start condition.
Start Condition Description
Immediate Starts recording when the Start Recording button
Specified Time Starts recording when the specified time arrives.
Specified Period Records at the specified period.
Alarm Starts recording using the alarm status as a
Level Starts recording using a collected data value as
is clicked.
trigger.
a trigger.
Stop Condition
You can specify the following for the stop condition.
Stop Condition Description
Continuous Stops recording when the Stop Recording button
Specified Time Stops recording at the specified time. If the start
Specified
Duration
Data Number Stops recording at the specified number of data
Specified Period Stops recording at the specified period and enters
Alarm Stops recording using the alarm status as a
Level Stops recording using a collected data value as a
is clicked.
condition is set to Alarm or Level, GA10 enters a
recording standby state.
Stops recording when the specified time elapses
after recording starts. If the start condition is set to
Alarm or Level, GA10 enters a recording standby
state.
points. If the start condition is set to Alarm or
Level, GA10 enters a recording standby state.
recording standby state.
trigger and enters recording standby state.
trigger and enters recording standby state.
An example of the procedure when the start condition is
set to Alarm is explained below.
1
Set Start Condition to Alarm.
The tag range, reference alarm, and alarm value are
displayed.
Tag range
Reference alarm
2
Click the first or last tag selection button.
Alarm value
A tag selection dialog box appears.
3
Select the applicable tag range.
The dialog box closes, and the tag selection button
display changes to the selected tag.
4
Select the reference alarm.
5
Set the alarm value to Happen (alarm activated
state) or Release (alarm released state).
Click the Start Recording button to enter the recording standby state. When the monitored alarm reaches the specied alarm value, recording starts.
• If the stop condition is set to Alarm
The setting procedure is the same as described
above.
GA10 operates in the following manner.
If the start condition is set to Alarm or Level, when the
specified alarm value is reached during recording, GA10
stops recording and enters the recording standby state.
If the start condition is not set to Alarm or Level, when the
specified alarm value is reached during recording, GA10
stops recording.
An example of the procedure when the start condition is
set to Level is explained below.
1
Set Start Condition to Level.
Tag range, threshold value, and operation direction
appear.
Tag range
Note
• If you set the start condition to Specified Period, the
stop condition is fixed to Specified Period.
• If the start condition is set to Specified Period and
the recording start time is set to the same time as the
record stop time, the recorded data file is not divided
at every interval.
• If the start condition is set to Specified Period and the
period is set to the 31st of every month, for months
that do not have 31 days, the date is automatically set
to the last day of the month.
• If you set the start condition to Specified Time,
you cannot specify a nonexistent time due to DST
(daylight saving time) transition.
• If the specified time overlaps due to the DST
transition, the first time is used to start recording.
3-22
Type the threshold.
2
Click the first or last tag selection button.
Operation direction
A tag selection dialog box appears.
3
Select the applicable tag range.
The dialog box closes, and the tag selection button
display changes to the selected tag.
4
Enter the threshold value.
5
Set the operation direction to Up (data value is
greater than or equal to the threshold) or Down
(data value is less than or equal to the threshold).
Click the Start Recording button to enter the recording standby state. When the monitored tag value
reaches the threshold in the specied direction,
recording starts.
IM 04L65B01-01EN
Page 47

Every Week, or Every Month.
Set the conditions
Chapter 3 Configuring and Starting Data Collection and Recording
• If the stop condition is set to Level
The setting procedure is the same as described
above.
GA10 operates in the following manner.
If the start condition is set to Alarm or Level, when
the monitored tag value reaches the threshold in the
specified direction, GA10 stops recording and enters the
recording standby state.
If the start condition is not set to Alarm or Level, when
the monitored tag value reaches the threshold in the
specified direction, GA10 stops recording.
File Division
Set the conditions for dividing data files. The settings vary
depending on the selected condition. The figure below
shows an example when Specified Period is selected.
Type the time.
for dividing.
Select Every Hour, Everyday,
Off
File is not divided.
Specified Duration
Based on the time of the first recorded data, the file
is divided at every specified hour and minute.
Example: If the division time is 1 hour, the time of
the first recorded data is 3:00:00, and the record
interval is 1 second, the first file will contain the data
from 3:00:00 to 3:59:59, and the second file will
contain the data from 4:00:00 to 4:59:59.
Specified Period
Select Every Hour, Everyday, Every Week, or Every
Month and the absolute time to divide the data file.
Data Number
The file is divided when the number of data values in
the data file reaches the specified number.
Note
The file is divided in the following situations.
• When the data file size exceeds 1 GB
• When the data file output format is Excel and the
number of recorded tags is 180 or less, the files will
be divided every 65535 rows.
When the number of recorded tags is 181 or more, the
files will be divided in groups of the maximum number
of rows that meets the following condition: number of
tags × number of rows < 11796428.
• When the data file output format is binary and the
number of recorded data points exceeds 10 million
This number is the number of timestamps that is
recorded and is not related to the number of tags.
Number of Files
You can limit the number of data files that are saved from
the start of recording to the end of recording. When the
number of data files reaches the limit, the oldest file is
deleted to save the most recent file.
The handling of the number of files is different when the
data time of collected data is set to PC time or Device
time.
PC time
Because the data of every device is saved in a
single file, the number of data files of one iteration
from recording start to recording stop is applicable.
Device time
Because a file is saved for each device or each
interval, the number of data files of one iteration
from recording start to recording stop for each
device or interval is applicable.
Folder
Specify the data file save destination.
Server PC Operation System Default destination
Windows XP C:\Documents and Settings\All Users\
Windows Vista, 7, 8 C:\Users\Public\Documents\SMARTDAC+
Documents\SMARTDAC+Data Logging
Software\Data
Data Logging Software\Data
Note
We recommend you use the default setting for the data
save destination folder.
If you want to change the save destination, select a folder
that the server (Network service account) can write to.
Note that files cannot be saved to the desktop or
Document folders.
File Name
Specify the name of the data file. When recording data
using Specified Period, it is convenient to add the date
or time to the file name. The date or time of the first data
point is added to the file name.
Comment
You can attach comments to data files. You can view
these comments when you display the data in Universal
Viewer.
You can change the comments until you click Start
Recording but not afterwards.
• Differences in Data Recording When PC Time Is
Used and When Device Time Is Used
The table below summarizes the differences in the
recording files created when Data time is set to
Device time and when set to PC time.
Data Time
Influence
Number of recording
files
Alarm information Alarm information is
DST (daylight saving
time) when a recording
file is displayed on the
viewer
When device settings
are changed during
recording
One data file is created. A data file is created for
recorded by taking the
logical OR of the alarm
information from the
collected data immediately
after the previous recording
data point to the current
recording data point.
When a recording file is
displayed on the viewer,
the time information
is displayed correctly
according to the DST.
The changes are not
reflected.
Changes to devices during data collection and recording:
Q11
Specified Data Time
PC Time Device Time
each device. Or if there
are multiple acquisition
intervals in the same
device, a data file is
created for each interval.
The data files and alarm
information are aligned.
When the DST settings on
the PC and device are the
same, the time information
is displayed correctly. If
they are not the same,
the DST information of
the device is not reflected
correctly.
Recording stops.
IM 04L65B01-01EN
3-23
Page 48

Click here to display the Email Setting Page.
Chapter 3 Configuring and Starting Data Collection and Recording
3.3.8 Configuring Mail Settings
GA10 can send email when alarms occur or when the communication status changes.
Configure email settings on the Mail Setting Page.
SMTP server settings
Basic Operation
Set mail transmission conditions.
1
Type the server name in the SMTP Server box.
2
Type the port number that the SMTP server will use in the Port No. box.
3
Click Resend Times, and select the number of retransmissions when transmission
fails.
4
Click Authentication Methods, and select OFF (no authentication), SMTP
Authentication, or POP Before SMTP.
5
Set the conditions for sending email. You can specify multiple conditions.
6
Click Sending Setting .
A dialog box appears.
7
In the dialog box, set the necessary items such as the destination, title, and body of the
message, and click OK.
8
For Attached Files, select the information to attach to the file.
SMTP server settings are listed below.
• SMTP server name
• Port number that the SMTP server will use
• Authentication method that the SMTP server will use
• Settings related to the selected authentication method
• Number of retries when email transmission fails
The available authentication methods are no authentication, SMTP authentication, and POP
before SMTP.
3-24
IM 04L65B01-01EN
Page 49

Copy and Paste buttons
Chapter 3 Configuring and Starting Data Collection and Recording
The available email transmission conditions are listed below.
• Send an email when an alarm occurs.
• Send an email when the communication status between the server and a data
collection device changes or when a data dropout occurs on the server.
• Send an email at specified intervals (such as everyday, every week, and every
month) or at a specific time within the interval.
• Send an email at specified intervals after data collection starts.
• Send an email when the creation of a data file is completed.
When you enter the conditions for sending emails, set the content of the email in the
following dialog box.
The content can be copied to another project.
Can be copied to another project
Mail transmission
settings
• Sent from
• Sent to
• CC
• Title
• Content
IM 04L65B01-01EN
3-25
Page 50

Chapter 3 Configuring and Starting Data Collection and Recording
SMTP Server Settings
Enter the following items.
• SMTP server name (up to 255 characters)
• Port number (0 to 65535)
• Resend Times: Select 0, 1, 2, 3, 4, or 5. If email
transmission fails, GA10 retries the
specified number of times. GA10 will
retry to transmit 5 minutes after the
previous transmission failure.
• Authentication Methods: Select OFF, SMTP
Authentication, or POP
Before SMTP.
If you use authentication, you must set the user name and
password.
SMTP authentication
POP Before SMTP authentication
Setting Conditions for Sending Email
The table below summarizes the available conditions for
sending email.
Behavior When Sending Email When Alarms Occur
and File Attachments
If Send while alarm occurs is specified, note the
following points.
• The timing for sending email is different when Data
time is set to PC time and when Data time is set to
Device time.
PC time
The specified tag range is assumed to be a single
group. If any of the alarms of the tags in the group
occurs, an email is sent.
Device time
The specified tag range is grouped by device or
interval. If any of the alarms of the tags in the group
occurs, an email is sent.
In each 1 second interval of each group, the data
timestamp of the earliest occurring alarm is used as
the alarm timestamp, and a single email message is
sent for this alarm.
The alarm information and instantaneous value
in the file attachment will only be for this earliest
occurring alarm.
Email is not sent for all other alarms that occur.
• The condition for sending email is based on the alarm
information of data collected at the data collection
interval. The condition for starting and stopping
recording is based on the alarm information of data
recorded at the record interval.
Send Conditions Description File Attachment
Send while alarm
occurs
Send mail when
Comm. Status is
changed
Send by specified
interval
Send by specified
time
Send while data file is
created
Multiple alarm levels of
multiple tags are monitored.
When an alarm occurs in
the collected data, an email
is sent.
When the communication
between the server and a
data collection device is
disconnected or restored
or when the server fails to
collect data for some reason,
an email is sent.
An email is sent at specified
intervals such as everyday,
every week, or every month.
An email is sent at a specific
time within the interval.
An email is sent at userspecified intervals after data
collection starts.
An email is sent when
the creation of a data file
is completed after data
collection starts.
Availability
The alarm
information and
instantaneous value
for the specified tag
at the time of alarm
occurrence can be
attached as a file.
No file is attached.
The alarm
information and
instantaneous value
for the specified tag
can be attached as
a file.
The alarm
information and
instantaneous value
for the specified tag
can be attached as
a file.
The created file is
attached.
Behavior When Sending Email at Specified Intervals
and File Attachments
If Send by specified interval is specified, note the
following points.
• Do not change the time during data collection and
recording. Doing so will affect the timestamps of data
attached to e-mails.
• The timing for sending email is different when Data
time is set to PC time and when Data time is set to
Device time.
PC time
The time on the PC in which the server is installed
is used. The data in the file attachment is all the tag
data within the specified range.
Device time
If Device time is specified, tags are grouped by
device or interval. Because the timestamps attached
to the data is used in each group, multiple emails
may be sent at the device level or interval level.
If there are no tags that belong to a group in the
specified range, file attachment is not created.
3-26
IM 04L65B01-01EN
Page 51

Chapter 3 Configuring and Starting Data Collection and Recording
Body of the Sent Email
The body of email messages consists of the message
specified by the user and the message automatically
added according to the send conditions.
The following figure shows the message that is
automatically added. It displays the event information
(send conditions) divided into the time of occurrence,
type, and details.
Time of occurrence
Type
Details
The time of occurrence, type, and details are described
below.
The type and details are displayed in English.
• Time of occurrence
Send Conditions Time Description
When an alarm occurs Time when any of the monitored alarms occurred
When the
communication status
changes
Specified period Time of the specified period
Specified duration Time of the specified duration
When a data file is
created
Time when communication was disconnected or
restored or when data dropout occurred
Time when the creation of any data file was
completed
• Type
Send Conditions Text String Expressing the Event Type
When an alarm occurs Alarm
When the
communication status
changes
Specified period Periodically Notification
Specified duration Regularly Notification
When a data file is
created
Communication Status
Data file
Send Conditions Text String Expressing the Details
Specified duration The condition of sending mail in ProjectName is
When a data file is
created
every hh hour(s) mm minute(s) ss second(s).
A data file (filename) in ProjectName is created.
Tagindex: Tag index of the tag where the alarm occurred
AlarmLevel1: Alarm level where the alarm occurred
AlarmLevel1, AlarmLeve2: Alarm levels where alarms
occurred
ProjectName: Name of the project where the event
occurred
no: Number of the device where the event occurred
deviceName: Name of the device where the event
occurred
weekday: Day of the week when the event occurred
day: Date when the event occurred
filename: Name of the data file (including the extension)
in which the event occurred
YYYY: The year in four digits
MM: The month
DD: The date from 1 to 31
hh: The hour from 00 to 23
mm: The minute from 00 to 59
ss: The second from 00 to 59
ms: The millisecond from 000 to 999
Note
• The maximum number of emails that the server can
hold is 20 messages per project.
This includes emails that fail transmission (including
the number of retransmission.)
• Emails held in the server are deleted when the
specified retransmission count is reached or when the
server stops.
• Details
Send Conditions Text String Expressing the Details
When an alarm occurs When an alarm occurs in one level
When the
communication status
changes
Specified period When the specified period is everyday
Tagindex “AlarmLevel1” in ProjectName is
occured.
When alarms occur in several levels
Tagindex “AlarmLevel1,AlarmLeve2” in
ProjectName are occured.
When communication is disconnected
The connection of no: deviceName in
ProjectName is disconnected.
When communication is restored
The connection of no: deviceName in
ProjectName is recovered.
When a data dropout occurs (when Data time is
set to Device time):
Data lack in no: deviceName in ProjectName
is detected. The duration of Data Lack is from
YYYY/MM/DD hh:mm:ss:ms to YYYY/MM/DD
hh:mm:ss:ms.
When a data dropout occurs (when Data time is
set to PC time):
Data Lack in ProjectName is detected.
The condition of sending mail in ProjectName is
at hh:mm:ss of every day.
When the specified period is every week
The condition of sending mail in ProjectName is
at hh:mm:ss of each weekday.
When the specified period is every month
The condition of sending mail in ProjectName is
at hh:mm:ss of each month day.
IM 04L65B01-01EN
3-27
Page 52

Access user list
Click here to display the Access&Others Setting Page.
Chapter 3 Configuring and Starting Data Collection and Recording
3.3.9 Setting Project Access Privileges
In GA10, you can set access privileges at the project level separately from the server
access privileges (administrator and user privileges).
These privileges define the operation scope of the project; they apply in the same way to
the administrator and users.
There are four types of project access privileges: Owner, Manager, Operator, and Monitor.
Only the owner can assign access privileges. The person creating the project is the initial
owner of the project. (To change owners:
page 6-4)
Administrator A
User B
Owner
All operations Edit
Operation
Monitor
User DUser C
OperatorManager Monitor
Operation
Monitor
User E
Monitor
Project A
Privileges are assigned on the Access & Others Setting Page of the project.
From the users registered in the server, you can specify the users that can access the
current project and their operation scope.
The server user list in the bottom half of the page displays the users that are registered in
the server.
The access user list in the top half of the page displays the users that have been granted
access to the project. You can assign users by moving them on the page.
3-28
Other settings
Users registered in the server
Server user list
IM 04L65B01-01EN
Page 53

Chapter 3 Configuring and Starting Data Collection and Recording
Access Privilege Types and Operation Scope
The table below shows the available project access
privilege types and their operation scope.
Level Privilege
Type
1 Owner All operations All operations (including deleting the
2 Manager Setup
3 Operator Operation
4 Monitor Monitor View recorded data files.
Allowed
Operations
Operation
Monitor
Monitor
Operation Details
project)
Set project access privileges.
Edit setup data.
Start/stop data monitoring or recording.
View recorded data files.
Open data files.
Delete data files.
Monitor collected data.
View setup data.
Start/stop data monitoring or recording.
View recorded data files.
Open data files.
Delete data files.
Monitor collected data.
Open data files.
Monitor collected data.
To assign access privileges, follow the procedure below.
Skip steps 1 and 2 if you are already setting the details of
a project.
1
The user who has owner privileges to the project
logs in.
2
In the Project List Page, double-click the appropriate
project to open the project.
The selected project appears on the Project Page.
3
Change the project setting window to the Access &
Others Setting Page.
A list of users registered in the server appears.
4
Drag the appropriate user to the appropriate
privilege area.
Manager
privileges
5
Or, select the user, and click the Move button
Operator
privileges
User list
Monitor
privileges
pointing to the appropriate privilege area.
Move button
The user moves to the specied privilege area.
Note
You can change how the users are displayed between
User Name and User Full Name by clicking User Display
Form on the View menu.
User name display
IM 04L65B01-01EN
User full name display
The user can now perform the granted operations in
the project.
You can select multiple users by using the Shift and Ctrl
keys on the keyboard. Hold down Shift and left-click to
specify a range. Hold down Ctrl and left-click to select
users one at a time.
All Users
The user list displays a user named “All Users.” You
can use this to assign access privileges to all users in
the server user list.
You can assign access privileges to both “All Users”
and individual users. If you do, the higher privilege
takes effect for such users.
3-29
Page 54

Chapter 3 Configuring and Starting Data Collection and Recording
Note
• “All Users” apply to all users registered in the server.
Therefore, note that if you assign access privileges to
“All Users” on the Setting Page and then add or delete
users, the users that can access the project will also
be automatically updated.
• Before deleting project access privileges of a user,
check the user status.
For example, if a user has a project opened with
monitor privileges and you delete the access
privileges of this user, the user will be shut out from
monitoring when the change takes effect in the server.
If you delete an owner user:
To open a project with lower access privileges:
Keep Lock State Feature
On the Access & Others Setting Page, you can also set
the Keep Lock State feature.
When this feature is enabled, only the user that starts data
collection will be able to operate the relevant project.
The Keep Lock state is retained until the user that started
data collection logs in again and stops the data collection.
This feature is set to OFF by default. To use it, select ON.
Select ON to set the Keep Lock State feature.
page 6-4
page 6-4
Note
The administrator can clear the Keep Lock state if there
is some reason in which data collection must be stopped.
To clear the Keep Lock state:
page 6-5
Using the DDE Server Feature
GA10 supports the DDE (Dynamic Data Exchange)
Server feature, which is used to send data to other
applications.
The basic procedure to use the DDE server is described
below.
Skip steps 1 to 3 if you are already setting the details of a
project.
First, configure the project as follows.
1
In the Project List Page, double-click the appropriate
project to open the project.
The selected project appears on the Project Page.
2
On the Project setting window, configure data
collection and display settings.
3
Change the project setting window to the Access &
Others Setting Page.
4
Set DDE Server to ON.
DDE server: Select ON.
Start the DDE server and data collection.
1
On the File menu, click Start DDE.
The DDE server starts on the PC running the GA10
client.
2
In the Project List Page, double-click the project that
you want to use the DDE server with to open the
project.
The selected project appears on the Project Page.
3
Start data collection.
While the DDE server is running on the client PC,
you can retrieve data from a DDE client.
4
To stop the DDE server, on the File menu, click
Stop DDE.
The DDE server stops on the PC running the GA10
client.
By using a DDE client to access the DDE server, you
can retrieve the tag values that are being collected in the
project. You can begin retrieving the data from a DDE
client after the DDE server starts.
Retrievable
Information
Date The date when the data was collected
Time The time when the data was collected (excluding
Millisecond The millisecond when the data was collected
Data number The serial number of the data. The first data value
Value The collected tag value
Description
the millisecond)
collected when data collection is started is number
zero.
3-30
For information on how to use a DDE client, see the
manual for the DDE client.
IM 04L65B01-01EN
Page 55

IMPORTANT
Chapter 3 Configuring and Starting Data Collection and Recording
The application name, topic name, and item number that
are used to retrieve data with the DDE client are shown
below.
Item Text String to Specify and Output
Application name DLGDDE (fixed)
Topic name Specify the name of the target project.
Item name Date date Outputs the date as a text
Time time Outputs the time as a text
Millisecond msec Outputs the millisecond as a
Data number no Outputs the data number as
Value tagxxxx
• While DDE is running, do not change the project
• To save les using Excel as a DDE client, set Files
Information
string.
The date format is YYYY/
MM/DD.
string.
The time format is
hh:mm:ss.
text string.
The millisecond format is
msec.
The millisecond is
expressed using a number
between 000 and 999.
a number. The data number
starts with zero.
xxxx is the tag
index number.
name (topic name).
of type to Excel 97-2003 book (*.xls).
Outputs the tag value as a
number.
The value is displayed
using the number of decimal
places for tags that is
specified on the Tag Setting
Page.
Note
• If data collected by the DDE server is in error, it is
output using indications other than values.
For the different types of error data, see section
4.9.2.
• The time information that is used for DDE queries is
the PC time in which the server is installed. The time
when the collected data is set to the DDE server is the
time that is output.
Therefore, if Data time is set to Device time, the time
and value of the data on the Monitor Page or data
recorded to the data file will not be synchronized to
the time and value output by the DDE server.
• The data number is output only when Data time is
set to PC time. It is not output when Data time set to
Device time.
• If communication between the data collection device
and the server is disconnected and Data time is
set to PC time, OFF is output for the data value. If
set to Device time, data updating stops regardless
of whether FIFO is being used. This is the same
behavior as when the data collection from the device
is delayed.
3.3.10 Starting Data Collection and Recording
You can start data collection and recording using a
configured project.
To close the project without collecting data, click the
icon on the right edge of the page.
Controlling an Opened Project Individually
Click the icons that are displayed on the tab on the right
side of the screen to collect or start and stop recording.
The procedure is similar to section 3.2.4.
Controlling Opened Projects Simultaneously
1
Click the icon at the left end of the toolbar.
The Project List Page appears.
2
On the Operation menu, click Start Monitoring
Simultaneously. Or, click the icon.
To start recording, on the Operation menu, click
Start Recording Simultaneously. Or, click the
icon.
A conrmation message appears.
3
Click OK.
Data collection starts.
The color changes.
4
To stop, on the Operation menu, click Stop
Monitoring Simultaneously. Or, click the icon.
To stop recording, on the Operation menu, click Stop
Recording Simultaneously.
Or, click the icon.
IM 04L65B01-01EN
3-31
Page 56

Chapter 3 Configuring and Starting Data Collection and Recording
Note
• Projects that you can simultaneously control are those
that you have Operator or higher privileges for.
• If a Modbus device definition file that you are using
contains an error, data collection will not start on the
corresponding project.
3.4 Registering Modbus Devices
GA10 can connect to devices that use the Modbus
protocol.
To register such a device, you must create a Modbus
device definition file in advance and save it in a specific
server folder.
The Modbus device definition file must contain device
names, register positions for data collection, and so on.
The basic registration procedure is explained below.
Basic Operation
1
Create a Modbus device definition file in XML format
by referring to the provided example.
We suggest that you use the Windows standard
Notepad or a text editor to edit the le.
2
Save the file.
Save the le using UTF-8 encoding.
3
Place the Modbus device definition file in the C:\
Program Files\Yokogawa Electric Corporation\
SMARTDAC+ Data Logging Software\Modbus folder
of the PC in which the server is installed.
4
Restart the server.
Restart procedure: section 2.6.1
The name of the registered Modbus device appears
next to Device Type in the Register device dialog
box.*
* A dialog box for registering new devices.
Note
When using a Modbus definition file to perform
communication through the Ethernet interface, set the
scan interval to a value less than the communication
timeout value of the device.
3-32
What Is a Modbus Device Definition File?
The Modbus device definition file is a file that is referred
to when a new Modbus device is registered on the Device
Setting Page.
A Modbus device definition file is composed of the
following four sections.
Option list
This is where the Modbus device options are
defined.
Register list
This is where the Modbus device’s registers that
are read during data collection are defined. Modbus
Function codes, register addresses, data types, and
register names are specified in this section.
Channel list
This is where the Modbus device’s channels that are
read during data collection are defined. You can also
specify channel settings, collection data positions,
and related alarm information.
Value conversion table
This is where the table for converting the data read
from the Modbus device’s registers into values for
actual use is defined.
Modbus device definition files are in XML format.
Descriptions in files have a hierarchical structure.
For details on the format, see page 3-33 and subsequent pages.
IM 04L65B01-01EN
Page 57

Chapter 3 Configuring and Starting Data Collection and Recording
Node Structure of Modbus Device Definition Files
Level 0 Level 1 Level 2 Level 3 Level 4 Level 5 Description Quantity
ModbusDevice Definition file root element 1
Options Option list node 0 or 1
Option Option information 0 to 5
Registers Register list node 1
Register Register information 1 to 300
Channels Channel list node 1
Channel Channel information 1 to 300
Init Channel default setting 0 or 1
DecimalPos Default decimal place 0 or 1
Min Default minimum span 0 or 1
Max Default maximum span 0 or 1
Unit Default unit 0 or 1
Value Channel value 1
DataError Error data status 0 or 1
ADError A/D converter status 0 or 1
PlusOver +OVER status 0 or 1
MinusOver -OVER status 0 or 1
Burnout Burnout information 0 or 1
Type Burnout type 0 or 1
Value Burnout status 0 or 1
Alarms Alarm list node 0 or 1
Alarm Alarm information 0 to 4
Type Alarm Type 0 or 1
Value Alarm value 0 or 1
TransTables Value conversion table node 0 or 1
Table Value conversion table 0 to 100
Value Conversion value 0 to 100
Node Attributes of Modbus Device Definition Files
If an attribute is not specified, the default value will be applied. However, if the Option, Mask, or Trans attribute is not
specified, GA10 assumes that the corresponding function is not used and does not apply the default value.
Node Name Attribute Type Type Mandatory Range Default
Value
ModbusDevice Type string string (A) Alphanumeric characters, 1 to 15
Modbus device type
characters
double 0.5 to 60.0 1
Option Name string string (B) Alphanumeric characters, 1 to 15
characters
Register Name string string (A) Alphanumeric characters, 1 to 15
Names of options supported by the
Modbus device
Register names in the Modbus device
characters
FunctionCode int int (A) 3 or 4 Modbus communication function code
Address int
DataType enum enum (A)
*2
*2
int
(A) 1-465535 Modbus register
INT16,UNIT16,INT32_B,INT32_L,
UINT32_B,UINT32_L,FLOAT_B,F
*3
LOAT_L
Read data type
Channel Name string string (A) 1 to 15 Unicode characters Channel name
DecimalPos int int 0 to 5 0 Channel decimal place
Min double double -1E16 to 1E16 0 Minimum channel span
Max double double -1E16 to 1E16 100 Maximum channel span
ScaleRatio double double -1E16 to 1E16 1 Channel scaling coefficient
ScaleOffset
*4
double double -1E16 to 1E16 0 Channel scaling offset
Unit string string Up to 6 Unicode characters “” Channel unit
Option string string Alphanumeric characters, up to 15
Option name
characters
DecimalPos
Min
Max
Register string string (A) Alphanumeric characters, 1 to 15
Mask
*1
int*2int
*2
characters
Hexadecimal number, 0 to 65535 Data bit mask
Trans string string Alphanumeric characters, up to 15
Register name
Value conversion table name
characters
Unit
DataError
ADError
PlusOver
MinusOver
Burnout\Type
*5
*5
*5
*5
*5*6
Burnout\Value
Alarm\Type
Alarm\Value
Description
IM 04L65B01-01EN
3-33
Page 58

Chapter 3 Configuring and Starting Data Collection and Recording
Node Name Attribute Type Type Mandatory Range Default
Alarm\Type Kind enum enum “OFF”,“H”,“L”,“dH”,“dL”,“RH”,“RL”,
Table Name string string (C) Alphanumeric characters, 1 to 15
Value From int
ToDataType enum enum Int, String Int Target conversion data type
To string string (C) Up to 15 Unicode characters Conversion target value
(A): Mandatory item. However, for attribute name Register, node name Type is not mandatory.
(B): Mandatory item to use the option
(C): Mandatory item to convert data
1 If only a mask is available, bit mask is applied to the data value read from the register, and the result is handled as TRUE or FALSE.
2 Decimal and Hexadecimal integers are supported. For hexadecimals, the number must be preceded by a “0x.”
3 For a description of Data Type, see the table below.
4 Scaling calculation: Y = ScaleRatio * X + ScaleOffset
X: Modbus register value (after decimal point calculation; after conversion is a value conversion table is available)
Y: Computed result
5 Channel data status is processed in the following order of precedence: ADError, DataError, Burnout, PlusOver, MinusOver.
6 If the burnout type is set to DownScale (type value is 2) and the burnout status is 1, the data status will be −BURNOUT. If the burnout type is set to UpScale (type value is not 2)
and the burnout status is 1, the data status will be +BURNOUT.
7 Node channels include optional attributes. When registering a device in the Register Device dialog box, if you do not select this option, this channel will not be available in
the registered device.
*2
*2
int
“tH”,“tL”,“PVH”,“PVL”,“DVH”,“DVL”
,“DVO”,“DVI”,“SPH”,“SPL”,“OTH”,“
OTL”,“ETC”
characters
(C) -2147483648 to 2147483647 Conversion source value
Value
“OFF” Default alarm type
Value conversion table name
To convert to a value, specify the value
using a character string.
Description
Description of Data Type
Value How to Use
INT16 Use when a signed 16-bit integer is assigned to the device register.
UINT16 Use when an unsigned 16-bit integer is assigned to the device register.
INT32_B Use when a signed 32-bit integer is assigned to the device register and the smallest register number is assigned to the highest bit.
INT32_L Use when a signed 32-bit integer is assigned to the device register and the smallest register number is assigned to the lowest bit.
UNIT32_B Use when an unsigned 32-bit integer is assigned to the device register and the smallest register number is assigned to the highest bit.
UINT32_L Use when an unsigned 32-bit integer is assigned to the device register and the smallest register number is assigned to the lowest bit.
FLOAT_B Use when a 32-bit floating-point number is assigned to the device register and the smallest register number is assigned to the highest bit.
FLOAT_L Use when a 32-bit floating-point number is assigned to the device register and the smallest register number is assigned to the lowest bit.
Note
A read error will occur in the following situations.
• A mandatory item is missing.
• There is a syntax error. However, in the following situations, an error will not occur and the value
will be corrected when it is read.
• There is a limit to the string length for a node attribute, and this limit is exceeded.
• There is an allowable range for a node attribute, and the value is outside the range.
A sample Modbus device definition file is provided in the following pages. The sample shows
how the XML file should be structured.
When you create a Modbus device definition file, refer to the description of registers in
the user's manual of the Modbus device that you want to connect.
3-34
IM 04L65B01-01EN
Page 59

Chapter 3 Configuring and Starting Data Collection and Recording
Modbus Device Definition File Example
<?xml version="1.0" encoding="utf-8"?>
<ModbusDevice Type="SAMPLE A">
<Options>
<Option Name="remote"></Option>
</Options>
<Registers>
<Register Name="PV1" FunctionCode="3" Address="40003" DataType="INT16"></Register>
<Register Name="SP1" FunctionCode="3" Address="40004" DataType="INT16"></Register>
<Register Name="OUT1" FunctionCode="3" Address="40005" DataType="INT16"></Register>
<Register Name="MOD1" FunctionCode="3" Address="40008" DataType="INT16"></Register>
<Register Name="PIDNO1" FunctionCode="3" Address="40009" DataType="INT16"></Register>
<Register Name="SPNO" FunctionCode="3" Address="40010" DataType="INT16"></Register>
<Register Name="ERROR1" FunctionCode="3" Address="40002" DataType="INT16"></Register>
<Register Name="BSL" FunctionCode="3" Address="41209" DataType="INT16"></Register>
<Register Name="PUNI1" FunctionCode="3" Address="41230" DataType="INT16"></Register>
<Register Name="PDP1" FunctionCode="3" Address="41231" DataType="INT16"></Register>
<Register Name="PV1Upper" FunctionCode="3" Address="41232" DataType="INT16"></Register>
<Register Name="PV1Lower" FunctionCode="3" Address="41233" DataType="INT16"></Register>
<Register Name="SPUpper" FunctionCode="3" Address="40933" DataType="INT16"></Register>
<Register Name="SPLower" FunctionCode="3" Address="40934" DataType="INT16"></Register>
<Register Name="SPNOUpper" FunctionCode="3" Address="40940" DataType="INT16"></Register>
<Register Name="ALM" FunctionCode="3" Address="40011" DataType="INT16"></Register>
<Register Name="AL1" FunctionCode="3" Address="40915" DataType="INT16"></Register>
<Register Name="AL2" FunctionCode="3" Address="40916" DataType="INT16"></Register>
<Register Name="AL3" FunctionCode="3" Address="40917" DataType="INT16"></Register>
<Register Name="AL4" FunctionCode="3" Address="40918" DataType="INT16"></Register>
</Registers>
<Channels>
<Channel Name="PV1">
<Init>
<DecimalPos Register="PDP1"></DecimalPos>
<Min Register="PV1Lower"></Min>
<Max Register="PV1Upper"></Max>
<Unit Register="PUNI1" Trans="PVUnitTable"></Unit>
</Init>
<Value Register="PV1">
<Error Register="ERROR1" Mask="0x0005"></Error>
<PlusOver Register="ERROR1" Mask="0x0010"></PlusOver>
<MinusOver Register="ERROR1" Mask="0x0020"></MinusOver>
<Burnout>
<Type Register="BSL"></Type>
<Value Register="ERROR1" Mask="0x0100"></Value>
</Burnout>
</Value>
<Alarms>
<Alarm>
<Type Register="AL1" Trans="PVAlarmTypeTable"></Type>
<Value Register="ALM" Mask="0x0001"></Value>
</Alarm>
<Alarm>
<Type Register="AL2" Trans="PVAlarmTypeTable"></Type>
IM 04L65B01-01EN
3-35
Page 60

Chapter 3 Configuring and Starting Data Collection and Recording
<Value Register="ALM" Mask="0x0002"></Value>
</Alarm>
<Alarm>
<Type Register="AL3" Trans="PVAlarmTypeTable"></Type>
<Value Register="ALM" Mask="0x0004"></Value>
</Alarm>
<Alarm>
<Type Register="AL4" Trans="PVAlarmTypeTable"></Type>
<Value Register="ALM" Mask="0x0010"></Value>
</Alarm>
</Alarms>
</Channel>
<Channel Name="SP1">
<Init>
<DecimalPos Register="PDP1"></DecimalPos>
<Min Register="SPLower"></Min>
<Max Register="SPUpper"></Max>
<Unit Register="PUNI1" Trans="PVUnitTable"></Unit>
</Init>
<Value Register="SP1"> </Value>
<Alarms>
<Alarm>
<Type Register="AL1" Trans="SPAlarmTypeTable"></Type>
<Value Register="ALM" Mask="0x0001"></Value>
</Alarm>
<Alarm>
<Type Register="AL2" Trans="SPAlarmTypeTable"></Type>
<Value Register="ALM" Mask="0x0002"></Value>
</Alarm>
<Alarm>
<Type Register="AL3" Trans="SPAlarmTypeTable"></Type>
<Value Register="ALM" Mask="0x0004"></Value>
</Alarm>
<Alarm>
<Type Register="AL4" Trans="SPAlarmTypeTable"></Type>
<Value Register="ALM" Mask="0x0010"></Value>
</Alarm>
</Alarms>
</Channel>
<Channel Name="OUT1" DecimalPos="1" Min="0" Max="100" Unit="%">
<Value Register="OUT1"></Value>
<Alarms>
<Alarm>
<Type Register="AL1" Trans="OUTAlarmTypeTable"></Type>
<Value Register="ALM" Mask="0x0001"></Value>
</Alarm>
<Alarm>
<Type Register="AL2" Trans="OUTAlarmTypeTable"></Type>
<Value Register="ALM" Mask="0x0002"></Value>
</Alarm>
<Alarm>
<Type Register="AL3" Trans="OUTAlarmTypeTable"></Type>
<Value Register="ALM" Mask="0x0004"></Value>
</Alarm>
<Alarm>
<Type Register="AL4" Trans="OUTAlarmTypeTable"></Type>
<Value Register="ALM" Mask="0x0010"></Value>
3-36
IM 04L65B01-01EN
Page 61

Chapter 3 Configuring and Starting Data Collection and Recording
</Alarm>
</Alarms>
</Channel>
<Channel Name="A/M1" DecimalPos="0" Min="0" Max="1">
<Value Register="MOD1" Mask="0x0001"></Value>
</Channel>
<Channel Name="R/L1" DecimalPos="0" Min="0" Max="1" option="remote">
<Value Register="MOD1" Mask="0x0002"></Value>
</Channel>
<Channel Name="SPNO" DecimalPos="0" Min="0" Max="8">
<Value Register="SPNO"></Value>
</Channel>
<Channel Name="PIDNO1" DecimalPos="0" Min="0" Max="8">
<Value Register="PIDNO1"></Value>
</Channel>
<Channel Name="Run/Stop" DecimalPos="0" Min="0" Max="1">
<Value Register="MOD1" Mask="0x0004"></Value>
</Channel>
</Channels>
<TransTables>
<Table Name="PVUnitTable" ToDataType="String">
<Value From="0" To="%"></Value>
<Value From="1" To="^C"></Value>
<Value From="2" To=""></Value>
<Value From="5" To="^F"></Value>
</Table>
<Table Name="PVAlarmTypeTable" ToDataType="String">
<Value From="0" To="OFF"></Value>
<Value From="1" To="H"></Value>
<Value From="2" To="L"></Value>
<Value From="9" To="H"></Value>
<Value From="10" To="L"></Value>
<Value From="11" To="H"></Value>
<Value From="12" To="L"></Value>
<Value From="25" To="ETC"></Value>
<Value From="26" To="ETC"></Value>
<Value From="27" To="ETC"></Value>
</Table>
<Table Name="SPAlarmTypeTable" ToDataType="String">
<Value From="28" To="H"></Value>
<Value From="29" To="L"></Value>
<Value From="68" To="H"></Value>
<Value From="69" To="L"></Value>
</Table>
<Table Name="OutAlarmTypeTable" ToDataType="String">
<Value From="30" To="H"></Value>
<Value From="31" To="L"></Value>
<Value From="70" To="H"></Value>
<Value From="71" To="L"></Value>
</Table>
</TransTables>
</ModbusDevice>
IM 04L65B01-01EN
3-37
Page 62

Blank
Page 63

1
2
3
Chapter 4 Monitoring Data Collection
Data not being monitored
4.1 Monitoring on the Monitor Page
This section explains the Monitor Page for Detail Settings
mode. In Simple Settings mode, the Monitor Page
consists of the Trend Monitor Set and Digital Monitor Set.
The operation is the same.
4.1.1 Displaying the Data Collection Status
You can monitor data collection in the following page.
Client and server
communication status
Project tab
Start and stop data monitoring
Not monitoring
Monitoring
Start and stop data recording
Not recording
Recording
Setting Page
Monitor Page
Status Page
Data files Page
Close
• Close
Click to close the project.
• Viewing the Project Status in the Project List Page
Click the
icon to show the Project List Page. You
can view the project status.
Data monitoring in progress
The boundary color changes.
Data recording standby
Data recording in progress
4
Monitoring Data Collection
• Client and Server Communication Status
The client and server communication status is indicated
as Good, Ordinary, or Bad.
You can check the alarm status and alarm ACK status
for the opened project.
When an alarm is not occurring
• Project Tab
The tab shows the project name, and operation icons.
The project alarm status is indicated in red.
* Blinking red: Alarm occurring
Solid red: Alarm acknowledged
• Start and Stop Data Monitoring
*
When an alarm is occurring
(indicated in red)
Click to start or stop data collection.
• Start and Stop Data Recording
Click to start or stop data recording.
• Setting Page, Monitor Page, Status Page, and Data
files Page
Click to display the corresponding page.
Setting Page
section 3.2, section 3.3
Monitor Page section 4.1.2
Status Page section 4.7
Data files Page section 5.1
IM 04L65B01-01EN
4-1
Page 64

Chapter 4 Monitoring Data Collection
4.1.2 Displaying the Monitor Page
Open a project, and click the Monitor Page icon on the
Project tab to open the Monitor Page.
In Simple Settings mode, the Monitor Page consists of
the Trend Monitor Set and Digital Monitor Set as shown
below.
Monitor set boundary Monitor sets
In Detail Settings mode, the Monitor Page that you
configured opens.
Maximize icon
• Switching the Display Group at Once
On the View menu, click Group Link. Or, click the
icon on the toolbar.
When you change the display group of one Monitor
Set, the display group of other Monitor Sets also
changes.
To cancel linking, on the View menu, click Group
Link to unselect it. Or, click the icon on the toolbar to
unselect it.
4.1.3 Setting General Display Options
• Tag Display Form
From the list of options that appears when you click
Tag Display Form on the View menu, select the items
to display as tags. This applies to all pages.
• User Display Form
From the list of options that appears when you click
User Display Form on the View menu, select the
items to display as user names. This applies to all
pages.
• Screen Background Color
On the View menu, click Style, and click Light or
Dark to select the background color. This applies to all
pages.
• Date Format
From the list of options that appears when you click
Date Format on the View menu, select the date
format. This applies to all pages.
• Month Display Form
From the list of options that appears when you click
Month Display Form on the View menu, select the
month display format. This applies to all pages.
Item Description
Digit Example: “10” for October
Character Example: “OCT” for October
Monitor set boundary Monitor sets
Maximize icon
• Resizing the Monitor Set
To resize the Monitor Set, Resize the Monitor Set on
the Acquisition & Monitor Setting page must be set to
On.
Move the pointer near the boundary of the Monitor Set
to change the pointer to
or . In this condition,
drag the pointer to move the boundary to the desired
position.
• Maximizing the Monitor Set
Click the Maximize icon
in the upper right of the
Monitor Set to expand the Monitor Set to fill the entire
window. Click
to return to its original size.
4-2
• Decimal Point
On the View menu, click Decimal Point to select the
symbol to use for the decimal point. This applies to all
pages.
Item Description
. Period
, Comma
IM 04L65B01-01EN
Page 65

Scan interval
Chapter 4 Monitoring Data Collection
Show or hide the legend
4.2 Monitoring on the Trend Display
4.2.1 Displayed Content
Group tab
Trip line value
Waveform
Grid
Legend
Alarm display Time axis
• Scan Interval
The data collection interval.
• Group Tab
Switches the displayed group. Alarms occurring in tags
of each group are indicated in red.
• Waveform
Displays each waveform according to its corresponding
data tag color.
“Waveform Display”
• Grid
The grid shown in the waveform display area.
• Trip Line
Trip line assigned to a tag. Only the trip line of the
active waveform is displayed.
Moving the trip line
Drag the value of the trip line to the desired position.
• Y-axis
Displays the Y-axis scale, title, and unit. Each y-axis is
displayed according to its corresponding tag color.
• Legend
Displays tags, tag colors, waveform display on/off
check boxes, and Y-axis display on/off check boxes.
• Alarm Display
Displays alarms using bars from occurrence to release.
• Time Axis
The right end shows the most recent data time.
Trip line
Y-axis
Active
waveform mark
Vertical splitter
Time axis scroll bar
• Vertical Splitter
Use the vertical splitter to adjust the width of the Y-axis
display area.
When you move the pointer over the vertical splitter,
the pointer changes to
. In this condition, drag the
pointer to expand or reduce the width of the Y-axis
display area.
Waveform Display
• Active Waveform
The front-most displayed waveform is called the active
waveform.
• Changing the Active Waveform
Click a tag in the Legend or a Y-axis to make the
corresponding waveform the active waveform. When
a Y-axis is shared among multiple waveforms, the
waveform with the smallest waveform number will
become the active waveform. The active waveform
mark (
) moves below the Y-axis of the active
waveform.
• Automatically Updating the Displayed Data
(monitor mode)
When the time-axis scroll bar is at the right end
or when it is not displayed, the data display is
automatically updated. This mode is called monitor
mode. The right end of the waveform is the most recent
data.
• Viewing Past Data (playback mode)
Move the time-axis scroll bar from the right end to
view past data. This mode is called playback mode.
Automatic updating of the data display stops.
Returning the scroll bar to the right end switches GA10
back to monitor mode. If you do not operate the scroll
bar for 30 minutes, GA10 will return to monitor mode.
When Collecting Data Using Device Time
The window is divided by a combination of device
and scan interval. Trends of up to four devices can be
displayed at each scan interval.
4.2.2 Changing the Display
You can change the display using the icons in the upper
right.
Zoom in on or out of the time axis
Y-axis display zone
Waveform line thickness
Grid density
Waveform
display limit
• Show or Hide the Legend
You can show or hide the legend.
• Zoom in on or out of the Time Axis
You can zoom in on or out of the time axis.
IM 04L65B01-01EN
4-3
Page 66

Chapter 4 Monitoring Data Collection
Full zone
• Y-axis Display Zone
You can switch the Y-axis display zone.
section 4.2.3
• Waveform Line Thickness
You can change the waveform line thickness. This
applies to all waveforms.
• Grid Density
You can change the grid density.
• Waveform Display Limit
With limit Without limit
When you click the icon to select it, waveform display
limit is enabled. When you apply the waveform display
limit, the Y-axis display range is limited to the minimum
and maximum values that you specified using Scale
in Display Group. Measured values that are less than
the minimum scale value are set to the minimum
value, and values that are greater than the maximum
scale value are set to the maximum value. When you
click the icon to unselect it, waveform display limit is
disabled. In this condition, measured values outside the
scale are displayed as they are.
4.2.3 Controlling the Y-axis
• Y-axis Display Zone
You can select the Y-axis display zone.
Y-axis display zone specifies the scale position and
length. It is the waveform position and range.
position to zoom in or out on the Y-axis.
Moving the Y-axis
When you move the pointer on an Y-axis scale, the
pointer changes to
. In this condition, drag the pointer
to move the desired position to move the Y-axis to the
desired position.
• Compact Mode and Detail Mode
A Y-axis can be displayed in compact or detail mode. In
compact mode, scale values are hidden, narrowing the
width of the Y-axis.
In detail mode, if you move the pointer on the Y-axis
and click the
icon at the top of the Y-axis, the
mode changes to compact. In compact mode, if you
click the
icon, the mode changes to detail.
• Scrolling a Y-axis Scale
When you move the pointer on an Y-axis scale, the
pointer changes to
or .
Spinning the mouse wheel in this condition causes
the Y-axis scale to scroll, maintaining the difference
between the upper and lower limits of the scale.
Click the scale initialization icon
to return the scale
to its original position.
• Zooming in or out on an Y-axis Scale
When you move the pointer on an Y-axis scale, the
pointer changes to
is
shows a scale zoom in/zoom out icon .
or . Clicking when the pointer
Click an arrow of the icon or spin the mouse wheel to
zoom in or out on the scale value in reference to the
icon position.
Click the scale initialization icon
to return the scale
to its original position.
• Changing the Active Waveform
“Waveform Display”
Slide zone
Auto zone
Free zone
• Full Zone: Displays all waveforms in the maximum
range
• Slide Zone: Displays each waveform cascaded from
the top to the bottom of the waveform display area
• Auto Zone: Divides the waveform display area
into equally spaced zones in accordance with the
number of waveforms and displays the waveforms
• Free Zone: Displays waveforms in user-specified
zones
• Operations in Free Zone
In Free Zone mode, you can change the Y-axis display
zone as you like.
Zoom in/out on the Y-axis
When you move the pointer near the lower or upper
edge of the Y-axis scale, the pointer changes to
this condition, drag the pointer to move the desired
4-4
. In
IM 04L65B01-01EN
Page 67

Chapter 4 Monitoring Data Collection
Tag display mode Axis display mode
Alarm bar
Cursor Cursor
Alarm indicator
4.2.4 Showing and Hiding Waveforms (Using the
Legend)
The legend can be displayed in tag display mode or axis
display mode. Each time you click the display mode icon,
the mode toggles between tag display and axis display.
Display mode icon
Tag name
Tag color
Waveform check icon
• Tag Display Mode
The tags assigned to the display group are displayed.
Waveforms whose waveform check icons are selected
are shown. If you click an icon to clear the check box,
the waveform will be hidden.
• Axis Display Mode
A list of Y-axes used by tags is displayed. Expand a
Y-axis to display a list of tags that are using the Y-axis.
If you click an Y-axis check icon to clear the check box,
the axis and waveform data sharing the axis will be
hidden.
Click + to display tags.
Axis check icon
4.2.6 Reading Values with Cursors
You can use cursors to read values from waveforms. You
can display two cursors: cursor A and cursor B.
• Showing and Hiding Cursors
1
Click a point in the waveform graph.
Cursor A (vertical line) appears, and the value at the
intersection of the cursor and waveform is displayed.
2
Drag the cursor, and release the mouse button.
Cursor B (vertical line) appears, and the value at the
intersection of the cursor and waveform is displayed.
3
To clear the cursors, on the View menu, click Erase
cursor.
If the cursor value displays of multiple tags are
overlapped and you want to view the cursor values in
the back, make the appropriate waveform the active
waveform. Or, use the cursor value dialog box.
When a cursor is displayed, the waveform display
enters playback mode, and automatic updating of data
display stops.
4.2.5 Viewing the Alarm Occurrence Status
When you click Alarm on the View menu to add a check
mark, alarm bars are displayed in the alarm display area.
Remove the check mark to hide the alarm bars.
The bars show the data range in which alarms are
occurring for the tags displayed in the group. The alarms
are from the top alarm level 1, alarm level 2, alarm level 3,
and alarm level 4.
• Alarm bars are displayed with tag display colors.
• The alarm bars of the active waveform area always
shown in front. If the alarm bars of multiple tags are
overlapped and you want to view the alarm bars in
the back, make the appropriate waveform the active
waveform.
• Cursor Value Transparency
On the View menu, click Cursor value transparency
to choose Transparent or Opaque.
• Reading the Difference between Two Cursors
On the View menu, click Cursor value. The Cursor
Value dialog box appears. From this dialog box, you
can read the difference between cursors A and B.
Click the cursor move icon (
data point.
Cursor movement icon
) to move the cursor by 1
IM 04L65B01-01EN
4-5
Page 68

×
Mark edit box
Mark
Chapter 4 Monitoring Data Collection
• Data No.
A sequence number of collected data points taking
the first collected data point to be zero.
• Alarm indicator
The status of alarm level 1, alarm level 2, alarm
level 3, and alarm level 4, are displayed from the
left.
Displayed Content Description
Red Alarm occurrence
Green Alarm release
Gray Alarm not set
When Alarm in the View menu is not checked,
alarm indicators are not shown.
To close the cursor value dialog box, click the
in the upper right.
icon
4.2.7 Adding Marks
You can add marks to data. To add a mark, specify the
mark string and the data to add the mark to.
1
Type the string in the mark edit box.
You can edit the displayed string as well as select
from a list of strings that you used in the past from
the drop-down menu. The drop-down menu displays
the most recent five strings.
Current group
All groups
• Adding a Mark to the Current Group
If you select Current Group, a mark is added only to the
group shown on the trend monitor.
• Adding a Mark to All Groups
If you select All Groups when data is being collected
using PC time, a mark is added to all groups.
If data is being collected using device time,
• In playback mode, a mark is added at the same
position as cursor A to all display groups that contain
tags of the same device and of the same collection
interval as the monitor set subwindow that you
added a mark to.
• In monitor mode, a mark is added to all groups.
• When Marks Are Overlapped
Sometimes marks overlap and the string of the lower
mark cannot be read. Clicking a mark with Shift held
down moves the mark to the back.
Note
• Marks that have been added cannot be deleted or
edited.
• Mark information is saved in data files. (Only binary
data files.) Mark information added to data positions
in files that have already been closed is saved in the
data file that is currently being recorded. You can view
these marks by displaying connected data files.
2
Click the data position you want to add a mark to
display a cursor.
To add a mark to the most recent data, perform step
3 in monitor mode. Step 2 is not necessary.
3
On the Project menu, click Append Mark and then
Current Group or All Groups. Or, click the Current
Group or All Groups icon.
A mark is added to the specied position.
4-6
IM 04L65B01-01EN
Page 69

Tag color
▲
▲
Chapter 4 Monitoring Data Collection
4.3 Monitoring on the Digital Display
4.3.1 Displayed Content
Tag display area
Alarm indicator
Tag color
Tag name
Measurement bar display
• Tag Display Area
Tag alarm status is indicated in the alarm color.
* The alarm colors specified on the Acquisition &
Monitor page.
• Alarm Indicator
The status of alarm level 1, alarm level 2, alarm level
3, and alarm level 4, are displayed from the top. Tag
alarm status is indicated in the alarm color. Alarm
indicators show a character that indicates the alarm
*
type.
* It is not shown if the display area is limited.
Characters that indicate alarm types section 4.5.3
4.3.2 Showing and Hiding Alarm Indicators
When you click Alarm on the View menu to add a check
mark, alarm indicators are shown. To not show alarm
indicators, click Alarm on the View menu to unselect the
command.
Measured value
Unit
4.4 Monitoring on the Meter Display
4.4.1 Displayed Content
There are bar meters and analog meters.
Tag name
Alarm indicator
Tag color
Tag name
Alarm indicator
• Tag Display Area
Tag alarm status is indicated in the alarm color.
• Alarm Zone
The zone where alarms occur is indicated in the alarm
color.
• Alarm Value Mark (bar meters only)
Indicates the alarm value of data collection devices.
This appears when the alarm type is set to high limit,
low limit, difference high limit, difference low limit, delay
high limit, or delay low limit.
Displayed Content Description
Indicates that the alarm type is high
limit or difference high limit.
Indicates that the alarm type is low
limit or difference low limit.
Indicates that the alarm type is delay
high limit.
Indicates that the alarm type is delay
low limit.
Measured value
Bar meter
Bar meter
Unit
Alarm zone and
alarm value mark
Analog meter
Analog meter
Alarm zone
Measured value
and unit
IM 04L65B01-01EN
• Alarm Indicator
The status of alarm level 1, alarm level 2, alarm level
3, and alarm level 4, are displayed from the left. Tag
alarm status is indicated in the alarm color. A character
that indicates the alarm type is displayed.
* It is not shown if the display area is limited.
*
Characters that indicate alarm types section 4.5.3
You can show and hide alarm indicators.
section 4.3.2
4-7
Page 70

Group name
Alarm indicator
Most recent alarm
Chapter 4 Monitoring Data Collection
4.5 Monitoring Alarms
An alarm Monitor Set displays alarm information of
monitored tags in three formats.
4.5.1 Group Overview
Click the Group tab. Alarm information is displayed at the
group level. Groups that do not have alarms set on any
tags are not displayed.
• Alarm Occurrence Display
Alarm occurrence is displayed in the alarm color in the
group display area.
4.5.3 Alarm Overview
Click the Log tab. The history of all monitored tags’ alarm
occurrences and releases is displayed. The top line is the
most recent entry. The display is automatically updated as
alarms occur and are released.
If data is being collected in device time, the history is
displayed by dividing the window for each device.
Alarm list Scroll bar
Alarm level
Date
Time
Tag name
Alarm type
Status
4.5.2 Tag Overview
Click the Tag tab. Alarm information is displayed for tags
in the display group. Tags that do not have alarms set are
not displayed.
Alarm occurrence is displayed in the alarm color in the
The status of alarm level 1, alarm level 2, alarm level
Tag name
• Alarm Occurrence Display
tag display area.
• Alarm Indicator
3, and alarm level 4, are displayed from the left. Tag
alarm status is indicated in the alarm color.
Alarm type icon
Alarm status icon
• Most Recent Alarm
The top line always displays the most recent entry.
• Alarm List
The history of alarms are displayed in the order of
occurrence. Move the scroll bar down to view past
alarms. This condition is called playback mode. In
playback mode, the history is not automatically updated
(the line showing the most recent alarm is automatically
updated). Move the scroll bar to its top position to exit
playback mode.
• Alarm Status Icon
Indication Description
Alarm-on color
Alarm-off color
* The alarm colors specified on the Acquisition & Monitor page.
If ACK has not been executed, the icon background blinks.
*
*
Alarm occurrence
Alarm release
4-8
IM 04L65B01-01EN
Page 71

×
Chapter 4 Monitoring Data Collection
• Alarm Type Icons
Displayed
Content
Description
High limit alarm, measurement high limit alarm,
deviation high limit alarm, setting high limit alarm,
output high limit alarm
Low limit alarm, measurement low limit alarm,
deviation low limit alarm, setting low limit alarm,
output low limit alarm
Difference high limit alarm
Difference low limit alarm
High limit on rate-of-change alarm
Low limit on rate-of-change alarm
Delay high limit alarm
Delay low limit alarm
Deviation out limit alarm
Deviation in limit alarm
Other alarm
• Date and Time
The date and time of alarm occurrence and release.
• Alarm Level
Displayed
Content
L1 Alarm level 1
L2 Alarm level 2
L3 Alarm level 3
L4 Alarm level 4
Description
• Alarm Type
Displayed
Content
H high limit alarm
L Low limit alarm
dH Difference high limit alarm
dL Difference low limit alarm
RH High limit on rate-of-change alarm
RL Low limit on rate-of-change alarm
tH Delay high limit alarm
tL Delay low limit alarm
PVH Measurement high limit alarm
PVL Measurement low limit alarm
DVH Deviation high limit alarm
DVL Deviation low limit alarm
DVO Deviation out limit alarm
DVI Deviation in limit alarm
SPH Setting high limit alarm
SPL Setting low limit alarm
OTH Output high limit alarm
OTL Output low limit alarm
ETC Other alarm
Description
4.6 Checking Alarms
4.6.1 Displaying the Alarm Overview Dialog Box
While displaying the Monitor Page, click Alarm list List
on the View menu to display the alarm overview dialog
box.
The displayed content and operation in this dialog box are
the same as those of the alarm list of the alarm Monitor
Set.
Click
in the upper right of the dialog box to close it.
• Page Switching and Dialog Box Display
The dialog box stays open until you close it. If you
move to another page with the dialog box open, the
dialog box disappears. But, if you return to the Monitor
Page, the dialog box will appear again.
If you change the project while the dialog box is open,
the alarm information of the opened project will be
displayed in the dialog box.
4.6.2 Alarm Notification with Sound
On the Operation menu, click Alarm Sound to add a
check mark. When an alarm occurs, the PC will beep.
To stop the alarm sound, on the Operation menu, click
Turn Alarm’s Sound Off. Or, click the
To disable the alarm sound, on the Operation menu, click
Alarm Sound to remove the check mark.
icon.
Note
• To generate alarm sounds, the PC must be equipped
with a sound generating function and sound must be
turned on.
• You cannot change the sound.
4.6.3 Perform Alarm ACK Operations
If an alarm occurs in a monitored tag after data monitoring
is started, the corresponding area blinks in the alarm color
to indicate the alarm occurrence. An alarm ACK operation
refers to the act of stopping this blinking.
On the Project menu, click Alarm ACK. Or, click the
icon.
The blinking alarm indication stops.
• Status
Displayed
Content
ON Indicates that an alarm has occurred.
OFF Indicates that an alarm has been released.
IM 04L65B01-01EN
Description
4-9
Page 72

Project operation status
Chapter 4 Monitoring Data Collection
• Alarm ACK Operation and Alarm Indication
Transition
The following figure shows how the alarm indication
transitions as an alarm occurs, is released, and is
acknowledged with alarm ACK. The figure shows an
example of a Digital Monitor Set tag.
Alarm occurrence
Alarm releaseAlarm ACK
Blinks in alarm-on color
Alarm release Alarm ACK
4.7 Checking the Project Operation
Status
Click the Status Page icon on the Project tab to display
the Status Page. A Status Page is used to monitor:
• The project data collection and recording status
• The communication status between the data collection
device in the project and the server
The displayed data is automatically updated periodically.
4.7.1 Displayed Content
Device communication status
• If an alarm occurs and is released before the alarm
ACK operation, the color changes to that when
alarm is not occurring, but blinking continues until
the alarm ACK operation is executed.
• If an alarm occurs again after an alarm ACK
operation is executed, blinking will start again.
• Alarm ACK operations do not affect data collection
devices.
• Project Status
Stop Monitoring, Monitoring, Record Standby, or
Recording
• Loss Data
Recording data dropout status
Turns on in alarm-on colorBlinks in alarm-off color
• Write Error
Whether data writing to the data file is being performed
normally
• Beginning Time of Recording
The time of the first data value in the first data file that
is created after recording to data files is started
• Total Time of Recording
The elapsed time since the start of recording.
The timer continues until all recordings stop or when
Recording Standby is reached.
• Number of Generated Files
The number of data files that have been created after
recording was started
• Remaining Disk Capacity
The free space on the disk that contains the data file
save destination directory.
In the following conditions, “-----” is displayed, and the
bar does not display the amount of space used.
• Not recording.
• The data file save destination folder is set to a
network folder.
4-10
IM 04L65B01-01EN
Page 73

Model icon
Chapter 4 Monitoring Data Collection
• Device Communication Status
The status of communication with the devices in the
Device List is displayed. Nothing is displayed when
data collection is stopped.
Device name
Model name
Communication address
Communication status
Item Description
Model icon Device icon
Device name Device name and device number
Model name Model name and release number or software
Communication
address
Communication
status
name and release number
IP address
Communication status between the server
and device
Normal, Error, Retrying
4.8 Controlling Devices during Data
Collection
4.8.1 Controlling Device Computation from
GA10
On the Project menu, click Start Computing, Stop
Computing, Clear Computing, or Clear&Start
Computing.
Computation is collectively controlled on the devices that
meet the following conditions.
• Devices that are in the Device List of the project
• Devices that have computation functionality
• Devices that support Start Computing, Stop
Computing, Clear Computing, and Clear&Start
Computing.
Connected
Device,
Software
μR10000,
μR20000
DX1000,
DX1000N,
DX1000T
DX2000,
DX2000T
MV1000,
MV2000
CX1000,
CX2000
FX1000 Yes Yes Yes Yes
MX100, MW100 No No No No
DA100, DR130,
DR230,
DR240
GX10,
GX20,
GP10,
GP20
DAQLOGGER,
DAQ32Plus,
MXLOGGER
Devices
supporting
the Modbus
protocol
Yes: Supported No: Not supported
* When connected over an Ethernet network, the user registered
in the device must have privileges to use computation for this
feature to work.
Start
Comp.
Yes Yes No Yes
Yes Yes Yes Yes
Yes Yes Yes Yes
Yes Yes Yes Yes
Yes Yes Yes Yes
Yes Yes Yes Yes
Yes Yes Yes Yes
No No No No
No No No No
Stop
Comp.
Clear
Comp.
Clear&Start
Computing
IM 04L65B01-01EN
4-11
Page 74

Chapter 4 Monitoring Data Collection
4.9 Things to Consider
4.9.1 Time Zone and Daylight Saving Time
Be sure to set the same time zone and daylight saving
time settings on the PC running the GA10 server, the PC
running the GA10 client, and the data collection devices.
If they are not the same, data time may not be displayed
correctly.
4.9.2 Error Data
If collected or recorded data is in error, it is displayed
or recorded using indications other than values. For the
different types of error data, see “Data that indicates
errors.”
• Data Display in a Digital Monitor Set or Meter
Monitor Set
Display Data Condition
+OVER +OVER
–OVER -OVER
INVALID INVALID
BURNOUT BURNOUT
ILLEGAL ILLEGAL
LACK LACK
OFF OFF
* See “Data that indicates errors.”
• Display in the Trend Monitor Set
Waveform Cursor Value Data Condition
Drawn exceeding the
scale upper limit
Drawn exceeding the
scale lower limit
Nothing INVALID INVALID
* See “Data that indicates errors.”
+OVER +OVER
-OVER -OVER
BURNOUT BURNOUT
ILLEGAL ILLEGAL
LACK LACK
(blank) OFF
• Data in Recording Data Files
Data in Binary Data
Files
+OVER +OVER +OVER
–OVER –OVER -OVER
INVALID INVALID INVALID
BURNOUT BURNOUT BURNOUT
ILLEGAL ILLEGAL ILLEGAL
LACK LACK LACK
OFF OFF OFF
* See “Data that indicates errors.”
Data in Excel Data
Files
*
Data Condition
*
*
• Data That Indicates Errors
The following table shows the different types of data
that indicates errors.
Data Description
+OVER +Over-range data
–OVER -Over-range data
SKIP Channels that have been set to skipped
INVALID Invalid data
The data type and decimal place specified on
the Tag Setting Page do not match those of the
collected data.
BURNOUT Burnout data
ILLEGAL Illegal data
LACK Indicates that the device failed to acquire the data
OFF Indicates one of the following conditions.
• Data collection has not been performed since
the project was opened.
• Channels are not assigned to tags.
• When the data time is set to PC time, the
collected data is SKIP data.
• Communication error condition
• Initialized condition as a result of changing the
Device Setting Page or Tag Setting Page while
data collection is stopped
• An attempt was made to collect data from a
device using the backfill function, but there is
no data recorded in the device.
4.9.3 Reflecting Changes Made on the Monitor
Page to the Setting Page
If the access privilege is Owner or Manager, changes
made to the following settings on the Monitor Page are
reflected on the corresponding Setting Page (Display
Group or Acquisition & Monitor). If the access privilege is
Operator or Monitor, the changes are not reflected.
• Monitor Set size adjustment
• Waveform display on/off state, Y-axis display on/
off state, Detail/Compact, Zoom in/Zoom out, and
movement in the Trend Monitor Set
• Trip line position
4.9.4 Changing the Time on the Device after Starting Data Collection and Recording
Do not change the time on the device after starting data
collection and recording, because doing so will cause
adverse effects on the monitor screen and recorded data.
Related topic “Changes to devices during data
collection and recording”: Q11
4-12
IM 04L65B01-01EN
Page 75

Transmission date and time
Chapter 4 Monitoring Data Collection
×
4.10 Viewing the Log
You can view the log that the server sends in the Log
dialog box. You can open the Log dialog box at any time
when you are logged in to the server. The dialog box stays
open until you close it.
4.10.1 Displayed Content in the Log Dialog Box
Up to 1000 log events that occur from when the user logs
in to the server until the user logs out are displayed.
There are two types of logs: system log (displayed in
yellow), which deals with the server, and project log
(displayed in blue), which deals with projects.
System log includes events such as server login and
logout. Project log includes data collection start and stop.
System logs are sent to all users. Project logs are sent to
users that have the projects opened.
4.10.2 Opening the Log Dialog Box
On the View menu, click Log. The log dialog box opens.
Filter
Log list
Most recent log entry
• Transmission Scope
Indicates the log transmission scope
Icon Description
Sent to all users (system log).
Set the Filter to Log to display the corresponding log.
Sent to users that that have the relevant projects
opened (project log).
Set the Filter to project to display the corresponding log.
• Source
SYS or the project name
• Sent Information
The log information
• Log Number
The number of the log event.
• Jump Icon
Displayed when there is a page associated with the log
event. Clicking the icon shows the relevant page. For
example, if you click the icon for a “recording started”
event, the corresponding project’s Monitor Page will be
displayed.
To close the log dialog box, click the
icon in the upper
right.
• Filter
The events that correspond to the filter box that you
clicked and turned blue appear. For details, see
“Transmission scope.”
• Log List
The log events are displayed in the order of
occurrence. If there are events that do not fit in the
dialog box, a scroll bar appears.
Transmission scope
Source
Sent information
Jump icon
Log number
• Most Recent Log Entry
This line always displays the most recent log entry.
• Transmission Date and Time
The date and time when the log was transmitted.
IM 04L65B01-01EN
4-13
Page 76

Blank
Page 77

1
2
3
4
Chapter 5 Managing Recording Data
5.1 Displaying a List of Data Files
Click the Data files Page icon on the Project tab to
display the Data File List Page.
Project tab
Data files Page icon
5.1.1 Displayed Content
The data files in the data file save destination directory are
listed. Only data files saved in binary format are displayed.
Data files saved in Excel format are excluded.
• Showing Files in Link View
Click the Show Files in Link View to turn the box
blue. Files are linked from the start of recording to the
end of recording and displayed in one line. Clicking
the box again to turn it to white returns the page to the
individual file display.
• Deleting Files
1
Click the file you want to delete.
Selecting multiple consecutive files
Example: Selecting consecutive files: File005, File006,
and File007
• Click File005. Drag to File007, and release the
mouse button.
• Click File005 to select it. While holding the Shift key
down, click File007.
2
Click Delete.
A conrmation dialog box appears.
3
Click OK.
The les are deleted.
5
Managing Recording Data
• Showing and Hiding Columns
If you move the pointer over a column title, a hide icon
appears. Click it to hide the column. When you hide a
column, a show icon will appear in the upper right of
Item Displayed Content
File Name Name of the data file
Data Number Number of data values in the data file
The total number of data values if files are
Recording
Interval
Start Time The time of the first data value in the data file
End Time The time of the last data value in the data file
File Size Data file size
Comment 1 Title and content of Comment 1 to 8 that were
Comment 2
Comment 3
Comment 4
Comment 5
Comment 6
Comment 7
Comment 8
* Does not include the values of deleted files and other files that
do not exist
linked and displayed
Recording interval used to create the data file
The time of the first data of the entire data if
files are linked and displayed
The time of the last data of the entire data if
files are linked and displayed
The total data size if files are linked and
displayed
specified when the file was created
*
*
*
*
the page. Click this icon to show the hidden columns.
Hide icon
Show icon
The results of showing and hiding columns apply to
every project in the same client.
• Adjusting Column Widths
When you move the pointer near a boundary of
a column title, the pointer changes to
. In this
condition, drag the pointer to move the boundary to the
desired position. The results of adjusting column widths
apply to every project in the same client.
IM 04L65B01-01EN
5-1
Page 78

,
Chapter 5 Managing Recording Data
• Sorting the File List
Click a column title to sort the file list on the basis of the
clicked column. Click it again to sort in reverse order. A
sort mark (
• Refreshing the Display
On the View menu, click Refresh.
The most recent file information is retrieved from the
server, and the page is refreshed.
) appears in the column title area.
5.2 Displaying Recording Data
Recording data can be displayed in Universal Viewer.
1
Select the file you want to view.
You can select multiple link les.
2
Click Open.
Universal Viewer starts, and the data in the le is
displayed.
You can also double-click the file to open it.
For instructions on how to use Universal Viewer, see the
Universal Viewer User’s Manual.
5-2
IM 04L65B01-01EN
Page 79

1
2
3
4
5
Chapter 6 Managing Users
6.1 Administrator and Users
In GA10, you can set server access privileges.
There are two types of server access privileges: administrator and user. The administrator
manages all users. The administrator can perform the following operations in addition to all
the operations available to users.
• Register users
• Delete users
• Initialize user passwords
• View the login status of users
The following sections explain how to use the User Management Page.
Registration
Server
New user
Administrator
View
User management
User A
Logged in
Delete
Initialize password
User B
Note that at the GA10 project level, users can be assigned one of four project access
privileges: Owner, Manager, Operator, and Monitor. These privileges are assigned for each
project using Details Settings mode.
For details, see page 3-28.
Not logged in
View
User D
Logged in
ViewView
User C
6
Managing Users
IM 04L65B01-01EN
6-1
Page 80

Chapter 6 Managing Users
6.2 Managing User Status
6.2.1 Using the User Management Page
The administrator can view the status of other users on
the User Management Page.
1
Start the client, and log in to the server with GA10
administrator privileges.
2
On the View menu, click User Management Page.
Or, click the
The User Management Page appears.
icon.
6.3 Changing User Information
This section explains how to change the user full name
and password. This procedure can also be performed by a
user who is logged in.
6.3.1 How the Administrator Changes Other
User Information
The administrator performs the following procedure to
change the full name and initialize the password of a user.
1
Follow steps 1 and 2 in section 6.2 to display the
User Management Page.
2
Select the user you want to change.
The user is selected.
The frame turns blue when selected.
3
Double-click the selected user.
The Change User’s Information dialog box opens.
4
To change the full name, type the new name.
To initialize the password, click Initialize.
Type in this box to change the full name.
3
Check the user status by looking at the icons (see
below).
Not logged in
Logged in
Number of users logged in
Appears in blue when logged in
6-2
Click here to initialize the password.
5
Check the information, and click OK.
The full name or password will be changed.
Note
You cannot change the information if the applicable user
is logged in or if the user has been deleted from another
client.
IM 04L65B01-01EN
Page 81

Chapter 6 Managing Users
6.3.2 How Users Change Their Information
The following example shows how the administrator or a
user changes his or her full name and password.
1
Start the client, and log in to the server.
The Project List Page appears.
2
On the User menu, click Change Information.
The Change User’s Information dialog box opens.
3
Change the full name or password, view the
changes, and click OK.
To change the password, type the current and
new passwords.
6.4 Registering and Deleting Users
Only the administrator can register and delete other users.
6.4.1 Registering a New Users
1
Start the client, and log in with the administrator
account that you created earlier.
2
On the View menu, click User Management Page.
Or, click the
The User Management Page appears.
3
On the User menu, click Register New User.
The Change User’s Information dialog box appears.
4
Type the user name and user full name that you
want to register.
Enter a name that is easy for the administrator
to identify.
icon.
Note
• You can change the full name and password
simultaneously.
• Enter the password using 4 to 30 alphanumeric
characters..
The default values of the settings in the Change User's
Information dialog box are shown below.
Item Initial value
Full Name User full name before change
Password Nothing is displayed.
New Password Nothing is displayed.
Confirm New Password Nothing is displayed.
IM 04L65B01-01EN
5
Check the entered information, and click OK.
The user is registered, and an icon is added in the
window.
6-3
Page 82

Chapter 6 Managing Users
6.4.2 Deleting a User
You cannot delete a user that is logged in.
We recommend that you check the user access privileges
before deleting the user.
1
Follow steps 1 and 2 in section 6.2 to display the
User Management Page.
2
Select the user you want to delete.
The user is selected.
3
On the Edit menu, click Delete.
Or, click the
A warning message appears.
4
To proceed, click OK.
The user will be deleted.
icon.
Change Project’ s Owner dialog box
4
From the New Owner list, select a user.
Any user registered in the server can become a
project owner.
6.4.3 Changing a Project Owner
If you delete an owner user
If the administrator deletes a user, the access
privileges granted to the user is lost. If the deleted user
had been a project owner, the project will no longer
have any owner. This condition is displayed as follows.
Displays a dash when there is no owner.
To change a project owner (specify a new owner),
follow the procedure below.
Note
Only the owner of the relevant project or the administrator
can change the owner.
1
Display the Project List Page.
On the View menu, click Project List Page. Or,
click the
2
Select the project you want to change.
icon.
Select a new owner.
5
After selecting the new owner, click OK.
The owner will be changed.
6.4.4 Opening a Project at a Specific Privilege
Level
A user assigned to a project can open the project at a
privilege level that is lower than the assigned privilege
level.
1
Display the Project List Page.
2
Select a project.
3
On the Project menu, click Open with Specified
Permission.
An Open with Specied Permission dialog box appears.
3
On the Project menu, click Modify Owner.
A Change Project’s Owner dialog box appears.
6-4
IM 04L65B01-01EN
Page 83

4
Select the privilege level that you want to use to
open the project.
You can select any level up to your assigned level.
The following figure is an example of a user who
is assigned the Manager level. The user cannot
select the Owner level, because it is higher than the
Manager level.
5
Click OK.
The dialog box closes, the Project Page appears.
Note
Only the operations allowed at the specified privilege
level can be used in the project. However, if the project
is locked, users other than the user who applied the lock
can only access the project at the Monitor level.
6.4.5 Unlocking a Project by Force
The administrator can only unlock locked projects.
1
On the Project List Page, select the locked project.
Chapter 6 Managing Users
3
To proceed, click OK.
The dialog box closes, and the name of the user
who locked the project disappears from the project.
Locked project
Displays the user
who locked the project
2
On the Project menu, click Unlock Project
Forcibly.
A conrmation message for unlocking appears.
IM 04L65B01-01EN
6-5
Page 84

Blank
Page 85

1
2
3
4
5
6
Chapter 7 Troubleshooting
7.1 Messages That GA10 May Display
Messages may appear on the screen during operation. This section describes the messages and how to respond to
them.
Messages
Code Message Description and Solution
M1001 OK to switch to detail setting mode? Unavailable to
back to simple setting mode.
M1002 Do you want to start the monitoring all at once? -----M1003 Do you want to stop the collecting all at once? -----M1004 Do you want to start the recording all at once? -----M1005 Do you want to stop the recording all at once? -----M1006 Do you want to stop the recording? -----M1007 Do you want to log out? -----M1008 Do you want to enforce to be unlock? This is a message that asks the administrator to confirm the unlocking
M1009 Do you want the user(%s)'s password to be initialized? This is a message that asks the administrator to confirm the
M1010 Trial version is time up, operation is prohibited. This message appears when a client accesses the server after the
M1011 Successed in Activation. This message indicates that the client license has been registered
M1012 Server is activated. Please restart server. After the server license registration is complete, the server needs to be
M1013 Option is added to server. Please restart server to
enable option.
M1014 Is it OK to exit? This message asks whether you want to close the client.
M1015 Device structure changed. OK to perform auto-
assignment of tag and display group information?
M1016 OK to update the selected device's channel
information? (Updated tag information will appear in
the tag settings screen.)
Warning Messages
Code Message Description and Solution
W2001 Do you want to delete this user(%s)? This message asks whether you want to delete the registered user. xxx
W2002 Do you want to delete this device(%s)? This message asks whether you want to delete the device from the
W2003 Do you want to delete this data file(%s)? This message asks whether you want to delete the data file from the
W2004 Do you want to delete the Project(%s)? This message asks whether you want to delete the project. xxx
W2005 The release number(%s)of handled meters is out of
support.
Error Messages
Code Message Description and Solution
E3001 Unable to connect to the specified server. Check for problems in the communication path to the server and IP
E3002 Login failed. Please confirm the user name or the
password.
E3003 Connected clients has reached maximum, you can not
log in.
------
of the locked project.
initialization of a user password. xxx indicates the name of the user
whose password will be initialized.
server trial period has expired.
successfully.
restarted.
After an option is added to the server, the server needs to be restarted.
This message asks whether you want to initialize the tag and display
group information and automatically assign tags to display groups
when the Devices List information is updated.
This message asks whether you want to update the device channel
information. If you click OK, GA10 will access the selected device,
retrieve its channel information, and reflect the information on the Tag
Setting Page.
indicates the name of the user that will be deleted.
Devices List on the Device Setting Page or the Registered Devices
List. xxx indicates the name of the device that will be deleted.
Data files Page. xxx indicates the name of the data file that will be
deleted.
indicates the name of the project that will be deleted.
The release number of the device is not supported. Thus, proper data
collection cannot be guaranteed. Consider updating the firmware or
using a supported device.
For the supported models and versions, See the General
Specifications (GS 04L65B01-01EN).
address and port number settings.
If you cannot connect to the server, stop the server firewall, or register
DFMServer.exe and DLGServer.exe as exceptions in the server firewall
configuration.
GA10 is connected to the server, but the user information for logging
in is not correct. Check the user name and password that you have
entered.
Wait for the other client to log out.
7
Troubleshooting
IM 04L65B01-01EN
7-1
Page 86

Chapter 7 Troubleshooting
Code Message Description and Solution
E3004 Unable to connect to the server. Check for problems in the communication path to the server.
E3005 The user name already exists, the user can not be
registed.
E3006 The password is incorrect. The password that you entered for changing the password is incorrect.
E3007 Please enter at least four characters for the password. Enter 4 to 30 characters for the password.
E3008 The new password and the comfirmed password does
not match.
E3009 You can not delete the logged user. Delete the user after the relevant user logs out.
E3010 Users to change is logged into the server. The basic
information can not be changed.
E3011 User to be initialized is logged in to the server, user
can not be initialized.
E3012 The maximum number of logins has been reached, the
user can not log in.
E3013 Since the Project name you entered already exists, the
project can not be created.
E3014 Since the Project name you entered already exists,
you can not change it.
E3015 The Project which is opening, can not be deleted. Delete the project after closing the relevant project.
E3016 The Project which is running, can not be deleted. Delete the project after stopping the relevant project.
E3017 The maximum number of registered devices has been
reached ,the device cannot be registered.
E3018 The equipment in use can not to be removed. The device that you want to delete is being used in a project. Check
E3019 Original owner is opening projects, you cannot change
the owner.
E3020 Server can not receive device information. Check the information for accessing the device and the communication
E3021 Fail to create record folder. The specified drive does not exist. Change the data file save
E3022 Failed to start Universal Viewer. Check whether Universal Viewer is installed in the PC.
E3023 An error occurred while reading the file. Failed to load the file when importing a project or tag information.
E3024 An error occurred while writing the file. Check that the export destination folder is not set to read-only and that
E3025 User manual does not excit in the specified location. Place the PDF manuals in the client installation folder.
E3026 Failed to start Adobe Reader. Check whether Adobe Reader is installed and the version.
E3027 Simultaneous running projects has reached the
maximum number, failed to start monitoring.
E3028 Because the maximum concurrent number of
connected devices is reached, collecting cannot start.
E3029 Because the maximum device number that can be
registered is reached, the Project can not be created.
E3030 Because the maximum number of open projects is
reached, the project cannot be opened.
E3031 Failed to delete data file. Another client may be using the data file that you want to delete.
E3032 Failed to open data files. Update the information on the Data files Page, and check that the
E3033 Fail to launch web browser. A Web browser may not be installed.
E3034 Operation failed because there is no right to access
Project.
E3035 Operation failed because the target user does not
exist.
E3036 Fail to import project because registed devices reach
the maximum number.
E3037 Project is closed, because Project lock status is
released forcibly.
E3038 Operation failed because the project is locked by
another user.
E3039 Specified new owner does not exist, you can not
change the owner.
A user with the same name is already registered. Check the user
name, and register with a different name.
Check the current password, and re-enter it.
Enter the new password and confirmation password so that they
match.
Modify the basic information after the relevant user logs out.
Initialize the user after the relevant user logs out.
Delete registered users first, and then register additional users.
A project with the same name is already registered. Check the project
name, and register with a different name.
A project with the same name is already being used. Check the project
name, and change to a different name.
Delete any of the devices registered in the server first, and then
register the new device.
that the device is not being used in another project. Delete the device
from the Devices List on the Device Setting Page of other projects, and
then delete the device.
When the administrator tried to change the owner of a project, the
current owner had the project opened. Change the owner after the
current owner closes the project.
path between the server and device.
destination folder.
Check that the file for importing is correct.
there is enough free disk space.
The number of running projects in the server has reached the
maximum number. Stop data collection in other projects.
Data collection cannot be started because the maximum device
connections will be exceeded. Stop data collection in other projects or
change the data collection device.
Delete any of the registered projects first, and then register the new
project.
The number of projects that the client has opened has reached the
maximum number. Close any of the opened projects.
relevant data file exists.
Ask the project owner to grant project access privileges.
The user may already have been deleted. Update the information on
the User Management Page, and check whether the user exists.
Delete unneeded devices from the Registered Devices List.
To use the project, open it again.
Use the project after the project is unlocked.
The user may already have been deleted. Set the new owner to an
existing user.
7-2
IM 04L65B01-01EN
Page 87

Chapter 7 Troubleshooting
Code Message Description and Solution
E3040 Operation failed because Project is deleted. The project may already have been deleted. Update the information on
E3041 Serial no is invalid. Activation failed. Check the license number, and enter it correctly.
E3042 Server has not been activated. Adding option to
software failed.
E3043 Tag upgrade option's serial no is invalid. Fail to add
option's serial no.
E3044 Part of the data files can not be deleted. Some of the data files that you tried to delete could not be deleted.
E3045 Part of the data files can not be opened. Some of the data files that you tried to open could not be opened.
E3046 Failed in registration.The administrator authority is
required.Please restart as an administractor or run as
administrator and restart.
E3047 Insufficient memory available to the OS. Operation
failed.
E3048 Since the number of tags in the imported project
configuration information exceeded the number of tags
supported by the current server,failed to import.
E3049 Failed to operate some projects or all project at once. If Start Monitoring Simultaneously cannot be executed, it could be any
E3050 Insufficient memory available to the OS. Project will
close.
E3051 Fail to start monitoring because the necessary setting
is not correct.
E3052 Operation failed because device has been deleted. Update the device information on the Registered Devices List.
E3053 Searching is not allowed because auto-search in
progress.
the Project List Page, and check that the project exists.
Register the server license first, and then add options.
Adding the option would cause the number of tags to exceed the
maximum recording tags in the project. In the server information dialog
box, check the current number of tags, and check whether the option
that you tried to add is appropriate.
They may be in use.
Update the information on the Data files Page, and check that the data
files exist.
Log on again as a Windows administrator. Or, choose Run as
administrator when starting Data Logging Software. (In Windows 7,
right-click the software icon, and click Run as administrator.)
Try the following:
• Stop other running programs.
• Reduce the number of simultaneously running projects.
• Increase the PC RAM.
• If you are using a 32 bit edition, try a 64 bit edition.
The number of tags in the project that you are trying to import exceeds
the number of tags handled by the current server. Consider increasing
the number of tags handled by the server.
of the following reasons.
• The number of simultaneously running projects or simultaneously
connected devices exceeds the limit.
• There is not enough available memory on Windows.
If Start Recording Simultaneously cannot be executed, it could be any
of the following reasons in addition to the reasons listed above.
• The data save destination folder failed to be created.
Close projects that do not require data collection. To start recording,
change the data file save destination folder.
Try the following:
• Stop other running programs.
• Reduce the number of simultaneously running projects.
• Increase the PC RAM.
• If you are using a 32 bit edition, try a 64 bit edition.
There is an error in the information that is used during data collection.
Check for errors in Modbus device definition files.
Another client is searching devices with different search conditions.
Wait for the search operation to complete, and try searching again.
IM 04L65B01-01EN
7-3
Page 88

Chapter 7 Troubleshooting
7.2 Frequently Asked Questions (FAQ)
Q1 Can the server and client be installed and run in the same PC?
A1
Yes. The server and client can be installed in the same PC or in different PCs.
Q2 Is there a way to back up the recording data files automatically?
A2
You can use the mail transmission feature to send generated data files as email
attachments. You can store the data files as back up in the device receiving the email
messages.
Q3 The communication between the server and a data collection device
was interrupted and then restored. How does the server behave when
communication is restored?
A3
Resuming data collection and recording
The server will retry to connect approximately every 30 seconds. When reconnection is
successful, the server resumes data collection and recording.
Recording data
The way that the server handles recording data when communication is restored varies
depending on whether data is being collected in PC time or device time.
• If data is being collected using PC time
The data during which communication was not possible will not be recorded.
• If data is being collected using device time
After communication is restored, the server prioritizes the collection of data that can be
gathered in real time through communication. Then, the server collects data that could
not be collected from devices and fills the missing data in the recorded data files. This
function is called backfill. Backfill only works when the necessary conditions are met. If
the conditions are not met, the data during which communication was not possible will
not be recorded. See Q4.
7-4
Q4 How does backfill work?
A4
When a communication error occurs between a server and device, data dropout occurs in
the data file that the server is recording. Backfill is a function that fills the dropped data in the
recording file by retrieving the missing data from the device after the system recovers. Data
is retrieved automatically from the device when the following conditions are met.
Operating conditions
On the GA10 side
• Applicable data: Binary data (Excel data is not included)
• Data time is set to Device time.
On the connected device side
• Applicable devices: GX10, GX20, GP10, GP20, DX1000, DX2000, DX1000N,
DX1000T, DX2000T, MV1000, MV2000
• Internal memory contains the event data file corresponding to the data loss location.
• The recording interval of the event data file is the same as the acquisition interval of
the device.
• FTP transferring of files is enabled.(FTP server function: ON, Port number: 21)
• The multi batch function is not in use.
IM 04L65B01-01EN
Page 89

Chapter 7 Troubleshooting
When the communication interference is eliminated, the backfill function operates
automatically. The restored data is saved as a new file, and you can view it on the Data files
Page. Marks that indicate that backfill has been performed are added to the beginning and
end of the restored section of the data.
In the case of a short communication interference,* data loss may be restored even when
the above settings are not specified. In such a case, GA10 does not create a new file but
writes directly to the recording file.
* The length of interruption time that makes this operation possible varies depending on the
connected device.
Note the following points.
• Handling of files collected by backfilling
Files collected by backfilling are the same as normal data files except for the point given
below.
• The file division conditions specified on the recording setting page do not apply.
Therefore, the files may become larger than normal data files.
• Other information
• Backfill is not performed if a communication error or other error had occurred at
the start of recording.
• If a backfill operation cannot start due to a device access failure or other reason,
GA10 will access the device every hour.
• If the server stops during a backfill operation, the operation will stop. Even if the
server is restarted, the previous backfill operation will not be performed.
• If any of the following settings on the device is changed after starting data
collection, backfill will not be performed.
Acquisition interval, time, channel on/off, decimal place, unit, span (scale), alarm
on/off, alarm type, and alarm value
Q5 The server stopped or the server PC shut down and then restarted.
How does the server operate after it restarts?
A5
Server recovery
The server retains the most recent status information just in case the host PC shuts down.
When the PC restarts, the server recovers the operation based on the status information.
Resuming data collection and recording
The server resumes data collection and recording after it restarts unless the user had
manually stopped the server or shut down the host PC.
Recording data
See A3.
IM 04L65B01-01EN
7-5
Page 90

Chapter 7 Troubleshooting
Q6 A communication error occurred between the client and server. Will
Q7 Unable to control the project. Why?
data collection continue?
A6
Because data collection is performed between the server and data collection devices, the
operation continues even when a communication error occurs between the client PC and
server PC.
When a communication error occurs between the client PC and server PC, the client logs
out from the server. The project that was open is closed. In this situation, if data collection
was in progress and the project’s Keep Lock State was set to ON, the project will remain
locked.
To control the project before the communication recovers, perform either of the procedures
below from a client on another PC using the same project.
• Open the project using the same user.
• Log in as an administrator. On the Project menu, click Unlock Project Forcibly to unlock
the project.
A7
Below are possible reasons.
• The user is not assigned privileges to control the project. → Open the project using a user
who has privileges to control the project, such as Owner, Manager, or Operator.
• The project is locked. → If an owner, manager, or operator user is logged in, the project
is locked. Other users can only monitor the project. Wait until the other user using the
project closes it.
• The project is locked. → If data collection is in progress and the project’s Keep Lock
State is set to ON, the project remains locked even when an owner, manager, or operator
closes the project. To control the project, perform either of the following procedures.
• Ask the user who locked the project to unlock the project.
• Clear the Keep Lock state.
Q8 I forgot the user password. What do I do?
A8
If the administrator password is lost, there is no recovery method. Contact your nearest
YOKOGAWA dealer.
If a user password is lost, the administrator can initialize the password. Then, the user can
log in with the initialized password (blank) and set a new password.
7-6
IM 04L65B01-01EN
Page 91

Chapter 7 Troubleshooting
Q9 The device data and the data collected and recorded by the software
are not synchronized. Why?
A9
Data collected using Device time is recorded as-is by the software. In this situation, the
device data and the collected and recorded data are synchronized.
However, data collected using PC time are timestamped with the PC time and the values are
adjusted accordingly. In this situation, the device data and the collected and recorded data
based on PC time may not be synchronized.
Q10 Can the recorded data be printed?
A10
Data files can be printed using Universal Viewer. Universal Viewer is supplied with this
software and installed along with this software.
Q11 Device settings were changed. At what point are the changes applied
to data collection?
A11
Changes to devices before data collection is started
This software retrieves device information when the device is registered to the Device List. If
this information is different from the actual device information at the start of data collection,
the software will collect data but will handle it as invalid data.
Check the following settings and match them.
Channel data type, unit, span, decimal place, alarm type, and alarm value
You can use Update Setting on the Device List to update the settings.
Changes to devices during data collection and recording
If you change the device settings during data collection and recording, the changes will not
be reflected to the software. Stop the data collection, apply the setting changes using either
of the methods below, and restart the data collection.
• Execute Update Setting of the devices in the devices List.
• Register the device again.
However, if data is being collected using Device time and you change the device’s
acquisition interval, the software will reset the entire monitor data, restart monitoring, and
stop recording.
Do not change the time on the device after starting data collection and recording, because
doing so will cause adverse effects on the monitor screen and recorded data.
Q12 What is the difference between setting the Data time to PC time and
setting the Data time to Device time?
A12
For information on the different data collection conditions, see also “Setting Data
Collection Conditions” on page 3-18.
The following table summarizes the major differences. For a detailed explanation, see the
following pages.
Differences
Mode
PC time
Device time
Description Backfill
Time on the
server PC
Time on the
device
No Select from
Yes
(fills
dropped
data using
data on the
device)
Collection and
Record Interval
available
options
The interval on
each device is
used, so it is
not possible to
specify a single
interval.
Trend Monitor Alarm Overview
No display limitations because all
the data can be displayed on the
same time axis.
If there are
multiple devices
with different
times or scan
intervals,
Monitor Sets
are subdivided
to display each
combination of
device and scan
interval..
Display
The page is
subdivided and
a list is displayed
for each device.
Saved Data Files
Data can be
saved to a single
file.
Files are divided
by a combination
of device and
scan interval.
IM 04L65B01-01EN
7-7
Page 92

Chapter 7 Troubleshooting
What is PC time?
PC time is the time information that the server PC uses. In PC time mode, the server
attaches PC timestamps on the data collected from devices. This data is displayed on the
Monitor Page and saved in recording files.
• Data collected using PC time will not necessarily be synchronized to the data of the
corresponding devices.
Q9
• The timestamps attached to data in PC time mode are determined so that data collection
would always occur at midnight (00:00:00).
• The data collection interval and record interval are specified on GA10.
• The data of all tags is saved to the same file.
What is Device time?
Device time is the time information that the data collection device uses. In Device time
mode, the server collects and records data at the data acquisition intervals of devices. If
there are multiple acquisition intervals in a single device, data is collected and recorded at
each acquisition interval. Device data and collected data are synchronized (the values and
timestamps match).
• Data collection and recording
• Data is collected separately for each device and for each data collection interval.
• Data is collected and recorded at the devices’ data acquisition intervals. You cannot
specify the data collection interval or record interval on GA10.
• Data is saved to separate files for each device and for each data acquisition interval.
Tags for device A and device BPC time
Data
file
Device time
Device A Device B
Collection
intervals
A1 and A2
Tag for device A,
collection interval A1
Data
file
Server
Collection
interval
B1
Tag for device A,
collection interval A2
Data
file
Tag for device B,
collection interval B1
Data
file
The device number, device name, and device acquisition interval are included in the
names of data files. Below is the file name format when date and time are included.
FileName-DeviceNo-DeviceName-Interval-YYYYMMDDhhmmss.ext
FileName: The file name string specified by the user
DeviceNo: Device number on the Device Setting Page
DeviceName: Device name on the Device Setting Page
Interval: The acquisition interval of each device
7-8
IM 04L65B01-01EN
Page 93

Chapter 7 Troubleshooting
• Monitor
The trend monitor displays data based on a single time axis. If there are multiple devices,
the Monitor Set will be divided and waveforms in the display group will be displayed in
windows divided at the interval level. Only up to four divided windows can be displayed.
Anything in excess will not be displayed.
A similar behavior will also occur in alarm lists. The page will be divided, and the lists will
be displayed separately at the device level.
• Filling data dropouts
If data collection is set to Device time mode, the backfill function can be used.
What is the backfill function? Q4
• Mail transmission function
In the email transmission based on alarm occurrence and release, the software monitors
relevant tags for each device and for each data collection interval to transmit email.
In the email transmission based on the specified period, the software sends email for
each device and for each data collection interval.
In the email transmission based on the specified duration, the software calculates the
duration and sends email for each device and for each data collection interval.
IM 04L65B01-01EN
7-9
Page 94

Blank
 Loading...