

Page 1

TM 262
TM 262
™
Auto Tymp
Operating Instruction Manual
April, 2008
Part Number 1738-0101 Rev 08
Page 2

Page 3

Electromagnetic Compatibility (EMC)
Electromagnetic compatibility (EMC)
Please refer to the Electromagnetic Compatibility Reference Guide on CD (part number 482-6387xx)
for EMC information concerning your system.
Compatibilité électromagnétique (CEM)
Veuillez vous reporter au guide de référence de compatibilité électromagnétique sur CD
(numéro de pièce 482-6387xx) pour des informations sur la CEM relatives à votre système.
Elektromagnetische Verträglichkeit (EMV)
Informationen über die EMV des Systems finden Sie im Referenz-Handbuch
Elektromagnetische Verträglichkeit auf der CD (Teilenummer 482-6387xx).
Compatibilità elettromagnetica (EMC)
Vedere la guida alla consultazione per la compatibilità elettromagnetica contenuta sul CD (numero di
parte 482-6387xx) per informazioni sulla compatibilità elettromagnetica relativa al sistema in dotazione.
Compatibilidad electromagnética (CEM)
Consulte la Guía de referencia sobre compatibilidad electromágnetica incluida en el CD (número
de pieza 482-6387xx) para obtener la información sobre la CEM de su sistema.
Prefix
Revised 4/11/08 a
Page 4

TM 262
Warranty
Welch Allyn, Inc. warrants the TM 262 Auto Tymp, to be free of original defects in
material and workmanship and to perform in accordance with manufacturer’s
specifications for a period of one year from the date of purchase. If this instrument or
any component thereof is found to be defective or a variance from the manufacturer’s
specifications during the warranty period. Welch Allyn will repair, replace or
recalibrate the instrument or component(s) at no cost to the purchaser.
This warranty only applies to instruments purchased new from Welch Allyn or its
authorized distributors or representatives. The purchaser must return the instrument
directly to Welch Allyn or an authorized TM 262 distributor or representative and
bear the costs of shipping.
This warranty does not cover breakage or failure due to tampering, misuse, neglect,
accidents, modification or shipping, and is void if the instrument is not used in
accordance with manufacturer’s recommendations or if repaired or serviced by other
than Welch Allyn or a Welch Allyn authorized representative.
No other express or implied warranty is given.
Return of the instrument registration card is required for proof of purchase and
warranty validation.
Service and Repair
Repair must be performed by authorized personnel. Failure to do so invalidates the
TM 262 Auto Tymp warranty.
For customers in North America or Canada, please contact Welch Allyn for
information regarding where to return your TM 262 Auto Tymp for service.
Technical Service Department Technical Service Department
Welch Allyn, Inc. Welch Allyn, Inc.
4341 State Street Road 160 Matheson Boulevard, East
Skaneateles Falls, NY 13153-0220 Mississauga, Ontario, Canada L4Z 1V4
Tel: 1-800-535-6663 (in U.S.A. only) Tel.: 1-800-561-8797 (in Canada only)
b Revised 4/11/08
Page 5

Table of Contents
Electromagnetic Compatibility (EMC)....................................................................................a
Warranty.....................................................................................................................................b
Service and Repair.....................................................................................................................b
Introduction 1
Introduction............................................................................................................................ 1-3
Tympanometry and Gradient ................................................................................................... 1-5
Gradient ................................................................................................................................... 1-6
Screening acoustic reflex ......................................................................................................... 1-7
Manual audiometry.................................................................................................................. 1-8
Recycling / disposal ................................................................................................................ 1-9
Glossary of terms ................................................................................................................. 1-10
Installation 2
Unpacking and Inspection..................................................................................................... 2-3
Probe Indicators ..................................................................................................................... 2-4
Front Panel Controls and Indicators ................................................................................... 2-5
Printer and Display................................................................................................................ 2-7
Rear and Bottom Panel Labels and Connectors................................................................. 2-9
Initial set-up.......................................................................................................................... 2-10
Loading the paper .................................................................................................................. 2-10
Paper storage...........................................................................................................................2-11
PreTest Tymp checks ........................................................................................................... 2-12
Calibration ............................................................................................................................. 2-12
Altitude adjustment ................................................................................................................ 2-13
Pre-Test Audiometric Checks (Models with Audiometer only)....................................... 2-15
Noise recovery period............................................................................................................ 2-15
Elimination of ambient noise................................................................................................. 2-15
Biological Check................................................................................................................... 2-16
Operation 3
Preventive Maintenance ........................................................................................................ 3-3
Cleaning the system................................................................................................................. 3-3
Eartip care.............................................................................................................................. 3-3
Probe care ............................................................................................................................... 3-4
Probe nose cone cleaning......................................................................................................... 3-4
Earphone Care (Models with Audiometry only)................................................................. 3-7
Paper supply........................................................................................................................... 3-7
Tympanometry testing information ..................................................................................... 3-8
Helpful hints ............................................................................................................................ 3-8
Revised 4/11/08 i
Page 6

TM 262
Obtaining a seal ....................................................................................................................... 3-8
Audiometry testing information ......................................................................................... 3-10
Instructing the patient/subject ................................................................................................ 3-10
Placement of earphones ......................................................................................................... 3-10
Response handswitch (optional accessory)............................................................................ 3-10
Program Mode ......................................................................................................................3-11
Reflex format ..........................................................................................................................3-11
Print header format ................................................................................................................ 3-12
Audiometric format during printing ...................................................................................... 3-13
Normal box format................................................................................................................. 3-14
Audiogram range ................................................................................................................... 3-14
Exiting the program mode ..................................................................................................... 3-14
Tympanometry/Reflex Test Sequence ................................................................................ 3-15
a. Tympanometry only mode ................................................................................................. 3-15
b. Tympanometry and Ipsilateral Reflex................................................................................ 3-16
c. Programming ipsilateral acoustic reflex test frequencies .................................................. 3-18
Exit tympanometry/reflex ...................................................................................................... 3-18
Audiometry Test Sequence (Models with Audiometer only) ........................................... 3-19
Screening audiometry ............................................................................................................3-21
Threshold audiometry............................................................................................................3-21
Exit audiometry...................................................................................................................... 3-22
Tests in memory ................................................................................................................... 3-23
Memory erase ........................................................................................................................ 3-23
Printing test results................................................................................................................. 3-24
Test Results 4
Ear Canal Volume.................................................................................................................. 4-3
Normal ..................................................................................................................................... 4-3
Abnormal ................................................................................................................................. 4-3
Compliance Peak.................................................................................................................... 4-3
Normal ..................................................................................................................................... 4-3
Abnormal ................................................................................................................................. 4-3
Pressure Peak ......................................................................................................................... 4-4
Normal ..................................................................................................................................... 4-4
Abnormal ................................................................................................................................. 4-4
Gradient.................................................................................................................................. 4-4
Acoustic reflex ........................................................................................................................ 4-5
Normal ..................................................................................................................................... 4-5
Audiometry............................................................................................................................. 4-5
Special Messages and Error Codes ...................................................................................... 4-6
Sample Test Results ............................................................................................................... 4-6
ii Revised 4/11/08
Page 7

Table of Contents
RS-232 Interface 5
Introduction............................................................................................................................ 5-3
Operation................................................................................................................................ 5-3
Record Formats...................................................................................................................... 5-4
General record format .............................................................................................................. 5-4
Tympanometry and Reflex test results record ......................................................................... 5-5
Audiometry test results record................................................................................................. 5-9
Notes ........................................................................................................................................ 5-9
Data Transmission Protocol.................................................................................................5-11
Data Transfer Program Mode ............................................................................................ 5-12
RS-232 Interface .................................................................................................................. 5-13
Interface configuration........................................................................................................... 5-13
Cable connections.................................................................................................................. 5-13
Communications flow control ............................................................................................... 5-13
Bibliography 6
Specifications 7
Specifications.......................................................................................................................... 7-3
Tympanometry/Reflex modes.................................................................................................. 7-3
Pneumatic system .................................................................................................................... 7-3
Acoustic Reflex Stimuli ........................................................................................................... 7-4
Probe LED Indicators .............................................................................................................. 7-4
Audiometry mode ................................................................................................................... 7-5
Power ....................................................................................................................................... 7-5
Environmental.......................................................................................................................... 7-5
Mechanical............................................................................................................................... 7-5
Intensity Levels........................................................................................................................ 7-6
Tone Format: ........................................................................................................................... 7-6
Transducers .............................................................................................................................. 7-6
Printer....................................................................................................................................... 7-6
Supplied accessories ................................................................................................................ 7-7
Optional Accessories ............................................................................................................... 7-7
Catalog Listing......................................................................................................................... 7-8
Revised 4/11/08 iii
Page 8

TM 262
Blank page.
iv Revised 4/11/08
Page 9

Introduction
Chapter 1
Introduction
Revised 4/11/08 1-1
Page 10

TM 262
Blank page.
1-2 Revised 4/11/08
Page 11

Introduction
Introduction
The TM 262 Auto Tymp (hereafter referred to as ‘instrument’ in this guide unless otherwise
noted for clarity) is a versatile combination instrument that provides testing capability for
tympanometry alone, tympanometry combined with screening acoustic reflex measurements,
and screening audiometry.
Two different versions are available to meet your individual testing needs.
• The basic version provides two modes of operation, tympanometry alone and
tympanometry plus screening ipsilateral acoustic reflex testing.
• The second version adds manual audiometry. It is possible to field retrofit the manual
audiometer to the basic version after the time of original purchase.
An RS-232 port is also available as an option. This allows the transfer of data to a computer.
An optional soft-sided carrying case can be purchased if portability is required. Also, a dust
cover, patient handswitch, patch cords, and earphone sound enclosures may be purchased as
optional accessories.
Revised 4/11/08 1-3
Page 12

TM 262
WARNING
!
Injury to personnel or damage to equipment can result when a three-prong to two-prong
adapter is connected between the TM 262 power plug and an AC outlet or extension
cord. Additionally, the TM 262 is equipped with a specific power transformer (8000-0246)
and power cord, which should not be interchanged with any other transformer or supply
and are for use only with the TM 262.
The above symbol indicates the location of a service adjustment part and is intended for
service personnel use only. The TM 262 is a specifically calibrated device and the
periodic service and adjustments which the instrument may require should be done
only by an authorized Welch Allyn service technician.
CAUTION
!
Radio transmitting equipment, cellular phones, etc. shall not be used in the close
proximity of the device since this could influence the performance of the device.
Particular precaution must be considered during use of strong emission sources such
as High Frequency surgical equipment and similar so that e.g., the HF-cables are not
routed on or near the device. If in doubt, contact a qualified technician or your local
representative. Refer to the Electromagnetic Compatibility (EMC) Guide on CD 482-
638702.
The TM 262 is designed to be used with a hospital grade outlet.
The TM 262 is designed to comply with the EMC requirements
according to IEC 60601-1-2.
1-4 Revised 4/11/08
Page 13

Introduction
Tympanometry and Gradient
Tympanometry is an objective technique used since the late 1960’s to measure the mobility
compliance) and the pressure within the middle-ear system. During tympanometry, a low pitch
tone (i.e., 226 Hz probe tone) is presented to the ear canal via the light-weight probe. The probe
tone is used to measure the compliance changes within the middle-ear system while air pressure
within the hermetically sealed ear canal is varied from a positive to a negative value. A positive
pressure within the ear canal space, in the absence of middle-ear pathology, causes the middleear system to stiffen up or become less mobile. This is caused by the pressure difference
between the sealed ear canal space and the middle-ear space which forces the tympanic
membrane to stretch inward. A stiffened middle-ear system displays little or no compliance. As
the pressure within the ear canal is brought back toward atmospheric (ambient or 0 daPa)
pressure, the pressure difference between the ear canal space and the middle-ear space is
reduced in normal ears.
At or near atmospheric pressure (0 daPa), the greatest amount of sound (probe tone) enters the
middle-ear system. In other words, this is the air pressure value where the middle-ear system
displays the maximum amount of compliance (admittance).
When the air pressure within the ear canal is then reduced to a negative value with respect to
the middle-ear space, a pressure difference is once again established and the middle-ear system
becomes less compliant. Therefore, by varying the pressure within the ear canal, it is possible
to make a series of compliance measurements by means of the probe tone. The tracing which
depicts these compliance changes is referred to as a tympanogram. The point of the
tympanogram which represents the point of maximum compliance (admittance) is the
compliance peak of the tympanogram. The air pressure (pressure at the peak) where this
compliance peak occurs approximates the pressure within the middle-ear system, since
maximum mobility is only possible when there is little or no pressure difference between the
ear canal and the middle-ear space. Compliance is measured with respect to the ability of an
equivalent volume of air to conduct sound and the scientific quantity used is cm
is measured in decaPascals (daPa).
3
. Air pressure
NOTE: 1.02 mm H20 = 1.0 daPa
Revised 4/11/08 1-5
Page 14

TM 262
The presence of a pathological condition which interferes with the mobility of the tympanic
membrane, the ossicular chain, or the air pressure within the middle-ear space can be detected
during tympanometry. For example:
• If the air pressure within the middle-ear space becomes negative due to a blocked
eustachian tube, tympanometry permits the measurement of this negative pressure and its
effect on middle-ear compliance.
• If fluid builds up within the middle-ear space, this fluid will restrict the ability of the
ossicular chain to conduct sound to the cochlea. If small air pockets exist within the fluid,
the tympanogram will indicate the negative pressure where the restricted mobility occurs.
With a totally fluid-filled middle-ear space, no mobility will be measured during
tympanometry at any pressure value.
• In the case of a “glue-ear”, the ossicular chain is restricted in mobility but the air pressure
within the middle-ear space is at atmospheric pressure. This tympanogram would depict a
restricted compliance peak at or near 0 daPa.
Gradient
Gradient (width) measurements are used to describe the shape of a tympanogram in the vicinity
of the peak. Often, the presence or absence of fluid in the middle ear is not clearly indicated by
otoscopy and tympanometry alone. This evaluation is especially difficult when the peak
pressure is in the normal range.
The presence of fluid within the middle-ear space alters the shape of a tympanogram, i.e.,
makes the tympanogram wider near its peak. A larger-than-normal gradient can indicate the
presence of fluid in the middle ear when other parameters are within normal limits. In this way,
the gradient acts as an adjunct to the tymp and ear canal volume measurements by helping to
differentiate between tymps with similar peak values.
The instrument uses tympanometric width to determine the gradient by measuring the pressure
interval at one-half of the tymp peak height. Differing tymp peak widths can point to different
middle-ear conditions, even when peak height and pressure are within normal range. For
example, middle-ear effusion brought on by secretory otitis media might result in an increased
tympanogram width and, therefore, an increased gradient value. This would occur because the
ossicular chain cannot react to the change in pressure introduced during the tympanogram in
the same way that it would if the middle ear were properly aerated. The continued presence of
effusion, leading eventually to a completely fluid filled middle-ear cavity, will reduce the
magnitude of the tympanogram to the point where no change in compliance is detectable across
the pressure range. Under this condition, no gradient measurement is possible.
1-6 Revised 4/11/08
Page 15

Introduction
Screening acoustic reflex
An acoustic reflex occurs when a very loud sound (stimulus) is presented to the auditory
pathway. During acoustic reflex testing, the stimulus is presented to the ear canal through a
probe (ipsilateral). This stimulus then travels through the middle ear to the cochlea. From the
cochlea, frequency and intensity information is transmitted via the 8th nerve to the brain stem
where a determination is made as to whether or not the intensity of the stimulus is high enough
to elicit the reflex response. If it is, a bilateral response occurs i.e., the right and left 7th nerves
innervate their respective middle-ear muscles (stapedial muscles) causing them to contract. As
these muscles contract, they stiffen their respective ossicular chains. This stiffening of the
ossicular chain reduces the compliance of each middle-ear system. As in tympanometry, a
probe tone is used to measure this decrease in compliance.
During ipsilateral acoustic reflex testing, both the stimulus and the probe tone are presented via
the hand-held probe. For best results, the air pressure within the ear canal where the probe is
positioned is set to the pressure value measured at the point of maximum compliance for that
ear during tympanometry with an offset of -20 daPa.
Acoustic reflex measurements are useful to determine the integrity of the neuronal pathway
involving the 8th nerve, brainstem, and the 7th nerve. Since the acoustic reflex test is
performed at high intensity levels and since it involves a measurement of middle-ear mobility,
acoustic reflex testing is not a test of hearing.
The acoustic reflex also serves as a good validation of tympanometric results since an acoustic
reflex cannot be measured in the absence of a compliance peak. In other words, if the
tympanometric results indicate no mobility over the pressure range available with your
instrument, no reflex can be measured. If the test results indicate a reflex response in the
absence of a compliance peak, one has cause to question the validity of the tympanometric test
results. This indicates that the tympanogram should be repeated.
Clinical middle-ear instruments allow the measurement of the acoustic reflex threshold since
they provide the ability to manually change the intensity of the stimulus to a level where a
reflex response is just barely detectable for each patient tested. However, the instrument
automatically presents the stimulus in a very definite stimulus intensity sequence. This preset
intensity sequence may start at a level above an individual’s acoustic reflex threshold level.
Also, since the instrument uses a hand-held probe and noise from hand motion can be detected
by the instruments circuitry, the magnitude of a detectable response must be somewhat higher
than the criterion generally used during clinical acoustic reflex threshold testing to avoid
artifact caused by hand motion. Thus, the acoustic reflex measurements made with the
instrument are referred to as screening acoustic reflex testing. The purpose of these screening
reflex tests is to determine whether a reflex is detectable rather than to determine the lowest
intensity at which the reflex occurs (i.e., threshold testing).
Revised 4/11/08 1-7
Page 16

TM 262
Manual audiometry
While tympanometry and acoustic reflex measurements check the integrity of the middle-ear
system, audiometry provides a means for checking the integrity of the entire auditory pathway.
Manual audiometry provides a method to check an individual’s ability to hear a test signal at a
particular intensity level or at the lowest possible intensity level without the use of masking.
During threshold audiometry, the test signal is generally presented through an earphone to the
ear under test. Different screening test protocols define the frequencies and intensity sequence
to be used to obtain a response. Audiometric testing requires a behavioral response for the
individual being tested. This consists of having the individual raise a finger/hand or press a
handswitch (optional) whenever the test signal is heard. The finger/hand is lowered or the
handswitch is released when the test signal is no longer audible. Thus, the individual being
tested must be able to understand a set of simple instructions and have the ability to provide
some physical sign when the test signal is heard.
1-8 Revised 4/11/08
Page 17

Introduction
Recycling / disposal
CAUTION
!
Many local laws and regulations consider electric equipment-related waste as
hazardous or requiring special procedures to recycle or dispose of. This includes
batteries, printed circuit boards, electronic components, wiring and other elements of
electronic devices. Follow all of your respective local laws and regulations for the proper
disposal of batteries and any other parts of your system, such as monitors, amplifiers,
keyboards, electrodes, etc.
To recycle or dispose of this product within the European Union, refer to Welch Allyn
insert 704414 “Disposal of Non-Contaminated Electrical and Electronic Equipment.”
Directive 2002/96/EC WEEE.
D-9
Revised 4/11/08 1-9
Page 18

TM 262
Glossary of terms
Tympanometry - an objective measurement of middle-ear mobility and middle-ear pressure
through the use of a low frequency sound (probe tone) and air pressure changes.
Tympanogram - the tracing which depicts the results of tympanometry.
Compliance Peak - the point of maximum mobility in a tympanogram which indicates the
degree of mobility within the middle-ear system.
Pressure Peak - pressure value where maximum mobility occurs in a tympanogram. This
pressure value approximates the pressure within the middle-ear space.
Normal Box - range of pressure peak and compliance peak values associated with normal
middle-ear function. (-150 daPa to +100 daPa, 0.2 cm3 to 1.4 cm3 per ASHA, 32, Supl. 2, 1990,
17-24).
Ear Canal Volume - volume measured between the tip of the probe and the tympanic
membrane at the starting pressure for a tympanogram.
Probe Tone - low pitch (226 Hz) tone used to measure middle-ear mobility.
Acoustic Reflex - reflex arc elicited in the presence of very loud sounds which cause a decrease
in middle-ear compliance as a protective mechanism for the cochlea.
Ipsilateral Acoustic Reflex - the acoustic reflex elicited when the stimulus is presented to the
same ear where the response is measured.
Manual Threshold Audiometry - a hearing test performed with a variety of frequencies and
intensities without the use of masking to determine if an individual can hear.
1-10 Revised 4/11/08
Page 19

Installation
Chapter 2
Installation
Revised 4/11/08 2-1
Page 20

TM 262
Blank page.
2-2 Revised 4/11/08
Page 21

Installation
Unpacking and Inspection
Examine the outside of the shipping container for any signs of damage. Notify your carrier
immediately if any damage is noted.
Carefully remove your instrument from its shipping container. Remove the plastic bag
protecting the instrument. If the instrument appears to have suffered mechanical damage, notify
the carrier immediately so that a proper claim can be made. Be certain to save all packing
material so that the claim adjuster can inspect it as well. As soon as the carrier has completed
the inspection, notify your Welch Allyn Distributor.
Probe Assembly Probe Eartips (6 sizes, 2 each)
Power Module Paper (3 rolls)
Test Headset model is with Audiometry only Test Cavity
Instruction Manual
Table 1: Accessories supplied
NOTE: Keep the original packing material and shipping container so the instrument can be
well packaged if it needs to be returned to the local service center for repair or calibration.
Check that all accessories listed in Table 1 (per version ordered) are received in good condition.
If any accessories are missing or damaged, notify your Welch Allyn Distributor or the factory
immediately. See the Specifications chapter of this manual for the catalog numbers of
accessories and also for a listing of optional accessories.
Revised 4/11/08 2-3
Page 22
TM 262
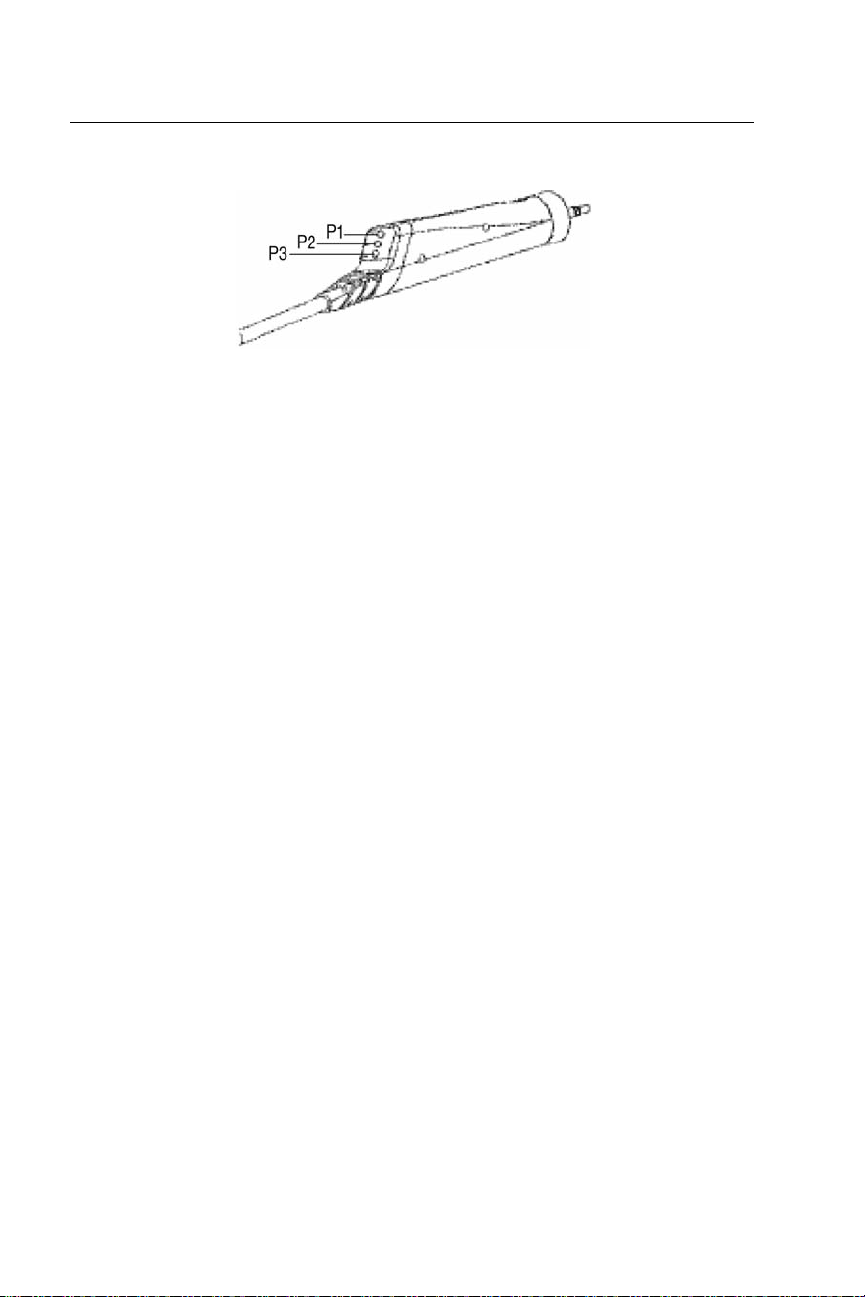
Probe Indicators
Figure 1: Probe indicators
P1 - Yellow: The probe is occluded. Remove the probe and inspect for cause of
occlusion.
P2 - Green lamp: Blinking - The instrument is ready to begin a Tymp.
Steady green - test successfully started and in progress.
P3 - Orange: A pressure leak has been detected.
2-4 Revised 4/11/08
Page 23

Installation
Front Panel Controls and Indicators
Figure 2: Front panel
Fl Power on indicator and label: Indicator is illuminated when the instrument is receiving
power.
F2 Print Screen: Pushbutton used to print the currently displayed page of memory.
F3 Print All Memory: Used to print all pages of data from memory.
F4 Paper Advance: Causes paper to feed through printer; may be used to load paper or to
provide space between printouts.
F5 FM: Used during the Audiometry mode to select a frequency modulated test tone when the
present bar is depressed; causes the letters FM to appear on the display when selected.
F6 Steady: Used during Audiometry mode to select a continuous test tone when present bar is
depressed; causes the steady symbol to appear on the display.
F7 Pulsed: Used during Audiometry mode to select a pulsed tone when the present bar is
depressed; causes the pulsed symbol to appear on the display.
F8 Attenuator Knob (dB HL): Used to increase or decrease the intensity of the test tone
presented in Audiometry mode; counterclockwise rotation causes the intensity to be lowered;
clockwise rotation causes the intensity to be increased.
F9 +10 dB: Used to temporarily extend the intensity range by 10 dB; causes a large + sign to
appear on the display indicating that the extended range has been selected.
F1O M+: Save key; during Audiometry mode, causes the threshold information per frequency
to be saved on the display; during Program mode, causes option to be selected; during Tymp /
Reflex mode, causes frequency to be stored as a default parameter.
F11< and > Hz: Selecting < causes the cursor to move to the next lower frequency; selecting
causes the cursor to move to the next higher frequency.
F12 Present Bar: Press to present test signal to appropriate earphone; release to turn test tone
off.
Revised 4/11/08 2-5
Page 24

TM 262
F13 Prog(ram): Selects Program mode screen which lists settings available for reflex
presentation format, printout header format, audiogram vs. tabular format, display normal box,
and identity frequency range for Audiometry mode.
F14 Aud(iometry): Selects Audiometry mode.(Available in models with Audiometer only).
F15 TYMP: Selects Tympanometry only mode.
F16 Tymp Reflex: Selects Tympanometry and Reflex mode.
F17 R: Used to identify right ear under test so that data stored in memory and/or printed is
properly identified. Used to select right earphone for audiometry.
F18 L: Used to identify left ear under test so that data stored in memory and/or printed is
properly identified. Used to select left earphone for audiometry.
F19 500: Selects 500 Hz as a stimulus during reflex testing.
F20 1000: Selects 1000 Hz as a stimulus during reflex testing.
F21 2000: Selects 2000 Hz as a stimulus during reflex testing.
F22 4000: Selects 4000 Hz as a stimulus during reflex testing.
F23 PAGE: Scrolls through test results stored in memory.
F24 M -: Erases currently displayed page of data from memory.
F25 M - -: Erases all pages of data from memory.
F26 Data Transfer: Transfers test results to an attached computer.
WARNING
!
Only computers that meet the requirements of IEC 60950-1 shall be
connected to the serial interface. The computer requires an isolation transformer.
2-6 Revised 4/11/08
Page 25

Printer and Display
The display (Figure 3) indicates test mode, parameters for test and test results.
Printer
Display
Figure 3: Printer and display
Installation
Revised 4/11/08 2-7
Page 26

TM 262
Figures 4 through 8 show the individual display format for each test mode.
Figure 4: Display format for TYMP Only Test.
Figure 5: Display Format for TYMP/REFLEX Test
(Reflex test results given as Yes or No).
Figure 6: Display for TYMP/REFLEX Test
(Reflex test results given in dB HL).
(Reflex test results given in dB HL and also shown with a tracing.
Figure 7: Display format TYMP/REFLEX Test
Figure 8: Display Format for AUDIOMETRY.
2-8 Revised 4/11/08
Page 27

Installation
Rear and Bottom Panel Labels and Connectors
Figure 9: Rear and bottom panel labels and connectors.
R1: Company name, address, model, serial number and country of origin.
R2: Symbol denotes a Type B, Class II product per IEC 878 as referenced in IEC 60601-1.
R3: Symbol denotes Attention, consult accompanying documents.
R4: Symbol indicates a service adjustment part that is intended for service personnel use only.
R5: Connector for handswitch. Input impedance (47 K ohm pulls up to 5 volts).
R6: Connector for contralateral insert phone. Function not available.
R7: Connectors for right and left earphone. 130 ohm, 2.50 volts rms maximum open circuit.
R8: Label describing low input voltage and current from desktop power supply.
R9: Power Input Jack. 5-pin DIN connector for external desktop power supply.
R10: Power Switch with ON/OFF indicators.
NOTE: There is a symbol on the bottom panel (marked B1 in Figure 10) that indicates entry
by qualified service personnel only.
Figure 10: Bottom panel.
Revised 4/11/08 2-9
Page 28

TM 262
Initial set-up
Place the instrument on a stable counter or table where it will subsequently be used. The
location should be near a properly grounded wall outlet. Carefully attach purchased accessories
to their appropriately labelled connector on the rear panel of the instrument (see Figure 9).
Locate the power switch on the rear panel of the instrument and move the switch to the On
position. Note that the lamp (F1) on the front panel is illuminated indicating the instrument is
receiving power. Once the power switch is activated, the TM 262 symbol will appear on the
display along with a listing of the revision number for the Tymp/Reflex and Audiometry (if
purchased) software.
Next, the display will default to the Tymp/Reflex mode and the probe green lamp will begin to
blink indicating that the instrument is ready to begin the tymp. If both the green and yellow
lamps are illuminated at the same time following power on, the probe is occluded or the tymp/
reflex software did not get properly initialized. Simply move the power switch to the off
position, inspect the probe tip or any signs of an occlusion, and reposition the power switch to
On. If both green and yellow lamps are still illuminated and you are certain that the probe is not
occluded, contact your local service representative or the Welch Allyn service department for
repair. In the mean time, it is still possible to select the Audiometry mode (if purchased).
Allow the instrument to warm-up for about 5 minutes before conducting a test. This allows the
electronic circuits to stabilize prior to use. If the storage temperature is lower than the room
temperature, allow some additional time for the instrument to reach room temperature.
Loading the paper
Remove the printer cover by placing your fingers along the back edge of the printer and pulling
upward on the cover. Cut the printer paper so that the leading edge of paper is straight across.
Place the roll of paper inside the paper well so that the paper will unroll from the lower surface.
See paper loading label for additional help (Figure 11).
Figure 11: Paper loading.
Position the leading edge of the paper roll into the paper entrance. The printer will sense the
paper and begin to autofeed. The paper will appear out the of the printer mechanism. Continue
to advance the paper by pressing the paper Advance button until a section of paper is long
enough to pass through the printer cover once it is repositioned over the printer.
2-10 Revised 4/11/08
Page 29

Installation
Paper storage
The instrument is supplied with a thermal printer. This type of printer requires a heat-sensitive
paper to create an image. For maximum paper life, any spare rolls of paper should be stored as
follows:
a. Store in the dark, i.e., in a drawer or cabinet
b. Do not store above 77 F (25 C)
c. Store at less than 65% relative humidity
The above recommendations are for the maximum paper life (greater than five years). Storing
your thermal paper at high temperatures or high humidity levels will only shorten the total
paper life somewhat, depending on the actual temperature and humidity the paper is subjected
to. The paper will show some darkening if stored for 24 hours at 113 F (45 degrees C) and a
relative humidity of greater than 90%, so avoid leaving your paper in a hot car or other hot area
overnight. Always avoid storing unused paper or printed tests in a lighted area..
Revised 4/11/08 2-11
Page 30

TM 262
PreTest Tymp checks
For your convenience, a test cavity is provided with your instrument. This test cavity enables
you to quickly verify, on a daily basis, the proper calibration of your unit. Welch Allyn strongly
recommends that you make this quick check a part of your daily routine.
Calibration
NOTE: To initiate the quick check, select the Tymp only mode and insert the probe into the
3
0.5 cm
opening on the test cavity. See Figure 12.
Figure 12: Test cavity
NOTE: Since the instrument is designed to start automatically, it is important that the probe is
inserted as quickly and as smoothly as possible. During the calibration check, the probe must be
held carefully and without movement. Do not place the probe on the same counter as the
instrument or any moving object during this check as mechanical noise will be picked up by the
probe and interfere with the calibration check.
The calibration check will start automatically if the probe has been inserted into the cavity
properly. This is confirmed by the green lamp changing from blinking to a steady condition. If
If the orange lamp is illuminated, the probe is not properly positioned within the cavity so that
a large pressure leak exists. If the yellow lamp is illuminated, the probe tip has been occluded.
In either case, remove the probe and wait for the blinking green lamp. Insert the probe once
again. If necessary, clean the probe tip as described in Chapter 3.
When the test sequence is completed, the green lamp on the probe is no longer illuminated.
Remove the probe from the test cavity and note that the green lamp is blinking once again. The
display will indicate a flat line on the tympanogram along with the value of the test cavity next
to the letters ECV (ear canal volume) i.e., 0.5. The letters NP will appear next to the labels cm
and daPa and three dashed lines will appear next to the letters GR (gradient). Since the test
cavity is a hard-walled cavity, the tympanogram should be a fiat line indicating that there is no
mobility in the system. The instrument places the letters NP next to the cm and daPa headers to
indicate that there is no peak compliance and, therefore, no peak pressure can be determined
during the quick check. Also, since there is no compliance peak detected, it is not possible to
calculate a gradient. Therefore, the instrument displays the dashed lines when a gradient
calculation is not possible. Using the same sequence, place the probe in the test cavity opening
labelled 2.0 cm
for the value placed next to the letters ECV 2.0. If you wish, the same sequence can be followed
3
. Note that the display looks the same as with the 0.5 cm3 measurement except
2-12 Revised 4/11/08
Page 31

Installation
with the 5.0cm3 opening on the test cavity. To keep a record of this test cavity calibration check,
simply press the Print All button on the front panel of the instrument.
Since sound pressure will vary with altitude and barometric pressure, some variation from the
0.5, 2.0 and 5.0 cm
factory, which is at approximately 250 feet above sea level. If you are located at an elevation of
1000 feet or higher, your instrument may need to be recalibrated to account for your elevation
(see the next topic). It is not necessary to recalibrate for barometric pressure changes on a daily
basis. Keep in mind that a change in barometric pressure (i.e., from low to high or vice-versa)
will slightly affect the test cavity readings.
Altitude adjustment
The altitude calibration adjustment allows you to ‘correct’ the ear canal volume (ECV)
measurement and test cavity volume measurement for variations due to altitude. Because the
instrument is a pressure sensitive device that makes measurements relative to ambient air
pressure, changes in air pressure due to weather or altitude will affect the ECV readout of the
instrument. The slight pressure change resulting from changing weather conditions will usually
yield volume readouts with ±0.1 cm
altitude can shift these cavity values by as much as 30%. These changes in pressure do not
affect the accuracy of the compliance measurement system in any way. However, you may
prefer that the instrument gives ECV values as they would appear at sea level. The altitude
calibration mode allows you to adjust the Auto Tymp without the services of a qualified Welch
Allyn representative.
Altitude (ft.)
0 - 1,500 2.0
2,000 - 3,500 2.1 ±0.1
4,000 - 6,000 2.2 ±0.1
6,500 - 7,500 2.3 ±0.1
8,000 - 9,000 2.4 ±0.1
9,500 - 10,000 2.5 ±0.1
3
readings may be observed. Your instrument is carefully calibrated at our
3
of the expected cavity value, but pressure changes due to
Altitude Table (cm
3
)
Table 2: Altitude correction.
Revised 4/11/08 2-13
Page 32

TM 262
The altitude calibration mode can only be entered with the instrument is powered up from its
Off state while the program mode (PROG) button is depressed. Hold the PROG button for
approximately five seconds.
1. When entering the altitude mode, the display will read as follows:
Altitude Mode
ECV 2.0
cm3 9.99
Standard
(E71) is displayed in the bottom right of the display until the probe is in the 2.0 cm3 cavity.
2. Place the probe into the 2.0 cm3 cavity provided with the instrument and check cm3 value
against the altitude correction table for accuracy.
3. If the measured volume is not within the published table value ±/.1 cc, then you should
exit the altitude mode by pressing the PROGRAM MODE button and contact field
service. Providing the measured volume agrees with the published table ±/.1cc, you may
proceed with the altitude adjustment.
4. With the probe still in the 2.0 cm3 cavity, press the PAGE button to enter the custom
calibration mode. Custom will appear on the fourth line of the display.
5. The value now displayed in the cm3 display area is the volume measured and adjusted to
the current altitude. If the value displayed is 2.0 cc, the volume is adjusted to the current
site. If the value is not 2.0 cc ±.01, press the SAVE button M+ to customize the volume
measurement to the current altitude. The measured volume should now read 2.0 cc.
6. To exit the altitude mode, press the PROG pushbutton to return to normal mode.
2-14 Revised 4/11/08
Page 33

Installation
Pre-Test Audiometric Checks (Models with Audiometer only)
Noise recovery period
Exposure to high levels of sound (e.g., unmuffled lawn mowers, loud music, gunfire) tends to
create a temporary threshold shift (TTS) which diminishes with time after exposure. Any
subject/patient tested soon after such exposure may exhibit a hearing loss that does not reflect
his or her normal hearing threshold. It is, therefore, important that the testing procedure
prescribe some time interval - usually at least 16 hours- between the last exposure to high-level
sounds and the administration of any hearing test.
Elimination of ambient noise
Excessive noise in the test environment during audiometric testing such as that produced by
conversation, typewriters, public address systems reduces test validity because it tends to mask
the test signals particularly at the lower frequencies where earphone cushions provide less
effective attenuation. An acoustically treated room may be required if ambient noise reaches
objectionable levels i.e., sufficient to cause apparent hearing loss at the low frequencies. Also,
Audiocups are available from Welch Allyn as an optional accessory. If the person being tested
is in the same room as the audiometer, it is recommended that he/she be seated about three feet
(1 meter) away from the instrument.
Maximum permissible noise levels are specified by the American National Standards - Criteria
for Permissible Background Noise during Audiometric Testing, ears covered with earphones
(S3.1 1991 revised). Table 3 shows the maximum background levels that can be present inside
the room while a valid hearing test is being conducted. For more comprehensive information
about hearing testing and hearing conservation the user is referred to the Bibliography.
Frequency (Hz) Test Room
125 29.0
250 17.5
500 14.5
750 16.5
1000 21.5
1500 21.5
2000 23.0
3000 28.5
4000 29.5
6000 33.0
8000 38.5
Revised 4/11/08 2-15
Maximum dB SPL* in 1/3 Octave Band
Page 34

TM 262
Biological Check
The best way to determine that your instrument is operating properly is to perform a daily
check on a normal ear - your own ear if possible. This allows you to listen for the probe tone
and the stimulus tone (during reflex) and to determine if the air pressure system is working
properly. Keep a copy of your chart for a day-to-day reference in checking your instrument.
If you purchased the TM 262 with Audiometry, select the Audiometry (AUD) mode pushbutton
located in the center section of the front panel. Note that the display changes from the
tympanogram format to an Audiogram format. The < and > Hz buttons allow you to select each
frequency and the dB HL knob allows you to alter the intensity of each frequency. Position the
test headset on your head so that each earphone is covering the appropriate ear (i.e., red is right
and blue is left). Select the right earphone by pressing the front panel button labelled R and
check for the following while depressing the Present bar:
a. Depressing the < Hz button causes the frequency to change to a lower frequency;
depressing the > Hz button causes the frequency to change to a higher frequency.
b. Each frequency or tone is pure: i.e., there is no distortion or cracking sound present.
c. Rotating the dB HL knob in a clockwise direction causes the tone to increase
(become louder) in intensity; rotating the dB HL knob in a counterclockwise
direction causes the tone to become quieter (less intense).
2-16 Revised 4/11/08
Page 35

Operation
Chapter 3
Operation
Revised 4/11/08 3-1
Page 36

TM 262
Blank page.
3-2 Revised 4/11/08
Page 37

Operation
Preventive Maintenance
Preventive maintenance does not require access to the interior of the instrument and may be
performed by the user.
For the TM 262, preventive maintenance consists of periodically cleaning and inspecting the
exterior of the instrument. It is recommended that you develop a schedule for these purposes.
Cleaning the system
Turn OFF the system power before cleaning the instrument. Do not permit solutions or
sterilization agents to seep into the electronic portions of the system. Take special care around
controls, connectors and panel edges. Do not use any abrasive cleaners.
Remove any dust from the exterior of the system with a soft brush or cloth. Use a brush to
dislodge any dirt on or around the connectors and panel edges. Remove stubborn dirt with a
soft cloth slightly dampened with a mild detergent solution or cold sterilization agent.
Eartip care
Eartips may be washed with warm soapy water to remove cerumen after the eartip is removed
from the probe. Use an alcohol swab to disinfect the eartips. Be sure that the eartips are
completely dry before reuse.
NOTE: Eartips may crack or otherwise deteriorate if left submerged in alcohol for a long
period of time. Eartips should not be placed in an autoclave as they will melt and lose their
shape.
Revised 4/11/08 3-3
Page 38

TM 262
Probe care
With use, cerumen can work its way up inside the probe nose cone (probe tip). During the
warm-up period each day and throughout the day, inspect the probe tip to make sure it is clean
and free of cerumen. If any cerumen is detected, refer to the following instructions for cleaning
and maintaining the instrument’s probe.
Probe nose cone cleaning
Remove the nose cone portion of the probe:
1. Hold the body of the probe in one hand (e.g. left) near the tip and grasp the nose cone of
the probe in the other hand (e.g. right).
2. Rotate the nose cone portion of the probe counterclockwise until the nose cone is
completely separated from the probe (Figure 1).
3. Place the probe body securely on a table and inspect the nose cone for cerumen. Use a pipe
cleaner to remove any cerumen by inserting the pipe cleaner through the back portion of
the nose cone and pulling it through the front opening. It may be necessary to repeat this
several times to remove all the cerumen.
Figure 1: Probe nose cone removal
NOTE: The probe nose cone can be sterilized via many conventional methods including
autoclaving.
3-4 Revised 4/11/08
Page 39

Operation
The O-Ring
There is an O-Ring seated at the end of the threads on the probe. As a preventative maintenance
measure, and to ensure that the nose cone of the probe unscrews easily, do not clean or remove
the lubricant from the O-Ring. If the O-Ring appears to be void of any lubricant, or if the nose
cone itself was difficult to remove, apply a high-quality synthetic lubricant such as those
considered “food-grade.” Refer to Figure 2 and apply as described in the instructions that
follow.
A
B
Figure 2: O-Ring care.
A: Cotton swab.
B: Lubricant
C: O-Ring (enlarged for detail).
1. Place a small drop of lubricant at the front outer surface of the O-Ring.
2. Using your finger or a cotton swab, spread a thin layer of lubricant completely around the
front and outer surface of the O-Ring. Ensure that no lubricant spreads into the threaded
area of the nose cone. Only a thin layer of lubricant is necessary. Excessive application or
build-up may affect test results.
C
Revised 4/11/08 3-5
Page 40

TM 262
The probe wire
Inside the probe body there is a metal tube that contains a wire required for cleaning purposes.
1. Carefully remove this wire from the metal tube (Figure 3). This will pull any cerumen out
of the metal tube.
Figure 3: Probe wire removal.
2. Examine the wire for cerumen.
3. If necessary, clean the wire with a lint-free tissue.
4. Reinsert the wire into the metal tube and push it in as far as it can go.
NOTE: The wire must be inserted into the metal tube for the instrument to function properly.
Probe reassembly
After cleaning, reassemble the probe nose cone to the probe body by screwing the cone back
onto the probe. Take care to align the threads on both the probe body and the nose cone before
screwing the pieces together. Only screw the nose cone on until it is finger tight. You might find
it helpful to gently squeeze the two sides of the probe case together while screwing the nose
cone into place.
NOTE: The probe nose cone must be screwed firmly in place to guard against any air leaks.
3-6 Revised 4/11/08
Page 41

Operation
Earphone Care (Models with Audiometry only)
The earphone and cords provided with the instrument versions 3 and 4 should last a long time
with proper care. To clean the earphones and cords, use only a dry cloth or tissue. Moisture
should not be allowed anywhere near the earphone itself as this will damage the diaphragm and
grill cloth, requiring its replacement.
With extended use, earphone cords tend to fray internally at the connectors i.e., between the
cord and the instrument’s connector, and between the cord and the earphone connector. This
fraying will ultimately either decrease the signal level or cause the signal to be intermittent. To
check for this,
1. Position the test headset over your ears and select a frequency (e.g., 1000 Hz) at 35 dB
HL.
2. Select the right earphone and press the Present bar.
3. While the present bar is depressed, flex the earphone cord next to the connector at both
ends.
4. Listen for an intermittent signal, an abrupt change in signal intensity level or a scratchy
sound superimposed over the selected frequency that coincides with the flexing of the
cord. The presence of any of these conditions indicates that the cord should be replaced.
5. Also, examine the earphone cord for cuts or tears in the covering shield and the earphone
cushion for signs of damage. If either problem is noticed, the earphone cord or cushion
should be replaced. Both parts are easily replaced without the need for recalibration.
However, if the earphone receives shock damage or is replaced for any reason, the
instrument will need to be recalibrated.
6. Repeat this same sequence with the left earphone.
Paper supply
To streamline each testing session, it is a good idea to check the amount of paper left inside the
printer compartment. Extra rolls of paper should be kept nearby.
NOTE: The number of tests per roll of paper will vary with the version Auto Tymp being
used and the type of tests being performed. See Printer Description in the Specification
chapter for approximations. Replacement paper can be purchased from your local Welch Allyn
Distributor or from the factory.
Revised 4/11/08 3-7
Page 42

TM 262
Tympanometry testing information
As mentioned, it is a good idea to perform a test on a normal ear each day to make certain that
your instrument is functioning properly. See Biological Check in Chapter 2 for details.
Helpful hints
Tympanometry and acoustic reflex testing can be performed at any age. However, the technique
used will vary with age. From three years through adult, tympanometry can be performed with
little difficulty due to the cooperative nature of this age group. With the under-three-year
population, a bit of ingenuity is required to keep the patient relatively quiet during the seconds
required for the test. In all cases, distraction is the key to success. Anything which provides a
sound and/or visual distraction should work.
Sucking on a pacifier or a bottle will help with the younger population. However, the
tympanogram tracing will not appear as smooth due to the movement artifact. Having a parent
hold an infant during testing will also help.
The key to success in all cases is to make sure that you are at eye level with the ear canal. Keep
your hand steady and your eyes on the ear canal and probe lights until the test is over. It is a
good idea upon first receiving your instrument to practice on a cooperative patient to gain
confidence in its use. Once you feel comfortable with the probe, you are ready to handle any
situation. Remain calm and success will follow.
Obtaining a seal
Six different size eartips are provided with your instrument. The size eartip will vary with
skeletal size of the individual it is to be used on. Generally speaking, the following criteria
applies:
• Preemie -8 mm
• Newborn -8 mm, 11 mm
• Pre-school -11 mm, 13 mm
• School age -11 mm, 13 mm, 15 mm
• Adult -15 mm, 17 mm, 19 mm
NOTE: Before attempting to seal the entrance of the ear canal, visually inspect the opening to
make sure that the canal is free of any obstruction. If the canal is completely plugged at the
entrance or if fluid is running from the ear canal, tympanometry should not be attempted until
the condition is cleared.
NOTE: Damage to the probe can result if fluid is pulled up into the probe with negative
pressure.
3-8 Revised 4/11/08
Page 43

Operation
1. Slip the appropriate size eartip onto the nose cone of the probe, making sure the rounded
tip of the eartip sits flush with the tip of the nose cone (Figure 4).
Figure 4: Positioning the eartip
2. Move any hair away from the ear and pull upward and back on the pinna of the ear on an
adult (pull downward and back on the pinna of a young child.) This tends to straighten out
the ear canal and ensure better results. Keep the pinna in this position throughout the test
sequence.
3. Make sure that the green lamp on the probe is blinking.
4. Position the probe up against the entrance of the ear canal, applying a gentle pressure to
maintain a tight seal (Figure 5).
Figure 5: Positioning the probe.
5. Watch the probe lamp. As soon as a good seal is obtained, the blinking green lamp will
change to a steady glow and remain steady while the test is in progress.
6. Once the test sequence is over, all lamps on the probe will be turned off and the test result
can be viewed on the instrument display before printing it out. It is now possible to
remove the probe from the ear canal.
7. Note that the green lamp is now blinking again, signifying that you can run another test.
Should you run into difficulty during the test, the probe lamps will inform you of a
problem as follows:
• Green lamp: Still blinking - seal has not been obtained to initiate the test sequence.
• Orange lamp: The ear canal is not properly sealed and a large pressure leak exists.
• Yellow lamp: The probe tip is occluded with cerumen or you are pressing too hard
against the ear canal so that you have collapsed the canal at the tip of the probe.
In all cases, it is best to remove the probe, examine the tip for cerumen and clean it if
necessary. A change of eartip size may also be appropriate. Start the test again.
Revised 4/11/08 3-9
Page 44

TM 262
Audiometry testing information
Prior to testing, ensure that the earphone cords are plugged into their appropriate connectors on
the rear panel of the instrument. Select the desired tone type (i.e., pulsed, steady, or FM).
CAUTION
!
Always handle earphones with care. Neither drop them nor permit
them to be squeezed together. Severe mechanical shock may change their operating
characteristics and require their replacement. Insert the earphone cords between the
ear-phone cushions during storage to prevent damage from mechanical shock.
Instructing the patient/subject
You should put the patient/subject as much at ease as possible before the test begins. In
addition, it is important to try to make them understand how the test is to be conducted and
what they will hear. For sake of uniformity, an unvarying explanation is advisable, for example:
“I am going to place these earphones over your ears. You will hear a variety of tones - some
high, some low, some loud, and some very soft. Whenever you hear, or think you hear one of
these sounds raise your hand. Lower your hand when you no longer hear the sound.”
“Remember that although some of the tones will be easy to hear, others will be very faint.
Therefore, you should listen very carefully and raise your hand whenever you think you hear
the tone.”
NOTE: Modify the instructions accordingly if the optional handswitch is to be used.
Placement of earphones
The most important thing to remember is that a good seal is required between the earphone
cushion and the patient’s/subject’s head and ears. To increase the likelihood of a good seal:
a. Eliminate all obstruction between the earphones and the ears e.g., hair, eyeglasses,
earrings, hearing aids, etc.
b. Adjust the headband so that it rests solidly on the crown of the subject’s head and
exerts firm pressure on both ears.
c. Center the earphones carefully over both ears. The earphone with the red connector
goes on the right ear. Take care to eliminate any visible gaps between the earphone
cushions and portions of the individual’s head and the ear on which the cushion rests.
Response handswitch (optional accessory)
If the optional handswitch is to be used, be sure that the handswitch connector is properly
inserted into the jack on the rear panel. The instrument will display an appropriate symbol
whenever the handswitch is operated.
3-10 Revised 4/11/08
Page 45

Operation
Program Mode
To enter the program mode, press the PROGram pushbutton located on the front panel. The
following screen appears the first time you enter the Program mode after you receive your
instrument from the factory. These are the default settings used at the factory during
production.
Program Mode - User Selections
* Reflex HL + Curve * Print - Audiogram
Reflex HL only Print - Aud Table
Reflex Yes/No * Normal Box ASHA
* Prn Header Welch Allyn Normal Box Off
Prn Header Off * Aud Range Normal
Prn Header Custom Aud Range Narrow
Note that these selections fall into five different groups of controls:
• Reflex format for printer
• Print header format
• Audiometric test result format
• Status of normal box
• Audiogram frequency range
The default setting for each group of controls has an asterisk (*) prefix so that it is easy to scan
the settings selected for each group.
Reflex format
Reflex test results can be displayed and printed in any of the following three different ways:
• reflex dB HL plus curve
• reflex dB HL only
• reflex yes/no
The default setting for this grouping is reflex dB HL plus curve. This means that all reflex test
results will appear on the display and the printout with the following information:
a. I (Ipsi)
b. Frequency: 500, 1000, 2000, or 4000 Hz
c. Intensity level where response was detected
d. Tra cing of actual response curve.
If reflex HL only is selected, the same information as shown above (except for d) will appear
on the display and the printout.
If reflex yes/no is selected, item d will not appear and item c will be replaced with the word
yes (response detected at one of three levels) or no (no response detected).
Revised 4/11/08 3-11
Page 46

TM 262
To select a different setting for reflex format, note that a square cursor is located next to the
reflex HL + curve option.
1. Use the < Hz button to cursor down to the setting that you wish to select for your own
default criterion.
2. While the square cursor is positioned in front of your desired setting, press the M+ button.
Note that the word SAVED appears in the lower right margin of the screen. Also, this will
cause the asterisk (*) to be deleted from in front of the prior default setting (e.g., Reflex
HL + curve) and to be repositioned in front of the new setting.
Print header format
Three options to choose how the print header will be handled:
• Print header = TM 262
This is the default setting for this feature which means that each time the print screen or
print all tests in memory buttons are pressed, the printout will begin with the label “TM
262.”
• Print header = off
If this option is selected, no header will be printed before any test results, which will save
printout space and printout time.
• Print header = custom
Select this option to design a custom header, which might be the name of your own
facility, department or company name.
Use a similar procedure to that described above to deselect the Welch Allyn header and select
no header or a custom header.
1. With the < or > Hz pushbutton, position the square cursor in front of the desired new
setting
2. Press M+ to select it as the new default setting. The word SAVED appears in the lower
right margin.
If custom header is selected, a line cursor will begin to flash at the left-hand margin below
the words Prn Header Custom. To “type” in the desired header, use the dB HL knob.
Rotating this knob clockwise will sequence you through the alphabet in the forward
direction and rotating this knob counterclockwise will sequence you through the
characters in a reverse direction. The available character set is: A -Z; 0 - 9; and a blank
space. The blank space can be used to erase an unwanted letter or number. A total of 35
character spaces are available.
NOTE: If you want to center the header, it will be necessary to consider the length of the
name to be inserted and calculate from the left margin where you want the header to begin.
Otherwise, if you begin to enter the characters for the header from the left margin, the header
will be printed from the left margin on the printout.
3-12 Revised 4/11/08
Page 47

Operation
If you had previously entered a custom header:
1. Position the square cursor next to the asterisk (‘) in front of Pm Header Custom.
2. Press M+ to display the left-hand margin along the bottom of the display. The word
SAVED will appear at the lower right margin indicating that the custom header is still
selected.
To move the cursor from the left-hand margin without inserting a letter or a number:
1. Select the character that represents a space (i.e., rotate the knob one position to right of the
letter A).
2. Use the > Hz pushbutton to move over to the next character position.
3. Repeat this sequence until the cursor is moved over to the desired start position for the first
character to appear in your header.
4. Rotate the dB HL knob to select the appropriate characters to spell out the desired header.
5. After selecting each character, use the > Hz pushbutton to move over to the next character
position.
6. Once all of the header characters have been added, press the M+ pushbutton to save your
header in memory. The word SAVED will appear on the right-hand margin indicating that
your header is now saved. The square cursor will reappear next to Prn Header Custom.
7. It is now possible to exit the program mode or to sequence on to the next selection.
8. To exit the program mode, press PROG. Enter a single test result and select print screen to
see how the custom header looks.
Audiometric format during printing
The audiometric test results can be printed out in an audiogram format (PRINT AUDIOGRAM) or in a tabular format (PRINT - AUD TABLE). The default setting for this
function is the audiogram format.
NOTE: When a specific frequency is deselected for testing, the result will be a break in the
audiogram line at that frequency. This eliminates the assumption that a threshold exists at that
untested frequency.
1. Move the < or > Hz pushbutton to position the cursor in front of the description PRINT AUD TABLE.
2. Press the M+ button to save this format as the new default parameter. Note that the word
SAVED appears in the lower right-hand corner of the display to indicate that this new
setting has been saved. With the PRINT - AUD Table selected, all audiometric test results
will appear in a table with the frequency range typed horizontally along the top of the table
followed by two lines of test data. The test results for the right ear will appear next to the
letter R and below each frequency tested. Similarly, the test results from the left ear will
follow below the right ear results.
NOTE: The PRINT - AUD setting selects the format for the printout only. An audiogram
always appears on the screen while in this mode.
Revised 4/11/08 3-13
Page 48

TM 262
Normal box format
It is possible to have the normal box, as described by ASHA, appear on the tympanogram
screen and printout. The boundaries for this normal box are -150 daPa to +100 daPa and 0.2 cm
to 1.4 cm
3
.
NOTE: A compliance value of 1.5 cm
normal box.
The normal box is the default setting. To deselect this normal box:
1. Move the square cursor with either the < or > Hz button so that it is placed in front of the
words Normal Box Off.
2. While the cursor is in this position, select the M+ pushbutton to save this feature as the
new default setting.
Note that the word SAVED appears in the lower right-hand margin. This message assures
you that the normal box will not appear on the tymp screen or printout.
3
or greater will automatically turn off the ASHA
Audiogram range
All eleven frequencies are available during audiometry or the range can be abbreviated to eight
frequencies. The default setting is Aud Range Normal. To select the abbreviated frequency
range:
1. Position the square cursor in front of the feature Aud Range Narrow.
2. Press the M+ button to save this narrow range for audiometric testing.
Note that the word SAVED will appear in the lower right-hand margin and the asterisk
now appears in front of the narrow range selection. The normal range of frequencies
includes 125 Hz through 8000 Hz. The narrow range of frequencies includes 500 Hz
through 6000 Hz. Please note that in the Aud mode, if the narrow range is selected, the <
and > Hz buttons will allow you to scroll through this abbreviated frequency range only.
Both the screen and printout will still be labelled with the full range of frequencies i.e.,
125 Hz through 8000 Hz.
Exiting the program mode
1. Press the PROG button to exit the program mode and return to the test mode that was
operational prior to entering the program mode.
3-14 Revised 4/11/08
Page 49

Operation
Tympanometry/Reflex Test Sequence
a. Tympanometry only mode
1. Select the Ty mp o nl y mode by pressing Ty mp on the front panel. The display will
immediately show the format for the tympanogram along with the summary information
headers ECV, cm3, daPa, and GR. The default scale for compliance is 1.5 cm3. If a
compliance peak greater than 1.5 cm
3
compliance axis to 3.0 cm
so that more of the tympanogram data can be seen.
2. Determine which ear is to be tested and select the appropriate ear (R or L) button so that
the test results will be labeled properly.
3. Examine the ear canal of the ear to be tested to determine the appropriate size eartip for the
test and position the eartip on the probe. Be certain that the eartip is pushed as far down
the probe tip as possible so that the eartip is flush with the tip of the probe. Position
yourself so that you are at eye level with the test ear.
4. Note that the green lamp is blinking, which indicates that the instrument is ready to begin
the test.
5. Place the probe up against the entrance of the ear Canal so that its opening is completely
covered with the eartip and no visible leaks are apparent.
6. The test sequence begins once the instrument determines that a volume between 0.2 cm3
3
and 6.0 cm
is present. This is indicated by the green lamp changing from blinking to a
steady state. From this point on, hold the probe securely in this same position without any
hand motion. Keep your eyes on the probe and the individual’s ear.
At the start of the test, the pressure system establishes a pressure of +200 daPa within the
ear canal. When this pressure is achieved, the instrument makes a measurement of ear
canal volume. This information is valuable since it indicates whether a good seal has been
established and since it helps differentiate between two similar Tympanogram (i.e., a
fluid-filled middle-ear system and a perforated tympanic membrane). After the ear canal
volume (ECV) is obtained, this compliance value is subtracted from the remaining
compliance measurements so that a direct reading of the tympanogram compliance peak is
possible.
The pressure sweep begins at the starting pressure of +200 daPa and proceeds in the
negative direction at a rate of 600 daPa/second. Measurements of compliance are made
continuously as the pressure sweep continues in the negative direction. The slope of the
tympanogram increases as the measurement approaches the compliance peak. This signals
the instrument to slow down the rate of pressure sweep to 200 daPa/second to ensure a
more accurate reading of the compliance peak. After the peak compliance and pressure
values are detected and stored, the tympanogram dips downward toward the baseline (i.e.,
3
) and the pressure sweep rate increases back to 600 daPa/second. The tymp sweep
0 cm
ends automatically when the compliance value returns to baseline and the pressure is at
least -100 daPa. Only when the middle-ear pressure is very negative is it necessary for the
pressure sweep to continue all the way down to -400 daPa. This automatic stop when the
tymp compliance returns to baseline eliminates unnecessary pressurization of the ear and
shortens the test time.
3
is measured, the instrument automatically scales the
Revised 4/11/08 3-15
Page 50

TM 262
When the tympanogram is completed and the test is finished, the steady green lamp turns
off and the display displays the complete tympanogram results.
7. It is now possible to remove the probe from the ear and to view the test results on the
display.
The test results are automatically stored in a page of memory. The actual memory location
number is determined by the number of tests that preceded this current test. For example,
if this is the first test to be stored in memory, it will be assigned the number Ml. If it is the
third test to be stored in memory, it will be numbered M3, etc.
In addition to the tympanogram tracing, the screen displays the test summary information.
This data includes the ear canal volume (ECV), the compliance peak in cm
at the peak of the tympanogram in daPa, and the gradient (GR) as a pressure width value.
This test result can be printed out immediately as a single test by selecting the pushbutton
labeled print screen only or other tests can be run and saved before all tests in memory are
printed via the print all pushbutton.
b. Tympanometry and Ipsilateral Reflex
The default parameters for this test are tympanometry followed by an ipsilateral acoustic reflex
test at 1000 Hz. To change this default setting, select the desired frequencies for the test as
described in the next topic, b. Programming ipsilateral acoustic reflex test frequencies.
Once a seal is obtained, the tympanometry sequence is initiated. (See topic a. Tympanometry
only mode earlier in this chapter for detail.s As long as no large leak is encountered during
tympanometry (orange lamp illuminated) and no occlusion is detected (yellow lamp
illuminated), the test automatically sequences on to the reflex portion of the test as follows.
a. The pressure from the tympanogram peak compliance is re-established within the ear
canal and is offset by -20 daPa so as to avoid any problems with extremely sharp
tympanogram slopes.
b. With the air pressure held constant throughout the reflex test sequence, the lowest
intensity level for the starting frequency is presented and a measurement of
compliance change is made. If the compliance decreases by at least 0.05 cm, this
reflex intensity level is stored in memory.
c. If no other frequencies were selected for the test, the Tymp Reflex sequence ends
here. The display will indicate the reflex test result as a Yes, as an HL value, or as an
HL value plus a tracing of the reflex response curve. The default setting established
in the Program mode determines the manner in which the reflex result is displayed.
See Program Mode earlier in this chapter. Note that the green lamp is no longer
illuminated indicating that it is time to remove the probe from the ear.
d. If no response is measured (i.e., a compliance decrease of at least 0.05 cm3 was not
detected) at this lowest intensity level, the intensity level of the stimulus is
automatically increased by 10 dB. During this second presentation, a measurement of
compliance change is also made. If a response is detected, the test sequence for this
frequency ends and either the result is displayed on the screen or the test proceeds on
to the next frequency selected. However, if once again no response is detectable, the
intensity level is increased by 10 dB (e.g., 1000 Hz Ipsi = 105 dB HL) and the
stimulus is presented.
3
, the pressure
3-16 Revised 4/11/08
Page 51

Operation
e. After the compliance measurement is made and a response is detected, the highest
intensity level is stored as the reflex test result and displayed on the screen. If no
response is detectable at this third and highest intensity level, either a No or an NR
(depending upon Program mode setting) is indicated on the screen next to the
frequency tested label. If during any of the three stimulus presentations a large
pressure leak develops, an NT will appear on the screen next to the frequency where
it occurred and the test sequence is aborted.
f. The same sequence is followed for each test stimulus selected. The first stimulus
presentation occurs at the lowest level available for the stimulus selected. If a
compliance change of 0.05 cm
particular test stimulus ends at this lowest level. If no compliance change of at least
0.05 cm3 is detected, the test automatically increases the stimulus intensity by 10 dB
and this same frequency is repeated at this next higher level. Once again if a
compliance change of 0.05 cm3 is detected, this sequence ends at this level and the
intensity level is stored.
g. Finally, if there is no detectable response at the second intensity level, the test
automatically increases the stimulus intensity by another 10 dB and the same
stimulus is repeated for a third and final time. If a response is detected, this third level
is stored in memory as the test result. If no response is detectable at this third and
highest intensity level, the test is considered a no response (NR) or as a No depending
upon the program mode default setting. In other words, for each test stimulus
selected, a maximum of three different stimulus intensity levels are available for the
test. The test sequences through each of the intensity levels only if required to obtain
a measurable result. Thus, if the individual being tested responds to the lowest level,
there is no addition-al stimulus presentation necessary for this particular stimulus.
This test protocol aims to save test time and to limit the number of circumstances
where the higher level stimulus presentations are made.
The three intensity levels available vary with the frequency selected ipsilaterally as follows:
3
or greater is detected, the test sequence for this
IPSI Intensity Levels
500 Hz 80, 90,100 dB HL
1000 Hz 85, 95,105 dB HL
2000 Hz 85, 95,105 dB HL
4000 Hz 80, 90, 100 dB HL.
NOTE: Although four frequencies are available during the tymp and ipsilateral reflex test
mode, most situations require only one or two frequencies to be tested. You can choose from a
selection of the most commonly used frequencies. However, it is strongly recommended that
you select only one to two frequencies per test since holding the probe in the same position for
the length of time it takes to test four frequencies may become a problem for both you and the
individual being tested.
Revised 4/11/08 3-17
Page 52

TM 262
c. Programming ipsilateral acoustic reflex test frequencies
As mentioned earlier, the instrument defaults to a 1000 Hz test stimulus when the TYMP
REFLEX button is first pressed after receipt from the factory. However, any combination of
the four available frequencies (500, 1000, 2000, 4000 Hz) can be selected either temporarily or
as revised default parameters. To temporarily modify the default condition:
1. Press the Ty mp Ref lex button.
2. Select the desired frequencies by selecting or deselecting the appropriate frequency
buttons after. In this way, the actual test stimuli presented will be determined by the
frequency pushbuttons selected prior to beginning a test i.e., sealing the ear canal.
Each frequency selected will be indicated on the display as it is chosen. For example, if
2000 Hz is selected along with 1000 Hz, the label I 1000 will appear at the top of the first
column of numbers for reflex and I 2000 will appear directly below it. If 500 is also
selected, the screen will be modified so that I 500 appears at the top of the first column of
reflex numbers, I 1000 will appear directly below I 500 and I 2000 will appear at the top of
the second column of reflex numbers and directly to the right of I 500 and so on.
NOTE: There is a very definite pattern to the way in which these frequencies are positioned
on the screen; namely, the lowest frequency will be placed at the top of the first column for
reflex results followed by the next lowest frequency. If more than two frequencies are selected,
the third and fourth frequencies will be placed in the second column for reflex results in a ow to
higher frequency order.
To change the default frequencies for the Tymp Reflex mode:
1. Select the desired frequencies as described above.
2. Once you have reviewed them and are certain that they are the desired parameters, press
the M+ pushbutton. Note that the word SAVED appears on the display screen. Now every
time that you re-enter the Tymp Reflex mode, these revised default parameters will be
selected automatically. As mentioned above, it will still be possible to temporarily alter the
frequencies selected by choosing the desired frequencies. However, in this case each time
that the Tymp and Reflex test mode is exited and re-entered, the default parameters will
reappear. There is no limit to the number of times that the default frequencies can be
modified. It is a good practice to keep a record of the reflex default frequencies.
Exit tympanometry/reflex
To exit Tym p O nly Mo de:
1. Select Ty mp Reflex or Audiometry Mode. Note that the appropriate screen appears on
the display.
To exit Tym p/ Ref le x Mo de:
1. Select Ty mp or Audiometry Mode. Note that the appropriate screen appears on the
display.
3-18 Revised 4/11/08
Page 53

Operation
Audiometry Test Sequence (Models with Audiometer only)
To enter the audiometry mode:
1. Press the AUD button. Note that the display changes from a tymp or tymp and reflex
format to an audiogram format.
The default settings for the frequencies available during audiometry are set in the Program
mode as 125 through 8000 Hz (normal) or 500 through 6000 Hz (narrow). The default setting is
the normal frequency range of 125 through 8000 Hz. Upon entering the audiometry mode, the
starting frequency is automatically selected to be a steady signal of 1000 Hz at 0 dB HL. You
can change the signal format temporarily from steady (continuous) to a pulsed or frequency
modulated tone. These alternative tone formats remain selected as long as you remain within
that audiometric test. Once you leave that specific test by selecting either Tymp or Tymp
Reflex, or by initiating the next test, the tone type returns to steady. In other words, the tone
format is re-initialized to the steady tone format.The display indicates a continuous bar when
steady is selected, a dashed bar when pulsed is selected, and the letters FM when frequency
modulation is selected. Note that the audiometry test defaults to testing the right ear first. To
start with the left ear, it is necessary to press the L button after entering the audiometry mode.
Since the audiometry mode defaults to 1000 Hz at 0 dB HL, the cursor is positioned at the
corresponding location on the audiogram. Please note that even though you may have selected
the tabular format for the audiometric test results on the printout, the screen always appears in
the audiogram format.
To change to a frequency above 1000 Hz:
1. Press the > Hz pushbutton.
If the > Hz button is pressed once momentarily, the frequency increases to the next
frequency in the range i.e., 1500 Hz.
If the > Hz button is held down continuously, it is possible to quickly scroll through the
available frequencies. Note that if the button is held down past the 8000 Hz in the normal
range (6000 Hz for the narrow range), the frequency scroll wraps around to the lowest
frequencies (i.e., 125 Hz with the normal range and 500 Hz with the narrow frequency
range). The reverse occurs if the < Hz pushbutton is pressed.
In addition to changing the cursor position on the audiogram, the < and > Hz pushbuttons
cause the frequency value on the right-hand side of the display screen to change as well.
Revised 4/11/08 3-19
Page 54

TM 262
To change the intensity level of the test tone:
1. Rotate the dB HL knob in the clockwise direction to increase the intensity level in 5 dB
steps; rotate the knob in the counterclockwise direction to decrease the intensity level in 5
dB steps.
Note that cursor moves up and down accordingly. Also, note that the dB level displayed
above the frequency value on the right-hand side of the audiogram changes as well.
For each frequency, there is a fixed intensity range normally available while rotating the dB HL
knob as follows:
Frequency Intensity Range
125 Hz -10 to 50 dB HL
250 Hz -10 to 70 dB HL
500 to 6000 Hz -10 to 90 dB HL
8000 Hz -10 to 70 dB HL
However, in addition, it is possible to extend the intensity range per frequency by 10 dB simply
by pressing the +10 dB button. This +10 dB button may only be selected when the intensity
level is set to the highest value in the normal range. For example, with the test tone of 1000 Hz,
the normal intensity limit is 90 dB HL. Note that, when the intensity knob is rotated clockwise
to select beyond 90 dB HL, the intensity value above the 1000 Hz to the right of the audiogram
flashes indicating that the normal intensity limit has been reached. To go beyond 90 dB HL,
select the +10 dB button. Note that a large + sign appears on the screen below the 1000 Hz
value. Now, the dB HL knob can be rotated through two additional positions, namely, 95 and
100 dB HL. If you rotate the dB HL knob to the next position beyond 100 dB, the intensity
value 100 flashes on the screen to the right of the audiogram; thereby, indicating that the
maximum dB HL for the extended range has been reached. If the dB HL is rotated one more
position beyond the flashing 100 dB position, the letters NR appear next to the letters dB above
the 1000 Hz. This permits the selection of the no response symbol on the audiogram during
testing. The extended range remains selected until either the intensity level for that particular
frequency (e.g., 1000 Hz) is brought down 5 positions below the maximum dB HL value (e.g.,
65 dB HL for 1000 Hz) or the frequency is changed. To save the threshold value per frequency,
press the M+ button. Note that the appropriate symbol (0 for right ear and X for left ear) for the
ear under test is positioned at the correct location on the audiogram. If no response (NR) was
detectable over the intensity range available, an arrow is attached to the 0 or X symbol on the
audiogram. It is possible to repeat a threshold check for any frequency by returning to that
frequency by way of the < and > Hz buttons. In this instance, the last threshold obtained and
saved with M+ button becomes the value saved in memory and is the value printed out on the
audiometric test results.
To present each test tone to the selected test ear, press the Present bar. A speaker symbol with
an arrow pointing from it appears on the screen between the audiogram and the dB/ Hz values
for as long as the Present bar is depressed.
NOTE: Although the printout will combine the right and left ear test results on the same
audiogram or table, the screen can display only the results from one ear at a time. Therefore, if
an ear pushbutton (R or L) is selected while you are still testing a particular ear, the screen will
change to a new audiogram. Once this happens, it is not possible to return to the incomplete
audiogram to complete the test sequence.
3-20 Revised 4/11/08
Page 55

Operation
Screening audiometry
1. Carefully position the earphones over the individual’s ears so that the red phone covers
the right ear and the blue phone covers the left ear.
2. Be sure that nothing is obstructing each earphone such as earrings, eye glasses or a hearing
aid.
3. Instruct the person being tested to raise a hand or a finger (or press the optional
Handswitch) whenever a tone is heard.
4. Encourage the patient to respond even if he/she is not sure whether a tone is heard.
5. Select the ear to be tested with the R (right) or L (left) button.
6. Select the desired screening intensity by rotating the dB HL knob to the appropriate
position. The American Speech Language and Hearing Association recommends 20 dB as
the screening level for school-age children.
7. Select the desired frequency at which to start the test by pressing the < or > Hz
pushbuttons.
8. Present the selected intensity via the Present bar.
9. If the individual fails to respond, increase the intensity by 10 dB and try again. Press the
M+ pushbutton at the intensity level where the individual responded.
10. Continue the procedure for all the desired frequencies.
11. These results can be printed in an audiogram or tabular format. Check the Program mode
to determine which setting has been selected.
Threshold audiometry
1. As described earlier, carefully position the earphones and select the ear to be tested first.
2. Familiarize the individual with the test protocol by presenting a tone of 40 dB HL at 1000
Hz.
3. Decrease the intensity in 10 dB steps until the person no longer responds or until you reach
0 dB HL.
4. When you believe the individual understands the procedure, (i.e., raise your hand/finger
when you hear a tone) proceed with the test protocol. The level of the first presentation
generally is 10 dB below the level at which the individual responded during the
familiarization procedure.
5. Starting at the desired test frequency, present the tone for a period of one or two seconds.
Revised 4/11/08 3-21
Page 56

TM 262
6. If a response is indicated,
a. decrease the intensity of this same test frequency by 10 dB and present the tone again
for one to two seconds.
b. If no response is indicated, increase the intensity by 5 dB. Present the tone again.
c. If no response is indicated, increase the intensity by another 5 dB.
d. If a response is indicated, this is the second time that the individual responded to the
same intensity level. Repeat the sequence of down 10 dB and up in 5 dB increments
to determine if a correct response is again detected at the same intensity level. The
threshold is considered to be the minimum level at which a response has occurred two
out of three times. Press the M+ button when this intensity level is indicated on the
screen above the test frequency to signify that the threshold level for that frequency
has been reached. Note that the appropriate symbol (0 = right, X = left) appears at the
correct intensity level where the threshold was determined.
7. Repeat this test sequence for each frequency to be tested.
8. Once the thresholds have been obtained for all the desired frequencies, select the other ear
and repeat the sequence. Note that the display changes to a new screen for storing the
second ear’s results. The test protocol follows a down 10 dB and up 5 dB sequence to
arrive at the threshold level.
Exit audiometry
There are two ways to exit the audiometry mode:
a. Select the Ty mp mode button
- or -
b. Select the Tym p Re flex mode.
Note that the appropriate screen appears on the display.
3-22 Revised 4/11/08
Page 57

Operation
Tests in memory
The Tymp and Tymp Reflex test results are automatically stored in memory when the test
sequence ends. Audiometric test results are stored in memory when M+ is pressed. A total of
eight memory locations are available with the TM 262. Each test result is assigned a memory
location number in order of sequence obtained starting with Ml and continuing up to M8.
To review the individual test results, press the PAGE button. Note that the screen contains the
appropriate format for each test type stored (e.g., tympanogram or audiogram). The memory
number is located in the upper right-hand corner of each screen. If, for example, only five tests
were stored in memory, only five memory locations can be scanned. The memory can be
scanned a page at a time by pressing the PAGE pushbutton once and observing the result. The
entire memory can be scrolled through by holding the PAGE pushbutton down continuously.
Memory erase
If there is a particular test result that you wish to delete before printing, PAG E to this test result
and press M-. This erases that particular test result from memory. The LCD displays a blank
screen for erased memories with the memory location number located at the top right corner.
Upon exiting from the Erase mode, the stored memories reshuffle and replace the empty
memory with the remaining tests in the order in which they were run. The Erase mode will be
exited once you press the PRINT ALL or ERASE ALL buttons or any pushbutton that would
normally begin the setup of a new test. Please note that when the Erase mode is entered, a
current audiogram is no longer accessible to change or to store new HL values.
NOTE: The instrument is programmed to default to the right ear at 0 dB and 1000 Hz upon
selection of a new audiometric test.
If you should wish to erase all tests from memory, press the M-- (ERASE ALL) pushbutton.
For example, the test results have been printed and you wish to test another person.
NOTE: Be certain that you wish to remove all tests from memory before pressing the M--
pushbutton because the erasure occurs immediately upon pressing the M-- pushbutton!
Revised 4/11/08 3-23
Page 58

TM 262
Printing test results
The printout will begin with a header if it is selected during the program mode (i.e., TM 262 or
a custom header designed by you). The next two lines contain space for entering the individuals
name and the test date. This is followed by the test results in the order that they were obtained/
selected.
Either a single test can be printed from memory or the entire group of tests in memory can be
printed. To print a single test from memory, use the PAGE button to arrive at the desired test
result to print. Once this test is displayed, press the PRINT SCREEN button.
To print all tests in memory, press the PRINT ALL button. When PRINT ALL is pressed and
two audiogram tests are stored in memory, they will combine under the following conditions.
There must be one left test and one right test sequentially stored in memory. A left and right
audiometric pair of tests will not be combined if they are separated in the memory by a Tymp
test. Therefore, when tests are erased, the resorting could cause a change in left, right or right,
left sequence with Audiometric tests. This would result in the wrong audiometric tests being
combined when PRINT ALL is selected. Prior to selecting PRINT ALL you should scroll
through the tests in memory to determine where the audiometric tests are located. This will help
you avoid combining tests from different patients.
3-24 Revised 4/11/08
Page 59

Test Results
Chapter 4
Test Results
Revised 4/11/08 4-1
Page 60

TM 262
Blank page.
4-2 Revised 4/11/08
Page 61

Test Results
Ear Canal Volume
Normal
As a general rule, values for ear canal volume should be between 0.2 and 2.0 cm3. However, the
normal values will vary with age and bone structure.
Abnormal
An ear canal value of less than 0.2 cm3 indicates an abnormal condition. If the probe is partially
plugged with cerumen or if the probe is positioned up against the ear canal wall, a smaller than
expected value will be measured. Also, if an individual has a relatively large bone structure for
his/her age group and a smaller than expected value is measured, the probe could also be
partially occluded or up against the canal wall. It is also possible to collapse the canal if the
probe is held too firmly against it. Examine the Tympanogram and the reflex results to confirm
your suspicions. If they are abnormal as well, it is good practice to repeat the test.
3
An ear canal volume greater than 2.0 cm
important application of the ear canal volume measurement is to determine if there is a
perforation of the tympanic membrane. If there is a perforation due to trauma or due to the
presence of a pressure-equalization (P-E) tube, the measured ear canal volume will be much
larger than normal since the combined volume of the ear canal and the middle-ear space is
being measured.
also may indicate an abnormal condition. An
Compliance Peak
Normal
The range of normals for compliance is 0.2 cm3 to approximately 1.4 cm3. Some groups use a
larger range up to 1.8 cm
mobility within the middle-ear system.
3
. A measured compliance peak within this range indicates normal
Abnormal
A compliance value of less than 0.2 cm3 indicates a pathological condition as the middle-ear
system is stiffer than normal. To distinguish the probable cause of the stiffening, the pressure
value where this stiffened compliance peak occurs needs to be considered. For example, normal
pressure along with a stiff middle ear system is indicative of a “glue-ear”, otosclerosis, a
severely scarred tympanic membrane or a layer of plaque across the tympanic membrane. On
the other hand, abnormal pressure along with a stiffened middle-ear system is consistent with a
poorly functioning eustachian tube with possible effusion (serous otitis media).
NOTE: If the measured compliance value is less than 0.1 cm
next to the heading cm
or flat Tympanogram. The Tympanogram may depict a very shallow peak.
A compliance value greater than 1.4 cm
membrane or a possible disarticulation depending upon how far above the normal range the
value is. Generally speaking, a compliance value of greater than 3.0 cm3 is indicative of a
disarticulated ossicular chain. Further testing is necessary to confirm this suspicion.
Revised 4/11/08 4-3
3
on the screen and printout. The letters “NP” indicate a poorly defined
3
(or 1.8 cm3) indicates a hyperflaccid tympanic
3
, the letters NP will be printed
Page 62

TM 262
NOTE: If a compliance value is measured to be greater than 1.5 cm, the instrument changes
the range assigned to the graph automatically and the tympanogram is traced to 3.0 cm.
The validity of tympanometry and acoustic reflex testing is dependent upon a healthy tympanic
membrane. A pathological condition at this membrane can mask the true condition of the
middle ear.
Pressure Peak
Normal
Strict rules for middle-ear pressure indicate a normal range of ±50 daPa. However, for most
applications, a normal range of -150 daPa to +100 daPa is used.
Abnormal
Very rarely will you obtain an extreme positive pressure condition. Some researchers have
reported high positive pressures at the onset of acute otitis media.
Pressure values more negative than -150 daPa are indicative of a poorly functioning eustachian
tube. The severity of this condition is determined by how negative the pressure is and its impact
on the compliance peak.
If no pressure peak is measured over the pressure range of +200 daPa to -400 daPa, then the
letters NP will appear on the screen and the printout. This indicates that no pressure peak was
detected over this pressure range.
Gradient
Normal
When testing a child, the normal range for the gradient is between 60 and 150 daPa. (Infants
may show higher gradient values due to the mobility of their ear canals.) The range of normal is
somewhat narrower for adults i.e., 50 to 110 daPa.
Abnormal
A high gradient value (greater than the high end of the normal range per age group) is
indicative of middle-ear effusion. The reduced compliance values and negative middle-ear
pressure characteristic of developing or resolving otitis media with effusion (OME) will be
manifested in a broad tympanogram with a large gradient value. However, abnormal gradient
values may also be found in the absence of abnormal parameters. This could indicate a transient
OME, so a retest after several weeks may be recommended.
3
When the middle ear’s mobility is reduced to near 0 cm
condition, no gradient value can be measured. In this case, dashes (—) will be displayed next to
the letters GR.
Very low gradient values are associated with a flaccid middle ear system. These low values
should be taken into consideration with the ear canal volume and compliance peak values to
determine the probable use of the flaccid condition.
4-4 Revised 4/11/08
, due to viscous effusion or a “glue-ear”
Page 63

Test Results
Acoustic reflex
Normal
For screening purposes, an ipsilateral reflex measured at any one of the three levels available
per frequency can be considered normal. Obviously, the lowest values are desired. However,
without knowing the hearing threshold level of the individual per frequency, it is difficult to
make a more definite statement. Generally speaking, the reflex is reported to occur at between
70 and 90 dB HL above the hearing threshold in normals. Remember that these values apply to
reflex threshold measurements and that your instrument does not permit reflex threshold
measurements due to the use of a hand-held probe. The presence of a reflex in the absence of a
compliance peak suggests that the tympanometric results should be considered invalid and the
test repeated. This is true because if there is no compliance measured during tympanometry, it
is not possible to measure any stiffening affect during the reflex stimulus presentation.
Abnormal
If a pressure leak occurs during the reflex testing and the pressure system is unable to correct
for this leak, the reflex test sequence is aborted. When this occurs, the test results are assigned
the letters NT (N
If no response is obtained at the third and final stimulus level, the instrument will indicate this
with the letters NR or No. More detailed testing at the frequency where this occurred is
required to determine the reason for the no response.
ot Tested).
Audiometry
Normal
A normal response from a child should be at or below 20 dB HL. A normal response from an
adult will be somewhat higher at or below 25 dB HL. Remember that these normal values
assume a quiet environment during testing.
Abnormal
In children, a failure to respond to a 20 dB HL (or lower) stimulus presentation during a retest
performed four to six weeks after the initial test would indicate the need for more extensive
diagnostic testing to determine the cause.
In adults, a failure to respond at or below 25 dB HL when the room noise levels are low
indicates the need for more evaluation. However, the age and employment history of the
individual must also be considered.
Revised 4/11/08 4-5
Page 64

TM 262
Special Messages and Error Codes
Error code numbers and other “special” messages may be displayed on the screen or on the
printout. These messages appear whenever an instrument error occurs or, in some instances, to
apprise the operator of certain situations. For example, if there is no test result on the screen and
the print screen pushbutton is pressed, the printer will indicate “No Test To Print”
Error codes will appear as a two-digit number prefixed by the letter “E”. If an error code
appears, please repeat the operation that caused the error code to appear. If the error code
appears for the second time, make a note of it and contact your Welch Allyn Service
Representative, giving him/her the exact error code number.
Sample Test Results
Figures 1 through 10 illustrate test results from sample TM 262 Auto Tymp printouts. The
smoothness of the tympanogram tracing is determined by the amount of movement during the
testing. Little or no movement during the testing provides a smoother tracing. Moving, talking
or crying during testing leads to a more erratic looking tracing but does not dramatically affect
the test results.
Figure 1: Range of Normals
Figure 3: Abnormal Tymp
Figure 2: Abnormal Tymp
Figure 4: Abnormal Tymp
4-6 Revised 4/11/08
Page 65

Test Results
Figure 5: Abnormal Tymp
Figure 7: Abnormal Tymp
Figure 6: Abnormal Tymp
Figure 8: Abnormal Tymp
Figure 9: Abnormal Tymp
Revised 4/11/08 4-7
Figure 10: Abnormal Tymp
Page 66

TM 262
Blank page.
4-8 Revised 4/11/08
Page 67

RS-232 Interface
Chapter 5
RS-232 Interface
Revised 4/11/08 5-1
Page 68

TM 262
Blank page.
5-2 Revised 4/11/08
Page 69

RS-232 Interface
Introduction
The RS-232 Interface option provides the capability of transferring stored test results from the
instrument to an external computer or data collection device via an optically isolated serial
interface.
WARNING
!
may be connected to the Serial interface. Computers should meet the requirements of
IEC 60950-1 and be connected through an isolation transformer. Users should take
precautions to not touch the patient and equipment connected to the serial interface.
Only equipment that meet the requirements of IEC 60601-1-1 rating
Operation
Press the DATA TRANSFER button to transfer test results stored in memory. During data
transfer, the message “DATA TRANSFER” will appear on the LCD screen.
Transferring during normal operation
During normal testing operation, pressing the DATA TRANSFER button will transfer all
stored test results sequentially. The test results are transferred with one record for each memory
location in the order in which they are stored. Any test results which have been erased will not
be transferred.
Transferring from memory pages
If the PAGE button is used to review individual test results stored in any of the eight memory
locations, the DATA TRANSFER button will transfer only the currently displayed stored test
results. There is one exception to this rule: If the last (most recent) test result is displayed, the
instrument assumes normal testing operation, and transfers all test results.
Other LCD screen messages
“INVALID SELECTION
This message appears if the DATA TRANSFER button is pushed during any of the following
circumstances:
• During presentation of an audiometric tone
• During a tympanometry test
• During a reflex test
• During Printing
NO DATA AVAILABLE
This message appears if the DATA TRANSFER button is pressed and no results are stored.
NOT AVAILABLE
This message appears if the DATA TRANSFER button is pressed and the RS-232 interface is
not installed.
Revised 4/11/08 5-3
Page 70

TM 262
Record Formats
General record format
All output records are transmitted in a predefined, fixed length format. The generic format for
all records is:
“.”
Record
Typ e
Record
Sequence
Number
Record
Index
Number
Tot al
Record
Number
Data
Fields
Checksum “CR” “LF”
Each record contains only printable ASCII characters, other than the terminating “CR” “LF”
characters. Each record consists of fixed length data fields with any unused data fields filled
with a value of 0. The Record Sequence Number is a value from 0 to 9, which is incremented
by 1 for each new record transmitted. This value will wrap around from 9 to 0. A record will be
retransmitted with the same sequence number if retransmission is necessary due to a
communications error.
The Record Index Number is a value from 0 to 8 which indicates the record number within a
group of records when all test results are transmitted. For example this value will identity a
record as Record 1 of 5 or Record 7 of 8 when used in conjunction with the Total Record
Number. If only the currently displayed record is being transferred, this value will be 1.
The Total Record Number is a value from 1 to 8 which indicates the total number of records to
be transmitted in a group when all tests results are transmitted.
The Checksum is calculated as the mod 256 sum of all preceding characters in the record,
including the “:” prefix, with the most significant bit = 0 and stored as two Hex ASCII
characters.
5-4 Revised 4/11/08
Page 71

Tympanometry and Reflex test results record
RS-232 Interface
Character
Number
Number of
Characters
1 1 ASCII Start of record “.”
2 1 ASCII Record Type “x”
3 1 ASCII Record
4 1 ASCII Record Index
5 1 ASCII Total Record
6 5 ASCII Reserved Reserved for future use. Defaulted to “------”
11 2 uChar Ear Ear under test
13 4uintECV
17 4uintPeak
21 4 sint Peak Pressure The pressure where the peak compliance occurred,
25 4 sint Gradient Gradient value calculated as the pressure difference
29 2 sChar End Index The data index where the last compliance data point
Data
Type Field Name Field Description
Sequence
Number
Number
Number
Compliance
“0” to “9”
“1” to “8”
“1” to “8”
Bit 0 = 1 = Left ear under test
= 0 = Left ear not under test
Bit 1 = 1 = Right ear under test.
= 0 = Right ear not under
test
Bits 2-7 = Not used
Either the RIGHT ear is selected OR the LEFT ear
is selected. Both ears selected or no ear selected is
invalid.
3
cm
Ear canal volume in
stored as ECV x M.
Range = 0.00 to 6.00
Peak compliance in
64.
Range = 0.00 to 6.00
stored in daPa.
Range = 399 to 200 daPa
at the compliance half-peak points stored in daPa.
Range = -1 to 500 daPa
-1 = No gradient has been calculated
yet
0 = No gradient could be calculated.
is stored.
Range = -1 to 87
-1 = No data was stored.
measured at +200daPa,
3
cm
3
cm
, stored as compliance x
3
cm
Revised 4/11/08 5-5
Page 72

TM 262
Character
Number
Number of
Characters
Data
Type Field Name Field Description
31 2 sChar Slow Index The data index where the last compliance data point
measured at 600 daPa/sec before the rate changes to
200 daPa/sec is stored.
-1 = No rate change occurred
33 2 sChar Fast Index The data index where the first compliance data
point measured at 600 daPa/sec after changing back
to 600 daPa/sec from the 200 daPa/sec rate is
stored.
-1 = No rate change back occurred
35 2uCharTymp Data [0]
Tympanometry compliance data point #0 in
stored as: compliance X 64. Range = 0.00 to 3.98
3
cm
.
A maximum of 88 data points are stored per
Tympanometry test.
:::: :
209 2 uChar Tymp Data [87]
Tympanometry compliance data point #87 in
stored as: compliance X 64
211 2uCharTymp Scale
213 2 uChar Number of
Reflex Tests
215 2 uChar Reflex Test
Parameters
Tympanometry compliance axis scale. 15 = 1.5
cm
3
30 = 3.0
The number of reflex tests performed Range = 0 to
4
Reflex test selection parameters.
Bit 0 = Ispi status:
0 = Not selected
1 = Selected
Bit 1 = Contra status:
0 = Not selected
1 = Selected
Bit 2 = 500 Hz status:
0 = Not selected
1 = Selected
Bit 3 = 1000 Hz status:
0 = Not selected
1 = Selected
Bit 4 = 2000 Hz status:
0 = Not selected
1 = Selected
Bit 5 = 4000 Hz status:
0 = Not selected
1 = Selected
Bits 6 & 7 = Not used
cm
cm
3
cm
,
3
,
3
5-6 Revised 4/11/08
Page 73

RS-232 Interface
Character
Number
Number of
Characters
Data
Type Field Name Field Description
217 2 uChar Reflex #1
Result
Results of Reflex test #1
Bits 1 & 0 = dB level tested:
00 = Low dB level
01 = Middle dB level
10 = High dB level
11 = Invalid
Bits 3 & 2 = Reflex tests status:
00 = NT = Not Tested
01 =YES = Yes, a reflex was detected
10 = NR = No Reflex detected
11 = NT_CAL = Not Texted due to a
CALibration data error
Bits 5 & 4 = Test frequency:
00 =500 Hz
01 = 1000 Hz
10 = 2000 Hz
11 = 4000 Hz
Bits 6 = Test type:
0 =IPSI
1 = Contra
Bit 7 = Not used
219 4 uint Reflex #1
Average baseline compliance, in
Baseline
Average
223 4 uint Reflex #1
Average reflex compliance, in
Reflex Average
227 4 uint Reflex #1
Reflex [0]
Reflex compliance data point #1 of 4, in
256.Bit 15 = Noise indicator0 = Quiet data
measurement1 = Noisy data measurement,
potentially unreliable
:::: :
239 4 uint Reflex #1
Reflex [3]
Reflex compliance data point #4 of 4, in cm 3
X256.Bit 15 = Noise indicator0 = Quiet data
measurement1 = Noisy data measurement,
potentially unreliable
243 4 uint Reflex #1
Recovery [0]
Reflex recovery compliance data point #1 of
6measured after the stimulus is turned off, in cm
256,Bit 15 = Noise indicator0 = Quiet data
measurement1 = Noisy data measurement,
potentially unreliable
:::: :
cm
cm
3
X 256
3
X 256
cm
3
X
3
X
Revised 4/11/08 5-7
Page 74

TM 262
Character
Number
Number of
Characters
263 4 uint Reflex #1
267 asst Reflex #2 See Reflex #1 format.
317 asst Reflex #3 See Reflex #1 format.
367 asst Reflex #4 See Reflex #1 format.
417 2 uChar Checksum The hexadecimal sum of characters 1 to 416
419 2 ASCII Package
Data
Type Field Name Field Description
Recovery [5]
Ter minator
Reflex recovery compliance data point #5 of
6measured after the stimulus is turned off, in cc X
256,Bit 15 = Noise indicator0 = Quiet data
measurement1 = Noisy data measurement,
potentially unreliable. The recovery points #5 and
#6 are only included when the recovery is slow and
there was no recovery according to the first four
recovery data points. If not included, their values
will be 0.
“CR, “LF”
5-8 Revised 4/11/08
Page 75

Audiometry test results record
RS-232 Interface
Character
Number
1 1 ASCII Start of record “.”
2 1 ASCII Record Type “y”
3 1 ASCII Record Sequence Number “0” to “9”
4 1 ASCII Record Index Number “1” to “8”
5 1 ASCII Total Record Number “1” to “8”
6
11
13
::: : :
53 4 sint HL Threshold 8000 Hz -10 to +100 dB HL x 2
57 2 uChar Checksum The hexadecimal sum
59 2 ASCII Package Terminator “CR”, “LF”
Number of
Characters Data Type Field Name Field Description
5
2
4
ASCII
uChar
sint
Reserved Ear
HL Threshold 125 Hz
Either the RIGHT ear
is selected OR the
LEFT ear is selected.
Both ears selected or
no ears elected is
invalid.
-10 to +100 dB HL x 2
NR = Any value in the
range of 231 to 450
NT = 32,768 (0x8000
Hexadecimal)
NR = Any value in the
range of 231 to 450
NT = 32,768 (0x8000
Hexadecimal)
of characters 1 to 56
Notes
1. “uChar” & “sChar” designate unsigned and signed characters respectively, single bytes
represented in Hexadecimal by two ASCII characters.
Example: OxE9 is sent as: “E”, “9”
2. “ulnt: and slnt” designate unsigned and signed 16-bit integers respectively, expressed in
HiByte/ LowByte sequence by four Hex ASCII characters.
Example: OxE196 is sent as: “E”, “1', “9”, “6”
3. Tympanometry compliance values are stored in the record scaled by 64. To convert to cm3,
divide by 64.
Example: Tymp Data[0] = “4”, “2” = 0x42=66 decimal scales X64 = 66/64 = 1.0-3 cm
4. Reflex compliance values are stored in the record scaled by 256: To convert to cm3, divide
by 256.
Revised 4/11/08 5-9
3
Page 76

TM 262
Example: Reflex #1 Reflex [0] = “0”, “3”, “0”, “D” = Ox3OD = 781 decimal scaled X 256
= 781 /256 = 3.051 cm
5. Audiometry Threshold values are stored scaled by 2 in the sequence of 125 Hz, 250, 500,
750, 1000, 1500, 2000, 3000, 4000, 6000 and 8000 Hz.
Example: HL Threshold 125 Hz = “0”, “0”, “9”, “6” = 0x96 = 150 decimal scaled x 2 =
150/2 = 75 dB
6. The pressure at which a Tympanometry compliance value was measured at is not
contained in the data record but may be calculated.
At the start of each pressure sweep, the pressure sweep rate is 600 daPa/sec. If the
compliance begins to rapidly increase, the pressure sweep rate changes to 200 daPa/sec
and remains at that rate until the compliance rate of change has sufficiently slowed down
to allow the pressure sweep rate to return to 600 daPa/sec.
While the pressure sweep rate is 600 daPa/sec, a compliance data point is stored at every
12 daPa drop in pressure and at 200 daPa/sec a compliance data point is stored at every 3
daPa drop in pressure. The Slow Index and Fast Index values in the data record indicate
where the pressure sweep rate changes, if any occurred.
7. Reflex compliance values are stored in three groups: 1 Reflex Baseline Average value
which is the reference measurement performed before the stimulus is presented, 4 Reflex
compliance data points which are measured while the stimulus is presented and stored as
the relative compliance change form the Baseline Average value, and 4 to 6 Reflex
recovery compliance data points which are measured after the stimulus is turned off and
stored as the relative compliance change form the Baseline Average value.
3
5-10 Revised 4/11/08
Page 77

RS-232 Interface
Data Transmission Protocol
The RS-232 Interface uses a Auto Repeat Request (ARQ) communications protocol to ensure
the reliable transfer of data. With this protocol. the instrument will transmit a data record and
then wait for a response from the external device. If the external device receives the record correctly, is should respond with an acknowledge “ACK” character (ASCII control character
ACK). If the record is not received correctly, the external device should respond with a Not
AcKnowledge “NAK” character (ASCII control character NAK.)
If an ACK is received within 3 seconds of the completion of the transmission, the transmission
has been completed successfully. The “DATA TRANSFER” message is erased and normal
operation resumes.
If after the transmission of a record there is no response within three seconds, the record is
retransmitted with the same Record Sequence Number. If such a timeout occurs after the
second attempt, then the message “NO RESPONSE” is displayed, any pending transmissions
are aborted, and normal operation resumes
If a NAK response is received during a transmission or within three seconds after the transmission is completed, the record is retransmitted with the same Record Sequence Number. If the
transmission is not acknowledged within three attempts the message ‘TRANSFER NOT COMPLETE” is displayed for about three seconds, any pending transmissions are aborted, and
normal operation resumes.
The NAK responses and timeouts are treated independently. Thus, when a combination of
errors is happening, the NAKs and timeouts are being counted separately. If the transfer is not
successful, the error message displayed corresponds to the failure condition that occurs first.
The only expected response from the external device to your instrument is an ACK or a NAK
character. When a series of records are transmitted, the external device must ACK or NAK after
each record.
Revised 4/11/08 5-11
Page 78

TM 262
Data Transfer Program Mode
The Data Transfer Program mode is used to modify the RS-232 interface configuration parameters to match the computer’s RS-232 parameters. To enter the Data Transfer program mode,
1. Enter the User Selections Program mode by selecting the PROGram pushbutton.
Press the DATA TRANSFER button.
The following screen appears the first time the Data Transfer Program mode is entered
showing the default settings set at the factory.
PROGRAM MODE - DATA TRANSFER
19.2 kBAUD * NO PARITY + 8-BIT DATA
* 9600 BAUD ODD PARITY + 7-BIT DATA
4800 BAUD EVEN PARITY + 7-BIT DATA
2400 BAUD SPACE PARITY + 7-BIT DATA
1200 BAUD * XON/XOFF FLOW DISABLED
600 BAUD XON/XOFF FLOW ENABLED
These selections fall into three difference groups of control:
• Baud rate
• Parity and data bits
• Flow control
The default setting for each group has an asterisk (*) before it so that it is easy to scan the settings for each group.
Selecting difference default settings for any of the groups is done in the same manner as the
Program mode.
1. Use the <Hz or >Hz buttons to move the solid square cursor down or up to the setting that
you wish to select.
2. Press the M+ pushbutton. The word SAVED will appear in the lower right margin of the
screen and the asterisk (*) will be repositioned in front of the new setting.
Exit the Data Transfer Program mode by selecting either the DATA TRANSFER or PROGram
pushbuttons. This will return you to the User Selections Program mode which can be exited by
selecting PROGram a second time.
5-12 Revised 4/11/08
Page 79

RS-232 Interface
RS-232 Interface
Interface configuration
The configuration of the TM 262 RS-232 interface must be set to match the interface configuration of the computer. The TM 262 defaults to 9600 baud, no parity, 8 data bits, 2 stop bits and
no communications flow control. The default settings for the baud rate, parity, number of data
bits and flow control may be modified using the Data Transfer Program Mode explained
earlier in this chapter.
Cable connections
The RS-232 interface provides a serial interface consisting of RxD (Received Data) and TxD
(Transmitted Data) using a standard DB-25 female connector. A straight through cable can be
used to connect to either a 25 pin or 9 pin (using an appropriate adapter) connector on the external device.
TM 262
(25 pin)
TD 2
RD 3
Signal 7
Ground
Computer
(25 pin)
2 TD
3 RD
7 Signal Ground
TM 262
(25 pin)
TD 2
RD 3
Signal 7
Ground
Computer
(25 pin)
2 TD
3 RD
7 Signal Ground
Communications flow control
Software XON/XOFF flow control is available to allow software commands from the external
computer to start and stop the flow of data from your instrument. No hardware flow control is
provided. Sending XOFF (ASCII control character [DC3]) to the instrument pauses its
transmission.
Sending XON (ASCII control character [DC1]) to your instrument resumes the transmission.
Once XOFF is received by the instrument, XON must be received within six seconds. If not
received within this time, then the message “NO RESPONSE” is displayed for about three
seconds, transmission is aborted, and normal operation resumes.
After an XOFF timeout, the next transmission waits for XON to be received within six seconds
as described above.
These commands are valid only during data transmission and when enabled in the Data
Transfer Program Mode.
Revised 4/11/08 5-13
Page 80

TM 262
Blank page.
5-14 Revised 4/11/08
Page 81

Bibliography
Chapter 6
Bibliography
American Speech-Language-Hearing Association (1990). “Guidelines for Screening for
Hearing Impairment and Middle Ear Disorders”. ASHA, 32 (Suppl.2), 17-24.
Criteria for Permissible Ambient Noise During Audiometric Testing (ANSI S3.1 - 1977).
de Jonge, R.R. (1986). “Normal Tympanometric Gradient: A Comparison of Three Methods”.
Audiology, 26, 299-308.
Koebsell, K.A., & Margolis, R.H. (1986). “Tympanometric Gradient Measured from Normal
Pre-School Children”, Audiology, 25, 149-157.
Margolis, R.H., & Heller, J.W. (1987). “Screening Tympanometry: Criteria for Medical
Referral”. Audiology, 26, 197-208.
Margolis, R.H. & Shanks, J.E., “Tympanometry”. In Katz, J.(Ed.),. Handbook of Clinical
Audiology, Ed.3., Baltimore: Williams & Wilkins, 1985.
Michael, P.L., and Bienvenue, G.R., “Noise Attenuation Characteristics of Supra-Aural
Audiometric Headsets using the Models MX41/AR and 51 Earphone Cushions,”
J.Acoust.Soc.Am., 70(5), Nov.1981, 1235-1238.
Methods for Manual Pure-Tone Threshold Audiometry (ANSI S3.21 1978). Newby, H.A.,
AUDIOLOGY (4th Ed.). New Jersey: Prentice-Hall Inc. (1979).
Paradise, J.L., Smith, C.G., Bluestone, C.D.(1976). “Tympanometric Detection of Middle Ear
Effusion in Infants and Young Children”, Pediatrics, 58 (2),198-210.
U.S. Department of Labor, Occupational Noise Exposure, CFR 1910.95, March 8, 1983.
Revised 4/11/08 6-1
Page 82

TM 262
Blank page.
6-2 Revised 4/11/08
Page 83

Specifications
Chapter 7
Specifications
Revised 4/11/08 7-1
Page 84

TM 262
Blank page.
7-2 Revised 4/11/08
Page 85

Specifications
Specifications
Standards: UL 60601-1 Medical Electrical Equipment Requirements for Safety
IEC/EN 60601-1 General Requirements
CSA C22.2 No.601-1-M90
ANSI S3.39-1987 Aural Acoustic Impedance Admittance (Type 3) IEC 1027-1991
Aural Acoustic Impedance/ Admittance (Type 3 ANSI S3.6-1989 Audiometers
(Type 4)
IEC 60645-1 Pure Tone Audiometers (Type 4)
PTB Certificate No. 15.11-94/53 Pure Tone Audiometers (Type 4)
Protective Classification: This system is intended for continuous operation and has
a protective classification of Class II, Type B.
Class II Type B equipment symbols
Tympanometry/Reflex modes
Probe Tone: 226 Hz, ±3%
Sound Pressure Level: 85.5 dB SPL, ±2.0 dB, measured in a 2.0 cm
Harmonic Distortion: <5%
Admittance (Compliance) Range: 0 to 1.5 cm
0 to 3.0 cm
3
3
NOTES:
1. The range is automatically selected based upon the
amplitude of the compensated (tymp only)
tympanogram.
2. The maximum uncompensated (ECV + tympanogram
peak) admittance (compliance) range is 0 to 5.0 cm
3. ECV/cavity limits for initiating pressurization is 0.2 to
3
6.0 cm
. Compliance Accuracy: ±0.1 cm3 or ±5%,
whichever is greater
Pneumatic system
Pressure Range: +200 to -400 daPa
NOTES:
1. daPa = 1.02 mmH20
2. Pressure sweeps to at least -100 daPa. To save test
time, pressure
3. Sweep stops once tympanogram returns to baseline
after -100 daPa.
4. Full pressure sweep for 6 cm3 from sea level to 7000 ft.
altitude with no leak.
Pressure Accuracy: ±10 daPa or ±15%, whichever is greater
3
coupler
3
.
Revised 4/11/08 7-3
Page 86

TM 262
Rate of Sweep: 600 daPa/sec except near tympanogram peak where
sweep rate slows to 200 dapa/sec to provide better
definition of peak compliance.
Direction of Sweep: Positive to negative
Tymp Test Time: Approximately 1 second
NOTE: High compliance tympanograms will take
somewhat longer.
Gradient: Tympanogram pressure with at 50% of peak compliance.
Acoustic Reflex Stimuli
Frequencies: 500, 1000, 2000, and 4000 Hz
Accuracy: ±3%
Total Harmonic Distortion: <5%
Rise/Fall Time: 5 to 10 msec
Output Levels:
IPSI: 500 and 4000 Hz80, 90,100 db HL
1000 and 2000 Hz85, 95, 105 dB HL
NOTES:
1. psi stimuli are time multiplexed with probe tone (106
mS ON, 53 mS OFF).
2. Stimuli are presented at lowest level first. If there is
no response, the intensity is increased by 10 dB until
a response is detected or the maximum dB HL is
reached.
Pressure: Automatically set to pressure at peak compliance with an
offset of -20 daPa.
3
Reflex Determination: Compliance change of 0.05 cm
Reflex Test Time: 1 to 12 seconds depending upon the number of ipsi test
frequencies selected (4 maximum) and intensity required.
or greater.
Probe LED Indicators
Steady yellow: Occlusion
Blinking green: Ready to start
Steady green: Testing test in progress
Steady orange: Leak
7-4 Revised 4/11/08
Page 87

Specifications
Audiometry mode (Model No. 26230, No. 26230-RS, No. 26235, No. 26235-RS only - marked “Version 4”)
Frequencies: 125, 250, 500, 750, 1000, 1500, 2000, 3000, 4000, 6000,
8000 Hz
Accuracy: ±3%
Total Harmonic Distortion: < 3% (125 to 3000 Hz measured acoustically at maximum
dB HL; 4000 and 6000 Hz measured electrically)
Power
Line Voltage: 100 - 240 VAC (±10%)
NOTE: Desktop power supply.
Frequency Range: 47 - 63 Hz (±5%)
Line Voltage Current: 0.2 A at 120 VAC or 0.1 amps at 240 VAC
Power Consumption: 30 watts maximum while printing. Low voltage input for
desktop power supplies 12 VDC, 2.5 A
Environmental
Temperature:
Operating: 60 to 105 deg. F (15 to 40 deg. C)
Relative Humidity: 20-80% noncondensing
NOTE: Warm-up time is required if storage temperature is
different from room temperature.
Storage: -30 to 149 deg. F (-34 to 65 deg. C)
Humidity: 5% to 90%
Shipping Conditions:
Normal instrument shipping conditions may exceed
recommended storage and operating specifications. Original
instrument packaging has been designed to allow shipment
and storage in typical shipping conditions for up to 60 days.
Typical shipping conditions may range in temperature from 34 degrees C to 65 degrees C, and humidity levels may vary
from 15% - 95%, noncondensing.
Mechanical
Dimensions: 13.15" W x 14.5" D x 4.3" H
33.66 cm W x 35.56 cm D x 9.53 cm H
Weight: 10 lbs (5.0 kg) net
14 lbs (5.0 kg) shipping
Revised 4/11/08 7-5
Page 88

TM 262
Intensity Levels
125 Hz -10 to 50 dB HL
500 to 6000 Hz-10 to 90 dB HL
250 and 8000 Hz-10 to 70 dB HL
NOTE: An additional +10 dB is available per frequency via
the +10 dB pushbutton.
Accuracy: 125 to 4000 Hz ±3 dB
6000 and 8000 Hz ±5 dB
Step Size: 5 dB
Signal-to-Noise Ratio: > 70 dB in 1/3 octave; less than -10 dB HL for levels less than
60 dB HL
Rise/Fall Time: 20 to 50 msec
Tone Format: Tone is normally off until present bar is depressed.
Continuous Steady when present bar is depressed
Pulsed 2.5/sec (i.e., 200 msec ON, 200 msec OFF)
FM (frequency modulated) 5 Hz, ±5%
Transducers
IPSI: Welch Allyn design
Audiometric Headset:
Pair TDH-39 earphones with MX41AR cushions
(60 ohms impedance)
Headband force per ANSI S3.6 and IEC 645 (4.5 ±0.5)N
(Model No. 26230, No. 26230-RS, No. 26235, No. 26235-RS
only - marked “Version 4”)
Printer
Paper Roll Length: Approximately 80 feet (960")
Tests/Roll:
Versions 1 and 2: Approximately 420 Tymps/Reflex or 210 people
Versions 3 and 4: Approximately 230 tests or 115 people
Assumption: 2 Tymps/Reflex + 1 Audiogram per person)
Speed: Approximately 1.5 minutes to print three screens:
Tym pan ogram
Tympanogram + reflex (4)
Audiogram
7-6 Revised 4/11/08
Page 89

Specifications
Supplied accessories
Probe (all versions) 1738-3200
TDH-39 Headset (model numbers 26230/26235 only) #23223
Test Cavity (all versions) #26241
Eartips, (Probe) 6 sizes, 2 each (all versions) #26100
Paper 5 rolls thermal 3" wide (all versions) #52601 qty: 5
Optional Accessories
Carrying Case #05260
Dust Cover #26240
Patch Cord (1) #23221
Subject Response Handswitch #23220
Earphone Sound Enclosures #23222
RS-232 Cable (10' - DB-25 M/F Straight Through) #26243
RS-232 Cable Adaptor (DB-25M/DB-09F) #26244
Eartips
8mm, 1 box of 25 #26008
11mm, 1 box of 25 #26011
13mm, 1 box of 25 #26013
15mm, 1 box of 25 #26015
17mm, 1 box of 25 #26017
19mm, 1 box of 25 #26019
Replacement Paper #52601
Revised 4/11/08 7-7
Page 90

TM 262
Catalog Listing
Tymp and Ipsi Reflex
TM 262 Auto Tymp (USA) #26200
TM 262 Auto Tymp (Export, specify country and voltage) #26205
TM 262 Auto Tymp (Includes RS-232 Interface) (USA) #26200-RS
TM 262 Auto Tymp (Includes RS-232 Interface)
(Export, specify country and voltage) #26205-RS
Tymp and Ipsi Reflex and Manual Audiometer
TM 262 Auto Tymp (USA) #26230
TM 262 Auto Tymp (Export, specify country and voltage) #26235
TM 262 Auto Tymp (Includes RS-232 Interface) (USA) #26230-RS
TM 262 Auto Tymp (Includes RS-232 Interface)
(Export, specify country and voltage) #26235-RS
7-8 Revised 4/11/08
Page 91

Index
A
Accessories supplied 2-3
Acoustic reflex 4-5
Altitude adjustment 2-13
Ambient noise 2-15
Audiogram range 3-14
Audiometric Checks (Models with
Audiometer only) 2-15
Audiometric format during printing 3-13
Audiometry 4-5
Audiometry test results record 5-9
Audiometry Test Sequence (Models with
Audiometer only) 3-19
Audiometry testing information 3-10
B
Bibliography 6-1
Biological Check 2-16
Bottom Panel Labels and Connectors 2-9
C
Cable connections 5-13
Calibration 2-12
Cleaning the system 3-3
Communications flow control 5-13
Compliance Peak 4-3
Connectors 2-9
Controls and Indicators 2-5
D
Data Transfer Program Mode 5-12
Data Transmission Protocol 5-11
Display 2-7
E
Ear Canal Volume 4-3
Earphone Care (Models with Audiometry
only) 3-7
Eartip care 3-3
Electromagnetic Compatibility (EMC) 1-a
Elimination of ambient noise 2-15
EMC 1-a
Error Codes 4-6
Exit audiometry 3-22
Exit reflex 3-18
Exit tympanometry/reflex 3-18
Exiting the program mode 3-14
F
Formats 5-4
Front Panel Controls and Indicators 2-5
G
General record format 5-4
Glossary of terms 1-10
Gradient 1-5, 1-6, 4-4
Green lamp 2-12
H
Helpful hints 3-8
I
Indicators 2-5
Initial set-up 2-10
Inspection 2-3
Installation 2-1
Instructing the patient/subject 3-10
Interface configuration 5-13
L
Labels 2-9
LCD screen messages 5-3
Loading the paper 2-10
M
Maintenance 3-3
Manual audiometry 1-8
Memory erase 3-23
N
Noise recovery period 2-15
Normal box format 3-14
O
Obtaining a seal 3-8
Operation 3-1
Orange lamp 2-12
O-Ring 3-5
P
Panel Controls and Indicators 2-5
Paper storage 2-11
Paper supply 3-7
Placement of earphones 3-10
Pressure Peak 4-4
Pre-Test Audiometric Checks (Models with
Audiometer only) 2-15
PreTest Tymp checks 2-12
Print header format 3-12
Printer and Display 2-7
Printing test results 3-24
Probe care 3-4
Probe Indicators 2-4
Probe nose cone cleaning 3-4
Probe reassembly 3-6
probe wire 3-6
Program Mode 3-11
Revised 4/11/08 i-1
Page 92

TM 262
R
Rear and Bottom Panel Labels and
Connectors 2-9
Record Formats 5-4
Recycling / disposal 1-9
Reflex 5-5
Reflex format 3-11
Reflex test results record 5-5
Reflex Test Sequence 3-15
Repair 1-b
Response handswitch (optional
accessory) 3-10
RS-232 Interface 5-1, 5-13
S
Sample Test Results 4-6
Screening acoustic reflex 1-7
Screening audiometry 3-21
Service and Repair 1-b
Special Messages 4-6
Specifications 7-1
T
Tests in memory 3-23
Threshold audiometry 3-21
TM 262 1-3
Transferring during normal operation 5-3
Transferring from memory pages 5-3
Tympanometry and Gradient 1-5
Tympanometry and Reflex test results
record 5-5
Tympanometry testing information 3-8
Tympanometry/Reflex Test Sequence 3-15
U
Unpacking and Inspection 2-3
W
Warranty 1-b
Y
Yellow lamp 2-12
i-2 Revised 4/11/08
 Loading...