

Page 1

TechSupport@OceanOptics.com
(Technical support)
QE65000 Scientific-grade Spectrometer
Install ation and Operation Manual
Document Number 220-00000-000-02-201303
Offices: Ocean Optics, Inc. World Headquarters
830 Douglas Ave., Dunedin, FL, USA 34698
Phone 727.733.2447
Fax 727.733.3962
8 a.m.– 8 p.m. (Mon-Thu), 8 a.m.– 6 p.m. (Fri) EST
000-00000-000-02-A
E-mail: Info@OceanOptics.com (General sales inquiries)
Orders@OceanOptics.com (Questions about orders)
Page 2

Additional
Ocean Optics Asia
Phone
86.21.5206.8686
Offices:
666 Gubei Road, Kirin Tower, Suite 601B, Changning District,
Shanghai, PRC. 200336
Fax 86.21.5206.8686
E-Mail Sun.Ling@OceanOptics.com
Ocean Optics EMEA
Sales and Support Center
Geograaf 24, 6921 EW DUIVEN, The Netherlands
Phone 31-26-3190500
Fax 31-26-3190505
E-Mail Info@OceanOptics.eu
Regional Headquarters
Maybachstrasse 11
73760 Ostfildern
Phone 49-711 34 16 96-0
Fax 49-711 34 16 96-85
E-Mail Sales@Mikropack.de
Copyright © 2010 Ocean Optics, Inc.
All rights reserved. No part of this publication may be reproduced, stored in a retrieval system, or transmitted, by any means, electronic, mechanical,
photocopying, recording, or otherwise, without written permission from Ocean Optics, Inc.
This manual is sold a s part of an order and subject to th e cond ition that it shall not, by way of tra de or otherwise, be lent, re-sold, hired out or otherwise
circulated without the prior consent of Ocean Optics, Inc. in any form of binding or cover other than that in whi ch it is published.
Trademarks
All products and services herein are the trademarks, service marks, registered trademark s or registered ser vice marks o f their respective owners.
Limit of Liability
Every effort has been made to make this manual as complete and as accur at e as possible, but no warranty or fitness is implied. The in f orm ation provided is
on an “as is” basis. Ocean Optics, Inc. shall have neither liability nor responsibility to any person or entity with respect to any loss or damages arising from
the information contained in this manual.
Page 3

Table of Contents
About This Manual ......................................................................................................... iii
Document Purpose and Intended Audience .............................................................................. iii
What’s New in this Document ................................................................................................... iii
Document Summary .................................................................................................................. iii
Product-Related Documentation ............................................................................................... iii
Upgrades ....................................................................................................................... iv
Chapter 1: Introduction ..................................................................... 1
Product Overview .......................................................................................................... 1
Features ........................................................................................................................ 2
System Requirements ................................................................................................... 3
EEPROM Utili zat ion .................................................................................................................. 3
About Ocean Optics Software ................................................................................................... 3
Sampling System Overview....................................................................................................... 4
How Sampling Works ............................................................................................................ 4
Modular Sampling Accessories ............................................................................................. 4
Interface Options ........................................................................................................... 4
Shipment Components .................................................................................................. 5
Other Accessories Available .......................................................................................... 6
Breakout Box ............................................................................................................................. 6
Chapter 2: Installing the QE 6 5 0 00 .................................................... 7
Overview ....................................................................................................................... 7
QE65000 Installation ..................................................................................................... 7
USB Mode ................................................................................................................................. 7
Serial Port Mode ........................................................................................................................ 8
Configuring the QE65000 .............................................................................................. 8
Configuring the QE65000 in SpectraSuite ................................................................................ 8
SpectraSuite QE65000 Spectrometer Features ........................................................................ 8
Configuring the QE65000 in OOIBase32 .................................................................................. 10
QE65000 Controls in OOIBase32 ......................................................................................... 10
Connect Spectroscopic Accessories .............................................................................. 11
External Triggering Options ........................................................................................... 11
220-00000-000-02-201303 i
Page 4

Table of Contents
Chapter 3: Troubleshooting .............................................................. 13
Overview ....................................................................................................................... 13
QE65000 Connected to Computer Prior to Software Installation .................................... 13
Windows Operating Systems .................................................................................................... 13
Remove the Unknown Device from Windows Device Manager ........................................... 13
Remove Improperly Installed Files ........................................................................................ 14
Mac Operating Systems ............................................................................................................ 14
Linux Operating Systems .......................................................................................................... 15
Appendix A: Calibrating the Wavelength of t he Q E 65000 .............. 17
Overview ....................................................................................................................... 17
About Wavelength Calibration ....................................................................................... 17
Calibrating the Spectrometer ......................................................................................... 18
Preparing for Calibration ............................................................................................................ 18
Calibrating the Wavelength of the Spectrometer ...................................................................... 18
Saving the New Calibration Coefficients: USB Mode ..................................................... 20
Appendix B: Specifications ............................................................... 21
Overview ....................................................................................................................... 21
How the QE65000 Works .............................................................................................. 21
QE65000 Components Table .................................................................................................... 22
QE65000 Specifications ................................................................................................ 23
CCD Detector Specifications ..................................................................................................... 23
QE65000 Spectrometer Specifications ..................................................................................... 24
System Compatibility ..................................................................................................... 25
30-Pin Accessory Connector Pinout .............................................................................. 25
30-Pin Accessory Connector Pinout Diagram ........................................................................... 26
30-Pin Accessory Connector – Pin Definitions and Descriptions .............................................. 26
30-Pin J2 Accessory Connector - Part Num bers....................................................................... 28
QE65000 15-Pin Accessory Cable Pinout ..................................................................... 29
Index ................................................................................................... 31
ii 220-00000-000-02-201303
Page 5
About This Manual
Document Purpose and Intended Audience
This document provides the user of the QE65000 Spectrometer with instructions for setting up,
calibrating and performing experiments with their spectrometer.
What’s New in this Document
This version of the QE65000 Scientific-grade Spectrometer Installation and Operation Manual updates
specification information.
Document Summary
Chapter Description
Chapter 1: Introduction
Chapter 2: Installing the QE65000
Chapter 3: Troubleshooting
Appendix A: Calibrating the
Wavelength of the QE65000
Appendix B: Specifications
Contains descriptive information about the QE65000 Spectrometer
and how sampling works. It also provides a list of system
requirements, interface options, and shipment components.
Provides installation and configuration instructions.
Contains recommended steps to isolate and correct common
problems.
Provides instructions for calibrating the QE65000 Spectrometer.
Contains technical specifications and connector pinouts for the
QE65000 Spectromet er.
Product-Related Documentation
You can access documentation for Ocean Optics products by visiting our website at
http://www.oceanoptics.com
document from the available drop-down lists. Or, use the Search by Model Number field at the bottom
of the web page.
. Select Technical → Operating Instructions, then choose the appropriate
• Detailed instructions for SpectraSuite Spectrometer Operating Software is located at:
http://www.oceanoptics.com/technical/SpectraSuite.pdf
• Detailed instructions for Overture Spectrometer Operating Software are located at:
http://www.oceanoptics.com/technical/Overture.pdf
220-00000-000-02-201303 iii
.
Page 6

About This Manual
• Detailed instructions for OOIBase32 Spectrometer Operating Software are located at:
http://www.oceanoptics.com/technical/ooibase32.pdf
.
• Detailed instructions for the Breakout Box are located at:
http://www.oceanoptics.com/technical/HR4_breakout.pdf
• Detailed instructions for External Triggering for firmware versions below 3.0 are located at:
http://www.oceanoptics.com/technical/external-triggering.pdf
.
• Detailed instructions for External Triggering for firmware versions 3.0 and above are located at:
http://www.oceanoptics.com/technical/external-triggering2.pdf
Engineering-level documentation is located on our website at Technical → Engineering Docs.
• http://www.oceanoptics.com/technical/engineering/QE65000%20Addendum.pdf
• http://www.oceanoptics.com/technical/engineering/engineering/OEM%20Data%20Sheet%
20--%20QE65000.pdf
You can also access operating instructions for Ocean Optics products from the Software and Technical
Resources CD that ships with the product.
Upgrades
Occasionally, you may find that you need Ocean Optics to make a change or an upgrade to your system.
To facilitate these changes, you must first contact Customer Support and obtain a Return Merchandise
Authorization (RMA) number. Please contact Ocean Optics for specific instructions when returning a
product.
iv 220-00000-000-02-201303
Page 7
Chapter 1
Introduction
Product Overview
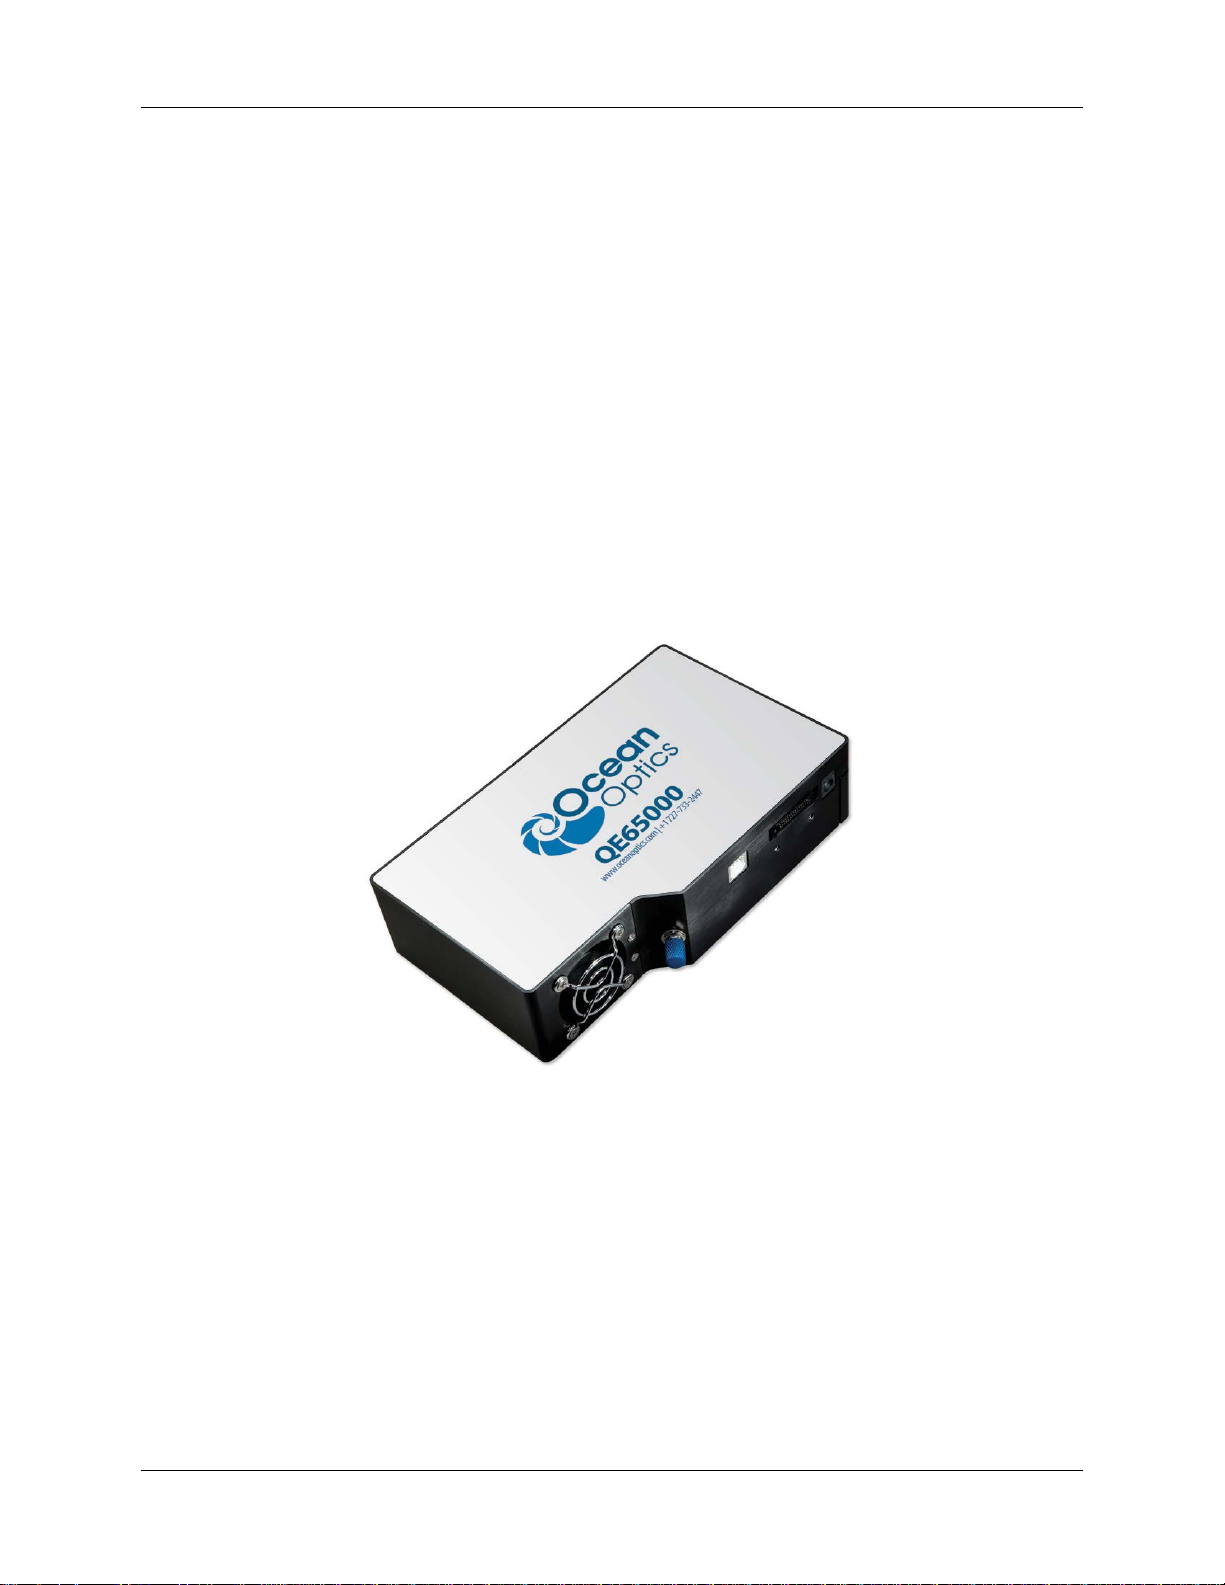
The Ocean Optics QE65000 Spectrometer is a novel combination of detector, optical bench and
electronics technologies that provide you with a remarkably sensitive system for demanding, low-light
level applications such as fluorescence, DNA sequencing and Raman spectroscopy. The QE65000 is
Ocean Optics’ most sensitive spectrometer, achieving up to 90% quantum efficiency with high signal-tonoise and improved signal processing speed.
Ocean Optics QE65000 High-Sensitivity Fiber Opti c Spec tro meter
The QE65000 features a Hamamatsu back-thinned detector with a 2-D arrangement of pixels (1044
horizontal x 64 vertical) that is responsive from 200-1100 nm. The detector’s columns are binned, or
summed, inside the detector prior to the readout process, thereby minimizing readout noise. Additionally,
the detector can be cooled down to –15 ºC with the onboard TE-Cooler to reduce dark noise. The
reduction of noise and dark signal allows integration times of the spectrometer (analogous to the shutter
speed of a camera) of up to 15 minutes, which greatly enhances the detection limit in low-light level
applications. The back-illuminated detector has great response in the UV.
The combination of the spectrometer’s low-noise detector and 16-bit A/D Converter delivers a dynamic
range of 25000:1 and a signal-to-noise ratio of 1000:1.
220-00000-000-02-201303 1
Page 8

1: Introduction
The QE65000’s onboard module has 10 user-programmable digital I/O lines for interfacing to other
equipment; and a pulse generator for triggering other devices. You can use the I/Os to flash a lamp,
stop/start a process, and send a message/alarm during the spectrometer’s integration period. The
spectrometer’s operating parameters can be controlled through software. In fact, wavelength calibration
coefficients unique to each spectrometer are programmed into a memory chip right on the spectrometer.
TheQE65000’s high-speed electronics have been designed for considerable flexibility in connecting to
various modules and external interfaces, including PCs, PLCs and other embedded controllers, through
USB 2.0 or RS-232 communications. Its USB 2.0 interface enables full spectral scans into memory every
7 milliseconds.
The QE65000 operates via USB interface. A +5 VDC external power supply is required for the TE Cooler
(TEC) and to operate the spectrometer via an RS-232 interface. This power supply is included with your
spectrometer.
Features
• Hamamatsu S7031-1006 Detector
• Peak QE: 90% @ 700 nm
• Back-thinned for good UV sensitivity
• MPP operation for low noise
• TE Cooled
• Spectrometer Design
• Symmetrical Crossed Czerny Turner
• 101mm focal length
• 14 gratings
• 6 slit widths
• Electrical Performance
• 16 bit, 500KHz A/D converter
• Integration times from 8ms to ~15min
• Embedded microcontroller allows programmatic control of all operating parameters and
standalone operation
• USB 2.0 480Mbps (high-speed) & 12Mbps (full speed)
• RS232 115Kbaud
• Multiple communication standards for digital accessories (SPI, I2C)
• Onboard Pulse Generator
• 2 programmable strobe signals for triggering other devices
• Software control of nearly all pulse parameters
• Onboard GPIO
• 10 user-programmable digital I/Os
2 220-00000-000-02-201303
Page 9

1: Introduction
• EEPROM storage for
• Wavelength Calibration Coefficients
• Linearity Correction Coefficients
• Absolute Irradiance Calibration (optional)
• Plug-n-play interface for PC applications
• 30-pin connector for interfacing to external products
System Requirements
You can use the QE65000’s USB connectivity with any computer that meets the requirements for the
spectrometer operating software being used (Windows 98/Me/2000/XP, Mac OS X and Linux). See
About Ocean Optics Software
Alternately, the QE65000 has a serial port for connecting to PCs, PLCs, and other devices w ith a
Windows 32-bit operating system that support the RS-232 communication protocol. However, this
connection method requires an external power supply to power the QE65000, the Breakout Box, and a
serial cable.
EEPROM Utilization
.
An EEPROM memory chip in each QE65000 contains wavelength calibration coefficien ts, li nearity
coefficients, and a serial number unique to each individual spectrometer. The OOI software application
reads these values directly from the spectrometer, enabling the ability to “hot-swap” spectrometers
between computers without entering the spectrometer coefficients manually on each computer.
About Ocean Optics Software
SpectraSuite is the latest generation of operating software for all Ocean Optics spectrometers. It is a
completely modular, Java-based spectroscopy software platform that operates on Windows, Macintosh
and Linux operating systems. The software can control any Ocean Optics USB spectrometer and device,
as well as any other manufacturer’s USB instrumentation using the appropriate drivers.
SpectraSuite is a user-customizable, advanced acquisition and display program that provides a real-time
interface to a variety of signal-processing functions. With SpectraSuite, you have the ability to perform
spectroscopic measurements (such as absorbance, reflectance, and emission), cont rol all system
parameters, collect and display data in real time, and perform reference monitoring and time acquisition
experiments. Consult the SpectraSuite manual for hardware requirements when using SpectraSuite (see
Product-Related Documentation
Overture software is available for free for limited spectroscopy operating functionality such as absorbance
and transmission measurements (see Product-Related Documentation
OOIBase32 software has been discontinued, but still functions with the QE65000 Spectrometer. Consult
the OOIBase32 manual for hardware requirements when using OOIBase32 (see
Documentation).
).
).
Product-Related
220-00000-000-02-201303 3
Page 10

1: Introduction
Sampling System Overview
How Sampling Work s
Ocean Optics components function in a sampling system as follows:
1. The user stores reference and dark measurements to correct for instrument response variables.
2. The light transmits through an optical fiber to the sample.
3. The light interacts with the sample.
4. Another optical fiber collects and transmits the result of the interaction to the spectrometer.
5. The spectrometer measures the amount of light and transforms the data collected by the
spectrometer into digital information.
6. The spectrometer passes the sample information to OOI software.
7. OOI software compares the sample to the reference measurement and displays processed spectral
information.
Modular Sampling Accessories
Ocean Optics offers a complete line of spectroscopic accessories for use with the QE65000. Most of our
spectroscopic accessories have SMA connectors for application flexibility. Accordingly, changing the
sampling system components is as easy as unscrewing a connector and replacing an accessory.
Interface Options
The QE65000 has both USB and serial port connectors (with the use of an adapter), enabling you to
connect the spectrometer to a desktop or notebook computer via a USB port or serial port. However, you
must create custom software if using the serial port. SpectraSuite software is available if you are
connecting via the USB port.
Computer
Interface
Computer via
USB Port
Desktop or
Notebook PC
via Serial
Port
Operating System Requirements Part Needed Description of Part
SpectraSuite: Windows 2000/XP for
PC, OS X version 10.0 or later for
Mac, or Red Hat 9 or later, Fedora
(any version), Debian 3.1 (Sarge),
and SUSE (9.0 or later), Centos,
and Ubuntu for Linux
OOIBase32: Windows 98/Me/
2000/XP
Any 32-bit Windows operating
system
USB-CBL-1
(included)
HR4BREAKOUT
(not included)
Cable that connects from USB port on
QE65000 to USB port on desktop or
notebook PC
Adapter block that enables connection
from serial port on QE65000 to serial
port on desktop or notebook PC; comes
with 5 VDC power supply (required
when connecting to serial port)
4 220-00000-000-02-201303
Page 11

1: Introduction
Shipment Components
QE65000 Spectrometer
+ 5VDC power supply
The following information and documentation also ships with the QE65000 Spectrometer:
Packing List
The packing list is inside a plastic bag attached to the outside of the shipment box (the invoice
arrives separately). It lists all items in the order, including customized components in the
spectrometer (such as the grating, detector collection lens, and slit). The packing list also includes
the shipping and billing addresses, as well as any items on back order.
Wavelength Calibration Data Sheet
Each spectrometer is shipped with a Wavelength Calibration Data Sheet that conta ins information
unique to your spectrometer. Your spectrometer operating software reads thi s calibrat ion dat a
from your spectrometer when it interfaces to a computer via the USB port. Any other interface
requires that you manually enter the calibration data in OOIBase32 (select Spectrometer |
Configure | Wavelength Calibration tab). See the OOIBase32 documentation for more
information (refer to Product-Related Documentation
documentation).
for instructions on accessing OOIBase32
Note
Please save the Wavelength Calibration Data Sheet for future reference.
Software and Technical Resources CD
Each order ships with the Ocean Optics Software and Resources CD. This disc contains software,
operating instructions, and product information for all Ocean Optics software, spectrometers, and
spectroscopic accessories. You need Adobe Acrobat Reader version 6.0 or higher to view these
files. Ocean Optics includes the Adobe Acrobat Reader on the Software and Technical Resources
CD.
All Ocean Optics software requires a password during the installation process. You can locate
passwords for the other purchased software applications on the back of the Software and
Technical Resources CD package.
220-00000-000-02-201303 5
Page 12

1: Introduction
Other Accessories Available
Visit us at www.OceanOptics.com for a complete list of products available for all of your spectroscopy
needs.
Fibers
Light Sources
Integrated Sampling Systems
Cuvettes
Filter Holders
Lithium Ion Battery Pack
HR4-BREAKOUT Breakout Box
Breakout Box
Ocean Optics also offers the Breakout Box (HR4-BREAKOUT), a passive module that separates the
signals from their 22-pin port to an array of standard connectors and headers, enabling easy access to a
variety of features found in Ocean Optics’ QE65000 Spectrometer. In addition to the accessory connector,
the breakout box features a circuit board based on a neutral breadboard pattern that allows custom
circuitry to be prototyped on the board itself.
6 220-00000-000-02-201303
Page 13

Chapter 2
Installing the QE65000
Overview
You must install the operating software application prior to connecting the QE65000 Spectrometer to the
computer. The Ocean Optics spectrometer operating software installs the drivers required for the
QE65000 spectrometer installation. If you do not install the software first, the system will not properly
recognize the QE65000.
If you have already connected the QE65000 to the computer prior to installing the operating software,
consult Chapter 3: Troubleshooting
for information on correcting a corrupt QE65000 installation.
QE65000 Installation
This section contains instructions for connecting the QE65000 via both USB and serial modes.
Caution
Ensure that TEC power is always applied (using SpectraSuite software) before USB
power.
USB Mode
This section contains instructions for connecting the QE65000 in USB mode. To connect the QE65000 to
a computer via the USB port, the computer must be running a Windows 2000/XP, Mac OS X or Linux
operating system.
►
Procedure
Follow the steps below to connect the QE65000 to a computer via the USB port:
1. Install the spectrometer operating software on the destination computer.
2. Locate the USB cable (USB-CBL-1) provided with the QE65000.
3. Insert the square end of the cable into the side of the QE65000.
4. Insert the rectangular end of the cable into the USB port of the PC.
5. If you intend to run the TE Cooler, plug the +5 VDC power supply into the QE65000.
220-00000-000-02-201303 7
Page 14

2: Installing the QE65000
If you installed the spectrometer operating software prior to connecting the QE65000, the software
installs the QE65000 drivers. If the drivers do not successfully install (or if you connected the QE65000
to the computer before installing the software), consult Chapter 3: Troubleshooting
.
Serial Port Mode
To use the serial port capacity of the QE65000 Spectrometer, the PC must be running a 32-bit version of
the Windows operating system (or Windows CE 2.11 or higher for handheld PCs).
►
Procedure
Follow the steps below to connect the QE65000 to the PC via serial port:
1. Connect the serial cable adapter block to the appropriate pins of the QE65000’s 30-Pin Accessory
Connector.
2. Connect one end of the 9-pin serial cable to the adapter block on the QE65000, and then connect
the other end to a serial port on the PC.
3. Note the number of the serial port (COM Port) to which you connected the QE65000 (some PCs
may not have numbered ports; handheld PCs typically have only one serial port).
4. Plug the 5 VDC external power supply into an outlet and connect it to the QE65000.
Configuring the QE65000
The QE65000 can be used with either SpectraSuite or OOIBase32 software when connected to the USB
port. The configuration process differs, depending on whether you are running SpectraSuite or
OOIBase32 software.
Configuring the QE65000 in SpectraSuite
If you have followed the previous steps and started SpectraSuite, the spectrometer is already acquiring
data. Even with no light in the spectrometer, there should be a dynamic trace displayed in the bottom of
the graph. If you allow light into the spectrometer, the graph trace should rise with increasing light
intensity. This means the software and hardware are correctly installed.
Note the spectrometer(s) that you have installed are listed in the Data Sources pane.
SpectraSuite QE65000 Spectrometer Features
Select Spectrometer | Spectrometer Features, then select the TEC tab to d isp la y the QE65000
Spectrometer controls.
8 220-00000-000-02-201303
Page 15

2: Installing the QE65000
Control Description
Enable Fan Check this box to turn on the cooling fan.
Enable Thermo-
Electric Control
Check this box to enable (recommended setting for laboratory conditions) or
uncheck to disable the thermoelectric cooler. Be sure to always turn on TEC
power before applying USB power.
Detector Set Point Enter the target temperature of the QE65000 Spectrometer detector. The default
is -10ºC. The TEC and fans will operate until the detector reaches this
temperature.
Detector
Displays the current temperature of the detector in the QE65000 Spectrometer.
temperature
Enable Periodic
Update
Check this box to enable periodic update of the QE65000 detector temperature
controls.
Update Interval If you enabled periodic updates, enter the interval period (in seconds).
Show in Status Bar Check this box to display the detector temperature in the status bar.
220-00000-000-02-201303 9
Page 16

2: Installing the QE65000
Configuring the QE65000 in OOIBase32
Once you install the QE65000, you must configure OOIBase32’s Configure Spectrometer options so
that OOIBase32 recognizes the QE65000 Spectrometer. Consult the OOIBase32 Spectrometer Operating
Software Operating Instructions for detailed instructions on configuring the spectrometer in OOIBase32
(see Product-Related Documentation
QE65000 Controls in OOIBase32
The QE65000 toolbar in OOIBase32 allows you to control a variety of options on the QE65000
Spectrometer. Click your right mouse button while in the OOIBase32 toolbar to display the QE65000
toolbar.
If your version of OOIBase32 does not have the options listed below, you should upgrade
your version of OOIBase32 to the latest release.
Visit http://www.oceanoptics.com/technical/softwaredownloads.asp
latest software version.
).
Note
to obtain the
Control Description
TEC On Check this box to enable (recommended setting for laboratory conditions) or
uncheck to disable the thermoelectric cooler. Be sure to always turn on TEC
power before applying USB power.
Det. Temp. Set Point Enter the target temperature of the spectrometer detector in the range of 30 to 45
degrees below ambient temperature. The TEC and fans will operate until the
detector reaches this temperature. The default is -10ºC.
NOTE: This assumes that your spectrometer is in the standard lab environment
(no extreme temperatures).
Apply Click this button to apply the changes made in this toolbar to the QE65000
Spectrometer.
Current Det. Temp. Displays the current temperature of the detector in the spectrometer.
10 220-00000-000-02-201303
Page 17

2: Installing the QE65000
Connect Spectroscopic Accessories
To find operating instructions for QE65000-compatible products (such as light sources, sampling
chambers, and probes), consult the Software and Technical Resources CD or the Ocean Optics website at
http://www.oceanoptics.com/technical/operatinginstructions.asp.
External Triggering Options
You can trigger the QE65000 using a variety of External Triggering options through the 30-pin Accessory
Connector on the spectrometer.
For QE65000 firmware versions below 3.0, see the External Triggering Options document located at
http://www.oceanoptics.com/technical/External-Triggering.pdf.
For QE65000 firmware version 3.0 and above, see the External Triggering Options document located at
http://www.oceanoptics.com/technical/External-Triggering2.pdf. The triggering document contains
instructions for configuring External Triggering options for the QE65000.
Note
Only the external software triggering option is available when using a handheld PC.
220-00000-000-02-201303 11
Page 18

2: Installing the QE65000
12 220-00000-000-02-201303
Page 19

Chapter 3
Troubleshooting
Overview
The following sections contain information on troubleshooting issues you may encounter when using the
QE65000 Spectrometer.
QE65000 Connected to Computer Prior t o Software Installation
Windows Operating Systems
If you connected your Ocean Optics QE65000 device to the computer prior to installing your
spectrometer operating software application (SpectraSuite, Overture or OOIBase32) on a Windows
platform, you may encounter installation issues that you must correct before your Ocean Optics device
will operate properly.
Follow the applicable steps below to remove the incorrectly installed device, device driver, and
installation files.
Note
If these procedures do not correct your device driver problem, you must obtain the
Correcting Device Driver Issues document from the Ocean Optics website:
http://www.oceanoptics.com/technical/engineering/correctingdevicedriverissues.pdf
Remove the Unknown Device from Windows Device Man ager
► Procedure
1. Open Windows Device Manager. Consult the Windows operating instructions for your computer
for directions, if needed.
2. Locate the Other Devices option and expand the Other Devices selection by clicking on the "+"
sign to the imme diate le ft.
.
220-00000-000-02-201303 13
Page 20

3: Troubleshooting
Note
Improperly installed USB devices can also appear under the Universal Serial Bus
Controller option. Be sure to check this location if you cannot locate the unknown device.
3. Locate the unknown device (marked with a large question mark). Right-click on the Unknown
Device listing and select the Uninstall or Remove option.
4. Click the OK button to continue. A warning box appears confirming the removal of the Unknown
Device. Click the OK button to confirm the device removal.
5. Disconnect the QE65000 from your computer.
6. Locate the section in this chapter that is appropriate to your operating system and perform the
steps in the following Remove Improperly Installed Files
section.
Remove Improperly Installed Files
► Procedure
1. Open Windows Explorer.
2. Navigate to the Windows | INF directory.
Note
If the INF directory is not visible, you must disable the Hide System Files and Folders
and Hide File Extensions for Known File Types options in Windows Folder Options.
Access Windows Folder Options from Windows Explorer, under the Tools | Folder
Options menu selection.
3. Delete the OOI_USB.INF in the INF directory. If your computer is running either the Windows
2000 or XP operating system, you must also delete the OOI_USB.PNF file in the INF directory.
4. Navigate to the Windows | System32 | Drivers directory.
5. Delete the EZUSB.SYS file.
6. Reinstall your Ocean Optics application and reboot the system when prompted.
7. Plug in the USB device.
The system is now able to locate and install the correct drivers for the USB device.
Mac Operating Systems
Since there are no device files for the QE65000 Spectrometer in a Mac operating system, you should not
encounter any problems if you installed the spectrometer before the operating software.
14 220-00000-000-02-201303
Page 21

3: Troubleshooting
Linux Operating Systems
For Linux operating systems, all you need to do is install the softwar e, then unplug and replug in the
spectrometer. Technically, the driver files for Linux simply give nonprivileged users permission to use
newly connected hardware. There isn’t any long-term harm to plugging in the device before installing the
software.
220-00000-000-02-201303 15
Page 22

3: Troubleshooting
16 220-00000-000-02-201303
Page 23

Appendix A
Calibrating the Wavelength of
the QE65000
Overview
This appendix describes how to calibrate the wavelength of your spectrometer. Though each spectrometer
is calibrated before it leaves Ocean Optics, the wavelength for all spectrometers will drift slightly as a
function of time and environmental conditions. Ocean Optics recommends periodically recalibrating the
QE65000.
About Wavelength Calibration
You are going to be solving the following equation, which shows that the relationship between pixel
number and wavelength is a third-order polynom ial:
λ
= I + C1 p + C2 p2 + C3 p
p
Where:
λ
= the wavelength of pixel p
I = the wavelength of pixel 0
= the first coefficient (nm/pixel)
C
1
= the second coefficient (nm/pixel2)
C
2
= the third coefficient (nm/pixel3)
C
3
You will be calculating the value for I and the three Cs.
3
220-00000-000-02-201303 17
Page 24

A: Calibrating the Wavelength of the QE65000
Calibrating the Spectrometer
Preparing for Calibration
To recalibrate the wavelength of your spectrometer, you need the following components:
• A light source capable of producing spectral lines
Note
Ocean Optics’ HG-1 Mercury-Argon lamp is ideal for recalibration. If you do not have an
HG-1, you need a light source that produces several (at least 4-6) spect ral lines in th e
wavelength region of your spectrometer.
• A QE65000 spectrometer
• An optical fiber (for spectrometers without a built-in slit, a 50-
• A spreadsheet program (Excel or Quattro Pro, for example) or a calculator that performs third-
order linear regressions
µm fiber works best)
Note
If you are using Microsoft Excel, choose Tools | Add-Ins and check AnalysisToolPak
and AnalysisTookPak-VBA.
Calibrating the Wavelength of the Spectrometer
► Procedure
Perform the steps below to calibrate the wavelength of the spectrometer:
1. Place the spectrometer operating software into Scope mode and take a spectrum of your light
source. Adjust the integration time (or the A/D conversion frequency) until there are several
peaks on the screen that are not off-scale.
2. Move the cursor to one of the peaks and position the cursor so that it is at the point of maximum
intensity.
3. Record the pixel number that is displayed in the status bar or legend (located beneath the graph).
Repeat this step for all of the peaks in your spectrum.
4. Use the spreadsheet program or calculator to create a table like the one shown in the following
figure. In the first column, place the exact or true wavelength of the spectral lines that you used.
In the second column of this worksheet, place the observed pixel number. In the third column,
calculate the pix e l n umber squared, and in the fourth column, calculate the pixel number cubed.
18 220-00000-000-02-201303
Page 25

A: Calibrating the Wavelength of the QE65000
Independent
Dependent
Values Computed
Variable
Variables
True Wavelength (nm) Pixel # Pixel # 2 Pixel # 3
253.65
296.73
302.15
313.16
334.15
365.02
404.66
407.78
435.84
546.07
576.96
579.07
696.54
706.72
727.29
738.40
751.47
175
296
312
342
402
490
604
613
694
1022
1116
1122
1491
1523
1590
1627
1669
30625
87616
97344
116964
161604
240100
364816
375769
481636
1044484
1245456
1258884
2223081
2319529
2528100
2647129
2785561
5359375
25934336
30371328
40001688
64964808
117649000
220348864
230346397
334255384
1067462648
1389928896
1412467848
3314613771
3532642667
4019679000
4306878883
4649101309
Predicted
Wavelength
from the Regr ession
Output
253.56
296.72
302.40
313.02
334.19
365.05
404.67
407.78
435.65
546.13
577.05
579.01
696.70
706.62
727.24
738.53
751.27
Difference
0.09
0.01
-0.25
0.13
-0.05
-0.04
-0.01
0.00
0.19
-0.06
-0.09
0.06
-0.15
0.10
0.06
-0.13
0.19
5. Use the spreadsheet or calculator to calculate the wavelength calibration coefficients. In the
spreadsheet program, find the functions to perform linear regressions.
• If using Quattro Pro, look under Tools | Advanced Math
• If using Excel, look under Analysis ToolPak
6. Select the true wavelength as the dependent variable (Y). Select the pixel number, pixel number
squared, and the pixel number cubed as the independent variables (X). After executing the
regression, you will obtain an output similar to the one shown below. Numbers of importance are
noted.
Regression Statistics
Multiple R 0.999999831
R Square 0.999999663 R Squared
Adjusted R Square 0.999999607
Standard Error 0.125540214
Observations 22
Intercept
Coefficients Standard Error
Intercept 190.473993 0.369047536 First coefficient
X Variable 1 0.36263983 0.001684745
X Variable 2-1.174416E-05 8.35279E-07
X Variable 3-2.523787E-09 2.656608E-10 Second coefficient
Third coeffic ient
220-00000-000-02-201303 19
Page 26

A: Calibrating the Wavelength of the QE65000
7. Record the Intercept, as well as the First, Second, and Third Coefficients. Additionally, look at
the value for R squared. It should be very close to 1. If not, you have most likely assigned one of
your wavelengths incorrectly.
Keep these values at hand.
Saving the New Calibration Coefficients: USB Mode
Ocean Optics programs wavelength calibration coefficients unique to each QE65000 onto an EEPROM
memory chip in the QE65000.
You can overwrite old calibration coefficients on the EEPROM if you are using the QE65000 via the
USB port.
►
Procedure
To save wavelength calibration coefficients using the USB mode, perform the following steps:
1. Ensure that the QE65000 is connected to the PC and that you have closed all other applications.
2. Point your browser to http://www.oceanoptics.com/technical/softwaredownloads.asp
scroll down to Microcode. Select USB EEPROM Program me r.
3. Save the setup file to your computer.
4. Run the Setup.exe file to install the software. The Welcome sc reen appe ar s.
5. Click the Next button. The Destination Location screen appears.
6. Accept the default installation location, or click the Browse button to specify a directory. Then,
click the Next button. The Program Manager Group screen appears.
7. Click the Next button. The Start Installation screen a ppear s.
8. Click the Next button to begin the installation. Once th e ins ta ll at io n finishes, the Installation
Complete screen appe ars.
9. Click the Finish button and reboot the computer when prompted.
10. Navigate to the USB EEPROM Progra mmer from the Start menu and run the software.
11. Click on the desired QE65000 dev ice display ed in the left pane of the US B Programmer screen.
12. Double-click on each of the calibration coefficients displayed in the right pane of the USB
Programmer screen and enter the new values acquired in Steps 5 and 6 of the
Wavelength of the Spectrometer section in this appendix.
13. Repeat Step 12 for all of the new values.
14. Click on the Save All Values button to save the information, and then Exit the USB Programmer
software.
Calibrating the
and
The new wavelength calibration coefficients are now loaded onto the EEPROM memory chip on the
QE65000.
20 220-00000-000-02-201303
Page 27

Appendix B
Specifications
Overview
This appendix contains information on spectrometer operation, specifications, and system compatibility.
It also includes accessory connector pinout diagrams and pin-specific information.
How the QE65000 Works
Below is a diagram of how light moves through the optical bench of a QE65000 Spectrometer. The
optical bench has no moving parts that can wear or break; all the components are fixed in place at the time
of manufacture.
QE65000 Spectrometer with Components
220-00000-000-02-201303 21
Page 28

B: Specifications
QE65000 Components Table
Ocean Optics permanently secures all components in the QE65000 at the time of manufacture. Only
Ocean Optics technicians can replace interchangeable components, where noted.
Item Name Description
1
2 Slit
3 Filter
4
5 Grating
SMA
Connector
Collimating
Mirror
Secures the input fiber to the spectrometer. Light from the input fiber enters the
optical bench through this connector.
A dark piece of material containing a rectangular aperture, which is mounted directly
behind the SMA Connector. The size of the aperture regulates the amount of light
that enters the optical bench and controls spectral resolution.
You can also use the QE65000 without a Slit. In this configuration, the diameter of
the fiber connected to the QE65000 determines the size of the entrance aperture.
Only Ocean Optics technicians can change the Slit.
Restricts optical radiation to pre-determined wavelength regions. Light pass es
through the Filter before entering the optical bench. Both bandpass and longpass
filters are available to restrict radiation to certain wavelength regions.
Only Ocean Optics technicians can change the Filter.
Focuses light entering the optical bench towards the Grating of the spectrometer.
Light enters the spectrometer, passes through the SMA Connector, Slit, and Filter,
and then reflects off the Collimating Mirror onto the Grating.
Diffracts light from the Collimating Mirror and directs the diffracted light onto the
Focusing Mirror. Gratings are available in different groove densities, allowing you to
specify wavelength coverage and resolution in the spectrometer.
Only Ocean Optics technicians can change the Grating.
6
7
8
22 220-00000-000-02-201303
Focusing
Mirror
Backthinned
Area
Detector
with TE
Cooling
Detector
with OFLV
Filter
Receives light reflected from the Grating and focuses the light onto the CCD
Detector or L2 Detector Collection Lens (depending on the spectrometer
configuration).
Provides 90% quantum efficiency and bins pixels in a vertical column to acquire
light form the entire height of the spectrometer’s slit image. This improves light
collection and signal-to-noise significantly. This 2D area detector is back-thinned
(back-illuminated) and does not require the detector upgrade that is normally
applied to other detectors.
Only Ocean Optics technicians can add or remove the Detector.
Eliminates second-order effects and is used with an HC-1 Grating in a 200-950 nm
wavelength system in a QE65000.
Page 29

B: Specifications
QE65000 Specifications
The following sections provide specification information for the CCD detector in the QE65000, as well as
the QE65000 Spectrometer itself.
CCD Detector Specifications
Specification Value
Detector Hamamatsu S7031-1006, back-thinned FFT-CCD
200-1100 nm with window, VUV option available (150nm). VUV
Spectral range
Active area 24.576 x 1.392mm
Pixel size 24.6 µm square
Full Well Capacity 300,000 electrons (vertical), 600,000 typical (horizontal)
option includes purge port and window removal (no TE cooling).
200-925 nm with HC1 grating.
Dark Current 4000 e/pix el/s ec @ 25 ºC; 200 e/pix el/sec @ 0 ºC
Dark noise 3 RMS counts
Readout noise 1.5 counts RMS (40 electrons)
Linearity Correction >99.8%
Quantum efficiency
90% at 700 nm peak; 65% at 250 nm. See Q uantum Efficiency of
Detector graph below.
220-00000-000-02-201303 23
Page 30

B: Specifications
Quantum Efficiency of Detector
QE65000 Spectrometer Specifications
Specification Value
Dimensions (LxWxH) 182 mm (7.16 in.) x 110 mm (4.3 3 in.) x 47 mm (1.85 in.)
Weight
QE65000
Power Supply
Temperature
Operation
Storage
Humidity 0 – 90% noncondensing
Power consumption
No TE Cooler
With TE Cooler
Supply Voltage 4.5 – 5.5 V
1.18 kg (2.53 lbs.)
0.45 kg (1 lb.)
TE Cooler can only cool 45 to 30°C below ambient temperature
0 °C to +50 °C
–30 °C to +70 °C
500 mA @ 5 VDC
3.5A at 5 VDC
Power-up Time ~ 2s depending on code size
Signal-to-noise ratio 1000:1 (single acquisition)
24 220-00000-000-02-201303
Page 31

B: Specifications
Specification Value
Gratings 14 gratings available
Entrance aperture 5, 10, 25, 50, 100 or 200 µm wide slits
Order-sorting filters 6 OF series available
Focal length (input) f/4, 101 mm
Optical resolution
(FWHM)
Stray light <0.08% at 600 nm; 0.4% at 435 nm
Dynamic range
Fiber optic connector SMA 905 to single-strand optical fiber (0.22 NA)
Integration time 8 ms to 15 minutes
Interfaces USB 2.0, 480 Mbps (USB 1.1 compatible); RS-232 (3-wire)
Depends on grating and size of entrance aperture
9
7.5 x 10
period
(over integration range); 25000:1 for a single integration
System Compatibility
You can use the QE65000’s USB connectivity with any computer that meets the requirements for the
spectrometer operating software being used (Window s 2000/XP, Mac OS X and Linux). See
Optics Software.
Alternately, the QE65000 has a serial port for connecting to PCs, PLCs, and other devices with a
Windows 32-bit operating system that support the RS-232 communication protocol. However, this
connection method requires an external power supply to power the QE65000, the HR4000 Breakout Box,
and a serial cable.
About Ocean
30-Pin Accessory Connector Pinout
The QE65000 features a 30-pin Accessory Connector, located on the side of the unit as shown:
220-00000-000-02-201303 25
Page 32

B: Specifications
Location of QE65000 30-Pin Accessory Connector
30-Pin Accessory Connector Pinout Diagram
When facing the 30-pin Accessory Connector on the front of the vertical wall of the QE65000, pin
numbering is as follows:
USB
Port
2 4 6 8 10 12 14 16 18 20 22 24 26 28 30
1 3 5 7 9 11 13 15 17 19 21 23 25 27 29
30-Pin Accessory Connector Pinout Diagram
30-Pin Accessory Connector – Pin Definitions and Descriptions
The following table contains information regarding the function of each pin in the QE65000’s 30-Pin
Accessory Connector:
Pin
#
1 RS232 Rx Input RS232 receive signal – C o m m unicat es with a PC over DB9 Pin 3
2 RS232 Tx Output RS232 transmit signal – Communicates with a PC over DB9 Pin 2
Function Input/Output Description
3 GPIO (2) Input/Output
26 220-00000-000-02-201303
General purpose software-programmable, digital input/output
(channel number)
Page 33

B: Specifications
Pin
#
Function Input/Output Description
4 N/A N/A Reserved
5 Ground Input/Output Ground
6 I2C SCL Input/Output I2C clock signal for communication to other I2C peripherals
7 GPIO (0) Input/Output
General purpose software-programmable, digital input/output
(channel number)
8 I2C SDA Input/Output I2C data signal for communication to other I2C peripherals
9 GPIO (1) Input/Output
10
Ext. Trigger
In
Input
11 GPIO (3) Input/Output
12 VCC or 5VIN
Input or
Output
General purpose software-programmable, digital input/output
(channel number)
TTL input trigger signal -- See External Triggering Options
document for info
General purpose software-programmable, digital input/output
(channel number)
Input power pin for QE65000 – When operating via USB, this pin
can power other peripherals – Ensure that peripherals comply with
USB specifications (no TEC power)
13
14 VCC or 5VIN
SPI Data
Out
Output
Input or
Output
15 SPI Data In Input
16 GPIO (4) Input /Output
17
Single
Strobe
Output
18 GPIO (5) Input/Output
SPI Master Out Slave In (MOSI) signal for communication to other
SPI peripherals
Input power pin for QE65000 – When operating via USB, this pin
can power other peripherals – Ensure that peripherals comply with
USB specifications (no TEC power)
SPI Master In Slave Out (MISO) signal for communication to other
SPI peripherals
General purpose software-programmable, digital input/output
(channel number)
TTL output pulse used as a strobe signal – Has a programmable
delay relative to the beginning of the spectrometer integration
period
General purpose software-programmable, digital input/output
(channel number)
19 SPI Cl oc k Output SPI clock signal for communication to other SPI peripherals
20
Continuous
Strobe
Output
TTL output signal used to pulse a strobe – Divided down from the
master clock signal
220-00000-000-02-201303 27
Page 34

B: Specifications
Pin
#
21
22 GPIO (6) Input/Output
23 N/A N/A Reserved
24 N/A N/A Reserved
25
26 GPIO (7) Input/Output
27 Ground Input/Output Ground
28 GPIO (8) Input/Output
29 Ground Input/Output Ground
Function Input/Output Description
SPI Chip
Select
Lamp
Enable
Output
Output
SPI Chip/Device Select signal for communication to other SPI
peripherals
General purpose software-programmable, digital input/output
(channel number)
TTL signal driven Active HIGH when the Lamp Enable command
is sent to the spectrometer
General purpose software-programmable, digital input/output
(channel number)
General purpose software-programmable, digital input/output
(channel number)
30 GPIO (9) Input/Output
General purpose software-programmable, digital input/output
(channel number)
30-Pin J2 Accessory Connector - Part Numbers
The part numbers for the 30-pin accessory connector on the QE65000 Spectrometer are as follows:
• The connector is Pak50™ model from 3M Corp. Headed Connector – Part Number
P50–030P1–RR1–TG.
• The mating connector is Part Number P50–030S–TGF.
• Mating the two components requires two 1.27 mm (50 mil) flat ribbon cables (3M 3365 Series is
recommended).
28 220-00000-000-02-201303
Page 35

B: Specifications
QE65000 15-Pin Accessory Cable Pinout
Pin # Description Pin # Description
1 Single_strobe 9 GPIO-9
2 ContStrobe 10 GND_SIGNAL
3 V5_SW 11 SDA
4 ExtTrigIn 12 SCL
5 ExtTrigIn 13 LampEnable
6 GPIO-8 14 A_IN
7 A_OUT 15 GPIO-7
8 ExtTrigIn
220-00000-000-02-201303 29
Page 36

B: Specifications
30 220-00000-000-02-201303
Page 37

Index
Numbers
15-pin accessory cable
pinouts, 29
30-pin accessory connector
diagram, 26
part numbers, 28
pin definitions, 26
A
accessories, 6, 11
Accessories, 4
accessory connector
pinout, 25
Adobe Acrobat Reader, 5
B
breakout box, 6
D
detector, 23
Detector Collection Lens, 22
document
audience, iv
purpose, iv
summary, iv
E
EEPROM, 3
External Triggering, 11
F
filter, 22
focusing mirror, 22
G
Calibrating, iv, 17
calibration, 17
preparing for, 18
procedure, 18
calibration coefficients
saving in USB mode, 20
CCD, 23
CCD Detector, 22
collimating mirror, 22
compatibility, 25
Components Table, 22
configuring, 10
C
grating, 22
I
Installation, 7
Serial Port mode, 8
USB mode, 7
installed filter, 22
Interface, 4
L
L2 Detector Collection Lens, 22
Lens, 22
220-00000-000-02-201303 31
Page 38

Index
Software and Resources Library CD, 5
M
memory chip, 3
mirror, 22
O
OOIBase32, 10
Options
Interface, 4
specifications, 21
detector, 23
QE65000, 23
spectrometer, 24
SpectraSuite, 8
Spectrometer Features
SpectraSuite, 8
spectroscopic accessori es, 11
System Requirements, 3
T
P
packing list, 5
passwords, 5
power supply (external), 2, 3, 4, 5, 7, 24, 25
product-related documentation, iv
Q
QE65000
specifications, 23
QE65000 controls, 10
S
Sampling
Accessories, 4
System, 4
Serial Port mode, 8
setup, 7
shipment components, 5
slit, 22
SMA Connector, 22
TE Cooler, 1, 2, 7, 10, 24
Triggering, 11
troubleshooting
Linux systems, 15
Mac systems, 14
Troubleshooting, 13
U
upgrades, v
USB mode, 7
USB-ADP-PC, 4
USB-CBL-1, 4
W
Wavelength Calibration
about, 17
Wavelength Calibration Data File, 5
Wavelength Calibration Data Sheet, 5
what's new, iv
32 220-00000-000-02-201303
 Loading...