


EXPRESS5800/A1160
User's Guide

Proprietary Notice and Liability Disclaimer
The information disclosed in this document, including all designs and related materials, is the
valuable property of NEC Corporation of America, Inc. and/or its licensors. NEC Corporation
of America and/or its licensors, as appropriate, reserve all patent, copyright and other
proprietary rights to this document, including all design, manufacturing, reproduction, use,
and sales rights thereto, except to the extent said rights are expressly granted to others.
The NEC Corporation of America product(s) discussed in this document are warranted in
accordance with the terms of the Warranty Statement accompanying each product. However,
actual performance of each product is dependent upon factors such as system configuration,
customer data, and operator control. Since implementation by customers of each product
may vary, the suitability of specific product configurations and applications must be
determined by the customer and is not warranted by NEC Corporation of America.
To allow for design and specification improvements, the information in this document is
subject to change at any time, without notice. Reproduction of this document or portions
thereof without prior written approval of NEC Corporation of America is prohibited.
Trademarks
Windows is a registered trademark of Microsoft Corporation.
Intel and Itanium are registered trademarks of Intel Corporation.
All other product, brand, or trade names used in this publication are the trademarks or
registered trademarks of their respective trademark owners.
PN: 456-01803-000 December, 2008
Copyright 2008
NEC Corporation of America
10850 Gold Center Drive, Suite 200,
Rancho Cordova, CA 95670
All Rights Reserved

Contents
Contents
Section 1 Introduction .................................................................. 1-1
1.1. Documentation Updates ..................................................................... 1-1
1.2. Scalable Symmetric Multiprocessing Servers .................................... 1-1
1.3. Server Management........................................................................... 1-2
1.4. User Interfaces ................................................................................... 1-3
1.5. Express5800/A1160 Cell .................................................................... 1-4
1.6. Cabinets ............................................................................................. 1-5
1.7. Locations of Hardware Components .................................................. 1-6
1.8. System Components .......................................................................... 1-6
1.9. Network Components ......................................................................... 1-8
Section 2 Overview of System Interfaces ................................... 2-1
2.1. Remote console interfaces ................................................................. 2-1
2.1.1. Uses for remote console interfaces .................................................... 2-2
2.1.2. Accessing and Logging On to remote console interfaces .................. 2-2
2.2. EXPRESSSCOPE® Monitor Interface ............................................... 2-3
2.2.1. Uses for EXPRESSSCOPE® Monitor Interface................................. 2-4
2.2.2. Accessing EXPRESSSCOPE® Monitor Interface .............................. 2-5
2.3. ESMPRO Manager ............................................................................ 2-5
2.3.1. Uses for ESMPRO Manager .............................................................. 2-5
2.3.2. Accessing ESMPRO Manager ........................................................... 2-6
2.4. ESMPRO Alert Manager .................................................................... 2-6
2.4.1. Uses for ESMPRO Alert Manager ...................................................... 2-6
2.4.2. Accessing ESMPRO Alert Manager ................................................... 2-7
2.5. ESMPRO Agent for Windows ............................................................. 2-7
2.5.1. Uses for ESMPRO Agent for Windows .............................................. 2-7
2.5.2. Accessing ESMPRO Agent for Windows ........................................... 2-8
2.6. ESMPRO Agent for Linux or VMware ESX Server ............................ 2-8
2.6.1. Uses for ESMPRO Agent for Linux .................................................... 2-8
2.6.2. Accessing ESMPRO Agent for Linux ................................................. 2-9
iii

Contents
BIOS Interface ................................................................................... 2-9
2.7.
2.7.1. Uses for BIOS Interface ..................................................................... 2-9
2.7.2. Accessing BIOS Interface ................................................................ 2-10
Section 3 Remote console interfaces ......................................... 3-1
3.1. Page Layout ....................................................................................... 3-1
3.2. Refreshing Page Displays .................................................................. 3-3
3.3. Web Page Timeouts ........................................................................... 3-3
3.4. Navigation .......................................................................................... 3-3
3.5. Partition Remote Console Interface ................................................... 3-4
3.5.1. Partition Summary Page .................................................................... 3-4
3.5.2. Command Buttons ............................................................................. 3-8
3.5.3. Submitting and Monitoring Progress of Commands .......................... 3-9
3.5.4. Sensor Readings ............................................................................. 3-10
3.5.5. Event Log .......................................................................................... 3-11
3.5.6. Hardware Locator ............................................................................ 3-13
3.5.7. FRU Inventory .................................................................................. 3-14
3.5.8. Partition Settings .............................................................................. 3-15
3.5.9. Power Settings ................................................................................. 3-16
3.5.10. Boot Cell Selection Settings ............................................................. 3-18
3.5.11. General Settings .............................................................................. 3-19
3.5.12. Fault Settings ................................................................................... 3-20
3.5.13. Customer Data Settings ................................................................... 3-22
3.5.14. Alert Management ............................................................................ 3-22
3.5.15. Network Address .............................................................................. 3-23
3.5.16. SSL Certificate ................................................................................. 3-24
3.5.17. Time and Date.................................................................................. 3-25
3.5.18. User Management ........................................................................... 3-26
3.5.19. KVMS Redirection ............................................................................ 3-27
3.5.20. Fault Information .............................................................................. 3-28
3.5.21. Enabling and Disabling Components ............................................... 3-29
iv

Contents
3.5.22.
3.5.23. Management Firmware Updates ...................................................... 3-32
3.5.24. Service Processor Functions ........................................................... 3-33
3.6. System remote console interface ..................................................... 3-34
3.6.1. System Settings Page ...................................................................... 3-35
3.6.2. Partitioning ....................................................................................... 3-36
3.6.3. Cell Access ...................................................................................... 3-37
3.7. Cell remote console interface ........................................................... 3-37
3.7.1. Cell Summary Page ......................................................................... 3-38
3.7.2. Hardware Locator ............................................................................ 3-39
3.7.3. Network Address .............................................................................. 3-40
3.7.4. SSL Certificates ............................................................................... 3-40
3.7.5. Diagnostic Tests ............................................................................... 3-41
Diagnostic Tests ............................................................................... 3-30
3.7.6. Service Processor Functions ........................................................... 3-43
Section 4 EXPRESSSCOPE® Monitor Interface ......................... 4-1
4.1. Components ....................................................................................... 4-1
4.1.1. Main Screen Display .......................................................................... 4-2
4.1.2. Operational Buttons ........................................................................... 4-4
4.1.3. Power Button ..................................................................................... 4-4
4.1.4. EXPRESSSCOPE® Monitor LEDs .................................................... 4-5
4.1.5. EXPRESSSCOPE® Monitor LCD Back Light .................................... 4-5
4.2. Menu System ..................................................................................... 4-6
4.2.1. Menu Structure ................................................................................... 4-6
4.2.2. Main Menu ......................................................................................... 4-6
4.2.3. EXPRESSSCOPE® Monitor LCD Timeouts ...................................... 4-7
4.2.4. Navigating Menus .............................................................................. 4-7
4.2.5. Menu Contents ................................................................................... 4-8
4.2.6. Success and Error Menus ................................................................ 4-10
4.3. Fault Messages ................................................................................. 4-11
4.3.1. Viewing Fault Messages ................................................................... 4-11
v

Contents
Clearing Fault Messages ................................................................. 4-12
4.3.2.
4.4. Partition Chassis Control ................................................................. 4-13
4.5. Network ............................................................................................ 4-14
4.5.1. Viewing Network Settings ................................................................ 4-14
4.5.2. Updating Network Settings .............................................................. 4-15
4.5.3. Updating Network Values ................................................................. 4-17
4.6. Default Settings ................................................................................ 4-18
Section 5 BIOS .............................................................................. 5-1
5.1. About the BIOS .................................................................................. 5-1
5.2. BIOS Boot Order ................................................................................ 5-2
5.3. BIOS Settings .................................................................................... 5-2
5.4. BIOS Windows ................................................................................... 5-3
5.5. BIOS Window Controls ...................................................................... 5-3
5.6. Viewing and Temporarily Changing BIOS Boot Order ....................... 5-4
5.7. Updating BIOS Boot Order ................................................................ 5-6
5.8. Configuring BIOS Settings ................................................................. 5-8
5.9. Configuring Settings for Partition Options ........................................ 5-13
5.10. Operating System Settings in BIOS ................................................. 5-18
5.11. BIOS Operational Considerations .................................................... 5-18
Section 6 Applying and Removing Power and Booting Partitions
....................................................................................... 6-1
6.1. Powering Up or Powering Down Process .......................................... 6-1
6.2. Powering Up or Powering Down the System ..................................... 6-2
6.3. Powering Up or Powering Down Partitions ........................................ 6-3
6.3.1. Powering Up or Powering Down Partitions Using remote console
interface ............................................................................................. 6-3
6.3.2. Powering Up or Powering Down Partitions Using
EXPRESSSCOPE® Monitor Interface ............................................... 6-4
6.4. Booting Partitions Automatically ......................................................... 6-5
6.5. System Power-On Self Tests (POST) ................................................ 6-6
Section 7 Setting Up the System to Handle Faults Automatically
vi

Contents
....................................................................................... 7-1
7.1. Setting Fault Behavior using remote console interface ...................... 7-2
7.2. Configuring Alerts and the SMTP Server using remote console
interface ............................................................................................. 7-2
7.2.1. Configuring the SMTP Server using remote console interface .......... 7-3
7.2.2. Configuring Alert Notifications using remote console interface .......... 7-5
7.2.3. Clearing Alert Destinations using remote console interface ............... 7-7
7.3. Configuring Alerts using Server Management Software .................... 7-7
7.3.1. Configuring Alerts using ESMPRO Alert Manager ............................. 7-8
7.3.2. Configuring Alerts using ESMPRO Agent for Windows ...................... 7-9
7.3.3. Configuring Alerts using ESMPRO Agent for Linux .......................... 7-10
Section 8 Performing Partitioning Actions ................................. 8-1
8.1. Overview of Partitioning ..................................................................... 8-1
8.2. Rules for Partitioning .......................................................................... 8-2
8.3. Submitting Partitioning Actions ........................................................... 8-3
8.4. Moving Cells to Other Partitions ......................................................... 8-4
8.5. Deleting Partitions .............................................................................. 8-4
8.6. Creating Partitions.............................................................................. 8-4
8.7. Specifying Partition Settings .............................................................. 8-5
8.8. Selecting Primary and Secondary Boot Cells .................................... 8-6
8.8.1. Setting Primary and Secondary Boot Cells ........................................ 8-7
8.8.2. Setting Primary Boot Cell During Partitioning .................................... 8-8
8.9. Partitioning Messages ........................................................................ 8-9
8.10. Analyzing Processor Sockets and Cores ......................................... 8-10
8.10.1. Disabling Processor Sockets using remote console interface .......... 8-11
8.10.2. Disabling Processor Cores using BIOS Interface ............................. 8-11
Section 9 Managing Partitions, Virtual Machine Monitors, and
Virtual Machines ........................................................... 9-1
9.1. Accessing the Desktop of a Partition Remotely using remote
console interface ................................................................................ 9-2
9.2. Viewing Operating Status and Configuration Information .................. 9-3
vii

Contents
Viewing Information using ESMPRO Manager .................................. 9-3
9.2.1.
9.2.2. Viewing Information using remote console interface ......................... 9-4
9.3. Setting Performance Thresholds using ESMPRO Manager .............. 9-4
9.3.1. Defining Threshold Values ................................................................. 9-4
9.3.2. Setting Threshold Limits for the Rate of CPU Load ........................... 9-7
9.3.3. Setting Threshold Limits for the File System Free Capacity .............. 9-7
9.4. Viewing Alerts .................................................................................... 9-8
9.4.1. Viewing Alerts using ESMPRO Manager AlertViewer ........................ 9-8
9.4.2. Viewing Alerts Issued by Management Firmware ............................ 9-10
9.5. Creating Graphs of Server Performance using ESMPRO
Manager ............................................................................................ 9-11
9.6. Adding Managed Systems using NEC Server Management ........... 9-12
9.6.1. Discovering Network Servers in ESMPRO Manager ....................... 9-13
Section 10 Troubleshooting Hardware Problems .................... 10-15
10.1. Overview of the Recommended Troubleshooting Sequence ......... 10-15
10.2. Determine the Affected System and Partition from An Alert ........... 10-17
10.2.1. Viewing Alerts Issued by Management Firmware .......................... 10-17
10.2.2. Viewing Alerts using ESMPRO Manager AlertViewer .................... 10-18
10.3. Determine the Affected System and Partition Using Your
Monitoring Software ....................................................................... 10-19
10.3.1. Monitoring with ESMPRO Manager ............................................... 10-19
10.4. Examine the Cell EXPRESSSCOPE® Monitor LCDs .................... 10-19
10.4.1. Fault Messages .............................................................................. 10-20
10.4.2. Viewing Fault Messages ................................................................ 10-21
10.4.3. Fault Messages on the EXPRESSSCOPE® Monitor LCD ............ 10-21
10.5. Examine LEDs (Optional) .............................................................. 10-23
10.5.1. LEDs on Front of Cell ..................................................................... 10-23
10.5.2. LEDs on Back of Cell ..................................................................... 10-24
10.5.3. LEDs not Visible Unless Cell Is Disassembled .............................. 10-26
10.6. Contact the Customer Support Center ........................................... 10-26
10.7. Examine the Management Firmware Event Log ............................ 10-27
viii

Contents
10.7.1.
10.7.2. Analyzing Management Firmware Event Log ................................ 10-28
10.7.3. Asserted and De-Asserted Statuses .............................................. 10-29
10.7.4. Example of the Event Log .............................................................. 10-30
10.8. Get Fault Number Information ........................................................ 10-31
10.9. Examine Management Firmware Sensors ..................................... 10-31
10.9.1. Analyzing Management Firmware Sensor Readings ..................... 10-31
10.9.2. Example of a Sensor Readings Page ............................................ 10-32
Events and Event Logs .................................................................. 10-27
Section 11 Removing and Replacing CRUs ................................ 11-1
11.1. Replaceable Units ............................................................................. 11-1
11.2. Obtaining Replacement Parts ........................................................... 11-2
11.3. Returning Defective Parts ................................................................. 11-2
11.4. Fault Messages on the EXPRESSSCOPE® Monitor LCD ............... 11-2
11.5. Front Bezel ........................................................................................ 11 -3
11.5.1. Attaching the Front Bezel .................................................................. 11-4
11.5.2. Detaching the Front Bezel ................................................................. 11-5
11.6. Components on the Front of a Cell ................................................... 11-6
11.7. Components on the Rear of a Cell .................................................... 11 - 7
11.8. Electrostatic Discharge (ESD) Guidelines ......................................... 11-8
11.9. DIMM (CRU) ..................................................................................... 11 - 9
11.9.1. DIMM Removal Steps ..................................................................... 11-10
11.9.2. DIMM Replacement Steps .............................................................. 11-14
11.10. DVD Drive (CRU) ............................................................................ 11 - 1 5
11.10.1. Removing the DVD Drive ................................................................ 11- 1 5
11.10.2. Replacing the DVD Drive ................................................................ 11-16
11.11. Fan Module (CRU) .......................................................................... 11- 1 6
11.11.1. Removing the Fan Module .............................................................. 11-16
11.11.2. Replacing the Fan Module .............................................................. 11 - 17
11.12. Hard Drive (CRU) ............................................................................ 11 - 1 7
11.12.1. Locating a Failed Hard Drive ........................................................... 11 - 1 7
ix

Contents
11.12.2.
11.12.3. Replacing a Hard Drive ................................................................... 11-20
11.12.4. Reintroducing the Disk Drive .......................................................... 11-21
11.13. Memory Board (CRU) ..................................................................... 11-21
11.13.1. Memory Board Removal Steps ....................................................... 11-21
11.13.2. Memory Board Replacement Steps ................................................ 11-23
11.14. PCIe Card and Carrier (CRU) ......................................................... 11-24
11.14.1. Removing a PCIe Card and Carrier ................................................ 11-24
11.14.2. Replacing a PCIe Card or Carrier ................................................... 11-27
11.15. Power Supply (CRU) ....................................................................... 11-27
11.15.1. Removing a Power Supply .............................................................. 11-27
11.15.2. Replacing the Power Supply ........................................................... 11-28
11.16. Clearing Faults using remote console interface .............................. 11-28
Removing a Hard Drive ................................................................... 11-20
Section 12 Maintaining Service Processors, Partitions, and the
BIOS ............................................................................ 12-1
12.1. Setting Partition Time and Date using remote console interface ..... 12-1
12.2. Adding Memory to Cells and Partitions ............................................ 12-2
12.3. Eliminating Browser Startup Warnings using remote console
interface ........................................................................................... 12-2
12.4. Configuring User Credentials using remote console interface ......... 12-3
12.4.1. Adding User Credentials using remote console interface ................ 12-3
12.4.2. Modifying User Credentials using remote console interface ............ 12-4
12.4.3. Deleting User Credentials using remote console interface .............. 12-5
12.5. Setting Partition MLAN Address using Management Firmware ....... 12-6
12.6. Taking a Dump of Service Processor Data using remote console
interface ........................................................................................... 12-6
12.7. Configuring Windows System Force Dumps ................................... 12-7
12.8. Configuring SUSE LINUX Enterprise Server 10 SP2 System
Force Dumps ................................................................................... 12-8
12.9. Configuring Red Hat Linux 5.2 System Force Dumps ..................... 12-9
12.10. Checking the Level and Updating BIOS Firmware .......................... 12-9
x

Contents
12.10.1.
12.10.2. Obtaining Releases from the Support Site ..................................... 12-10
12.10.3. Updating BIOS on the EFI Flash Memory ...................................... 12-10
Checking BIOS Level using remote console interface ..................... 12-9
Section 13 Using a Trusted Platform Module ............................. 13-1
13.1. TPM Capabilities .............................................................................. 13-1
13.2. Understanding TPM Certificates ...................................................... 13-2
13.3. Taking Ownership of a TPM ............................................................. 13-2
13.3.1. BIOS TPM Settings .......................................................................... 13-3
13.3.2. Enabling a TPM Using BIOS Interface ............................................. 13-4
13.3.3. Disabling TPM Using BIOS Interface ............................................... 13-5
13.4. TPM Physically Present Indicator .................................................... 13-5
13.4.1. Setting TPM Physically Present Indicator Using
EXPRESSSCOPE® Monitor Interface ............................................. 13-6
13.4.2. Clearing TPM Physically Present Indicator Using
EXPRESSSCOPE® Monitor Interface ............................................. 13-6
xi


Figures
Figure 1-1 Express5800/A1160 Cell ............................................................................. 1-1
Figure 1-2 Management Architecture ............................................................................ 1-3
Figure 1-3 Basic Cell ..................................................................................................... 1-5
Figure 1-4 Cabinet Configuration .................................................................................. 1-6
Figure 3-1 Management Firmware Web Page Layout .................................................. 3-2
Figure 3-2 Partition Summary Page .............................................................................. 3-5
Figure 3-3 Partition States Window ............................................................................. 3-10
Figure 3-4 Sensor Readings Page .............................................................................. 3-11
Figure 3-5 Event Log Page ......................................................................................... 3-12
Figure 3-6 Partition Hardware Locator Page .............................................................. 3-13
Figure 3-7 Field-Replaceable Units (FRU) Inventory Page ........................................ 3-15
Figure 3-8 Partition Settings Page .............................................................................. 3-16
Figure 3-9 Power Setting Page ................................................................................... 3-17
Figure 3-10 Boot Cell Selection Setting ...................................................................... 3-18
Figure 3-11 General Settings Page ............................................................................. 3-19
Figure 3-12 Fault Settings Page ................................................................................. 3-20
Figure 3-14 Alert Management Page .......................................................................... 3-22
Figure 3-15 Partition Network Address Page .............................................................. 3-24
Figure 3-16 Partition SSL Certificate Page ................................................................. 3-25
Figure 3-17 Time and Date Page ................................................................................ 3-26
Figure 3-18 User Management Page .......................................................................... 3-27
Figure 3-19 KVMS Redirection Page .......................................................................... 3-28
Figure 3-20 Clear Fault Data — Enable/Disable Components Page .......................... 3-29
Figure 3-21 Partition Diagnostic Tests Page ............................................................... 3-31
Figure 3-22 Partition Diagnostic Tests Status Page .................................................... 3-32
Figure 3-23 Management Firmware Updates Page .................................................... 3-33
Figure 3-24 Partition Service Processors Page .......................................................... 3-34
Figure 3-25 System Settings Page ............................................................................. 3-35
Figure 3-26 Partitioning Page ..................................................................................... 3-36
Figure 3-27 Cell Access Page ..................................................................................... 3-37
xiii

Figures
Figure 3-28 Cell Summary Page ................................................................................ 3-38
Figure 3-29 Cell Hardware Locator Page ................................................................... 3-39
Figure 3-30 Cell Network Address Page ..................................................................... 3-40
Figure 3-31 Cell SSL Certificate Page ........................................................................ 3-41
Figure 3-32 Cell Diagnostic Tests Page ...................................................................... 3-42
Figure 3-33 Cell Diagnostic Tests Status Page ........................................................... 3-42
Figure 3-34 Cell Service Processor Page ................................................................... 3-43
Figure 4-1 EXPRESSSCOPE® Monitor Interface ........................................................ 4-2
Figure 4-2 EXPRESSSCOPE® Monitor LCD Main Screen Layout .............................. 4-3
Figure 4-3 EXPRESSSCOPE® Monitor LCD Main Screen Example ........................... 4-4
Figure 4-4 EXPRESSSCOPE® Monitor Main Menu .................................................... 4-7
Figure 4-5 System Menu .............................................................................................. 4-8
Figure 4-6 System Information ..................................................................................... 4-8
Figure 4-7 Fault Message on Main Screen ................................................................. 4-11
Figure 4-8 View Faults Option on Main Menu ............................................................. 4-12
Figure 4-9 Fault Message ........................................................................................... 4-12
Figure 4-10 Clearing Fault Messages ......................................................................... 4-13
Figure 4-11 Network Information................................................................................. 4-15
Figure 4-12 Settings Reserved ................................................................................... 4-16
Figure 4-13 Expanded Network Menu ........................................................................ 4-16
Figure 4-14 Setting IP Address Value ......................................................................... 4-17
Figure 4-15 Applying IP Address Changes ................................................................. 4-18
Figure 5-1 BIOS Front Page ......................................................................................... 5-5
Figure 5-2 BIOS Boot Manager .................................................................................... 5-6
Figure 5-3 Boot Maintenance Manager ........................................................................ 5-7
Figure 5-4 Boot Options ................................................................................................ 5-8
Figure 5-5 BIOS Setup Window .................................................................................... 5-9
Figure 5-6 BIOS General Window .............................................................................. 5-10
Figure 5-7 BIOS Partition Window .............................................................................. 5-11
Figure 5-8 BIOS Advanced Window ........................................................................... 5-12
Figure 5-9 BIOS Security Window .............................................................................. 5-13
xiv

Figure 5-10 OS Control Window ................................................................................. 5-14
Figure 5-11 BIOS Memory Configuration Window ...................................................... 5-15
Figure 5-12 Memory Configuration Addressing Window ............................................. 5-16
Figure 5-13 Processor Configuration Window ............................................................ 5-17
Figure 5-14 I/O Configuration Window ........................................................................ 5-18
Figure 6-1 Power Strip and Switch ................................................................................ 6-2
Figure 7-1 SMTP Page ................................................................................................. 7-4
Figure 7-2 Alert Management - Modify Email ................................................................ 7-5
Figure 7-3 Alert Management - Modify SNMP Trap ...................................................... 7-6
Figure 8-1 Partitioning ................................................................................................... 8-2
Figure 8-2 Partitioning Messages ................................................................................. 8-9
Figure 8-3 BIOS Core Selection Window .................................................................... 8-12
Figure 9-1 Threshold Values and Status ....................................................................... 9-5
Figures
Figure 9-2 CPU Load Threshold and Reset Values ...................................................... 9-6
Figure 9-3 Alert on AlertViewer Window ....................................................................... 9-9
Figure 9-4 E-mail Alert from Management Firmware .................................................. 9-11
Figure 10-1 Recommended Troubleshooting Sequence .......................................... 10-16
Figure 10-2 E-mail Alert from management Firmware .............................................. 10-17
Figure 10-3 AlertViewer Alert Log ............................................................................. 10-18
Figure 10-4 Server Experiencing a Problem ............................................................. 10-19
Figure 10-5 Fault Message on Main Screen ............................................................. 10-20
Figure 10-6 View Faults Option on Main Menu ......................................................... 10-21
Figure 10-7 Fault Message ....................................................................................... 10-21
Figure 10-8 LEDs on Front of Cell ............................................................................ 10-24
Figure 10-9 LEDs on Back of Cell ............................................................................. 10-26
Figure 10-10 Event Log Page ................................................................................... 10-30
Figure 10-11 Sensor Reading Page .......................................................................... 10-33
Figure 11-1 Front Bezel of the Cell ............................................................................. 11-4
Figure 11-2 Keyhole for the Security Key ................................................................... 11-4
Figure 11-3 Attach the Bezel to the front of the Cell ................................................... 11-5
Figure 11-4 Detach the Bezel from the front of the Cell .............................................. 11-6
xv

Figures
Figure 11-5 Front of the Cell ....................................................................................... 11-6
Figure 11-6 Rear of the Cell ........................................................................................ 11-8
Figure 11-7 ESD Ground Locations ............................................................................ 11-9
Figure 11-8 Fan Module ............................................................................................ 11-11
Figure 11-9 Removing the Memory Board ................................................................ 11-12
Figure 11-10 DIMM Locations ................................................................................... 11-13
Figure 11-11 DIMM Socket Release Latches ............................................................ 11-14
Figure 11-12 DIMM Socket Release Latches ........................................................... 11-15
Figure 11-13 DVD Drive ............................................................................................ 11-16
Figure 11-14 Fan Module .......................................................................................... 11-17
Figure 11-15 RAID Viewer Window .......................................................................... 11-19
Figure 11-16 Physical Device Properties .................................................................. 11-19
Figure 11-17 Hard Drive ........................................................................................... 11-20
Figure 11-18 Fan Module .......................................................................................... 11-22
Figure 11-19 Removing the Memory Board .............................................................. 11-23
Figure 11-20 PCIe Card Carrier ................................................................................ 11-25
Figure 11-21 Removing the PCIe Card ..................................................................... 11-26
Figure 11-22 PCIe Card ............................................................................................ 11-27
Figure 11-23 Power Supply ...................................................................................... 11-28
Figure 12-1 User Management Add New User Page ................................................. 12-4
Figure 12-2 User Management Modify User Page ..................................................... 12-5
Figure 12-3 BIOS Version ......................................................................................... 12-10
Figure 12-4 BIOS Front Page ................................................................................... 12-11
Figure 12-5 BIOS Setup Window .............................................................................. 12-12
Figure 12-6 BIOS Partition Window .......................................................................... 12-13
Figure 12-7 OS Control Window ............................................................................... 12-14
xvi

Tables
Table 10-1 Device Names on the EXPRESSSCOPE® Monitor LCD ....................... 10-22
Table 10-2 LEDs on Front of Cell .............................................................................. 10-23
Table 10-3 LEDs on Back of Cell .............................................................................. 10-24
Table 10-4 Power Supply LEDs ................................................................................ 10-25
Table 10-5 LEDs not Visible Unless Cell Is Disassembled ....................................... 10-26
Table 10-6 Servicing FRUs and CRUs ...................................................................... 10-27
Table 10-7 Explanation of Example Event Log ......................................................... 10-31
Table 10-8 Explanation of Example Sensor Readings Page .................................... 10-33
Table 11-1 Device Names on the EXPRESSSCOPE® Monitor LCD .......................... 11-3
Table 11-2 Components on the Front of the Cell ........................................................ 11-7
Table 11-3 Components on the Rear of the Cell ......................................................... 11-8
xvii

Using This Guide
This guide contains information how to operate and administrate Express5800/A1160
server.
Who Should Use This Guide
This guide is intended for system administrators and operation personnel who are using
Express5800/A1160 server.
Symbols and Conventions
This guide uses the following text conventions and graphic symbols.
Warnings, cautions, and notes have the following meanings:
WARNING
Warnings alert you to situations that could result in serious personal injury or loss
of life.
CAUTION
Cautions indicate situations that can damage the system hardware or software.
Note: Notes give important information about the material being described.
Names of keyboard keys are printed as they appear on the keyboard. For example, Ctrl,
Alt, or Enter.
Text or keystrokes that you enter appear as boldface type. For example, type abc123
and press ENTER.
File names are printed in uppercase letters. For example, AUTOEXEC.BAT.
Related Documents
In addition to this guide, the following system documentation is useful.
NECCare™ Guide
The NECCare Guide contains information about NEC’s warranty and server registration.
xix

Safety Notices
Safety Notices
WARNING
To avoid a risk of injuries, maintenance procedures require trained technical
personnel.
In maintenance procedures with voltages of 42.4V peak or 60Vdc or more, take
safety measures, such as wearing insulated rubber gloves. Performing work
without these measures may cause electric shock.
In an emergency, such as a dangerous event that requires turning off the power
supply, turn off the breaker at the rear of the server. Turning off the breaker may
cause data destruction. Therefore, users should determine when to turn off the
breaker in accordance with specified operation criteria.
The server is equipped with a front stabilizer. Engage the front stabilizer during
installation. For stability and to distribute the weight, also attach side stabilizers.
Otherwise, the rack may topple over and cause injuries.
If you extend two or more devices from the rack at the same time, the rack may
topple over on you. Extend only one device from the rack at a time.
Exercise great care not to hurt your fingers on the rail when you mount/dismount
the equipment into/from the rack.
Lithium batteries can be dangerous. Improper handling of lithium batteries may
result in an explosion. Dispose of lithium batteries as required by local ordinance.
Replace only with the same or equivalent type battery.
A liquid crystal display is used in this server. When handling a damaged liquid
crystal display, take care to avoid exposure to the liquid inside the liquid crystal
display. The liquid can cause bodily harm. In the event the liquid is ingested,
gargle at once and consult a doctor immediately. If the liquid comes in contact
with skin or gets into the eyes, wash the skin with cool running water, or flush the
eye with cool running water for at least 15 minutes and consult a doctor.
The DVD-ROM drive uses a laser beam. Do not look or insert a mirror inside
while the system is on. A laser beam is invisible; if your eyes get exposed to it,
there is a risk of losing your eyesight.
Elevated Operating Ambient Temperature – If installed in a closed or multi-unit rack
assembly, the operating ambient temperature of the rack environment may be greater
than the room ambient environment. Therefore, consideration should be given to
xx

Safety Notices
installing the equipment in an environment compatible with the maximum rated ambient
temperature of 89.6°F.
Reduced air Flow – Installation of the equipment in a rack should be such that the
amount of air flow required for safe operation of the equipment is not compromised.
To prevent fires, and damage to rack equipment and supply wiring, make sure that the
rated load of the power branch circuit is not exceeded. Equipment nameplate ratings
should be used when addressing this concern. For more information on installation and
wiring of power-related facilities, contact your electrician or local power company.
To prevent electrical shock, connect all rack and rack support equipment to the same
electrical circuit of the building wiring. If you are unsure, check the building wiring to
avoid remote earth conditions.
For safe operation, only connect the equipment to a building supply that is in accordance
with current wiring regulations in your country. In the USA those wiring standards are
regulated by Underwriter Laboratories (UL); in the U.K. by the Institution of Electrical
Engineers, (IEE) and in Canada by the Canadian Standards Association (CSA).
WARNING
Some locations within the server have high voltage and therefore are very
dangerous. To avoid risk of electric shock, turn off all server power and
disconnect power cables before working inside the server unit.
The main power of your server is turned off by turning off the power source to the
server or removing the power cable.
Before touching the parts in the server, wait for at least 10 to 15 seconds until
residual voltage is discharged.
Online maintenance – During and after servicing, do not leave the server door open
unless necessary to perform servicing.
xxi

Safety Notices
WARNING
Take care not to short live components with conductive tools, such as an
adjustable wrench.
To prevent shock, take care not to drop or leave conductive parts, such as a
screw, in the server when servicing the system.
Be careful when accessing a fan or rotating parts to avoid cutting your hand or
fingers.
Safety inspections – When servicing the system, check equipment that can cause harm
due to deterioration, and if necessary, replace the part.
Safety Notices for Users Outside of the U.S.A. and Canada
PELV (Protected Extra-Low Voltage) Integrity: To ensure the extra-low voltage integrity
of the equipment, connect only equipment with mains-protected electrically-compatible
circuits to the external ports.
Remote Earths: To prevent electrical shock, connect all local (individual office)
computers and computer support equipment to the same electrical circuit of the building
wiring. If you are unsure, check the building wiring to avoid remote earth conditions.
Earth Bonding: For safe operation, only connect the equipment to a building supply that
is in accordance with current wiring regulations in your country. In the USA those wiring
standards are regulated by Underwriter Laboratories (UL); in the U.K., by the Institution
of Electrical Engineers, (IEE) and in Canada by the Canadian Standards Association
(CSA).
xxii
Section 1
Introduction
This document describes how to operate and administer the Express5800/A1160
system.
1.1. Documentation Updates
This document contains all the information that was available at the time of publication.
The latest version of the document may be found in the Product Support Web Site:
http://support.necam.com/servers/Enterprise/
1.2. Scalable Symmetric Multiprocessing Servers
Express5800/A1160 systems are the next generation of symmetric multiprocessing
(SMP) servers that support multi-core Intel Xeon processors.
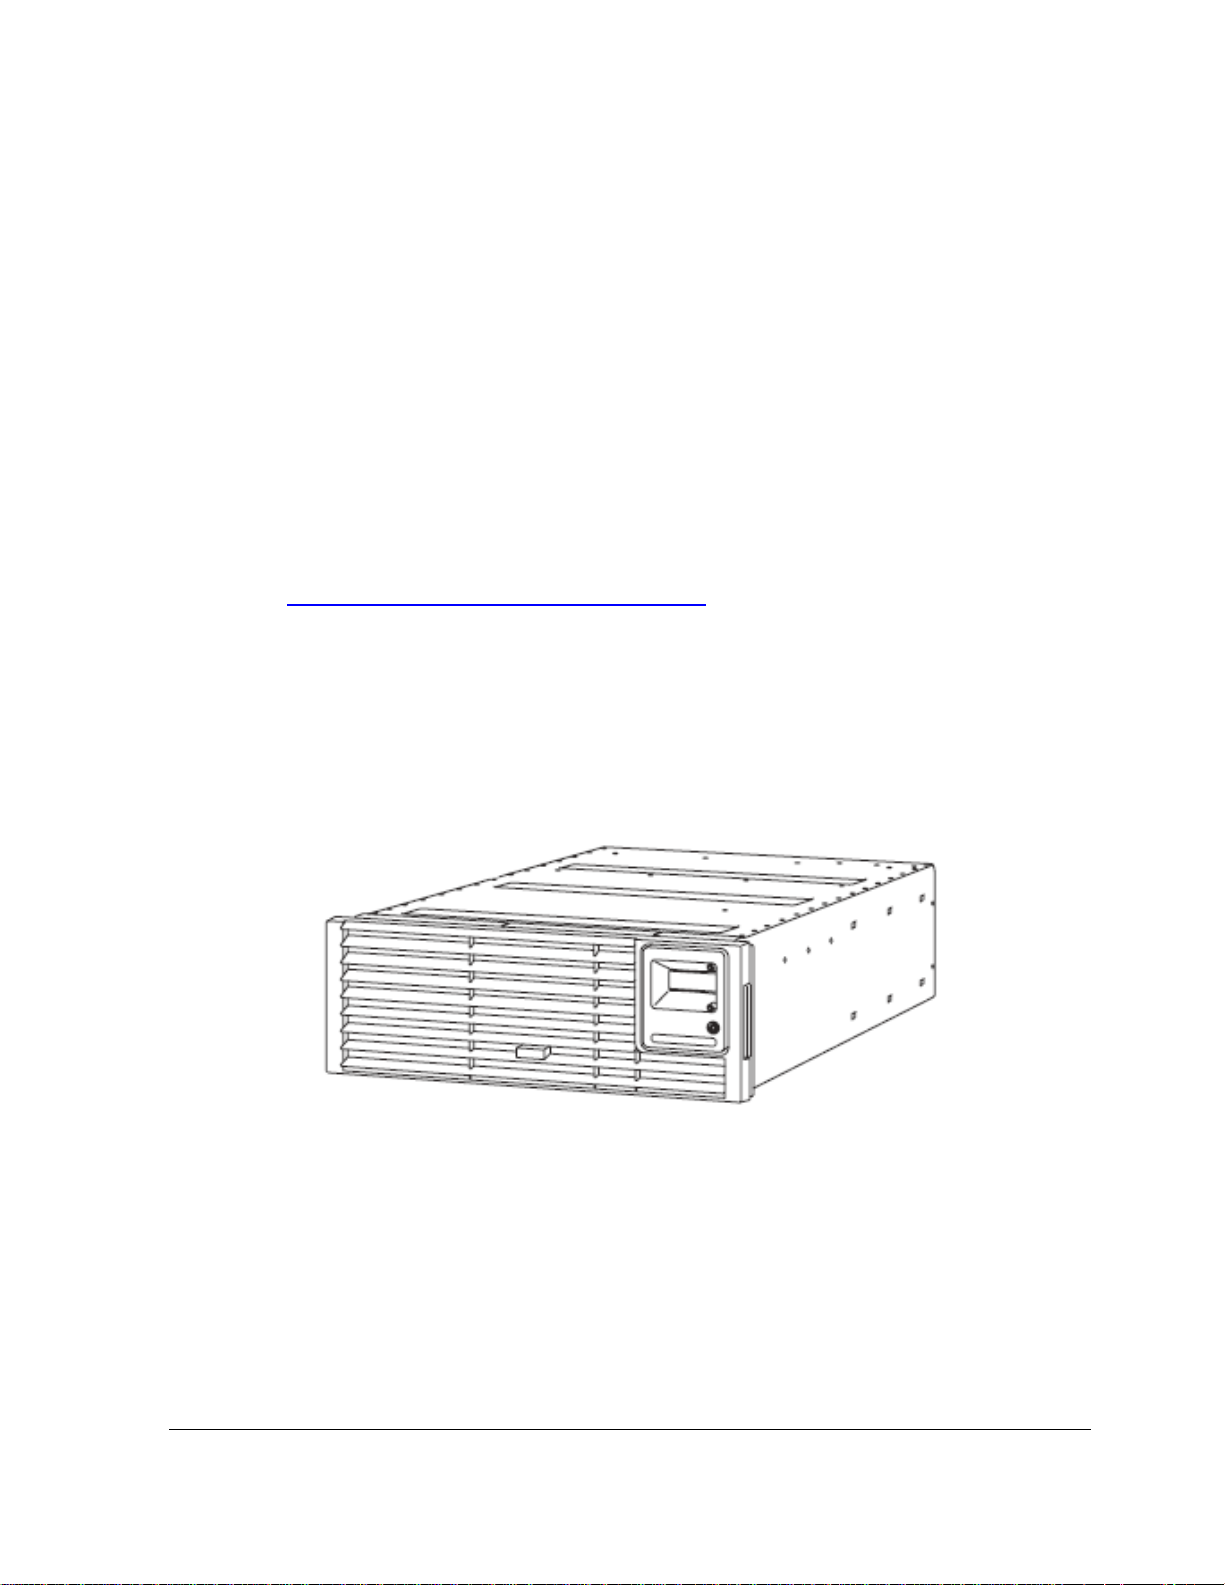
Figure 1-1 Express5800/A1160 Cell
Basic Building Block
Express5800/A1160 systems employ a modular building-block design. The basic
building block is a cell—a standard 19-inch 4U rack-mounted server. A cell contains four
processor sockets, six Peripheral Component Interconnect Express (PCIe) slots, 32
dual inline memory module (DIMM) sockets that support 2-GB or 4-GB fully buffered
DIMMs, and all the other components it needs to function as a self-contained computer
system.
1-1

Server Management
Modular Expansion
The cell-based building-block design allows Express5800/A1160 systems to grow as
business needs evolve. By connecting cells together, you can expand an
Express5800/A1160 system from 4 to 16 processor sockets. Memory expands from 2 to
128 DIMM sockets. With 4-GB fully buffered DIMMs, a cell can contain up to 128 GB of
memory, and a 4-cell system can contain up to 512 GB of memory. The I/O subsystem
expands from 6 to 24 PCIe slots and adding PCIe expansion modules can further
increase the number of I/O slots. Hardware to connect the cells together is added only
as the server size increases.
System Partitioning
Each cell in an Express5800/A1160 system can function as an independent partition. In
multiple-cell systems, two or more cells can be combined into a single partition. Each
partition can run an operating system different from the operating system in any other
partition.
Customer Installation and Servicing
Express5800/A1160 systems are designed to be installed by the customer without any
special tools or training. Likewise, no special tools or training are required to service
customer-replaceable units (CRUs).
Reliability, Availability, and Serviceability
Express5800/A1160 systems contain many features to detect and isolate faults.
Systems with two or more cells provide 99.995% or better hardware availability.
Distributed System Management
Management controllers within each cell of an Express5800/A1160 system cooperate to
provide management of the system. Hosted remotely, a server management application,
such as NEC Server Management software, can monitor and control the system.
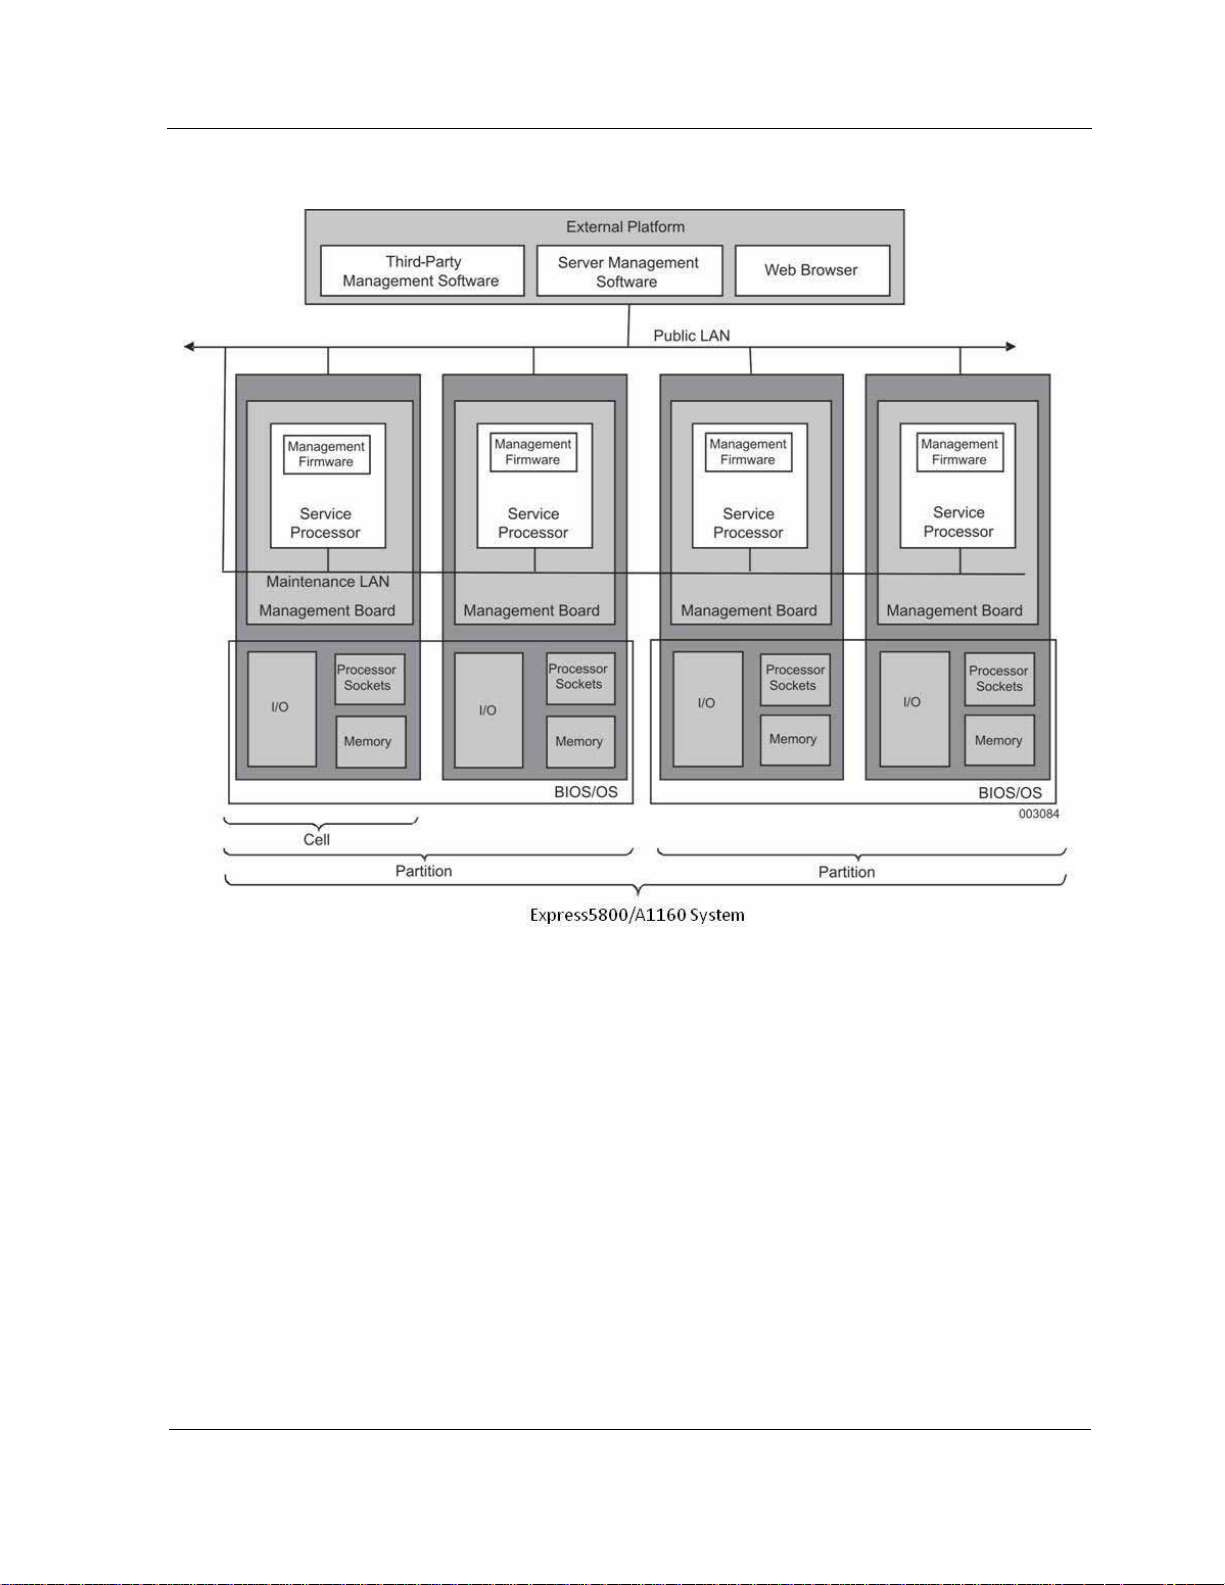
1.3. Server Management
Management of Express5800/A1160 systems consists of both hardware and software
components. The main hardware component is the management board, which contains
the Service Processor and other components. Software components include the
management firmware, remote console interfaces, and the BIOS.
External management platforms, such as a management server or a workstation, enable
system administrators to manage the system when the operating system network
drivers or the partition are not functioning properly. External management platforms also
provide access to additional features and third-party software.
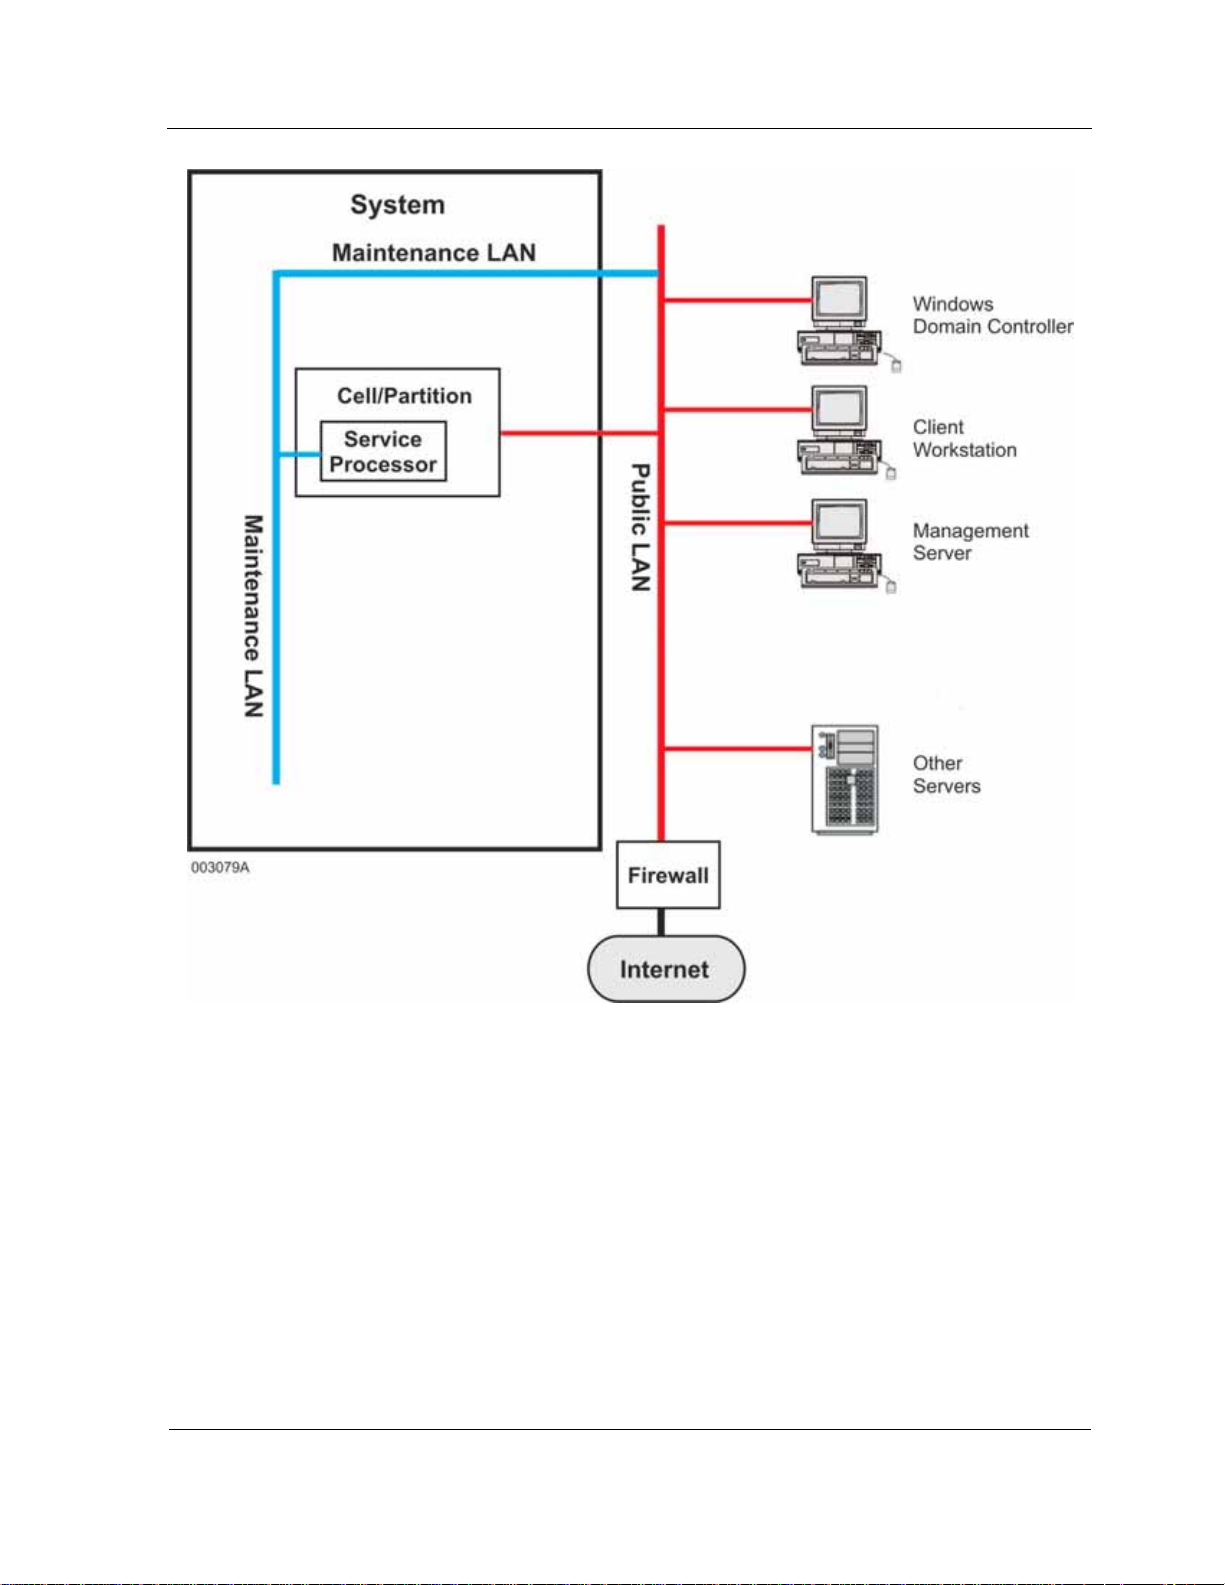
Figure 1-2
illustrates the management architecture of Express5800/A1160 systems.
1-2
User Interfaces
Figure 1-2 Management Architecture
1.4. User Interfaces
This guide includes information about system products with user interfaces. For a
complete description of the system and products without user interfaces, refer to the
Technical Overview.
For each interface, this guide contains a summary description, its uses, and how to
access it. If the interface does not have other documentation, this guide provides
complete detail; otherwise, this guide refers to the other documentation. The interfaces
are
• Remote Console Interfaces
• EXPRESSSCOPE® Monitor Interface
• ESMPRO Manager
1-3

Express5800/A1160 Cell
• ESMPRO Alert Manager
• ESMPRO Agent
• BIOS Interface
Refer to Section 2 Overview of System Interfaces
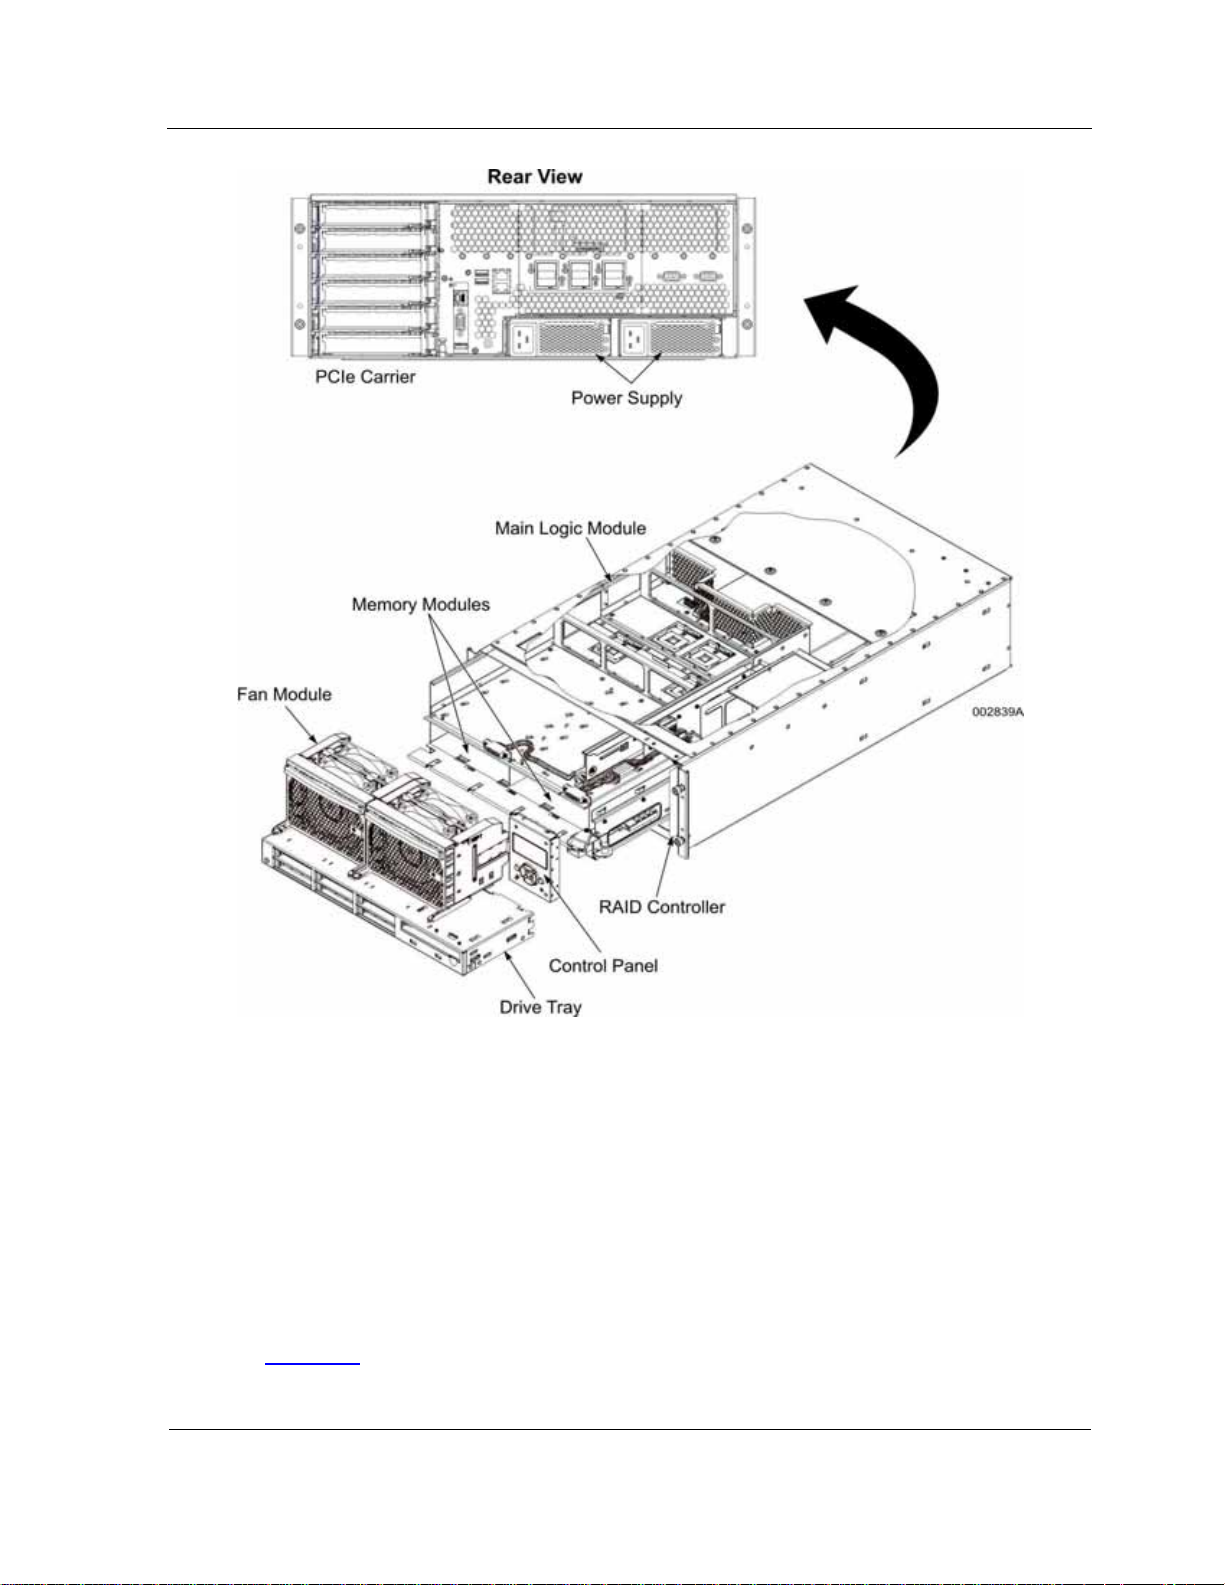
1.5. Express5800/A1160 Cell
In Express5800/A1160 systems, hardware components are organized into cells. The
main components of a cell are
• Main logic module that hosts the processors, processor voltage regulator modules,
and node controller. (The node controller interconnects the components of a cell
and provides the connection among the cells in a multiple-cell system.)
• Memory board that contains the DIMM sockets for the fully buffered DIMMs.
• I/O subsystem that includes the I/O riser board, PCIe carriers, and PCIe cards.
• Power supplies.
• Fan modules.
• Peripherals including drive tray and hard drives, DVD drive, and Serial Attached
SCSI (SAS) RAID controller.
• Management and maintenance components (EXPRESSSCOPE® Monitor and
management board).
for more information.
Figure 1-3
illustrates the main components of a cell.
1-4
Cabinets
1.6. Cabinets
Express5800/A1160 systems can be installed in any standard 19-inch-wide cabinet. You
can either order a cabinet from NEC or provide your own. See the System Planning
Guide for the requirements for customer-provided cabinets.
Optionally, each system can have a directly connected keyboard, monitor, and mouse to
serve as a system console.
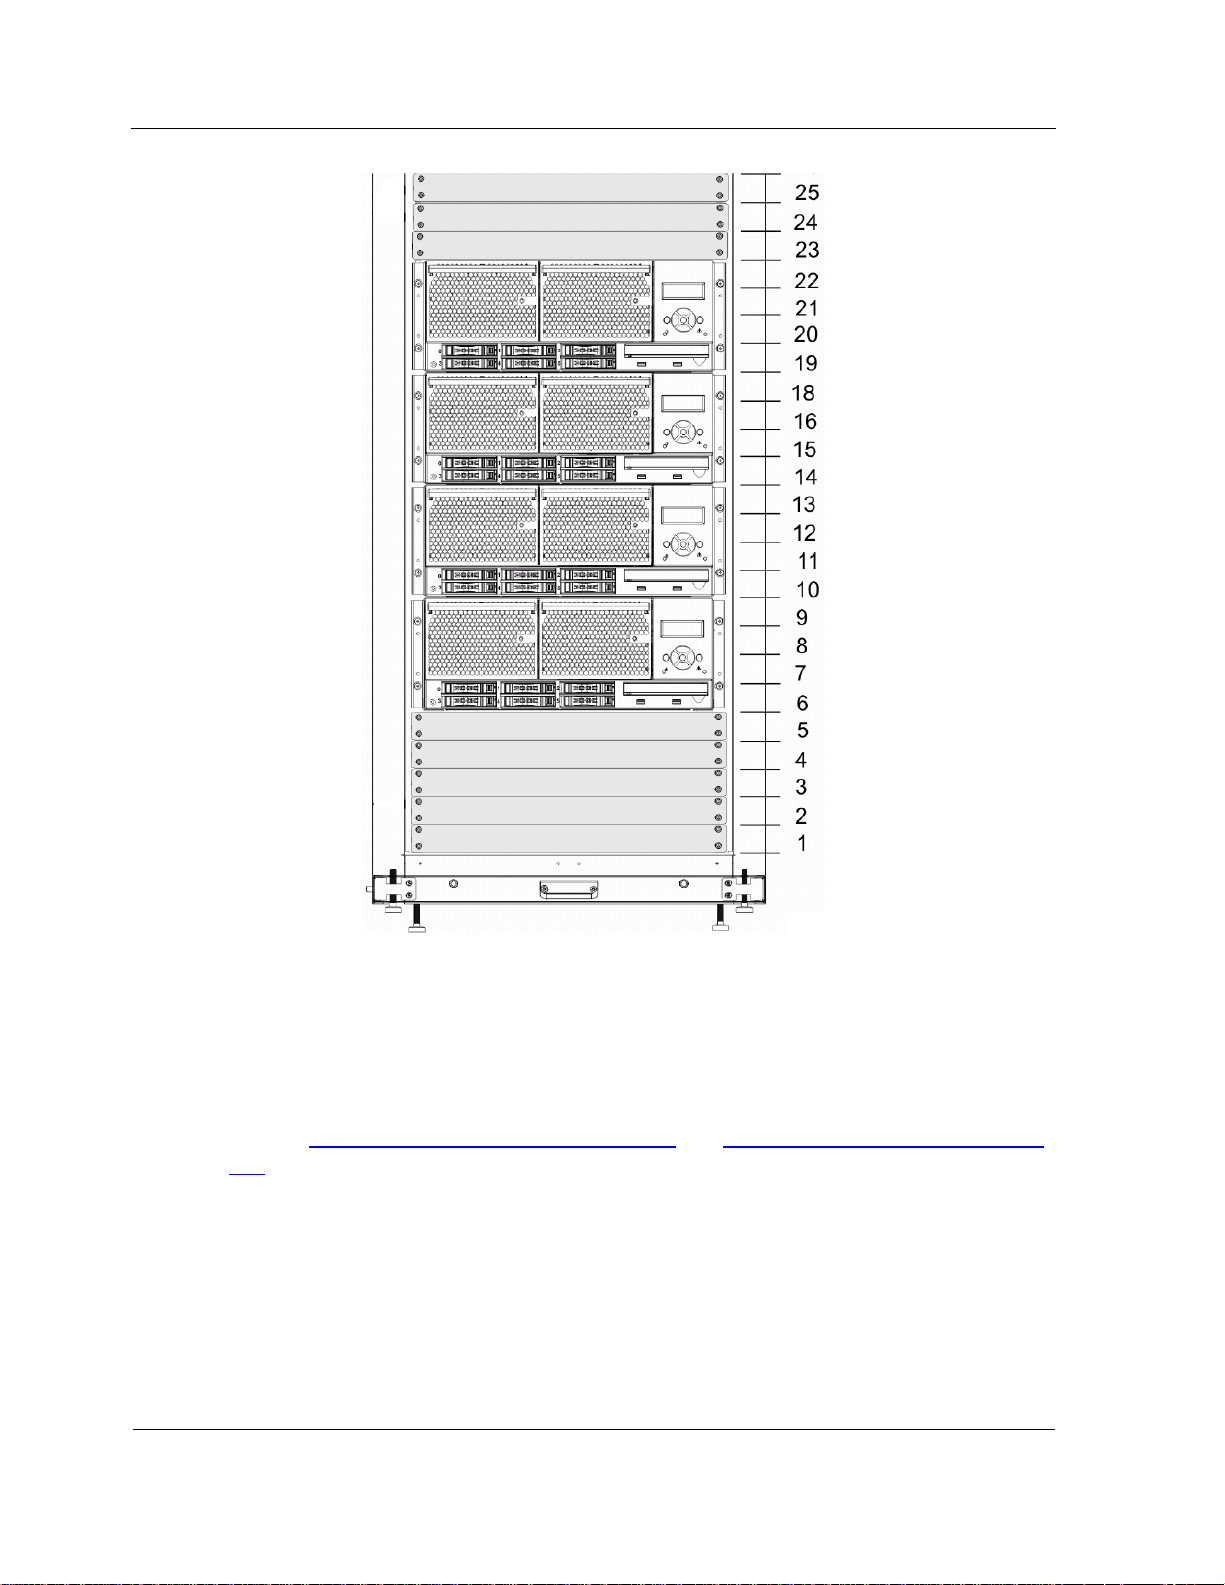
Figure 1-4
shows the configuration of cells and other components in a cabinet.
Figure 1-3 Basic Cell
1-5
Locations of Hardware Components
Figure 1-4 Cabinet Configuration
1.7. Locations of Hardware Components
Hardware components are visible and accessible through the front or back of the cell.
Refer to 11.6 Components on the Front of a Cell
Cell for illustrations and descriptions.
and 11.7 Components on the Rear of a
1.8. System Components
The following illustration shows how the components are connected in a typical system
environment.
1-6
System Components
Your system can include the following components.
Cells
A cell contains the physical resources of the system: instruction processors, memory,
input/output devices, peripheral storage devices, management board, fans, power
supplies, EXPRESSSCOPE® Monitor, and so on. Each system comprises one to four
cells.
Maintenance LAN (MLAN)
The maintenance LAN (MLAN) connects the internal components of the system.
1-7

Network Components
Partition
A partition is a combination of one to four cells that runs a single instance of an
operating system or virtual machine monitor. The operating system can be Red Hat
Linux, SUSE Linux, or any supported Windows operating system. The virtual machine
monitor can be VMware ESX or Xen. You can purchase the operating system or virtual
machine monitor from NEC or supply it yourself.
A system comprises a minimum of one and a maximum of four partitions.
Service Processor
Each cell has an internal management board. For each partition, one of the partition’s
management boards serves as the Service Processor. (Other management boards in
the partition are called satellite management controllers.) A Service Processor manages
and maintains the partition, monitors the system for hardware problems, and allows you
to repartition the system.
The system’s management firmware resides on flash memory on the management
board and provides the Service Processor functionality. Using a Web browser, you
connect to the remote console interface to maintain, monitor, and repartition the system.
The management board also includes the BIOS and Console Manager firmware.
1.9. Network Components
Your network environment can include the following components.
Public LAN
The public LAN is the customer’s internal production network that connects the servers,
workstations, and so forth of an enterprise. It is sometimes referred to as the enterprise
LAN.
Windows Domain Controller
The domain controller typically acts as the Domain Name System (DNS), Windows
Internet Name Service (WINS), and Dynamic Host Configuration Protocol (DHCP)
server.
Note: DNS and WINS servers must be made secure in accordance with local security
policy guidelines. Microsoft recommends that production applications such as Server
Management software not be installed on domain controllers. For more information
about domain controllers, see the appropriate Microsoft documentation.
1-8

Management Server
A management server that has Server Management software installed enables you to
manage new Express5800 systems and monitor older Express5800 systems in your
environment. A management server is necessary in order for your system to report
problems to the NEC client support center using remote maintenance service requests.
The ESMPRO Manager is installed on the management server. It is designed to help
you manage your enterprise at a glance.
Client Workstation
A client workstation enables you to remotely access management server functionality.
From a Web browser on the client workstation, you can also access the Remote
Console interface residing on the partition Service Processor. In addition, a client
workstation can serve as a remote system console by accessing the KVMS Redirection
page of the Partition Remote Console interface, which launches the Console Manager
Partition Desktop or JViewer interface.
Network Components
Console Manager Client Software
Console Manager Partition Desktop and JViewer user interfaces enable you to manage
partitions remotely, without the need for directly attached peripherals. Instead, you can
use one or more network-connected workstations to view and control partitions. (These
workstations can be the same as client workstations that have Server Management
software installed or can be other workstations that meet the Console Manager
requirements.) You can control the partition keyboard and mouse, view the partition
operations, and share storage drives or storage images with the partition.
To control a partition remotely, you access the Partition Desktop or JViewer interface
from the KVMS Redirection page of the remote console interface. (If your workstation is
running a Windows operating system and Internet Explorer, you can use the Partition
Desktop. If your workstation is running either a Linux operating system or a Windows
operating system with the required Java software, you can use JViewer.) The
appropriate client software is downloaded to your workstation, and you can view or
operate the partition.
1-9


Section 2
Overview of System Interfaces
The Express5800/A1160 system offers a number of user interfaces for different
purposes. This section contains the following information for each interface:
• A summary of the interface capabilities
• Uses for the interface
• Instructions for accessing and logging on, if appropriate
• Pointers to additional information in this and other documents
2.1. Remote console interfaces
Management firmware is a comprehensive means of configuring, controlling, and
monitoring individual components of the Express5800/A1160 system and the system as
a whole. Management firmware runs on the Service Processor.
The remote console interfaces are client user interfaces to management firmware that
are provided by Web servers running on Service Processors. You can access remote
console interfaces using a Web browser on any device that is connected to the LAN that
supports the Express5800/A1160 system.
Different remote console interfaces (sets of Web pages) control each partition, each cell,
and the system as a whole. Each remote console interface provides commands to view
information and update settings for that component. Figure 3-2
3-27 show the opening page of each set of Web pages.
For more information, refer to
• The following paragraphs for uses of and logging on to the remote console
interfaces
• Section 3 Remote console interfaces
pages for partitions, cells, and the system, including the available commands
• The Console Manager Help for a description of Console Manager, the workstation
requirements for both the Partition Desktop and JViewer interfaces, and Partition
Desktop menus and buttons
for detailed information about the sets of Web
, Figure 3-24 and Figure
Note: Console Manager Help is available through the Partition Desktop and from
the Product Support Web Site. The JViewer Help is available through JViewer.
• Later portions of this guide for procedures that use remote console interfaces
2-1

Remote console interfaces
2.1.1. Uses for remote console interfaces
The remote console interfaces enable you to
• View information about a partition, a cell, or the system as a whole, including
network settings
• Set attribute values to control the behavior of components, such as automatic
booting of partitions
• Submit commands to perform actions, such as shutting down partitions
• Monitor operating status and events
• Configure behavior in response to hardware faults and configure alert notifications,
including configuring the SMTP server for sending e-mail alerts
• Troubleshoot problems, perform diagnostic tests, and clear faults after replacing
faulty hardware
The remote console interfaces are the only interfaces that enable you to
• Start a remote session from a workstation, using the Partition Desktop or JViewer
interface of Console Manager (refer to 9.1 Accessing the Desktop of a Partition
Remotely using remote console interface)
• Set the power restore policy, which controls how partitions are powered up (refer to
3.5.9 Power Settings
• Control whether a partition that is missing some resources (that is, a degraded
partition) can boot (refer to 3.5.12 Fault Settings)
• Perform partitioning actions for the Express5800/A1160 system (refer to Section 8
Performing Partitioning Actions), such as
- Selecting the primary and secondary boot cells for each partition
- Modifying existing partitions and creating new partitions
2.1.2. Accessing and Logging On to remote console interfaces
You log on to remote console interfaces (sets of Web pages) for each partition, cell, and
the system as a whole separately, as explained in the following paragraphs.
Logging On to a Partition or Cell
To access the remote console interface for a partition or cell
1. Type the maintenance LAN (MLAN) address of the partition or cell in the browser
address box.
2-2

Note: The MLAN address is the IP address on the partition and cell menus on the
EXPRESSSCOPE® Monitor LCD. Refer to 4.5 Network
A log-on dialog box appears.
2. Type a valid user name and password, and click Log On.
Management firmware authenticates the credentials before displaying the
requested remote console interface. The same credentials are valid when logging
on to the remote console interface for any partition or cell, but you must enter the
credentials each time.
Logging On to the System
To access the remote console interface for the system as a whole, do either of the
following:
• Log on to a partition interface, click the system name in the top banner, and enter
your credentials in the system log-on dialog box.
Authentication is required when accessing the system remote console interface
from a partition remote console interface.
EXPRESSSCOPE® Monitor Interface
• Log on to a cell interface and click the system name in the top banner.
Authentication is not required when accessing the system remote console interface
from a cell remote console interface.
Strategies for Logging On
Another way to access the remote console interface for a cell is to first log on to the
system remote console interface and then use the cell access link in the system Web
page (refer to 3.6.3 Cell Access
You can minimize the number of MLAN addresses you must remember by adopting the
following strategy:
1. Log on to a partition remote console interface using its MLAN address in your
browser.
2. Access the system remote console interface using the top banner of the partition
Web page.
3. Access a cell remote console interface using the cell access link in the system Web
page.
)
2.2. EXPRESSSCOPE® Monitor Interface
The front of each cell has an EXPRESSSCOPE® Monitor, as shown in Figure 4-1. The
2-3

EXPRESSSCOPE® Monitor Interface
EXPRESSSCOPE® Monitor enables you to monitor operating status and perform some
tasks. The EXPRESSSCOPE® Monitor uses management firmware, which runs on the
Service Processor.
Each EXPRESSSCOPE® Monitor interface consists of an LCD and a set of buttons.
The tasks that you can do using the EXPRESSSCOPE® Monitor interface are mostly a
subset of the tasks that you can do using the remote console interface. The tasks
pertain to the cell, the partition of which the cell is a member, and the system as a whole.
To perform tasks for other partitions and their member cells, use the
EXPRESSSCOPE® Monitor interface on the appropriate cell.
For more information, refer to
• The following paragraphs for uses of and instructions on accessing the
EXPRESSSCOPE® Monitor interface
• Section 4 EXPRESSSCOPE® Monitor Interface
commands and options for partitions, cells, and the system
• Later portions of this guide for procedures that use the EXPRESSSCOPE® Monitor
interface
for detailed information about
2.2.1. Uses for EXPRESSSCOPE® Monitor Interface
The EXPRESSSCOPE® Monitor interface on the front of each cell enables you to
• Have physical access to the system and some capabilities that should not be
available remotely, such as
- Powering on and powering off individual cells for maintenance
- Enabling or disabling the Trusted Platform Module (TPM); refer to Section 13
Using a Trusted Platform Module for more information
• Monitor and control partition and cell operations
• Monitor messages and other information about field-replaceable units (FRU) faults,
successful completion of commands, and errors
• Identify the physical cell (chassis) when looking at the front and back of the rack
• Set up partition and cell network addresses
• Perform basic partition and cell configuration
The EXPRESSSCOPE® Monitor interface is the only interface from which you can
• Determine whether CRU or FRU faults exist, including the part name and number of
the unit (refer to 4.3 Fault Messages
• Set or clear the TPM Physically Present indicator, which is required when enabling
or disabling the TPM (mentioned previously)
)
2-4

ESMPRO Manager
• See POST codes displayed (refer to 6.5 System Power-On Self Tests (POST))
• Set up initial network information (refer to 4.5.2 Updating Network Settings
enables the connection to the remote console interface
2.2.2. Accessing EXPRESSSCOPE® Monitor Interface
The EXPRESSSCOPE® Monitor interface is on the front of each cell. You must be
physically present to operate the buttons and view the LCD and LEDs.
2.3. ESMPRO Manager
Server Management software enables you to manage remote servers across a network.
ESMPRO Manager works in conjunction with ESMPRO Alert Manager, ESMPRO Agent
for Windows, and ESMPRO Agent for Linux to monitor, log, and report operational
information and alerts for failures and error information.
ESMPRO Manager runs on a management server. The agents run on the appropriate
partitions.
For more information, refer to
• 2.5 ESMPRO Agent for Windows
ESX Server
and 2.6 ESMPRO Agent for Linux or VMware
), which
• ESMPRO Manager Help
• ESMPRO Manager User’s Guide
• Later portions of this guide
2.3.1. Uses for ESMPRO Manager
The ESMPRO Manager enables you to
• Collect and view data that is transmitted by agents on the partitions about server
hardware and software configurations, failures, and performance
• Create more efficient data routing procedures and optimize server usage by
analyzing log data to
- Track short-term and long-term performance, including using graphs to record
and analyze trends
- Monitor server usage
- Check server failure rates
• Access AlertViewer and configure how alerts appear in AlertViewer
2-5

ESMPRO Alert Manager
• Access Alert Manager through AlertViewer
2.3.2. Accessing ESMPRO Manager
To access ESMPRO Manager
1. Navigate to the desktop of a management server.
2. On the Start menu of the management server, point to All Programs and then
ESMPRO Manager, and click ESMPRO Manager.
The ESMPRO Manager Operation Window appears and displays the hierarchy of
systems and servers. The AlertViewer window opens also and displays alerts sent from
servers.
2.4. ESMPRO Alert Manager
ESMPRO Alert Manager directs and manages alerts, using the reporting capabilities of
ESMPRO Manager AlertViewer.
ESMPRO Alert Manager runs on the management server and operates in conjunction
with ESMPRO Manager, ESMPRO Agent for Windows, and ESMPRO Agent for Linux.
For more information, refer to
• 2.3 ESMPRO Manager
for Linux or VMware ESX Server
• ESMPRO Alert Manager User’s Guide
• Later portions of this guide
, 2.5 ESMPRO Agent for Windows and 2.6 ESMPRO Agent
2.4.1. Uses for ESMPRO Alert Manager
ESMPRO Alert Manager
• Directs and manages reports of alerts that occur in response to a server condition
that requires attention, where the condition could be a
- System event
- System error
- System resource that is operating outside its specified limits
• Makes alerts visible through ESMPRO Manager AlertViewer, Internet mail, pop-up
messages, printer output, text files, or commands to be executed
• Enables you to configure the SMTP server for Internet mail alert messages
2-6

2.4.2. Accessing ESMPRO Alert Manager
To access ESMPRO Alert Manager
1. Navigate to the desktop of a management server.
2. On the Start menu of the management server, point to All Programs and then
ESMPRO Manager, and click ESMPRO Manager.
The ESMPRO Manager Operation window and AlertViewer window appear.
Note: You also can click AlertViewer on the Tools menu of the ESMPRO Manager
Operation window to display the AlertViewer window.
3. Click Report Settings on the Tools menu of the AlertViewer window.
The Alert Manager window appears.
2.5. ESMPRO Agent for Windows
ESMPRO Agent for Windows monitors a Windows operating environment. ESMPRO
Agent for Windows collects data and transmits it over the network to ESMPRO Manager,
using SNMP. Together, these components monitor and report operational information,
failures, and error information.
ESMPRO Agent for Windows
ESMPRO Agent for Windows runs on a partition under a Windows partition operating
system. ESMPRO Manager runs on a management server.
For more information, refer to
• 2.3 ESMPRO Manager
• ESMPRO Agent User’s Guide
• Later portions of this guide
and 2.4 ESMPRO Alert Manager
2.5.1. Uses for ESMPRO Agent for Windows
ESMPRO Agent for Windows does the following tasks:
• Monitors the status of server components and resources, such as disk usage, rate
of CPU load, memory usage, and LAN traffic
• Supports troubleshooting and recovery by recording information on component
failures and server status in a Windows environment, including system log
messages that are logged by other applications
• Monitors storage devices and can predict failures before they occur
• Reports information to ESMPRO Manager to monitor system status in real-time and
display messages in AlertViewer
2-7

ESMPRO Agent for Linux or VMware ESX Server
• Enables you to set some Server Management threshold values and monitoring
cycles for the partition
2.5.2. Accessing ESMPRO Agent for Windows
To access ESMPRO Agent for Windows
1. Navigate to the desktop of a partition on which the agent is installed.
2. On the Start menu, click Control Panel.
The Control Panel window appears.
3. Double-click the icon labeled ESMPRO Agent for Windows.
The ESMPRO Agent Properties window appears.
2.6. ESMPRO Agent for Linux or VMware ESX Server
ESMPRO Agent for Linux monitors a Linux or VMware ESX Server operating
environment. ESMPRO Agent for Linux collects data and transmits it over the network to
ESMPRO Manager, using SNMP. Together, these components monitor and report
operational information, failures, and error information.
ESMPRO Agent for Linux runs on a partition under a Linux partition operating system or
VMware ESX Server. ESMPRO Manager runs on a management server.
For more information, refer to
• 2.3 ESMPRO Manager
• ESMPRO Agent User’s Guide
• Later portions of this guide
and 2.4 ESMPRO Alert Manager
2.6.1. Uses for ESMPRO Agent for Linux
ESMPRO Agent for Linux does the following tasks:
• Monitors the status of server components and resources, such as disk usage, rate
of CPU load, memory usage, and LAN traffic
• Supports troubleshooting and recovery by recording information on component
failures and server status in a Linux or VMware ESX Server environment, including
system log messages that are logged by other applications
• Monitors storage devices and can predict failures before they occur
• Reports information to ESMPRO Manager to monitor system status in real-time and
display messages in AlertViewer
2-8

• Enables you to set some Server Management threshold values and monitoring
cycles for the partition
2.6.2. Accessing ESMPRO Agent for Linux
To access ESMPRO Agent for Linux
1. Navigate to the desktop of a partition on which the agent is installed.
2. Log on as the root user.
3. For VMware ESX Server 3, change the value of the LANG environment variable
temporarily by executing the following command:
# export LANG=en_US
4. Navigate to the directory where ESMPRO Agent for Linux is installed by executing
the following command:
# cd /opt/nec/esmpro_sa
5. Navigate to the directory where ESMPRO Agent for Linux components are stored
by executing the following command:
BIOS Interface
# cd bin
6. Start the Control Panel for monitoring functions (ESMagntconf) by executing the
following command:
# ./ESMagntconf
7. Start the Control Panel for reporting functions (ESMamsadm) by executing the
following command:
# ./ESMamsadm
2.7. BIOS Interface
The BIOS firmware initializes and configures the partition hardware to prepare it to boot
an operating system. The BIOS firmware and persistent data are stored in the firmware
hub flash memory, a hardware component on the management board.
Limited help appears in the upper right corner of each BIOS interface page. The
displayed help comment refers to the selected item on the page. The comment changes
depending on the item that is selected.
Refer to Section 5 BIOS
for more information.
2.7.1. Uses for BIOS Interface
The BIOS interface enables you to
2-9

BIOS Interface
• Change the boot order for this boot or permanently. Refer to 5.6 Viewing and
Temporarily Changing BIOS Boot Order and 5.7 Updating BIOS Boot Order
• Change operational settings for the partition, such as
- Memory usage (stacked or interleaved)
- Assignment of processor sockets
- I/O settings, descriptions, and the skip list
- Power settings
Refer to 5.8 Configuring BIOS Settings
Options
2.7.2. Accessing BIOS Interface
To access the BIOS interface
1. Navigate to the summary page of the partition remote console interface.
2. If you are accessing the remote console interface from a remote workstation, click
KVMS Redirection in the left column and start a remote session to the partition.
Refer to 9.1 Accessing the Desktop of a Partition Remotely using remote console
interface for more information.
3. Return to the summary page and power on the partition (or click a button that cycles
power to the partition).
When the boot process reaches the BIOS Starting state, a logo screen appears for
a few seconds, with an instruction at the bottom to press the spacebar to enter the
BIOS interface.
Note: A logo screen might appear twice. The instruction occurs the second time.
4. Press the spacebar while the logo screen is displayed.
and 5.9 Configuring Settings for Partition
The boot process is interrupted and the BIOS front page appears, as shown in
Figure 5-1
.
2-10

Section 3
Remote console interfaces
This section describes management firmware and its remote console interfaces.
Management firmware is a comprehensive means of configuring, controlling, and
monitoring individual components of the Express5800/A1160 system and the system as
a whole. Management firmware is an implementation of IPMI—Intelligent Platform
Management Interface Specification Second Generation v2.0.
Different remote console interfaces control each of the following components:
• Partitions
The remote console interface for a partition is described in 3.5 Partition Remote
Console Interface.
• System
The remote console interface for the system as a whole is described in 3.6 System
remote console interface.
• Cells
The remote console interface for a cell is described in 3.7 Cell remote console
interface.
Each remote console interface is a set of Web pages. Each page displays information
about some aspect of the component and contains commands to configure or use it.
Refer to 3.1 Page Layout
all Web pages.
Refer to 2.1 Remote console interfaces
instructions for logging on to each remote console interface.
3.1. Page Layout
All pages in the remote console interface have the same layout, as shown in Figure 3-1.
through 3.4 Navigation for general information that applies to
for uses of the remote console interfaces and
3-1
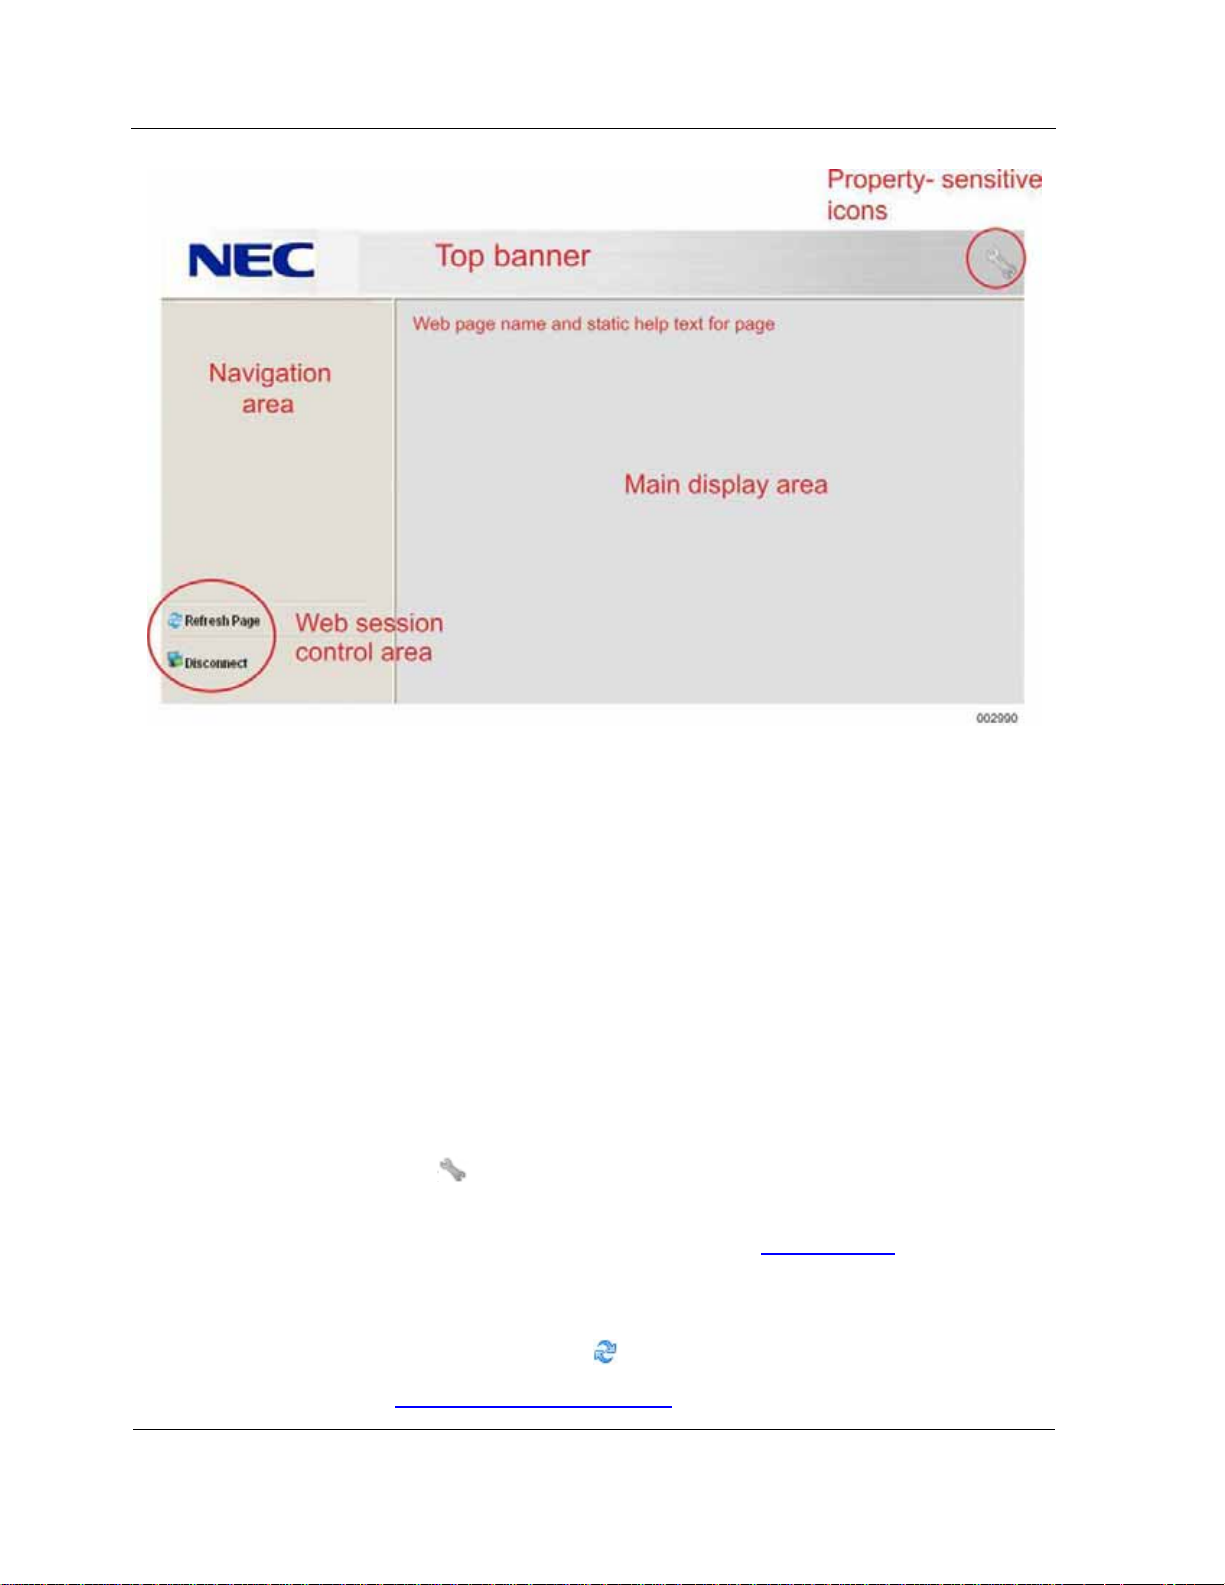
Page Layout
Figure 3-1 Management Firmware Web Page Layout
The components of each page are
• Top banner, which contains the following static information.
Note: Static information is updated only when the system name changes or you
refresh the page using the Refresh Page command in the Web session control
area.
- Logo (in upper left corner)
- System name (for access to the system Web pages)
- Partition name (on applicable pages)
- System size in number of cells (on applicable pages)
- Partition property-sensitive icons (not links) for current values, such as the
wrench icon (
• Navigation area, which contains links to each Web page in the set of partition,
system, or cell Web pages being accessed. Refer to 3.4 Navigation
navigation links on the summary page of each type of Web pages.
) that appears when maintenance mode is on
for the
• Remote console session control area, which contains the following commands:
- Refresh Page, designated by
Refer to 3.2 Refreshing Page Displays
3-2
for more information.

- Disconnect, designated by
• Main display area, which contains
- Title corresponding to the link in the navigation area that displayed the page
- Applicable help text for the page
- Content for the page
3.2. Refreshing Page Displays
Only the partition summary page is refreshed automatically every 11 seconds. To
refresh all other pages or to refresh the partition summary sooner, click Refresh Page in
the Web session control area.
3.3. Web Page Timeouts
All Web pages except the partition summary page time out after 50 minutes of no activity.
You must log on again to access pages that time out.
Refreshing Page Displays
3.4. Navigation
The left side of every Web page contains a hierarchy of options for navigating; the
headings in the hierarchy define categories for grouping the options. The categories for
partition Web pages (refer to Figure 3-2) are
• Monitoring
• Information
• Configuration
• Remote control
• Maintenance
The categories for system Web pages (refer to Figure 3-24
• Configuration
• Maintenance
The categories for cell Web pages (refer to Figure 3-27
• Monitoring
) are
) are
• Configuration
• Maintenance
3-3

Partition Remote Console Interface
Log on to a remote console interface and click an option in any category to display the
associated Web page in the main display area.
The remaining portions of this section contain information about each option for each set
of Web pages, including graphics, instructions for using the page, and references to
related information.
3.5. Partition Remote Console Interface
A partition remote console interface is a set of Web pages for monitoring and managing
a partition. Each partition has its own set of Web pages. You must log on to each
partition remote console interface separately (refer to 2.1.2 Accessing and Logging On
to remote console interfaces).
The top banner of each page of the partition interface displays the
• System name, followed by parenthetical text showing the number of cells in the
system, if the number of cells is greater than one
• Partition name
• Icons reflecting the current state of certain partition properties
The left side of each partition page provides navigation to other pages. The name of the
displayed page is highlighted in the hierarchy. The following paragraphs describe each
partition page.
3.5.1. Partition Summary Page
The partition summary page opens when you log on to the remote console interface for
a partition. Each partition consists of one or more cells, as shown in Figure 3-2.
Management firmware enables you to monitor and control a partition using a set of Web
pages.
The partition summary page is refreshed automatically every 11 seconds.
The navigation area contains the main navigation categories (refer to 3.4 Navigation
and links to each option in each category.
)
3-4

Partition Remote Console Interface
Figure 3-2 Partition Summary Page
The summary area displays information about the name, health, and state of the
partition; the name, power, health, and state of the cells in the partition, and command
buttons, as follows:
• Name
The name of the partition, which is established when the partition is created. It
appears in the top banner of all remote console interface pages for the partition,
and the EXPRESSSCOPE® Monitor user interface. Its purpose is to identify the
partition and label the set of remote console interface pages.
• Health
Overall operating status of the partition, as determined by management firmware.
Values can be
Value Description Icon
Normal The partition is functioning normally.
Non-critical A problem exists that needs attention, but
partition function probably is not affected.
3-5

Partition Remote Console Interface
Critical A problem exists that requires immediate
attention. Partition function can be affected.
Non-recoverable A problem exists that management firmware
cannot recover. Partition function is affected.
Unknown Management firmware cannot determine the
health of the partition.
• State
Operating state of the partition, as set by user actions or determined by
management firmware. Values can be
Value Description Icon
Stopped The partition is stopped.
Initializing, Starting,
Cell check-in, BIOS
starting, OS load
Running The partition is running.
Hard reset initiated,
Power down
initiated
The partition is starting.
The partition is being rebooted or powering
down
Unknown The partition state cannot be determined.
• Name (cell)
The name of each cell in the partition, which is established by management
firmware at startup and depends on the cell and cable configuration.
• Power (cell)
The power status of each cell in the partition, as set by user actions or determined
by management firmware. Values can be
Value Description Icon
On The cell is powered on.
Powering on The cell is powering on.
Off The cell is powered off.
3-6

Partition Remote Console Interface
Powering off The cell is powering off.
Unknown The cell power state cannot be determined.
• Health and state (cell)
The possible values and icons of the health and state for cells are similar to those
for partitions. In addition, the state displays a second line containing additional
operating detail for each cell, as follows:
- In use; not in use
- Performing partitioning
- Updating firmware
- Running diagnostics
- Boot cell
- Will not be used in next boot
- Cannot be a boot cell
- Degraded
- In process of validation
- Mismatched manufacturer ID
- System serial number is incorrect
- Incompatible firmware level
- Has not been validated by system manager
- Memory mirroring enabled
- Memory mirroring: MEM0 broken; Memory mirroring: MEM1 broken
- Memory mirroring configuration error
• Command buttons for the following actions (refer to 3.5.2 Command Buttons
command names and details):
- Powering up or down, including cycling power and doing a hard reset or force
dump
- Shutting down or rebooting the operating system
- Accessing the partition keyboard, video, mouse, and storage (KVMS) remotely
- Adding components to a running partition (hot-add components)
A tool tip describing the command is displayed when you point the cursor at a
button without clicking the mouse.
for
3-7

Partition Remote Console Interface
3.5.2. Command Buttons
The following command buttons appear on the partition summary page:
• Power Up/Down
If power status is off, this command powers up the cell and partition and boots the
operating system. If power status is on, this command shuts down the operating
system ungracefully and shuts down the partition by removing power from all cells
in the partition.
Note: Applying DC power to a cell applies power to all cells in a partition that are
not already powered on. Likewise, removing power from a cell shuts down the
partition and its operating system.
• Soft-Shutdown
Sends a request to the operating system to shut down and powers off the partition.
The operating system shuts down gracefully, if possible, but might force a hard
shutdown, if necessary. The partition is powered off unless the Do not power off
cells on the next power down command check box is selected on the power
settings page (refer to 3.5.9 Power Settings
).
Caution
Only a soft shutdown can result in a graceful shutdown of the operating
system, during which files can be closed and data saved. All other actions
cause an ungraceful shutdown of the operating system, and data can be lost.
• Power Cycle
Shuts down the operating system ungracefully, shuts down power for the specified
interval, and then turns power on and reboots the operating system.
• Hard Reset
Shuts down the operating system ungracefully and reboots the operating system;
power remains on.
• Force Dump
Takes a memory dump, sends a nonmaskable interrupt (NMI), and shuts down the
operating system ungracefully.
• Remote KVMS (keyboard, video, mouse, storage)
Links to the KVMS redirection Web page to select operating system and mouse
mode settings for the host operating system Console Manager selections. Refer to
3.5.19 KVMS Redirection
for more information.
3-8

Partition Remote Console Interface
• Hot Add Components
When enabled, adds newly available cell resources to a running partition (refer to
3.5.20 Fault Information
The power restore policy, the power cycle interval, and the Do not power off cells on
the next power down command check box can affect many power commands. You
can change these settings on the partition settings page (refer to 3.5.9 Power Settings
Refer to Section 6 Applying and Removing Power and Booting Partitions
on powering up and powering down using the different interfaces.
). Typically, this command is disabled.
).
, for information
Refer to 3.5.3 Submitting and Monitoring Progress of Commands
about how commands work.
for more information
3.5.3. Submitting and Monitoring Progress of Commands
To submit a command and monitor its progress
1. Navigate to the remote console interface for the partition.
2. Click the button for the desired command.
A dialog box explaining the action might appear for some commands.
If the partition is in an improper state for the command that is submitted, an error
dialog box appears. Click OK to close the dialog box, correct the error, and submit
the command again.
3. If a dialog box appears, click OK to continue.
Note: Click Cancel if you do not want to perform the action.
A separate window that contains the possible partition states opens to indicate
progress, as shown in Figure 3-3
command executes. The window is updated every second.
. The current partition state is highlighted as the
3-9

Partition Remote Console Interface
Figure 3-3 Partition States Window
4. Wait for the command to finish.
When the command reaches the final state, the progress indicator window stays
open for one second and then closes.
The partition state on the progress indicator window can be different from the state on
the summary page because the two values are refreshed at different rates.
If you navigate to another page while a command is executing, the progress indicator
window is no longer updated. However, the window stays open, and you must close it
manually.
3.5.4. Sensor Readings
A sensor is an entity that monitors hardware and has a value or status. Sensors can
issue system events under certain conditions. Figure 3-4 shows the partition sensor
readings page.
3-10

Partition Remote Console Interface
Figure 3-4 Sensor Readings Page
A sensor reading is the value or status associated with the sensor. Sensors are either
• Analog or threshold sensors, which have values, such as a voltage or temperature
reading.
• Discrete sensors, which have status. Each discrete sensor asserts or deasserts up
to 15 events, including standard IPMI-defined events and events specific to
Express5800/A1160 systems. The reading value for a discrete sensor is a numeric
code that represents the status and provides no additional meaning.
Sensors are the core control mechanism for management firmware. Use the sensor
readings, along with the event log, to diagnose problems and answer questions, such as
• Why is the health status for the partition not normal?
• Why does the partition not boot successfully?
• What event triggered an alert notification?
• What errors occurred during diagnostics tests?
Refer to 3.5.5 Event Log
information.
and 10.9 Examine Management Firmware Sensors for more
3.5.5. Event Log
An event is a condition that is detected (for example, by a sensor) and reported to a
3-11

Partition Remote Console Interface
monitoring entity. The condition can be a system error, a change in an environmental
condition, a system resource that is outside currently accepted limits, or some other
system status that is no longer within specification.
Some events result in alerts. An alert is a notification that an event occurred that
requires attention. Refer to 3.5.14 Alert Management
A fault is a failure of a hardware component, a software component, or some
combination of components. A fault typically results in both an event and an alert.
Management firmware enters data for atypical health status, faults, and state transitional
events to an event log for each partition. The partition event log contains entries for a
partition and its member cells. Figure 3-5
for more information.
shows the partition event log page.
Figure 3-5 Event Log Page
Both management firmware and the host operating system access the partition event
log to capture event data and clear entries.
Use the event log, along with the sensor readings, to diagnose problems and answer
questions, such as
• Why is the health status for the partition not normal?
• Why does the partition not boot successfully?
• What event triggered an alert notification?
• What errors occurred during diagnostics tests?
Refer to 3.5.4 Sensor Readings
and 10.7 Examine the Management Firmware Event
3-12

Log for more information.
3.5.6. Hardware Locator
The hardware locator enables you to locate physical cells for maintenance or
troubleshooting activities by causing both the EXPRESSSCOPE® Monitor LCD on the
front of a cell and the LED on the back to flash. If you are logged on to the remote
console interface for a partition, the EXPRESSSCOPE® Monitor LCD and LED flash on
all cells in the partition.
Partition Remote Console Interface
Figure 3-6
shows the partition hardware locator page.
Figure 3-6 Partition Hardware Locator Page
To turn on the hardware locator for all cells in the partition
1. Select one of the following values from the list:
• Off
Turns off the EXPRESSSCOPE® Monitor LCD and LED lights
• On for 4 minutes
Causes the EXPRESSSCOPE® Monitor LCD and LED lights to flash for four
minutes
• On
Causes the EXPRESSSCOPE® Monitor LCD and LED lights to flash
3-13

Partition Remote Console Interface
2. Click Submit
The EXPRESSSCOPE® Monitor LCDs on the fronts of cells and the LEDs on the
backs either flash or turn off.
This function is similar to the hardware locator in the cell remote console interface and
the chassis identification (ID) button for the cell on the EXPRESSSCOPE® Monitor
interface (refer to 4.1.2 Operational Buttons
• The hardware locator in the partition remote console interface identifies all cells in
the partition.
• The hardware locator in the cell remote console interface and the
EXPRESSSCOPE® Monitor ID button identify only that cell.
3.5.7. FRU Inventory
Management firmware can display the following information about field-replaceable
units (FRU):
• Chassis information: type, part number, and serial number
). The differences are
• Board information: manufacturer, product name, serial number, and part number
• Product information: manufacturer, product name, serial number, version, part
number, and asset tag
Figure 3-7
shows the partition field replaceable units (FRU) inventory page.
3-14

Partition Remote Console Interface
Figure 3-7 Field-Replaceable Units (FRU) Inventory Page
You can view information about each FRU in the partition or cell of the partition, as
follows:
1. Select Partition or the cell identifier in the Location list. The location determines
which devices appear in the FRU name list.
2. Select the desired device in the FRU Name list. The devices in the list depend on
the selected location.
Information about the selected FRU is displayed if available from the device.
3.5.8. Partition Settings
Each partition has unique settings, as shown in Figure 3-8, Figure 3-12, and Error!
Reference source not found.
following groups of variables for each partition:
• Power settings (refer to 3.5.9 Power Settings
• Boot cell selection (refer to 3.5.10 Boot Cell Selection Settings)
. The settings page enables you to set values for the
)
• General settings (refer to 3.5.11 General Settings)
• Fault settings (refer to 3.5.12 Fault Settings
• Customer data settings (refer to 3.5.13 Customer Data Settings
)
)
3-15

Partition Remote Console Interface
3.5.9. Power Settings
The power settings are shown in Figure 3-9. They control how power is applied to the
partition and, consequently, how the partition starts, as follows:
• Power cycle interval
This value is the number of seconds that the partition remains off during a power
cycle command.
• Do not power off the cells in this partition on the next power down
When you power down a partition, DC power is removed from the cells. If you do
not want to remove DC power, select the check box, and DC power is not removed
from cells the next time this partition is powered down. This one-time setting is
cleared afterwards.
• Power restore policy
The power restore policy determines how DC power is applied to the cells after AC
power is turned on for the partition. It affects how partitions start. Select one of the
following rules:
Figure 3-8 Partition Settings Page
- DC stays off when AC is applied to the cells in this partition (default)
DC power stays off when AC power is applied to cells in the partition (default).
The partition does not start automatically. You need to start the partition
3-16

Partition Remote Console Interface
manually using the Power Up/Down button.
- DC turned on when AC is applied to the cells in this partition
DC power is turned on when AC power is applied to cells in the partition. The
partition starts automatically when the system receives power.
- Restore DC to its state prior to AC loss
DC power is restored to its previous state before AC power was removed from
the cells in the partition. The partition starts automatically when the system
receives power or not, depending on its previous state.
• Delay in restoring DC power when AC is applied
This value is the number of seconds of delay in restoring DC power when AC power
is applied.
Refer to 6.4 Booting Partitions Automatically
and the delay in restoring DC power enable booting partitions automatically.
Refer to 3.5.2 Command Buttons
partitions.
for the commands that apply and remove power to
for details on how the power restore policy
Figure 3-9 Power Setting Page
3-17

Partition Remote Console Interface
3.5.10. Boot Cell Selection Settings
The boot cell selection settings are shown in Figure 3-10. This section appears on the
partition settings page only if the partition has more than one cell.
Every partition must have a primary boot cell. By default, the first cell assigned to the
partition membership is the primary boot cell. If a partition has only one cell, that cell is
the primary boot cell.
Partitions with two or more cells optionally can have a secondary boot cell, which is used
automatically if the primary boot cell is disabled. If a secondary boot cell is not
designated and the primary boot cell becomes disabled, you must select a different
primary boot cell.
Note: Selecting a different primary boot cell does not change the MLAN address for
accessing the partition.
The boot cell must be able to access the storage device on which the partition operating
system is installed.
Refer to 8.8.1 Setting Primary and Secondary Boot Cells
Cell During Partitioning for procedures to select the boot cells.
and 8.8.2 Setting Primary Boot
Figure 3-10 Boot Cell Selection Setting
3-18

3.5.11. General Settings
General settings for a partition are shown in Figure 3-11.
Partition Remote Console Interface
Figure 3-11 General Settings Page
General settings include the following:
• Name
The partition name appears in the top banner of partition pages and other places
where it is needed to identify a partition. The current value appears in the box. You
can leave it or edit it. The name can be up to 16 characters, consisting of letters,
numbers, and spaces. Changing the name does not affect anything other than the
remote console interface pages.
• Partition GUID
The globally unique identifier (GUID) defines a partition in management firmware.
The GUID for each partition is fixed and cannot be changed.
• System GUID
This GUID identifies the partition during Preboot Execution Environment (PXE)
boots. The current value appears in the box. Normally you should not change this
value. In rare recovery situations, you might need to edit it if a customer
representative instructs you to do so. The GUID can be up to 32 hexadecimal
characters, consisting of A through F and 0 through 9.
3-19

Partition Remote Console Interface
• Hot available sockets
This value is the number of processor sockets that are currently available in the
partition.
• Enable wrapping of Event Log
Select the check box if you want the event log to overwrite the earliest entries when
the file reaches its maximum size. If you do not select the check box, the system
cannot log any more events when the log is full.
3.5.12. Fault Settings
Fault settings enable you to define certain management firmware behavior when
problems occur. Figure 3-12 shows the partition fault settings page.
Figure 3-12 Fault Settings Page
The following fault groups and behavior settings are available:
• Start Degraded Partition
A degraded partition is missing some resources, such as a cell that has not been
discovered or is not usable. Select one of the following options:
- Permit a degraded partition to start
This setting means that the partition might not have all the possible resources
3-20

Partition Remote Console Interface
that were allocated to it. For example: if a cell is not included during a boot, the
partition does not have as many processors or as much memory and I/O
capacity as expected. When the resources become available, they are
automatically available in the partition and the state is no longer degraded.
- Do not permit a degraded partition to start
This setting means that the partition is not started unless all its resources are
available. The following icon appears in the upper-right corner when this option
is selected:
• Failing Unit Removal
Select one of the following options to determine management firmware behavior
when units fail:
- Do not disable failing units; reinitialize partition instead
Management firmware should try to reinitialize the units to bring them up in the
partition.
- Disable failing units
Management firmware should disable the units rather than reinitialize them.
• Maintenance Mode
You can enable maintenance mode to suspend the sending of Call Home
messages. You must enable and disable maintenance mode manually because an
automatic timer is not associated with it. Select one of the following options:
- Enabled
Call Home messages are not sent while maintenance mode is enabled. This
setting should be temporary. The following icon appears in the upper-right
corner when maintenance mode is enabled:
- Disabled
The system resumes sending Call Home messages if necessary. This is the
normal operating setting. The wrench icon is removed from the upper-right
corner.
• Primary Central Service Computer IP address
This is the primary IP address for the partition to send Call Home fault packets. The
current value appears in the box. You can leave it or edit it. If you change the
primary IP address in management firmware, it also is changed in Infrastructure
Solutions Console.
• Secondary Central Service Computer IP address
This is the secondary IP address for the partition to send Call Home fault packets.
The current value appears in the box. You can leave it or edit it. If you change the
secondary IP address in management firmware, it also is changed in Infrastructure
3-21

Partition Remote Console Interface
Solutions Console.
3.5.13. Customer Data Settings
Customer data is not supported.
3.5.14. Alert Management
An alert is a notification that an event occurred that requires attention. An event (refer to
3.5.5 Event Log) is a condition that is detected (for example, by a sensor) and reported
to a monitoring entity. The condition can be a system error, a change in an
environmental condition, a system resource that is outside currently accepted limits, or
some other system status that is no longer within specification.
Figure 3-13
shows the partition alert management page.
Figure 3-13 Alert Management Page
Management firmware generates alerts when certain events occur in a partition. Alerts
can be
• E-mail messages
If you configure e-mail alerts, you must configure the Simple Mail Transfer Protocol
(SMTP) server.
• SNMP traps
3-22

Partition Remote Console Interface
If you configure SNMP trap alerts, ensure that you have a trap watcher application
running as a background process to capture and analyze SNMP alerts. Refer to the
trap watcher documentation for information about using the application and its
analysis methodology.
You can configure up to 13 different destinations for alerts. Each destination has a
• Minimum alert severity level: none, informational, warning, critical, or
non-recoverable. The severity of the event must be at least the level specified
before an alert is sent. The “none” level means that no alerts are sent to that
destination; this level is useful for temporarily disabling a destination.
• Destination address to which alerts are sent. If the destination address is zeroes,
this entry is available to be configured.
Refer to 7.2 Configuring Alerts and the SMTP Server using remote console interface
9.4.2 Viewing Alerts Issued by Management Firmware
alerts and how they look when received.
Refer to Section 10 Troubleshooting Hardware Problems
alerts in troubleshooting.
3.5.15. Network Address
The partition network address, or IP address, is its MLAN address. You use the MLAN
address to log on to the partition remote console interface. Unless you change it, the
MLAN address of the partition is the IP address of its initial boot cell (refer to 3.7.3
Network Address).
Figure 3-14
shows the partition network address page.
and
for information about configuring
for information about using
3-23

Partition Remote Console Interface
Figure 3-14 Partition Network Address Page
MLAN addresses for all partitions and cells must be on the same LAN segment.
Network addresses also appear as IP addresses on the EXPRESSSCOPE® Monitor
interface on the partition network submenu or on the cell network submenu (refer to 4.5
Network).
Refer to 12.5 Setting Partition MLAN Address using Management Firmware
procedure to change MLAN addresses
3.5.16. SSL Certificate
A Secure Sockets Layer (SSL) certificate exists for the remote console interface for
each partition and each cell. SSL certificates contain the IP address of the Web server
for the secure pages, which is the MLAN address of each partition and each cell. Each
MLAN address requires unique certificates.
SSL certificates eliminate warning dialog boxes that browsers display automatically
when using the secure https secure interface. The generated warnings depend on the
browser used. Management firmware provides SSL certificates that grant full access to
all remote console interface functionality and eliminate some, but not all, browser startup
warning dialog boxes. The security administrator for your site is responsible for
maintaining SSL certificates.
for the
Figure 3-15
shows the partition SSL certificate page.
3-24

Partition Remote Console Interface
Figure 3-15 Partition SSL Certificate Page
3.5.17. Time and Date
All cells in the partition must have the same time and date, which you set manually or by
using the browser settings. You need to set the time and date to account for daylight
saving time (DST) in your time zone. The Service Processor does not adjust the time for
DST.
Figure 3-16
shows the partition time and date page.
3-25

Partition Remote Console Interface
Figure 3-16 Time and Date Page
Refer to 12.1 Setting Partition Time and Date using remote console interface using
remote console interface for the procedure to set the partition time and date.
3.5.18. User Management
Each user must have a set of valid user credentials for accessing the partition, cell, and
system remote console interfaces. User credentials are required for logging on to the
partition and its member cell remote console interfaces. The credentials remain valid
until changed or deleted, including when management firmware is updated.
You can define up to 10 users for the partition.
Figure 3-17
shows the partition user management page.
3-26

Partition Remote Console Interface
Figure 3-17 User Management Page
Refer to 12.4 Configuring User Credentials using remote console interface for
procedures to configure user credentials.
3.5.19. KVMS Redirection
You can access the partition operating system or BIOS and control its keyboard, video,
mouse, and storage (KVMS) from your workstation.
Note: Storage in this context includes physical CD-ROM or CD-ROM image, physical
DVD or DVD image, physical disk or disk image, or physical USB storage device or USB
storage device image.
Figure 3-18
shows the partition KVMS redirection page.
3-27

Partition Remote Console Interface
Figure 3-18 KVMS Redirection Page
KVMS redirection starts a remote session using the Partition Desktop or JViewer
interface of Console Manager. Depending on your workstation operating system,
browser, and the version of Java installed, you can use these interfaces to view and
control partition operations. Partition Desktop can operate with Express5800/A1160
partitions as well as with other systems that include Console Manager. JViewer can
operate only with Express5800/A1160 partitions.
Console Manager is preinstalled on your system Service Processor. You configure and
access Console Manager through the remote console interface. Refer to 9.1 Accessing
the Desktop of a Partition Remotely using remote console interface for the procedure to
configure Console Manager and start a remote session from your workstation.
3.5.20. Fault Information
Fault information is available for cell components in the partition, including whether they
are enabled or disabled. Components can become disabled automatically when faults
occur, or you can disable components manually to temporarily remove them from the
partition. Disabled components are not used the next time a partition boot or restart
occurs.
Figure 3-19
shows the partition clear fault data page.
3-28

Partition Remote Console Interface
Figure 3-19 Clear Fault Data — Enable/Disable Components Page
Refer to 3.5.21 Enabling and Disabling Components if you need to disable or enable
components manually.
Refer to 11.16 Clearing Faults using remote console interface
faults after you replace faulty hardware components.
3.5.21. Enabling and Disabling Components
Partition components can become disabled automatically when faults occur. You also
can disable them manually to temporarily remove them from the partition. Disabled
components are not used the next time the partition is powered up or restarted.
To disable components manually
1. Navigate to the fault information page of the remote console interface for a partition
(refer to Figure 3-19
The lower portion of the page lists components by cell and shows them as being
either enabled or disabled.
).
for a procedure to clear
2. Scroll to each desired component and select Disabled.
3. Click Submit.
4. Power up the partition (or restart it if it is running) to boot it without the disabled
components.
3-29

Partition Remote Console Interface
To enable components manually
1. Navigate to the fault information page of the remote console interface for a partition.
The lower portion of the page lists components by cell and shows them as being
either enabled or disabled.
2. Scroll to each desired component and select Enabled.
3. Click Submit.
4. If the partition is running and the operating system supports the hot-add capability
for a running partition, navigate to the partition summary page and click Hot-Add
Components to use the components in the partition (refer to 3.5.2 Command
Buttons).
5. If the partition is not running or the operating system does not support the hot-add
capability, power up or restart the partition to use the enabled components.
3.5.22. Diagnostic Tests
Diagnostic tests are available from the remote console interface for a partition or a cell.
For a partition, diagnostic tests run first against each cell in a partition, followed by
interface tests between each pair of cells in the partition. Cells that are in use are
skipped. Execution time is 1 to 3 minutes for tests on each cell and 3 to 6 minutes for
interface tests between cells.
Figure 3-20
shows the partition diagnostic tests page.
3-30

Partition Remote Console Interface
Figure 3-20 Partition Diagnostic Tests Page
If you have an indication that some component is failing, you can run diagnostic tests for
a partition or a cell, as follows:
1. Click Run Diagnostics to start the tests.
The tests begin and the label on the button changes to Update Status, as shown in
Figure 3-21
.
3-31

Partition Remote Console Interface
Figure 3-21 Partition Diagnostic Tests Status Page
2. Click Update Status to check progress while tests are executing. The current status
is updated with the current test ID, the number of tests completed of the total to run,
and the number of errors encountered. When tests complete, the label on the
button changes to Run Diagnostics, and the results are displayed.
Use the event log (refer to 3.5.5 Event Log
Sensor Readings) Web pages for additional diagnostic information about errors that
occurred during the tests.
) and the sensor readings (refer to 3.5.4
3.5.23. Management Firmware Updates
You can display the current management firmware revision levels and update
management firmware for all cells in a partition that are powered on. All cells in a
partition should have the same firmware level. If you add a cell with a different firmware
level to a partition, the firmware is updated on the cell.
Note: The MLAN address remains the same when management firmware is updated.
Figure 3-22
shows the partition management firmware updates page.
3-32

Partition Remote Console Interface
Figure 3-22 Management Firmware Updates Page
Refer to the Service Processor Troubleshooting Guide for procedures to display and
update firmware.
3.5.24. Service Processor Functions
You can reset (reboot) the Service Processors in a partition or take a dump of Service
Processor data to send to the support center for analysis. Figure 3-23 shows the
partition Service Processors page. If you access the Service Processors page from a
partition remote console interface, the actions affect all member cells that have AC
power.
3-33

System remote console interface
Figure 3-23 Partition Service Processors Page
To reset the Service Processor
1. Click Reset on the Service Processors page.
The Service Processors are rebooted and the connection to the remote console
interface is lost.
2. Refresh the page and log on.
The connection to the partition remote console interface is restored.
To take a dump of Service Processor data
1. Click Dump.
A dump file is created that includes all saved hardware state data for the partition.
Data is collected in a single file in compressed format.
2. Click Save.
The dump file is downloaded from management firmware to your workstation; from there
you can send it to the support center for analysis. The file continues to exist in
management firmware until another dump is performed, when the older file is
overwritten.
3.6. System remote console interface
The system remote console interface applies to all cells and partitions in the system (but
3-34

you probably will not use this interface frequently). The system pages offer no
monitoring capability and are used only for specific infrequent tasks, such as partitioning
(refer to 3.6.2 Partitioning
Cell Access).
You can access the system remote console interface by clicking the system name in the
top banner of a partition or cell page rather than entering a MLAN address. Additional
authentication is required if access is from a partition Web page but is not required if
access is from a cell Web page. Refer to 2.1.2 Accessing and Logging On to remote
console interfaces for more information.
The left side of the system page provides navigation to other pages. The name of the
displayed page is highlighted in the hierarchy. The following paragraphs describe each
system page.
) or accessing cell remote console interfaces (refer to 3.6.3
3.6.1. System Settings Page
Figure 3-24 shows the system settings page.
System remote console interface
Figure 3-24 System Settings Page
The navigation area contains the main navigation categories (refer to 3.4 Navigation)
and links to each option in each category.
The summary area displays
• System serial number
Identifies the system. This value is set at the factory. If it needs to be updated,
contact a service representative.
• System style
Identifies the style number of the system. This value is set at the factory. If it needs
3-35

System remote console interface
to be updated, contact a service representative.
• System name
- Identifies the system in remote console interfaces, such as the top banner of
each page.
- Identifies the system on the cell EXPRESSSCOPE® Monitor LCD.
- Identifies the system in Call Home packets that are sent to the support center.
- This value is set at the factory. The default value is
SystemNameserial_number.
- You can edit the system name on this page, if desired, keeping in mind any
historical logs or records that contain the previous name. The system name
can be up to 32 characters consisting of letters, numbers, and spaces.
3.6.2. Partitioning
Each cell is a member of exactly one partition at any time. No cell components can be
shared between partitions. Systems with only one cell have only one partition.
Figure 3-25 Partitioning Page
shows the partition Service Processor partitioning page.
Figure 3-25 Partitioning Page
You can modify, create, or delete partitions in systems with two or more cells. The host
3-36

Cell remote console interface
operating system cannot be running when you submit partitioning actions.
Refer to Section 8 Performing Partitioning Actions
tasks.
3.6.3. Cell Access
Figure 3-26 shows the partition Service Processor cell access page.
for procedures to perform partitioning
Figure 3-26 Cell Access Page
You can access the remote console interface for an individual cell by clicking the
appropriate cell name on the cell access page and logging on, as usual. This method is
useful for doing maintenance and relieves you of the necessity of remembering MLAN
addresses for cells. Refer to 2.1.2 Accessing and Logging On to remote console
interfaces for more information.
3.7. Cell remote console interface
A cell remote console interface is a set of Web pages for monitoring and managing a cell.
Each cell has its own set of Web pages. You must log on to each cell remote console
interface separately (refer to 2.1.2 Accessing and Logging On to remote console
interfaces).
The top banner of all cell pages displays the
• System name, followed by parenthetical text showing the number of cells in the
system, if the number of cells is greater than one
3-37

Cell remote console interface
• Cell name
The left side of each cell page provides navigation to other pages. The name of the
displayed page is highlighted in the hierarchy. The following paragraphs describe each
cell page.
3.7.1. Cell Summary Page
You can access a cell remote console interface from the system remote console
interface or by entering the cell MLAN address in the browser. Figure 3-27 shows the
cell summary page, which opens when you log on. None of the pages in a cell remote
console interface are refreshed automatically.
Figure 3-27 Cell Summary Page
The navigation area contains the main navigation categories (refer to 3.4 Navigation)
and links to each option in each category.
The summary area displays
• Cell name
• Partition name of which this cell is a member
• Power status
• Health
• State
These attributes are similar in cells and partitions, and values are represented by the
3-38

same icons. Refer to 3.5.1 Partition Summary Page for more information.
3.7.2. Hardware Locator
The hardware locator enables you to locate physical cells for maintenance or
troubleshooting activities by causing both the EXPRESSSCOPE® Monitor LCD on the
front of a cell and the LED on the back to flash. If you are logged on to the remote
console interface for a cell, the EXPRESSSCOPE® Monitor LCD and LED flash on only
that cell.
Cell remote console interface
Figure 3-28
To turn on the hardware locator for the cell
shows the cell hardware locator page.
Figure 3-28 Cell Hardware Locator Page
1. Select one of the following values from the list:
• Off
Turns off the EXPRESSSCOPE® Monitor LCD and LED lights
• On for 4 minutes
Causes the EXPRESSSCOPE® Monitor LCD and LED lights to flash for four
minutes
• On
Causes the EXPRESSSCOPE® Monitor LCD and LED lights to flash
2. Click Submit
The EXPRESSSCOPE® Monitor LCD on the front of the cell and the LEDs on the
3-39

Cell remote console interface
back either flash or turn off.
This function is similar to the hardware locator in the partition remote console interface
and the chassis identification (ID) button for the cell on the EXPRESSSCOPE® Monitor
interface (refer to 4.1.2 Operational Buttons
• The hardware locator in the partition remote console interface identifies all cells in
the partition.
• The hardware locator in the cell remote console interface and the
EXPRESSSCOPE® Monitor ID button identify only that cell.
3.7.3. Network Address
The cell network address, or IP address, is the IP address of its Service Processor.
Figure 3-29
shows the cell network address page.
). The differences are
Figure 3-29 Cell Network Address Page
MLAN addresses for all partitions and cells must be on the same LAN segment (refer to
3.5.15 Network Address).
Network addresses also appear as IP addresses on the EXPRESSSCOPE® Monitor UI
on the partition network submenu or on the cell network submenu (refer to 4.5 Network
Refer to 12.5 Setting Partition MLAN Address using Management Firmware
procedure to change IP addresses.
3.7.4. SSL Certificates
A Secure Sockets Layer (SSL) certificate exists for the remote console interface for
3-40
).
for the

Cell remote console interface
each partition and each cell. SSL certificates contain the IP address of the Web server
for the secure pages, which is the MLAN address of each partition and each cell. Each
MLAN address requires unique certificates.
SSL certificates eliminate warning dialog boxes that browsers display automatically
when using the secure https secure interface. The generated warnings depend on the
browser used. Management firmware provides SSL certificates that grant full access to
all remote console interface functionality and eliminate some, but not all, browser startup
warning dialog boxes. The security administrator for your site is responsible for
maintaining SSL certificates.
Figure 3-30
shows the cell SSL certificate page.
Figure 3-30 Cell SSL Certificate Page
3.7.5. Diagnostic Tests
Diagnostic tests are available from the remote console interface for a partition or a cell.
For a cell, diagnostic tests run against only that cell but cannot be run if the cell is in use.
Execution time is 1 to 3 minutes for tests on a cell. Figure 3-31
tests page.
shows the cell diagnostic
3-41

Cell remote console interface
Figure 3-31 Cell Diagnostic Tests Page
If you have an indication that some component is failing, you can run diagnostic tests for
a cell, as follows:
1. Click Run Diagnostics to start the tests.
The tests begin and the label on the button changes to Update Status, as shown in
Figure 3-32
.
Figure 3-32 Cell Diagnostic Tests Status Page
2. Click Update Status to check progress while tests are executing. The current
status is updated with the current test ID, the number of tests completed of the total
to run, and the number of errors encountered. When tests complete, the label on
3-42

Cell remote console interface
the button changes to Run Diagnostics, and the results are displayed.
Use the event log (refer to 3.5.5 Event Log
Sensor Readings) Web pages for additional diagnostic information about errors that
occurred during the tests.
3.7.6. Service Processor Functions
You can reset (reboot) the Service Processor in a cell or take a dump of Service
Processor data to send to the support center for analysis. Figure 3-33
Service Processor page. If you access the Service Processors page from a cell remote
console interface, the actions affect only that cell.
) and the sensor readings (refer to 3.5.4
shows the cell
Figure 3-33 Cell Service Processor Page
To reset the Service Processor
1. Click Reset on the cell Service Processor page.
The Service Processor is rebooted and the connection to the remote console
interface is lost.
2. Refresh the page and log on.
The connection to the cell remote console interface is restored.
To take a dump of Service Processor data
1. Click Dump.
A dump file is created that includes all saved hardware state data for the cell. Data
is collected in a single file in compressed format.
2. Click Save.
3-43

Cell remote console interface
The dump file is downloaded from management firmware to your workstation; from
there you can send it to the support center for analysis. The file continues to exist in
management firmware until another dump is performed, when the older file is
overwritten.
3-44

Section 4
EXPRESSSCOPE® Monitor Interface
This section describes the EXPRESSSCOPE® Monitor interface. EXPRESSSCOPE®
Monitor functionality is a subset of management firmware functionality, offering menus
with limited options to configure, control, and monitor the Express5800/A1160 system
components. Different menus apply to partitions, cells, and the system as a whole.
Refer to 2.2 EXPRESSSCOPE® Monitor Interface
accessing the EXPRESSSCOPE® Monitor interface.
4.1. Components
To operate the EXPRESSSCOPE® Monitor interface components, you may need to
detach the bezel from the front of the Cell (refer to 11.5 Front Bezel).
Figure 4-1
the front of each cell, as follows:
• An LCD that displays information about the system, partition, and cell; and
• Operational buttons for navigating in the menu system, for applying and removing
• Two LEDs that indicate the cell operating status and communication faults with
shows the EXPRESSSCOPE® Monitor interface components that appear on
information that is accessed using a menu system (refer to 4.1.1 Main Screen
Display and 4.1.5 EXPRESSSCOPE® Monitor LCD Back Light)
DC power to the cell, and for identifying the cell chassis (refer to 4.1.2 Operational
Buttons)
management firmware on the Service Processor (refer to 4.1.4 EXPRESSSCOPE®
Monitor LEDs)
for uses of and instructions on
Notes:
• Applying DC power to a cell applies power to all cells in the partition containing the
cell that are not already powered on and might boot the partition, depending on
settings.
• Using the EXPRESSSCOPE® Monitor power button is usually for maintenance
purposes only; the remote console interface is the preferred method for applying
and removing DC power.

Components
Figure 4-1 EXPRESSSCOPE® Monitor Interface
4.1.1. Main Screen Display
The EXPRESSSCOPE® Monitor LCD displays the main screen, which contains up to
four lines, each containing up to 20 ASCII characters. Each line in the main screen
displays specific content, as shown in Figure 4-2
the content is
• Line 1: System name
The system name also appears in the remote console interfaces. Refer to 3.6.1
System Settings Page.
• Line 2: Partition name
The partition name also appears in the remote console interface for the partition.
Refer to 3.5.1 Partition Summary Page
• Line 3: Cell operating state on the left; power-on self test (POST) code from BIOS (if
valid) on the right
. From the top left to the bottom right,
.
Refer to 3.5.1 Partition Summary Page
(POST) for more information about cell states and POST codes.
• Line 4, left side: Fault indicator; that is, whether any FRU faults exist. An example is
and 6.5 System Power-On Self Tests
4-2

Components
Faults: 2 FRUs.
• Line 4, right side: Five 1–character indicators that, if displayed, have the following
meanings:
- T: TPM Physically Present indicator is set; that is, an administrator (or operator
working with an administrator) who is physically present used the
EXPRESSSCOPE® Monitor to set the indicator. Refer to Section 13 Using a
Trusted Platform Module for information about using this indicator.
- M: Maintenance mode is enabled. When maintenance mode is enabled, Call
Home messages are not sent. This setting should be temporary. Maintenance
mode is disabled for normal operations so that Call Home messages are sent
when necessary. Refer to 4.2.5 Menu Contents
more information.
- N: No Degraded Boot is enabled. A degraded partition is missing some
resources, such as a cell that has not been discovered or is not usable. You
must use the remote console interface to set this option; refer to 3.5.12 Fault
Settings for more information.
and 3.5.12 Fault Settings for
- B: This is the boot cell for the partition.
You must use the remote console interface to set this option; refer to 8.8.1
Setting Primary and Secondary Boot Cells and 8.8.2 Setting Primary Boot Cell
During Partitioning for procedures to select the boot cells.
- 0 to 3: The cell number in the system is indicated by a digit from 0 to 3. This
setting is fixed at the factory.
Figure 4-2 EXPRESSSCOPE® Monitor LCD Main Screen Layout
If a value on the LCD is blank, the indicator is off, cleared, or disabled or components
are operating normally. For example
• If the fault indicator on line 4 is blank, no faults exist and FRUs are operating
normally.
4-3

Components
• If the rightmost five digits of line 4 contain only “B0,” this indicates a boot cell with
the cell number 0. The other indicators are off, cleared, or disabled; that is, TPM
Physically Present is cleared, maintenance mode is off, and a degraded boot is
allowed.
Figure 4-3
Physically Present is cleared, maintenance mode is on, and a degraded boot is not
allowed.
shows a stopped partition in cell 0 that is also a boot cell. No faults exist, TPM
Figure 4-3 EXPRESSSCOPE® Monitor LCD Main Screen Example
4.1.2. Operational Buttons
The operational buttons on the EXPRESSSCOPE® Monitor interface are used as
follows:
• Navigation buttons (arrows, OK)
1. Press the OK button to enter the menu system, which is displayed on the LCD.
2. Press the arrow buttons to navigate to the desired menu option.
3. Press the OK button to display the information or a submenu for the menu
option.
Refer to 4.2.4 Navigating Menus
• Chassis identification (ID)
Press the ID button to cause the LCD and an indicator LED in the rear of the cell to
blink to enable you to identify the cell. Refer to 3.7.2 Hardware Locator
information.
• Power
Press the power button to apply DC power to the cell if it is off or to remove DC
power if it is on. Refer to 4.1.3 Power Button
for more information.
4.1.3. Power Button
If power is off, press the power button to apply DC power to the cell and to all cells in the
partition containing the cell that are not already powered on. Powering up cells might
4-4
for more
for more information.

boot the partition, depending on settings.
When power is on and you press the power button for less than 5 seconds, a soft
shutdown occurs. If you press the power button for 5 seconds or more, the partition is
powered down the same as submitting the power down command. Refer to 3.5.2
Command Buttons) for descriptions of the soft shutdown and power down commands.
You usually use the EXPRESSSCOPE® Monitor power button for maintenance
purposes. Infrastructure Solutions Console or remote console interfaces are the
preferred interfaces for applying and removing DC power to partitions and cells for
normal operations.
4.1.4. EXPRESSSCOPE® Monitor LEDs
The LED above the EXPRESSSCOPE® Monitor LCD shows the cell operating status,
as follows:
• Green, when the cell is powered on and operating normally
• Amber, when a fault occurs in the cell
Components
The LED below the EXPRESSSCOPE® Monitor LCD is used by the power control to
indicate the existence of a communication fault with the Service Processor or
management firmware, as follows:
• Off, when communication is normal and no faults exist
• Amber, when communication with the Service Processor is interrupted and a fault
occurs
The interface does not have a button to control this function.
4.1.5. EXPRESSSCOPE® Monitor LCD Back Light
The back light of the EXPRESSSCOPE® Monitor LCD is
• Off when the EXPRESSSCOPE® Monitor is not in use in order to extend the
lifespan of the back light
• On
- For a time after DC power is applied to the cell
- When you are using the menu system
- For a time after you exit the menu system
• Blinking for chassis identification when you
- Press the ID button on the front or back of the cell
- Submit the identification command using the remote console interface
4-5

Menu System
4.2. Menu System
The menu system is a hierarchy of choices that provide
• Detailed information about the system as a whole, partitions, and cells, which
reflects the basic structure of the management firmware control and reporting
functions
• Commands to configure and control partitions and cells
Press the OK button to enter the menu system.
4.2.1. Menu Structure
Each menu (refer to Figure 4-4) has a title, one or more options, and indicators, as
shown in the following table:
Indicator Description
No right angle bracket An option that is not followed by a right angle bracket is a command,
and
Return
View
A right arrowhead on the left of an option designates the current
selection.
A right angle bracket following an option indicates that a submenu
exists for that option.
such as view, set, clear, and return.
Up and down arrows in the right corners indicate that more options
are available in that direction.
A Return command moves back to the previous display, similar to a
browser Back button.
A View command (refer to Figure 4-5) causes information about the
selection to appear on the EXPRESSSCOPE® Monitor LCD.
Press the OK button to return to the menu after viewing the
information.
4.2.2. Main Menu
The main menu enables you to
• Enter the system menu
• Enter the partition menu
• Enter the cell menu
4-6

Menu System
• Return to the main screen
The main menu appears on the EXPRESSSCOPE® Monitor LCD when you press OK.
Four lines appear at a time. Figure 4-4
shows the main menu in two parts:
Figure 4-4 EXPRESSSCOPE® Monitor Main Menu
Press the navigation buttons (up or down arrows on the EXPRESSSCOPE® Monitor;
refer to Figure 4-1
OK to select the option.
) to move the right arrowhead ( ) to the desired option, and then press
4.2.3. EXPRESSSCOPE® Monitor LCD Timeouts
If the EXPRESSSCOPE® Monitor is left idle, the main menu times out and the LCD
again displays the main screen (refer to Figure 4-2
is left idle longer, the back light turns off.
Press OK to activate the menu system and display the main screen.
). If the EXPRESSSCOPE® Monitor
4.2.4. Navigating Menus
The system, partition, and cell menus offer more detail and command entry. For
example, if you navigate to System on the main menu (refer to Figure 4-4) and press OK,
the system menu appears, as shown in Figure 4-5.
4-7

Menu System
If you press OK when View Information is selected (the arrowhead points to the current
selection), the system information screen appears, displaying the system name, serial
number, and the number of cells (refer to Figure 4-6
Figure 4-5 System Menu
).
Press OK to return to the system menu. From there, navigate to Return and press OK
to return to the main menu.
The partition and cell menus are similar to the system menu, but they contain more
options. Refer to 4.2.5 Menu Contents
are displayed for all menus.
4.2.5. Menu Contents
The menu system is organized to display information and commands about the system
as a whole, partitions, cells, network, and field-replaceable units (FRU) faults, if faults
occur. Some options are dynamic and appear only if applicable. For example, fault
information is available to view only if faults exist. When faults occur, the first option on
the main menu is View Faults, as shown in Figure 4-8
The following hierarchy shows the structure of all options in the menu system. Each
option displays information, displays a submenu of lower level options, or submits a
command.
Figure 4-6 System Information
for details about the options and information that
.
• View faults (if faults exist)
- FRU name
- Part number
4-8

Menu System
- Reference to documentation
- Return to main menu
• System
- View information
o System name
o System serial number
o System size (number of cells)
- Return to main menu
• Partition
- View information
o Partition name
o Membership (which means the cells that are in the partition, in the form
xxxx for cells 0 through 3. For example, x1xx means that cell 1 is a
member but cells 0, 2, and 3 are not.)
o Flags for TPM Physically Present, maintenance mode, and No Degraded
Boot
- View GUID
- Chassis control (refer to 3.5.2 Command Buttons
o Power up/down
o Power cycle
o Soft shutdown
o Hard reset
o Force dump (send a nonmaskable interrupt (NMI))
- Network (refer to the full description that follows)
- Set Phys Present (TPM Physically Present)
- Set maint mode (maintenance mode)
- Clear all faults
- Return to main menu
• Cell
)
- View information
o Cell ID and power state
o Cell serial number
4-9

Menu System
• Network (submenu of partition and cell menus)
o Cell operating state (and POST code, if valid)
o Flags for boot cell and cell number
- Network (refer to the full description that follows)
- Power on/off cell
- Restore defaults
- Return to main menu
- View settings
o DHCP enabled/disabled
o IP address
o NM (network mask)
o GW (network gateway address)
- Update settings
Reserves network settings for you to update. Well-behaved client applications,
such as the EXPRESSSCOPE® Monitor interface and remote console
interface, do not change reserved settings. However, other clients are not
precluded from changing these settings.
- Commit changes
You must commit changes for them to take effect. If you submit a revert
changes command or a timeout occurs, changes are not submitted.
- Revert changes
- Set DHCP on/off
- Set IP address
- Set IP (network) mask
- Set gateway address
- View DHCP GUID
- Return to partition or cell menu
• Return to main screen display
4.2.6. Success and Error Menus
Many commands display a success or error menu when they complete to provide more
information.
A success menu is positive confirmation of a command that is issued to management
4-10

firmware and offers either
• Notification of successful completion
• Explanation of specific conditions, such as a message that the network is reserved
for updates
An error menu indicates the failure of a command that is issued to management
firmware and offers either
• Error codes
• Explanation of a specific error, such as a message that the network is already
reserved
4.3. Fault Messages
A fault is a failure of a hardware component, a software component, or some
combination of components. A fault typically results in both an event and an alert. Refer
to 3.5.5 Event Log
and 3.5.14 Alert Management for more information.
Fault Messages
Some hardware components are customer-replaceable units (CRU), as discussed in
Section 11 Removing and Replacing CRUs
If faults occur in CRUs or FRUs, the LED above the LCD turns amber and a message
appears on the fourth line of the main screen. Figure 4-7
two FRUs in the named partition.
Note: The EXPRESSSCOPE® Monitor does not distinguish between CRUs and FRUs.
Instead, the term “FRU” appears on the LCD for both CRUs and FRUs.
and some are field-replaceable units (FRU).
shows that faults occurred in
Figure 4-7 Fault Message on Main Screen
Refer to the following paragraphs and Section 10 Troubleshooting Hardware Problems
for information on handling CRU and FRU faults.
4.3.1. Viewing Fault Messages
If the main screen shows that faults occurred, press the OK button on the
EXPRESSSCOPE® Monitor to display the main menu. An option to view faults appears,
as shown in the following figure.
4-11

Fault Messages
Select View Faults and press OK to view the fault information. The display looks similar
to the following figure, where
• The FRU name and part number appear on the first two lines.
• A reference to a servicing guide on the following lines, which means one of the
following:
- For customers, the User’s Guide (refer to Section 11 Removing and Replacing
Figure 4-8 View Faults Option on Main Menu
CRUs)
- For service representatives, the Fault Isolation and Servicing Guide
• A down arrow appears if additional fault messages are available.
Figure 4-9 Fault Message
4.3.2. Clearing Fault Messages
After the fault is resolved, clear fault messages, as follows:
1. Press OK to return to the main menu.
2. Navigate to Partition, and press OK.
The partition menu now includes Clear All Faults.
3. Navigate to Clear All Faults, as shown in Figure 4-10
The fault indicator on the main screen is cleared for all cells in the partition.
4-12
, and press OK.

Partition Chassis Control
Figure 4-10 Clearing Fault Messages
Clearing messages using the EXPRESSSCOPE® Monitor interface is the same as
using the remote console interface.
Once messages are cleared, messages that appear later mean that a new fault
occurred.
4.4. Partition Chassis Control
Chassis Control on the partition menu displays a submenu of commands to shut down
and, possibly, reboot the partition operating system, and to power the partition on or off,
as follows:
• Power Down
Shuts down the operating system ungracefully and shuts down power.
• Power Cycle
Shuts down the operating system ungracefully, shuts down power for the specified
interval, and then turns power on and reboots the operating system.
• Soft Shutdown
4-13

Network
Shuts down the operating system gracefully; that is, management firmware tells the
operating system to shut down itself.
Caution
Only a soft shutdown can result in a graceful shutdown of the operating
system, during which files can be closed and data saved. All other actions
cause an ungraceful shutdown of the operating system, and data can be lost.
• Hard Reset
Shuts down the operating system ungracefully and reboots the operating system;
power remains on.
• Force Dump (send NMI)
Takes a memory dump, sends a non-maskable interrupt (NMI), and shuts down the
operating system ungracefully.
Navigate to the desired command and press OK.
Refer to 3.5.2 Command Buttons
for more information.
4.5. Network
The Service Processor has a separate network connection for each cell and partition in
the system. If you display the network menu from a cell menu, the values pertain to that
cell. If you display the network menu from a partition menu, the values pertain to the
partition to which the cell belongs. All cells in a partition display the same partition values
but unique cell values. You can update partition values from any cell in the partition.
4.5.1. Viewing Network Settings
The Network option on the cell and partition menus enables you to view and update
network settings for cells and partitions. All network menus have the same structure with
different values, depending on the context. To view network settings
1. Open the desired partition or cell menu.
2. Navigate to Network and press OK.
The network menu for the partition or cell opens.
3. Navigate to View Settings and press OK.
Network information appears on the EXPRESSSCOPE® Monitor LCD, as shown in
Figure 4-11
.
4-14
 Loading...