

Page 1
NIRS
XDS MultiVial Analyzer
Manual
8.921.8002EN / 2013-12-19
Page 2

Page 3

Metrohm AG
CH-9100 Herisau
Switzerland
Phone +41 71 353 85 85
Fax +41 71 353 89 01
info@metrohm.com
www.metrohm.com
NIRS
XDS MultiVial Analyzer
Manual
8.921.8002EN / 2013-12-19 fpe
Page 4

Teachware
Metrohm AG
CH-9100 Herisau
teachware@metrohm.com
This documentation is protected by copyright. All rights reserved.
Although all the information given in this documentation has been checked with great care, errors
cannot be entirely excluded. Should you notice any mistakes please send us your comments using the
address given above.
Page 5

▪▪▪▪▪▪▪
Table of contents
1 Introduction ................................................................................................................... 5
2 Site Readiness ................................................................................................................ 8
2.1 Temperature and Humidity ........................................................................... 8
2.2 General Environment .................................................................................... 8
2.3 Vibration ....................................................................................................... 8
2.4 Electrical Power ............................................................................................ 8
2.5 Instrument Communication .......................................................................... 8
2.6 Instrument Dimensions and Weight .............................................................. 9
3 XDS Instrument Connection ......................................................................................... 10
3.1 Network Connection, connected to an active network port as shown ........ 10
3.2 Direct Connection, in a free-standing manner with no network connection
11
3.3 Overview of XDS Instrument Communication ............................................. 11
3.4 Flowchart Diagram of XDS communication protocol .................................. 12
3.4.1 Microsoft Windows Firewalls ................................................................................ 13
3.4.2 Network Evolution Issues ...................................................................................... 13
3.4.3 Quick Glossary of Terms: ....................................................................................... 13
3.5 Connection in Vision ................................................................................... 14
3.6 Troubleshooting Connection Problems ....................................................... 15
3.6.1 Network Troubleshooting Overview ...................................................................... 16
3.6.2 Direct Connection Troubleshooting Overview ........................................................ 20
4 Assembly of the Instrument ......................................................................................... 22
5 XDS MultiVial Module .................................................................................................. 27
5.1 Introduction to Vial Analysis ....................................................................... 27
5.2 Creation of a Custom Vial Size .................................................................... 28
5.3 Spot Size Adjustment .................................................................................. 30
5.4 Iris Adapter ................................................................................................. 33
5.4.1 Installation of Iris Adapter: .................................................................................... 33
5.5 Use of the Sample Transport Mechanism .................................................... 35
5.5.1 Use of the Iris Adapter: ......................................................................................... 36
6 Vision Software: Connection to the Instrument ............................................................ 37
6.1 Entry into Vision ......................................................................................... 37
6.2 Use of Vial Dialog Selection Menu .............................................................. 43
6.2.1 Sample ID Entry .................................................................................................... 45
6.2.2 Order of Sampling ................................................................................................ 51
6.2.3 Additional Vial Dialog Functions ............................................................................ 53
7 Instrument Diagnostics................................................................................................. 57
7.1 Setup Diagnostics ....................................................................................... 57
7.1.1 Wavelength Linearization ...................................................................................... 58
7.1.2 Reference Standardization, “Use Tray” Position ..................................................... 60
7.1.3 Reference Standardization, “Use Iris” Position ....................................................... 64
3
Page 6

▪▪▪▪▪▪▪
7.1.4 Instrument Calibration .......................................................................................... 68
7.1.5 IPV Setup (Instrument Performance Verification) ................................................... 71
7.2 Evaluation Diagnostics ............................................................................... 73
7.2.1 Performance Test ................................................................................................. 74
7.2.2 Wavelength Certification ...................................................................................... 77
7.2.3 Photometric Test .................................................................................................. 81
7.2.4 Gain Test .............................................................................................................. 85
7.2.5 7.2.5 Low Flux Test .............................................................................................. 86
8 Instrument Maintenance .............................................................................................. 89
8.1 Overview .................................................................................................... 89
8.2 Fan Filter Replacement ............................................................................... 90
8.3 Lamp Replacement ..................................................................................... 91
8.4 Fuse Replacement ...................................................................................... 97
8.5 Maintenance Log ....................................................................................... 99
8.6 Window Cleaning ..................................................................................... 100
9 Validation Tools ......................................................................................................... 102
9.1 Hardware Validation Tools ....................................................................... 103
9.1.1 Factory Instrument Test Guide and Results .......................................................... 103
9.1.2 Installation and Operating Qualification Documents ............................................ 103
9.1.3 NIRStandards® for Instrument Performance Verification ..................................... 103
9.1.4 Instrument Performance Certification .................................................................. 103
9.1.5 Metrohm NIRSystems Master Instrument Program .............................................. 104
9.2 Software Validation Tools ........................................................................ 104
9.2.1 Installation and Operating Qualification Documents ............................................ 104
9.2.2 Vision Certificate of Validation ............................................................................ 104
9.2.3 21 CFR Part 11 Compliance ................................................................................ 105
10 Safety and Electrical Certification ............................................................. 107
11 Troubleshooting ....................................................................................... 108
12 Lifting and transporting the Metrohm instrument: .................................. 112
12.1 Instructions for MultiVial® Shipping Position........................................... 113
12.1.1 Instructions follow .............................................................................................. 113
13 Index ........................................................................................................ 115
4
Page 7
▪▪▪▪▪▪▪
1 Introduction
The versatile sampling mechanism of the MultiVial Analyzer
Thank you for selecting the XDS MultiVial Analyzer, manufactured by FOSS. This instrument is the
third generation in a series of instruments designed for precision NIR measurement, characterization
of organic materials, and qualification of known materials to allowable quality parameters.
The XDS MultiVial Analyzer is designed for stable operation in typical laboratory environments, while
providing the precision and accuracy users have come to expect of FOSS near-infrared (NIR)
instruments.
The MultiVial Analyzer comes with a choice of one vial tray. Others are optional.
The MultiVial Analyzer uses a proven monochromator design, employing a digitally-controlled
dispersive grating, sensitive detection devices, and state-of-the-art circuitry to enhance signal output
and minimize any extraneous noise that might influence performance. The XDS MultiVial Analyzer
uses various patented algorithms to provide superior accuracy and transferability between like
instruments. These software algorithms must be used to assure method transfer between
instruments. See section 7.1 for full details.
offers a movable sampling platform, suitable for handling
multiple vials or other samples. The software supports
acquisition of spectra in an unattended mode, freeing the
operator to prepare other samples, analyze data, or perform
unrelated tasks.
Vision supports four different default vial diameters, to
speed set-up. For custom vial diameters, set-up is
straightforward. The MultiVial Analyzer also offers variable
spot size, to focus energy on small vials.
Horizontal orientation of the sample transport mechanism facilitates loading, and prevents material
spills inside the sampling area of the instrument. The MultiVial Analyzer supports use of normal
sampling accessories for the XDS Rapid Solids Analyzer.
Sampling may be performed on two different physical levels, either directly on the sample window
(as with a normal XDS RCA) or on the vial tray, which is slightly raised from the glass. For this reason,
5
Page 8
▪▪▪▪▪▪▪
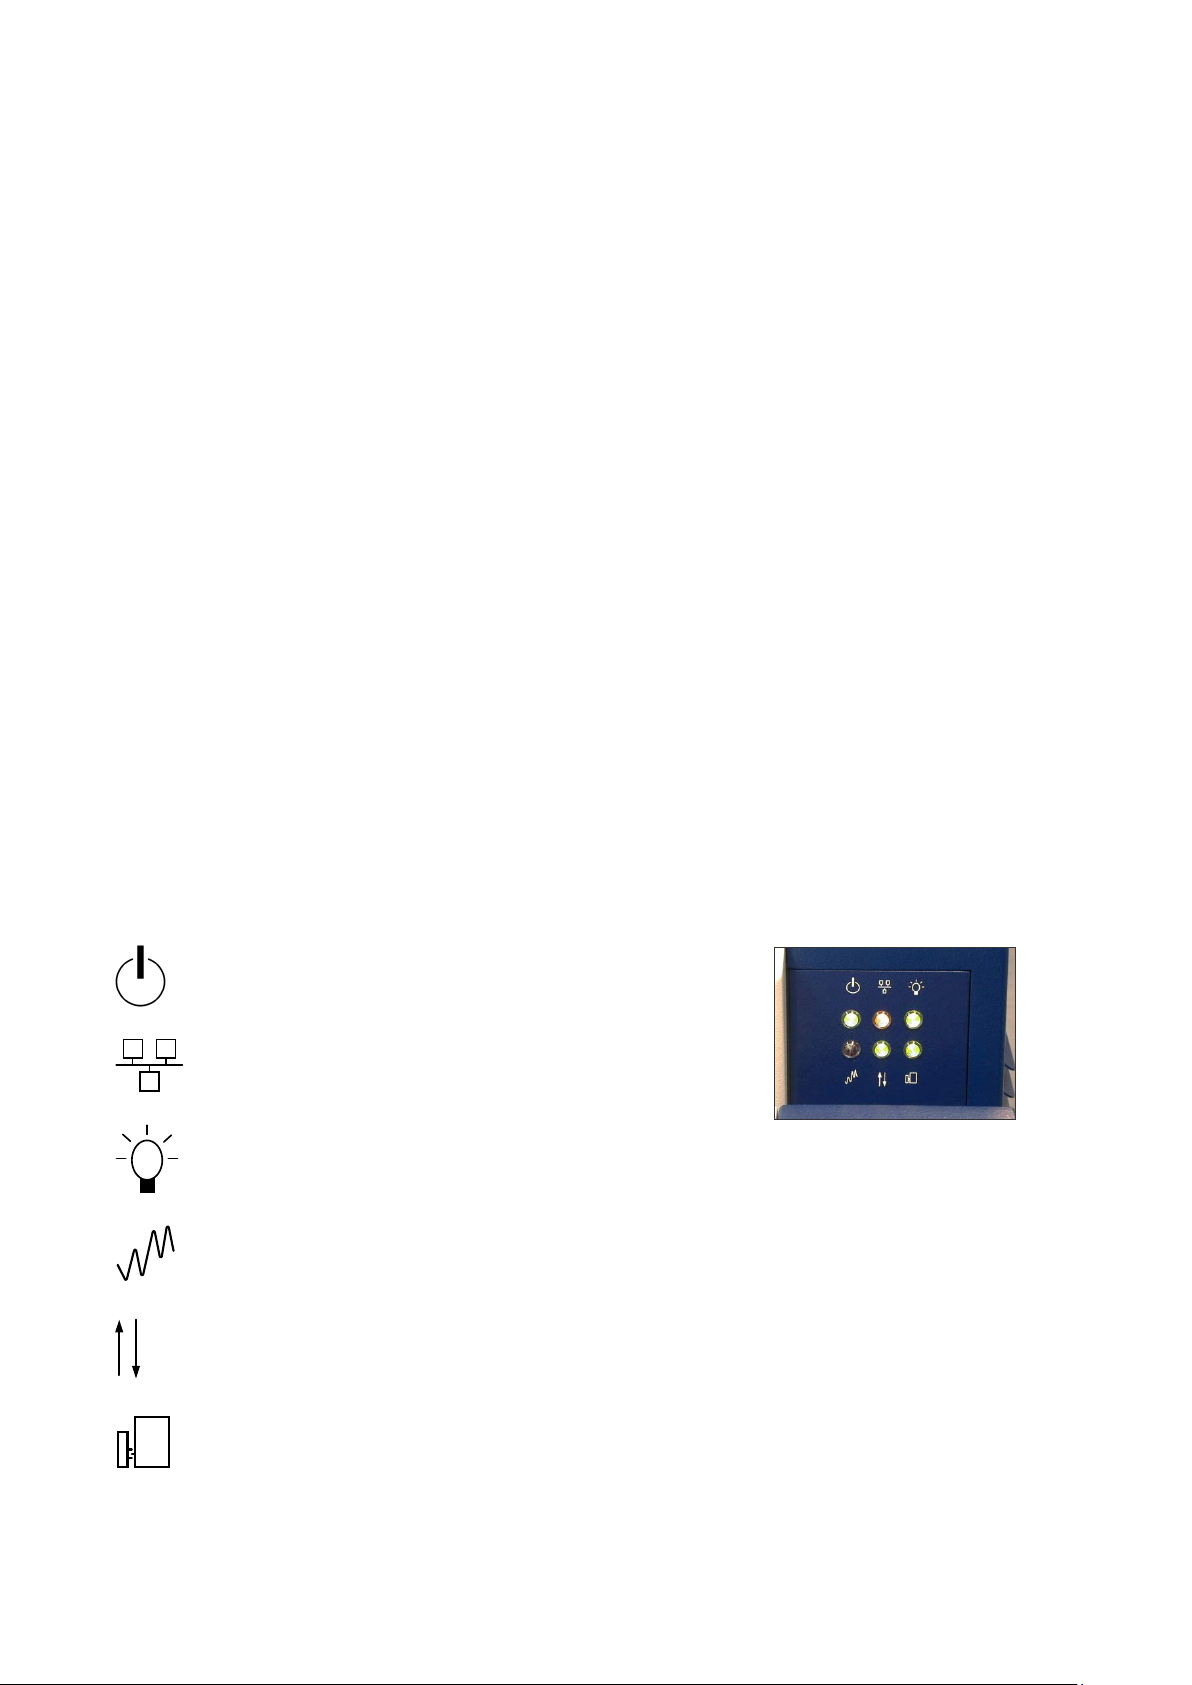
Icon
Status
Green when power is ON
Amber when connected to network or direct
Green when instrument lamp is ON
Red when scanning reference or sample
Green when module is properly attached
two sets of optical (“reference”) calibrations are stored in the instrument. It is important to Reference
Standardize on the correct level, as prompted by Vision Software. This aids in method transfer, and is
explained in the section on Reference Standardization.
This instrument uses near-infrared (NIR) spectral energy to illuminate the sample. By measuring the
energy reflected off (or passing through) the sample, chemical information and composition may be
determined. This information may be used for quantification of constituents, or for comparison to a
library of known materials, providing identification and qualification of materials.
Vision Software™ offers an easy user interface, using the familiar interface provided with previous
generations of NIR instrumentation. All functions required to perform identification, qualification, and
quantitation are provided, with easy tools for interpretation of results. Vision offers full instrument
diagnostics, with built-in acceptance specification tables for all tests. Vision stores all results in a
diagnostic database for later lookup, with control chart views of results tracked over time.
The menu-driven, validated Vision Software package meets all requirements of CFR 21 Part 11,
covering Electronic Records and Signatures. Vision comes with a full manual for operation and theory
of operation, with complete instructions for analytical development.
The XDS Analyzer provides 0.5nm data points, and uses several innovative methods to assure
wavelength accuracy and repeatability. Wavelength positions are traceable to NIST SRM-1920.
Because SRM-1920 does not have certified wavelengths above 2000 nm, an additional wavelength
absorber is included in the calibration standard, to provide stable wavelengths beyond 2000 nm.
These additional wavelengths have been independently measured on calibrated instrumentation to
ascertain the wavelength positions used.
A panel of 6 LED indicators provides information to the user on these functions:
connection
Green when stable operating temperature is reached
Instrument communication uses RJ-45 network connections, to eliminate issues involved with long
runs of RS-232 cable. An Internet Protocol (IP) address is dynamically requested upon connection.
6
Page 9

▪▪▪▪▪▪▪
This IP address may be permanently installed, if required for network purposes. RJ-45 connection also
permits remote interrogation and diagnostics checks of the instrument, if necessary and authorized.
The instrument enclosure is completely sealed to prevent contamination by dust or other substances.
The cooling fans operate outside the main enclosure, and are thermally linked to internal fans that
maintain a constant temperature inside the instrument enclosure. There is no airflow drawn into the
optics chamber instrument. An external fan-cooling loop is provided in the side chassis, with thermal
conduction from the inside of the optics chamber. This avoids contamination of the instrument in
dusty environments. An air filter is built into the door of this chamber. For cool environments, heaters
are embedded in the thermal transfer block to raise temperature when required.
Lamp changes are performed through a single panel on the rear surface of the instrument. The lamp
is easy to remove and replace, and requires no special tools or expertise.
7
Page 10

▪▪▪▪▪▪▪
2 Site Readiness
Like most precision instruments, the MultiVial Analyzer (RCA) is sensitive to environmental conditions
that can affect its performance and useful life. Observe the following guidelines when selecting a site
and installing the instrument:
2.1 Temperature and Humidity
The XDS Analyzer is designed to work in ambient air temperatures from 40-95°F (4.5-35°C).
Use the XDS Analyzer only in 10-90% relative humidity levels, non-condensing. Rapid changes in
humidity can cause interferences by adding trace moisture absorptions to the spectra. In general,
lower humidity levels are preferred.
The Performance Test (a comprehensive instrument diagnostic test in Vision software) is somewhat
sensitive to changes in ambient humidity, and the Performance Test may fail under conditions of
extreme humidity, or rapidly varying humidity.
2.2 General Environment
Minimize exposure of the monochromator to dust.
Inspect the fan filter at least monthly. If an accumulation of lint, dust, or other matter has
accumulated, pull open the right-hand panel from the instrument. Replace the filter. If dust has
accumulated on the fans, carefully wipe them clean with a moist soft cloth. Do not distort or damage
the fan blades or fins, as this will impede cooling.
Do not place the instrument directly near any HVAC duct. The direct flow of heating or cooling air
will cause the instrument to exhibit high noise during the Performance Test.
2.3 Vibration
Install the XDS Analyzer where it will not be affected by bench vibration from grinders, blenders,
stirrers, or mixers.
Never permit hammering or other physical impact on the bench top supporting the XDS Analyzer or
its computer.
2.4 Electrical Power
Power should be a single, separate, stable, transient-free filtered AC circuit. The circuit should have
surge protection.
Operating voltage for the instrument is 100-240VAC, 50/60Hz. The power supply is self-switching
and will provide the correct operating voltage to the instrument.
Maximum power consumption is 750W.
2.5 Instrument Communication
The XDS MultiVial Analyzer can communicate directly with the computer by use of a UTP Crossover
Cable (gray cable) supplied with unit.
Alternatively, the instrument may be accessed directly through a network connection. This uses a
standard RJ-45 type cable, such as CDW #074092, available from CDW Computer Centers, Inc. The
8
Page 11

▪▪▪▪▪▪▪
instrument detects network capability and optimizes communication speed.
The computer that operates the instrument must have clear access through the network, and be
configured to communicate properly. This communication is the responsibility of your on-site
network personnel.
Full instructions are given in section 3.0.
2.6 Instrument Dimensions and Weight
The XDS MultiVial Analyzer dimensions are:
• Width: 18.0” (457 mm)
• Height 15.25” (387 mm)
• Depth 22.5” (572 mm) front to back
Leave a minimum of 3” (76mm) around the instrument sides and back for airflow and access space.
Leave as much space as possible in front for sample handling.
• Weight 68.7 pounds (31.25 kg)
Follow lifting instructions (on last page) when moving the instrument. Avoid injury.
9
Page 12
▪▪▪▪▪▪▪
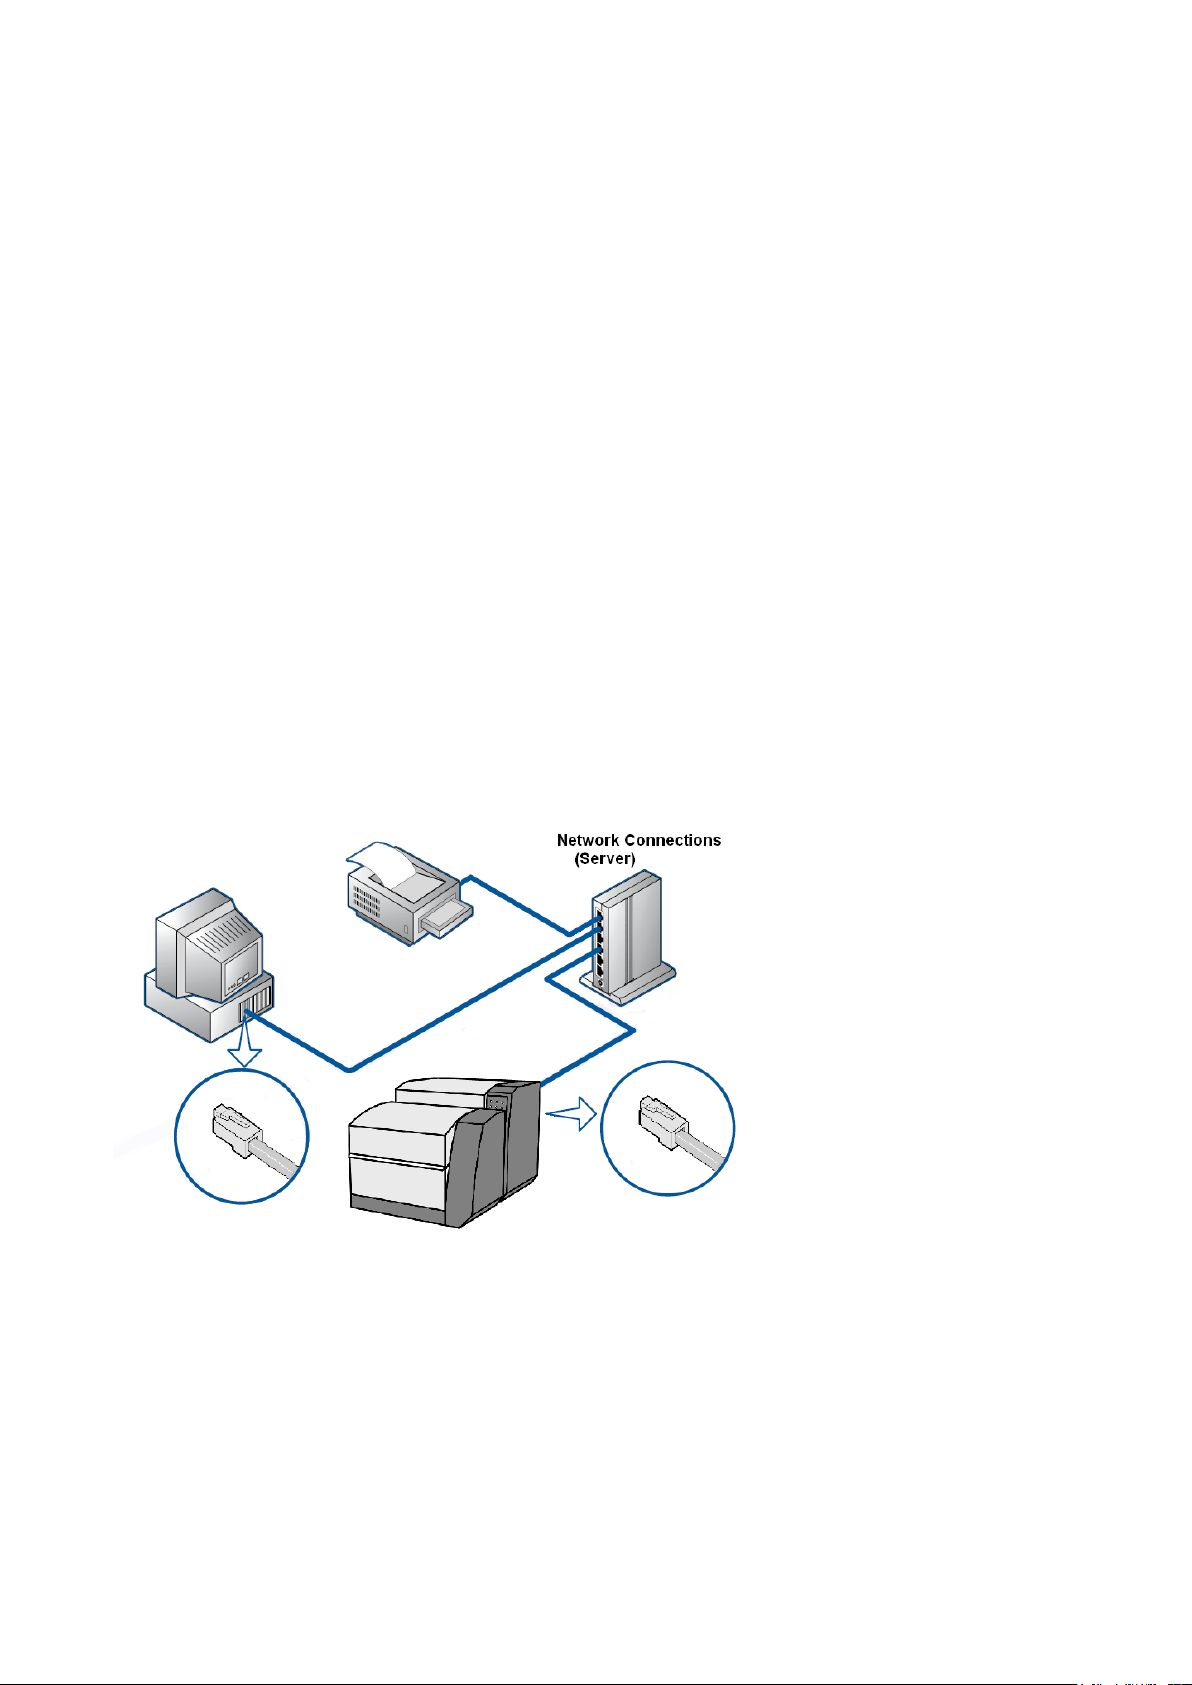
3 XDS Instrument Connection
The XDS instrument may be connected to the host computer in one of two ways: If the XDS
Instrument will be used as part of a network, use the Network Connection method shown
immediately below. If there are not enough active network ports near the XDS instrument, a hub or
router may be used.
This section assumes use of Windows® 2000, XP, or later versions of Windows Operating Systems.
For computers using Windows 95, 98, or NT 4.0, we recommend upgrade of the computer and
operating system to current specifications.
CAUTION: METROHM NIRSystems does not recommend the use of two network cards under any
circumstances. Do not use Direct Connection to the instrument along with a network connection to
the company network. The use of two network cards -- on one data bus in the computer – may
result in lost commands, lost data, and unsatisfactory software operation. Metrohm cannot be
responsible for software and instrument problems resulting from the use of two network cards in the
host computer.
This information is correct as of the time of original publication. Changes to computers, operating
systems, and network protocols may require revision of this information without notice.
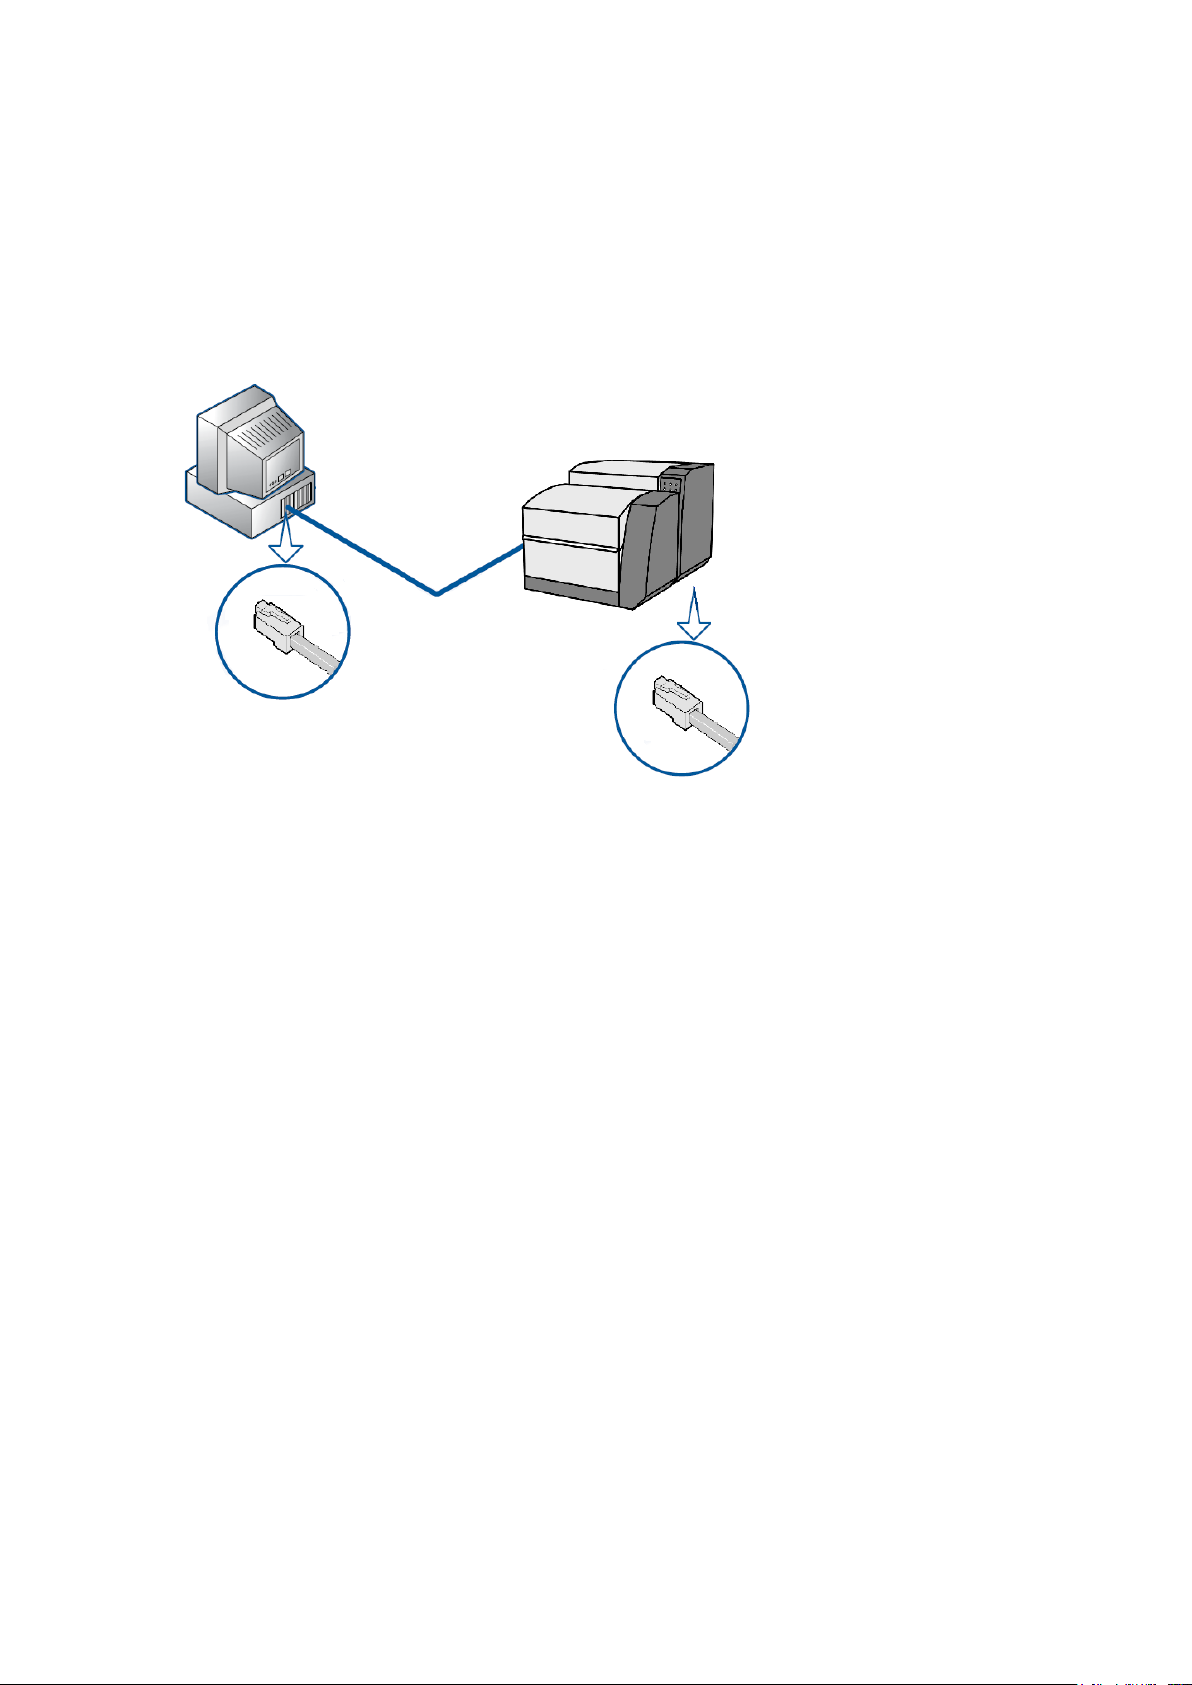
3.1 Network Connection, connected to an active network port as shown
This is the preferred method of instrument communication when a connection to the company Local
Area Network (LAN) is necessary. Specific information about this method follows:
• The XDS instrument should be connected -- with a “patch” cable – to the network port.
• Upon power-up, the XDS instrument will request a dynamic IP address from the network
server. This is normally assigned in 5 to 10 seconds.
• The XDS instrument uses a proprietary, encrypted command language. It cannot be activated
by any program except Vision, or Metrohm programs designed to operate the instrument.
Therefore, the instrument maintains “Closed System” status under 21 CFR Part 11 rules. No
hacking or support of viruses is possible with XDS instruments.
10
Page 13
▪▪▪▪▪▪▪
• The XDS instrument appears just like a network printer (or other peripheral device) on the
LAN system. It generates no signals, and only responds when commanded by an authorized
user, logged into Vision software.
• This is the easiest connection method for XDS instruments.
3.2 Direct Connection (without network)
This method allows users to connect to the instrument when there is no network present. In such
cases, a “crossover cable” (provided) is used. The XDS instrument, upon power-up, requests a
dynamic IP address. When none is supplied within 45 seconds, the XDS instrument concludes that no
DHCP server is available. It then defaults to an internal IP address which the computer may use for
“direct communication”.
This method of hookup should not be used when the computer is also connected to a network. Such
connection may result in lost commands, lost data, and unsatisfactory software operation. Metrohm
cannot be responsible for software and instrument problems resulting from the use of two network
cards in the host computer.
For IT personnel, it may be helpful to understand the sequence of events used by the XDS instrument
and Vision software when establishing an electronic connection. These are explained.
3.3 Overview of XDS Instrument Communication
The XDS instrument may be connected to LAN systems in the same manner as any printer or other
peripheral Ethernet-enabled device. These key items will help understand the communication
methods. See the flowchart diagram on next page.
1. The XDS instrument maintains “Closed System Status” under 21 CFR Part 11 guidelines. It
uses a proprietary, encrypted command language. It is not susceptible to hacking or virus
attacks.
2. The XDS system may only be addressed using proprietary software (usually “Vision”) which
can only be entered by an authorized user, using the “two-token” method of entry. (Unique
User ID and password)
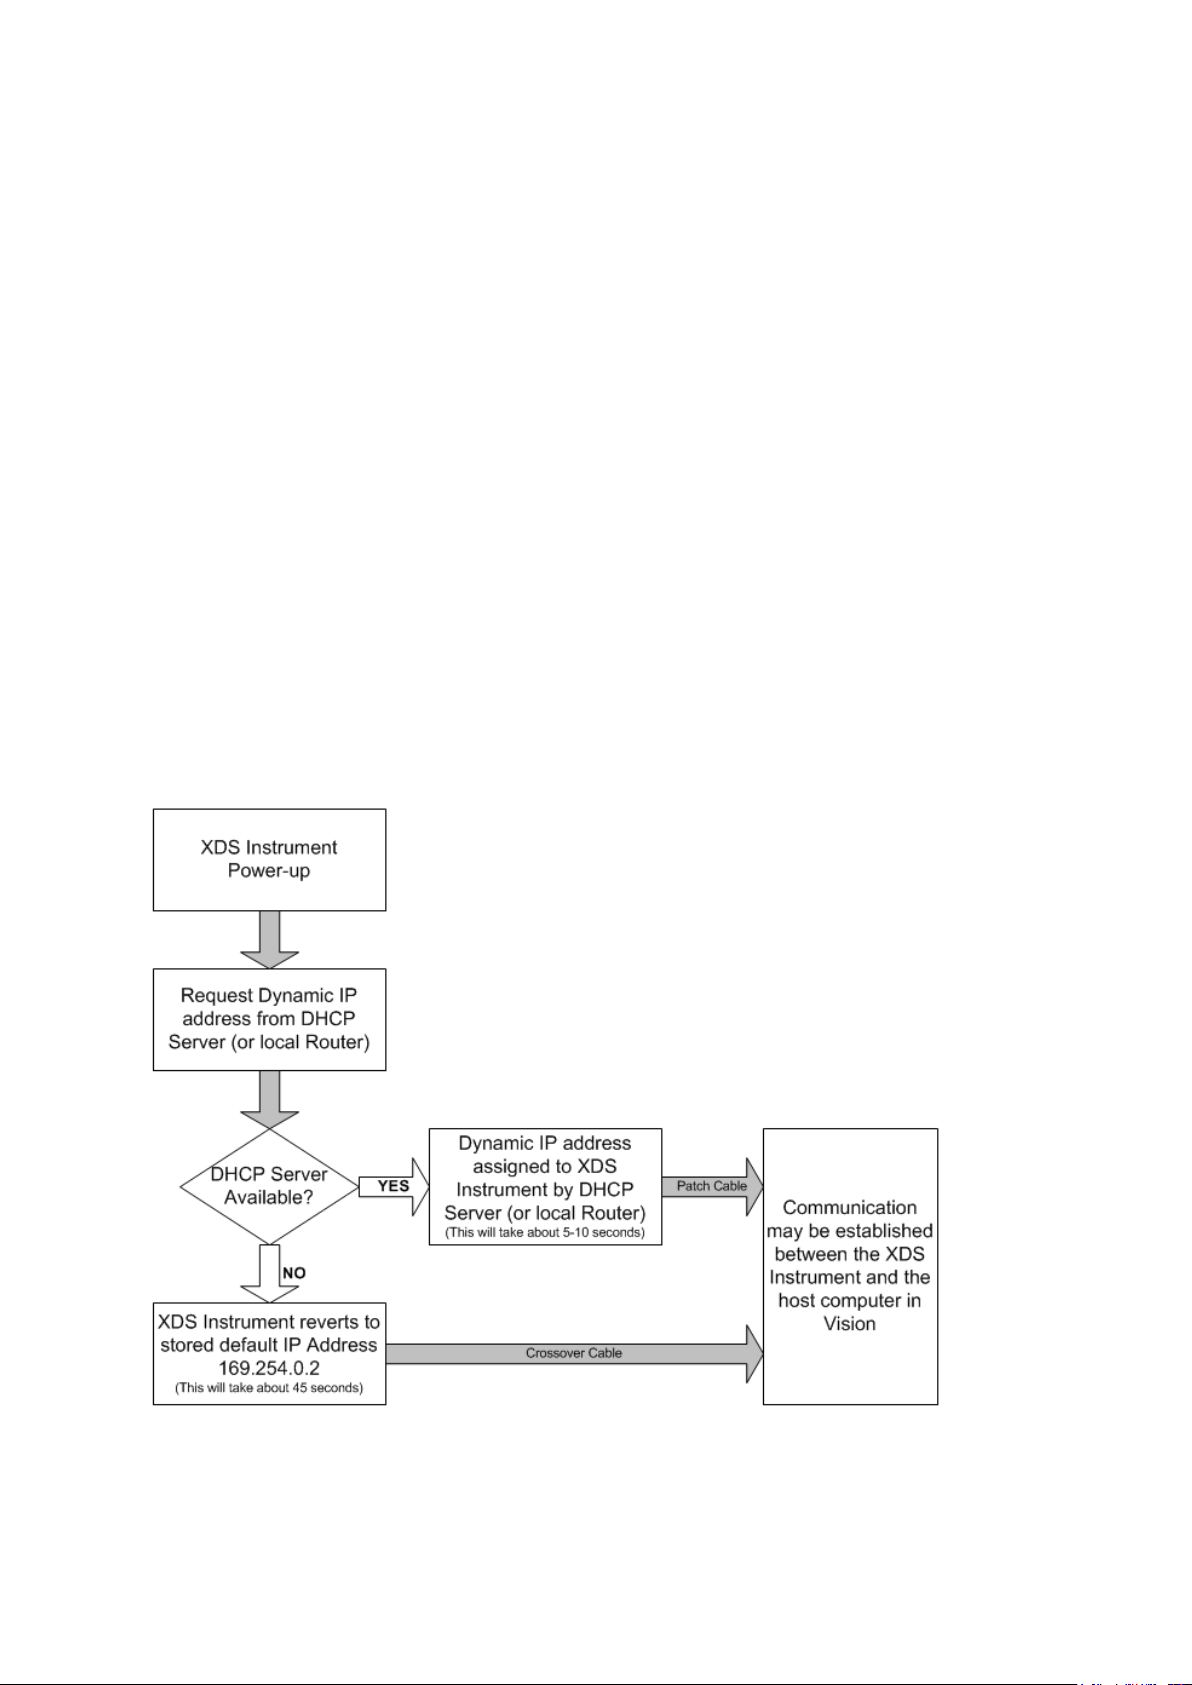
3. Upon being powered up on a LAN, the XDS instrument requests a “dynamic” IP address from
11
Page 14
▪▪▪▪▪▪▪
the DHCP server which controls the LAN. This IP address is normally granted promptly
(typically in 5-10 seconds) so the instrument can function on the LAN. Most DHCP servers
track the XDS instrument by the “MAC” (Machine Access Code) to later re-assign that same IP
address whenever the XDS instrument is on the LAN.
4. If there is no DHCP server available to assign an IP address (a free-standing router may serve
the same DHCP function), the XDS instrument will “time out” in 45 seconds --and it will know
that it is not attached to an active LAN. It will then default to an internally-stored default IP
address. This address, 169.254.0.2, is used for local, free-standing communication only. In
such cases, a crossover cable, or a hub with two patch cables, should be used to connect the
computer and the XDS instrument.
5. Upon the next power-down and subsequent power-up of the XDS instrument, it will again
request an IP address of the DHCP server. It will go through the same cycle, eventually
reverting to the stored default IP address. This is intentional.
6. A dynamic IP address is the preferred method of XDS instrument connection. The default IP
address is only used when no DHCP server is available to assign a dynamic IP address.
A short glossary of terms follows. See the flowchart diagram for XDS instrument communication
which visually outlines the items explained above.
3.4 Flowchart Diagram of XDS communication protocol
12
Page 15

▪▪▪▪▪▪▪
3.4.1 Microsoft Windows Firewalls
The Microsoft Windows® Firewall on the PC may interfere with Vision communication. To assure
communication, follow these steps:
• Enter Control Panel, Security Center.
• On the “General” Tab, be sure that “exceptions” are allowed. (Un-click “Don’t allow
exceptions”.)
• On the “Exceptions” Tab, click “Add Program”.
• Select Vision from the list of programs – click on it. (Vision must be installed to appear on the
list.)
• Click on “OK” at each window to exit Control Panel.
3.4.2 Network Evolution Issues
This document is as correct as possible at the time or writing. However, network management is an
evolving discipline, and conditions will change. Some of the drivers for change include network
security, authentication, and data integrity. Technology changes factor into all of these issues.
Because the network communication environment is complex and ever-changing, we have tried to
provide the basic information needed for connection of the XDS instrument. 95% of users will have
no connection problems, if these instructions are followed.
In the rest of the cases, there may be network issues, corporate restrictions, or other issues which
inhibit easy connection. The troubleshooting section covers some of the most common problems.
In all cases, we recommend minimal tampering with computer settings. This can cause instability, and
may be prohibited by company policies.
At this time, we recommend Microsoft Windows® XP as the easiest operating system by which to
establish network communication. We strongly recommend that Windows 95, 98, and NT 4.0 be
avoided, as they require considerable expertise in network configuration.
3.4.3 Quick Glossary of Terms:
DHCP:
The Dynamic Host Configuration Protocol (DHCP) is an Internet protocol for automating the
configuration of computers that use TCP/IP.
DNS Server:
A Domain Name Server. DNS Servers run special-purpose software, as part of the Domain Name
System, for managing enterprise networks.
IP:
An Internet Protocol (IP) address is a numerical identification and logical address that is assigned to
devices participating in a computer network utilizing the Internet Protocol for communication
between its nodes.
IPv4:
IPv4 refers to “Internet Protocol version 4” which is the fourth revision in the development of the
13
Page 16
▪▪▪▪▪▪▪
1. Log into Vision with your User ID and
Internet Protocol (IP) and it is the first version of the protocol to be widely deployed. Together with
IPv6, it is at the core of standards-based internetworking methods of the Internet and is still by far
the most widely deployed Internet Layer protocol. XDS Instruments use IPv4.
LAN:
A local area network (LAN) is a computer network covering a small physical area, like a home, office,
or small group of buildings, such as a corporate site, a university, or an airport. These are often called
“enterprises”.
Subnet Mask:
“Subnetting” is used to break a large network into smaller sections. This can enhance efficiency, raise
speeds, and reduce “packet collisions” within the network. To accomplish subnetting, “Subnet
Masks” may be applied to separate one section of the network from another. A subnet mask typically
takes the form “255.255.255.0” or something similar. This scheme is becoming obsolete, as new
network management methods are being implemented.
TCP/IP:
(Transmission Control Protocol/Internet Protocol) is the basic communication language or protocol of
the Internet.
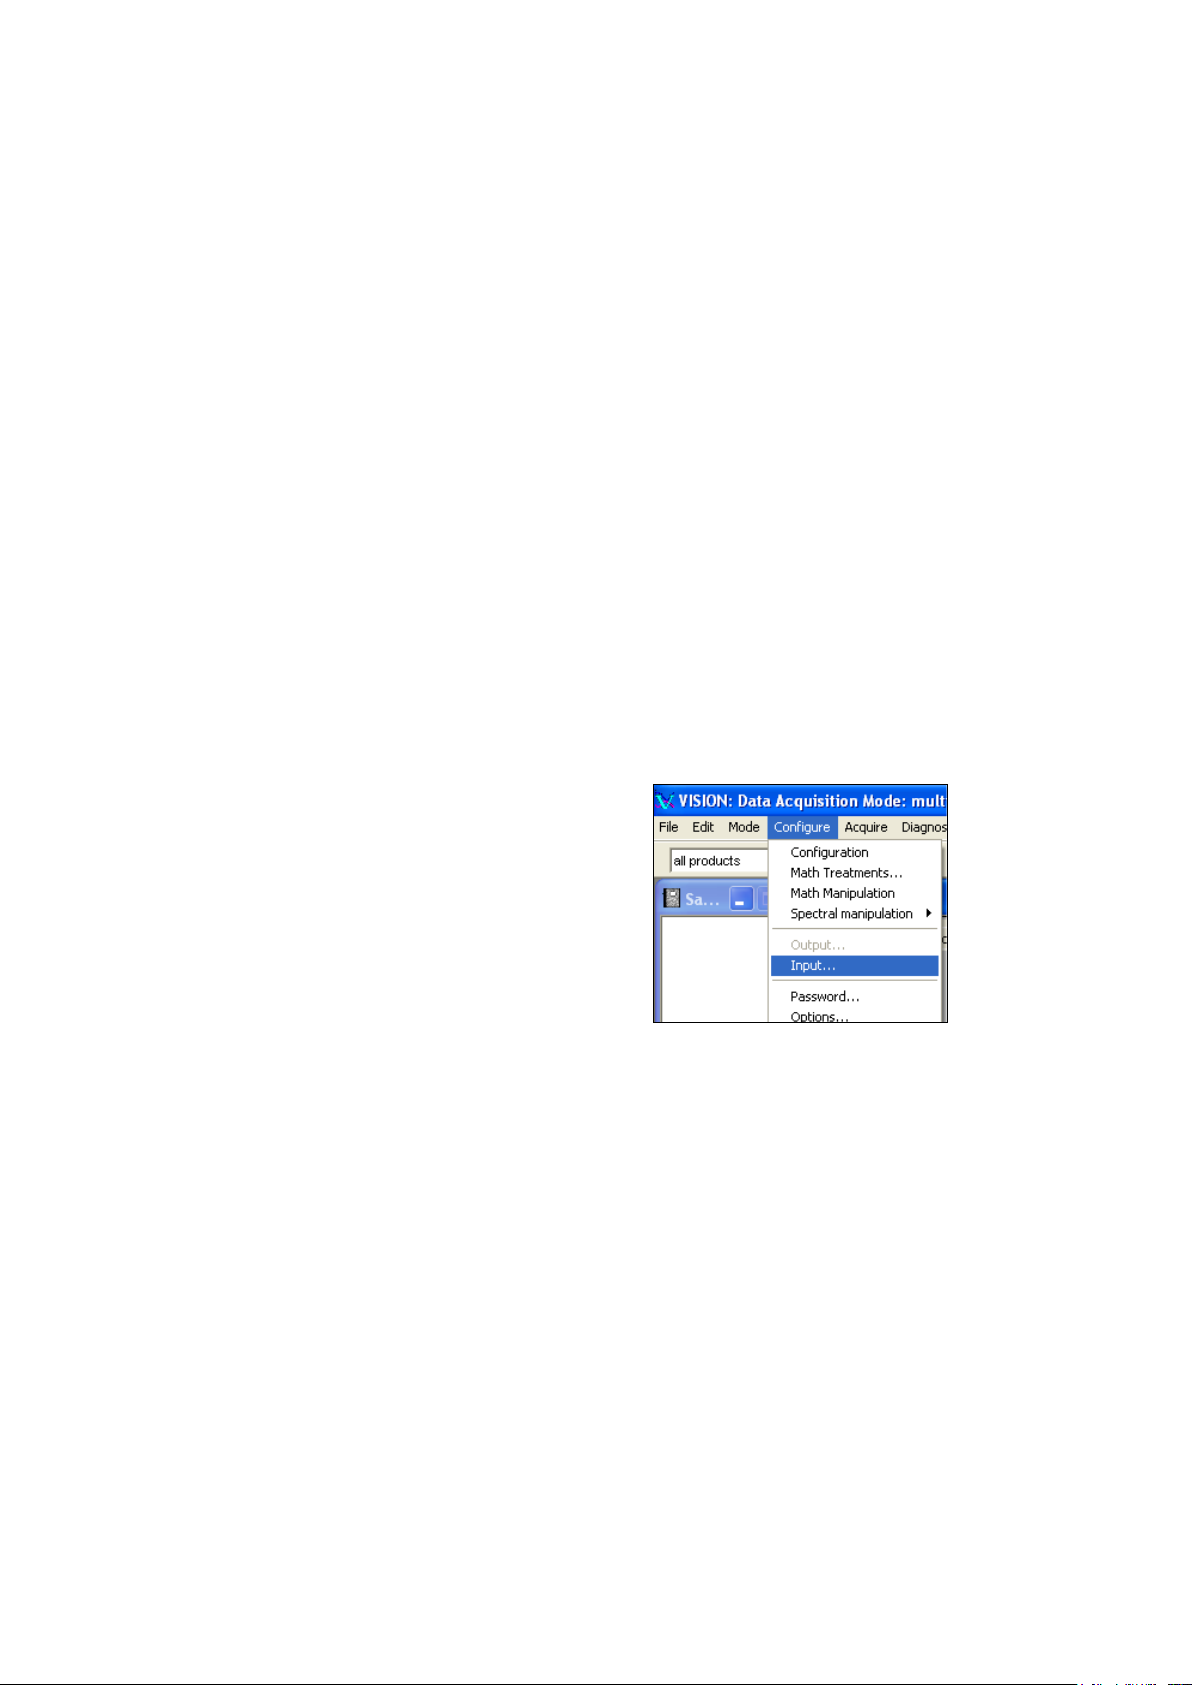
3.5 Connection in Vision
Password.
Click on Configure, Input as shown.
14
Page 17
▪▪▪▪▪▪▪
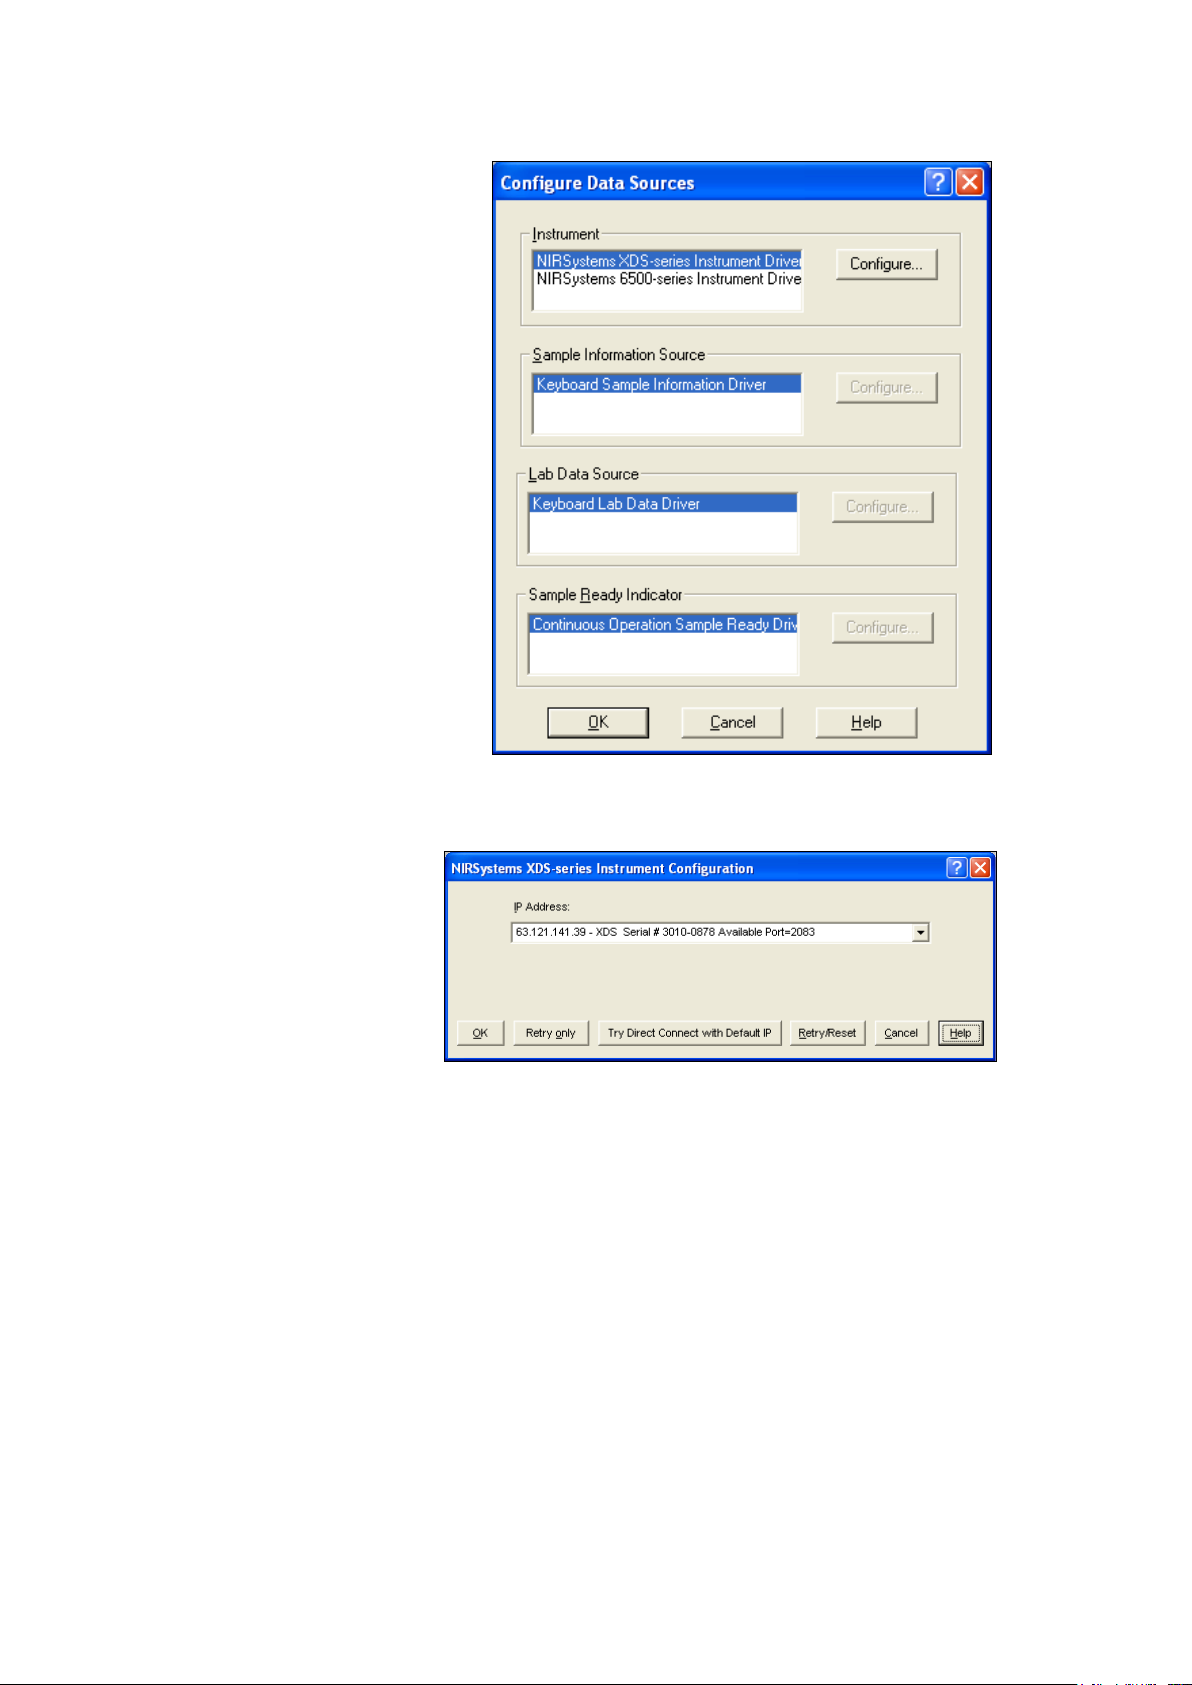
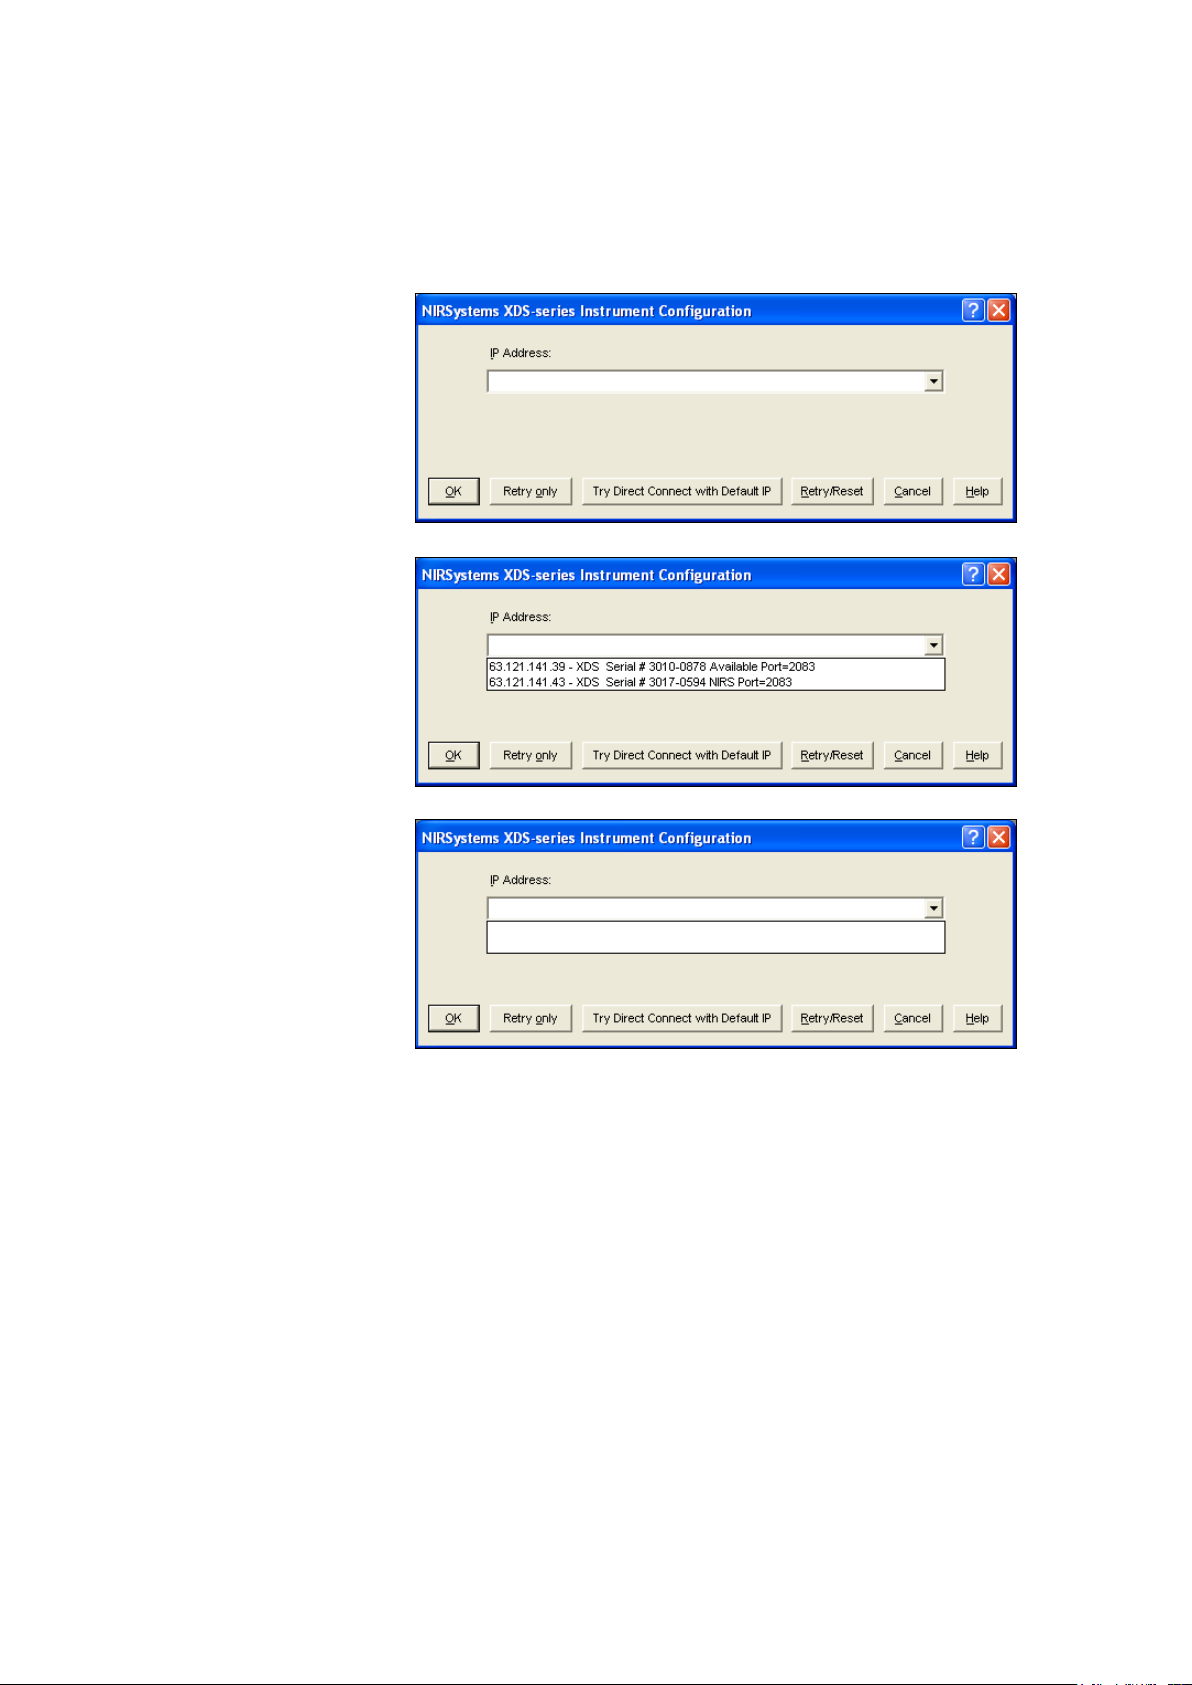
2. Highlight “NIRSystems XDS-
series Instrument Driver” as
3. When Vision “finds”
4. If the IP Address field is empty, the user should consult “Troubleshooting Connection
shown, then click on
“Configure”.
Information:
At this point, Vision requests any
XDS instrument on the local area
network (LAN) to report
connection status. This may take a
few moments.
If the instrument is not on a LAN,
and instead is connected with a
crossover cable, this will take a
minute or more. Vision first
requests a dynamic IP address, If
no server or router is available to
assign an IP address, Vision waits
45 seconds, then searches for the
default instrument IP address, in
the event of Direct Connection
using a crossover cable.
the instrument on the
LAN, it will be shown.
The dynamic IP
address (assigned by
Highlight the instrument and
click “OK”.
the server) is shown,
along with the XDS
Serial number. The
instrument is shown
as “Available” on port
2083.
Problems”.
3.6 Troubleshooting Connection Problems
Many connection problems are easily solved, especially with Windows® XP operating systems.
Windows XP is currently the preferred operating system, and has enhanced connectivity over other
operating systems. Vista is good also, but may impose user security restrictions. Windows 2000 is
almost as simple, but may require an extra step or two, as discussed.
15
Page 18
▪▪▪▪▪▪▪
1. Vision cannot see any
Solution: By expanding the
2. Vision still sees no
If your computer uses Windows 95, 98, or NT 4.0 for the operating system, we strongly recommend
upgrade to Windows XP for easiest connectivity. This may require a full computer upgrade, as older
computers may not have the processor speed, memory, or connectivity required to run Windows XP
with full Ethernet compatibility.
instrument on the
connection path.
Click on the “down
arrow” at the right
side of the empty field
to see if instrument(s)
are shown.
field, Vision can display the
instruments shown.
Note that only the top
instrument, Serial #30100878, is “Available”. Highlight
it and click “OK”.
instrument(s) after
expanding the field.
This indicates
connection or
network issues.
Verify Cable Type:
Verify correct cable type for hookup. Most networks use “patch” cables. Free-standing systems use a
“crossover cable”. Power down the XDS instrument, then power it back up. Wait 120 seconds for the
XDS instrument to fully reset its communication. If an instrument is shown, proceed to “Acquire”,
“Connect” in Vision.
If this does not resolve the problem, continue to the next section.
3.6.1 Network Troubleshooting Overview
If no XDS instrument shows as “available”, there may be a setting which should be changed. It may
be necessary to contact your IT department for assistance with these issues.
First, verify that the network has a DHCP Server. If no DHCP server is available, the instrument must
be connected by Direct connection, using a crossover cable. If this is the case, proceed to the section
entitled “Direct Connection Troubleshooting Overview”.
Network Solution 1:
16
Page 19
▪▪▪▪▪▪▪
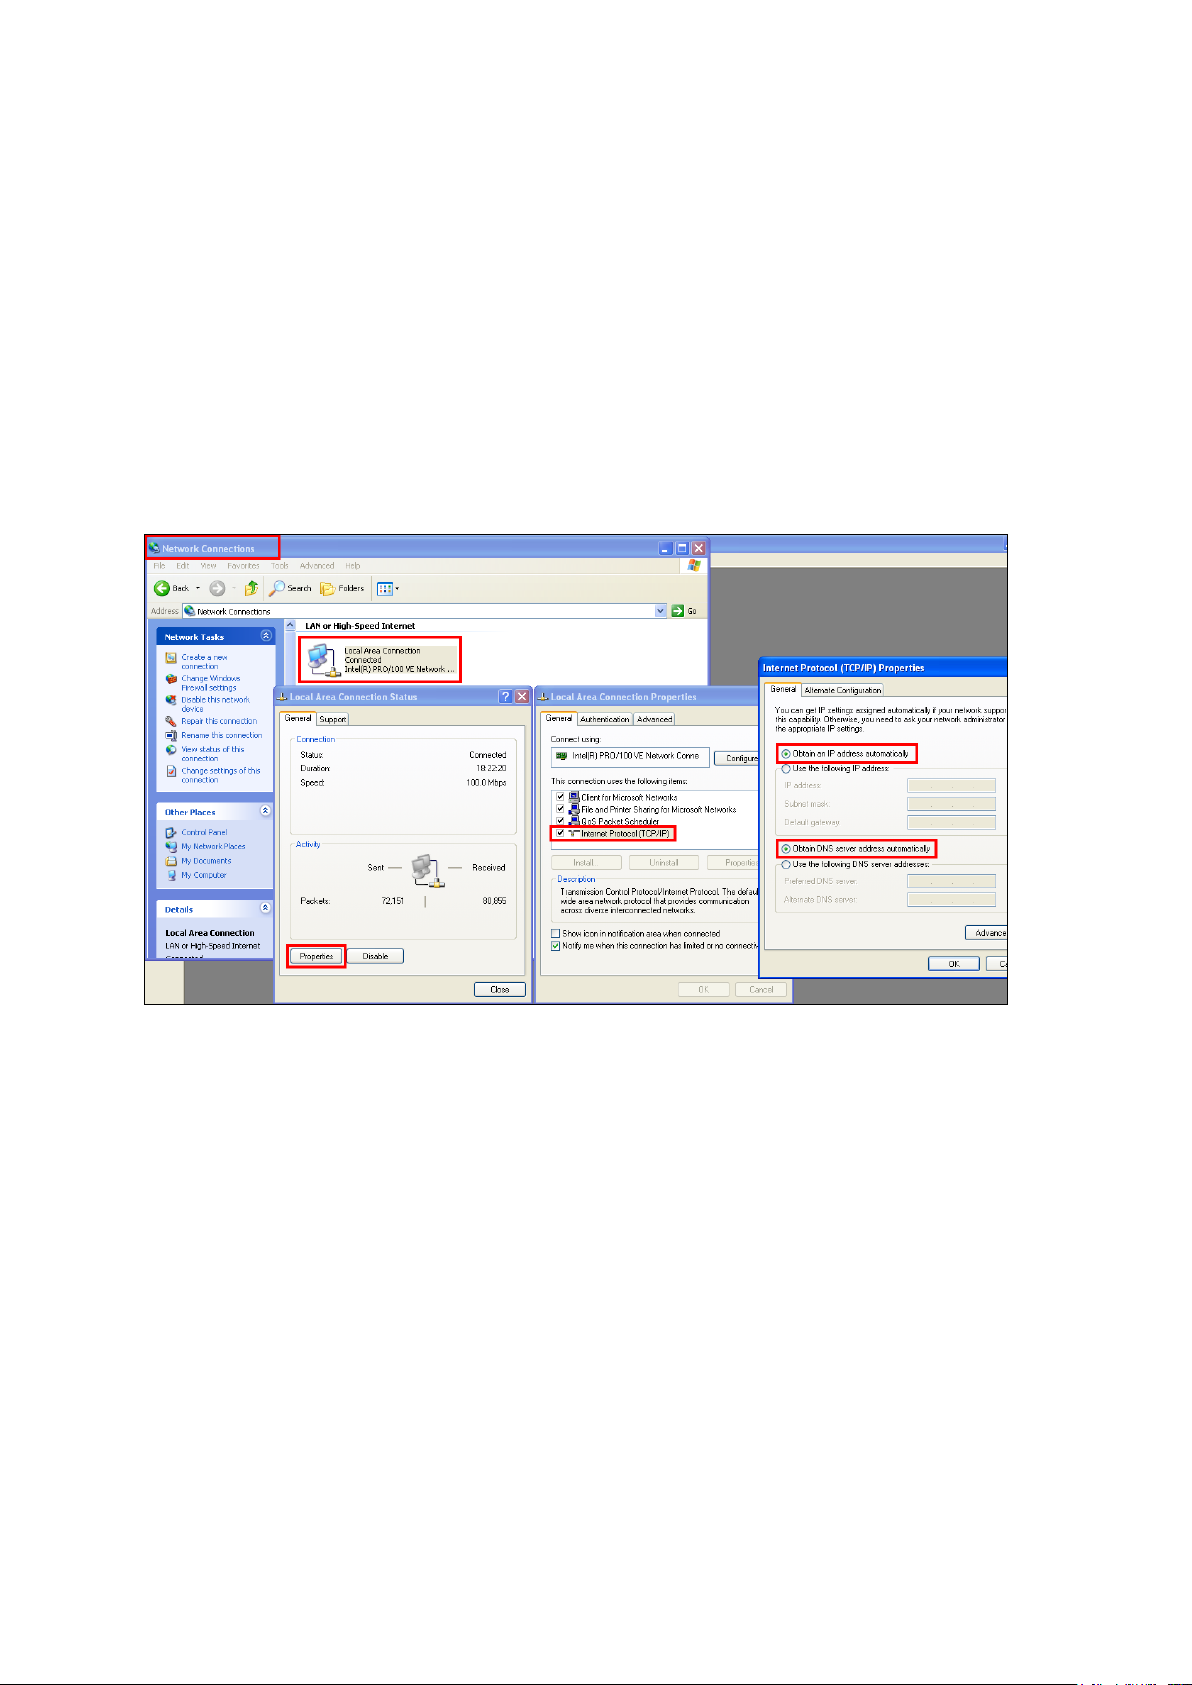
Check Internet Protocol (TCP/IP) Properties. (You may need to contact your IT department to follow
these steps.)
• Click on Start, then Control Panel
• Double-click on Network Connections
• Double-click on Local Area Connection
• Click on Local Area Connection Properties
• Click on Internet Protocol (TCP/IP)
• Click on Properties
The full path, from Network Properties forward to Internet Protocol (TCP/IP) Properties, is shown:
17
Page 20
▪▪▪▪▪▪▪
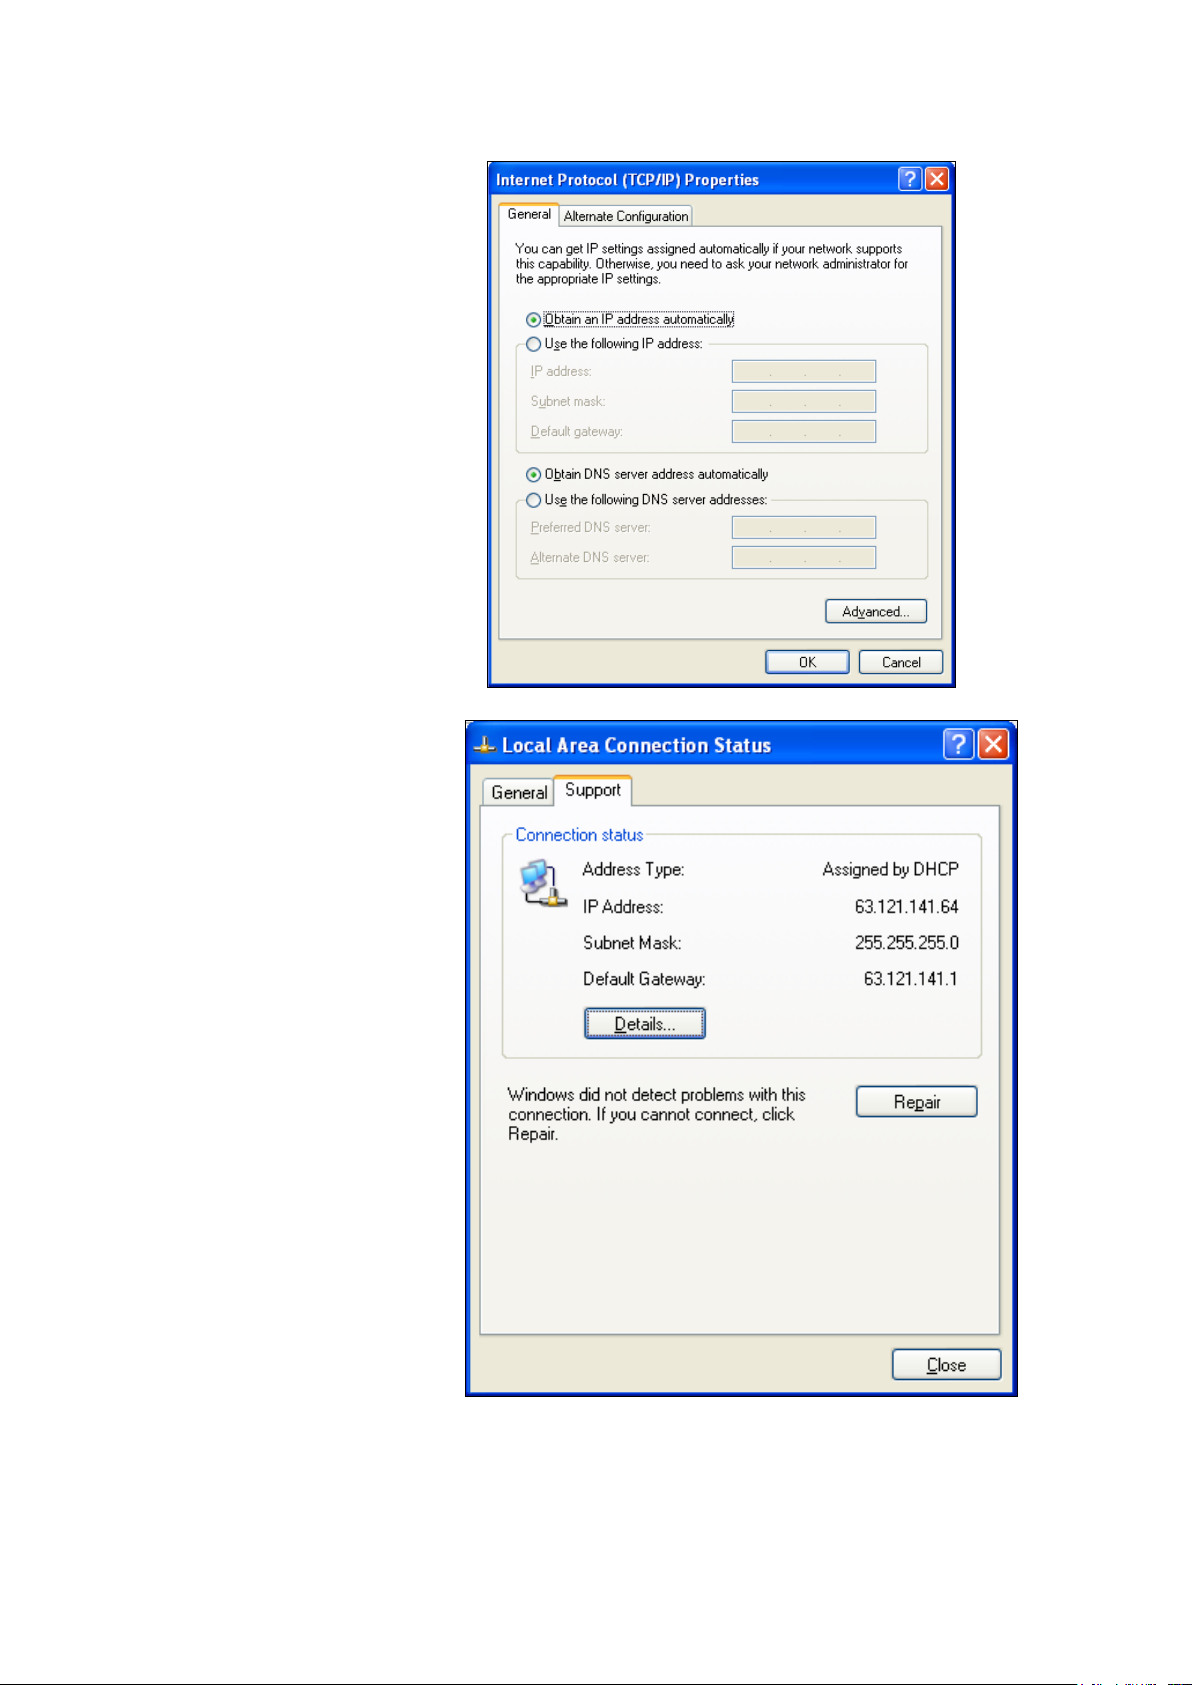
Verify these settings:
Network Solution 2:
• Obtain an IP address
automatically
• Obtain DNS server address
automatically
When finished, click “OK”. Close all
other boxes opened for this
verification.
If the settings were not set properly,
it may be necessary to exit Windows
XP, then re-enter XP, to have the
correct settings take effect. If in
doubt, do this and try XDS instrument
communications again after this takes
effect.
Returning to the Local Area
Connection Status dialog box, note
these items for the computer:
• Address Type:
(should be “assigned by
DHCP”)
• IP Address:
Write this address down for
the next step
• Subnet Mask:
Write this down for the
next step
If connection cannot be achieved,
it may be necessary to verify that
the XDS instrument is installed
“within the IP address range” of
the computer.
18
Page 21

▪▪▪▪▪▪▪
Network Solution 3:
The IT department at your company can verify if the network
Network Solution 4:
Network Retry, XP and
Verify network has full IPv4
compatibility.
Some networks have moved to
Ipv6 (Internet Protocol version 6)
which uses different address
formats.
Verify that the Firewall on the
computer has Vision loaded as an
“exception”.
This is located under “Control
Panel”, “Windows Firewall”.
If this is not enabled, click “Add
Program” and select “Vision” from
the list.
When finished, click “OK”
offers full Ipv4 compatibility. If the network has migrated to
Ipv6 operation, a “compatibility pack” may need to be
loaded to support Ipv4-enabled devices.
Vista:
Windows XP and Vista users
should click on “Retry
Only”. This command resets
the communication port,
and allows Vision to “find”
the instrument, if connected
properly.
19
Page 22
▪▪▪▪▪▪▪
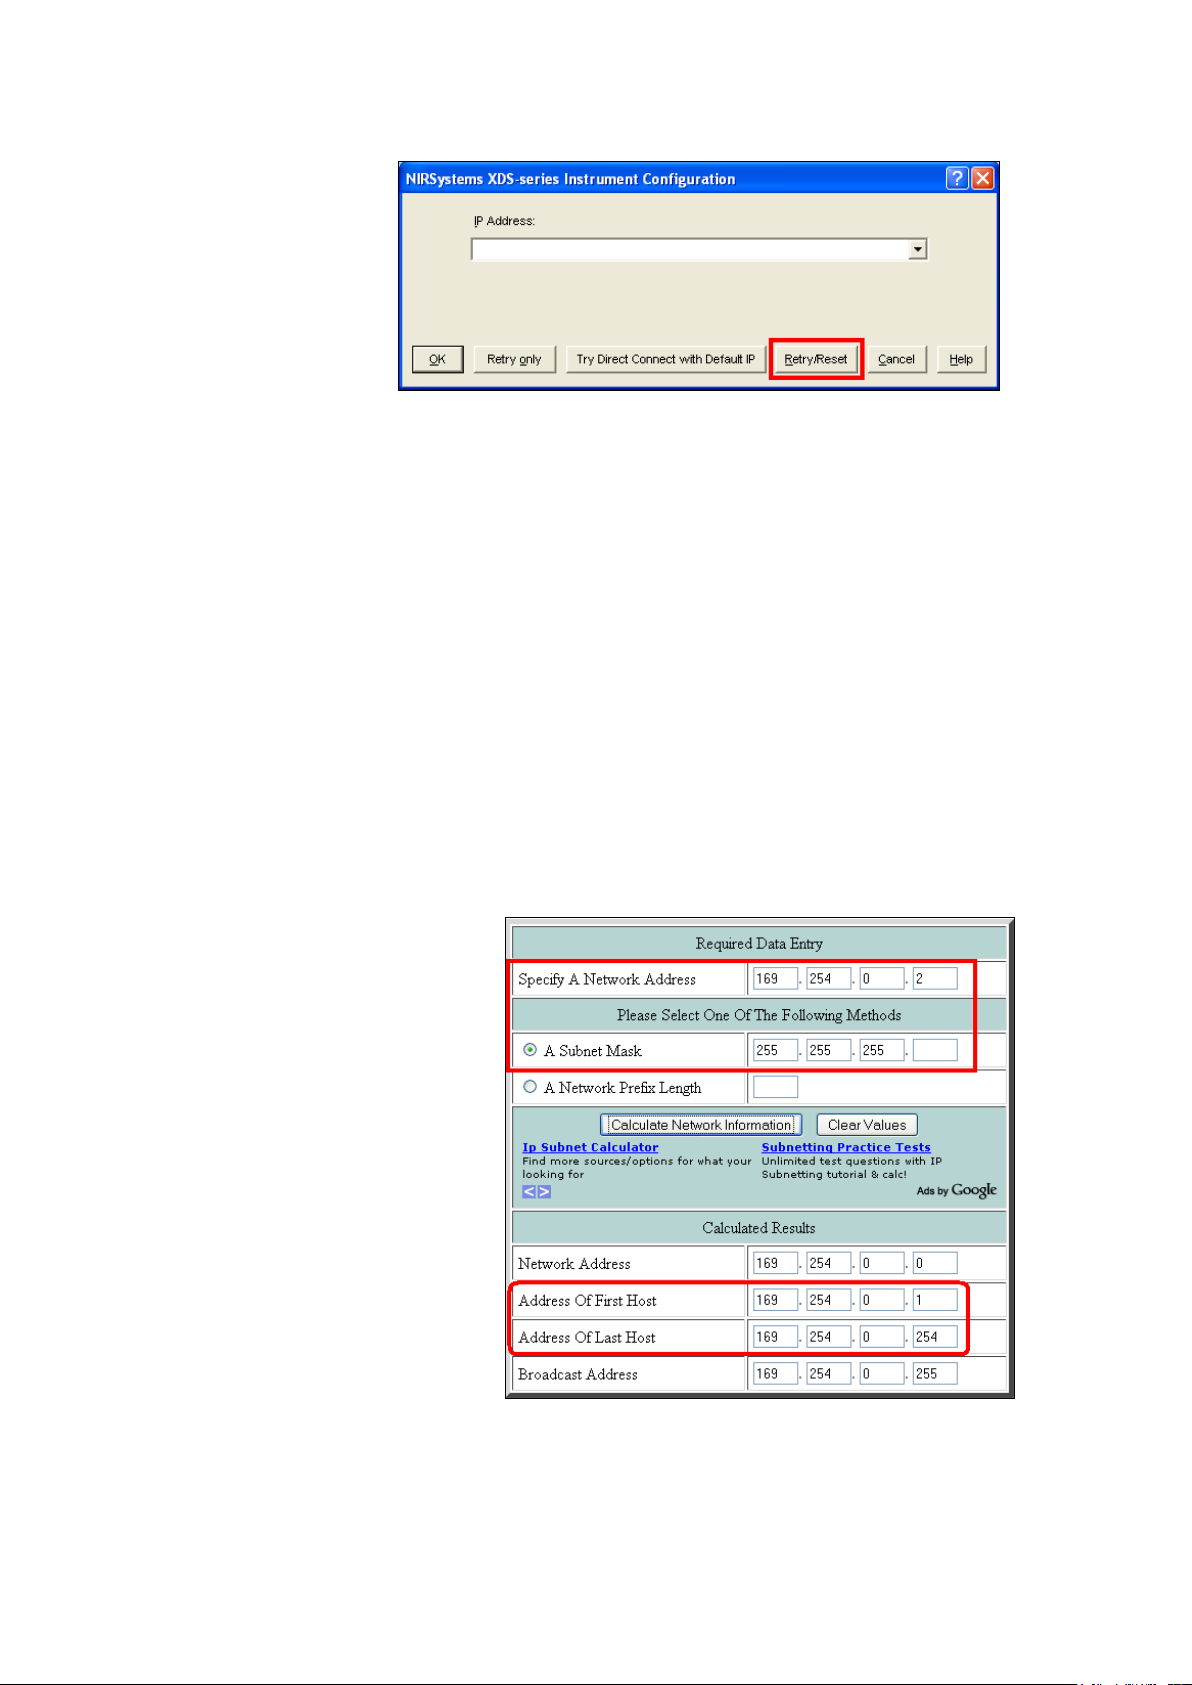
Network Retry, Windows
Direct Connection Solution 1:
2000:
Windows 2000 users should
click on “Retry/Reset”. This
command resets the
communication port, and
also resets Windows 2000
to the proper state to
connect using a dynamic IP
address in the XDS
instrument.
3.6.2 Direct Connection Troubleshooting Overview
If no XDS instrument shows as “available”, the computer may need to be configured for the IP
address range of the XDS instrument. It may be necessary to contact your IT department for
assistance with these issues.
First, verify the following:
• The instrument is free-standing not connected to a network with DHCP server
• There is only one network card in the computer
• A crossover cable is used between the XDS instrument and the computer
If these conditions are met, please proceed.
If using a crossover cable, verify that
the computer is communicating in the
same IP range as the XDS instrument.
The XDS instrument default IP address
is 169.254.0.2, as shown. This address
calculator gives the allowable computer
IP address range as 169.254.0.1
through 169.254.2.254.
DO NOT use 169.254.0.2 in the
computer!
Set the computer IP address to either:
• 169.254.0.1, or
• 169.254.0.3.
20
Page 23
▪▪▪▪▪▪▪
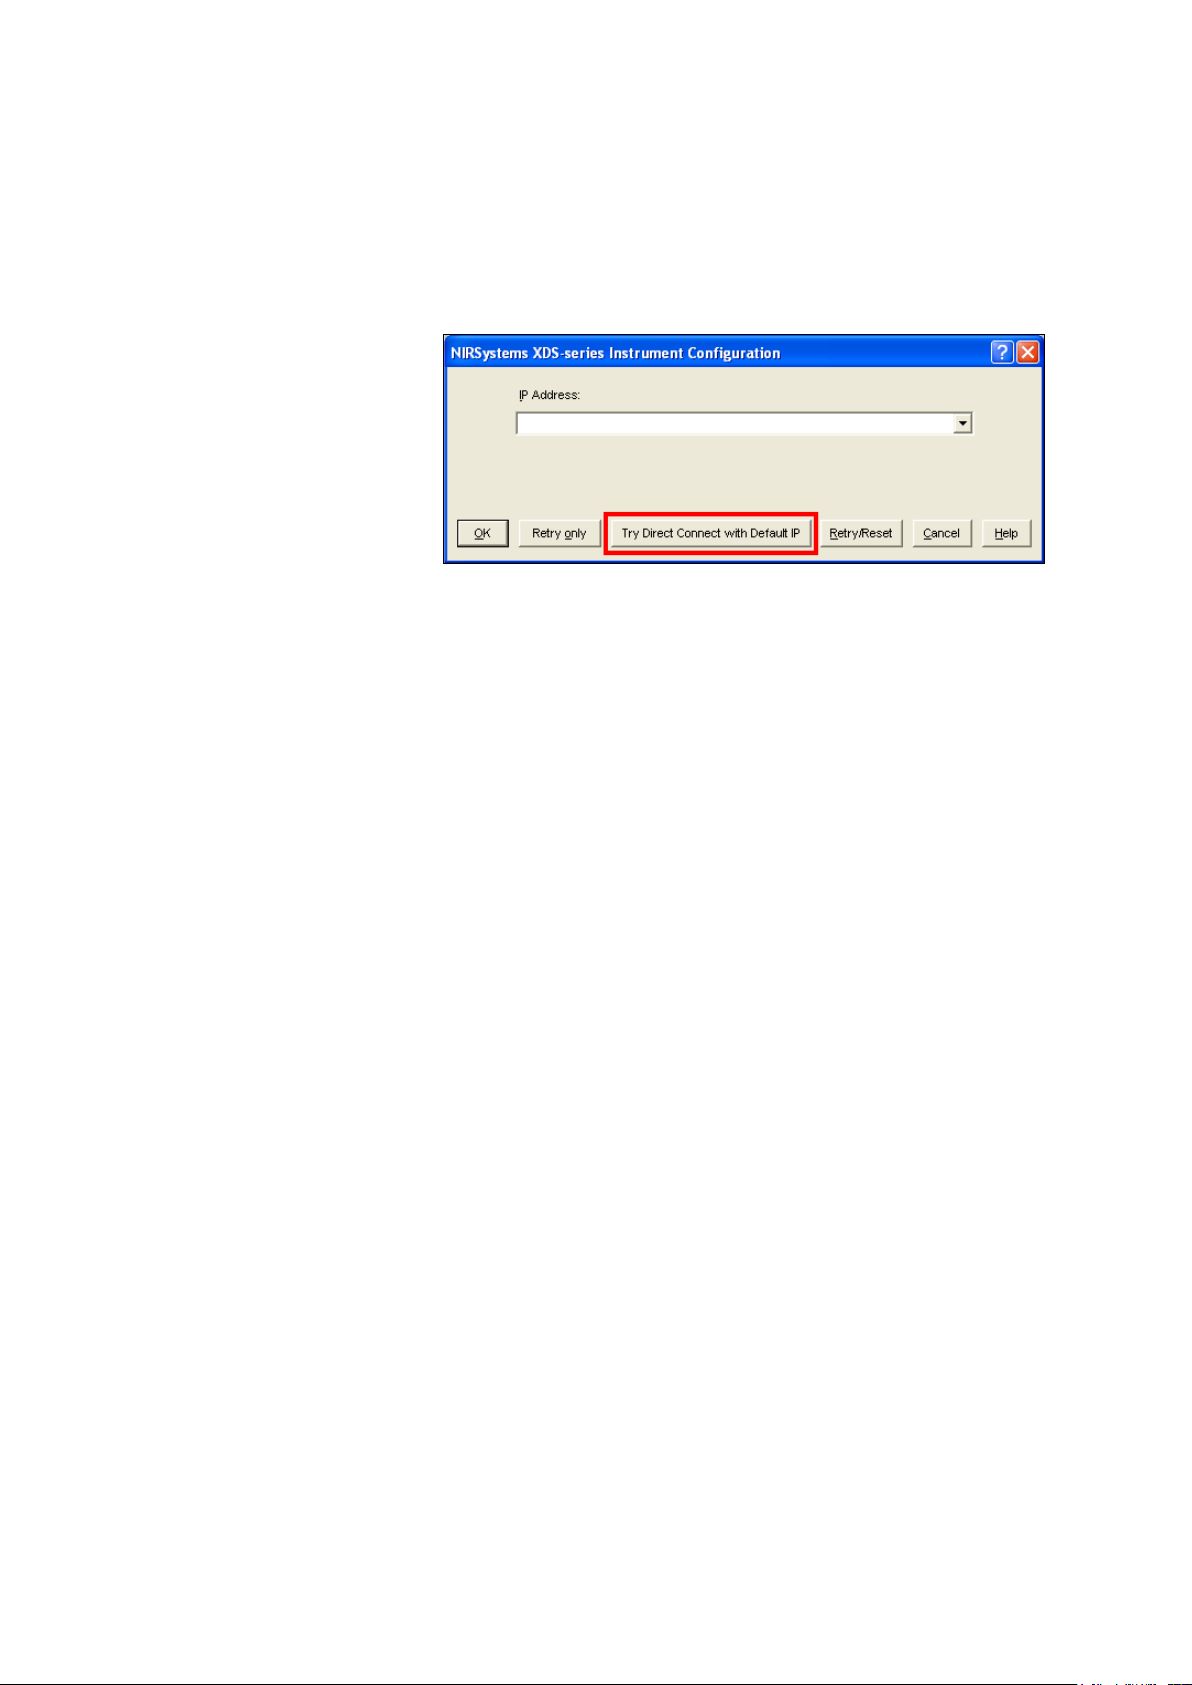
Direct Connection Solution 2:
Power down the XDS Instrument, then power it back
up. Wait 120 seconds, for the instrument to determine
Direct Connection
the correct method of Ethernet communication. Please
do not click anything for this amount of time, or
communication may be interrupted.
Solution 3:
Click on “Try Direct Connect
with Default IP”. This
searches for the default IP
address stored in the
instrument.
When the instrument is
found, click “OK”
This should resolve the connection issue. Proceed to “Acquire” and “Connect” in Vision.
21
Page 24
▪▪▪▪▪▪▪
4 Assembly of the Instrument
The XDS Analyzer will be assembled and installed by a trained representative of Metrohm. This
person will perform a full suite of diagnostics to verify correct operation, and will explain basic
operating points. Assembly information is given as a guide for the user, should re-assembly ever be
required due to an instrument move or for other reasons.
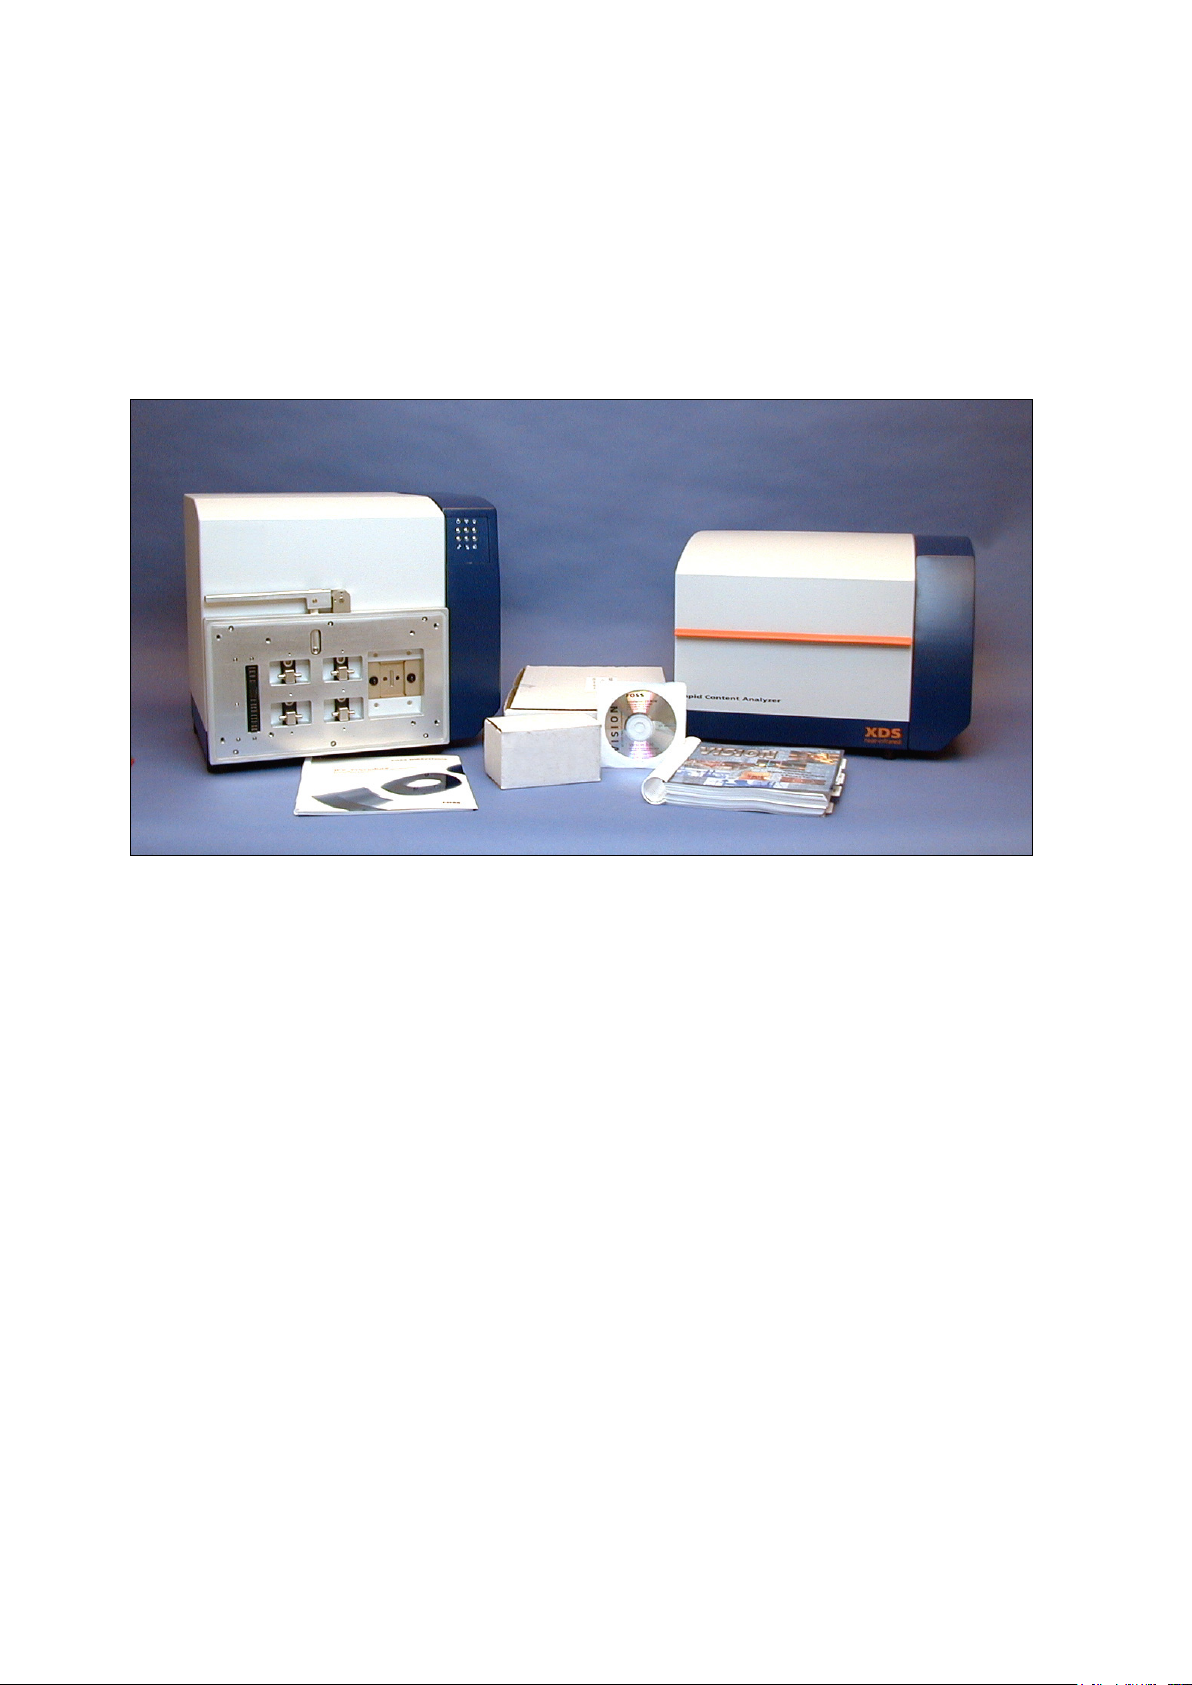
Verify that the following items have been received in good condition:
• Metrohm XDS Monochromator
• MultiVial module
• Vision Spectral Analysis Software (Vision Manual is on CD)
• Spare Lamp
• Accessory Kit, containing cords, cables, standard tray, and other required items
• Safety Manual for CE certification
• Instrument Test Results Packet
(Packaging of items may vary from that shown.)
The serial number of the instrument and module are located on serial plates on the left side, when
facing the instrument. These serial numbers should match the serial numbers marked on the shipping
papers.
When using Vision software, the software will automatically read the monochromator serial number.
The module serial number must be entered manually, and is located on the module serial number
plate on the left side of the module, facing the instrument.
22
Page 25
▪▪▪▪▪▪▪
DO NOT OPERATE OR TROUBLESHOOT WITH THE LID OPEN. SUNLIGHT MAY CONFUSE
1
2
Place the monochromator on the lab bench
3
Open the right-hand panel of the
THE OPTICAL INTERRUPTERS USED TO POSITION THE SAMPLE CARRIAGE. THIS MAY
CAUSE AN “X-Y POSITIONING ERROR” TO BE REPORTED.
Follow the assembly sequence that begins on the next page:
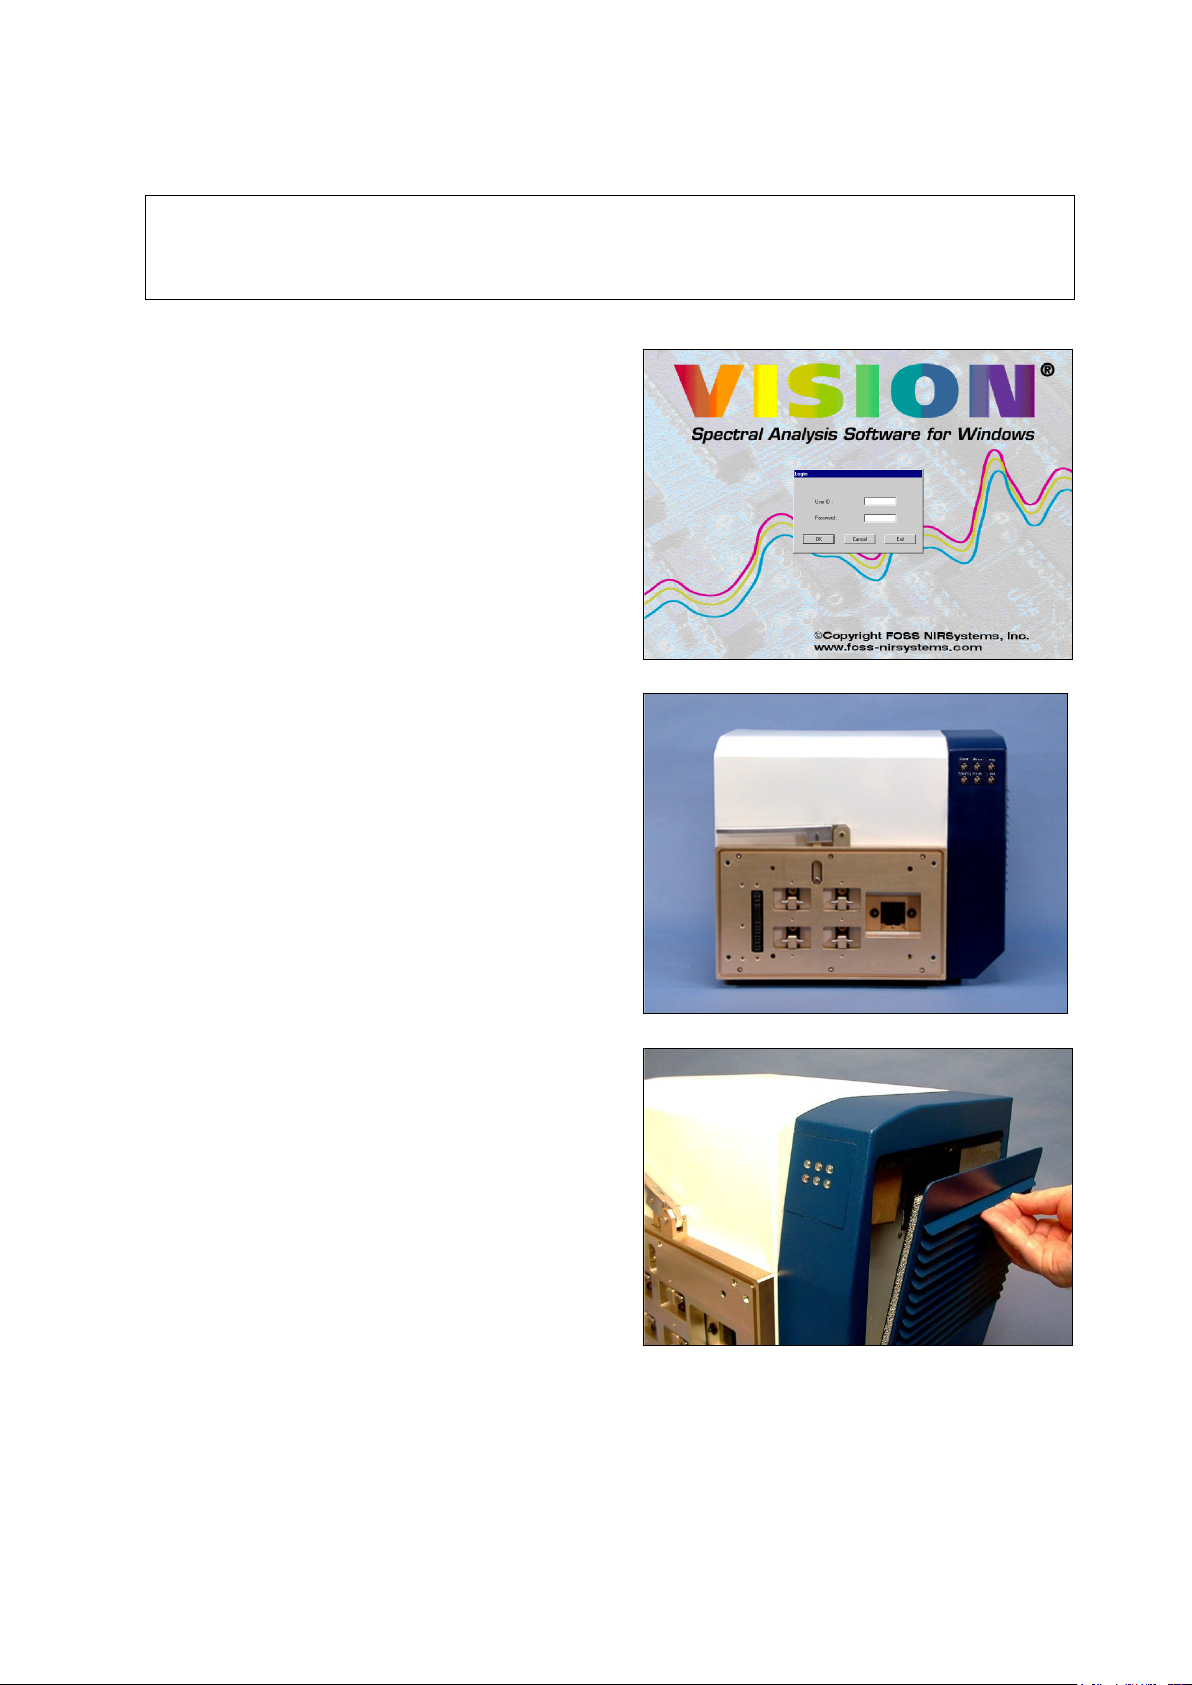
Load Vision Spectral Analysis Software onto
the computer designated to operate the
XDS instrument.
in the position shown.
instrument. Pull it gently by a fin, until the
catch releases. This panel opens to about a
45-degree angle for access to connectors,
and for filter inspection. Avoid scratches or
damage.
23
Page 26
▪▪▪▪▪▪▪
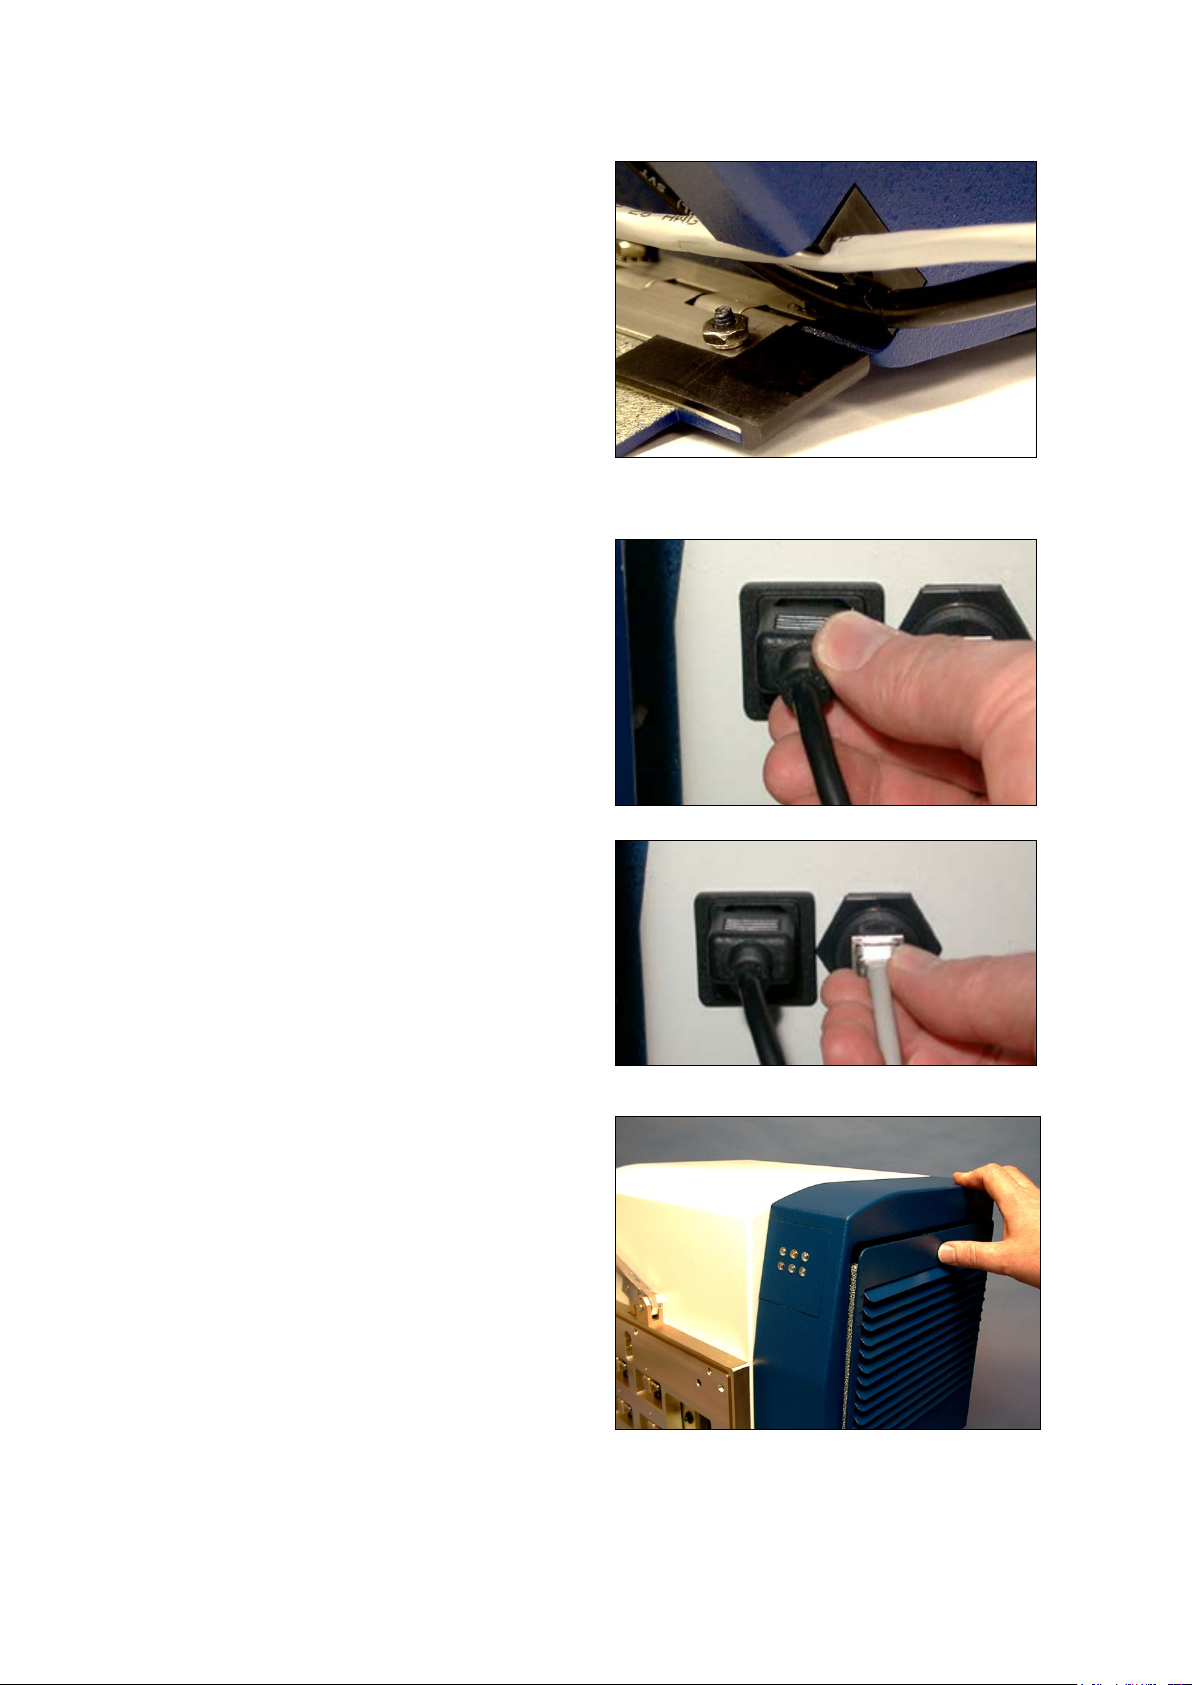
4
Gently thread the AC power cable and
5
Insert the AC power cable into the AC
6
Attach the RJ-45 cable to the network
network cable through the lower right
corner of the instrument access area as
shown.
The cables should snap into the black
holder. The innermost position is large, to fit
the power cord. If the power cord is in the
wrong location, the door may not close
fully.
The network cable may go into either of the
other two locations.
power block as shown.
connector on the instrument. If using Direct
Connection, use the gray cable from the
instrument accessory kit.
If using network connection, do not use the
gray cable, as it is a “UTP crossover” cable
and will not work with a network. Use a
network cable as described in section 3.0.
7 Close the outer cover of the instrument.
Push gently to the final closed position. It
should latch securely.
24
Page 27
▪▪▪▪▪▪▪
8
Position the sampling module directly in
front of the monochromator.
9
Lift the release handle on the
10
When the catches are fully engaged to the
11
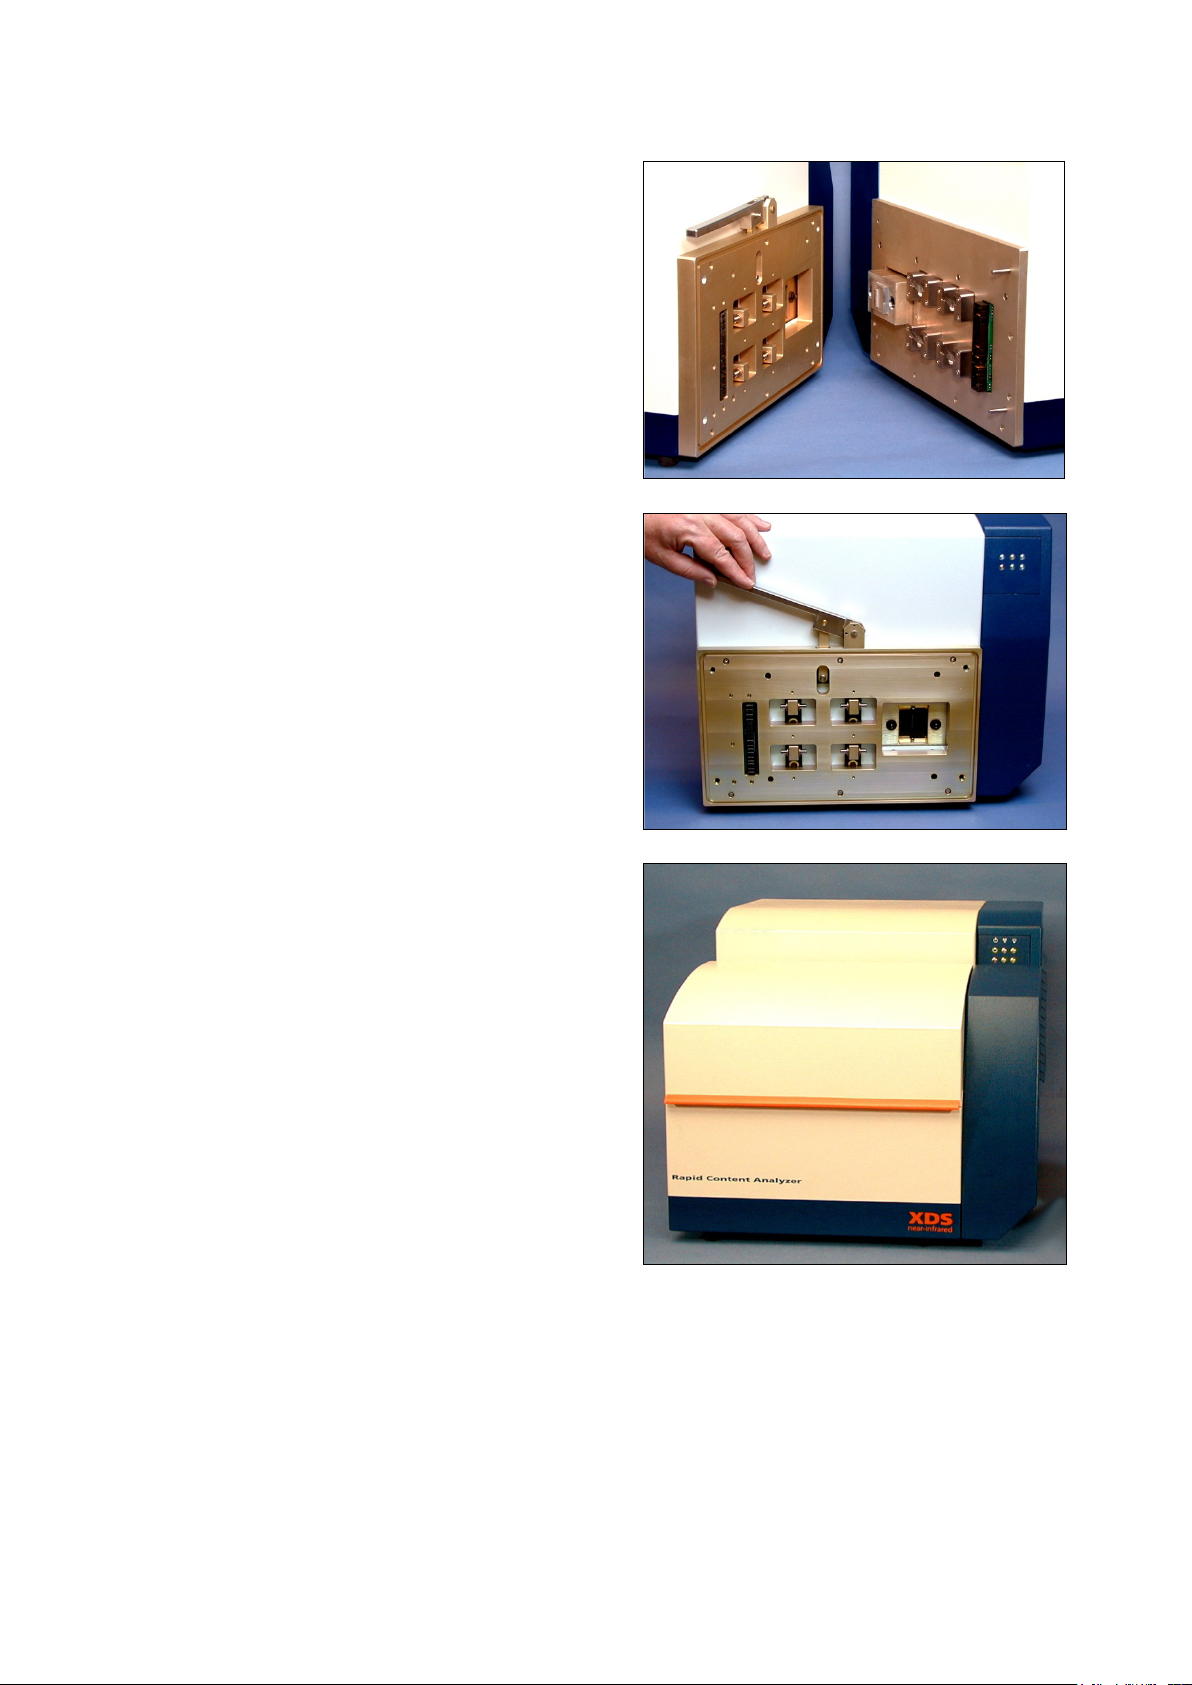
Plug the AC power cord into a grounded AC outlet. A surge protector or Uninterruptible
This photo shows the mating connection
plates, prior to final alignment and
assembly. The locating pins help find the
final position.
The latches are used to lock the module in
position.
monochromator and engage the module
“catches” to the locking togs on the
monochromator. (Module not shown to
allow a good view of handle.)
Push monochromator and module together
firmly (with handle up) then lower the
release handle.
locking togs, push the release handle down
all the way.
This automatically engages the electrical
connector and fiber optic interface, and
maintains proper alignment of the module
to the instrument.
The final assembly is as shown.
Power Supply (UPS) is recommended for best operation.
25
Page 28
▪▪▪▪▪▪▪
12
If using a network, use a non-crossover type
13
When all the above assembly is finished,
14
Prepare to establish communication from
cable as listed in section 3.0. Plug the RJ-45
network connector into a functional network
port.
If this requires approval from a network
administrator, it should be properly approved
for hookup.
For “Direct Connection” the gray cable from the
instrument plugs directly to the computer
network jack. (Use the cable supplied with the
instrument.)
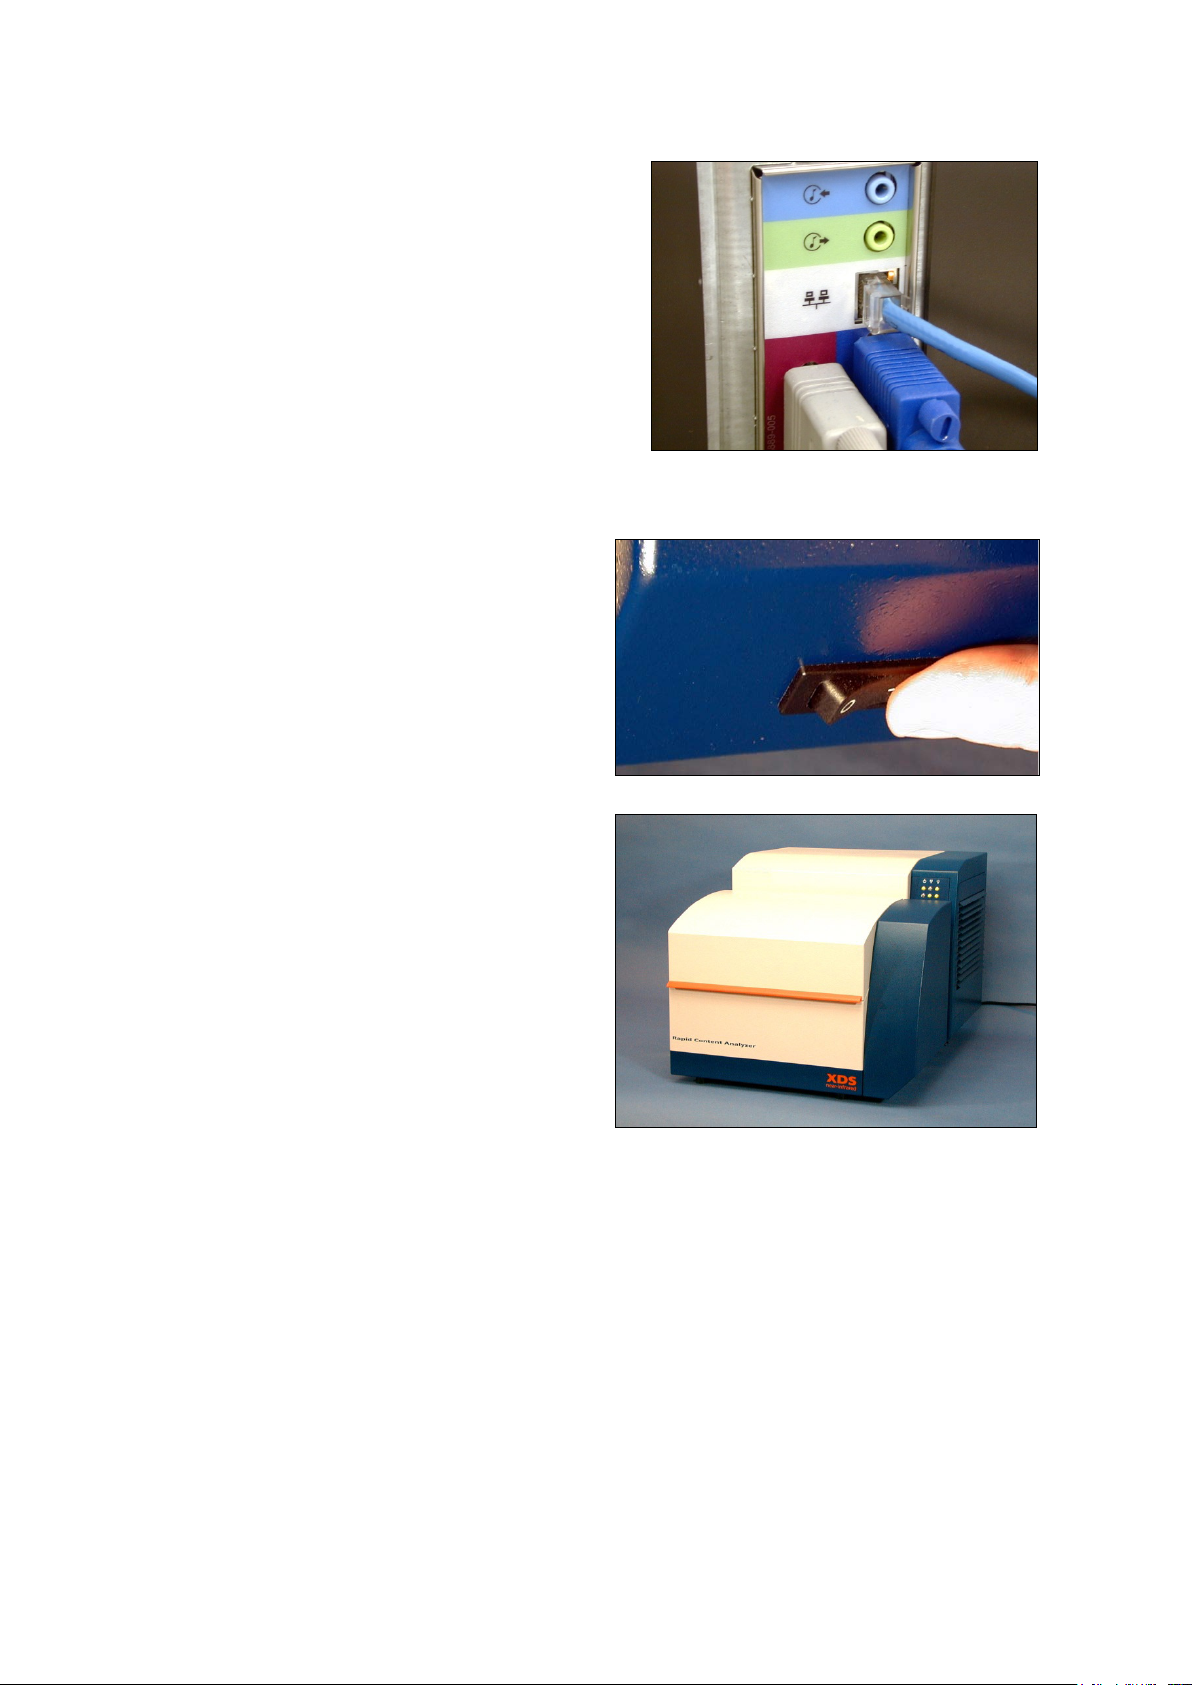
turn on the power switch on the
monochromator. It is located on the lower
surface, on the right-hand side as shown.
The monochromator performs some
initialization tests, which take a moment.
Some noises will be heard as items find their
initial positions. This is normal.
Vision to the XDS instrument. This is
detailed in Section 6.0, Vision Software.
This completes assembly of the MultiVial Analyzer.
26
Page 29
▪▪▪▪▪▪▪
5 XDS MultiVial Module
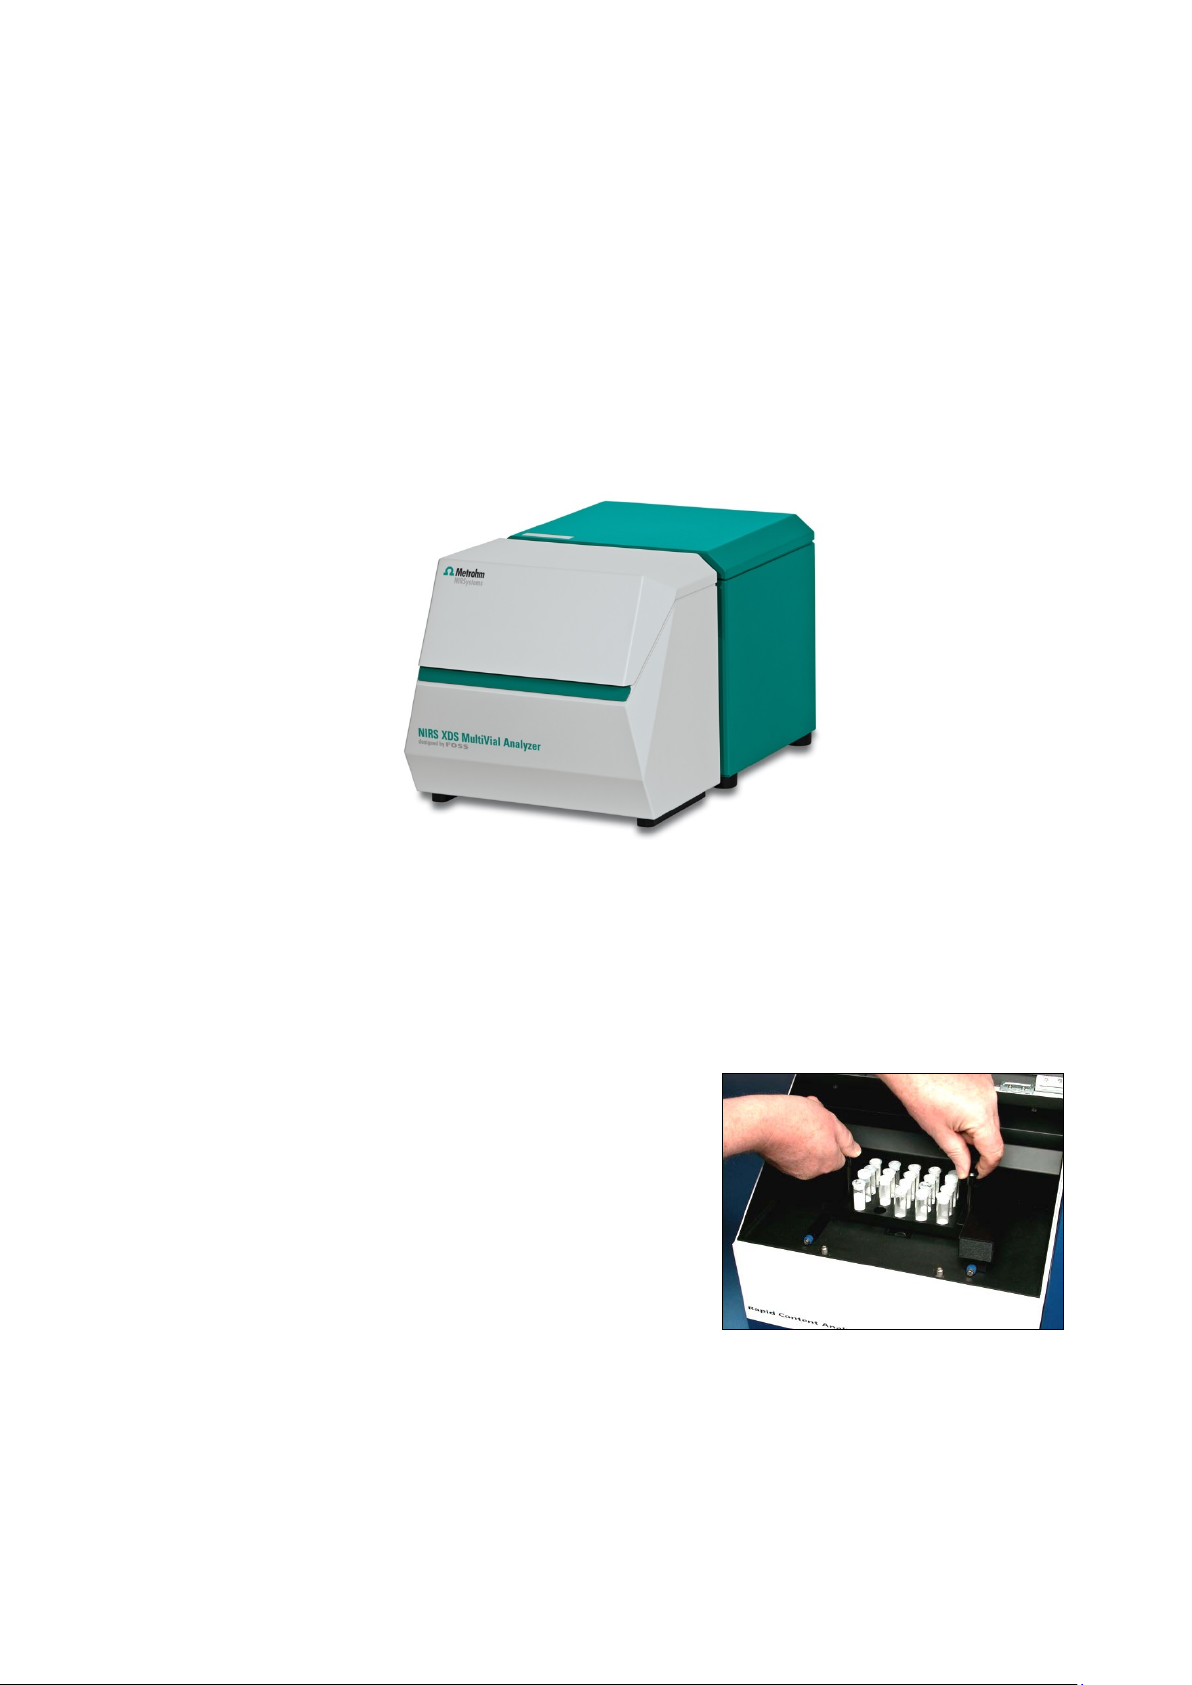
The MultiVial Analyzer is designed to provide
The XDS MultiVial Analyzer is primarily designed for vial sampling, which is the focus of this manual.
Optional sampling devices are available, and are also described following the vial information. For
optional sampling accessories, please contact your Metrohm NIRSystems distributor.
5.1 Introduction to Vial Analysis
sampling for trays of vials, like that shown at
right. This provides for a greater degree of
automation, and permits the operator to
perform sample loading and other duties while
one rack is being scanned by the instrument.
This extends the usefulness of the instrument
into a routine analytical tool, since no operator
input is required, once the sample information
is entered and the rack is in place. Spectral
information for each vial is acquired and
stored, and the calibration or library
identification is automatically applied.
Partial racks may be run, and the order of scanning determined by the user. Vision provides easy
graphical tools to make setup easy and accurate. No special software skill is required to set up the
instrument for routine analysis, once the calibration is in place.
Because the MultiVial may be used with different size vials, Vision accommodates setup by offering a
screen to help define the tray dimensions, including vial spacing. The number of columns and rows of
vials is entered, along with the manufacturer’s nominal diameter and tolerance. Vision takes this
information and provides centerline data for each bored hole in the tray, which can be used for
machining.
There are four default vial sizes set up in Vision, for commonly-used vials. The 15mm vial diameter is
shown as an example:
The setup screen for sampling is straightforward and easy to use. An example is shown:
27
Page 30
▪▪▪▪▪▪▪
From the menu bar, select Configure, Tray.
Step by step instructions are given later in this manual. Please see Section 6.2 for full information.
It is important that the “spot size” adjustment be set up properly for a given vial size. This is also
covered in the section on Vision. Normally spot size should be no larger than 80% of vial size.
However, this is not pre-set, as users may wish to scan a smaller area.
5.2 Creation of a Custom Vial Size
Most users will work with one of the standard vial sizes offered. However, for setup of custom sizes,
this information is provided. To create a custom vial diameter, follow these steps:
28
Page 31

▪▪▪▪▪▪▪
At the Select Tray Dialog box, note that four
sizes (vial diameters) are already loaded in
A “Tray ID” must be assigned.
In this case, the vial diameter
Vision. (Other sizes may be added over time.)
NOTE: The spot size (set in the Data Collection
Method) should be no larger than 80% of the
vial diameter. For each default vial size, set spot
size as follows:
• 15mm vial: 12mm spot size
• 19mm vial: 15mm spot size
• 25mm vial: 17.5mm spot size
• 29mm vial: 17.5mm spot size
If your vial diameter is not shown, ignore the
default sizes. Click “New”.
This brings up the Tray Configuration Dialog
box shown below.
The normal convention is to
use the diameter, then the
number of vials in a row, and
a column.
You may use your own
naming method, of course.
The shortcut to this screen is
shown below.
is 22mm.
Enter “22” for Vial Diameter.
Click on “Number of Vials”.
Vision calculates the
maximum number of vials per
tray. IN this case, 8 may fit on
the tray. Vision fills in the
number of vials per row and
column.
Click “More”.
29
Page 32
▪▪▪▪▪▪▪
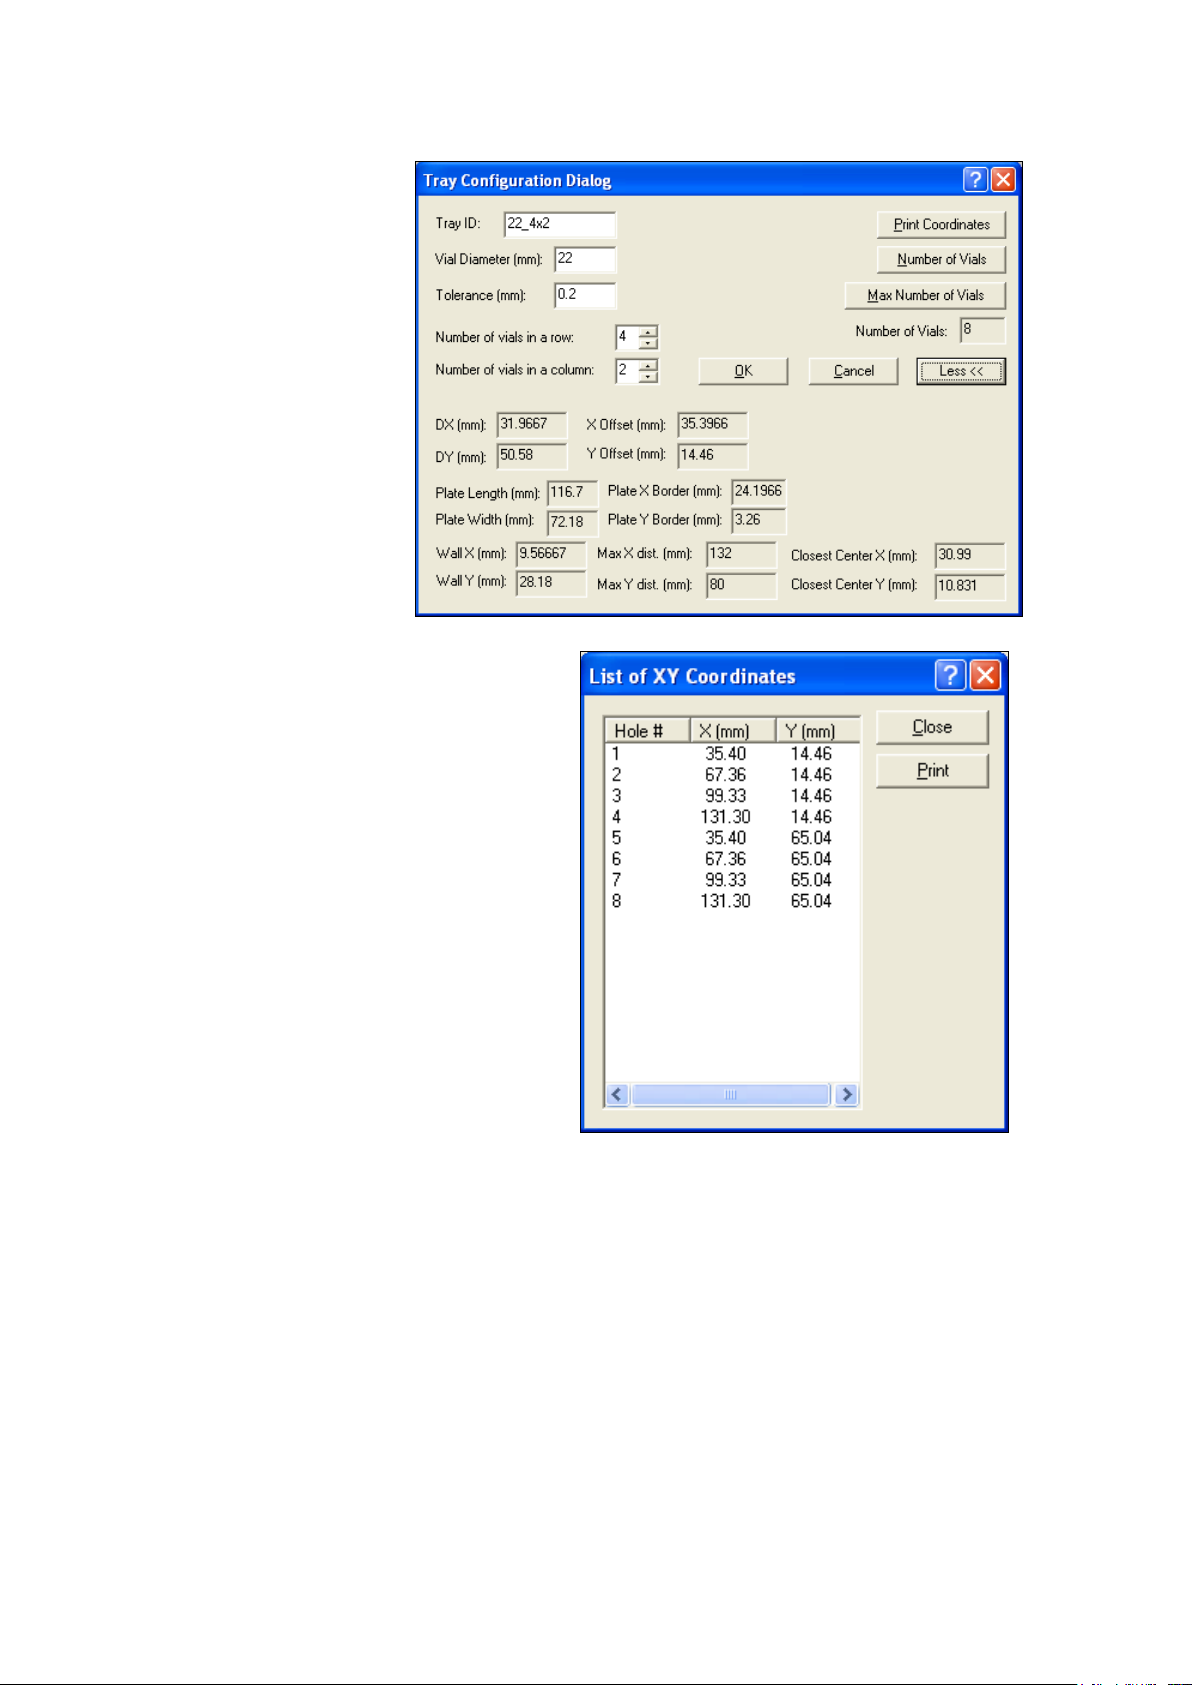
Upon selection of “More”,
These dimensions are the center of each vial
Vision shows key dimensions
of the tray, needed for
fabrication.
Click on “Print Coordinates”
to see additional dimensions.
opening in the tray. Vision uses these
coordinates to position each vial during
sampling.
Note that there are other important
dimensions, including the vial “support ledge”,
and the flatness of the final tray. Because the
fabrication is critical to repeatability, Metrohm
NIRSystems does not recommend local
machining.
Please contact your Metrohm NIRSystems
Distributor for ordering information.
You will need to supply both screens shown, as
the final tray will be machined to these
specifications.
A charge applies for each custom tray supplied.
5.3 Spot Size Adjustment
The MultiVial Analyzer offers spot size adjustment, which permits the user to set the relative size of
the illumination beam that strikes the sample. This is useful for small objects such as 15mm vials
(about 5ml volume), tablets, and other small-diameter materials. The instrument energy is focused
into a smaller area, providing better intensity within the area of interest. This generally provides
improved signal-to-noise on small samples. In the Data Collection Method (DCM) shown below, the
spot size is entered as 12mm, for a 15mm vial.
NOTE: The spot size (set in the Data Collection Method) should be no larger than 80% of the vial
diameter. For each default vial size in the Select Tray Dialog box, set spot size as follows:
• 15mm vial: 12mm spot size
30
Page 33

▪▪▪▪▪▪▪
• 19mm vial: 15mm spot size
• 25mm vial: 17.5mm spot size
• 29mm vial: 17.5mm spot size
As a rule, a large spot size is preferable for large samples. This provides as much sample viewing area
as possible for a good cross-sectional area of the sample. The default spot size is 17.25mm.
31
Page 34
▪▪▪▪▪▪▪
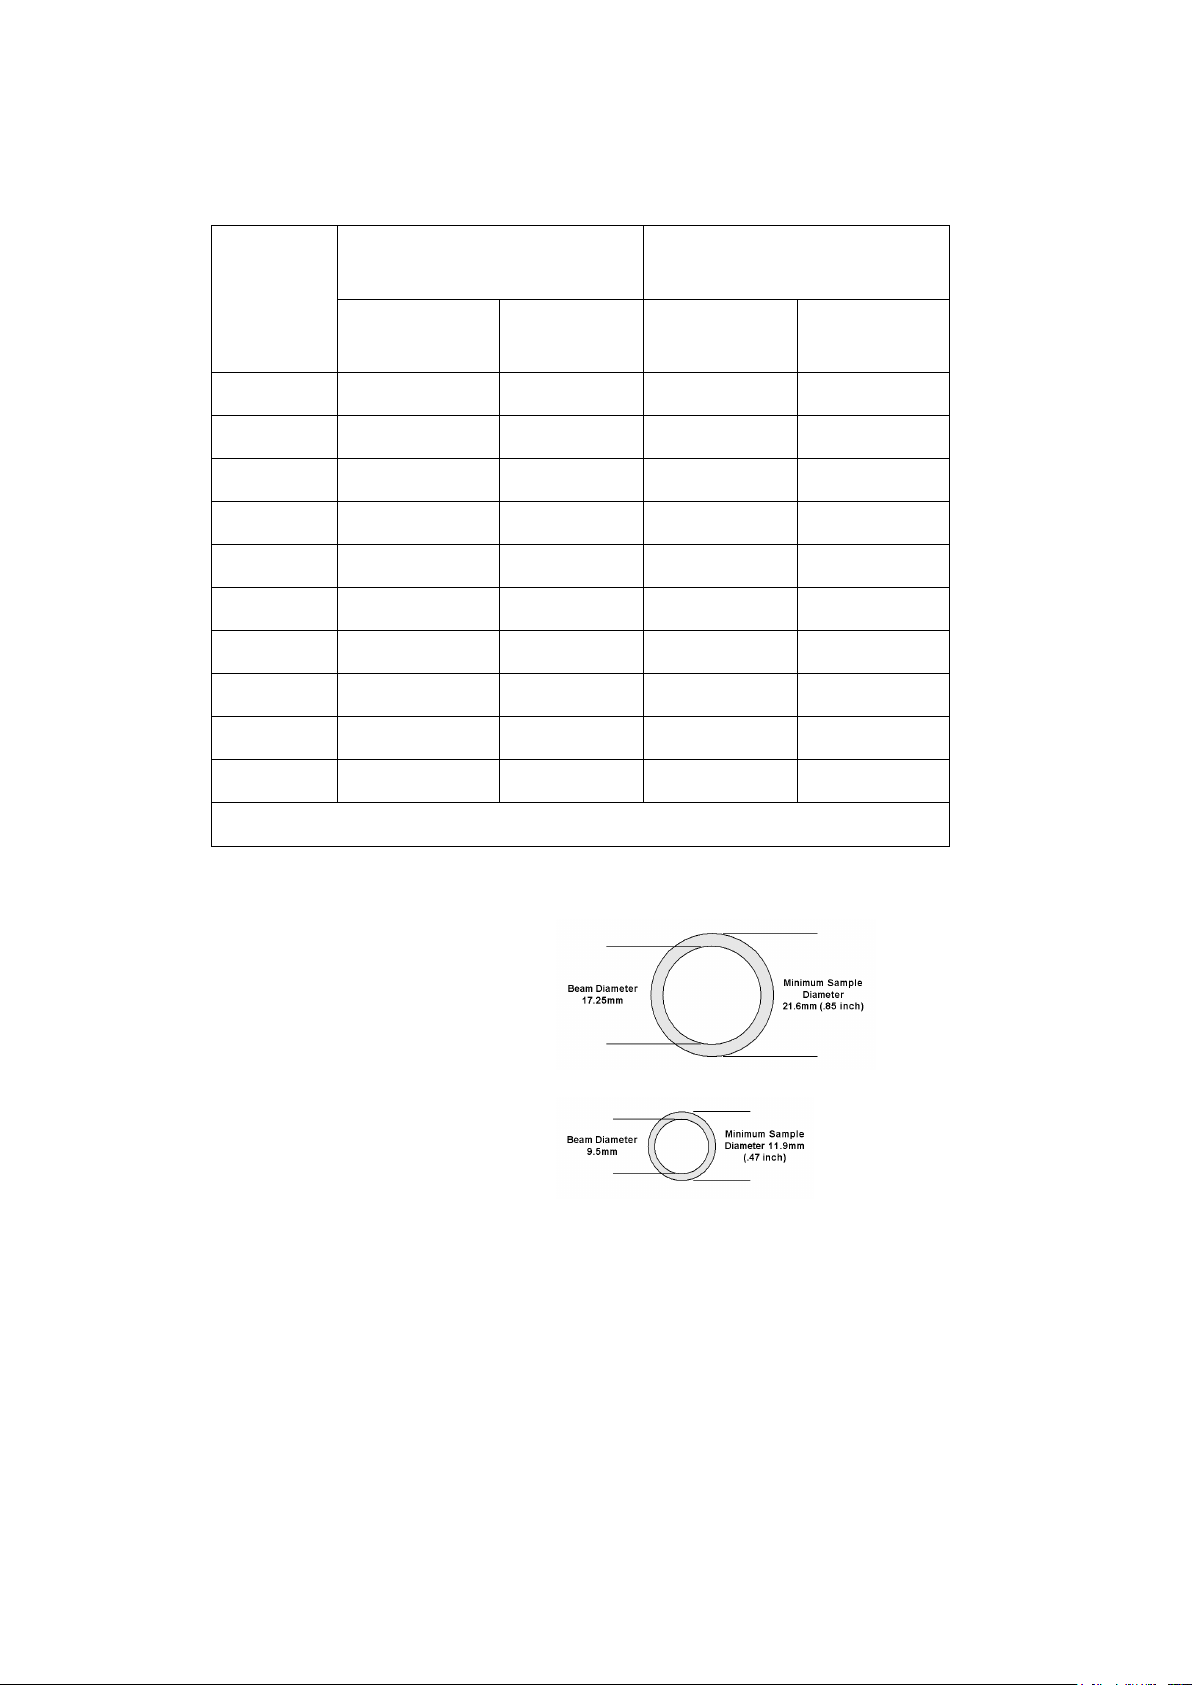
Spot Size
Minimum Sample
Scanned Sample Area
Diameter
Diameter
Square mm
Sq. Inches
9.5 mm
11.9 mm
0.47 in.
70.9 sq. mm
0.11 sq. in.
10 mm
12.5 mm
0.49 in.
78.5 sq. mm
0.13 sq. in.
11 mm
13.8 mm
0.54 in.
95.0 sq. mm
0.15 sq. in.
12 mm
15.0 mm
0.59 in.
113.1 sq. mm
0.18 sq. in.
13 mm
16.3 mm
0.64 in.
132.7 sq. mm
0.21 sq. in.
14 mm
17.5 mm
0.69 in.
153.9 sq. mm
0.25 sq. in.
15 mm
18.8 mm
0.74 in.
176.7 sq. mm
0.28 sq. in.
16 mm
20.0 mm
0.79 in.
201.1 sq. mm
0.32 sq. in.
17 mm
21.3 mm
0.84 in.
227.0 sq. mm
0.36 sq. in.
17.25 mm
21.6 mm
0.85 in.
233.7 sq. mm
0.37 sq. in.
When using the default spot size of
Diagrams may not be “actual size”—check dimension to verify sample size.
The adjustment ranges from 9.5mm to 17.25mm, in adjustment steps of 0.25mm. The effective
scanned sample areas at various spot sizes are as follows:
Diameter.*
(mm)
(in.)
*Based upon 125% of beam diameter
Interpolate for spot sizes in between those listed. Areas are rounded to the digits shown.
17.25mm, the sample diameter should be at
least 21.6mm (0.85 inch) as represented by
the gray circle in this diagram.
At the minimum spot size of 9.5mm, the
sample diameter should be at least 11.9mm
(.47 inch) as represented by the gray circle in
this diagram.
Set spot size in the Data Collection Method (DCM) under “Spot Size” as shown. The spot size should
generally be set to about 80% of the sample diameter for optimum illumination. (Looking at it the
other way, minimum sample size is recommended to be at least 125% of beam diameter.) Measure
the sample, and enter “Spot Size” into the DCM accordingly. Units are mm.
Once set in the DCM, and spectra are saved using this DCM, the spot size cannot be changed. This is
a safeguard to assure that all sample spectra are acquired using the same parameters.
32
Page 35
▪▪▪▪▪▪▪
NOTE: Perform Reference Standardization immediately after changing the spot
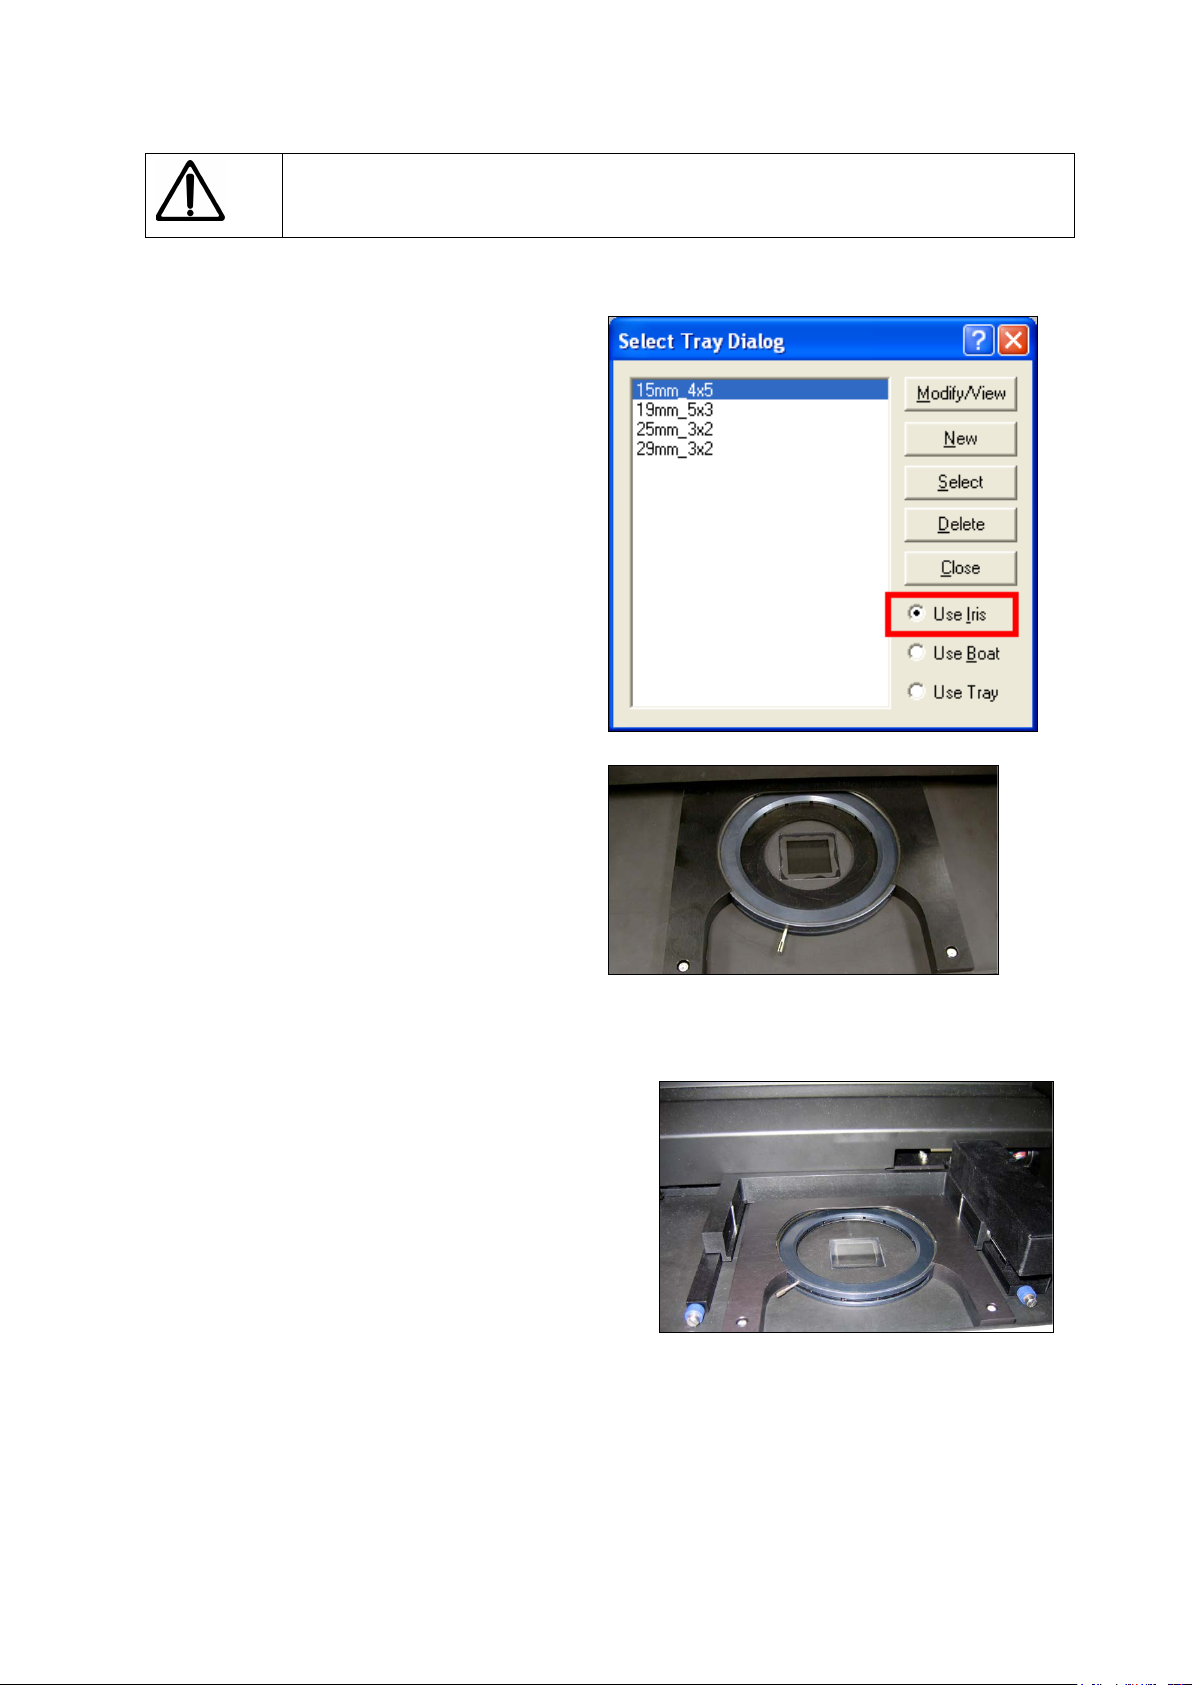
When scanning stationary objects, the “Use
Use the Iris Adapter for centering. Close the
The Iris Adapter is used for round sample cups,
size, to have the proper reference correction loaded in the instrument.
5.4 Iris Adapter
Iris” selection must be clicked. (Stationary
objects need not be moved across the sample
window for averaging.)
aperture around the object to center it, then
open the aperture to avoid reflecting light back
from the aperture itself.
5.4.1 Installation of Iris Adapter:
beakers, vials, and other stationary samples.
NOTE: Set the Select Tray dialog box to “Use Iris”.
Align the holes in the Iris Adapter with the pins on
the sample platform, and carefully lower into place.
The pins hold the Iris Adapter securely in position
over the sample window.
Use the adjustment lever to open the iris as needed.
33
Page 36

▪▪▪▪▪▪▪
Use the iris to center samples in the window area.
The MultiVial Analyzer may also be used for liquid
When using vial trays in the normal mode, the vials
Removal of the Iris Adapter is quite straightforward. Simply remove the Iris Adapter Assembly by
Push the handle to the right to center the sample,
then to the left to move the iris from the sample
window area.
Close the door of the sample chamber to exclude
ambient light.
Take a reference scan, the take a sample scan of the
material.
NOTE: If acquiring vial spectra that will later be used
with a vial tray, be sure to perform the Reference
Standardizations as described for both “Use Iris” and
“Use Tray” positions. This assures consistent spectra.
analysis using the Reflectance Cell and Immersion
Diffusers.
These cells are often used for clear to semi-clear
liquids such as alcohols and suitable fluids.
are slightly elevated from the sampling window. A
separate Reference Standardization is performed in
the “Use Tray” mode to account for the slight
photometric difference between the “Use Iris” mode
and the “Use Tray” mode.
Vision applies the proper Reference Standardization
based upon selection of “Use Iris” or “Use Tray”.
lifting straight upward, off the pins. Be sure to set the Select Tray dialog box to the correct setting
for the type of cell being used.
34
Page 37
▪▪▪▪▪▪▪
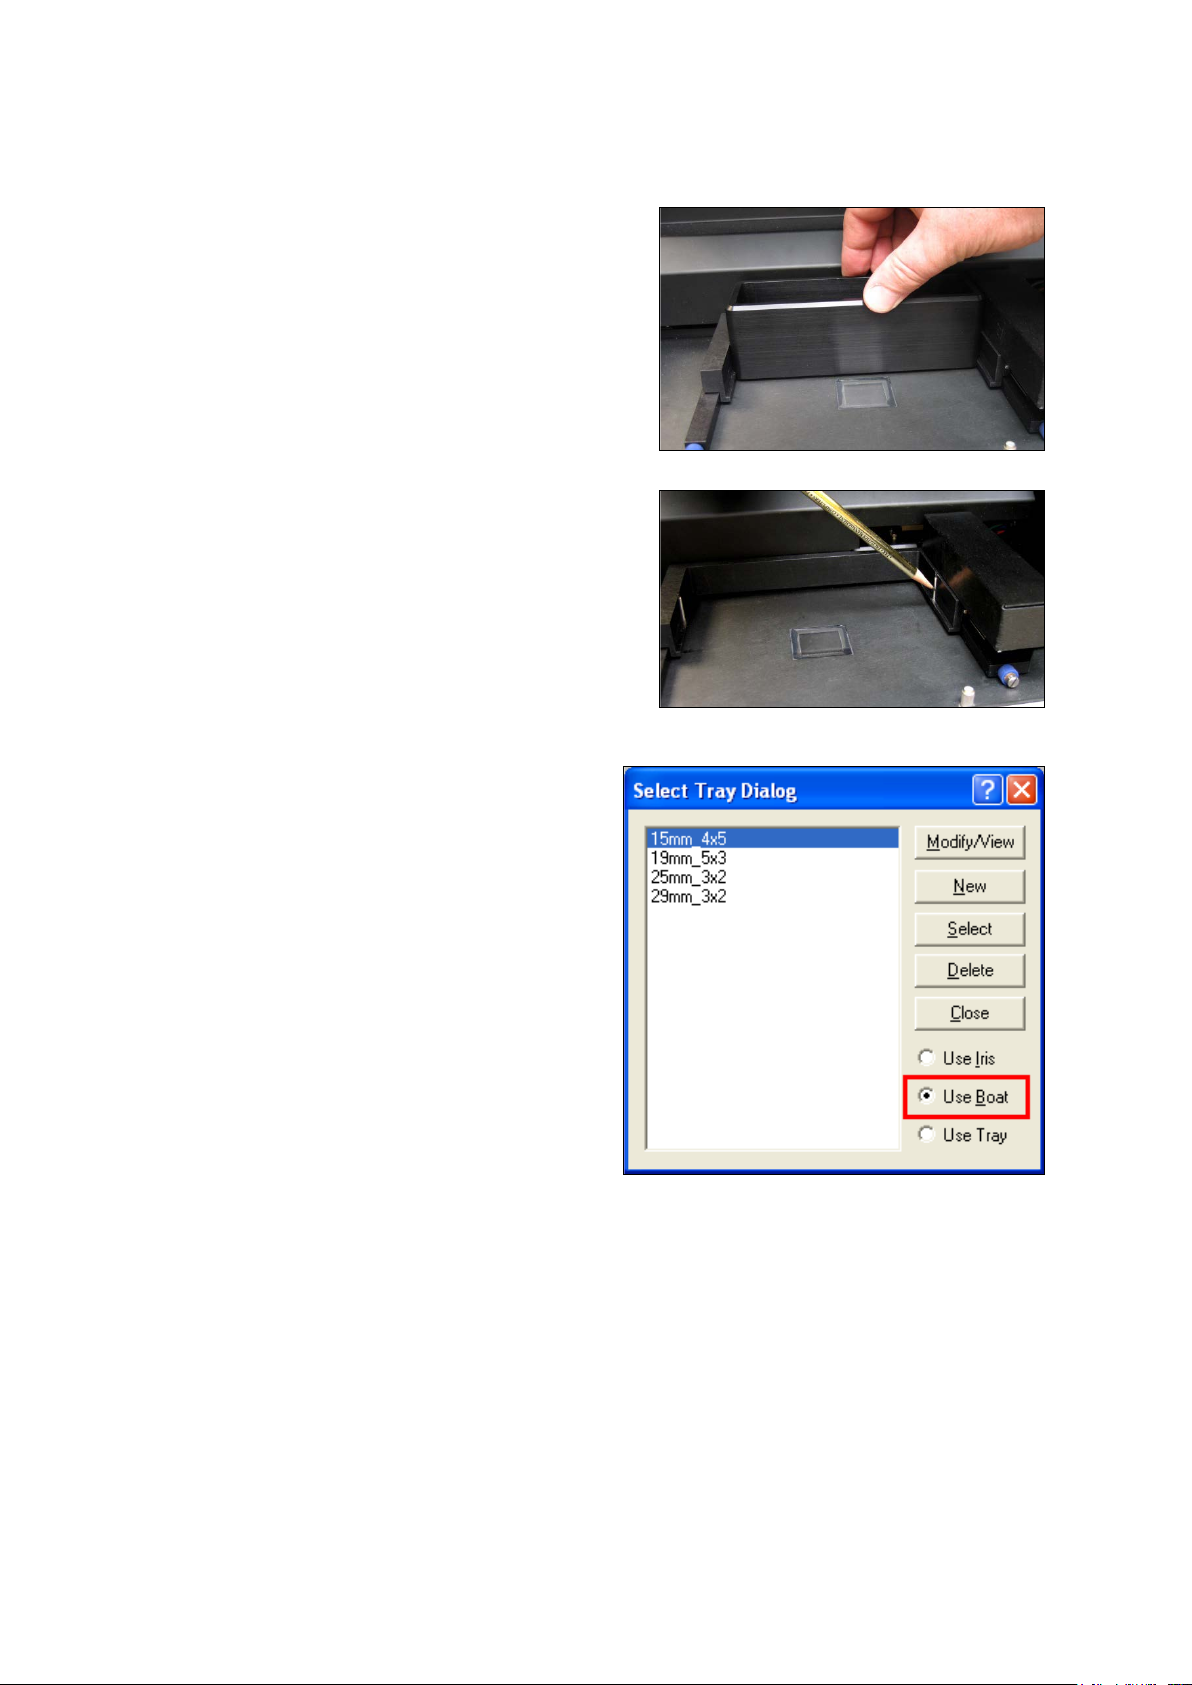
5.5 Use of the Sample Transport Mechanism
The sample transport uses a small motor and lead
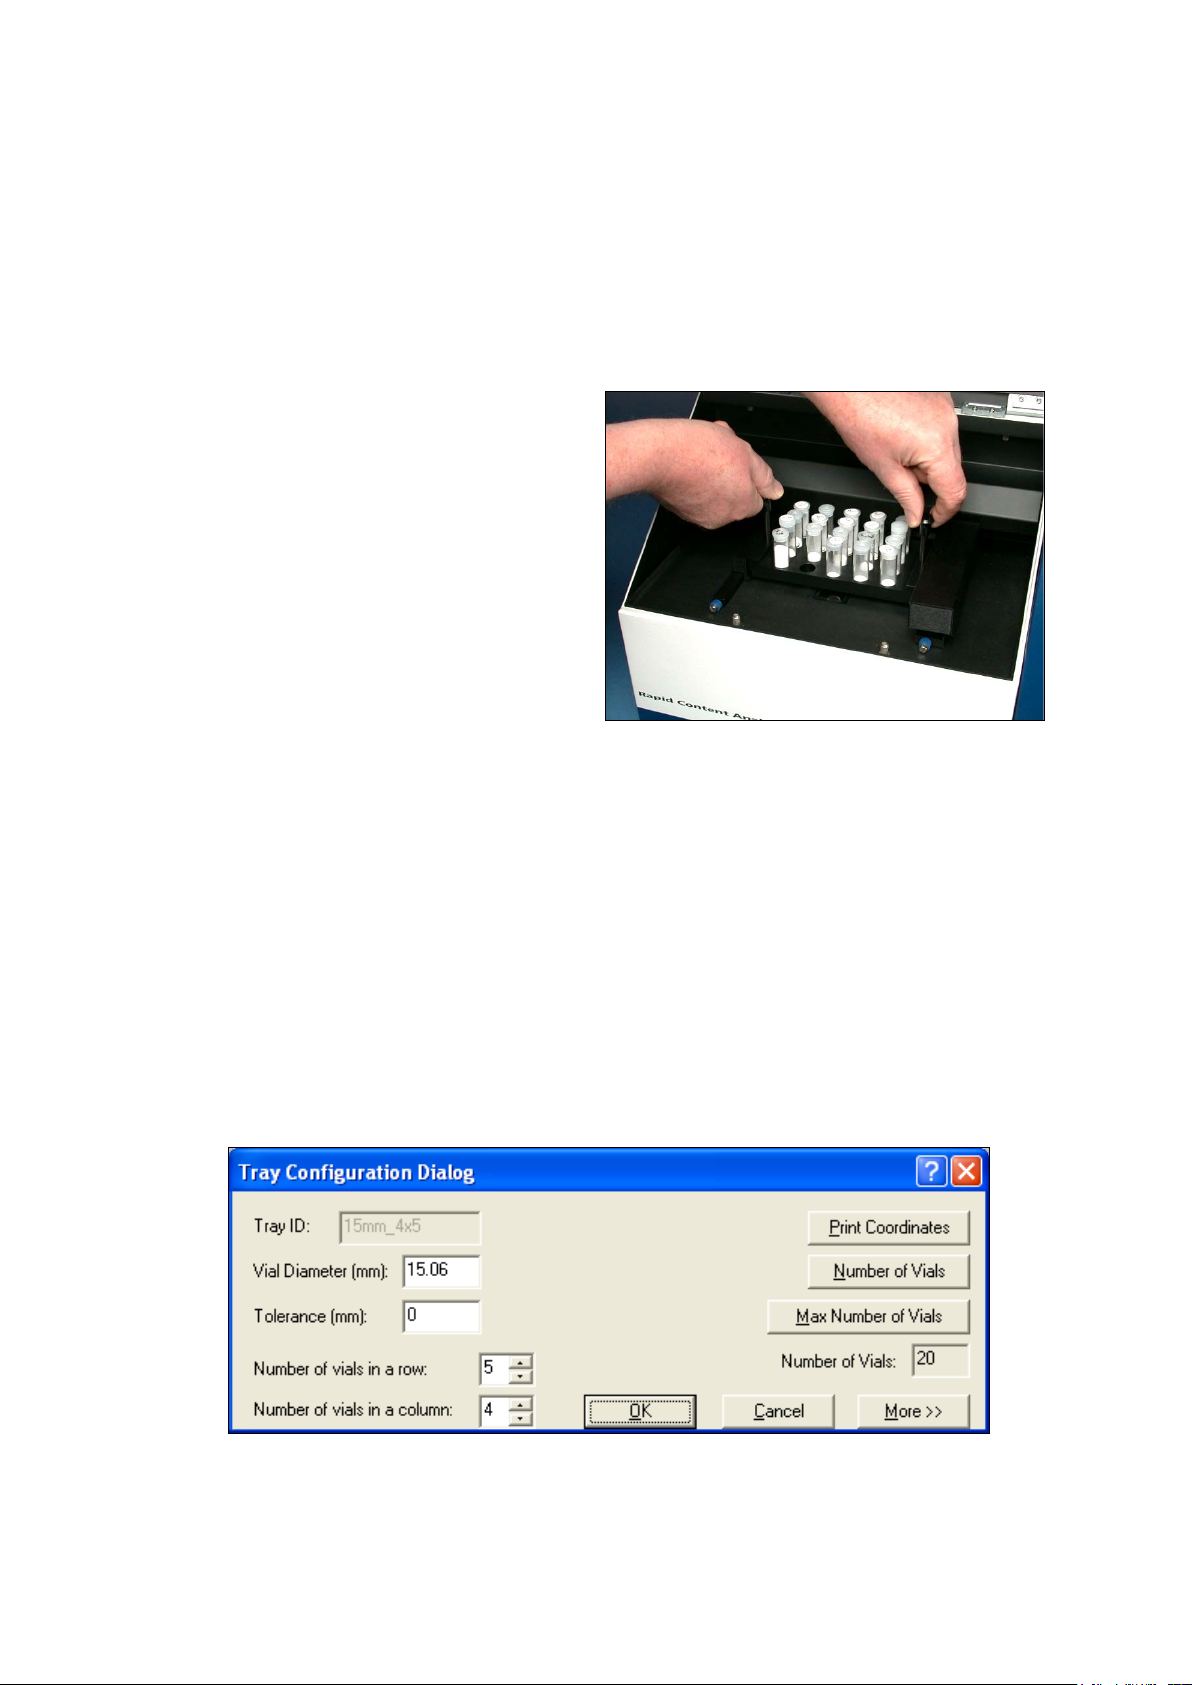
To insert the sample cell “boat” into the MultiVial,
The Select Tray Dialog box must have the correct
screw to position the cell over the sampling window
of the module, as shown in the photo at right.
In normal operation, the mechanism will move the
cell to one of 8 sample positions, for maximum
sampling area exposure. This is completely under
control of the instrument, and requires no input from
the user.
note the round guides on the sample carrier. They
are shown in this photo – the pencil points to the
one on the right.
The sample cell must be positioned over these pins
and gently pressed down to the stops. If crooked, the
cell cannot be positioned correctly. Care must be
used in placing the cell on the pins.
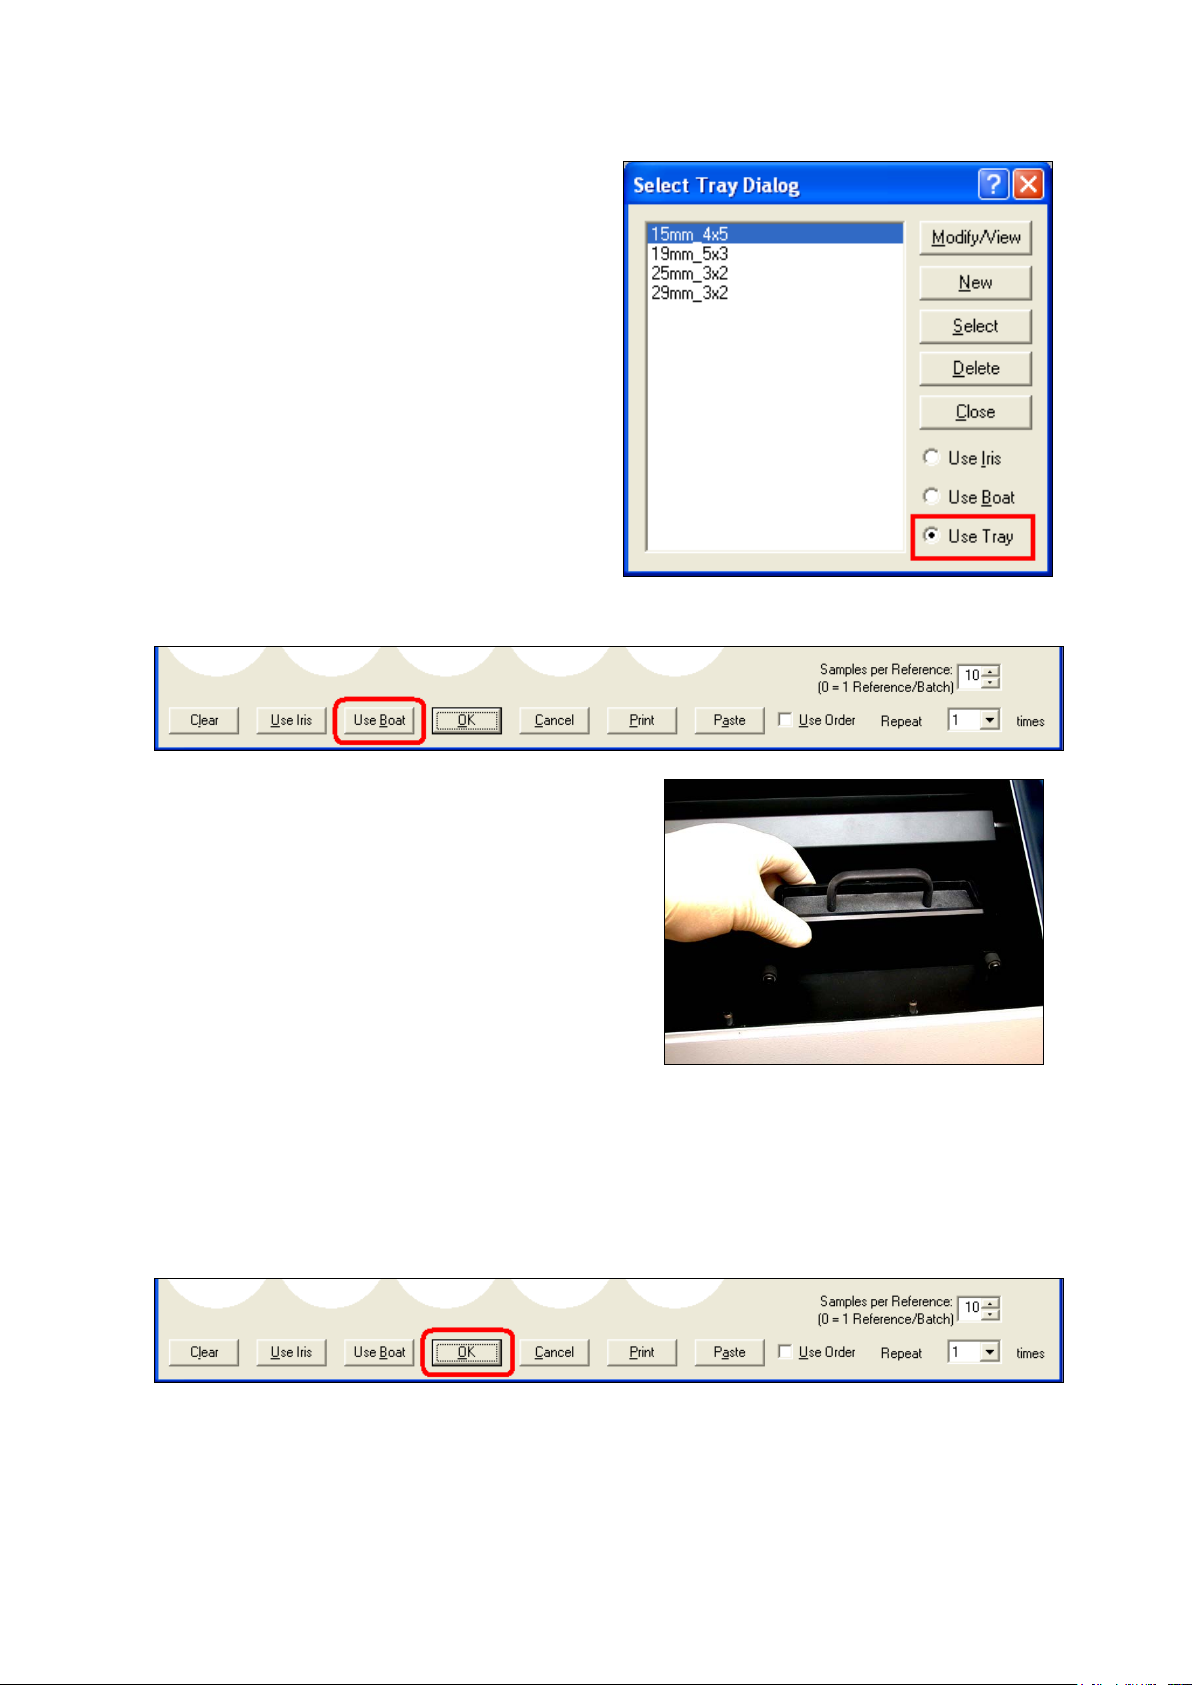
selection made. Click on “Use Boat” as shown.
This selection de-activates the “y-axis” motion,
and allows the correct range of “x-axis” motion.
DO NOT OPERATE OR TROUBLESHOOT
WITH THE LID OPEN. SUNLIGHT MAY
CONFUSE THE OPTICAL INTERRUPTERS
USED TO POSITION THE SAMPLE CARRIAGE.
THIS MAY CAUSE AN “X-Y POSITIONING
ERROR” TO BE REPORTED.
35
Page 38

▪▪▪▪▪▪▪
The sample transport mechanism is quite rugged, and requires no service by the user. Please
When using the Iris Adapter, select the “Use Iris”
Gently position the Iris Adapter over the locating
DO NOT OPERATE OR TROUBLESHOOT WITH THE LID OPEN. SUNLIGHT MAY CONFUSE
observe these cautions:
• Never attempt to move the mechanism manually. This will cause a “Limit Switch Error” in
Vision. The user must then disconnect, cycle power, and re-connect to the instrument to
reset the mechanism.
• DO NOT operate with the lid open. This can induce X-Y Positioning Errors.
• Do not attempt to clean or lubricate the mechanism. The traversing nut is self-lubricating
and self-cleaning, and requires no service of any kind. The lead screw is stainless steel, and
needs no service.
There are no user-serviceable parts in the mechanism. It has been aligned and set for quiet, stable
operation. Please be gentle, and do not attempt to make any adjustments.
5.5.1 Use of the Iris Adapter:
setting in the Select Tray dialog Box. This
positions the sample carrier to a central position,
and permits the user to install the Iris Adapter.
(The Iris Adapter is shown in the next photo.)
NOTE: Failure to set the “Use Iris” setting may
result in damage to the instrument, which is not
covered by instrument warranty.
When set to “Use Iris” Vision ignores the tray
sizes shown on the left side of this dialog box,
and proceeds only for use of the Iris Adapter.
pins and press downward.
This photo shows the Iris Adapter in the correct
position for use. Note the silver positioning lever
at the left side of the iris – move this lever right
to close the iris to centering vials or other cells.
THE OPTICAL INTERRUPTERS USED TO POSITION THE SAMPLE CARRIAGE. THIS MAY
CAUSE AN “X-Y POSITIONING ERROR” TO BE REPORTED.
36
Page 39

▪▪▪▪▪▪▪
6 Vision Software: Connection to the Instrument
Install Vision on the computer to be used for
Enter the default User ID, “NIRS”. It is not case-
A new project must be created. The “project” is
This section describes communication between the computer (with Vision Software loaded) and the
XDS instrument. Please follow these steps to establish communication. The instrument may be “direct
connected” as explained in section 3.0 of this manual. Alternatively, the instrument and computer
must both be plugged into a live RJ-45 communication jack, on an active network.
6.1 Entry into Vision
instrument operations.
Once installed, click on the Vision icon on the
desktop. The log-in box appears on the opening
screen.
sensitive.
Tab (or mouse) to the Password box, and enter
the default password, “NIRS”.
Note that you should set up specific User ID and
passwords for each authorized user. Do not
operate on the default User ID, or you will be in
violation of CFR 21, Part 11.
used to store data and calibrations for a given
type of analysis.
Multiple projects may be used, to keep spectra,
calibrations and other data separate and wellorganized.
Assign the project some meaningful name, to
make it easy to remember. For our purposes, we
simply called this “multivial”. No spaces are
allowed – use the “underscore” instead.
Vision will assign a Location. Leave this blank,
unless you intend to place the spectra in a
specific folder of your choosing.
37
Page 40
▪▪▪▪▪▪▪
Vision asks if the default directory location is
This screen sets up communication parameters
Click “OK” to exit the dialog box, then “OK” again to exit Configure Data Sources.
Vision prompts the user to connect to the instrument.
acceptable.
Click on “Yes”. Vision creates a directory for the
project as shown.
for the instrument. The XDS instrument has a
unique driver. Highlight this box and click on
“Configure”.
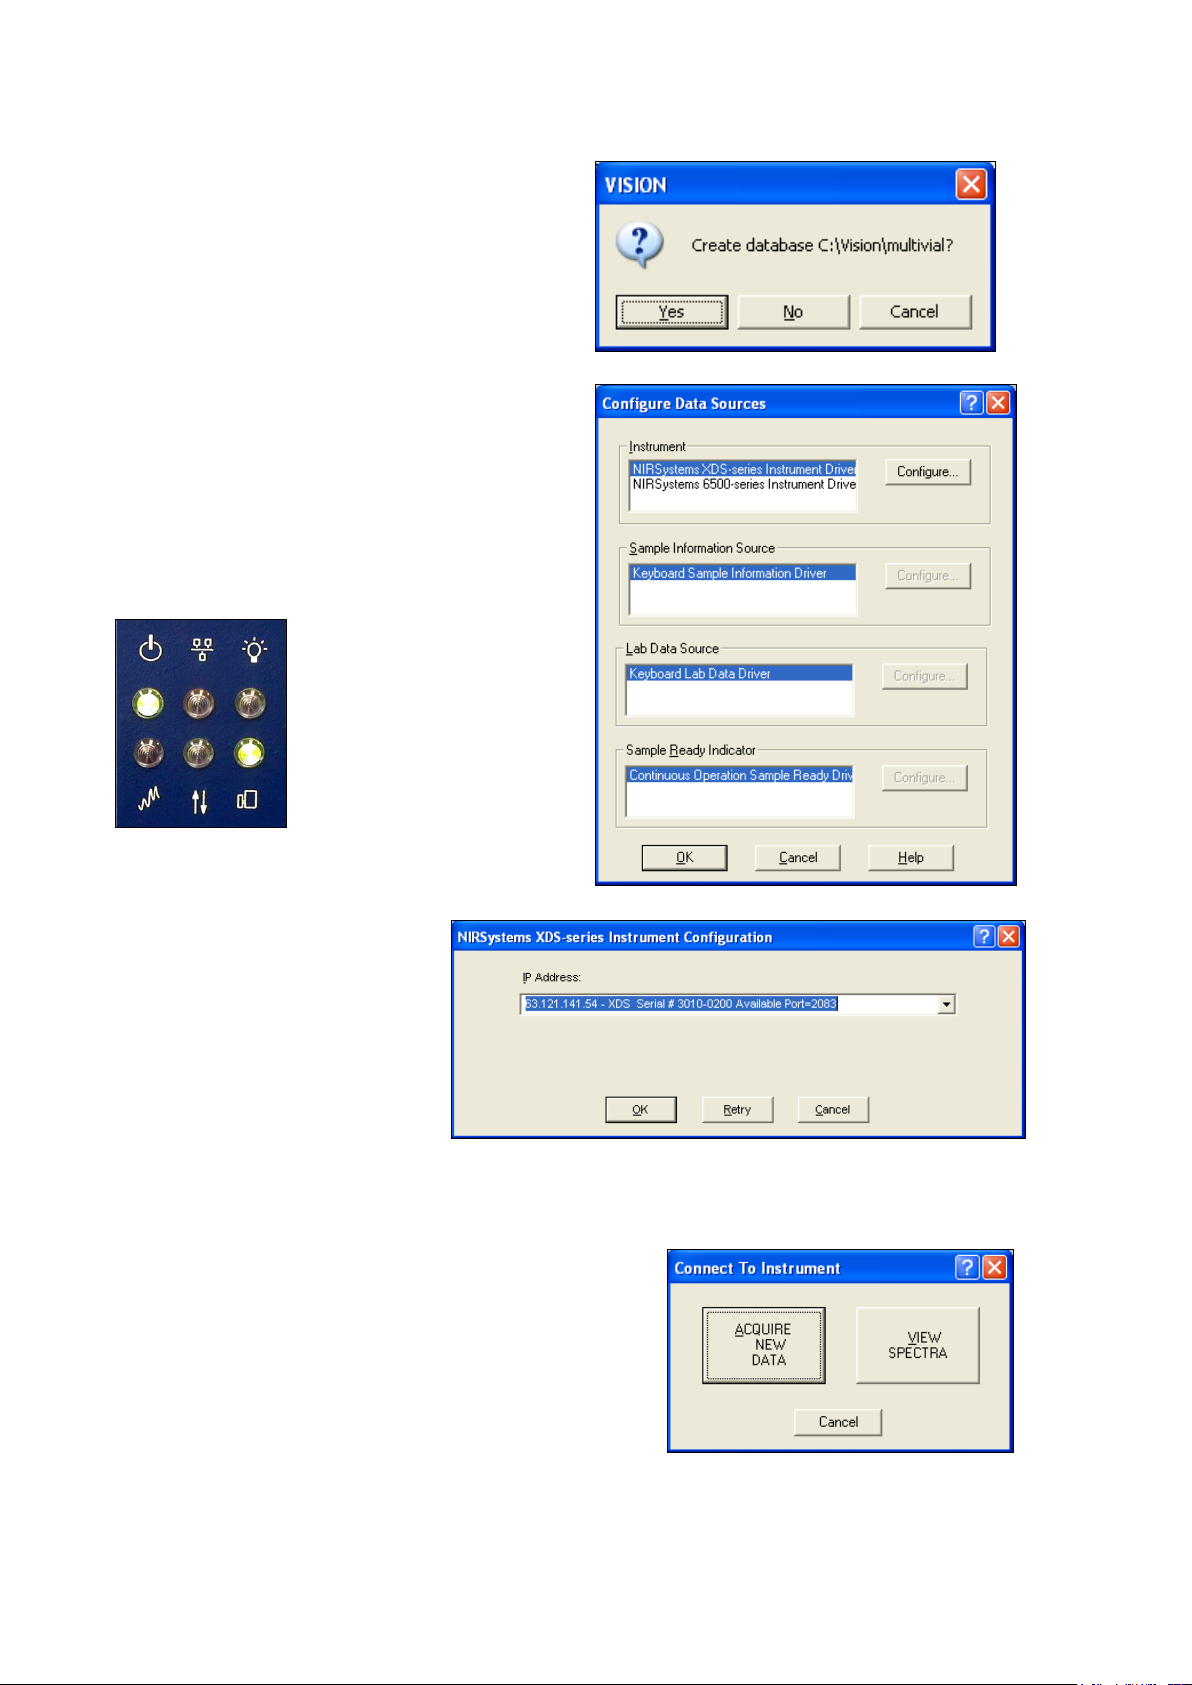
Be sure the instrument is turned on and is ready.
The “power” LED (top left) and the “module” LED
(lower right) should be illuminated as shown.
This box directs the user to select
the instrument IP (Internet
Protocol) address.
Use the drop-down arrow of the
IP Address box, and select the
correct instrument. The
instrument must show “Available”
to be selected.
Before connection, we wish to figure the “Project
Options”.
Click on “View Spectra”. The user is returned to the main
screen of Vision.
38
Page 41
▪▪▪▪▪▪▪
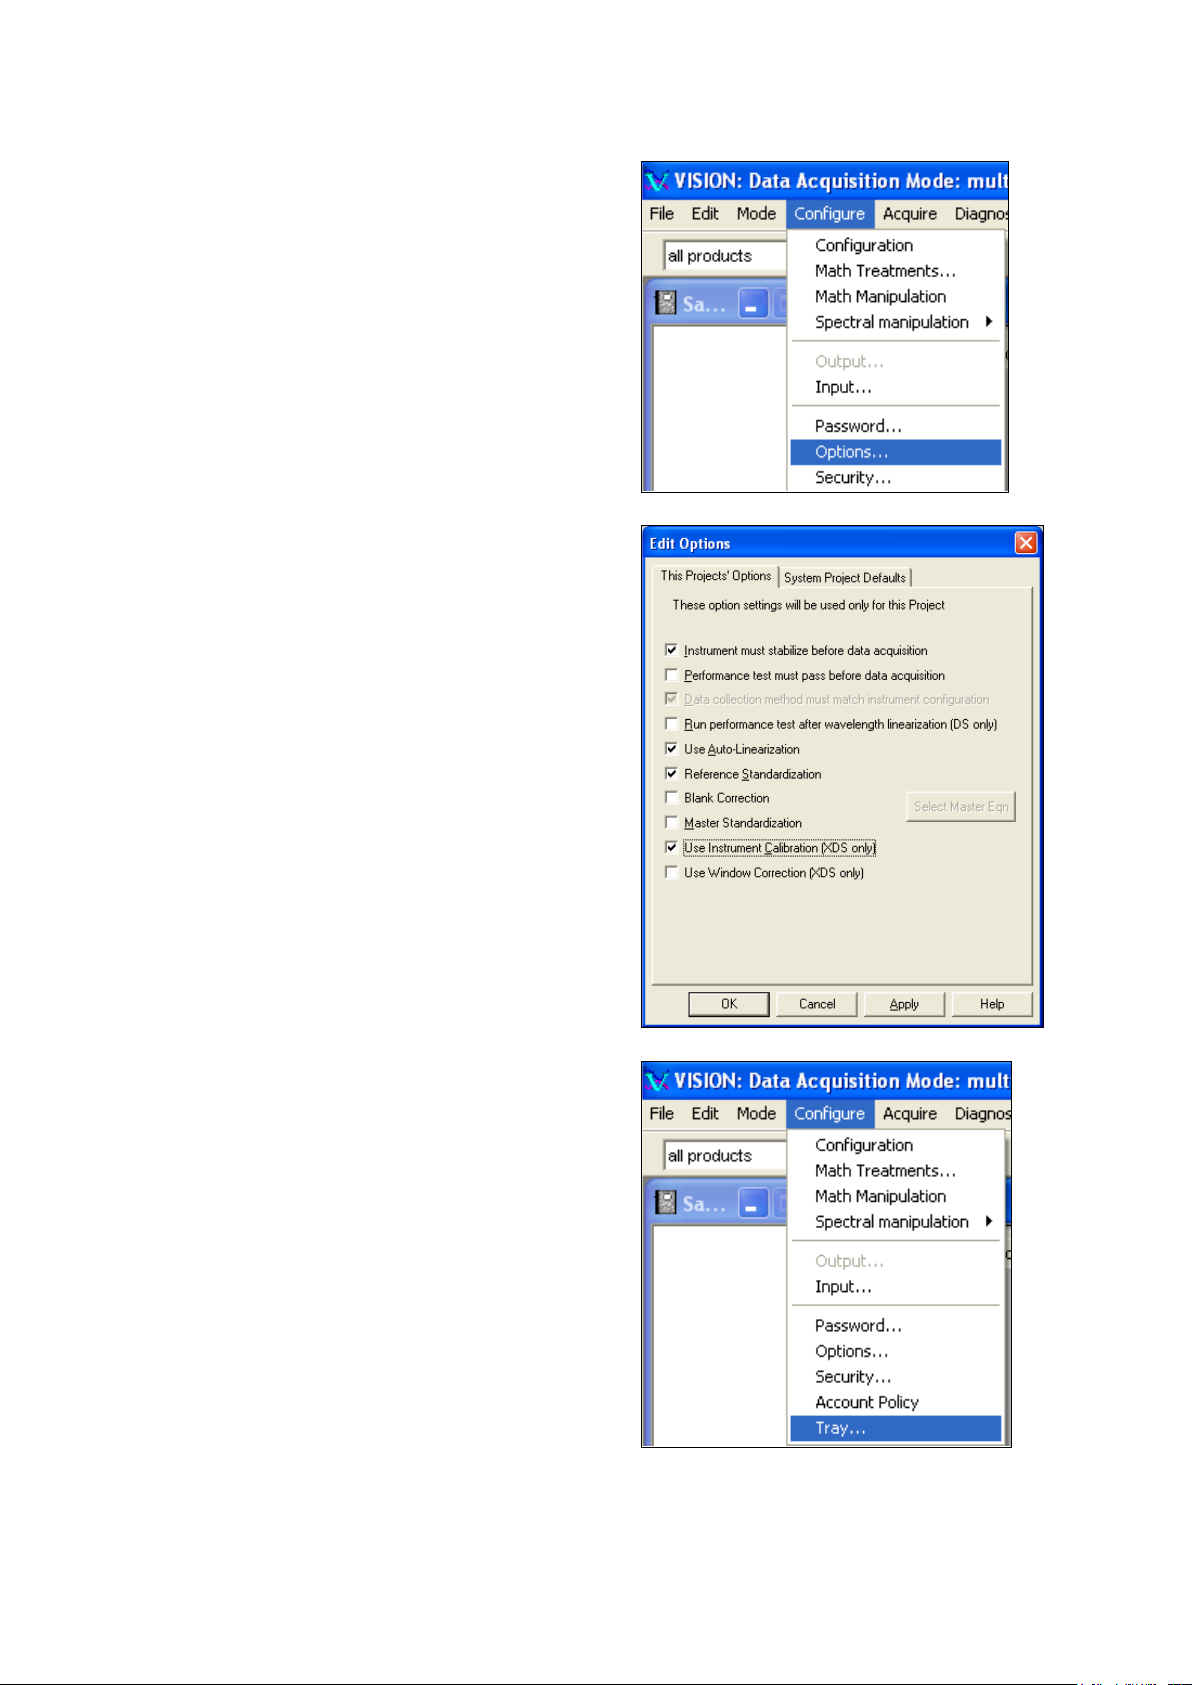
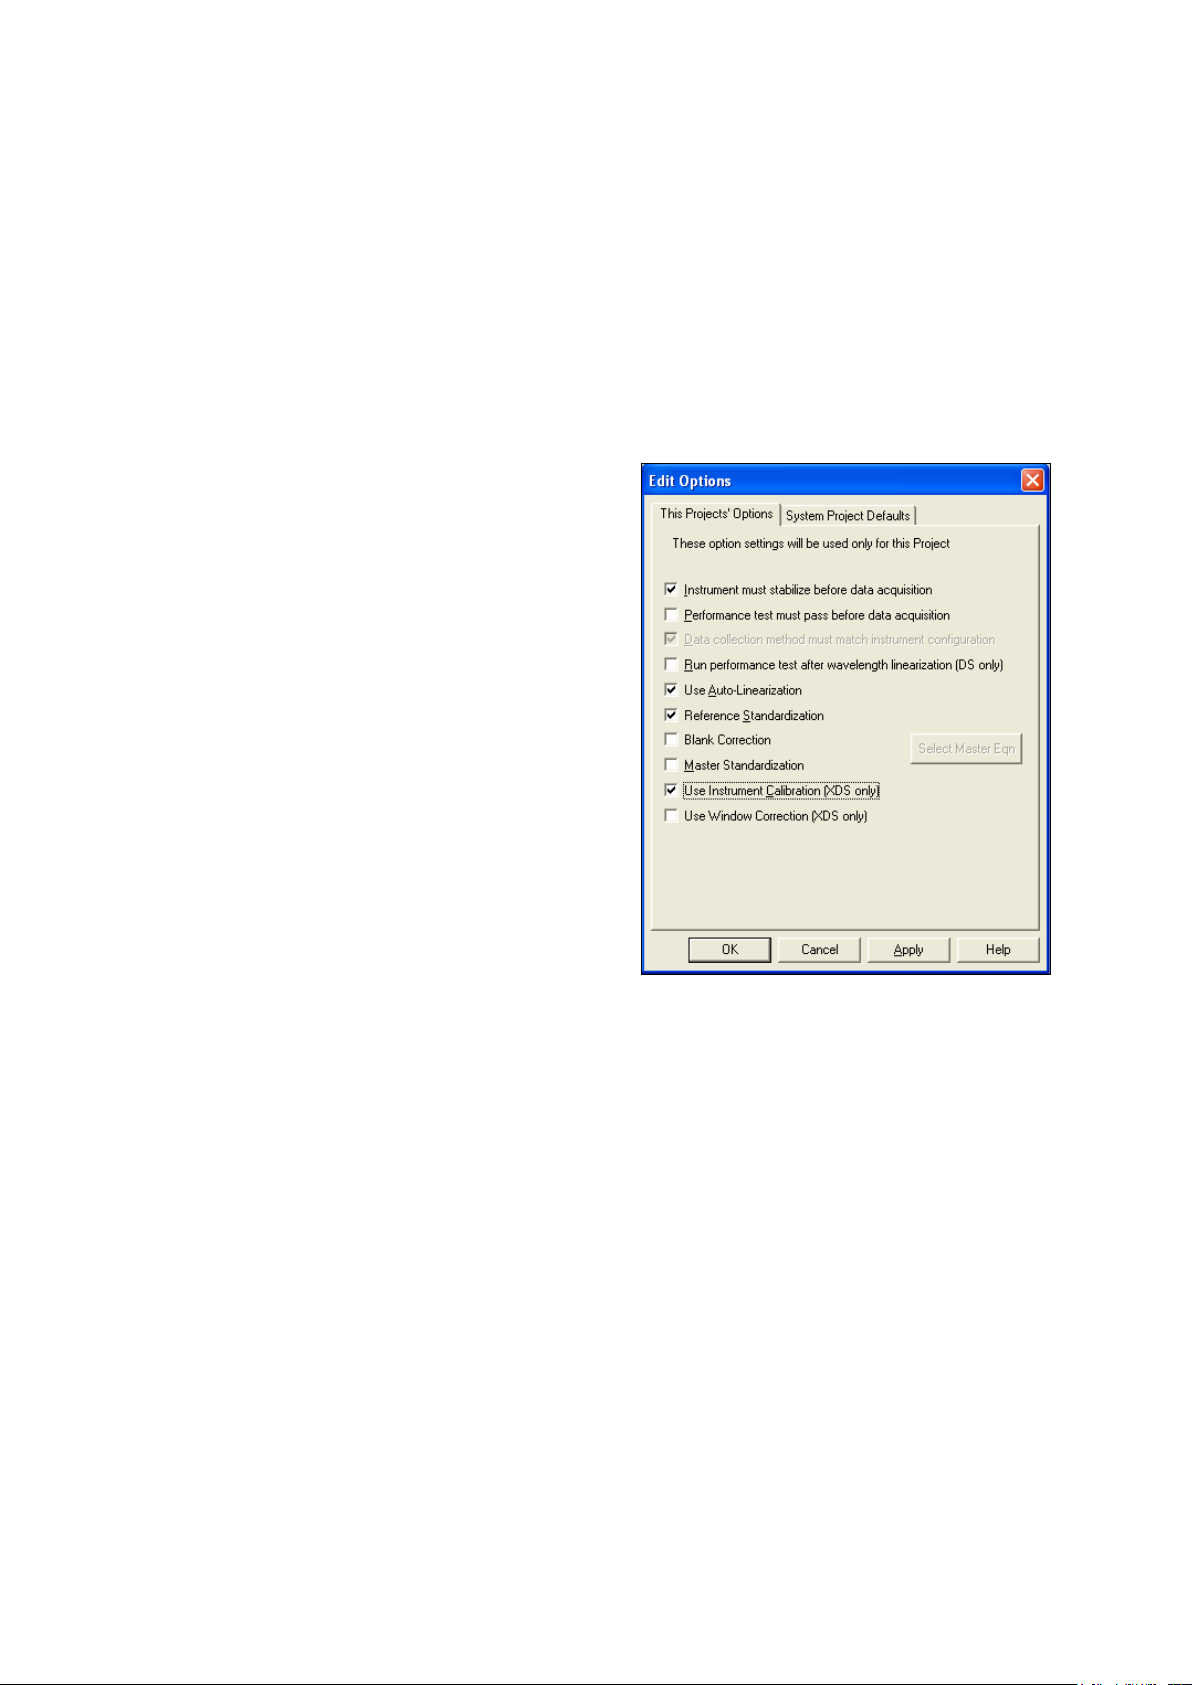
Select Configure, Options from the menu bar.
Verify that these selections are clicked:
• Instrument must stabilize before data
Select Configure, Tray from the menu bar.
acquisition
• Use Auto-Linearization
• Reference Standardization
• Use Instrument Calibration
These selections are explained in more detail,
further in this manual. Because some selections do
not apply to the MultiVial, they are not selected.
Reference Standardization and Instrument
Calibration must be selected for transferability
between similar instruments.
Click “OK” to exit the dialog box.
39
Page 42
▪▪▪▪▪▪▪
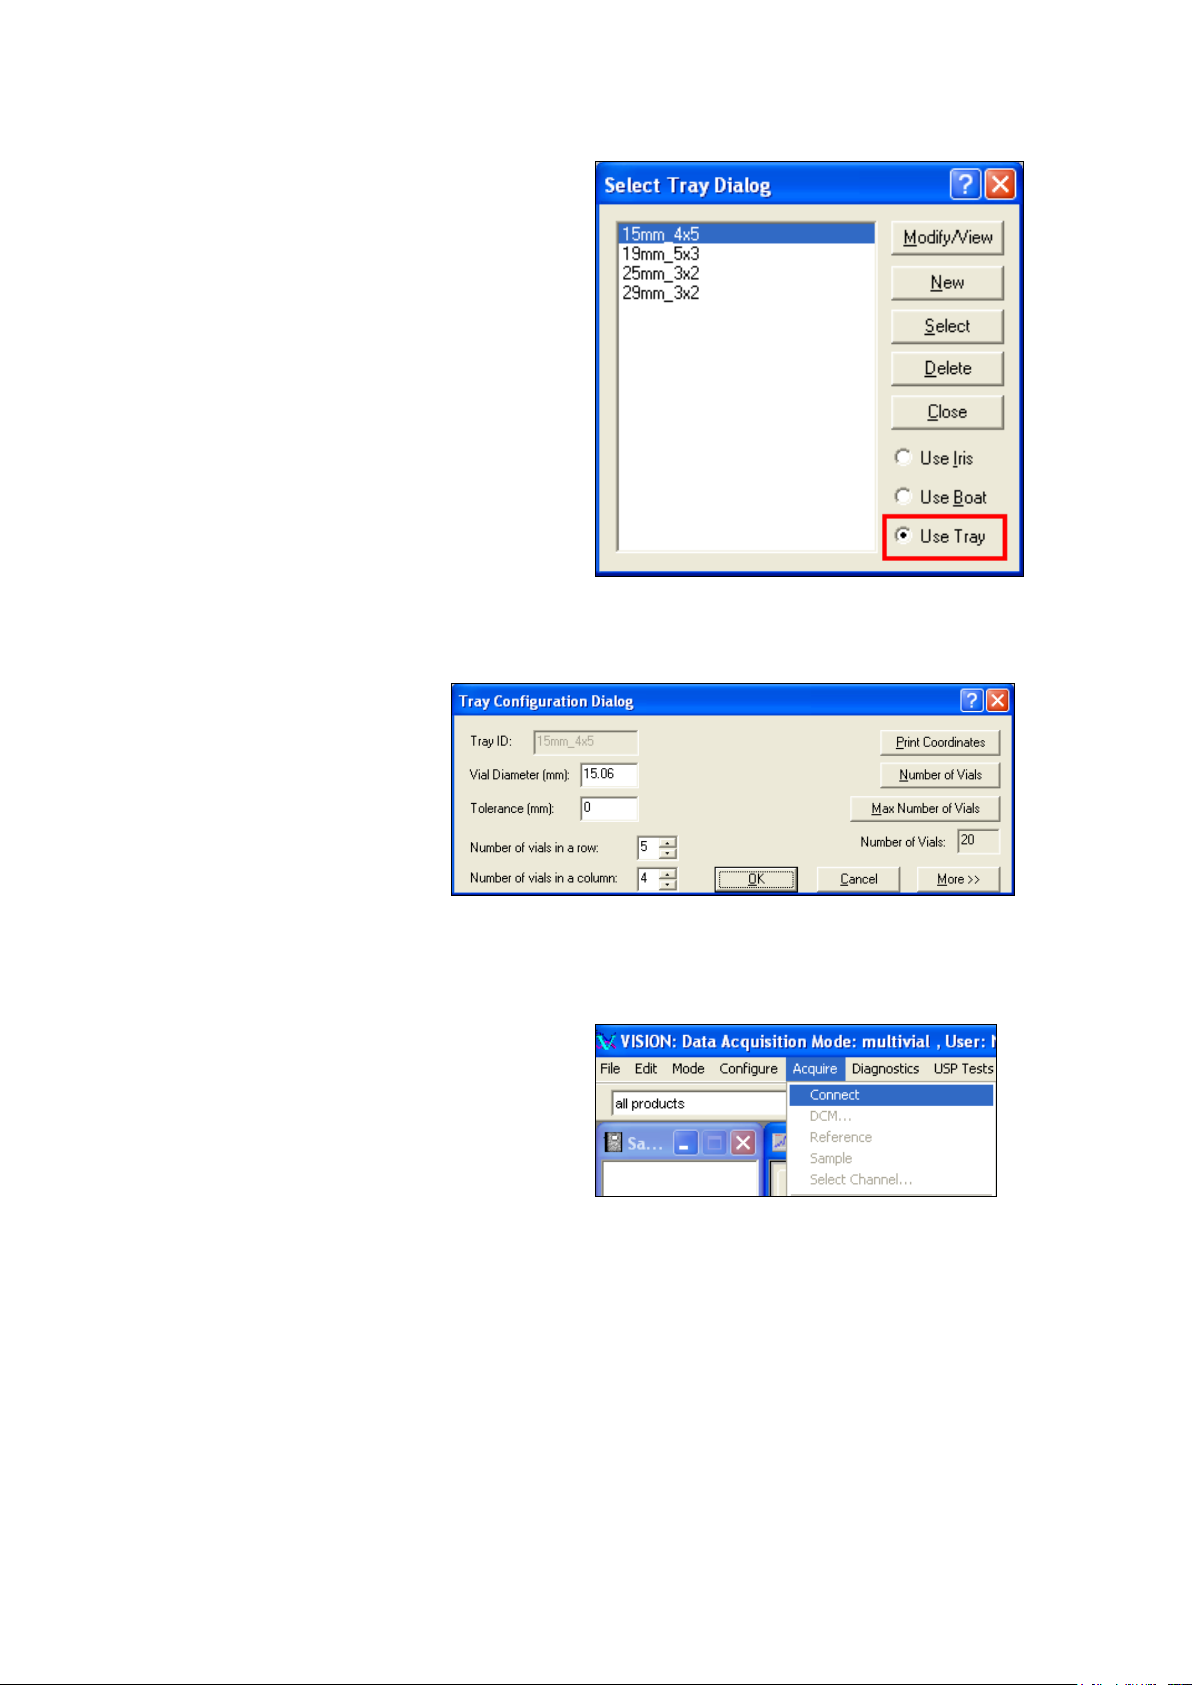
Vision has four “default” trays built in, for ease of
If the user clicks on “Modify/
(In this example, the 15mm vial will be used. See section 5.2, on Creation of a Custom Vial Size
Select Acquire, Connect to initiate
use. These are common trays, and should serve
many users.
Check the vial diameter you plan to use, and
highlight it on this list, if shown. (15mm_4x5 is
selected for this example.)
For a vial diameter not shown, click on “New”.
Vision provides a screen for creation of a new
size.
The default setting of “Use Tray” is clicked. Note
that the user may select “Use Iris” or Use Boat” if
another sampling method is planned. We plan to
use vials, so we keep the “Use Tray” setting.
Click on “Select” to save these settings and exit
this dialog box.
View” from the Select Tray Dialog
box, this screen is shown.
If “New” is clicked, all fields are
blank, for entry of vial
information.
Click “OK” to save and exit.
creation for details on setting up a custom vial size. Please continue to Acquire, Connect.)
communication with the instrument.
Upon successful connection, the amber LED (top
middle) will illuminate to indicate that
communication has been established.
40
Page 43
▪▪▪▪▪▪▪
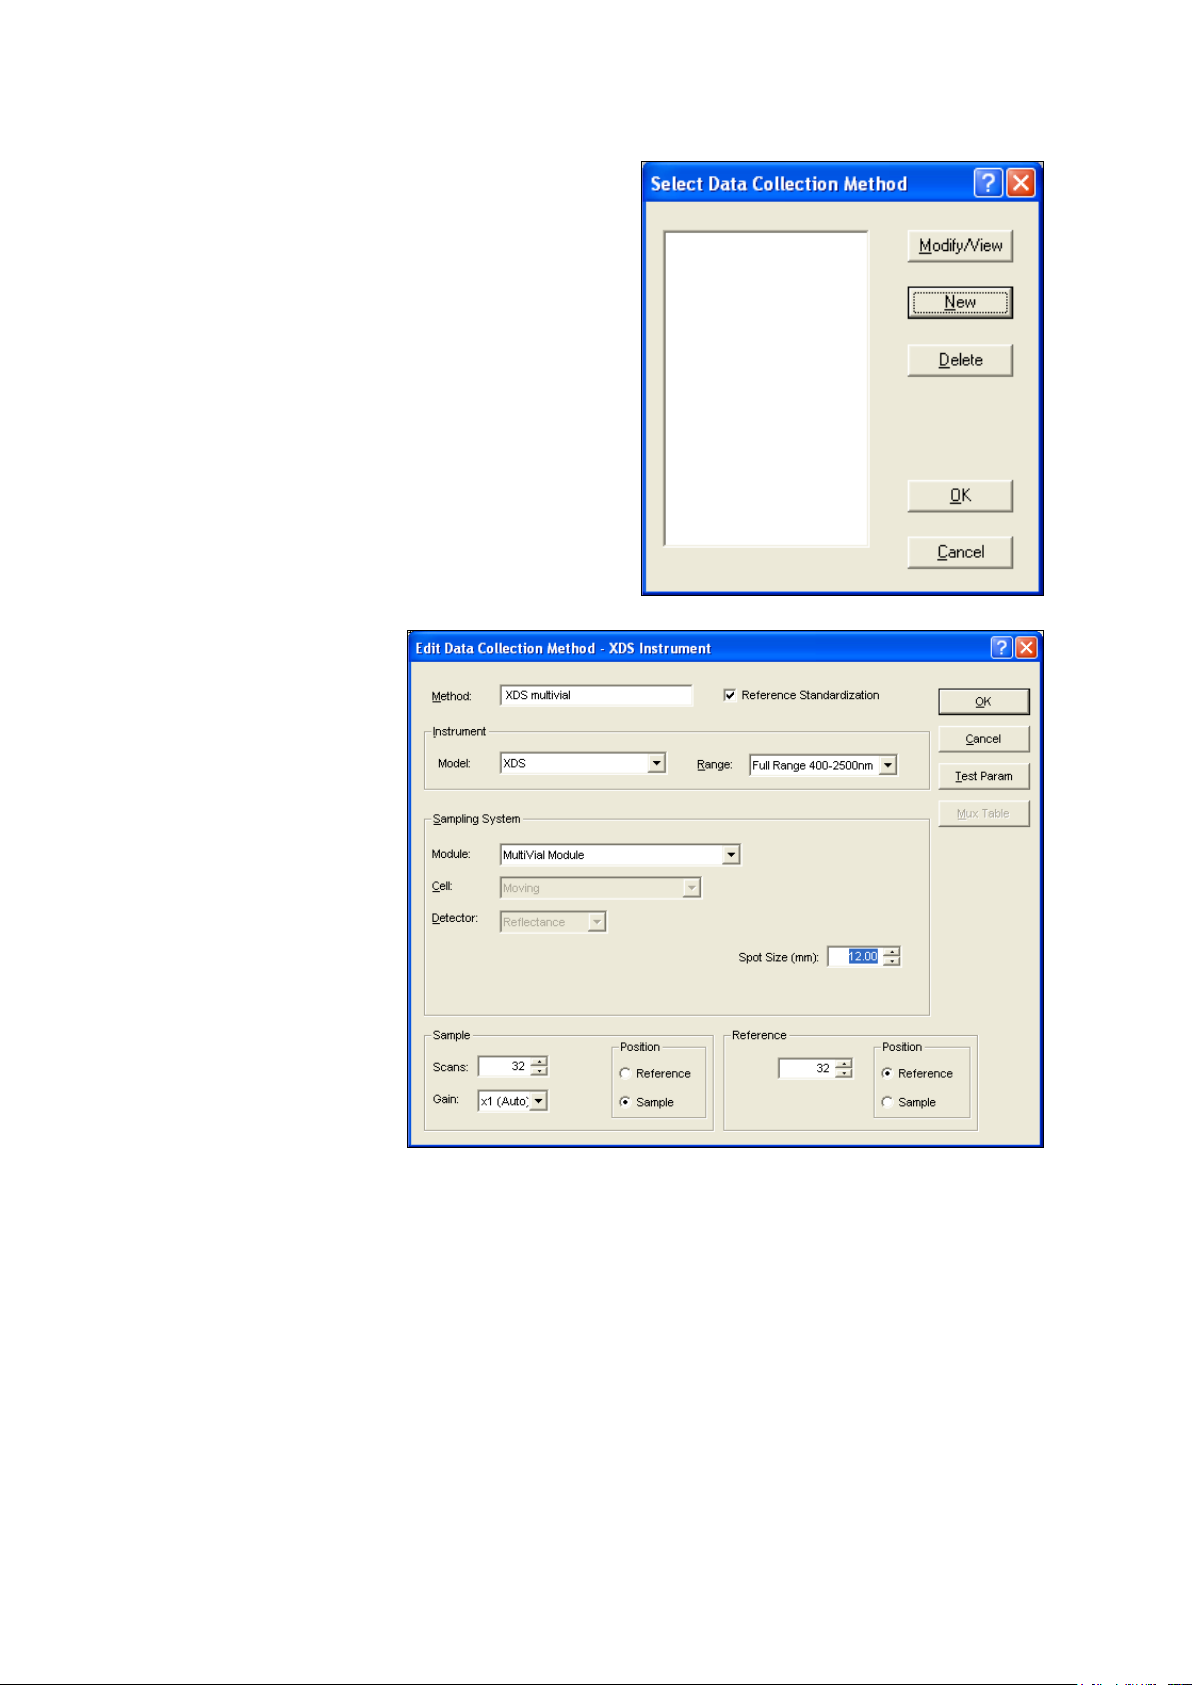
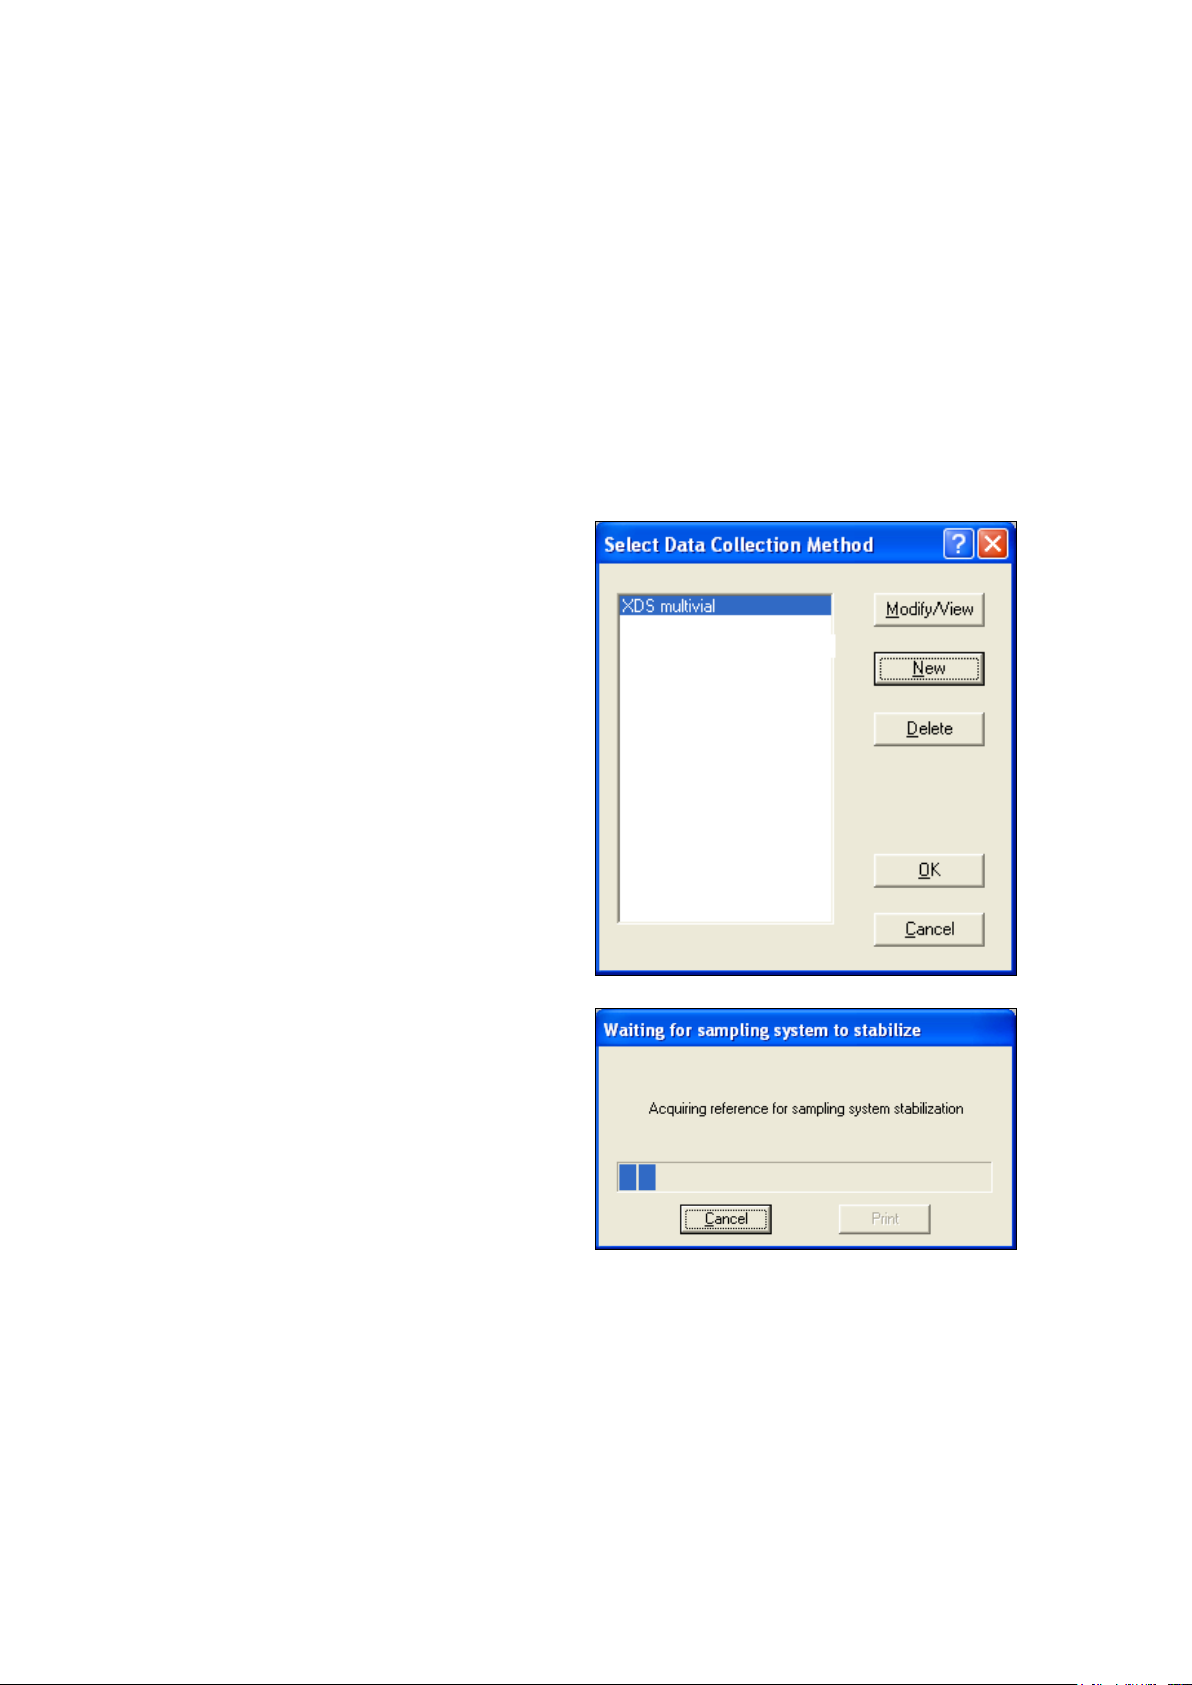
Vision requests that a Data Collection Method
(DCM) be selected for communication with the
The instrument “self-
instrument.
The DCM sets important parameters for how the
data is taken, and assures consistent methods.
There are no Data Collection Methods available
because this is a new project. Click “New” to
establish a new Data Collection Method.
identifies” as an XDS
system with the MultiVial
Module. The user should
enter a logical name for
the DCM. (Spaces are
OK.)
Note that the “Spot Size”
should be adjusted if the
vial used is smaller than
21.56mm diameter. The
default spot size is
17.25mm. Normally the
beam size should be set
for 80% of the vial
diameter.
For the 15mm vial, use a
12mm spot size.
41
Page 44
▪▪▪▪▪▪▪
Use 32 scans for “Sample” and 32 scans for “Reference.” The instrument scans on each forward
Next, select this DCM from the selection box.
Vision will connect with the instrument, and may
swing and each backward swing of the grating, unlike previous Metrohm instruments. Thus, 32
scans are accomplished on only 16 grating cycles, and are done rapidly. Click “OK” when finished.
The user will hear a slight ticking sound from the internal order sorter whenever the lamp is on.
This is normal, and has no effect on component life. The parts are kept in motion to reduce “wait
time” before instrument stabilization.
Verify that the box marked “Reference Standardization” is checked. If it is not, the user should
return to Configure, Options and select “Reference Standardization” on that menu before
establishing a DCM.
Click “OK” to exit the dialog box. The DCM information will be saved.
Click “OK” to connect to the instrument.
Once connected, verify that the amber
“Communication” LED is lit on the instrument
display a message that a reference is being
acquired to determine instrument stabilization.
If the instrument lamp has been on for some
time, this message will only be displayed for a
few scans. Otherwise, it may take some time for
the instrument to come to full internal operating
temperature.
42
Page 45
▪▪▪▪▪▪▪
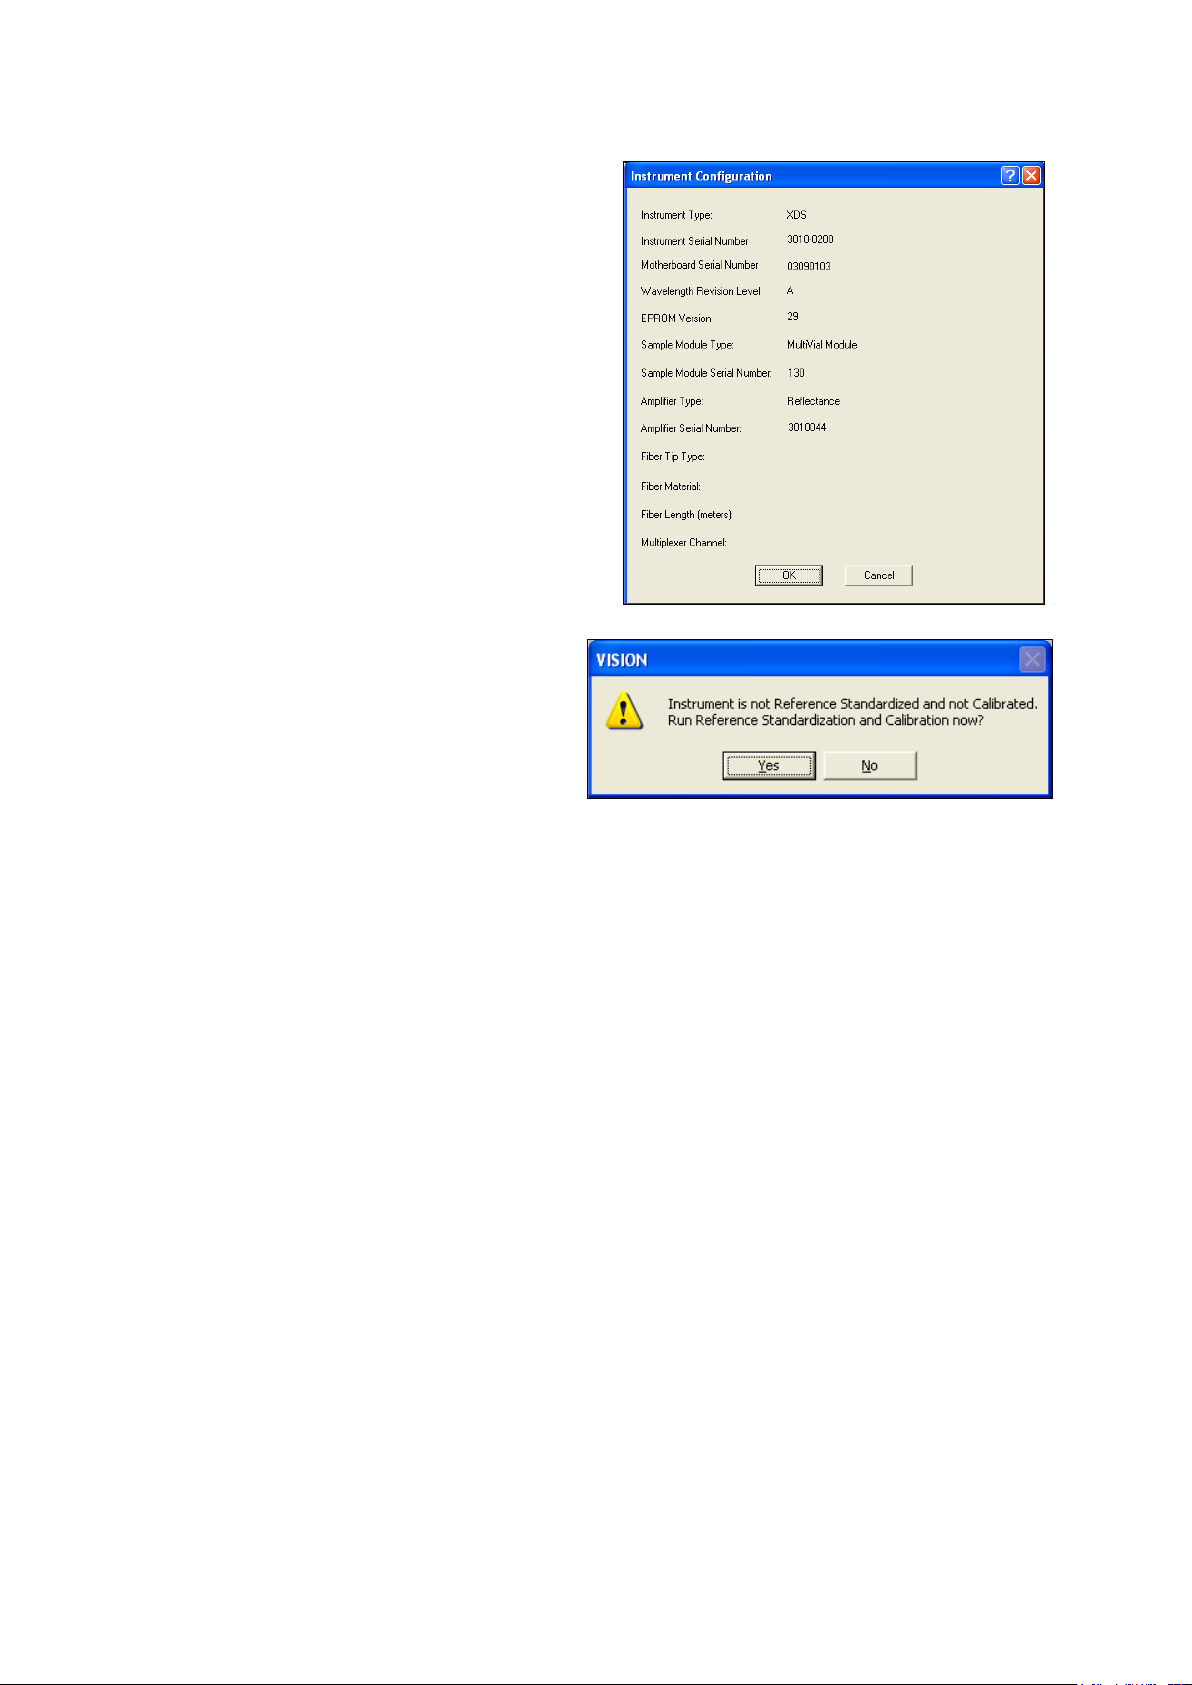
Upon connection, Vision may prompt for the
instrument configuration. This is used to establish
If a Reference Standardization does not exist
a Diagnostic Database. (Under some
circumstances this screen may not appear.)
It is important that the instrument be correctly
identified, to prevent corruption of the database.
If only one instrument is in use, accept the
information and click “OK”.
for the selected configuration, Vision will
display this message.
The user should perform both Reference
Standardization and Instrument Calibration,
to assure good method transfer.
As explained in the section on Reference Standardization, Vision stores two references, based upon
whether the sample is scanned directly on the sample window, or on the vial tray which is raised
from the sample window to allow free motion.
By storing two separate reference files, Vision can compensate for the optical difference between the
two methods. This allows use of one library or calibration, which is applied to either sampling
method.
If the user does not see this message, Vision has the required Reference Standardization in place to
perform this operation.
6.2 Use of Vial Dialog Selection Menu
The MultiVial Analyzer is designed for automated scanning of multiple vials. Vision Software supports
this feature, and permits the user to set up the system for each sample to be collected. While the
instrument is scanning, the user can prepare the next set of samples, or perform other necessary lab
work.
To set up the MultiVial Analyzer for automated sampling, follow these instructions:
43
Page 46
▪▪▪▪▪▪▪
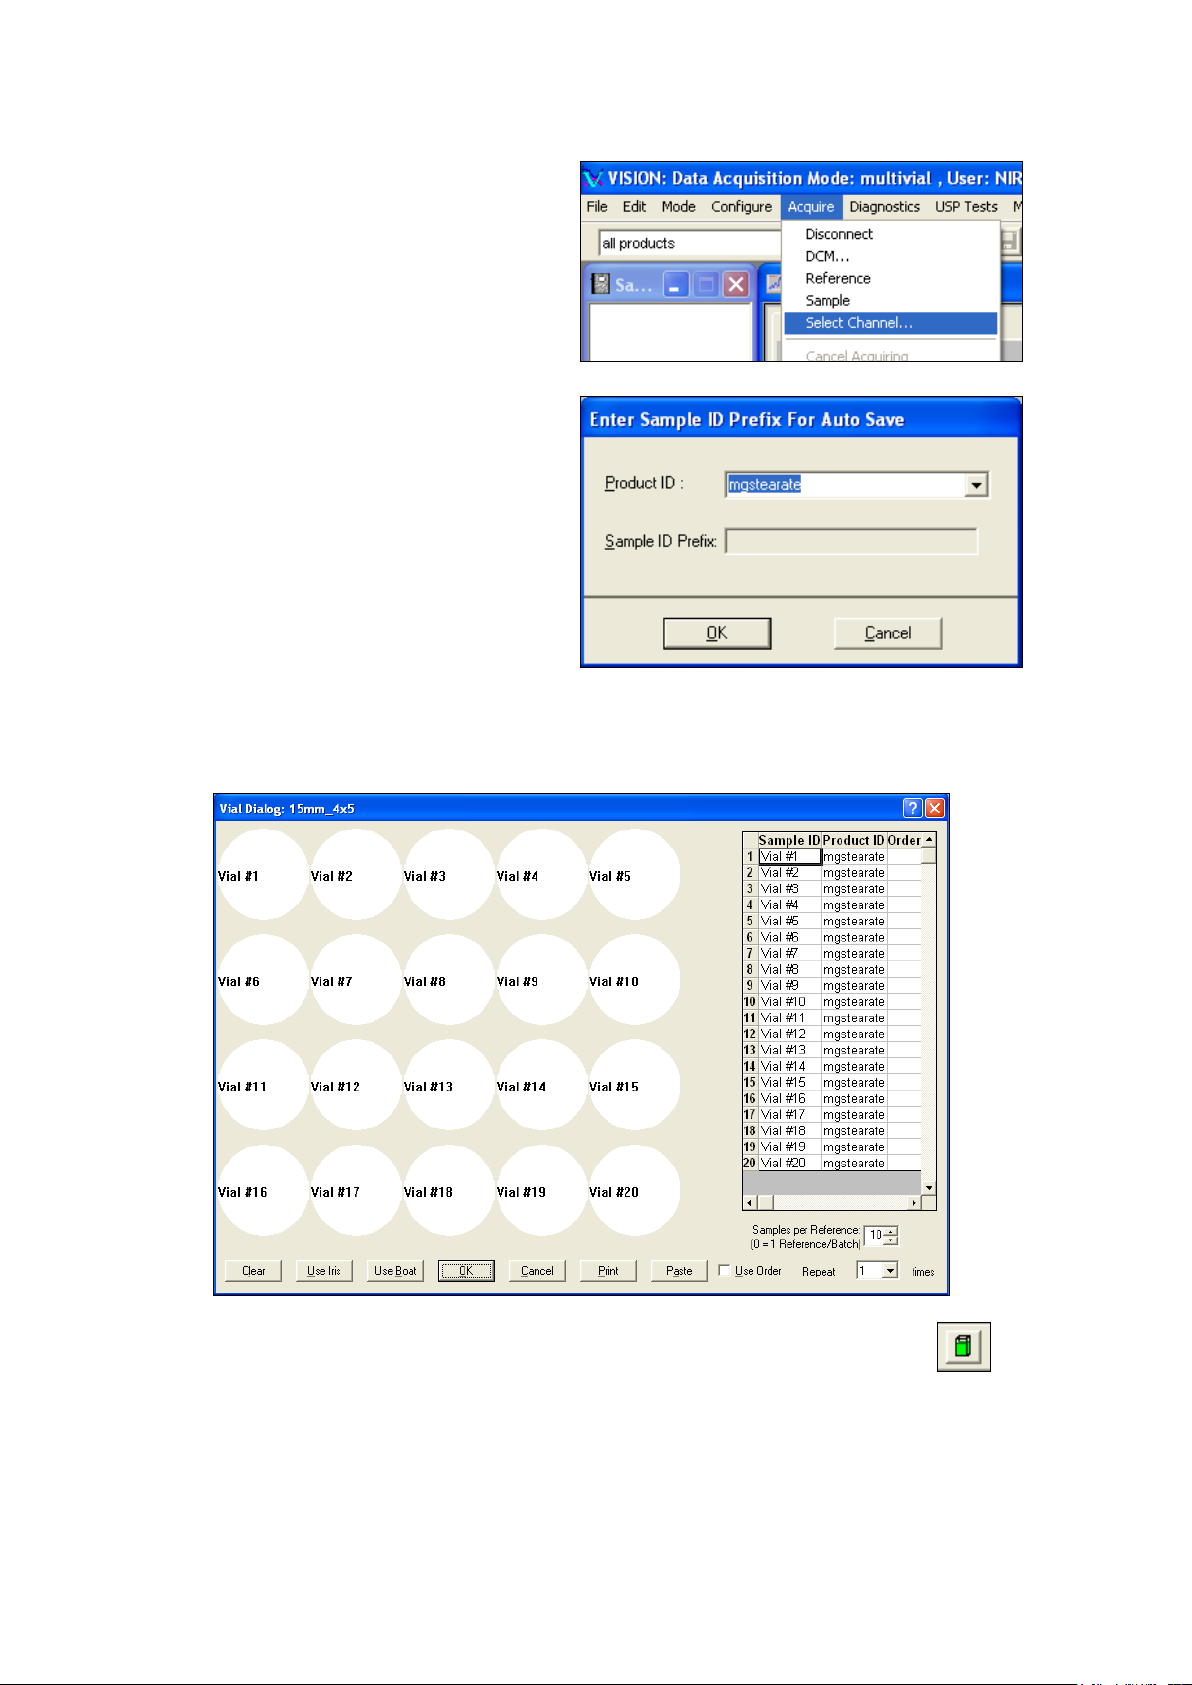
From the menu bar, go to Acquire, Select
Vision prompts for the Product ID using this
Note that the Vial Dialog box is also called when either of these actions is performed:
Channel.
dialog box. Enter the correct product name in
the Product ID field.
NOTE: If multiple products exist, click the
arrow to see all products, then highlight and
select the desired Product ID.
The Sample ID Prefix is not entered in this box –
that is done in the next screen.
Click “OK” when finished.
Vision displays this screen, which corresponds to the vial tray. Note that the Product ID is entered -this came from the previous dialog box.
1. The user clicks on the “Sample” Icon, or
44
Page 47
▪▪▪▪▪▪▪
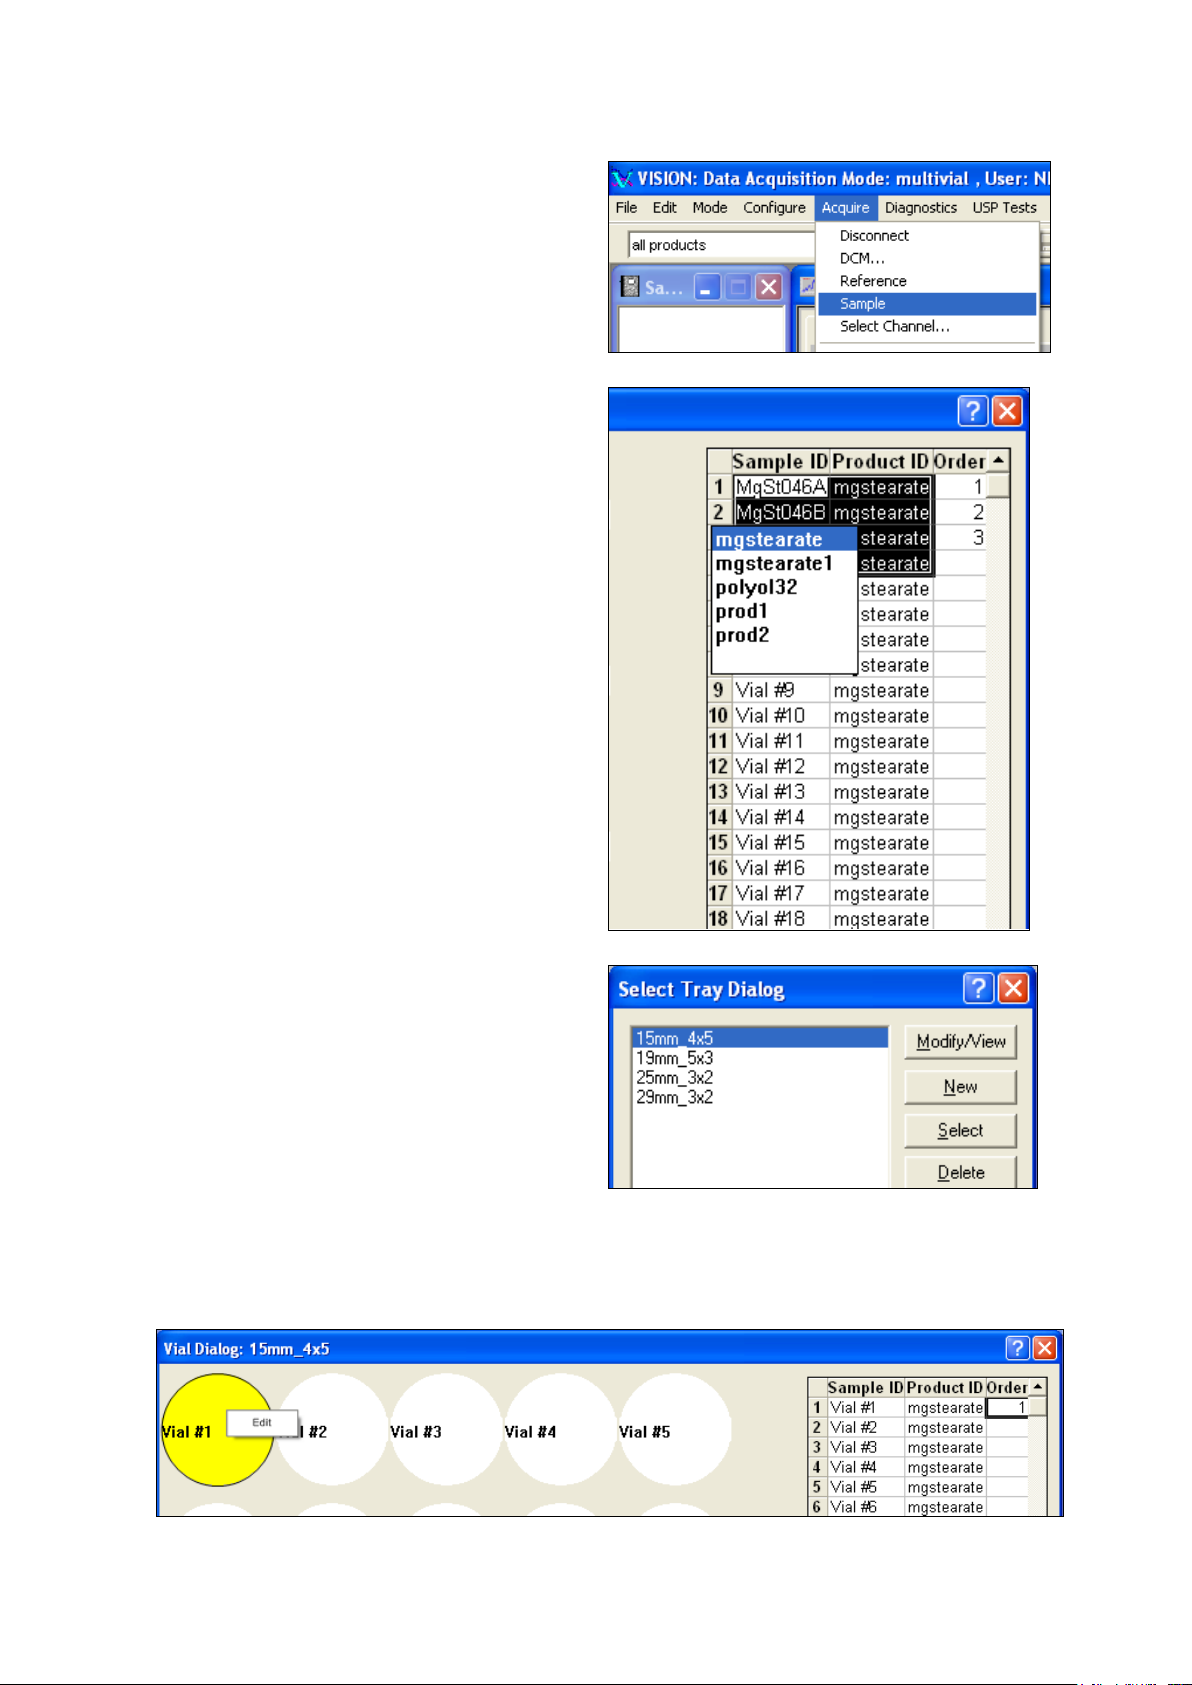
2. The user selects Acquire, Sample from
the File menu bar.
To change the Product ID, right-click over the
Also note that 20 vials are shown, in a 4 x 5
It is not necessary to acquire a reference first
with the MultiVial Analyzer, since it is
programmed to take a reference as part of the
scan sequence.
“Product ID” column. This brings up the
product selection menu.
Highlight the desired product, and press
“Enter”. This sets the product for the
highlighted rows.
configuration. This came from the Select Tray
Dialog box. (It is shown at right, as a reminder.)
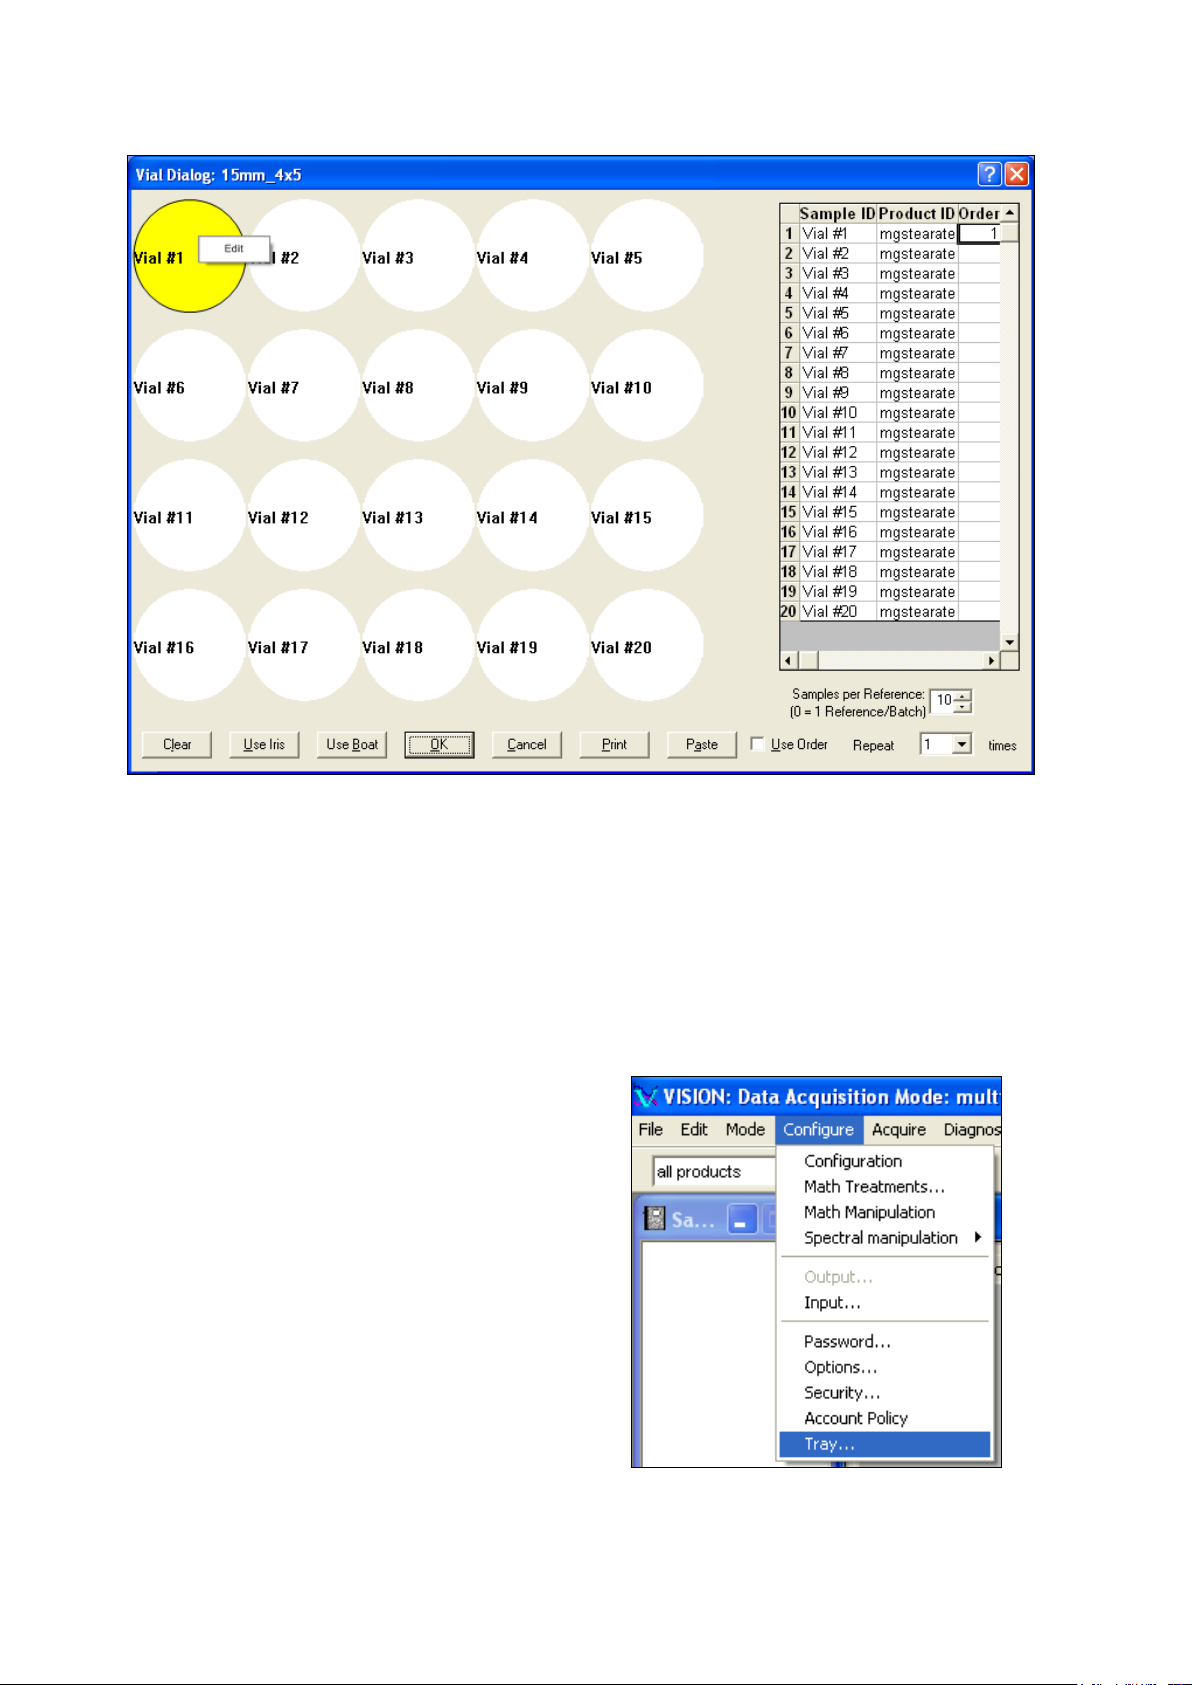
6.2.1 Sample ID Entry
There are several ways to enter the Sample ID:
Entry Method 1: Right-click on the circle that represents the vial position. The circle turns yellow (It
45
Page 48

▪▪▪▪▪▪▪
is shown with a circle here, for clarity in “black and white”.)
The “Edit” box appears as shown. Click on “Edit”, then type the sample name into the vial position.
Press “Enter”. The Sample ID will also be shown in the table at right, as shown below:
Vision fills in the “Order” column, in the entry sequence of sample ID. Note the “1” in the Order
column. Another sample name is filled in as shown below:
Continue to enter sample names in this manner, until all 20 positions are filled. Note that the vial
positions become yellow when active, and the sampling order is incremented in the “Order” column.
Do not click on the vial position and turn it white – that removes it from the “Order” column, and deactivates sampling on that vial.
Entry Method 2: Double-click on the upper part of the vial position, which brings up the box
shown:
The Sample ID may be typed into this box. Press “Enter” when finished.
While entering Sample IDs, the user may verify or change the Product ID. To do this, double-click on
the vial position below the center of the circle.
This shows the available products, with the selected product highlighted. If the user wishes to save a
given sample to a different product, it may be set using this screen. The Product ID will be updated in
46
Page 49

▪▪▪▪▪▪▪
the column at the right. Note that the Product must exist (that is, it must have been created within
the Project) to be used in this manner.
In the example shown, there are two “mgstearate” products shown. One has a suffix “1” that is not
shown due to window size. In practice, the user may wish to keep the names shorter, or use a prefix
instead of a suffix to identify products.
The user may right-click on the Sample ID and Product ID column to see the product list, as shown
above. (A double-left-click also opens this list) The Product ID may be edited in this manner also.
Entry Method 3: Click on the cell in the Sample ID column, and type the sample name directly into
the cell. Be sure to click the vial position (to turn it yellow) to make the vial position active.
The cell entry method is shown above, highlighted by the red border. The user may type a Sample ID,
then press “Enter” to move down to the next row. This speeds entry of a column of sample names.
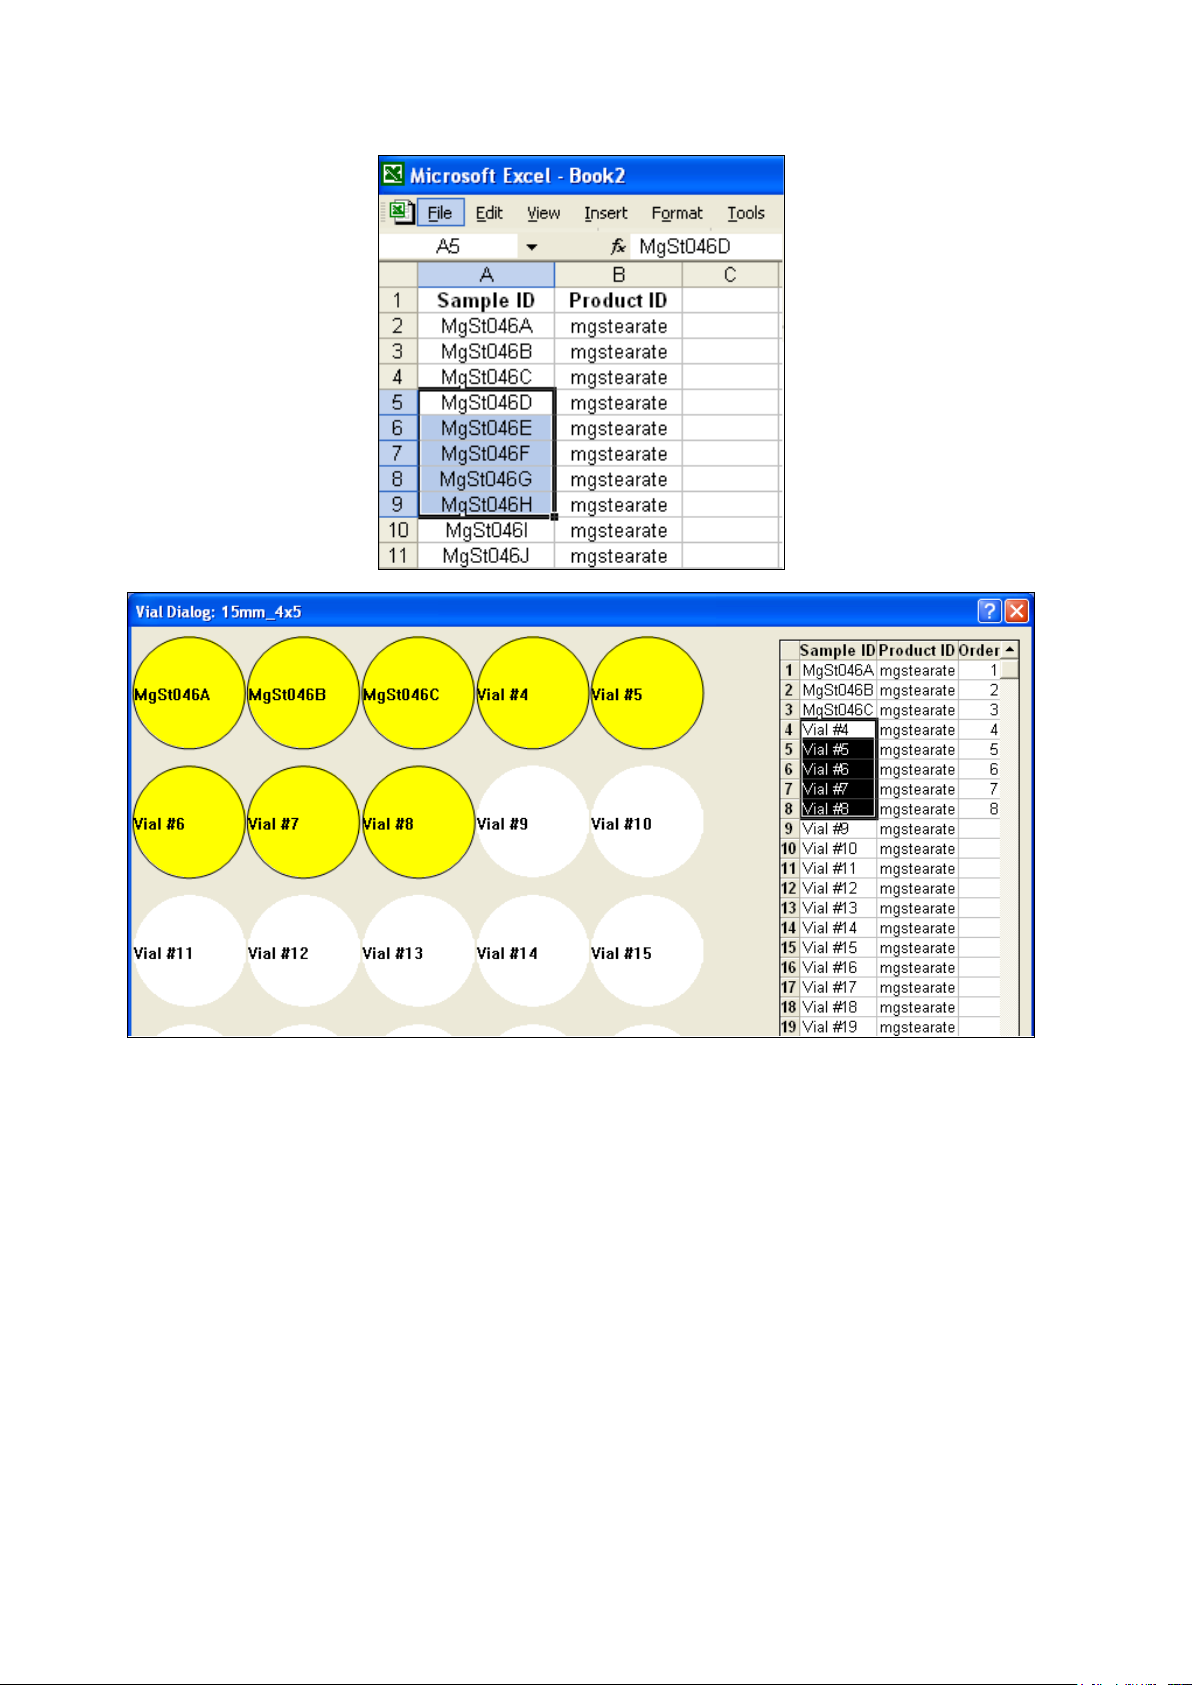
Entry Method 4: If the Sample ID names exist in an Excel spreadsheet, highlight those names in the
spreadsheet as shown at the right.
Hint: To select quickly, click on the first cell, hold the “Shift” key and click on the last cell. All cells in
between will also be highlighted.
Click “File, Copy”. Excel places the Sample ID names on the clipboard in Windows®.
Switch back to the Vision window.
47
Page 50
▪▪▪▪▪▪▪
Click on the vial positions to be entered, so they are yellow and active. (This may be done after
pasting Sample ID instead.)
Hint: To select quickly, click on the first cell, hold the “Shift” key and click on the last cell. All cells in
between will also be highlighted.
Highlight the Sample ID fields to be pasted as shown above. Click on the “Paste” button in the dialog
box. (It is outlined in red below.)
48
Page 51

▪▪▪▪▪▪▪
The Sample ID names are pasted into the column, as shown. In this case only five names were
pasted, for clarity. The entire column may be pasted, up to the limit of the vial positions.
Entry Method #5:
The user may use the right-click copy and paste method, as illustrated below:
This uses the Windows convention for pasting. Highlight the information to be copied, right-click,
and select “Copy”. Move the cursor to the destination field, right-click, and select “Paste”. The
information will be pasted into the field as desired.
49
Page 52
▪▪▪▪▪▪▪
There is a field for comments beside each sample.
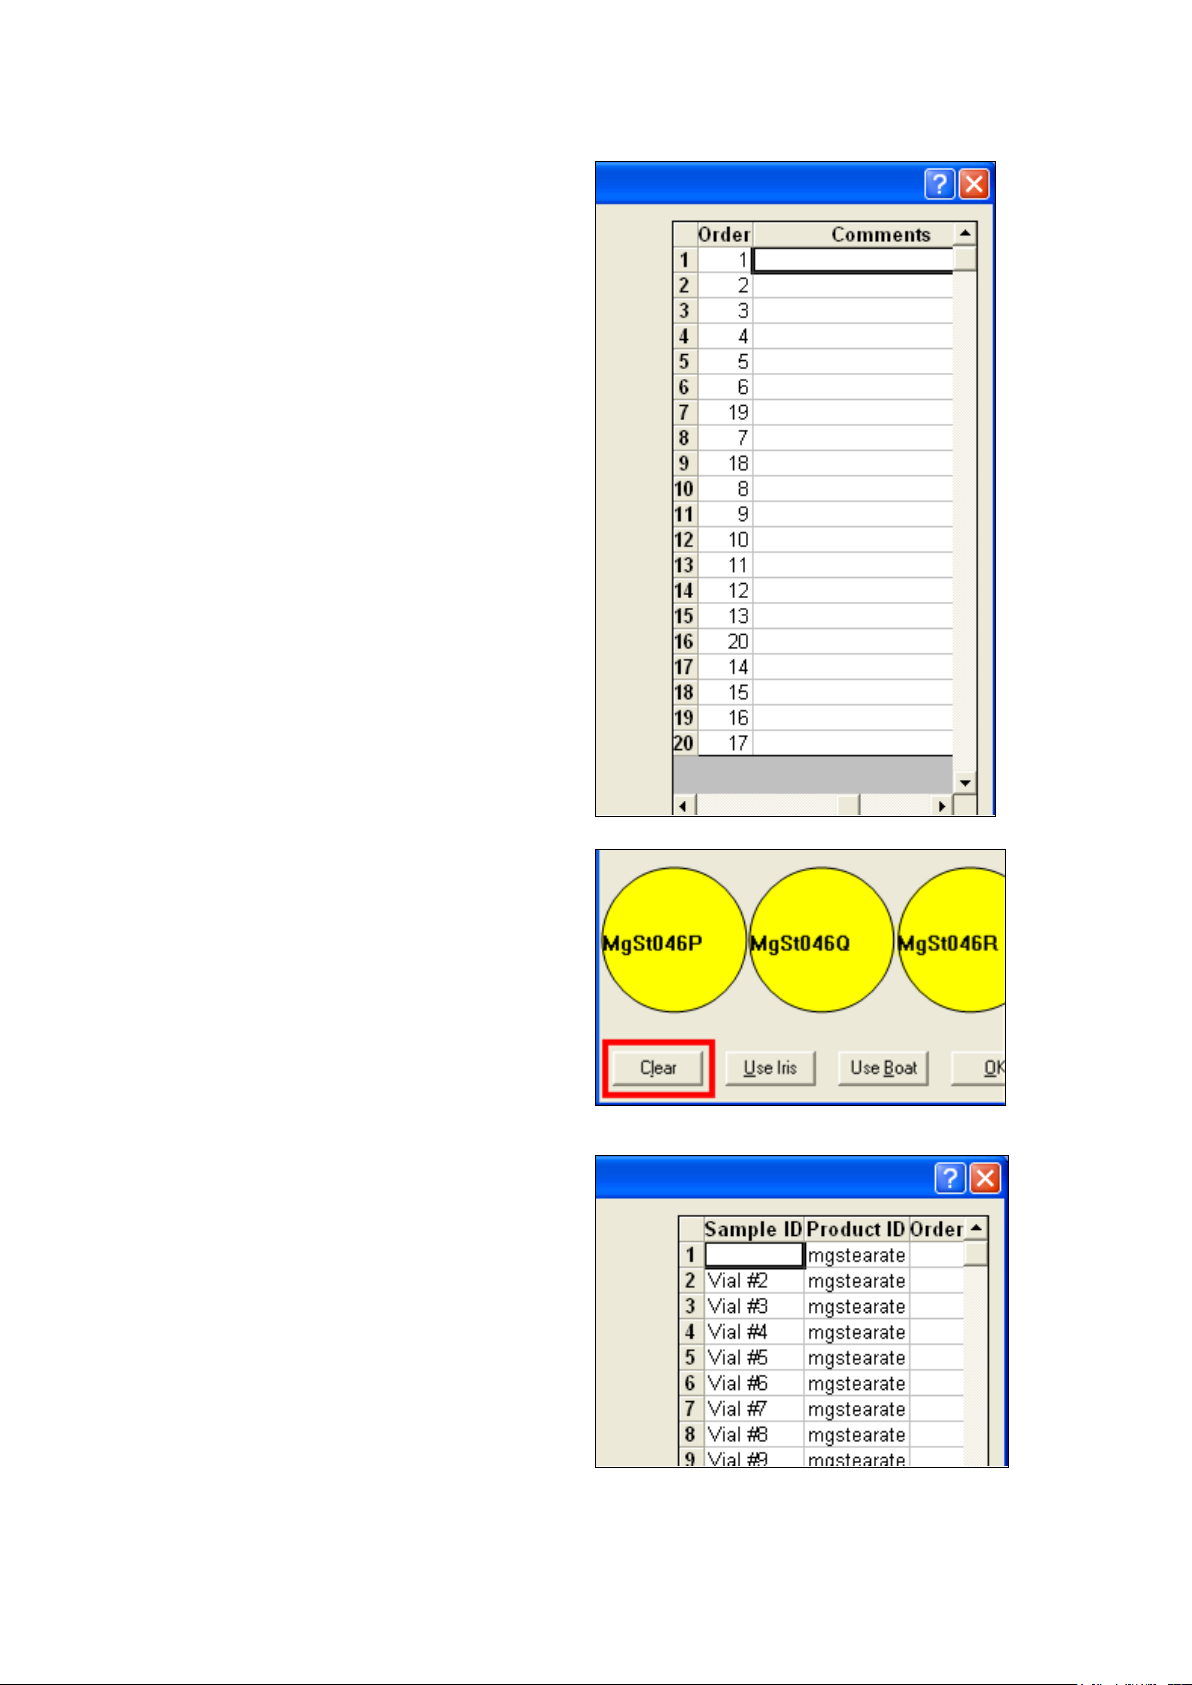
To remove all entries from the Vial Dialog screen,
To delete only one entry, highlight that entry and
To see this field, click the small arrow at the
bottom right, and the field will be visible.
Alternatively, use the “Tab” key. Start on the
Sample ID, Product ID, or Order, and tab over to
the “Comments” field.
Enter comments, if applicable. No entry is
required; this field is optional. The field is shown
here.
click on the “Clear” button, at the lower left
corner of the screen. This will clear the entire
Sample ID column. Click “OK” to close.
If this button was clicked, and was a mistake,
click the “Cancel” button. The Vial Dialog screen
will close. Select Acquire, Select Channel, verify
the product, and the original screen will be
displayed.
use the “Delete” key on the PC keyboard.
50
Page 53

▪▪▪▪▪▪▪
To delete multiple Sample ID names, highlight
those fields, and use the “Delete” key on the PC
keyboard. Vision will ask for confirmation, as
shown.
If the fields are to be cleared, click “Yes”.
Otherwise click “No”.
6.2.2 Order of Sampling
There are multiple ways to set the order of vial sampling. As a rule, it is faster to sample in the
sequence of the “Order” column, since this involves less movement of the MultiVial sampling
mechanism. This saves positioning time. If the Sample ID for each sample is entered in order, as
below, this is automatic.
51
Page 54

▪▪▪▪▪▪▪
At the bottom of the Vial Dialog screen is a
checkbox marked “Use Order”.
If this box is checked, the MultiVial Analyzer will
start with the sample marked “1” in the
“Order” column, and proceed numerically
upward through the order designated in the
“Order” column.
If this box is left unchecked, the MultiVial
Analyzer will proceed from vial position 1, to 2,
to 3, in numerical order of the physical vial
position in the tray. Vision will ignore the
“Order” column.
If the user plans to enable “Use Order” it is
important to set the order correctly.
Fortunately there is a method to set order easily, without losing Sample ID information.
In the example above, the order is out of sequence for samples, 7, 9, and 16. If “Use Order” is left
unchecked, Vision proceeds in order of Sample Number. No action is needed.
However, if the user wishes to set the sequence, the procedure is as follows:
1. Click on each vial position to be changed.
2. Re-click, and that vial’s “order” will be sent to the end of the sequence.
3. Because this may be difficult to achieve by setting one vial at a time, click on all vial positions,
to turn them white. Then click on each one, in the order desired. This will set the “Order”
52
Page 55
▪▪▪▪▪▪▪
column to the proper sequence.
4. Click on “Use Order” to have Vision follow the designated order.
6.2.3 Additional Vial Dialog Functions
There are several other important functions to be set or used in the Vial Dialog box. They are shown
below, and described in the text that follows.
Starting at the right side:
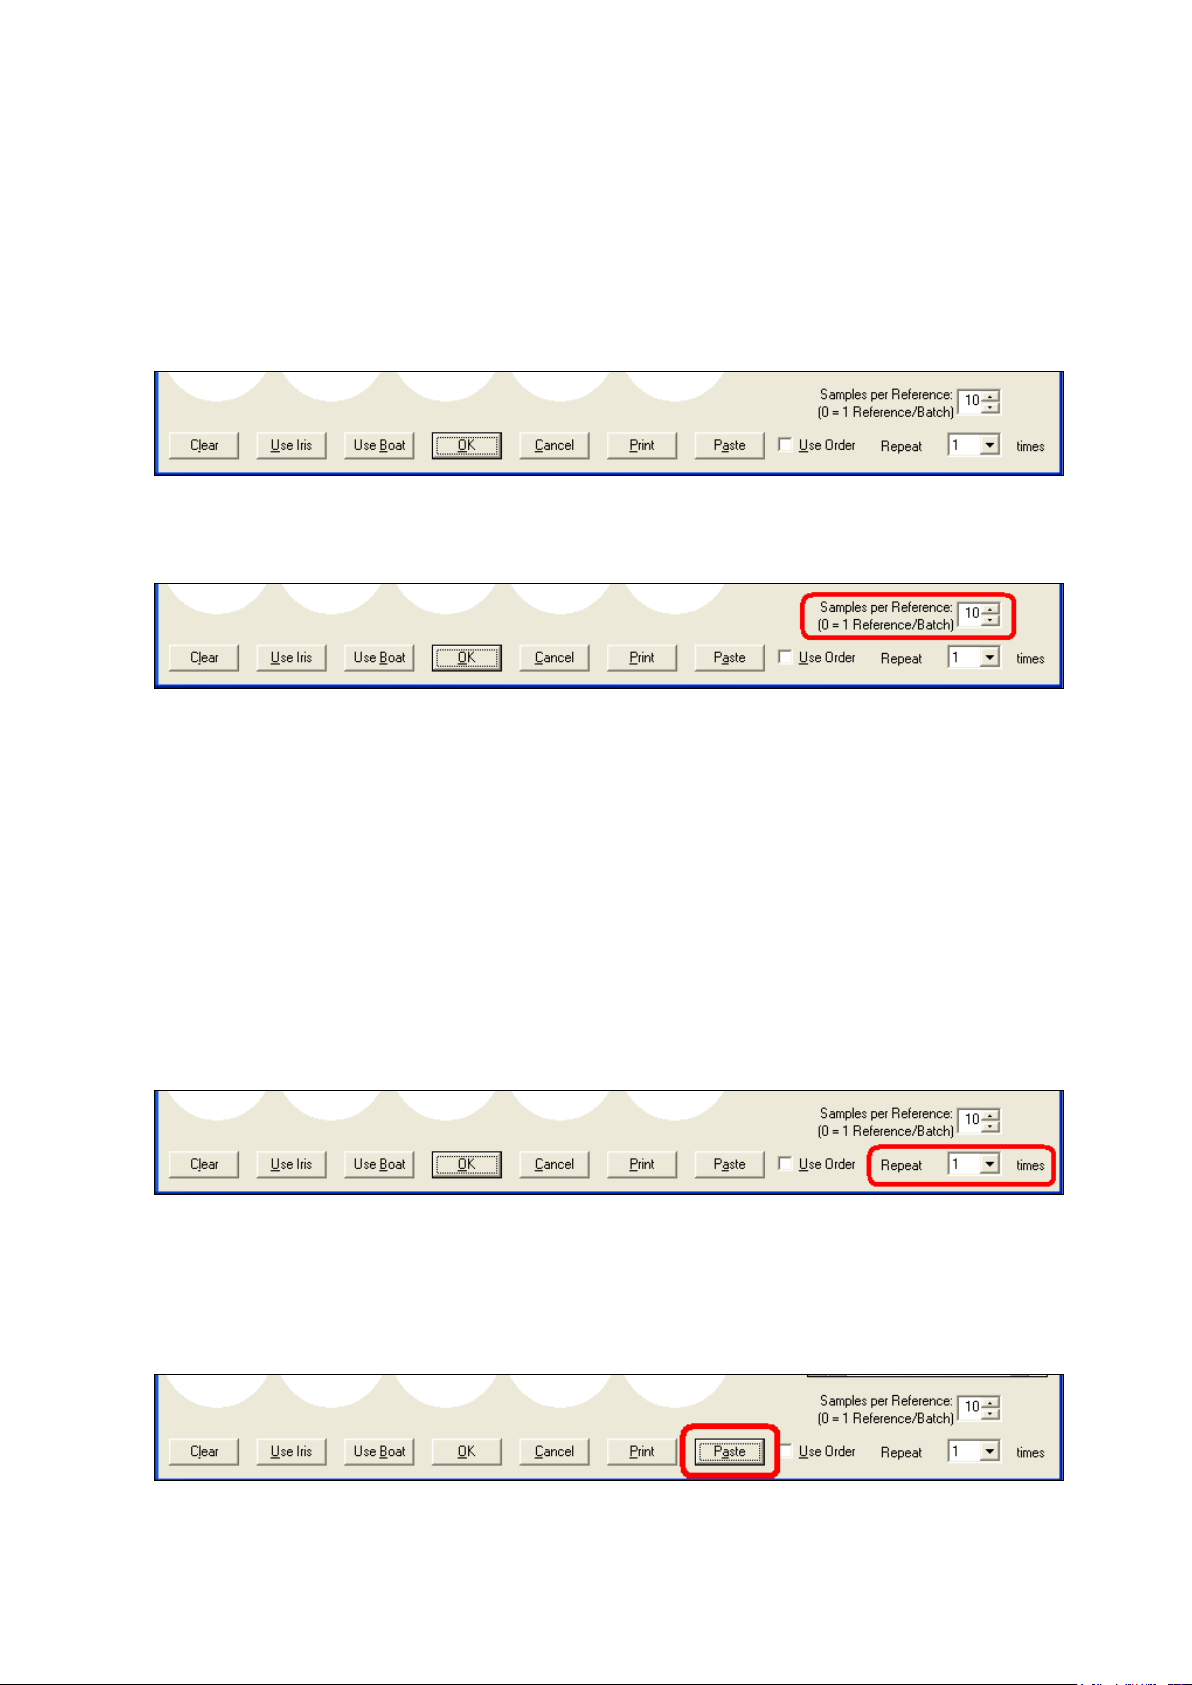
Samples per Reference:
This setting defines the number of sample spectra to be taken per reference scan. With multiple
samples, it is cumbersome to take a reference scan for each sample spectrum, and very timeconsuming. Because it is not necessary to take a reference spectrum for every sample scan, Vision
may use the same reference scan for a number of sample spectra.
The default is “10”, as shown above. This means that on a tray of 20 vials, Vision will take an initial
reference scan, then scan the first ten vials. Then Vision will take another reference scan, and go on
to scan the last 20 vials. If the tray has fewer than 10 vials, Vision will scan up to ten vials, if the
setting is “10”. If the setting is another number (other than 10) Vision will use that setting as the
maximum number of vials to be scanned per reference.
A “0” may be entered in this field, and Vision will scan the whole tray with a single reference scan.
Repeat:
A given tray may be scanned multiple times, to acquire “replicate” data. This is not often done,
though some users may want two or more replicates of the data for statistical reasons.
As a rule, this should be left at “1” unless there is a specific reason that replicates are required.
Paste:
As explained in the previous section, if the Sample ID names exist in an Excel spreadsheet, they may
be pasted directly into the table. The “Paste” button is used to place the Sample ID names into the
53
Page 56
▪▪▪▪▪▪▪
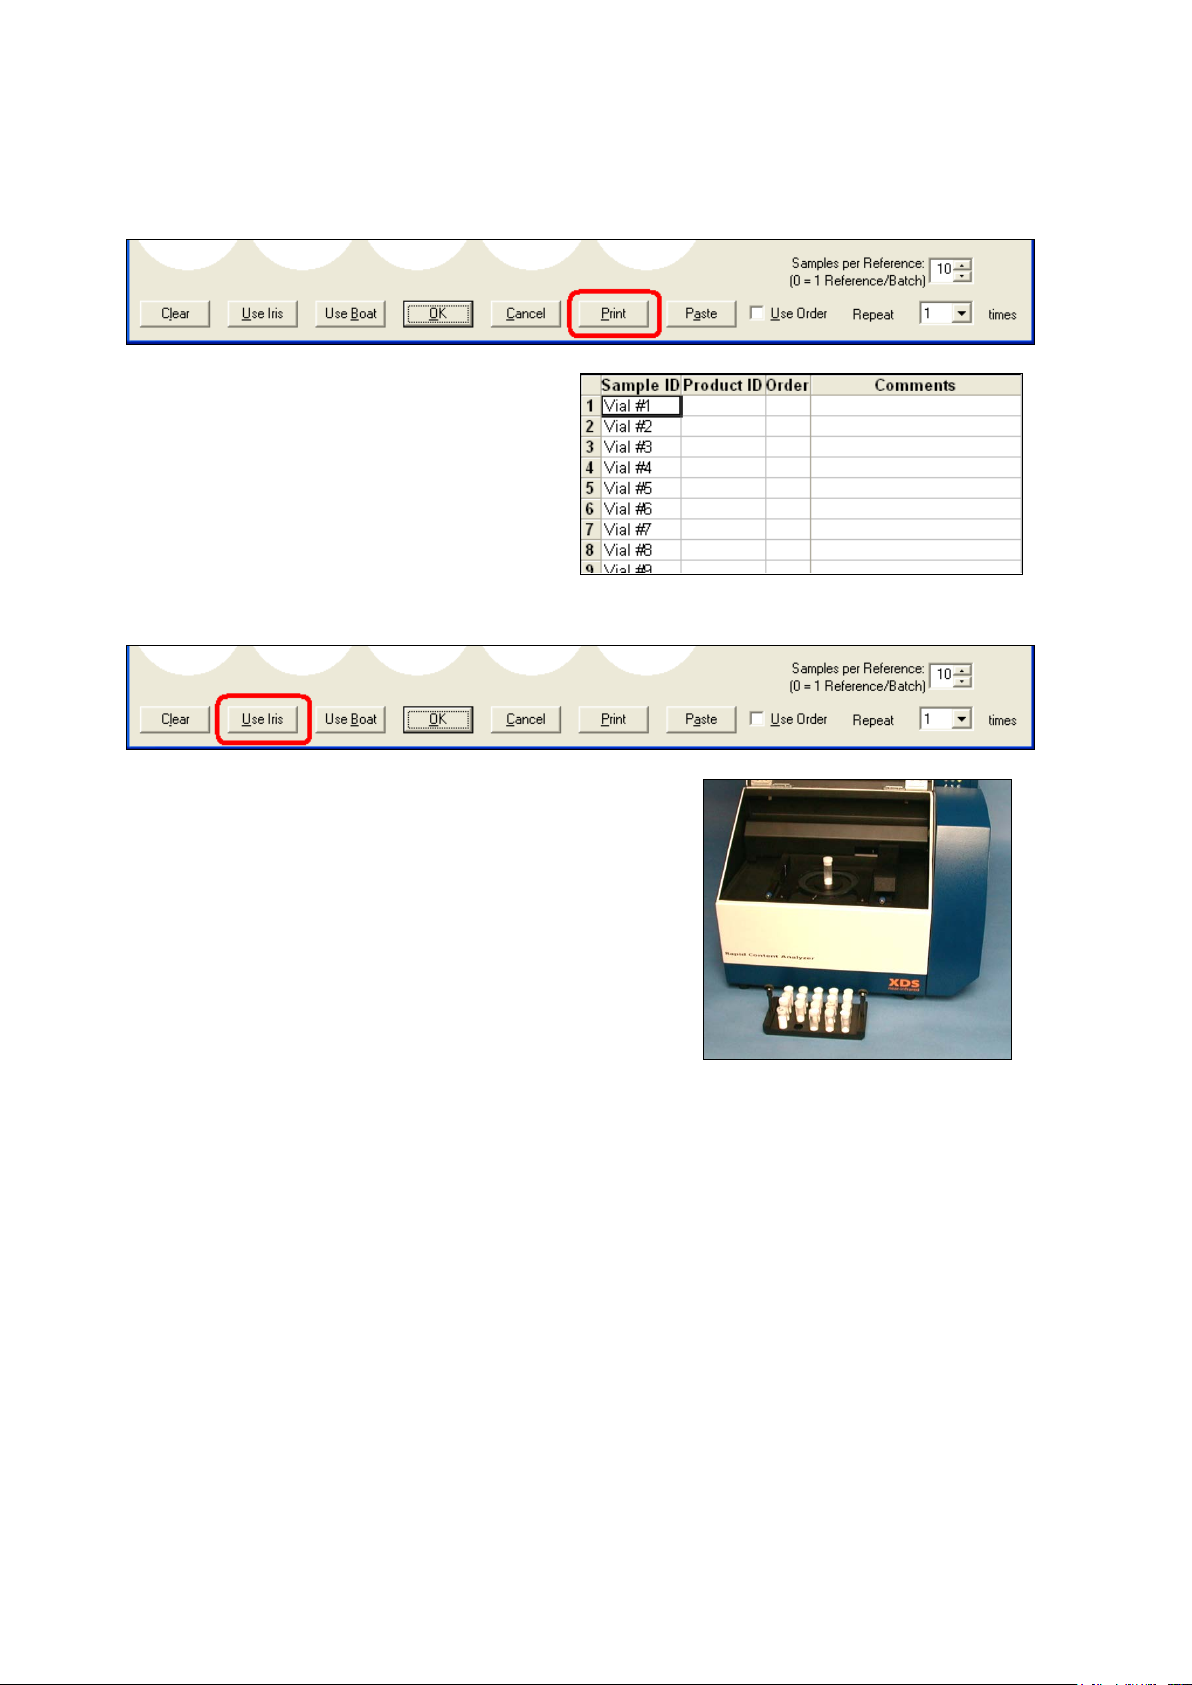
This prints the table containing the Sample ID,
If the user needs to scan a sample using the Iris Adapter, this
highlighted area of the table.
Print:
Product ID, Order, and Comments, as shown at
right.
The full length of the table will be printed – it is
cut off here for clarity. Print in “portrait” mode.
Use Iris:
box should be clicked. (This resets the choice made in the
“Select Tray” dialog box.)
The user should remove the tray. Vision will position the tray
mechanism out of the way, to allow the Iris Adapter to be
inserted.
When finished, the Iris Adapter should be removed, and the
tray re-inserted into the MultiVial mechanism.
Failure to remove the Vial Adapter will cause an error to be
reported in Vision.
54
Page 57
▪▪▪▪▪▪▪
To reset the mechanism for MultiVial trays, select
Configure, Tray to return to the Select Tray dialog
If the user needs to scan a sample using the large
box, and re-select “Use Tray”.
Use Boat:
Sample Cell (boat), this box should be clicked. (This
resets the choice made in the “Select Tray” dialog
box.)
The user should remove the tray. Vision will position
the tray mechanism out of the way, to allow the
sample cell to be inserted.
When finished, the sample cell should be removed,
and the tray re-inserted into the MultiVial mechanism.
Failure to remove the Sample Cell may cause an error
to be reported in Vision.
To reset the mechanism for MultiVial trays, select Configure, Tray to return to the Select Tray dialog
box, and re-select “Use Tray”. (This was illustrated in the section immediately preceding this one.)
OK:
The “OK” button saves the settings made and closes the dialog box. When the user initiates a sample
scan, the information in the dial box will be applied.
Clear:
55
Page 58

▪▪▪▪▪▪▪
The “Clear” button removes all data from the dialog box. The user should clear the box before entry
of information on a new tray.
Note that this clears the Sample ID, Order, and Comments. It does not clear the Product ID column.
To edit the Product ID, double click on that row and the selection list is shown.
Cancel:
This cancels all actions performed while the dialog box has been open. The box is closed, and
remains as it was before it was opened.
56
Page 59
▪▪▪▪▪▪▪
7 Instrument Diagnostics
Before use of the XDS Analyzer, some steps must
Vision provides diagnostics for instrument setup, which must be performed before use of the
instrument for analysis. Following these diagnostics, another set of diagnostics is provided to
evaluate the ongoing performance of the instrument. These are explained in the sections that follow.
The instrument must be set up with the Iris Adapter or Reference Tray for these diagnostics, as small
round sample cells are used. See section 5.4 for instructions on how to install the Iris Adapter.
7.1 Setup Diagnostics
be performed using Vision Software.
The “Options” for a given Project may be set. To
reach this menu, click on Configure, Options. The
menu shown at right is the default set of
selections. A brief explanation follows:
Instrument must stabilize before data acquisition:
This prevents spectral acquisition if the instrument
is cold.
Performance Test must pass before data
acquisition: This prevents the user from taking data
on a non-functional instrument.
Run performance test after wavelength
linearization: Forces user to run test sequentially.
This is not necessary with XDS.
Use Auto-Linearization:
Maintains correct wavelength registration
automatically, using internal wavelength materials
to keep instrument in precise adjustment over time.
Reference Standardization:
Used to create a virtual 100% reflectance reference, using a traceable photometric standard. This is
explained in a later section. Reference Standardization is performed on both the “Use Iris” level, and
on the “Use Tray” level on XDS MultiVial. This feature must be used to assure method transferability.
Blank Correction:
This is not used on this instrument. It applies only to the XDS Rapid Liquid Analyzer.
Master Standardization:
This method is not used with XDS. Do not select.
Use Instrument Calibration (XDS only):
This is a method to adjust the instrument wavelength profile to an external, traceable wavelength
standard. This feature must be used to assure method transferability.
Use Window Correction (XDS only):
57
Page 60
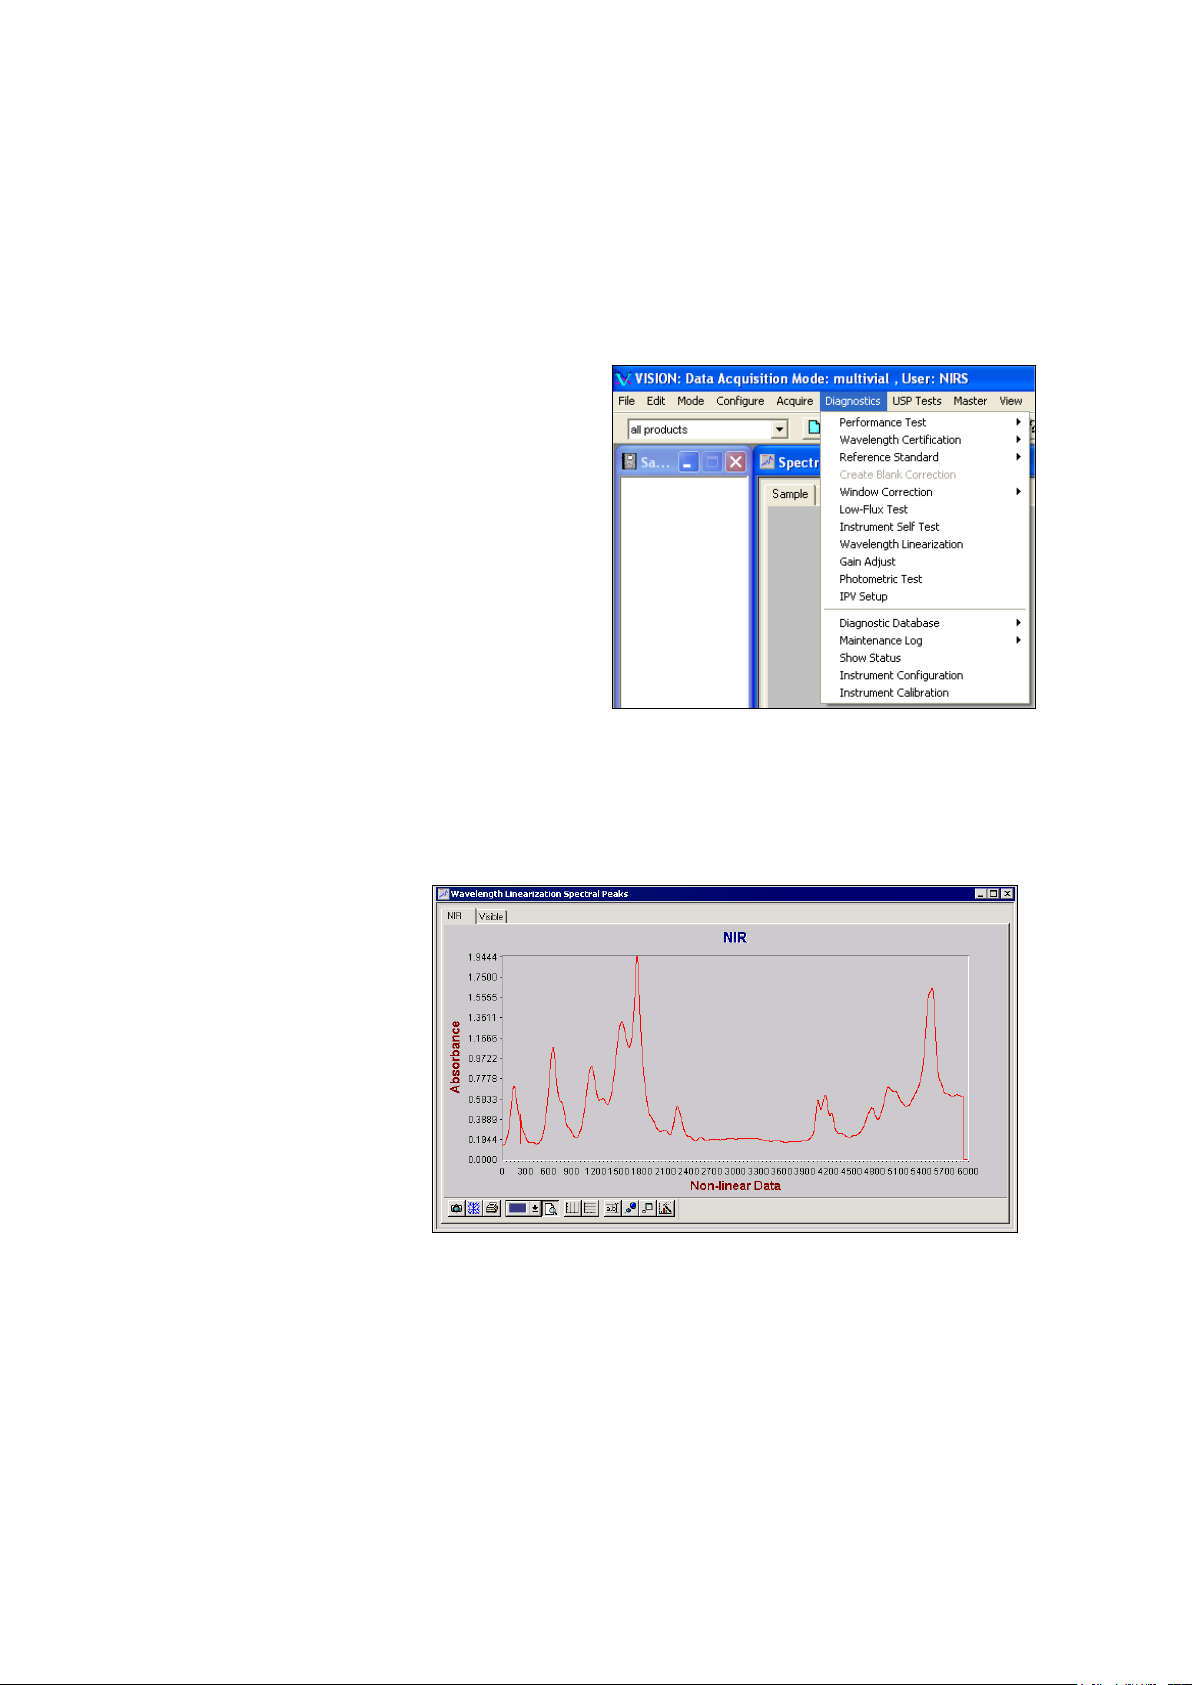
▪▪▪▪▪▪▪
Some of these selections are spectroscopic
The NIR wavelength positions
This feature is used only with XDS Process instruments that operate with Transmission Pair probes.
Do not select.
Instrument matching (method transferability) requires that Reference Standardization and
Instrument Calibration be selected, and that Certified Standards are used when required to
maintain calibration. These calibrations should be run when indicated by Photometric Test
(Reference Standardization) and Wavelength Certification (Instrument Calibration).
calibrations, and are used to apply corrections to
the instrument to minimize differences between
units of the same configuration.
The correction programs are accessed from the
Diagnostics menu bar, shown at right. The
diagnostic steps are explained in the sections that
follow.
7.1.1 Wavelength Linearization
Wavelength Linearization uses an internal wavelength material set to determine a set of internal,
arbitrary peak positions that the instrument will use to maintain repeatability of wavelength response.
of these peaks appear as
shown.
The scale of this display is
marked in encoder pulses,
which do not relate to
nanometers directly.
From the peaks, a linearization
is performed, which allows
assignment of nanometer
values.
58
Page 61
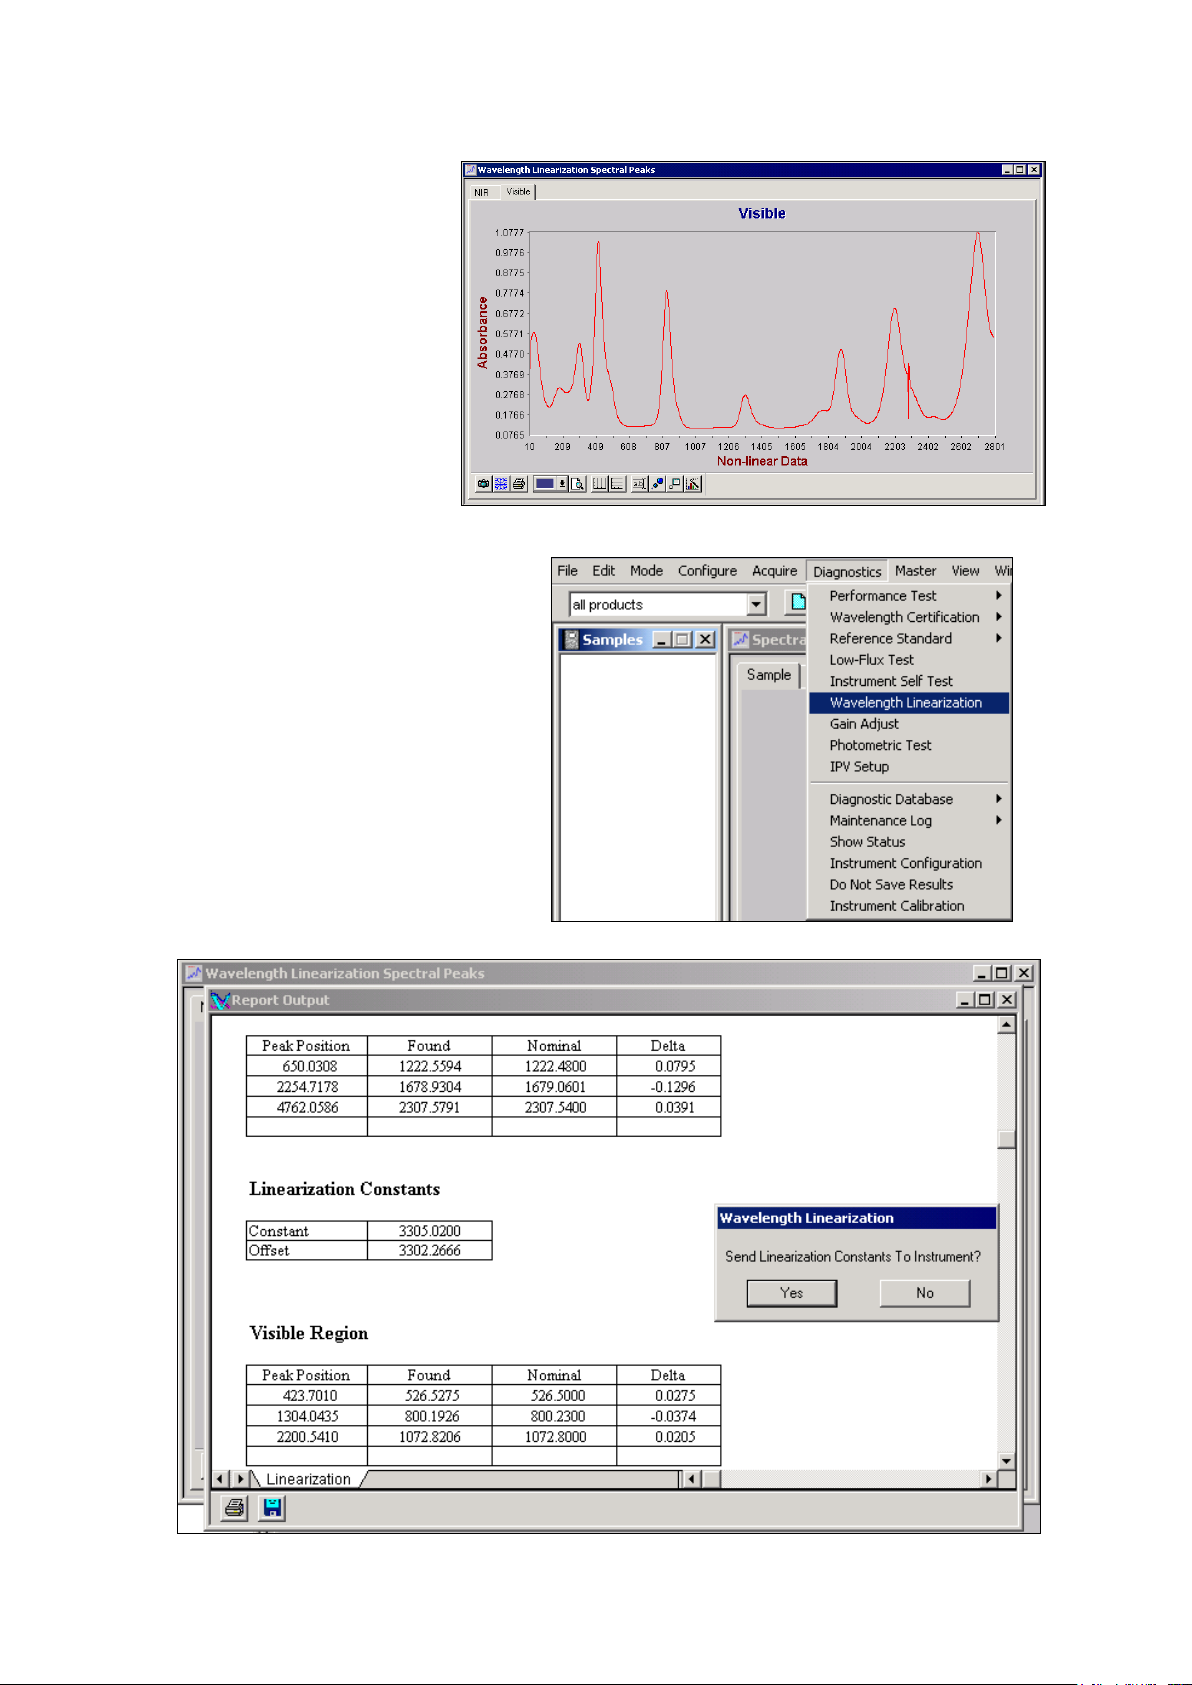
▪▪▪▪▪▪▪
The “visible” portion of the
spectrum is similar. A
These peak positions are not meant to be
linearization is applied to this
portion of the spectrum.
Minor artifacts appear in these
raw spectra due to detector
crossover and other
spectroscopic reasons. After
linearization these artifacts are
minimal or not evident, some
being beyond the usable range
of the instrument.
traceable, as the true wavelength
calibration of the instrument is done on
an external standard, traceable to NIST.
The internal wavelength materials are
used to maintain the external wavelength
registration by use of software
adjustment for any external effects on
the instrument.
Select Wavelength Linearization from the
Diagnostics menu. The instrument will
scan the ceramic reference.
59
Page 62
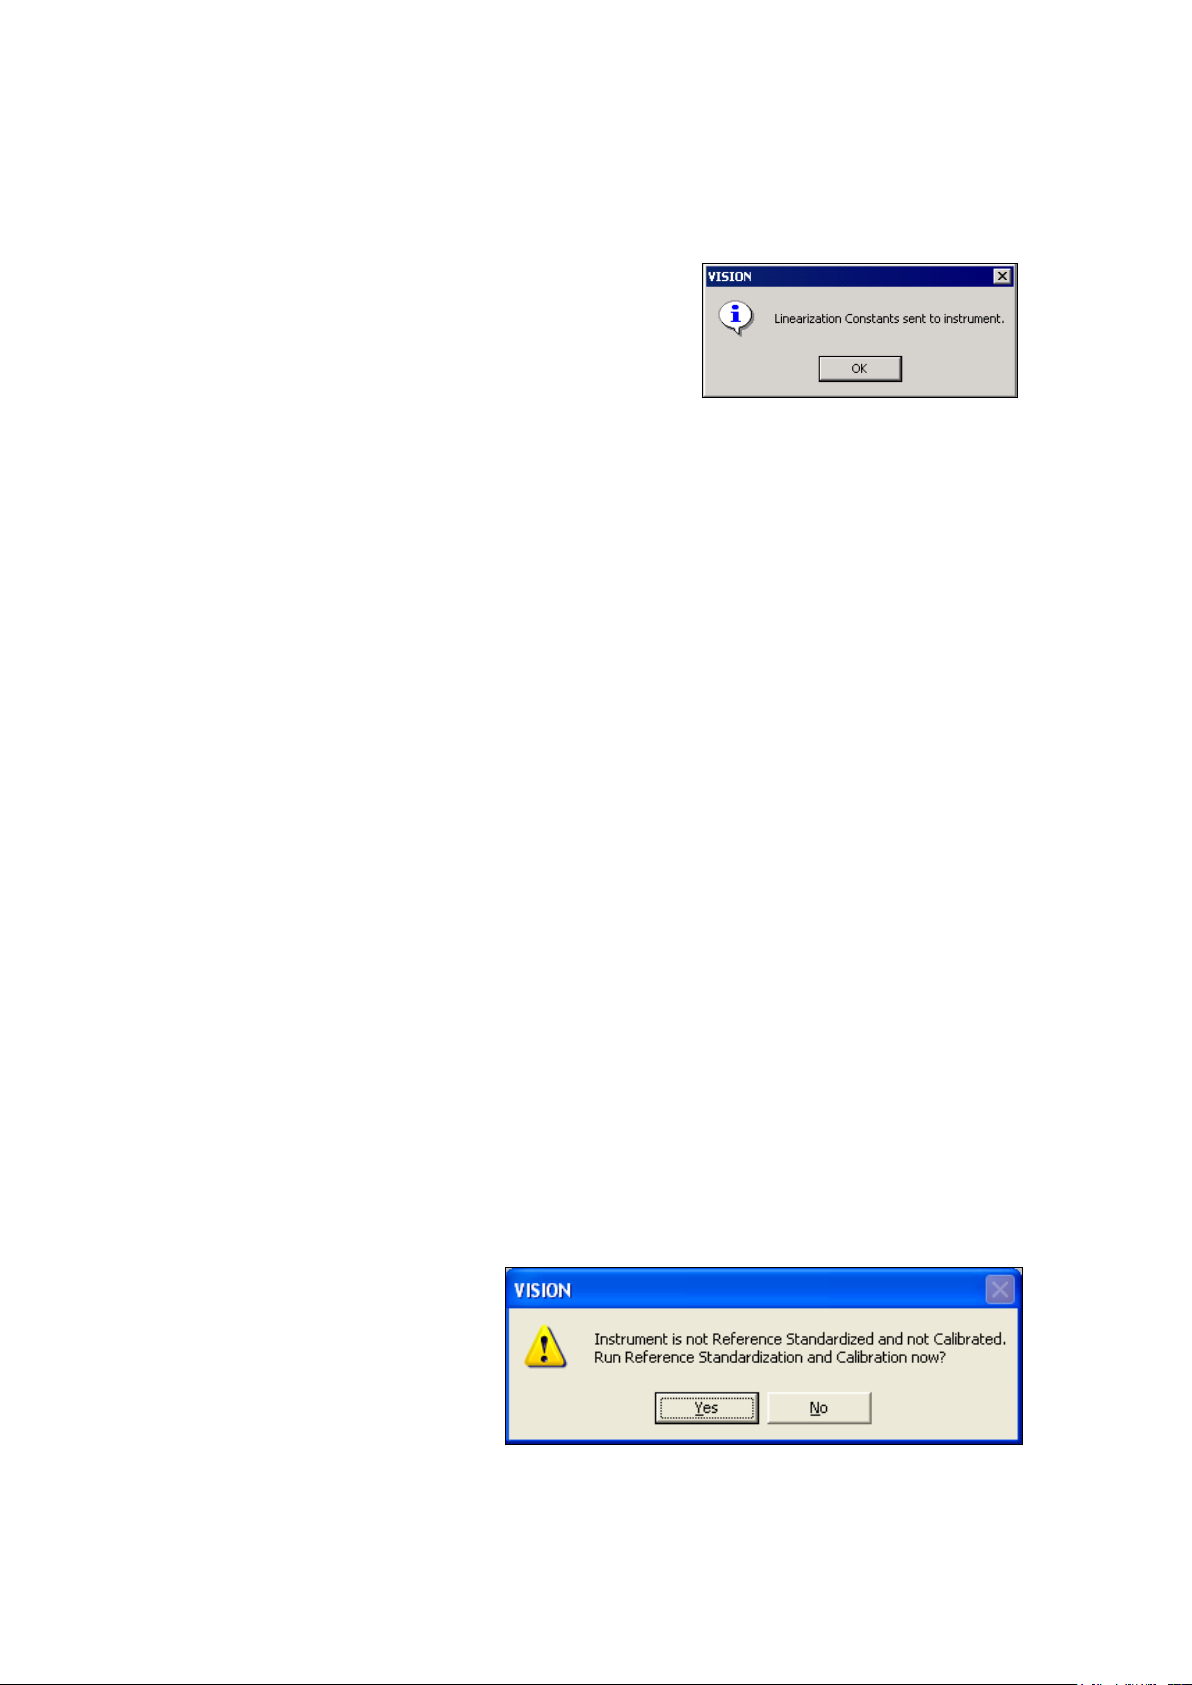
▪▪▪▪▪▪▪
After the linearization is successfully sent to the instrument,
NOTE: In the event that Vision does
The results screen shown above is typical. Peak positions for the reference materials are located using
a peak-finding algorithm. These “found” peaks are compared to the nominals. Differences should be
no more than 0.4nm for any peak. Click “Yes” to send the linearization to the instrument.
this message confirms the transfer.
Click “OK” to proceed. This is run in each direction of grating
motion. Continue until finished.
7.1.2 Reference Standardization, “Use Tray” Position
Reference Standardization is a method to provide a virtual 100% reflectance reference at each data
point, to serve as a true spectroscopic reference with no character attributable to the physical
reference used. This is important to achieve a high-quality spectrum on each instrument, and to
enhance transferability between instruments.
A photometric standard of known reflectivity (as measured on an absolute reflectance scale) is
scanned on the instrument. The internal ceramic standard is scanned. The differences of the ceramic
standard from 100% reflectivity are mapped, and a photometric correction is generated. This
correction is then applied to every spectrum taken on the instrument, to make each spectrum appear
as if taken with a reference of 100% reflectance. This assures that bright samples do not saturate the
instrument, or produce negative absorbance values.
The MultiVial Analyzer requires two reference standardizations, one for each sampling
level.
The first level is with a vial directly on the sample window, in “Use Iris” mode, with the Iris Adapter.
The second level involves the MultiVial tray, in “Use Tray” mode, where the vial tray is slightly above
the sample window. Vision applies the correct Reference Standardization based upon selection of
“Use Iris” or “Use Tray” in the Configure, Tray menu.
To account for the difference in sampling height, the background reference is adjusted using
Reference Standardization. The benefit of this system is that only one calibration (or library) is
required, and serves both sampling levels. (Without this system, two sets of calibrations [or libraries]
would be required for operation.)
To repeat: Vision software stores the two Reference Standardization files, which are downloaded to
the instrument, and are applied as a correction to each spectrum. (Vision knows which file to use
based upon selection of the “Use Iris” or “Use Tray” in the Tray dialog box.)
not find a Reference Standardization
where it is needed, it will prompt for a
new one upon connection as shown.
When a new Reference Standardization
is performed, Vision may ask for a new
Instrument Calibration as well.
Follow these steps to create a reference standard. The instructions are shown for the “Use Tray”
position. Upon completion of these steps, select the “Use Iris” position and perform a Reference
60
Page 63
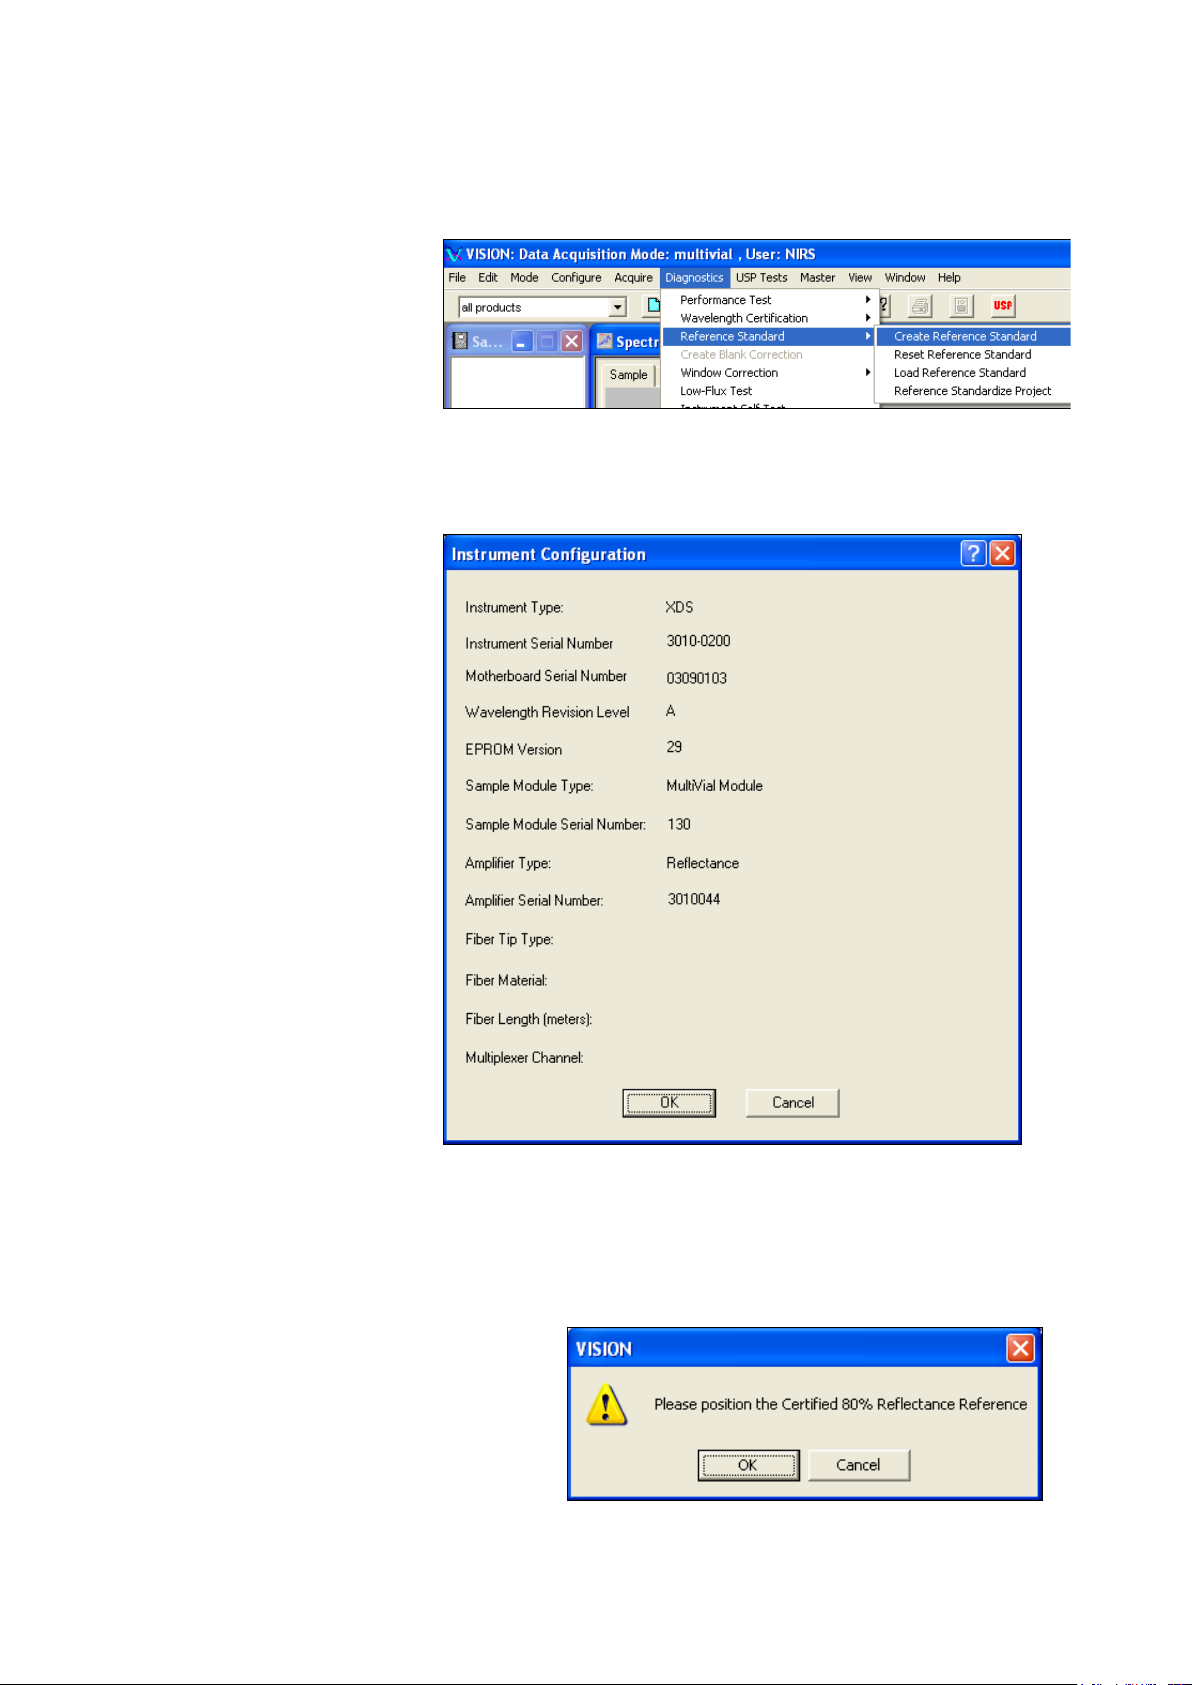
▪▪▪▪▪▪▪
Standardization using the Iris Adapter, without spacers.
Select Diagnostics, Reference
Vision briefly displays a dialog box which indicates that the instrument reference is being placed
Vision requests that the Certified 80%
Reference Standardization may be performed in this order, or “Use Iris” first, and “Use Tray” second.
Standard,
Create Reference Standard.
Vision prompts for the
instrument reference. The
XDS MultiVial Analyzer has an
internal instrument ceramic
reference which is positioned
automatically.
When Vision first
communicates with the
instrument (or after
disconnection and reconnection) this screen is
shown.
Vision must establish the
configuration and have it
verified by the user. This
assures that test data is sent
to the correct location in the
Diagnostic Database.
If the Sample Module Serial
Number field is empty, locate
the sample module serial
number on the side of the
module. Record the serial
number and enter it in this
field.
Click “OK to accept the
instrument identification.
into position. With the MultiVial Analyzer, this is automatic. No user action is required.
The status bar indicates scan progress.
Reflectance Reference Standard be placed
in the sampling area.
61
Page 64
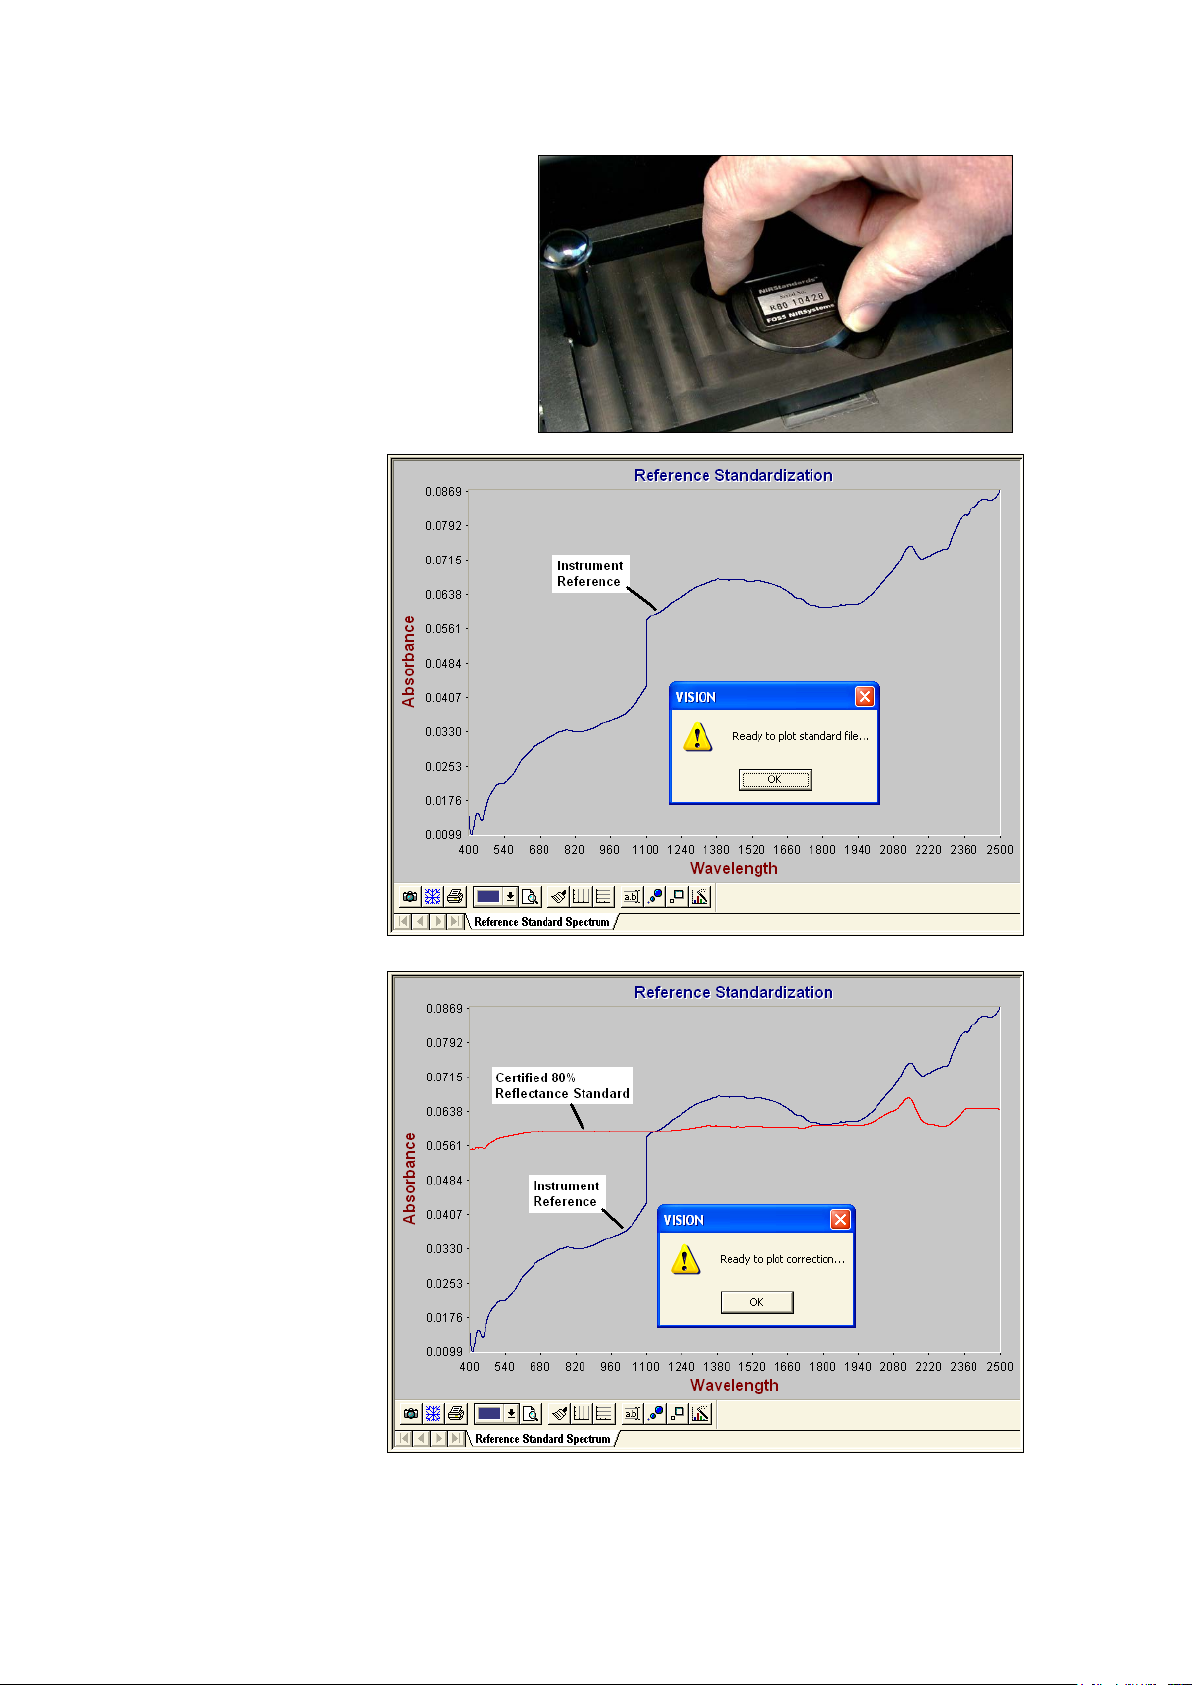
▪▪▪▪▪▪▪
Place the standard as shown, with the
Vision plots a spectrum of
The Certified 80%
identifying label parallel to the long axis of
the tray.
Close the cover, and click on “OK”.
the ceramic instrument
reference, as shown. (The
spectrum will be light blue
on the screen – it is
plotted in a darker color
here for readability.)
Next, Vision takes a
spectrum of the Certified
80% Reflectance Standard,
as indicated by the status
bar on screen.
Click “OK” to plot a
spectrum of the Certified
80% Reflectance Standard
in the next window.
Reflectance Standard is
shown with the spectrum
of the ceramic instrument
reference.
Click “OK” to plot a
correction spectrum in the
next window.
62
Page 65

▪▪▪▪▪▪▪
The correction spectrum
represents the amount of
A final spectrum (green
spectral correction
required to provide a
virtual 100% reflectance
reference at each data
point.
Click “OK” to plot the
correction spectrum in the
next window.
when plotted on-screen) is
plotted to verify that the
corrected spectrum
produces the same results
as the Certified 80%
Reflectance Standard.
Click “Close Report” to
continue. The correction is
automatically downloaded,
and is saved in the
Diagnostic Data Base.
The “Use Tray” correction
will be applied in real time
to all spectra taken with a
DCM where “Reference
Standardization” is
checked, and a tray is
used.
Next, perform a Reference Standardization in the “Use Iris” position. Be sure to select “Use Iris” in the
tray menu. Follow instructions for removal of tray, and insertion of the Iris Adapter. Repeat steps
given on pages 45-47 in the “Use Iris” position. The Reference Standardization will be stored for use
when scanning sample in the “Use Iris” mode.
NOTE: Perform Reference Standardization immediately after changing the spot
size, to have the proper reference correction loaded in the instrument.
Note that cleanliness of the sample window is very important when this program is run. If the
window is not extremely clean, the character of the window contamination will be imparted to the
Reference Standardization correction. Therefore, maintain a clean window at all times.
63
Page 66
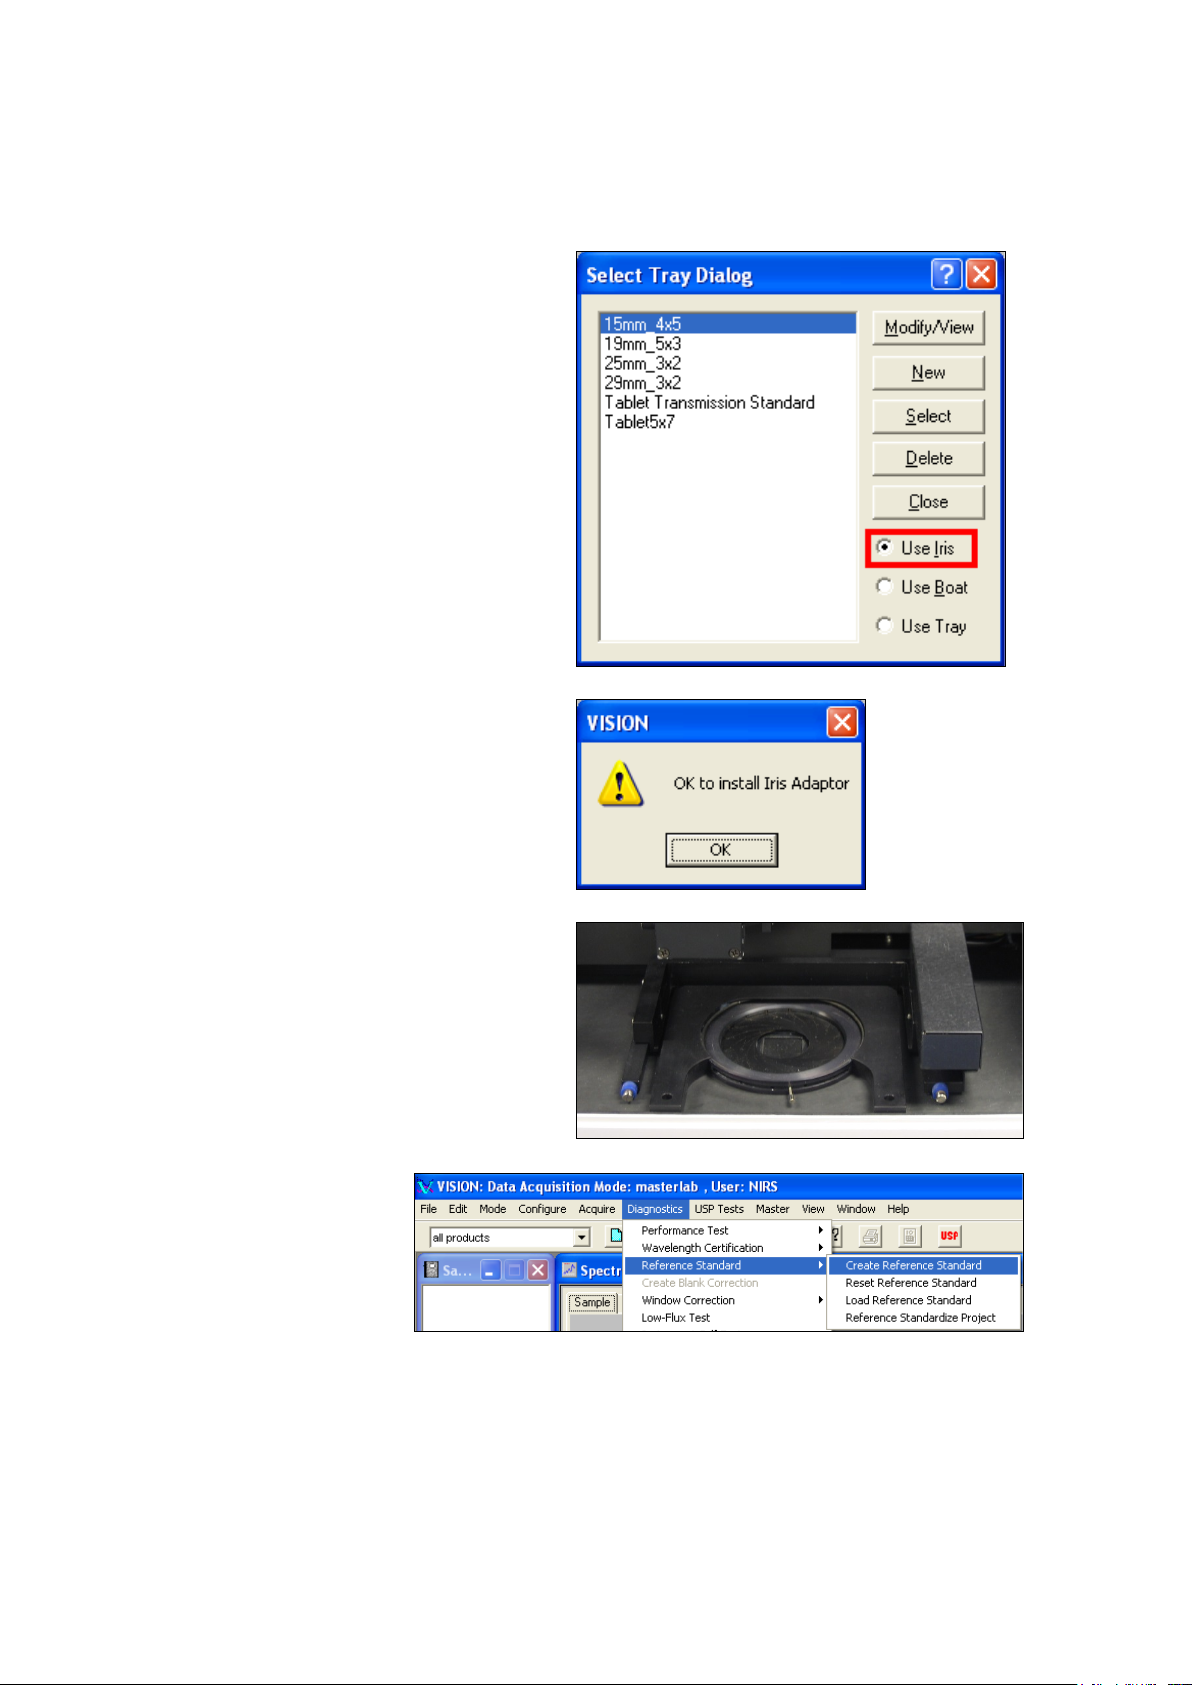
▪▪▪▪▪▪▪
First, verify that “Use Iris” is selected in the
Vision will advise the user to insert the Iris
Click “OK” and insert the Iris Adaptor as
Select Diagnostics, Reference
7.1.3 Reference Standardization, “Use Iris” Position
Next we will perform Reference Standardization in the “Use Iris” mode.
Select Tray Dialog box.
Adapter after the sample carriage mechanism is
reset. Do not insert the Iris Adapter until the
message is given by Vision.
shown.
Standard,
Create Reference Standard.
Vision prompts for the
instrument reference. The
XDS MasterLab Analyzer has
an internal instrument
ceramic reference (reflectance
only) which is positioned
automatically.
64
Page 67
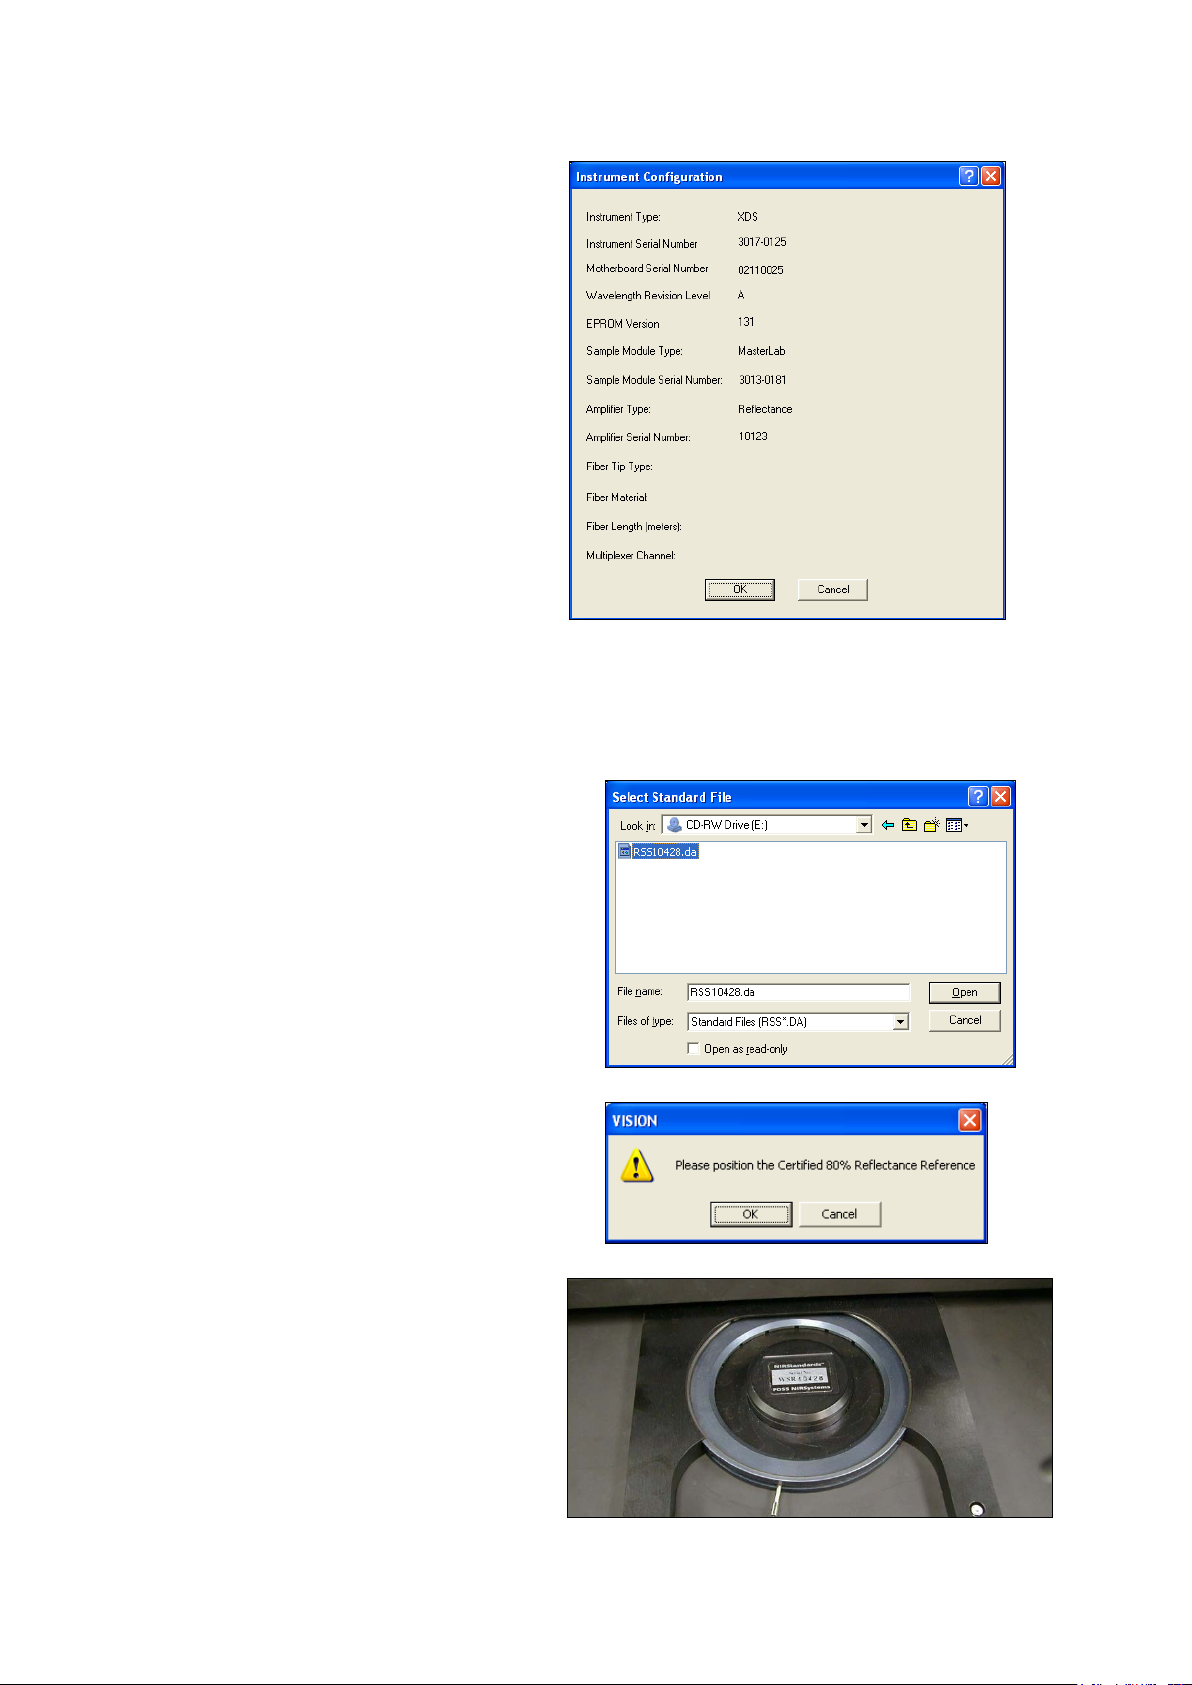
▪▪▪▪▪▪▪
If Vision displays the Instrument
Configuration screen again, click “OK to
Vision briefly displays a dialog box which indicates that the instrument reference is being placed
Vision requests the “Standard File” for the
Vision requests that the Certified 80%
accept the instrument identification.
into position. In reflectance, this is automatic. No user action is required.
The status bar indicates scan progress.
Certified Wavelength Standard.
Place the mini-CD into the CD drive, and select
the standard file. Click “Open”.
Reflectance Reference Standard be placed in
the sampling area.
Place the standard as shown, with the
identifying label parallel to the long axis of
the tray.
Close the cover, and click on “OK”.
65
Page 68
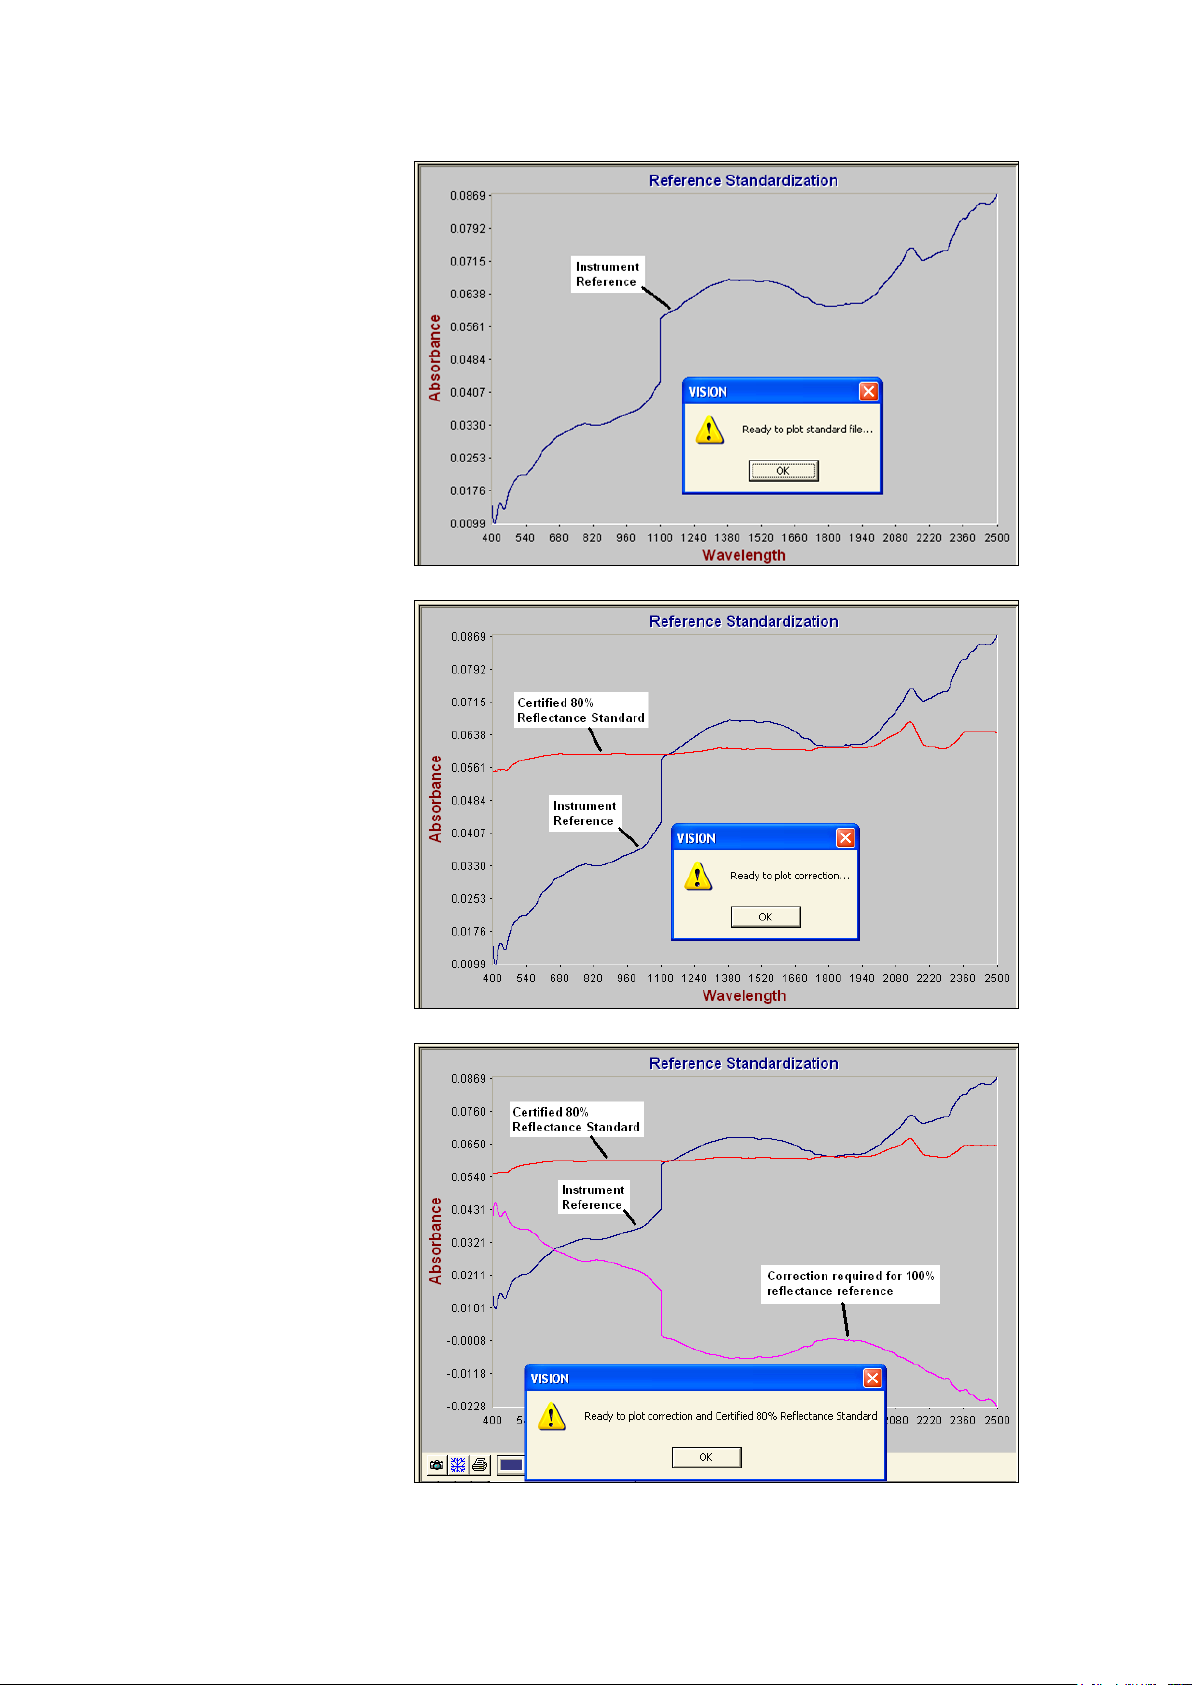
▪▪▪▪▪▪▪
Vision performs the same
The Certified 80%
The correction spectrum
operations as done on the
previous Reference
Standardization.
Click “OK”.
Reflectance Standard is
shown with the spectrum of
the ceramic instrument
reference.
Click “OK” to plot a
correction spectrum in the
next window.
represents the amount of
spectral correction required
to provide a virtual 100%
reflectance reference at each
data point.
Click “OK” to plot the
correction spectrum in the
next window.
66
Page 69

▪▪▪▪▪▪▪
A final spectrum (green
when plotted on-screen) is
In the event that Vision does not find a
plotted to verify that the
corrected spectrum
produces the same results
as the Certified 80%
Reflectance Standard.
Click “Close Report” to
continue. The correction is
automatically downloaded,
and is saved in the
Diagnostic Data Base.
The correction will be
applied in real time to all
spectra taken – in the “Use
Iris” mode --with a DCM
where “Reference
Standardization” is
checked.
When finished, remove the Iris Adapter, and return to the “Use Tray” mode.
Reference Standardization where it is
needed, it will prompt for a new one
upon connection as shown. When a
new Reference Standardization is
performed, Vision asks for a new
Instrument Calibration as well.
NOTE: Perform Reference Standardization immediately after changing the spot
size, to have the proper reference correction loaded in the instrument.
67
Page 70
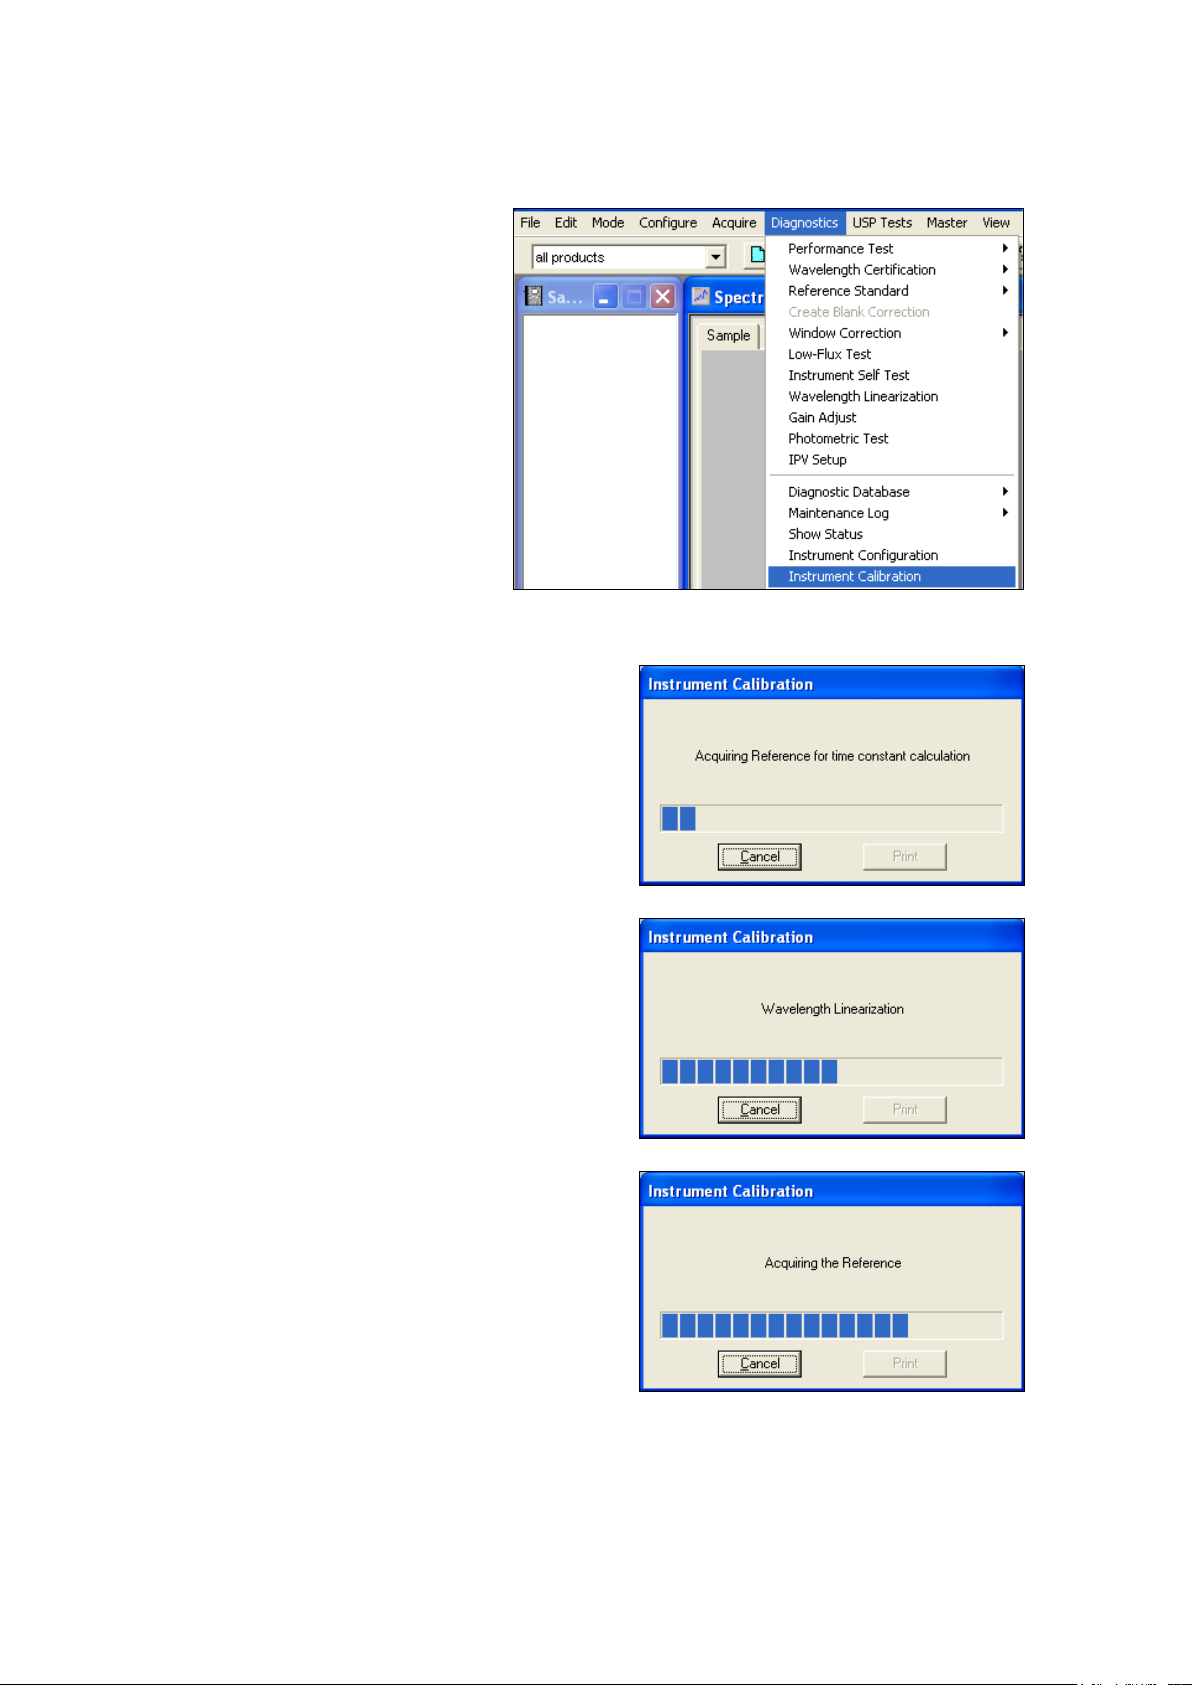
▪▪▪▪▪▪▪
Instrument Calibration uses an NIST-
Vision takes an instrument reference, which takes
Another reference scan is taken, and this box is
7.1.4 Instrument Calibration
traceable, stable, standard, of known
wavelength response, as a method to
establish wavelength scale response of
the instrument.
The instrument is set to scan the
standard, and the nominal peak
positions for each major absorption are
determined. Vision performs an
algorithm to set the peak positions of
the instrument to those of the standard.
These adjustments are saved, and are
applied on each subsequent scan of the
instrument, yielding a correct spectrum.
about 20 seconds. This dialog box is displayed.
Vision determines the detector “time constants” using
a patented algorithm, and sets the proper correction
for this parameter.
Wavelength Linearization is performed in two
sections, each of which takes about 45 seconds.
No user response is required during this test.
displayed. This takes about 20-30 seconds.
68
Page 71
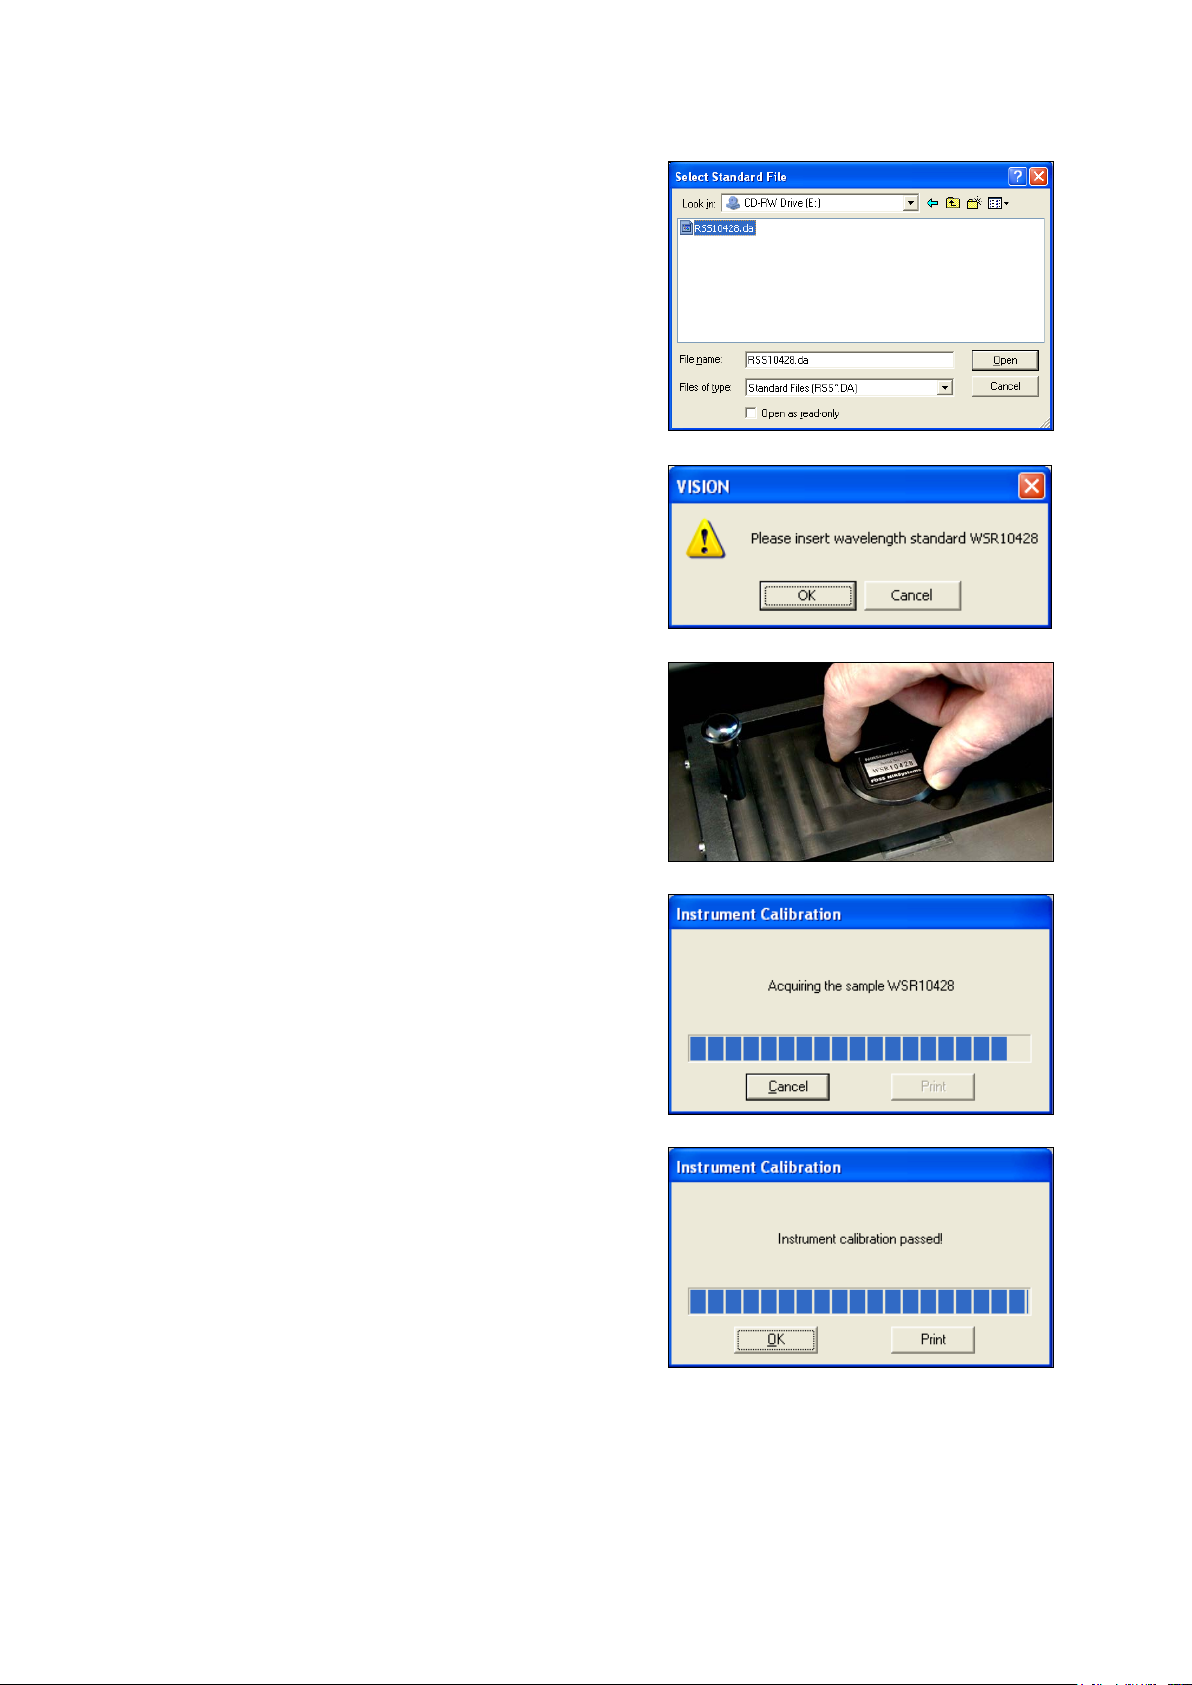
▪▪▪▪▪▪▪
Vision requests the “Standard File” for the Certified
Wavelength Standard.
Vision prompts the user to insert the WSR10xxx
This test takes about 45 seconds.
Place the mini-CD into the CD drive, and select the
standard file. Click “Open”.
standard into the instrument.
Insert the WSR10Xxx Wavelength Standard Cell when
prompted. Use the tray provided for this purpose.
Insert the standard with the label parallel to the long
axis of the tray.
Click “OK” to continue.
At the end of the test this dialog box is displayed.
Print confirmation of test results if needed for a log
book or other file.
Click “OK” to exit Instrument Calibration.
Hint: This file may be manually copied on the
computer, in the Vision directory, if desired.
During Instrument Calibration, the wavelength response for each defined peak is adjusted, to assure
precise wavelength registration between instruments. At the same time, bandwidth (bandpass) is
measured, and is iteratively adjusted to an optimum value for the peaks measured. This is performed
to assure good agreement from instrument to instrument, should multiple instruments be used for
analysis of similar products.
69
Page 72
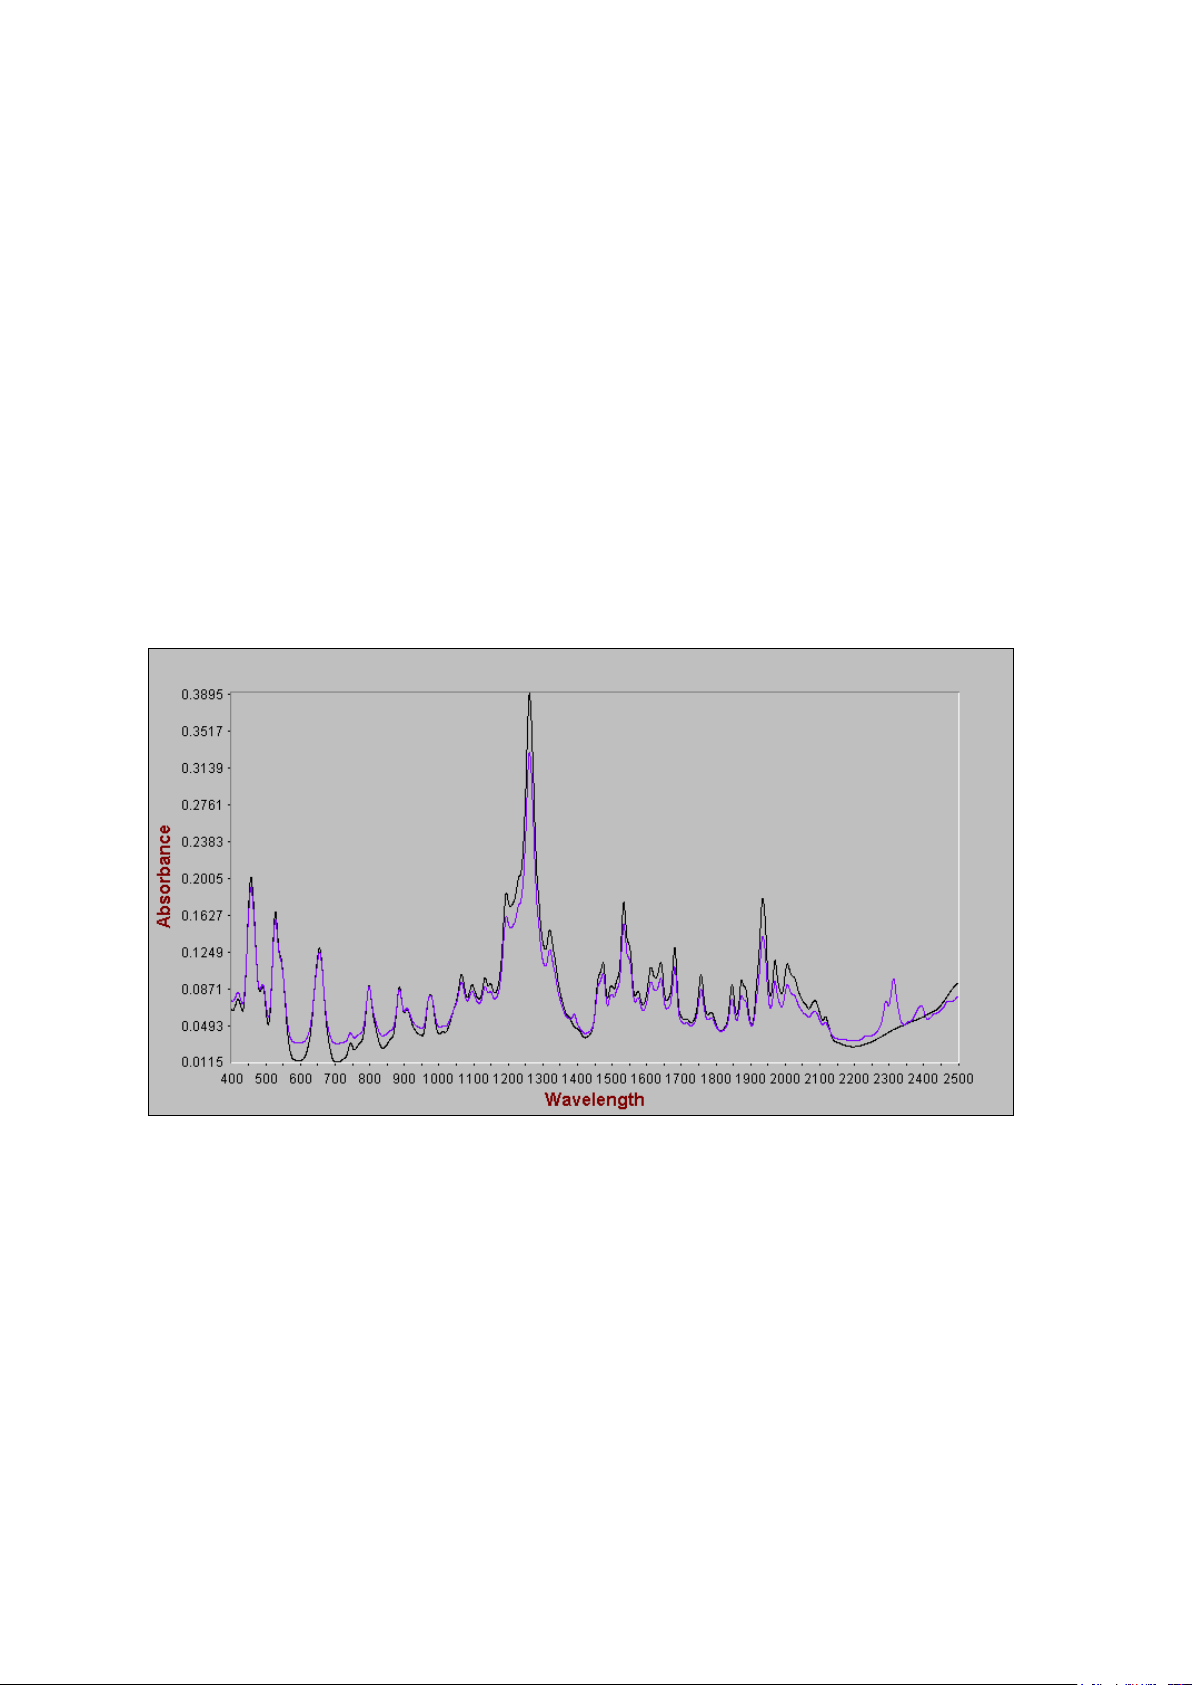
▪▪▪▪▪▪▪
Information about the wavelength standard:
The wavelength standard used is directly traceable to NIST SRM-1920a, through direct comparison
on the Metrohm master reflectance instrument, and in chemical formulation. In addition to the
prescribed formulation, one additional ingredient is added, in a small amount, to provide peaks
beyond those normally found in SRM-1920a. This material has very sharp bands, which are found to
be stable and repeatable.
Spectra of each are as described:
The darker spectrum, which has no discernible peaks beyond about 2150nm, is SRM-1920a.
The FOSS WSR Wavelength Standard is the lighter spectrum, and has clear peaks visible at above
2200nm. These additional peaks are used to set the wavelength scale of the instrument to aid in
instrument matching. This is one important step in method transfer.
The Foss WSR Wavelength Standard exhibits slightly different absorbance and baseline levels, due to
the reflectivity of the added ingredient. The peaks, however, are in the same wavelength positions,
and are similar in shape to SRM-1920a.
The XDS instrument is set to NIST nominals during Instrument Calibration, since these are the best
known information for NIR peak wavelengths. Peaks for the additional ingredient are set to peak
nominals determined by measurement on several different types of research instrumentation.
In Wavelength Certification, the NIST-stated uncertainty of 1.0nm is applied. Tighter tolerances are
not appropriate, unless NIST revises the stated uncertainty of SRM-1920a at some point in the future.
70
Page 73

▪▪▪▪▪▪▪
NOTE: The response of the WSR Wavelength Standard may vary slightly with temperature. This is
Select IPV Setup from the Diagnostics menu.
typically in the range a few hundredths of a nanometer for small temperature variations. While
this effect is small, it may cause some variation when running Wavelength Certification.
We suggest that the WSR standard be stored in the standards box, rather than inside the
instrument. When running a test with the WSR, place it in the instrument as directed, then take it
out and store it in the box, to keep the temperature as consistent as possible. Temperature inside
the instrument may be as much as ten degrees (F) higher, and may cause slight wavelength drift,
enough to cause slight wavelength errors when measuring wavelength response.
7.1.5 IPV Setup (Instrument Performance Verification)
IPV Setup is provided as a method to record initial instrument response to calibrated photometric
reflectance standards. This is normally performed upon initial installation, immediately after
Instrument Performance Certification (IPC), when a lamp has been changed, or when standards have
been re-certified.
When the standards are scanned during IPV Setup, a file is generated, and is stored in the Vision
directory. This file has the same format as the standards file, but a “V” is placed into the fourth
character of the file name. This indicates that it is a “verification” file. For example, if the standards
set has the serial number RSS10301, the IPV Setup file is named RSSV10301.
With the IPV Setup file stored, the user can run Photometric Test to check the repeatability of
instrument performance. This is detailed later in this manual, in “Evaluation Diagnostics.” Photometric
Test compares the current performance of the instrument to the file stored during IPV Setup, and
reports differences. If the instrument differences exceed established tolerance limits, the test reports
that, so corrective action may be initiated.
It is important that IPV Setup, and later Photometric Test, both be run with the same options selected
under Configure, Options. That is, if the IPV Setup file is acquired with Reference Standardization
switched on, and with Window Correction switched off, then Photometric Test should be performed
using the same settings. The System Manager should pay particular attention to this. If options are
not consistently applied, there will be a bias in the results of Photometric Test. The bias may be
enough to cause test failure, depending upon selections.
Because the XDS is a sensitive instrument, it can detect differences in temperature of the standards,
and results may be affected slightly. To minimize this effect, be sure the standards are at a stable
temperature before use. If lab temperatures vary, the user may place the standards inside the RCA
cover for some time to let them equilibrate to a stable temperature.
IPV Setup is run as follows:
71
Page 74
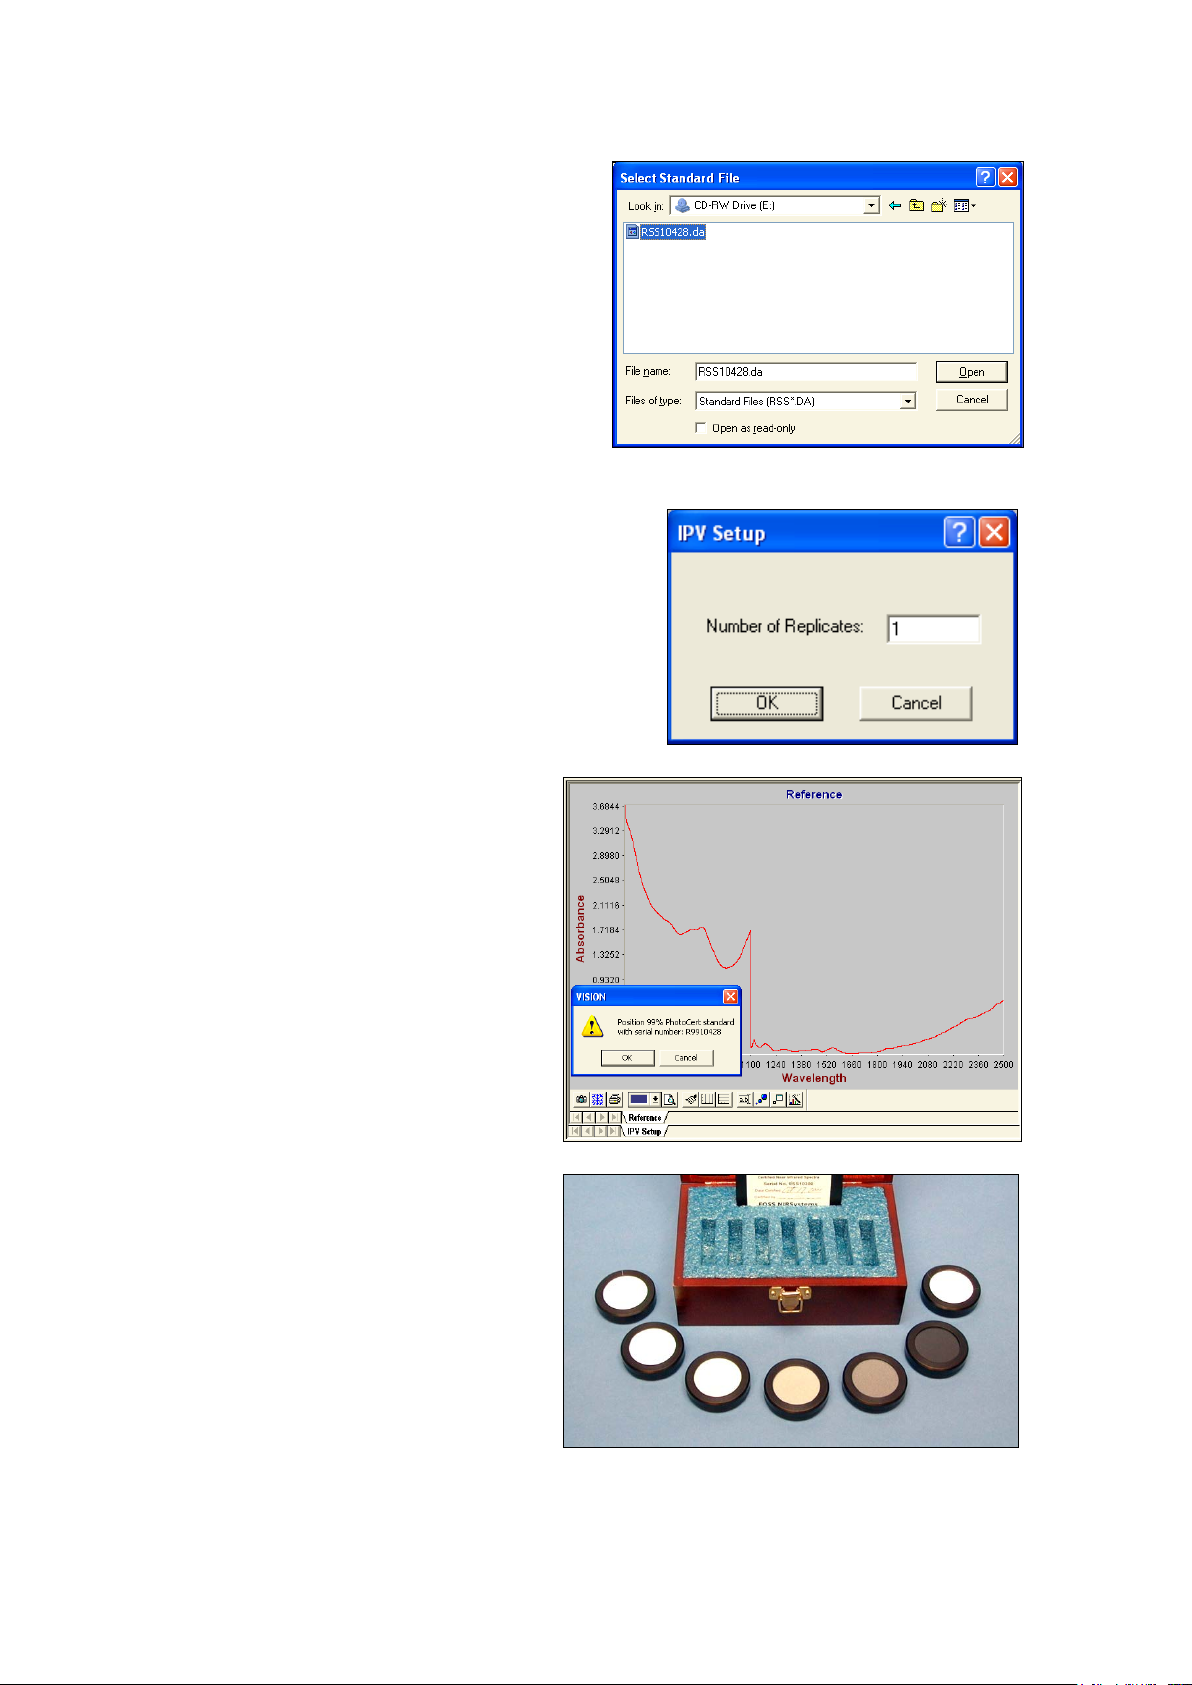
▪▪▪▪▪▪▪
Vision requests a “Standard File”. This is provided
For Number of Replicates, retain the default setting of 1.
If operating in Reference Standardized mode,
Select the requested standard from the set.
on a mini-CD, packed in the wooden box with the
standards.
Insert this mini-CD into the CD drive, select that
drive in the dialog box, and click on the
RSS1xxxx.da file as shown. (The serial number will
be different, of course.) Click “Open”.
The standard file is “NSAS File” format, which
refers to an older software package. This format is
used where it aids in file transfer.
Click on “OK”.
Vision will begin to take an instrument reference scan, if
the instrument is operating in Reference Standardized
mode. The red progress bar at the bottom of the screen
indicates status.
Vision requests the 99% standard from the
set.
The reference spectrum is shown in red. Note
that Reference Standardization is not shown
as applied to this spectrum – it is displayed in
raw form.
If not operating in Reference Standardized
mode, Vision requests the 80% standard,
which is used in place of the internal
instrument reference.
Labels on the back identify each standard.
Note the Mini-CD that contains the
“Standards File”. This file is used during IPV
Setup, Wavelength Certification, and
Instrument Calibration.
72
Page 75
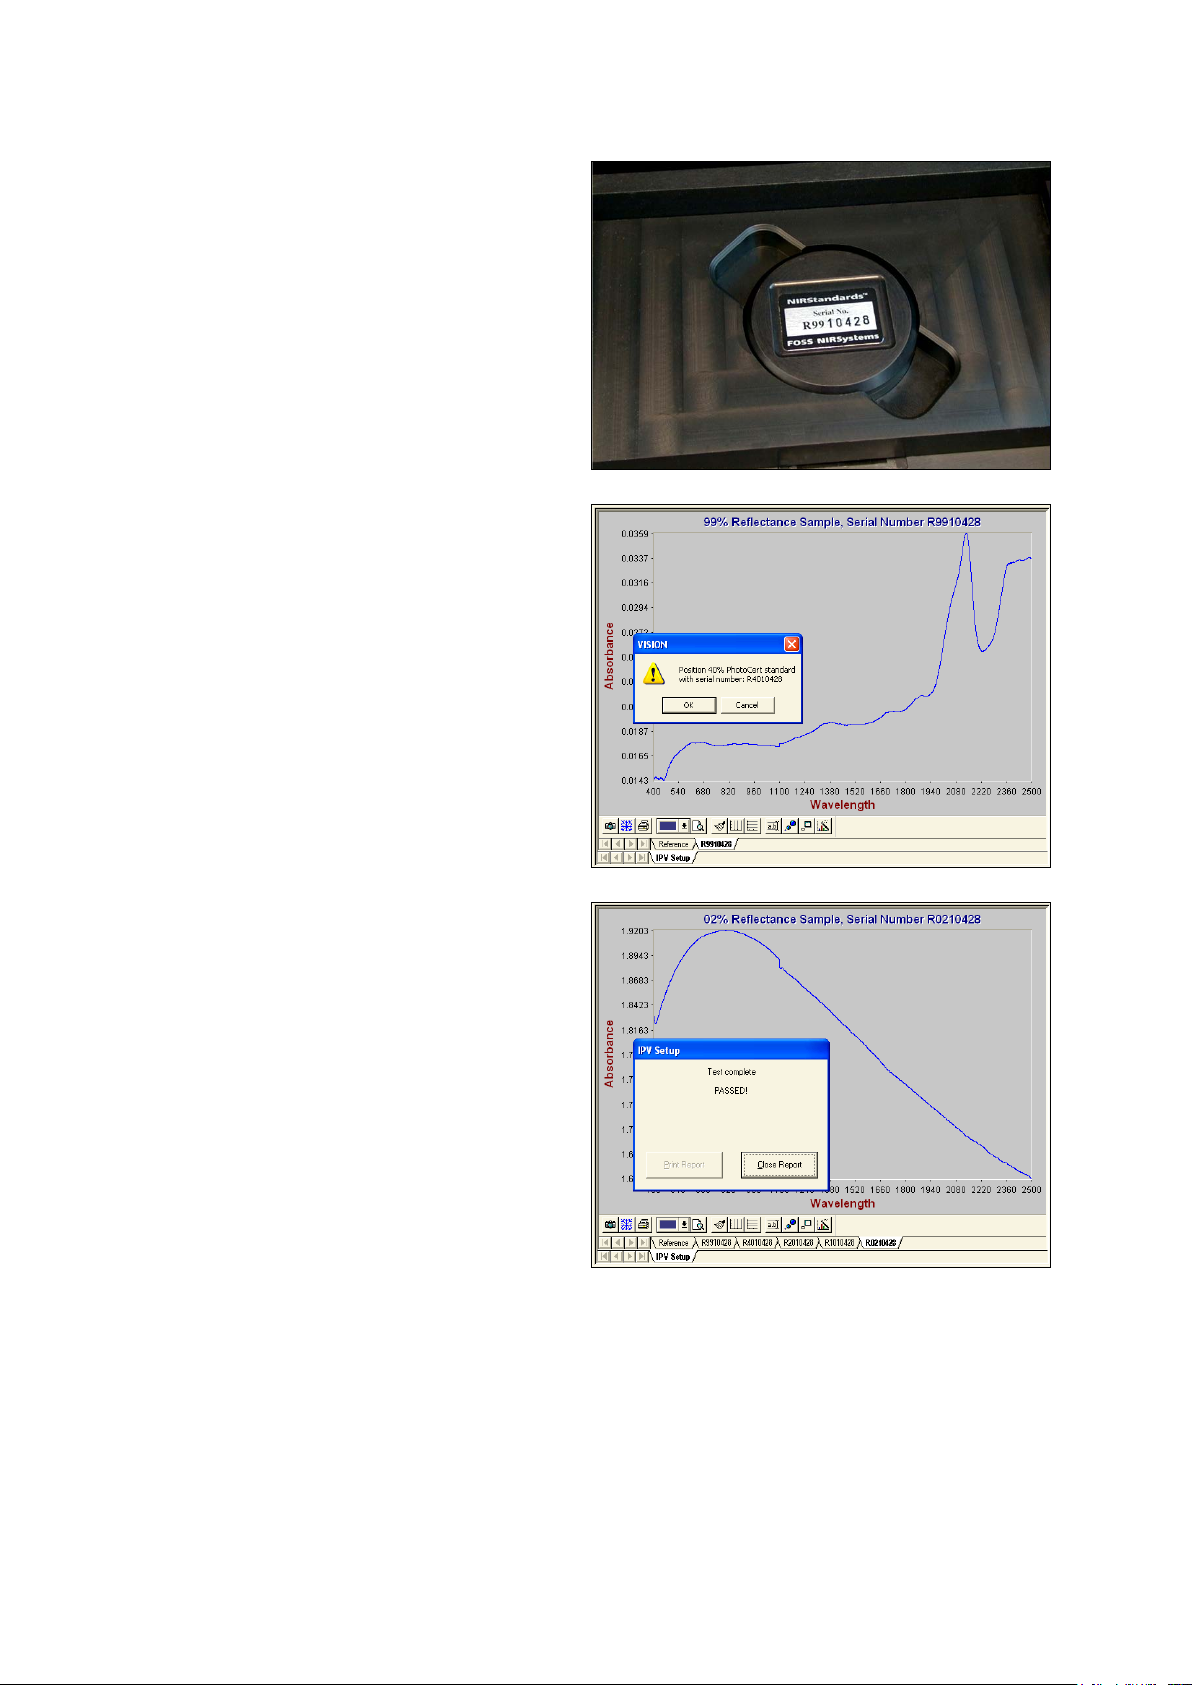
▪▪▪▪▪▪▪
Place the 99% standard into the tray. The
label edge should be parallel to the long edge
Once the 99% standard has been scanned, it
of the tray. This enhances repeatability.
is shown on screen. Note that the header
identifies the standard just scanned.
The dialog box prompts for the 40% standard
to be scanned next. Insert the 40% standard,
and click “OK”.
Continue through all standards (99, 40, 20,
10 and 2%) as prompted by Vision.
When the last standard is scanned. Vision
indicates that IPV Setup has “Passed”. This
verifies that the correct file has been written
to the active Vision directory.
During IPV Setup; Vision writes a special file
that is subsequently used in Photometric
Certification. This new file is named RSSVxxxx.
The “V” indicates that this file is to be used
for long-term Verification of the photometric
scale of the instrument.
This file is written to the C:\Vision directory,
or whatever directory from which Vision is
operating.
7.2 Evaluation Diagnostics
Evaluation Diagnostics are used to verify that the instrument is operating within allowable
parameters. These tests should be run approximately once per week.
This information is meant to guide the user through the tests in an expeditious manner. A more
complete description of these tests is given in the Vision Manual, in the Diagnostics section. A
73
Page 76
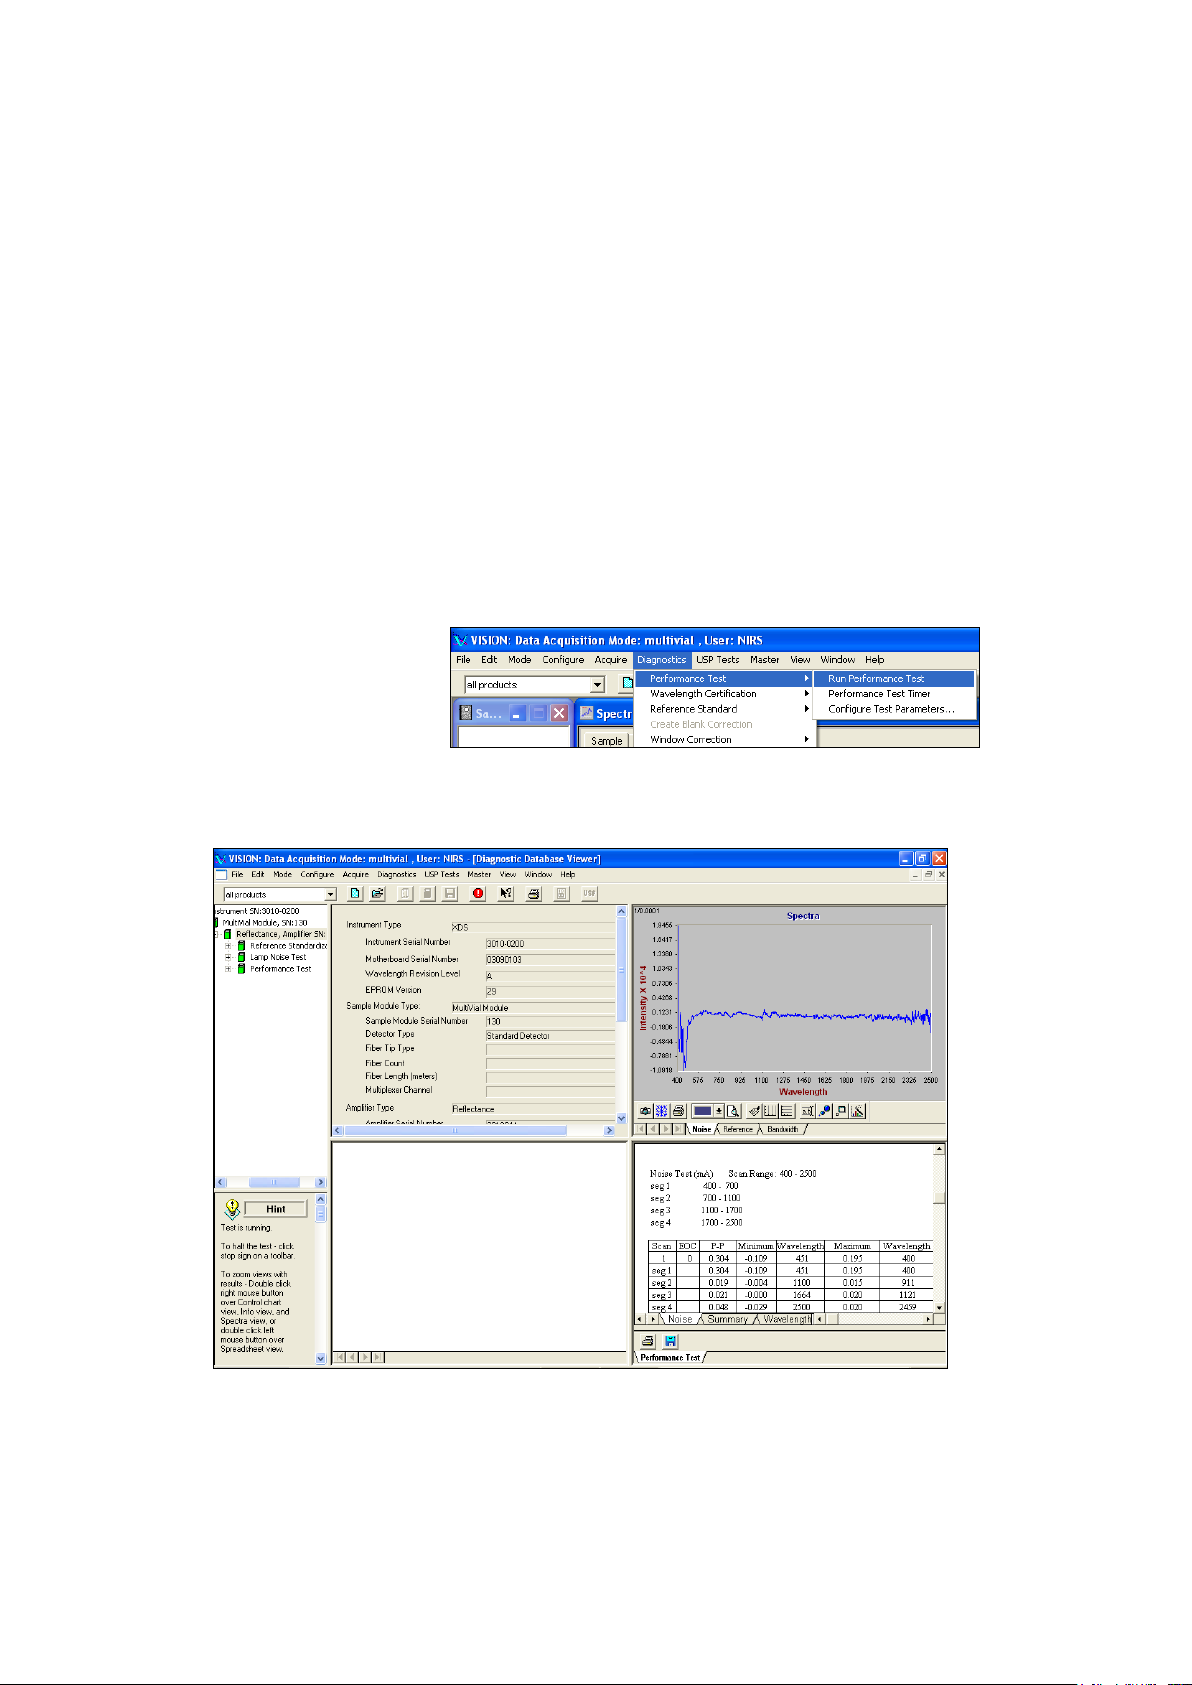
▪▪▪▪▪▪▪
Select Performance Test from the
discussion of the theory and interpretation of results is provided in the Vision manual.
7.2.1 Performance Test
Performance Test is a comprehensive test of instrumental performance, and is the final assurance that
the instrument is ready to run samples. The key items verified during this test are:
• Instrument Noise in each of four wavelength regions
• Internal Wavelength Performance (wavelength positions on non-traceable, internal reference
materials.)
• Internal Wavelength Precision (Repeatability)
• NIR Gain
• Visible Gain
The test is initiated as follows:
Diagnostics menu. Click on Run
Performance Test.
As the test runs, a screen like that shown below is displayed. This shows the first of ten sets of scans
from the test.
Because only the right two quadrants of the screen will be updated, many users “pull the screen
over” to see better, as shown on the next page.
74
Page 77
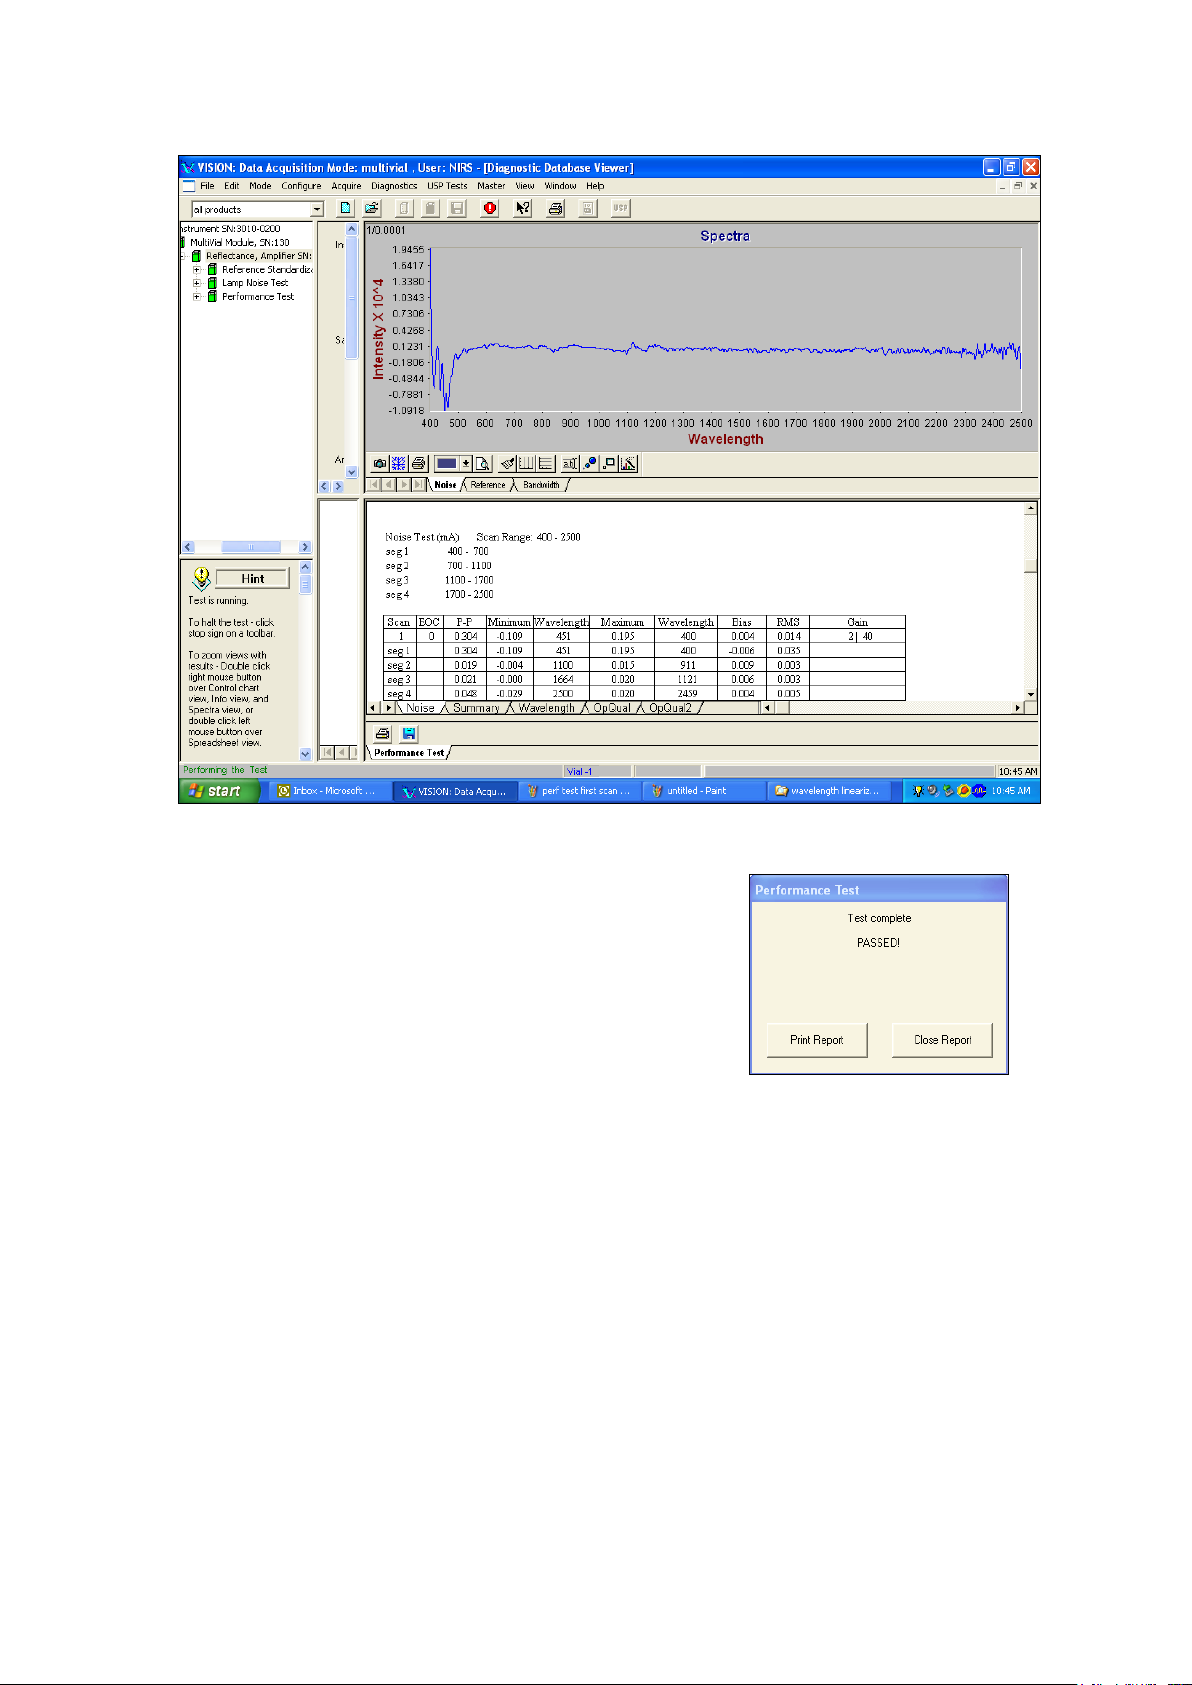
▪▪▪▪▪▪▪
When Performance Test is finished, a message box is displayed
This view shows the fill width of the tabulated results, and expands the spectrum for better viewing.
to indicate test completion and status. All measured values are
compared with acceptance criteria stored in Vision. If all results
meet acceptance criteria, the test is successful and this dialog
box is displayed.
Click “Print Report” for a hard copy of results. Before clicking
“Close Report”, the user is directed to the tabular display.
To view the tabular display of results, place cursor over the tabular display and double-click twice.
Vision enlarges the tabular portion of the screen. Now click on the OpQual tab, near the bottom of
the screen. Noise summary results are shown.
75
Page 78
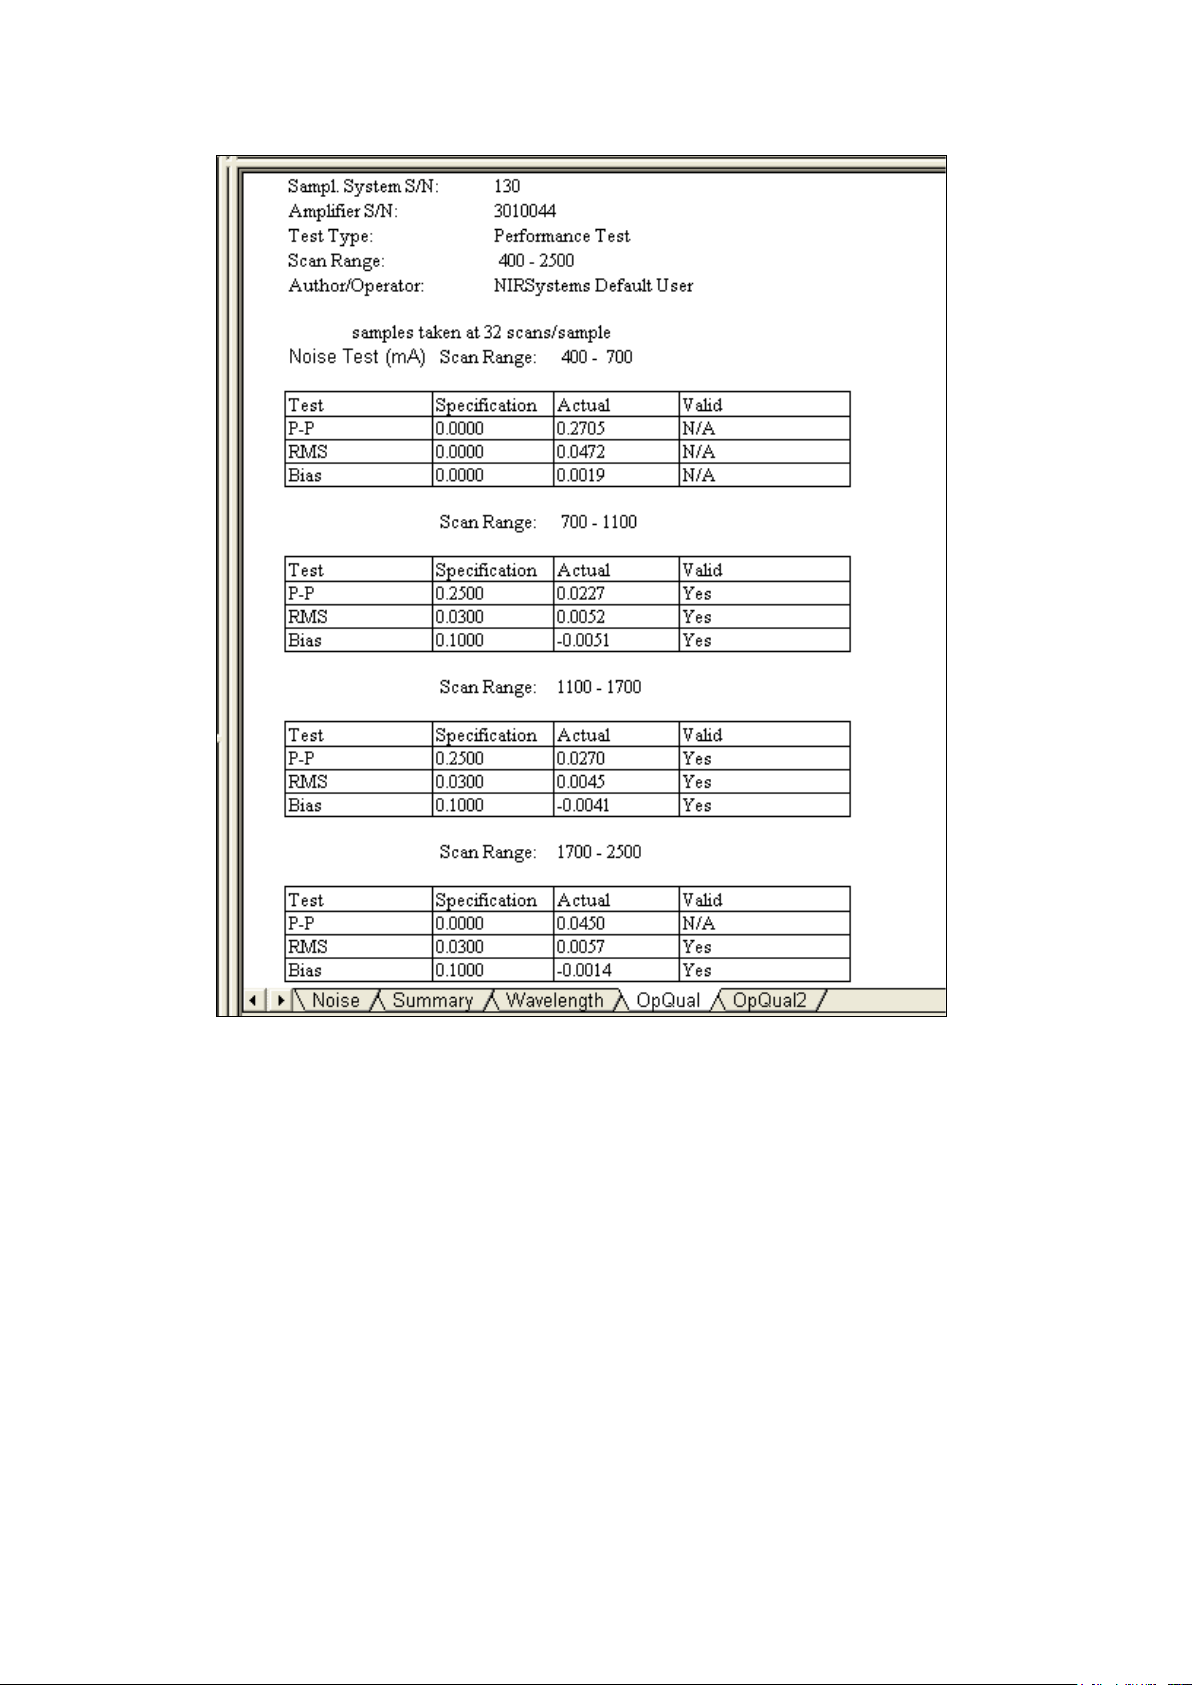
▪▪▪▪▪▪▪
Noise Summary displayed using the OpQual tab.
The OpQual tab brings up the display shown. This shows results of the Noise Test for each of the four
wavelength regions. These regions are:
• 400-700nm
• 700-1100nm
• 1100-1700nm
• 1700-2500nm
For each region, results are given for
• Peak-to-Peak Noise (P-P)
• Root-Mean-Square Noise (RMS)
• Bias (A measure of baseline energy changes)
Each of these parameters is described in more detail in the Diagnostics Section of the Vision Manual.
If the test is reported as “Passed” the user may proceed with sample analysis.
76
Page 79
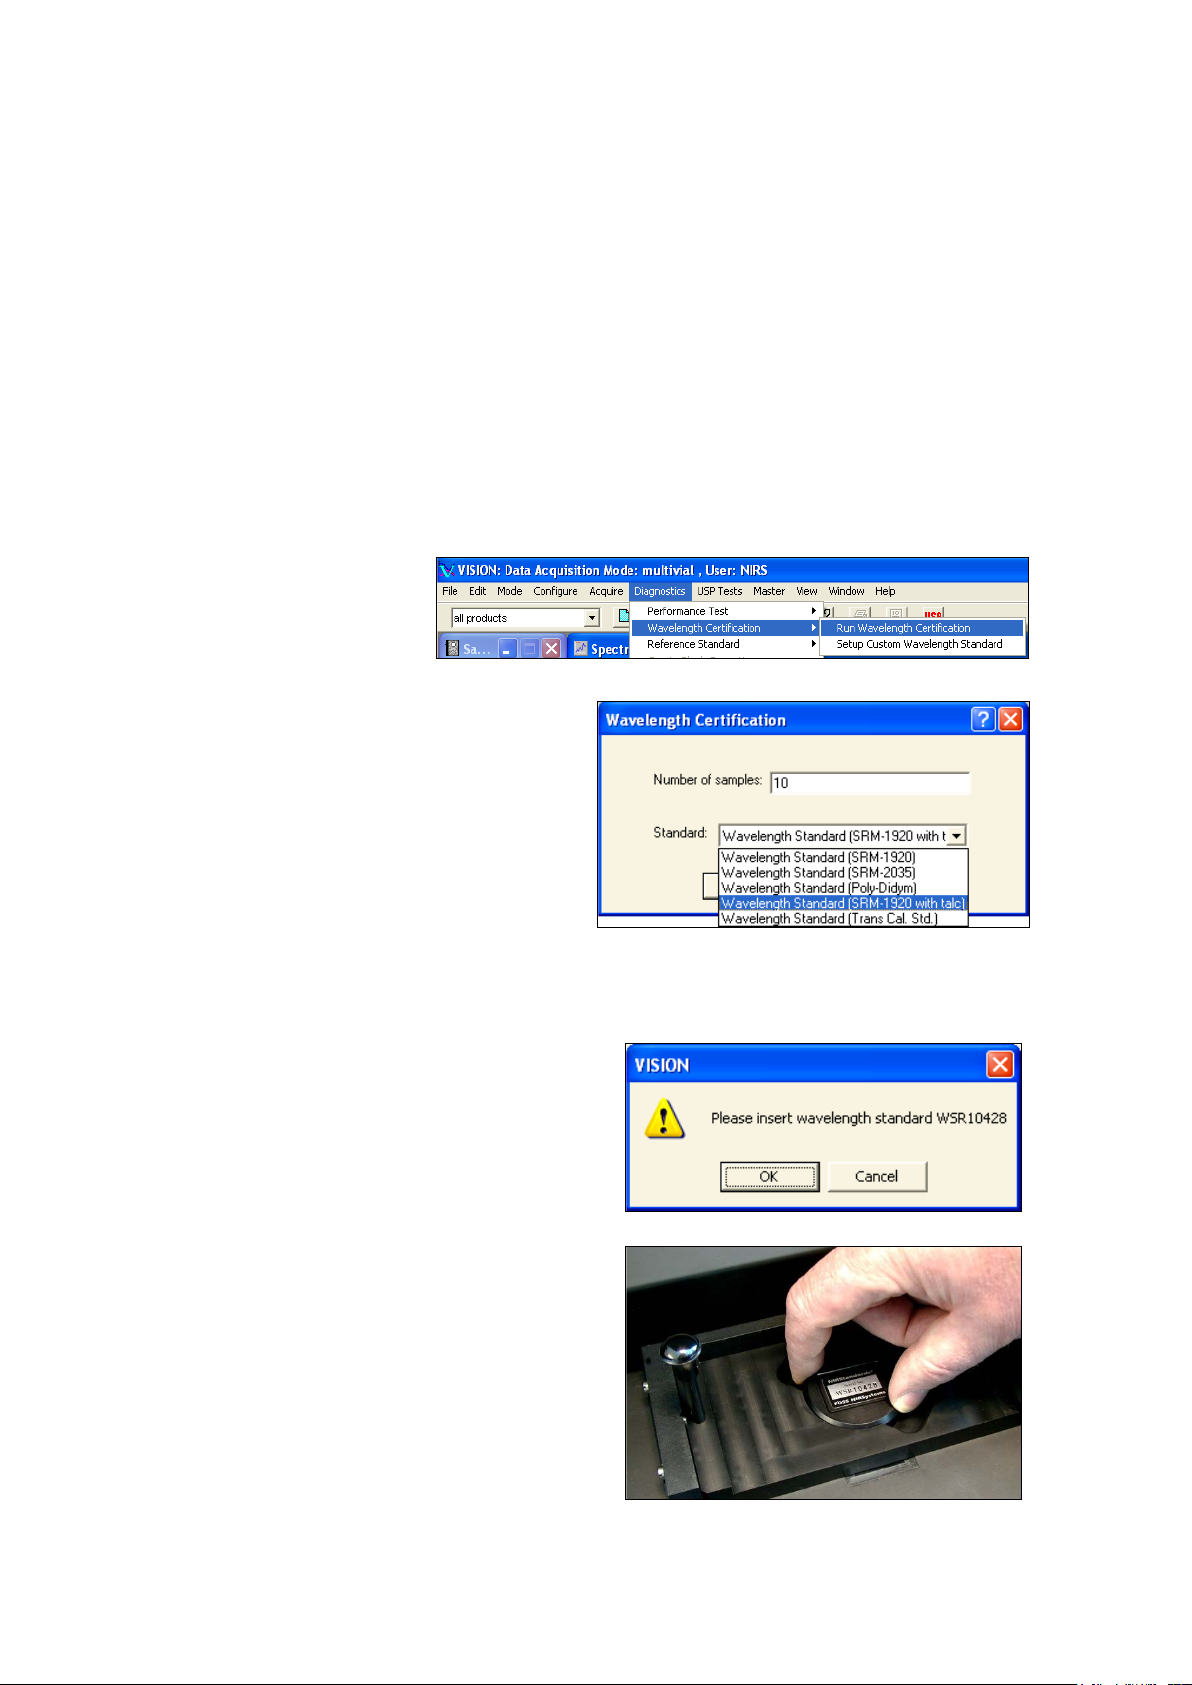
▪▪▪▪▪▪▪
The XDS instrument contains internal wavelength reference materials, which are used as a means to
Click on Diagnostics,
The Number of Samples should be 10, as
Vision briefly requests that the user place the ceramic reference into position. This is automatic
When the reference scan is finished, insert the
Always place the standard into the instrument in
maintain monochromator wavelength measurement. These internal wavelength materials are
protected and are moved by software command, transparent to the user. When Performance Test is
run, the relative wavelength positions and repeatability of these wavelength materials are monitored
and reported.
Note that these internal wavelength materials need not be precisely on the assigned nominals. These
nominals are arbitrary. The internal wavelength materials are a method to assure stable readings on
the external wavelength standard, measured at the sample plane.
7.2.2 Wavelength Certification
Wavelength Certification is used to confirm the peak positions of the instrument to a defined,
external wavelength standard.
Wavelength Certification,
Run Wavelength
Certification.
shown. The wavelength standard for
reflectance is the “SRM-1920 plus talc”, which
refers to the WSR1xxxx standard. This is the
same cell used for Instrument Calibration.
Click “OK” when ready.
with the MultiVial Analyzer; no response is required.
wavelength standard as directed.
the same orientation, with the label parallel to
the long axis of the tray.
Click “OK” when ready.
After the test is complete, a spectrum of the standard is shown in the upper right quadrant of the
77
Page 80
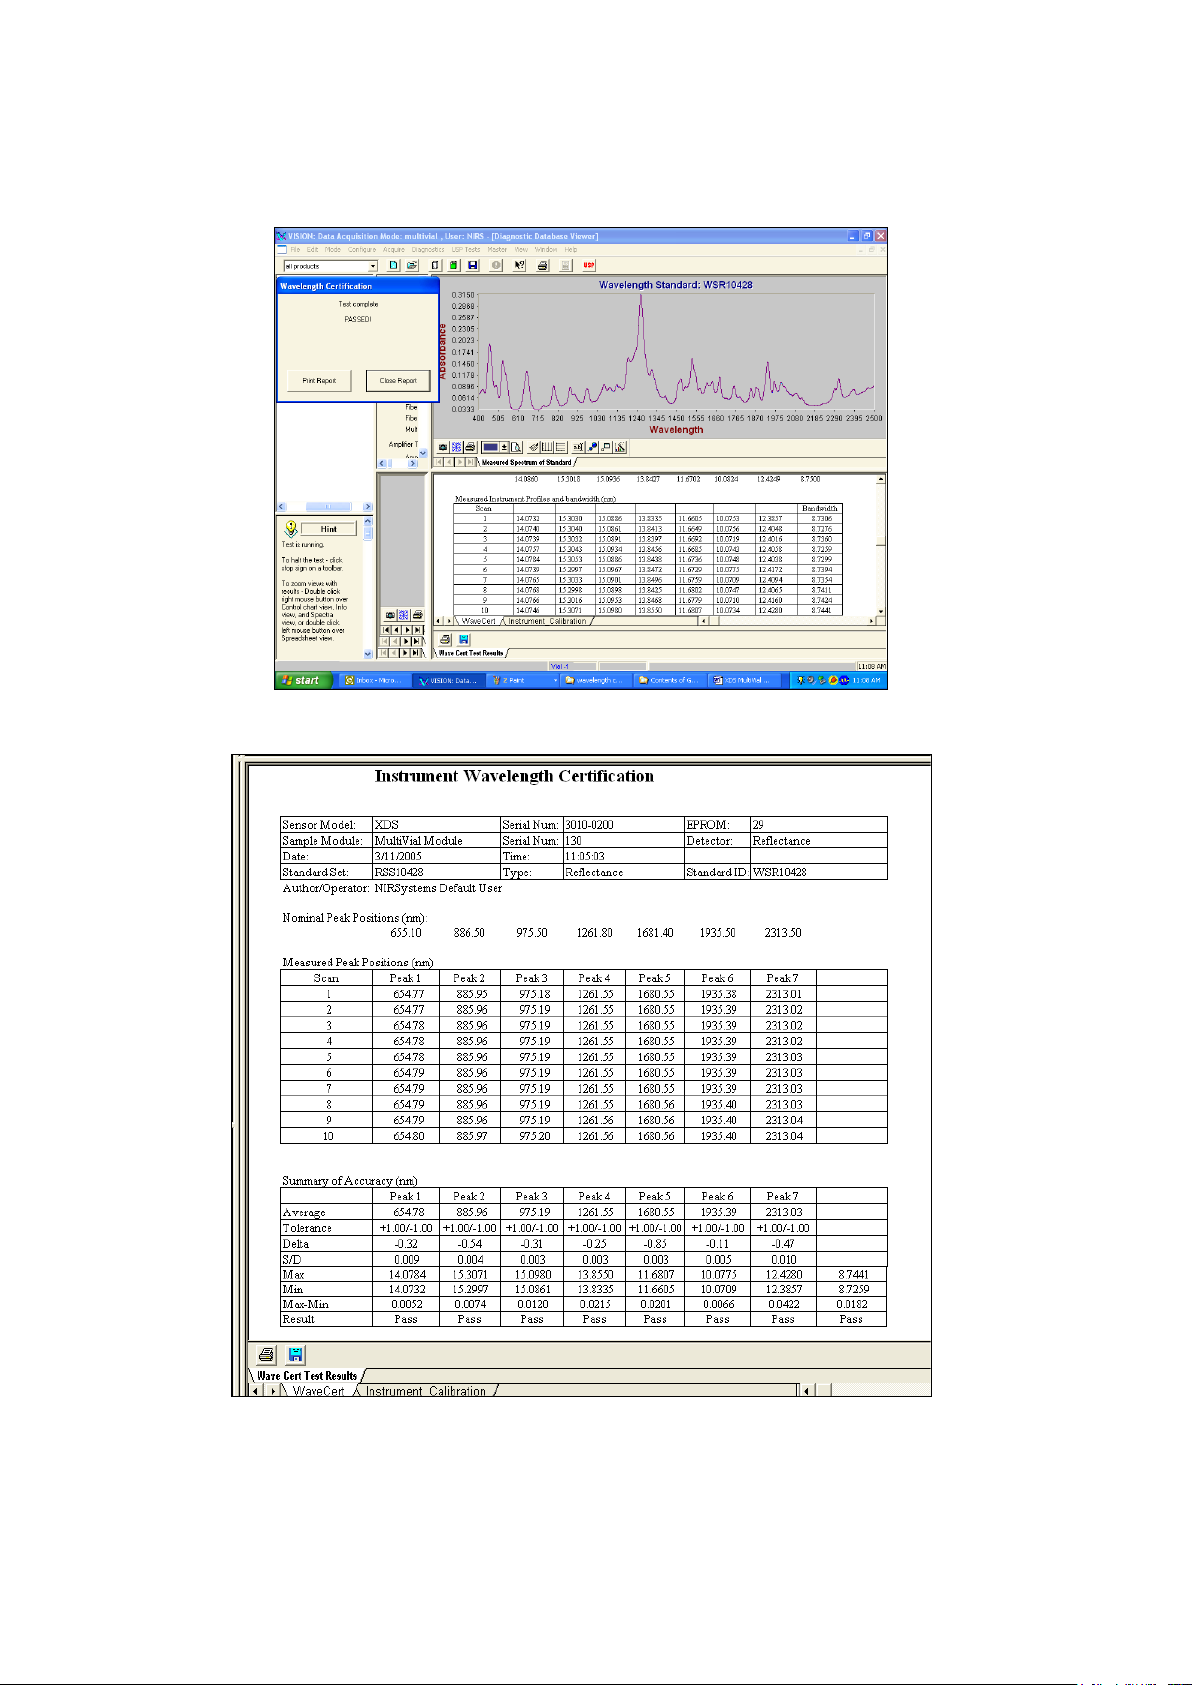
▪▪▪▪▪▪▪
screen. A tabular report is shown in the lower right quadrant, giving each peak, its nominal position
and its measured position. A typical screen is shown:
Double-click the lower right quadrant to see the full report.
The first tab shows the Wavelength positions, as found. They are compared to the NIST nominal peak
positions, or the empirically-determined positions for talc peaks. The difference from nominal, and
the repeatability of position are calculated.
Wavelength Certification also tests certain “measured instrument profile” peaks in the wavelength
78
Page 81

▪▪▪▪▪▪▪
standard. These peaks are used to set the “Instrument Wavelength Profile,” and one peak is used for
bandwidth calculation.
The wavelengths used for the instrument wavelength profile are well-defined, stable peaks in the
wavelength standard. These are the same peaks used during Instrument Calibration. Wavelength
Certification is a verification that the peaks are in correct positions, and that the peak positions are
consistent over time. Note that both tests use the wavelength standard at the sample plane, where
actual sample measurement is done.
Wavelength Certification is an excellent method to test whether Instrument Calibration needs to be
re-run. If the original settings in Instrument Calibration have drifted, a message will be displayed in
Wavelength Certification that Instrument Calibration should be re-run. Click on the Instrument
Calibration tab to see the results:
79
Page 82
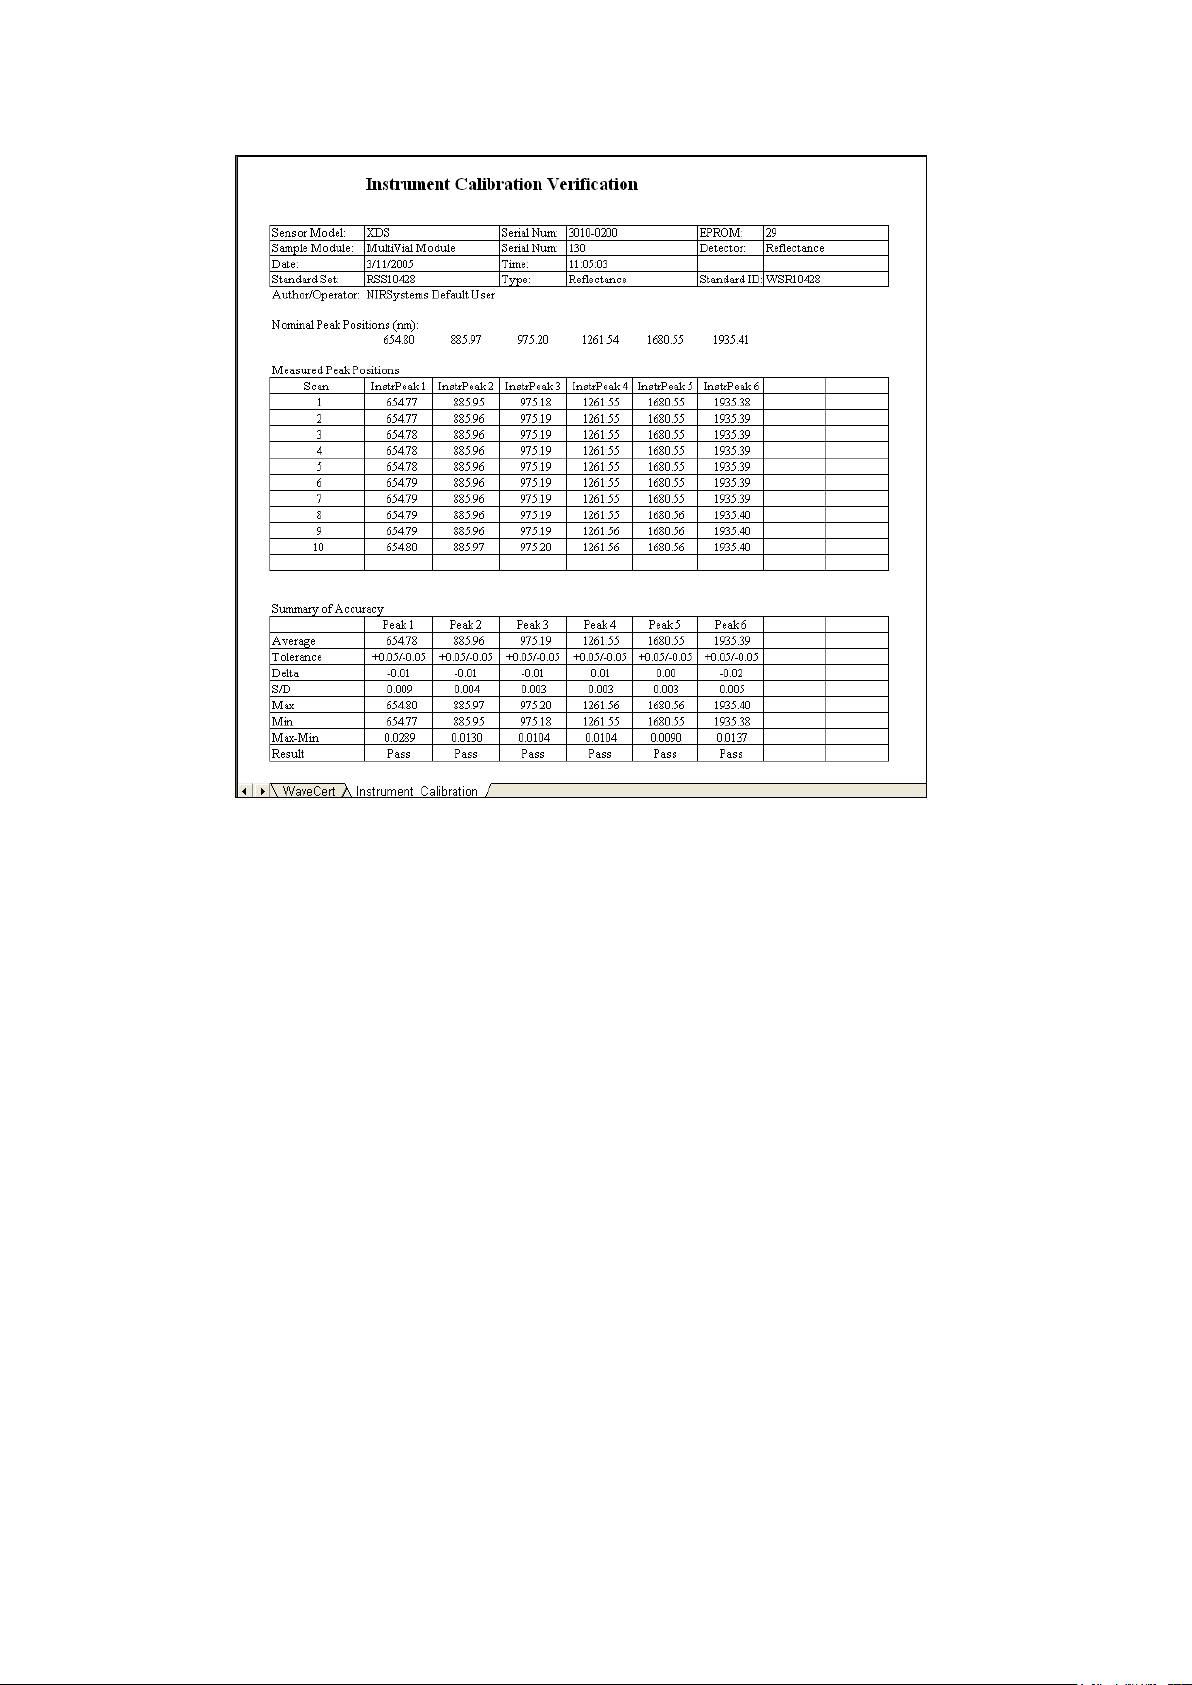
▪▪▪▪▪▪▪
The wavelength peaks used here are not the NIST peak positions, though they are within +/- 1.0nm
of the NIST peaks. The peaks used in Instrument Calibration are the peak positions used to assure
transferability of the XDS instrument, and are defined based upon tests of many XDS instruments.
Note that Performance Test measures peak positions of internal reference materials, and these
positions are used as a preliminary method to maintain wavelength measurement. The final
measurement is made at the sample plane, using the external standard. As discussed under
Performance Test, the internal reference materials are not traceable, and are only used as an internal
method of maintaining correct wavelength measurement prior to measurement of the external
wavelength standard.
If the test has passed, the user should click the cursor on the tabular display, go to the File menu, and
click Print to keep a copy of the report. It is saved in the Diagnostic Database for future recall. See the
Vision manual for a full explanation.
80
Page 83

▪▪▪▪▪▪▪
In some cases the user may see the message shown. This
indicates that the instrument has passed Wavelength
To run Photometric Test, select it from the
Certification on the NIST-defined peaks, but has not
passed on the tighter, FOSS-defined wavelength
positions.
This is not considered a failure, as the instrument still
passes Wavelength Certification on NIST-defined peaks.
Verify that the instrument is fully warmed-up. If so, and
this test still fails, re-run Instrument Calibration to set the
peaks to proper positions. If required, run Wavelength
Certification to verify that all peaks pass.
7.2.3 Photometric Test
Photometric Test provides a method to verify ongoing photometric performance of the instrument.
This is a requirement for pharmaceutical users. Test results are stored in the Diagnostic Database, and
may be accessed at any time. Control charts are plotted (after several tests have been stored) to
provide an ongoing record of performance.
The test uses the same standards used in IPV Setup. Photometric Test compares current spectra of
each standard to those stored during IPV setup. If any differences exceed normal tolerance values,
the instrument can be assumed to have changed in some manner, and may need service.
Because the calibrated photometric standards are the link to previous photometric performance, the
standards should always be stored in their wooden box, and protected from fingerprints, dropping,
or other damage. If any cup is opened, dropped, or otherwise altered, Photometric Test results may
fail.
Diagnostics menu.
81
Page 84

▪▪▪▪▪▪▪
Vision requests a “Standard File”. For
Vision requests a tolerance file. The tolerance
Vision displays the wavelength regions for
Photometric Test, use the RSSVxxxx.da file
stored in the Vision directory. This file was
created during IPV Setup. Current
photometric readings will be compared to
that initial file.
Click on the RSSVxxxx.da file as shown. (The
serial number will be different, of course.)
Click “Open”.
Do not use the file on the standards mini-CD
for Photometric Test, as it will cause Vision to
return an error message.
file was loaded in the C:\Vision directory, and
is an “XDA” formatted file.
Subsequent releases of this file may have a
higher number. This merely indicates that
additional XDS instruments are now
supported by the same file. (This is
transparent to the user.) Tolerances for this
instrument remain the same throughout
different tolerance file releases.
Select this file and click “Open”.
test.
For reflectance instruments, these regions
give a good overall picture of instrument
performance and repeatability. The
wavelength areas are chosen in flat parts of
the standards spectra for stability.
For Number of Replicates, retain the default
setting of 1.
Click on “OK”.
Vision will begin to take an instrument
reference scan, if the instrument is operating
in Reference Standardized mode. The red
progress bar at the bottom of the screen
indicates status.
82
Page 85
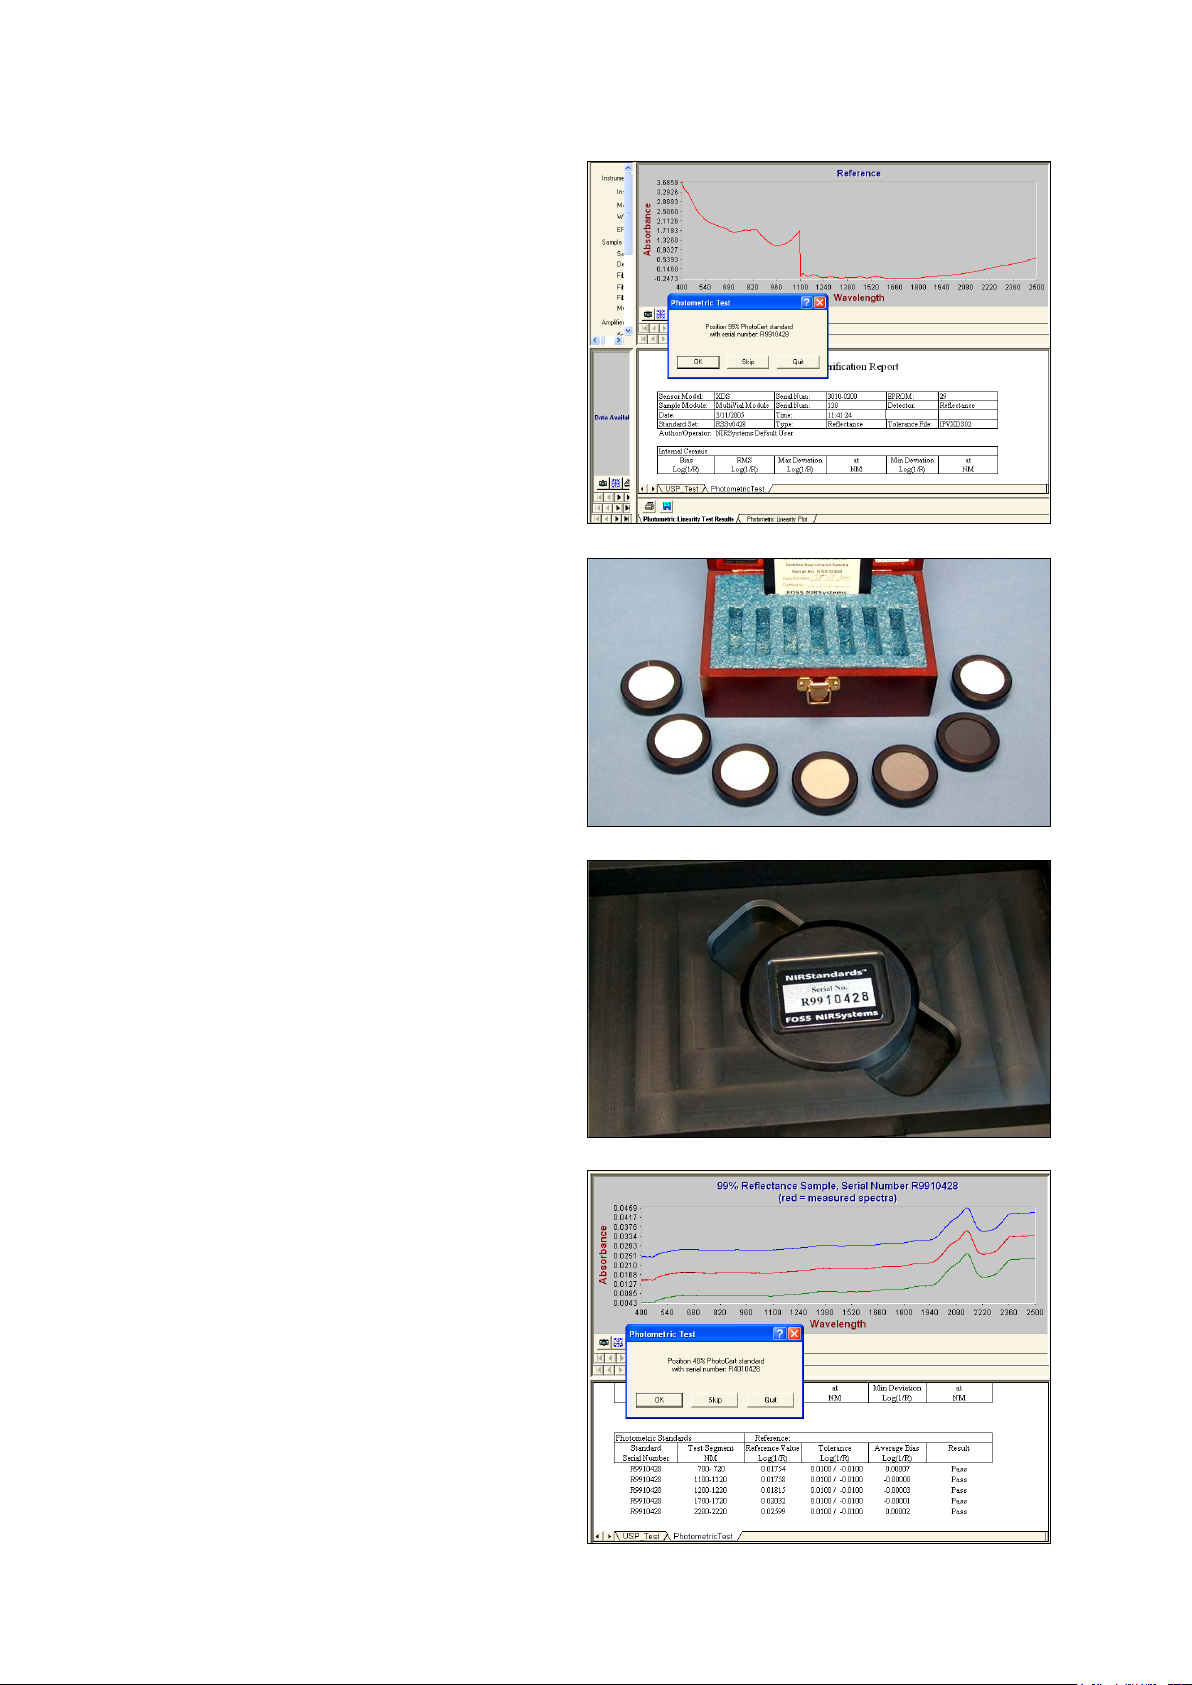
▪▪▪▪▪▪▪
If operating in Reference Standardized mode,
Vision requests the 99% standard from the
Select the requested standard from the set.
When the 99% standard has been scanned,
set.
If not operating in Reference Standardized
mode, Vision requests the 80% standard,
which is used in place of the internal
instrument reference.
Labels on the back of each standard identify
the reflectance value.
Insert the 99% standard into the tray as
shown, with the label parallel to the long axis
of the tray.
the result will be plotted as shown.
In this picture, the upper and lower spectra
are tolerances from the initial IPV Setup
spectrum. The IPV Setup spectrum is the dark
spectrum in the middle, displayed in black on
screen.
The lighter spectrum in the middle (red on
screen) is the current spectrum. It should be
within the upper (blue) and lower (green)
spectra as shown.
83
Page 86
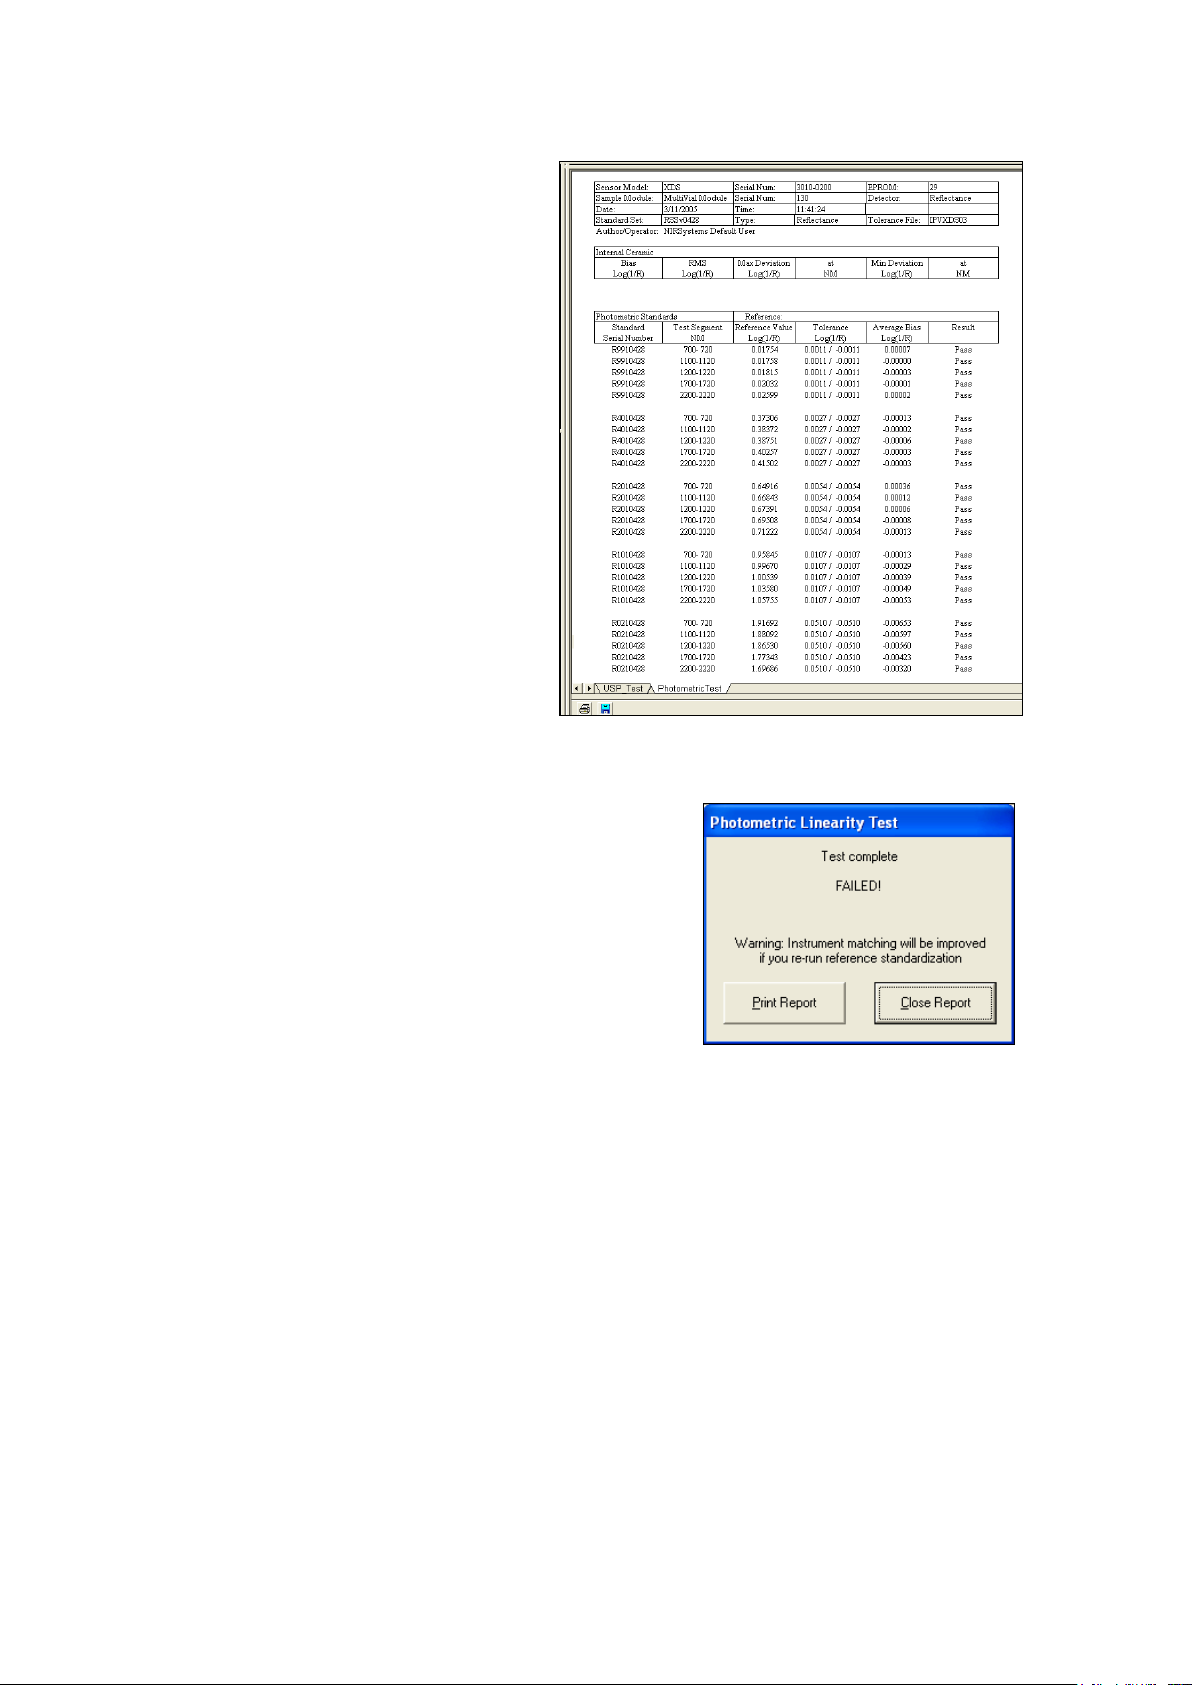
▪▪▪▪▪▪▪
After each standard is run, Vision plots the
If the photometric scale of the instrument has drifted, or if
comparison for each wavelength area as
shown. Tolerances are automatically applied,
and a “Pass” or “Fail” indication is given.
Continue to follow the on-screen prompts for
each standard. Vision requests the 40%,
20%, 10%, and 2% standards.
When Vision has completed the test, the
tabulated results may be printed. They are
also stored in the Diagnostic Database for
later recall.
Note the tab marked “USP Test”. Click on this
tab to see the USP-recommend plot and
summary report. These are shown on the
next page. (Note that this test is deemphasized as of December 1, 2008.)
When the test is complete, click “Print
Results” for a hard-copy report. Click “Close
Window” when finished.
the instrument is not fully warmed up, the user may see this
message.
Photometric Test is a good check of Reference
Standardization. If Reference Standardization needs to be rerun, this message will be shown. Re-run Reference
Standardization. If required, run Photometric Test again to
verify that the photometric scale of the instrument is now
reading properly.
84
Page 87

▪▪▪▪▪▪▪
The five standards are plotted out in the USP
format, showing repeatable response for
This shows tabulated results, at each of the
each standard. The x-axis, A REF, is from the
initial observation (during IPV Setup). The yaxis, A OBS, is the current observation.
The slope must be 1.0, +/- 0.05. The zero
intercept must be 0.0 +/_0.05. The box
shows the results for this observation.
Tabs allow the user to check at three
wavelengths: 1200, 1600, and 2000 nm.
Click on the Photometric Linearity Test
Results tab to see the tabular information.
three wavelengths.
USP dropped this test requirement from General Chapter <1119> as of December 1, 2008. Metrohm
does not recommend that this test be run unless company policies require it.
The user should be aware that USP tolerances for Photometric Linearity are quite relaxed, compared
to FOSS NIRSystems specifications for IPV testing. Therefore, there may be times when the USP test
passes, and IPV does not meet manufacturer’s specifications. This may be due to instrument changes
such as dirty windows, failing lamp, or placement errors. In such cases, Vision advises that Reference
Standardization may be required.
7.2.4 Gain Test
The Gain Adjust feature can be a useful diagnostic tool, though it is not required for normal
operation. Technically, gain is never adjusted on the XDS MultiVial Analyzer. The name of the test
comes from an adjustment capability that was required with older systems. With XDS, this program
reports gain information for the NIR and visible regions. No adjustment is performed.
85
Page 88

▪▪▪▪▪▪▪
To start Gain Adjust, click on
Diagnostics, then Gain Adjust.
The instrument is connected and in
communication for this to function.
The view above shows a fairly typical MultiVial Analyzer. The gain program sets the internal reference
paddle over the sample opening, and takes gain readings for both NIR and Visible regions.
Gain Factor is a measure of signal amplification. In the NIR region (1100-2500nm) it occurs in steps of
1, 2, 4, 10, 20, 40 and 80. In the Visible region (400-1100nm) the gains range from 1 to 80,000.
Gain Adjust can be helpful when troubleshooting an instrument. For example, a gain of 80 in NIR and
80,000 in Visible is a sign that the lamp is burned out, or some other sort of failure. Note that the
gain factors are reported in Performance Test, and can be called up from the Diagnostic Database.
This permits the user to see if the gain factor has changed significantly over time.
7.2.5 Low Flux Test
Low Flux Test is included for users who must run this test in support of regulatory requirements.
Low Flux Test uses a nominal 10% reflectance standard in the sample position. A noise test is run
using this standard. Because the reflectivity is less than the instrument standard, the test is
considered a good method for testing instrument noise in the range of reflectivity of many common
sample absorptions.
The XDS instrument has an internal 10% neutral density (transmittance) screen, triggered by
software, which can be used in place of an external 10% reflectance standard. This screen gives
equivalent results during the Low Flux Test, and minimizes the possibility of operator error in placing
the standard.
To initiate the Low Flux Test, follow this sequence:
86
Page 89
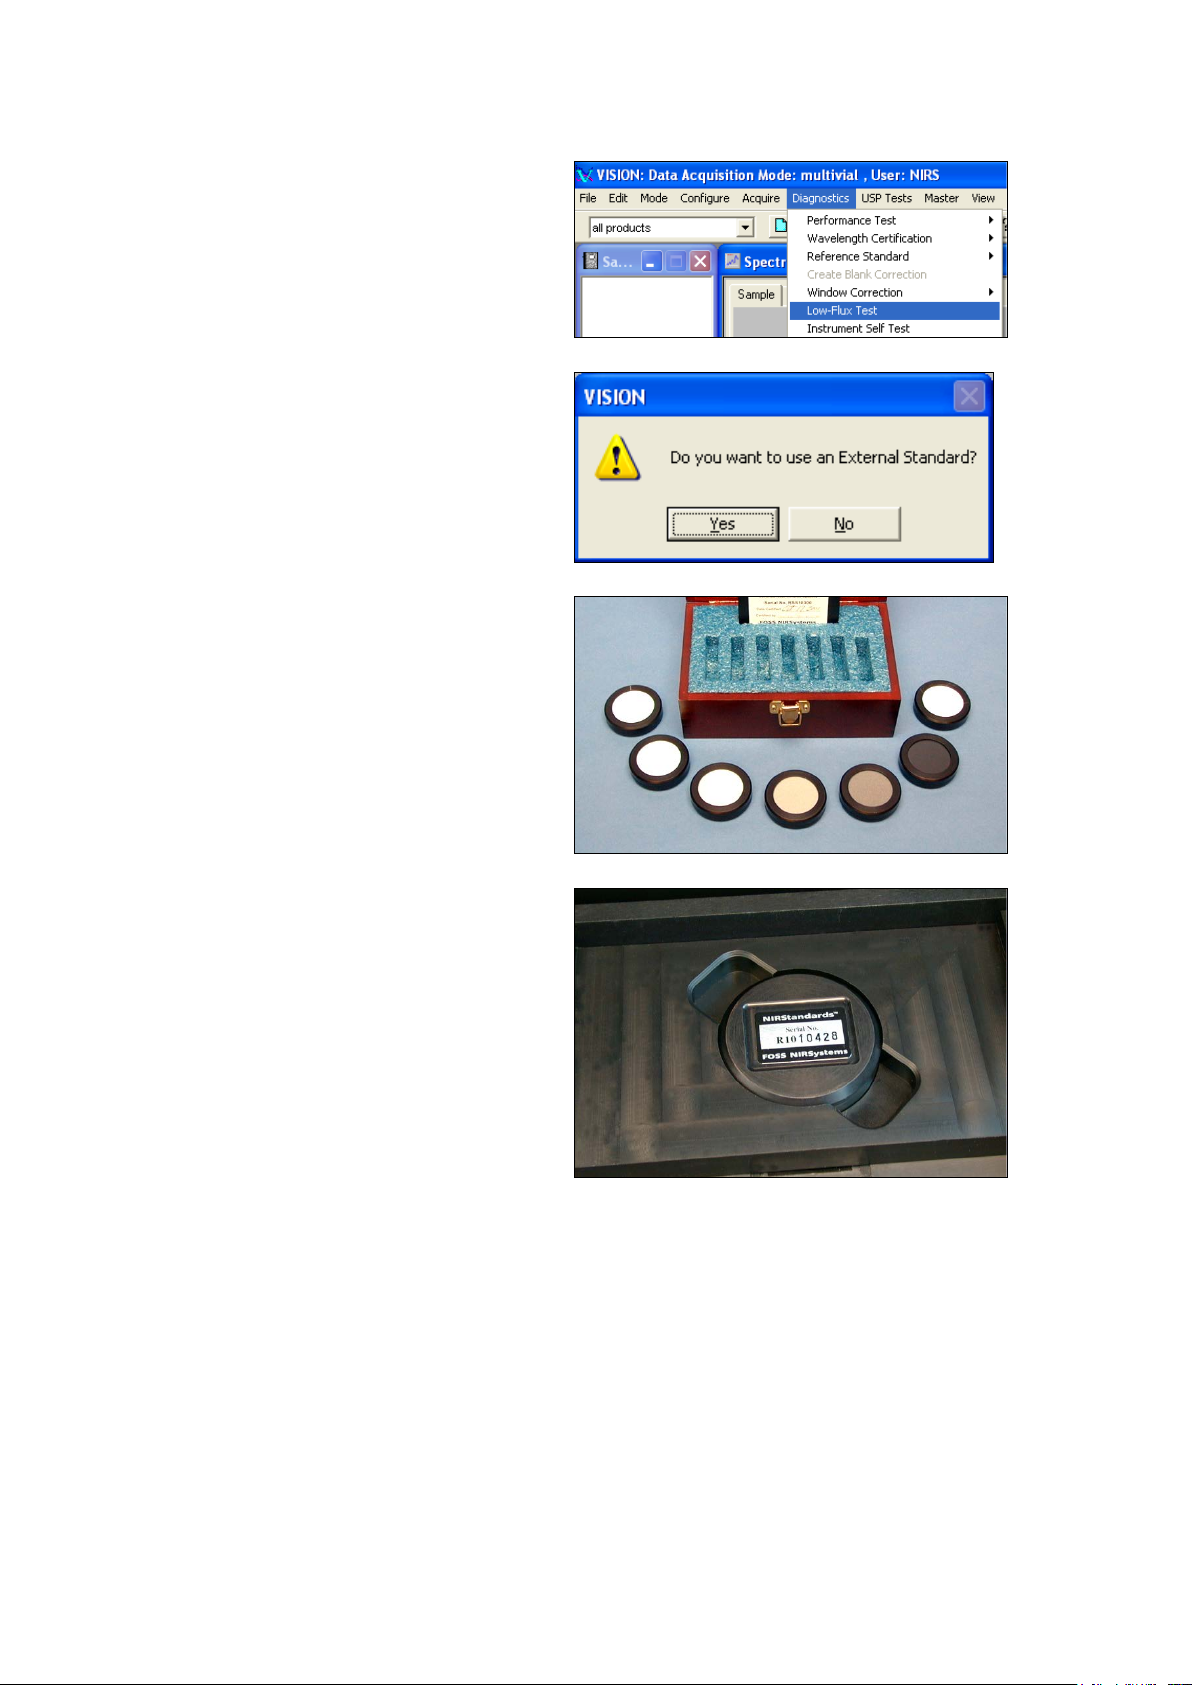
▪▪▪▪▪▪▪
From the Diagnostics menu bar, select Low
Flux Test.
Vision asks if the user wishes to use an
The 10% reflectance standard should be
external sample (standard) for the test.
Click “Yes” to use an external 10%
reflectance standard.
XC-1010 Reflectance Standards contain a
10% reflectance standard (R101xxxx) which
may be used for this test.
positioned in the tray as shown. The label
should be parallel to the long edge of the
tray.
If the user clicks “No” to the external standard, then Vision will automatically trigger the 10% internal
screen for this test. No user action is required.
Vision runs the Low Flux Test, which takes about 10 minutes. At the end, the results are displayed. A
typical run is shown:
87
Page 90
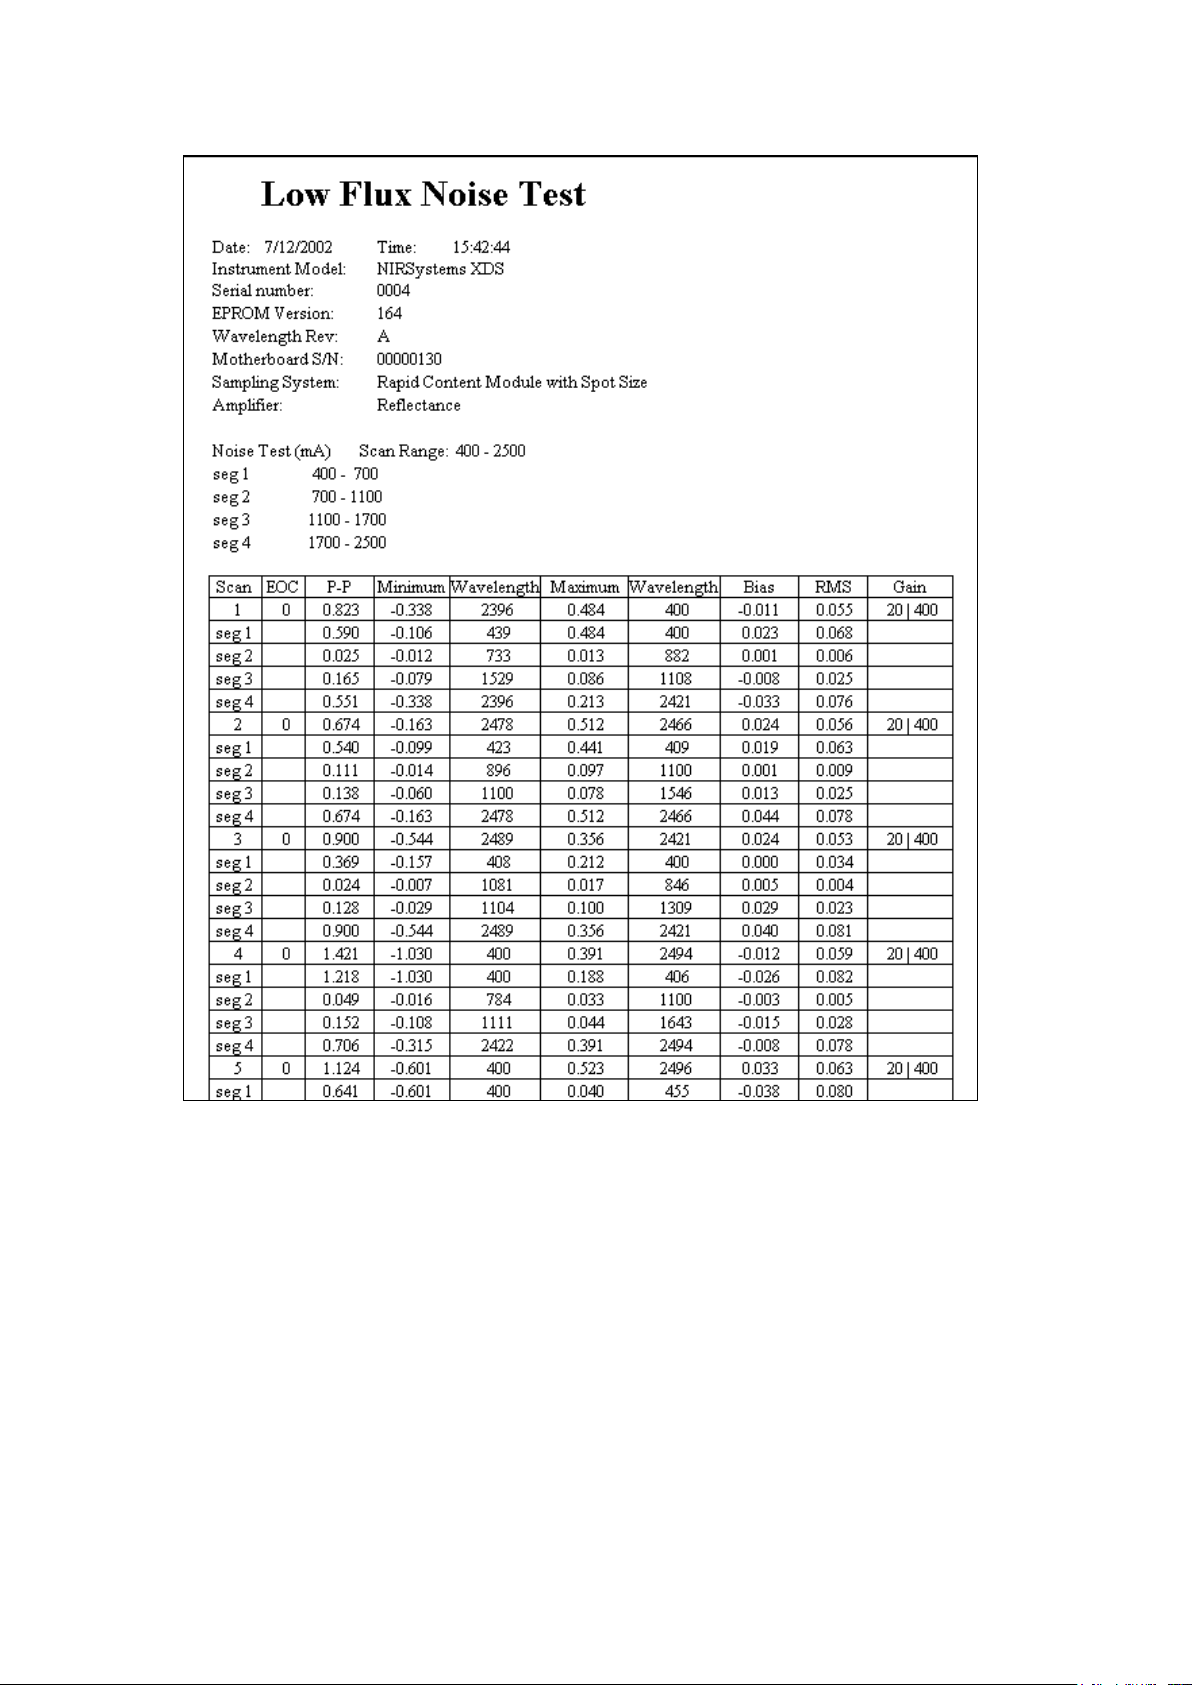
▪▪▪▪▪▪▪
Click on the tab marked “Summary” to see the summarized results as compared to acceptance
specifications. Vision reports a pass or fail based upon successful test completion.
Results are stored in the Diagnostic Database for later recall. The user may print results, or click
“Close” to complete the test.
88
Page 91
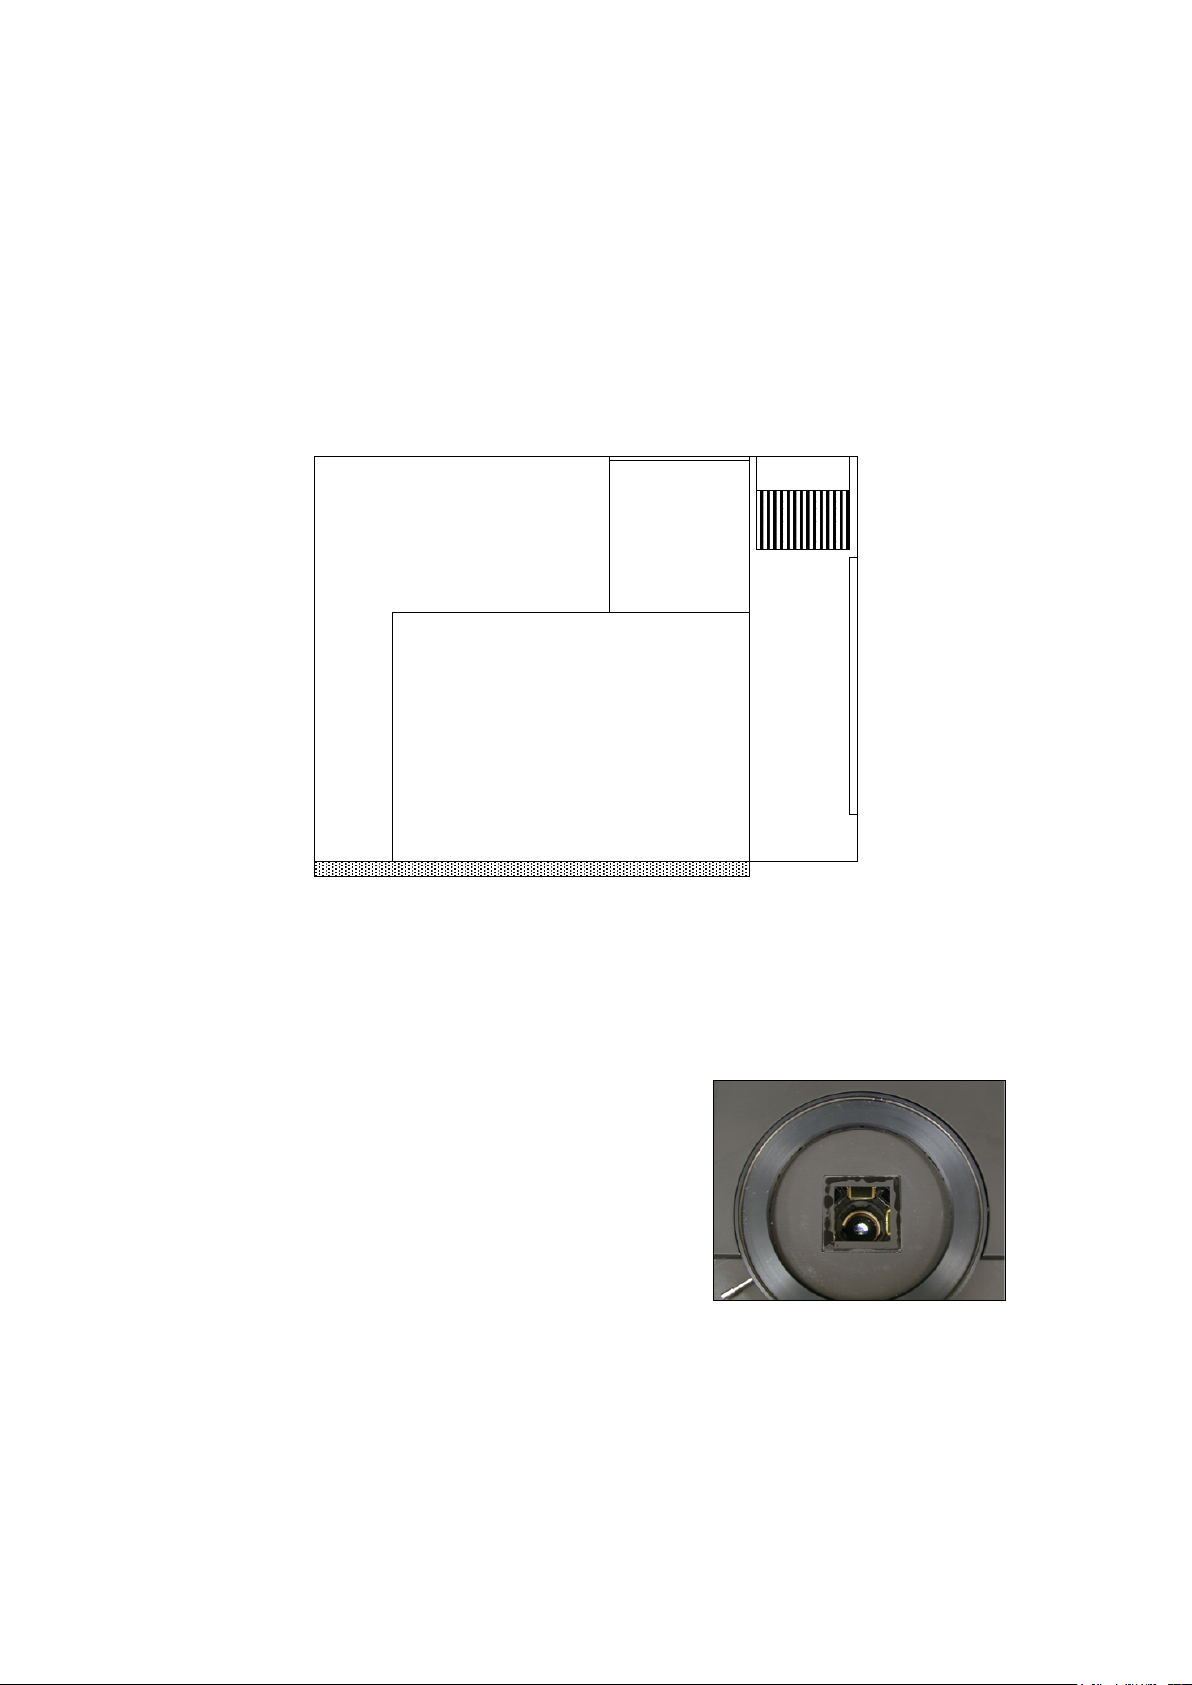
▪▪▪▪▪▪▪
8 Instrument Maintenance
Monochromator
Lamp Box
FANS
Power Supply, Circuitry,
Connectors, Etc.
Connector Plate to Sampling Module
Fan
Filter
The sampling window should be kept clean to prevent loss
Instrument maintenance is quite simple on the XDS MultiVial Analyzer. The optical enclosure is sealed
to prevent contamination of critical parts, which keeps maintenance to a minimum. A diagram of the
internal parts is shown, primarily for user information.
8.1 Overview
DO NOT attempt to open the optical enclosure. There are no user-serviceable parts inside. Damage is
not covered under warranty.
This is a diagram of a top view of the inside of the instrument, showing the relative location of
major components. Do not attempt to open the instrument enclosure unless directed to do so by
trained Metrohm service personnel.
The instrument should be kept clean at all times. If it becomes dusty or dirty, wipe it with a damp,
soft cloth to restore the finish.
of signal. (This is especially important with high-absorbance
samples.) Clean with a dampened, soft, non-linting tissue.
Remove all surface deposits and dust.
Periodically verify that no equipment has been placed nearby that might produce vibration or impacts
that could be transferred to the XDS MultiVial Analyzer. Such equipment can produce spectral
disturbances that are visible in diagnostics scans, and may affect analytical results.
89
Page 92
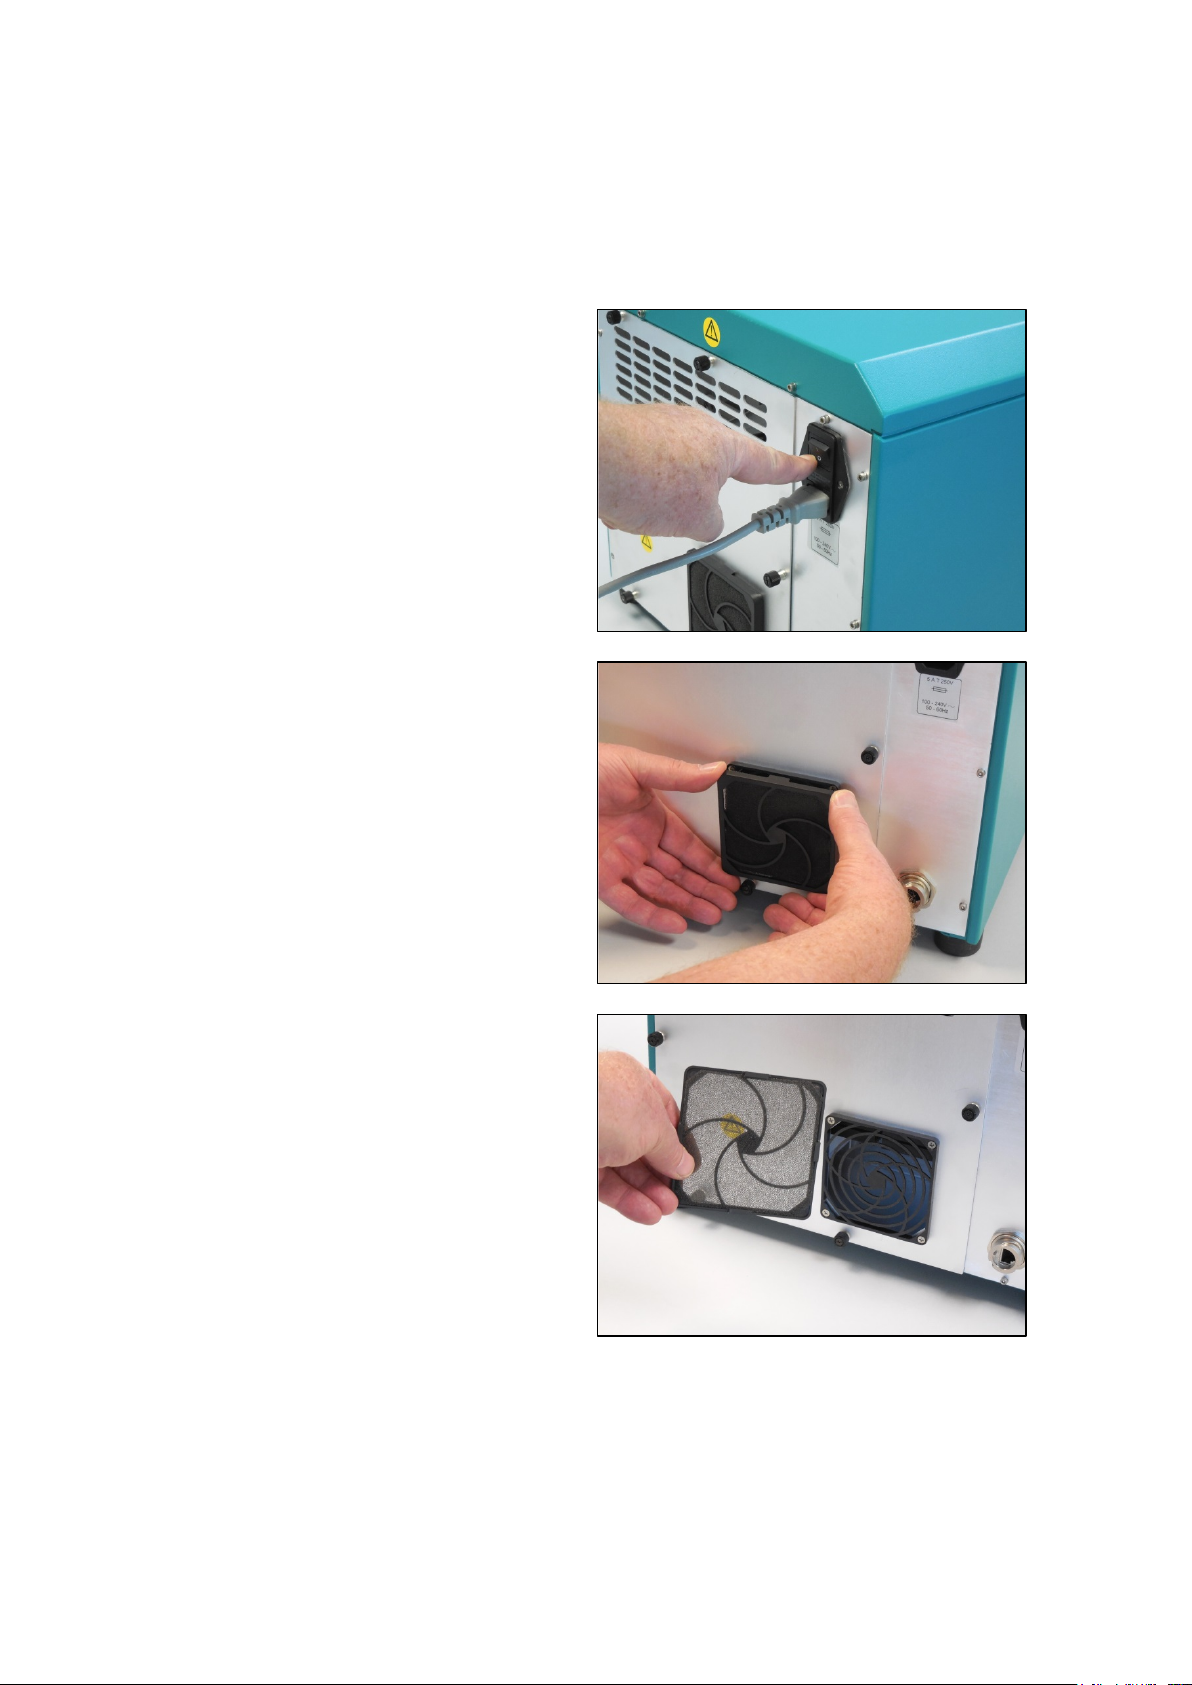
▪▪▪▪▪▪▪
Turn off power at the power switch located on
Lift the filter cover off and examine the filter
8.2 Fan Filter Replacement
The fan filter should be inspected at least monthly. (If installed in a dusty or dirty environment, it
should be checked weekly or twice-weekly.) We recommend that instrument power be turned off
before changing the filter. The filter is changed as follows:
the back panel.
The power cord may be removed for easier
access to the filter, if desired. This is not essential,
though we did remove it here for photos
Using both hands, grasp the filter cover and
gently unsnap it, starting at the top, and working
to the sides and bottom.
material. If clogged, it should be replaced.
A spare filter is included in the accessory box.
90
Page 93

▪▪▪▪▪▪▪
Using the new filter material, gently insert it into
the filter cover. It should fit easily in any direction,
Be sure the filter material is positioned correctly,
as it is symmetrical.
and is not wrinkled or folded. There should be no
gaps at the edges.
Starting at the top, snap the frame into place.
When all four snaps are in place, the face of the
filter frame should be parallel to the back plate of
the instrument.
When finished, re-install the power cord if
removed earlier. Instrument power may be turned
on.
8.3 Lamp Replacement
The lamp may need to be changed after several thousand hours of use. Generally the instrument will
exhibit high noise during Performance Test, or when wavelength precision (repeatability) has begun
to rise from established values.
CAUTION:
Let the lamp cool for about 10-15 minutes before
attempting to remove it – it may be very hot.
Follow this replacement procedure:
91
Page 94
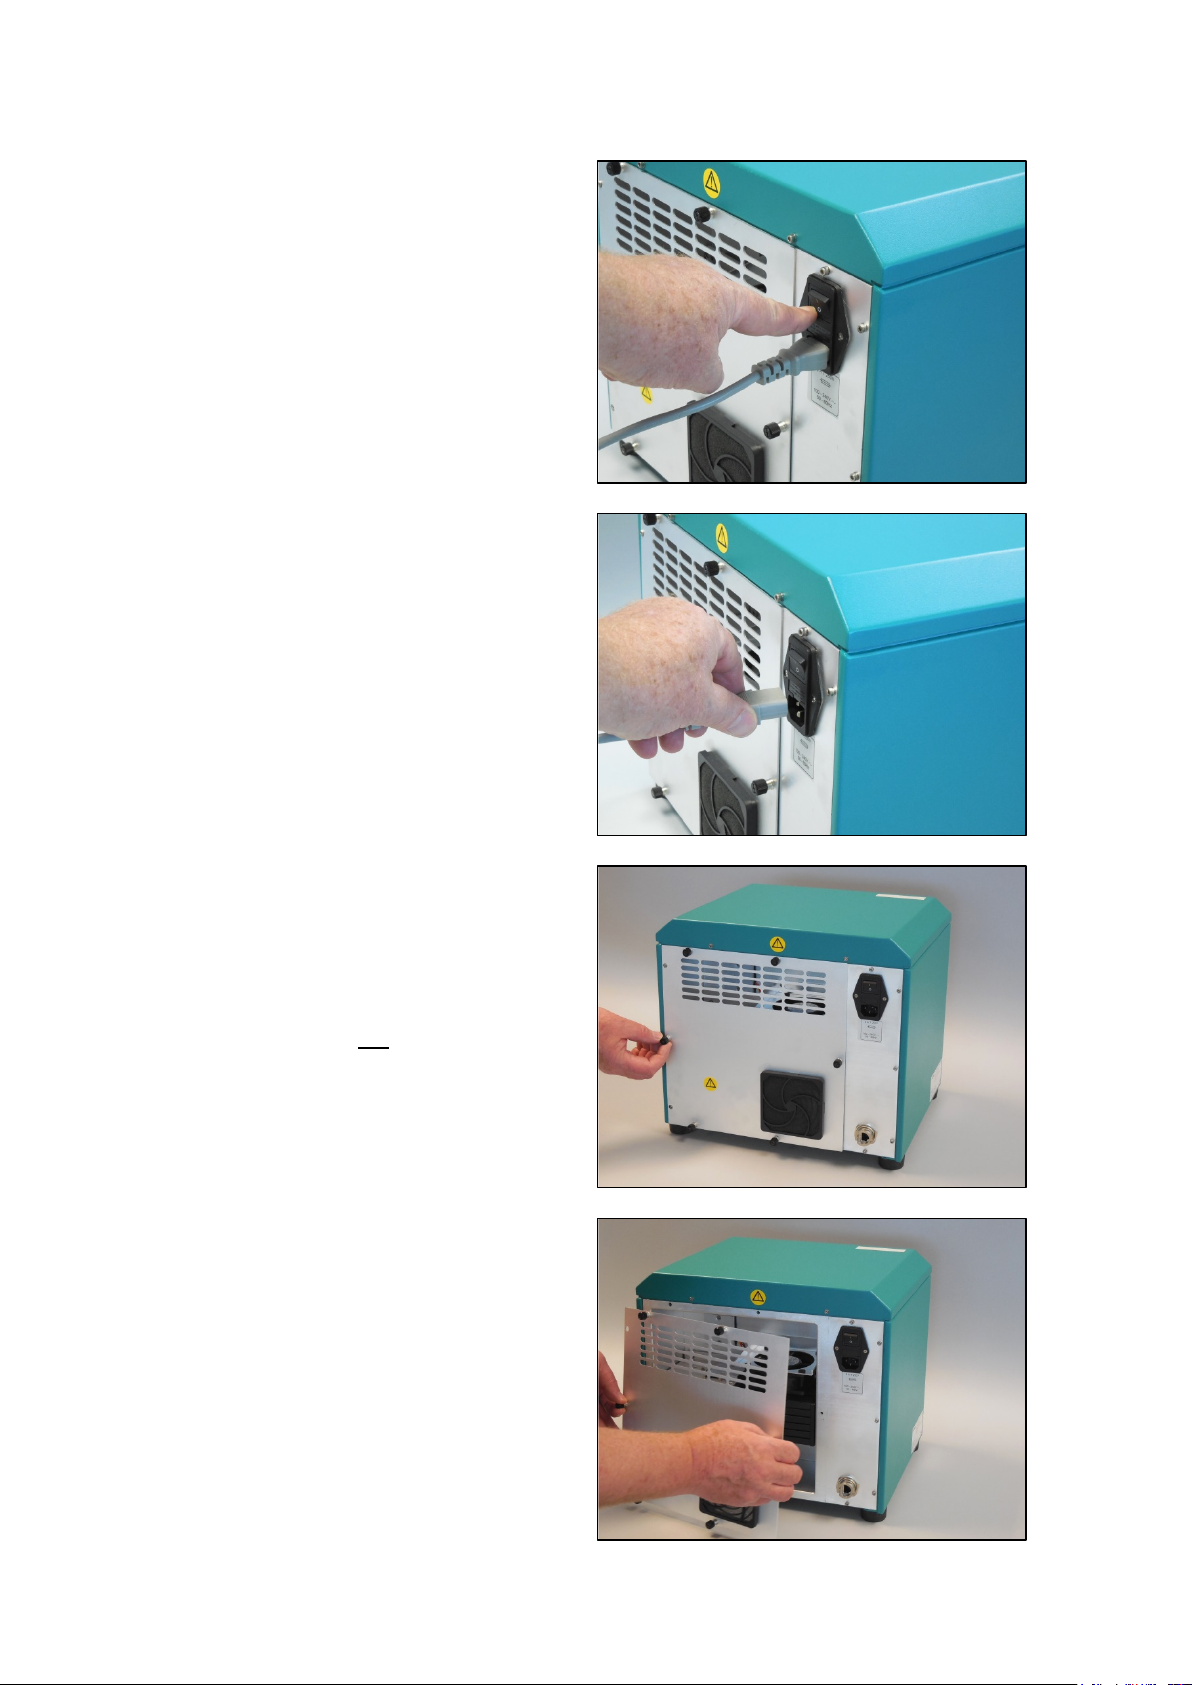
▪▪▪▪▪▪▪
Turn off power at the power switch located on
Unplug the power cord. While this is not
When all six screws are loose, gently lift the back
the back panel.
essential, it makes access easier. Remove the
communications cable too.
Loosen the six (6) captive screws which hold the
back cover in place. These should only be handtight. If the screws are too tight, use a Phillipshead or flat-bladed screwdriver to loosen them.
Back the screws out as far as they will go, to
release the back plate. Do not
the captive screws from the back plate.
plate off the monochromator, and set it in a safe
place.
attempt to remove
92
Page 95

▪▪▪▪▪▪▪
This orientation photo shows the area inside the
back cover. The lamp box is at the lower left.
The lamp box contains the lamp terminals at the
Using a #2 Phillips-head or flat-bladed
The fan and heat sinks, shown to the right of the
lamp box, are used to cool the instrument. No
maintenance or adjustment should be done on
these items.
If the lamp is still warm, give it several minutes to
cool. It may be hot enough to cause burns – this
should be avoided.
upper right, and the lamp itself, held in a quickrelease holder.
There is a black arrow on the lamp, which must
be oriented to the machined groove at the top of
the lamp mounting area.
Note the three quick-release studs (one is behind
a yellow wire) which hold the lamp mounting
plate in position. In a later step, this plate will be
pushed in, then rotated to remove the lamp.
screwdriver, loosen each lamp terminal and
remove the spade lugs as shown.
Do not remove the terminal screws.
93
Page 96

▪▪▪▪▪▪▪
Gently grasp the corners of the lamp mounting
When the lamp mounting plate is free of the
plate. Push in about 1mm, then rotate clock-wise
(to the right) about 5 mm.
The lamp mounting plate should then be pulled
outward from the mounting studs.
studs, lift the lamp and plate assembly out of the
lamp box as shown.
As a precaution, the lamp may be held by the
wires at this point, to avoid the hot lamp housing
and reflector.
Lift the lamp mounting plate up over the ends of
the lamp wires and remove it.
Discard the old lamp. Do not
become confused with new lamps. It cannot be
reused.
Locate the new lamp which was packed as part
of the accessory kit.
Place the lamp mounting plate over the wires of
the new lamp in the same manner. Let the lamp
mounting plate spring rest on the back of the
new lamp.
save it, or it may
94
Page 97

▪▪▪▪▪▪▪
Position the lamp with the black arrow up as
shown. Gently insert the lamp and mounting
This photo shows the black arrow in proper
Insert lamp connector spade lugs, one at a time,
plate into the lamp housing as shown.
Engage the holes over the studs. When all three
are in place, rotate the mounting plate counterclockwise (to the left) until they all lock in
position.
Verify that the black arrow on the lamp is aligned
with the machined groove in the lamp housing. If
not, gently
alignment. This is required for proper operation
of the instrument.
alignment. Note that the lamp mounting plate is
in the correct position on the studs.
rotate the lamp to get it into
under each terminal screw.
There is no polarity requirement, so either wire
may be under either screw.
Tighten each terminal securely to assure good
electrical contact.
95
Page 98

▪▪▪▪▪▪▪
Carefully re-install the back cover, lining up the
When finished, re-install the power cord if
In Vision, connect to the instrument, and turn the
captive screws with the mating threaded holes.
Tighten gently by hand.
Do not over-tighten as the screws tend to
become tighter over time. Do not
screwdriver, as this will make the screws very
difficult to remove at a later date.
removed earlier. Re-install the communications
cable as well. Instrument power may be turned
on.
use a
Turn the power switch to the ON position.
lamp ON. The LED panel should show the lamp as
“ON”. The second icon from the right in this
photo indicates the lamp is turned on.
Allow the lamp to warm up for an hour or so, to
let the temperature equilibrate inside the
instrument.
96
Page 99
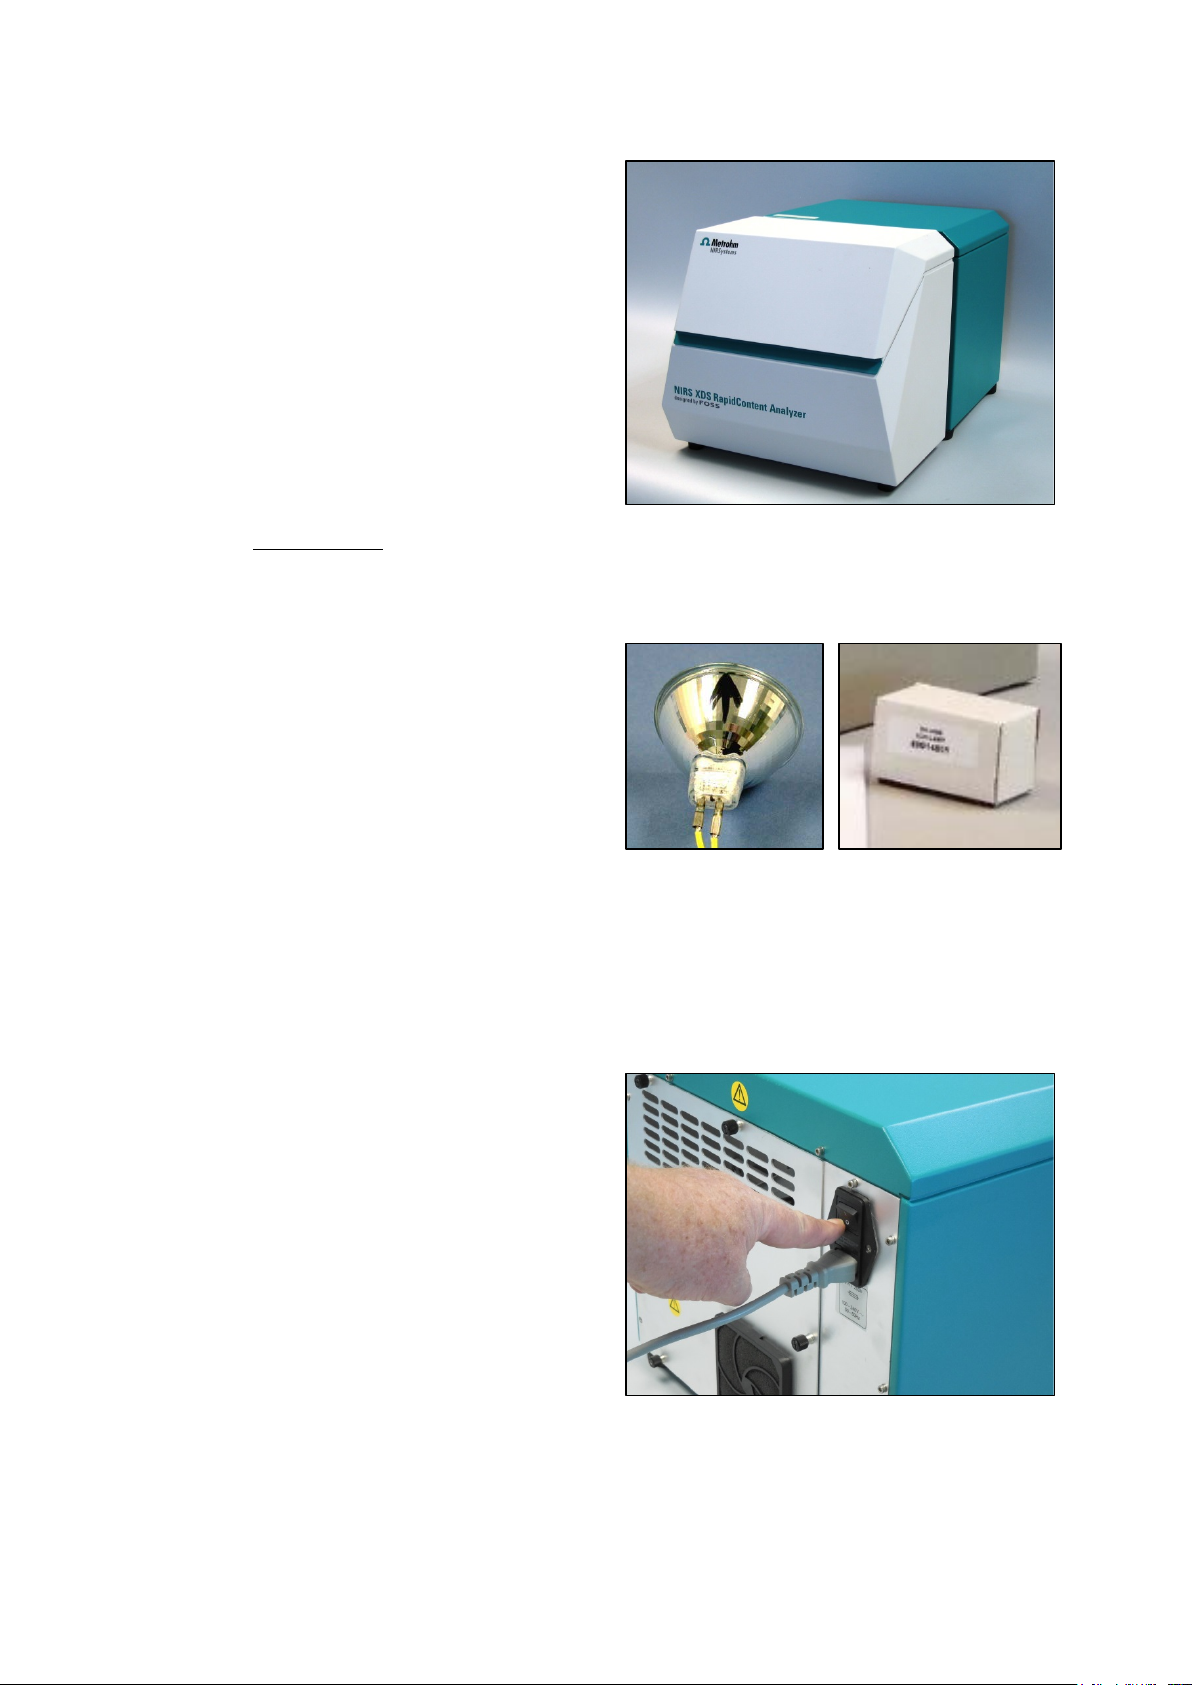
▪▪▪▪▪▪▪
Perform tests as specified in the prior sections of
this manual. These normally include the
Immediately contact your Metrohm distributor to
Turn off power at the power switch located on
following:
• Wavelength Linearization
• Performance Test
• Reference Standardization
(if applicable to this model)
• Instrument Calibration
The spare lamp may come with generic
instructions for instrument testing. Use the
instructions in this manual
as this manual overrides all instructions packed
with the lamp.
order a new spare lamp.
The part number is 6801 4801, model number
XA-3000. It is wise to keep several spare lamps
on hand.
Do not accept lamps from any other source. They
will not work in your Metrohm instrument.
to test the instrument,
8.4 Fuse Replacement
Fuse Replacement is an unusual event, and usually is caused by some electrical fault. The electrical
fault should always be investigated and repaired before fuse replacement. Once the fault is found
and corrected, this procedure should be followed:
the back panel.
97
Page 100
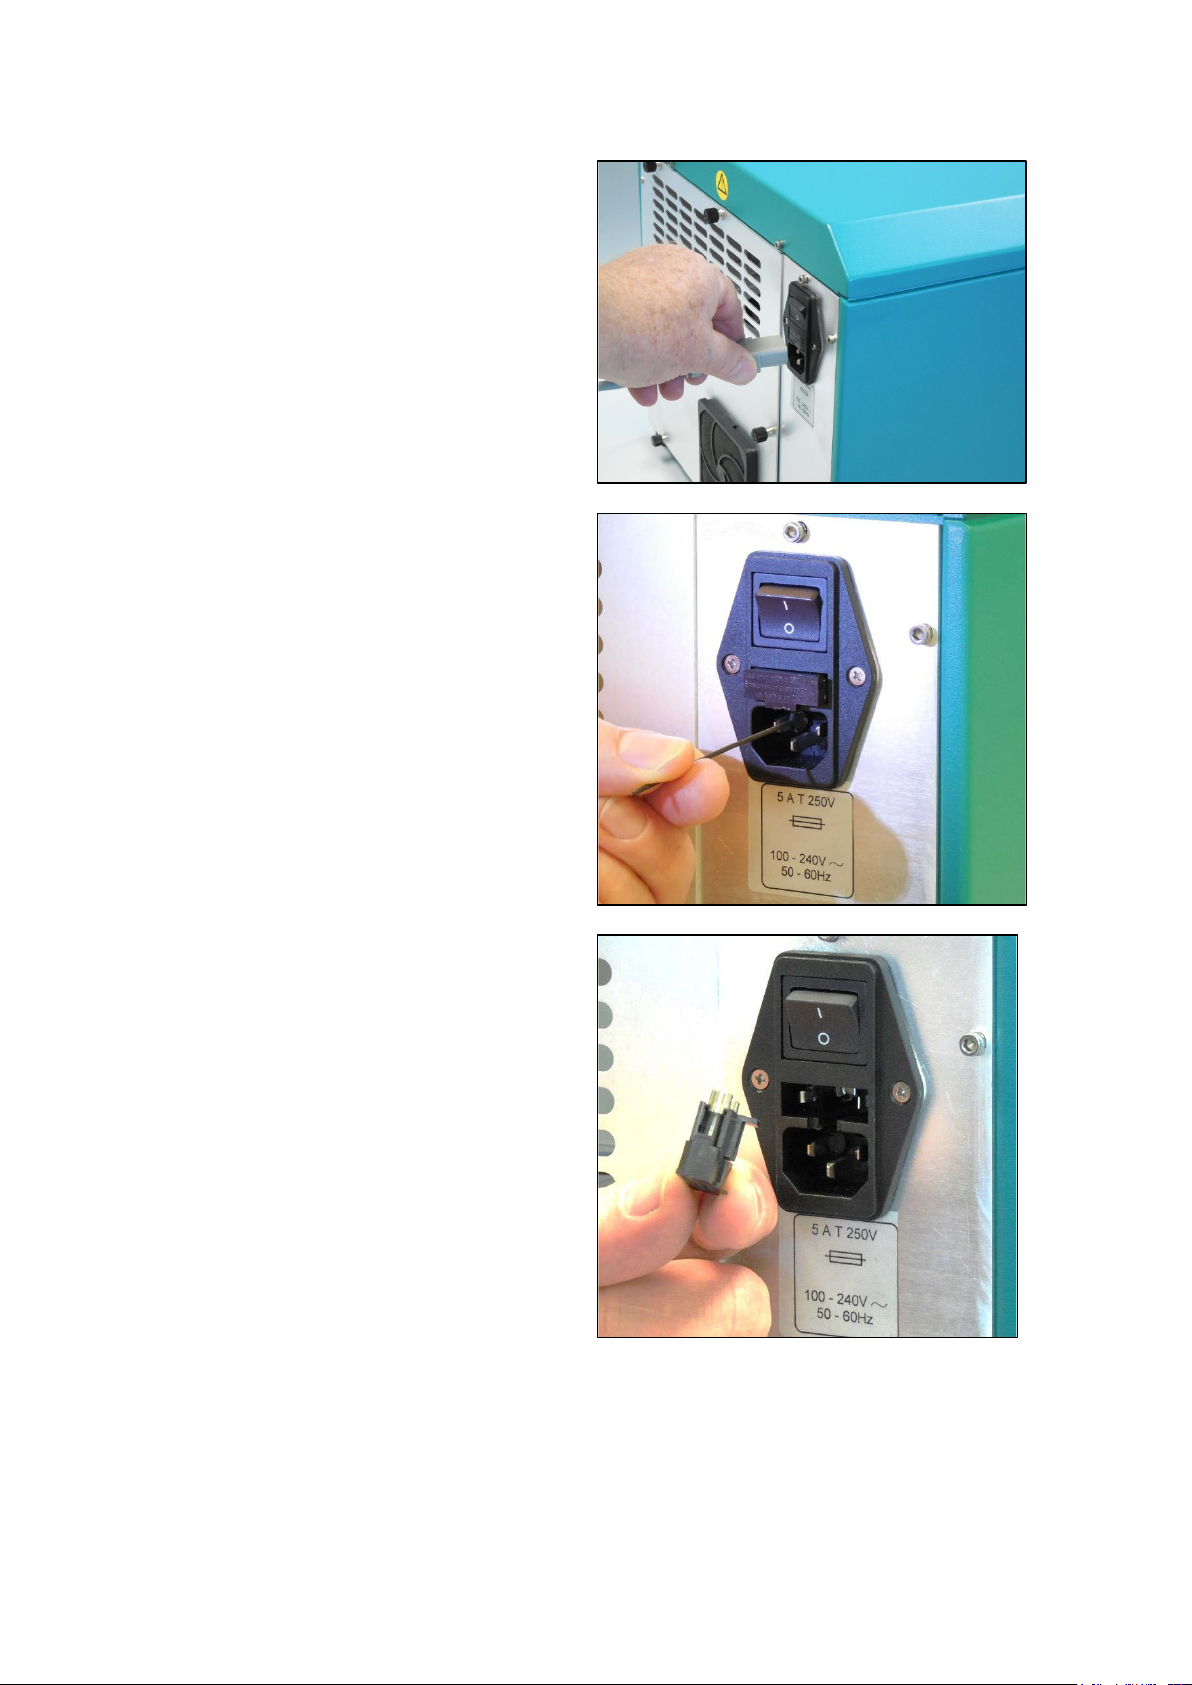
▪▪▪▪▪▪▪
Remove the power cord for access to the fuse.
Use a tool (such as an Allen wrench) to pull the
Remove old fuses from holder and discard. Install
housing open.
There is a small slot, underneath the fuse door
and in the center, where the tool can be inserted
to pry the door gently open.
the new fuses as shown.
Fuse Ratings:
• 5A 250 VAC, 5 x 20mm
• Slo-Blo
• (2) Required
The new fuses clip into the plastic holder, and
should be positioned at the center of the holder.
Close the fuse door fully.
98
 Loading...