

Page 1

User's Guide
Page 2

Page 3

Notice
Enterasys Networks reserves the right to make changes in specifications and other information contained in this
document without prior notice. The reader should in all cases consult Enterasys Networks to determine whether
any such changes have been made.
The hardware, firmware, or software described in this manual is subject to change without notice.
IN NO EVENT SHALL ENERASYS NETWORKS BE LIABLE FOR ANY INCIDENTAL, INDIRECT,
SPECIAL, OR CONSEQUENTIAL DAMAGES WHATSOEVER (INCLUDING BUT NOT LIMITED TO
LOST PROFITS) ARISING OUT OF OR RELATED TO THIS MANUAL OR THE INFORMATION
CONTAINED IN IT, EVEN IF ENERASYS NETWORKS HAS BEEN ADVISED OF, KNOWN, OR
SHOULD HAVE KNOWN, THE POSSIBILITY OF SUCH DAMAGES.
IN NO EVENT WILL ENTERASYS NETWORKS BE LIABLE FOR ANY DAMAGES WHATSOEVER,
INCLUDING SPECIAL, INDIRECT, OR CONSEQUENTIAL DAMAGES, ARISING OUT OF OR IN
CONNECTION WITH THE USE OR PERFORMANCE OF THE WEB LOG VIEW, WHETHER IN AN
ACTION OF CONTRACT OR TORT INCLUDING NEGLIGENCE.
Virus Disclaimer
Enterasys Networks has tested its software with current virus checking technologies. However, because no antivirus system is 100% reliable, we strongly caution you to write protect and then verify that the Licensed
Software, prior to installing it, is virus-free with an anti-virus system in which you have confidence.
Enterasys Networks makes no representations or warranties to the effect that the Licensed Software is virus-free.
Copyright 2000, 2001, 2002 by Enterasys Networks. All rights reserved.
Printed in the United States of America.
Order Number: 9032722-05 August 2002
Enterasys Networks, Inc.
P.O. Box 5005
Rochester, NH 03866-5005
Enterasys, NetSight, XPedition and Matrix E7 are trademarks of Enterasys Networks.
Windows, Windows NT, Windows XP, Microsoft, Microsoft Windows, and Microsoft Windows for
Workgro ups are trademarks or registered trademarks of Microsoft Corporation.
Solaris, Sun, Sun Microsystems, are trademarks or registered trademarks of Sun Microsystems, Inc.
Cabletron Systems, SPECTRUM, BRIM, DNI, FNB, INA, Integrated Network Architecture, LANVIEW,
LANVIEW Secure, Multi Media Access Center, MiniMMAC, and TRMM are registered trademarks, and
Bridge/Router Interface Modules, BRIM-A100, CRBRIM-W/E, CRXMIM, CXRMIM, Desktop Network
Interface, Distributed LAN Monitoring, Distributed Network Server, DLM, DNSMIM, E1000, E2000,
E3000, EFDMIM, EMM-E6, EMME, EPIM, EPIM-3PS, EPIM-A, EPIM-C, EPIM-F1, EPIM-F2, EPIMF3, EPIM-T, EPIM-T1, EPIM-X, ESXMIM, ETSMIM, ETWMIM, FDCMIM-04, FDCMIM-08,
FDMMIM, FDMMIM-04, Flexible Network Bus, FOMIM, FORMIM, HubSTACK, IRBM, IRM, IRM-2,
iii
Page 4

IRM-3, Media Interface Module, MicroMMAC, MIM, MMAC, MMAC-3, MMAC-3FNB, MMAC-5,
MMAC-5FNB, MMAC-8, MMAC-8FNB, MMAC-M8FNB, MMAC-Plus, MRX, MRXI, MRXI-24,
MultiChannel, NB20E, NB25E, NB30, NB35, NBR-220/420/620, RMIM, SecureFast Switch, SecureFast
Packet Switching, SFS, SFPS, SPECTRUM Element Manager, SPECTRUM for Open Systems, SPIM-A,
SPIM-C, SPIM-F1, SPIM-F2, SPIM-T, SPIM-T1, TPMIM, TPMIM-22, TPMIM-T1, TPRMIM,
TPRMIM-36, TPT-T, TRBMIM, TRMM-2, TRMMIM, and TRXI are trademarks of Cabletron Systems,
Inc.
AppleTalk, Apple, Macintosh, and TokenTalk are registered trademarks; and Apple Remote Access and
EtherTalk are trademarks of Apple Computer, Inc.
SmartBoost is a trademark of American Power Conversion
ST is a registered trademark and C++ is a trademark of AT&T
Banyan and VINES are registered trademarks of Banyan Systems, Inc.
cisco, ciscoSystems, and AGS+ are registered trademarks; and cBus, cisco Router, CRM, IGS, and MGS are
trademarks of cisco Systems, Inc.
GatorBox is a registered trademark; and GatorMail, GatorMIM, GatorPrint, GatorShare, GatorStar, GatorStar
GX-M, and XGator are trademarks of Cayman Systems, Inc.
CompuServe is a registered trademark of CompuServe Incorporated
X Window System is a trademark of Consortium, Inc.
CTERM, DECnet, and ULTRIX are registered trademarks; and DEC, DEC C++, DECnet-DOS, DECstation,
VAX DOCUMENT, VMA, and VT are trademarks of Digital Equipment Corporation
Fore Systems, ForeRunner, and ForeRunner ASX-100 are trademarks of Fore Systems, Inc.
PC/TCP is a registered trademark of FTP Software, Inc.
HP OpenView is a registered trademark of Hewlett-Packard, Inc.
AIX, IBM, OS/2, NetView, and PS/2 are registered trademarks; and AT, Micro Channel, PC, PC-DOS, PC/XT,
Personal Computer AT, Operating System/2, Personal System/2, RISC System/6000, and Workplace Shell are
trademarks of International Business Machines Corporation
i960 microprocessor is a registered trademark; and Intel and Multichannel are trademarks of Intel Corporation
Microsoft, MS-DOS, and Windows are registered trademarks of Microsoft Corporation
Chameleon, ChameleonNFS, Chameleon 32, IPX/link, and NEWT are trademarks of
NETMANAGE, Inc.
NetWare and Novell are registered trademarks; and Internetwork Packet Exchange (IPX), IPX, and Network File
System (NFS) are trademarks of Novell, Inc.
Motif and MS are registered trademarks; and Open Software Foundation, OSF, OSF/1, and OSF/Motif are
trademarks of The Open Software Foundation, Inc.
Silicon Graphics and IRIS are registered trademarks; and Indigo and IRIX are trademarks of Silicon Graphics,
Inc.
iv
Page 5

NFS, PC-NFS, SPARC, Sun Microsystems, and Sun Workstation are registered trademarks; and OpenWindows,
SPARCstation, SPARCstation IPC, SPARCstation IPX, Sun, Sun-2, Sun-3, Sun-4, Sun386i, SunNet, SunOS,
SunSPARC, and SunView are trademarks of Sun Microsystems, Inc.
OPEN LOOK and UNIX are registered trademarks of Unix System Laboratories, Inc.
Ethernet, NS, Xerox Network Systems and XNS are trademarks of Xerox Corporation
ANNEX, ANNEX-II, ANNEX-IIe, ANNEX-3, ANNEX-802.5, MICRO-ANNEX-XL, and MICRO-ANNEXELS are trademarks of Xylogics, Inc.
MAXserver and Xyplex are trademarks of Xyplex, Inc.
Restricted Rights Notice
(Applicable to licenses to the United States Government only.)
1. Use, duplication, or disclosure by the Government is subject to restrictions as set forth in subparagraph (c)
(1) (ii) of the Rights in Technical Data and Computer Software clause at DFARS 252.227-7013.
Enterasys Networks, 35 Industrial Way, Rochester, New Hampshire 03867-0505.
2. (a) This computer software is submitted with restricted rights. It may not be used, reproduced, or disclosed
by the Government except as provided in paragraph (b) of this Notice or as otherwise expressly stated in
the contract.
(b) This computer software may be:
(1) Used or copied for use in or with the computer or computers for which it was acquired, including
use at any Government installation to which such computer or computers may be transferred;
(2) Used or copied for use in a backup computer if any computer for which it was acquired is
inoperative;
(3) Reproduced for safekeeping (archives) or backup purposes;
(4) Modified, adapted, or combined with other computer software, provided that the modified,
combined, or adapted portions of the derivative software incorporating restricted computer
software are made subject to the same restricted rights;
(5) Disclosed to and reproduced for use by support service contractors in accordance with
subparagraphs (b) (1) through (4) of this clause, provided the Government makes such disclosure
or reproduction subject to these restricted rights; and
(6) Used or copied for use in or transferred to a replacement computer.
(c) Notwithstanding the foregoing, if this computer software is published copyrighted computer software, it
is licensed to the Government, without disclosure prohibitions, with the minimum rights set forth in
paragraph (b) of this clause.
v
Page 6

(d) Any other rights or limitations regarding the use, duplication, or disclosure of this computer software are
to be expressly stated in, or incorporated in, the contract.
(e) This Notice shall be marked on any reproduction of this computer software, in whole or in part.
vi
Page 7

Chapter 1 Introduction
Using This Guide ............................................................................................................. 1-1
Getting Help..................................................................................................................... 1-2
Using On-line Help................................................................................................... 1-2
Accessing On-line Documentation ........................................................................... 1-3
Documentation Feedback .................................................................................. 1-3
Getting Technical Support ........................................................................................ 1-3
Online Services on the World Wide Web .......................................................... 1-3
Global Technical Assistance Center .................................................................. 1-3
Chapter 2 Overview of
NetSight Element Manager
About NetSight Element Manager................................................................................... 2-1
Network Discovery................................................................................................... 2-4
Management and Monitoring Workspace................................................................. 2-5
List Views.......................................................................................................... 2-6
Tree Views......................................................................................................... 2-7
Map Views......................................................................................................... 2-9
Log Views........................................................................................................ 2-10
Excluding Nodes..................................................................................................... 2-10
Alarm and Event Handling ..................................................................................... 2-11
The NetSight Element Manager Tool Suite ................................................................... 2-11
Remote Administration Tools................................................................................. 2-12
Scheduler Tool ........................................................................................................ 2-12
MIB Tools ............................................................................................................... 2-13
Customizing NetSight Element Manager ...................................................................... 2-13
Adjusting Default Settings...................................................................................... 2-13
Workspace Options.......................................................................................... 2-14
Network Options ............................................................................................. 2-15
Polling Options................................................................................................ 2-17
Node Options................................................................................................... 2-20
Directories Options.......................................................................................... 2-21
Device Management Options .......................................................................... 2-23
Event Log Options........................................................................................... 2-24
Customizing the Toolbar......................................................................................... 2-26
Adding a Tool Entry ........................................................................................ 2-27
Editing a Tool Entry ........................................................................................ 2-30
Removing a Tool Entry ................................................................................... 2-30
Backing Up Data Files................................................................................................... 2-30
Contents
vii
Page 8

Contents
Editing the Backup Configuration File ...................................................................2-33
Performing a Backup .............................................................................................. 2-34
Restoring Files from a Backup Set ......................................................................... 2-35
Restoring Default Files ...........................................................................................2-35
Chapter 3 Discovering Nodes
Accessing the Discover Manager Window...................................................................... 3-1
Creating and Modifying Discover Scripts .......................................................................3-2
Accessing the Discover Properties Window............................................................. 3-2
Setting General Discover Properties......................................................................... 3-4
Setting Device Discovery Parameters....................................................................... 3-5
Defining IP Address Ranges..............................................................................3-6
Defining and Selecting Subnets ........................................................................ 3-7
Defining a Community Name.......................................................................... 3-11
Selecting a Script Filter ................................................................................... 3-12
Setting a Discover Interval .....................................................................................3-13
Executing Discover Scripts............................................................................................3-14
The Discover Process..................................................................................................... 3-16
NEW and SECONDARY Discovers ...................................................................... 3-17
Stopping a Discover in Progress............................................................................. 3-17
Restarting a Completed Discover ........................................................................... 3-17
Scheduled Discovers............................................................................................... 3-18
Deleting a Discover Script .............................................................................................3-18
Starting the Discover Wizard......................................................................................... 3-19
Launching the Scheduler Application............................................................................ 3-19
Using the IP or Host Locator Tool .................................................................................3-19
Matching a Host Name to an IP Address................................................................ 3-20
Matching an IP Address to a Host Name................................................................ 3-21
Locating the MAC Address for a Host Name/IP Pair ............................................ 3-21
Subnet Search ......................................................................................................... 3-22
Matching a MAC Address to a Host Name and IP.................................................3-25
Using the Subnets Window............................................................................................ 3-27
Creating and Modifying a Subnet Entry ................................................................. 3-28
Deleting a Subnet Entry.......................................................................................... 3-29
Chapter 4 List Views
About List Views ............................................................................................................. 4-1
The List View Workspace......................................................................................... 4-1
Adding a Folder to the Workspace ....................................................................4-2
The All Nodes List View .......................................................................................... 4-3
Other Default List Views .......................................................................................... 4-4
List View Display Options........................................................................................4-5
Using the List View Toolbar.............................................................................. 4-5
Sorting Nodes ....................................................................................................4-6
Searching a List View ............................................................................................... 4-7
Creating and Editing List Views.................................................................................... 4-10
viii
Page 9

Contents
Selecting Node Information to Display .................................................................. 4-11
Node Information Options............................................................................... 4-12
Selecting a Display Font......................................................................................... 4-14
Selecting the Nodes to Display: Using Filters ........................................................ 4-15
Filter Categories .............................................................................................. 4-16
Creating the Filter............................................................................................ 4-18
Excluded Nodes ............................................................................................................. 4-18
Excluding Nodes from an Individual View ............................................................ 4-18
To Exclude a Node from a View ..................................................................... 4-19
To Re-include a Node in a View...................................................................... 4-21
Excluding Nodes from the Central Node Database ................................................ 4-22
The Excluded Nodes List and Discover .......................................................... 4-23
To Exclude a Node from the Central Node Database...................................... 4-23
To Re-include a Node into the Central Node Database................................... 4-24
To Delete a Node from the Database............................................................... 4-25
Adding Network Elements to the Node Database ......................................................... 4-26
Adding a Device ..................................................................................................... 4-27
Editing Device Properties................................................................................ 4-29
Configuring Node Interface Poll Settings .............................................................. 4-34
Editing Poll Settings for Multiple Nodes ........................................................ 4-36
Editing Node Class Properties ....................................................................................... 4-37
Selecting a New Model, Class, Enterprise, or Topology Symbol ................... 4-39
Changing Management Application Information............................................ 4-40
Changing General Node Class Properties ....................................................... 4-44
List Views and Maps...................................................................................................... 4-46
Selecting and Deleting Orphans ............................................................................. 4-46
Using the Go To Map Function .............................................................................. 4-47
Chapter 5 Tree Views
About Tree Views ............................................................................................................ 5-1
The Tree View Workspace........................................................................................ 5-2
Adding a Folder to the Workspace .................................................................... 5-2
The All Nodes Tree View ......................................................................................... 5-4
Other Default Tree Views ......................................................................................... 5-5
Navigating a Tree View ............................................................................................ 5-5
Using the Toolbar and the View Menu.............................................................. 5-5
Using the Keyboard........................................................................................... 5-6
Creating and Editing Tree Views ..................................................................................... 5-7
Selecting Node Information to Display .................................................................... 5-8
Node Properties Options.................................................................................... 5-9
Interface Properties Options ............................................................................ 5-11
Selecting a Display Font......................................................................................... 5-12
Selecting the Nodes to Display: Using Filters ........................................................ 5-13
Filter Categories .............................................................................................. 5-13
Creating the Filter............................................................................................ 5-15
Excluded Nodes ............................................................................................................. 5-16
Tree Views and Maps..................................................................................................... 5-16
Using the Go To Map Function .............................................................................. 5-16
ix
Page 10

Contents
Chapter 6 Creating Network Maps
Working with Maps.......................................................................................................... 6-1
About the Map View.................................................................................................6-2
About Submap Icons.................................................................................................6-3
About GoTo Symbols ...............................................................................................6-4
Map and Device Status Conditions........................................................................... 6-4
Building Your Network Map............................................................................................6-6
Adding a Folder ........................................................................................................6-6
Renaming a Folder.............................................................................................6-7
Adding a New Map................................................................................................... 6-7
Setting Basic Map Options ................................................................................ 6-9
Editing Map Properties.................................................................................... 6-12
Adding a Submap....................................................................................................6-13
Generating Submaps Automatically................................................................ 6-15
Changing a Submap Link ................................................................................ 6-17
Adding a GoTo Symbol.......................................................................................... 6-18
Importing an MRM Map................................................................................................ 6-20
Setting MRM Import Options.................................................................................6-20
Importing a Map ..................................................................................................... 6-21
Adding Network Elements to your Map........................................................................ 6-23
Adding a Device Directly to a Map ........................................................................ 6-23
Customizing Your Map .................................................................................................. 6-26
Using Non-manageable Symbols............................................................................ 6-27
Placing a Symbol Icon..................................................................................... 6-27
Editing Symbol Properties............................................................................... 6-28
Using Connections..................................................................................................6-33
Using Lines and Shapes..........................................................................................6-34
Using Text............................................................................................................... 6-37
Adding Object Notes .............................................................................................. 6-39
Adding Notes to Multiple Nodes..................................................................... 6-42
Changing the Layout of Map Objects..................................................................... 6-42
Layering Items in a Map.................................................................................. 6-43
Align Left, Right, Top, or Bottom ................................................................... 6-43
Space Evenly (Horizontally or Vertically)....................................................... 6-44
Make Same Width, Height, or Size ................................................................. 6-45
Align Objects in Grid ......................................................................................6-46
Align Objects in Ring ...................................................................................... 6-46
Using Object Linking and Embedding (OLE)........................................................ 6-47
Embedding an Object in a Map File................................................................ 6-49
Creating an Object Link ..................................................................................6-52
Adding an Object Package ..............................................................................6-52
Editing Object Data ......................................................................................... 6-53
Updating a Link ............................................................................................... 6-54
Converting an Object.......................................................................................6-56
Working with Linked and Embedded Objects ................................................. 6-57
Editing Your Map........................................................................................................... 6-58
Protecting Your Maps from Editing: The Lock Feature .........................................6-60
Managing Maps and Folders.......................................................................................... 6-61
Opening and Closing Maps and Folders .................................................................6-61
x
Page 11

Contents
Saving Maps ........................................................................................................... 6-62
Deleting Maps and Folders..................................................................................... 6-62
Chapter 7 Node Management Overview
Device Management ........................................................................................................ 7-1
Launching Device Management............................................................................... 7-1
A Brief Overview of Device Management............................................................... 7-2
Source Address Naming .................................................................................................. 7-4
PING ................................................................................................................................ 7-6
Accessing the PING Window................................................................................... 7-6
Appendix A Batch Customization via AddTool, AddImage, and Ad-
dDevType
Using the AddTool Utility ..............................................................................Appendix A-1
Creating an Add Tool Input File ..............................................................Appendix A-3
Comma-Separated Variable (CSV) Format ......................................Appendix A-3
Tag/Data Format ...............................................................................Appendix A-3
Executing the AddTool Command ..........................................................Appendix A-4
Using the AddImage Utility............................................................................Appendix A-5
Creating an AddImage Input File ............................................................Appendix A-6
Comma-Separated Variable (CSV) Format ......................................Appendix A-6
Tag/Data Format ...............................................................................Appendix A-7
Executing the AddImage Command........................................................Appendix A-8
Using the AddDevType Utility .......................................................................Appendix A-9
Creating an AddDevType Input File......................................................Appendix A-11
Comma-Separated Variable (CSV) Format....................................Appendix A-11
Tag/Data Format .............................................................................Appendix A-12
Executing the AddDevType Command .................................................Appendix A-12
Viewing the Log File ....................................................................................Appendix A-13
xi
Page 12

Contents
xii
Page 13

Introduction
Using this guide; getting help
Using This Guide
This manual contains general information regarding NetSight Element Manager,
including:
• Chapter 1, Introduction, which introduces the product, provides an outline of this
book’s structure, describes how to access and use the on-line documentation, and tells
you how to get assistance while using the product.
Chapter 1
• Chapter 2, Overview of NetSight Element Manager, provides a more in-depth look at
some of the application’s features and enhancements, and describes some general
functions of the software platform such as configuring options, backing up data files,
customizing the toolbar, and printing.
• Chapter 3, Discovering Nodes, provides details on how to use the Discover application
to discover nodes on your network. It describes how to build scripts that will discover
IP devices by address range or subnetwork range. The IP or Host Locator tool — which
resolves IP addresses to host names, and vice versa — is also described here.
• Chapter 4, List Views, covers the List View workspace and List View windows.
NetSight Element Manager stores all node information in a central database. List
Views provide you with a variety of user configurable views into that database,
including a wide selection of status and descriptive information about each node. This
chapter also provides information on manually adding nodes to the node database,
editing a node’s displayed properties and individual polling intervals, and launching
device management.
1-1
Page 14

Introduction
• Chapter 5, Tree Views, describes the Tree View workspace and windows. These user-
configurable views let you display your network nodes in a hierarchical tree control
format that provides a variety of information about the features supported by the
device, including information about the interface through which NetSight Element
Manager is communicating with each node.
• Chapter 6, Creating Network Maps, provides detailed instructions on how to use the
Map View workspace, and how to create and link individual map files. You can use
maps to represent your network configuration via symbols and icons. This chapter also
describes the use of Microsoft Object Linking and Embedding (OLE) with map files.
• Chapter 7, Node Management Overview, explains several features of device
management, including an introduction to the Device View windows; creating a source
address definition file; and a brief introduction to the Microsoft PING application.
• Appendix A, Batch Customization via AddTool, AddImage, and AddDevType,
Using the AddTool, AddImage, and AddDevType tools to expand the capabilities of
NetSight Element Manager
Other manuals in your documentation set — including the device-specific User’s Guides,
Tools Guide, Remote Administration Tools User’s Guide, Alarm and Event Handling
Guide, and RMON User’s Guide — contain specific information about the various
applications included in your NetSight Element Manager platform. A set of installation
instructions, a Getting Started guide, and a README.TXT file are also provided.
Getting Help
This section describes two different methods of getting help for questions or concerns you
may have while using NetSight Element Manager.
Using On-line Help
You can use the Help buttons in the NetSight Element Manager windows to obtain
information specific to the currently active window. When you click on a Help button, a
window opens which contains information that will assist you in the use of the windows
and their associated command and menu options. If a Help button is grayed out, on-line
help has not yet been implemented for the associated window. From the Help menu
accessed from the Device View menu bar, you can access on-line Help specific to the
Device View (Help —> Chassis Manager Help or Help —> Help Topics).
1-2 Getting Help
Page 15
Accessing On-line Documentation
All of the online help windows use the standard Microsoft Windows help facility. If you
NOTE
TIP
are unfamiliar with this feature of Windows, you can select Help —>How to Use Help
from the primary NetSight Element Manager window.
The complete suite of documents available for NetSight Element Manager can be
accessed via a menu option from the primary window menu bar: Help —> Online
Documents. If you chose to install the documentation when you installed NetSight
Element Manager, selecting this option will launch Adobe’s Acrobat Reader and a menu
file which provides links to all other available documents.
If you have not yet installed the documentation, the Online Documents option will not be
able to access the menu file. In order to activate this option, you must run the setup.exe
again to install the documentation component. See your Installation Guide for details.
Introduction
Documentation Feedback
Send your questions, comments and suggestions regarding NetSight
documentation to NetSight Technical Communications via the following email address:
Netsight_docs@enterasys.com
Getting Technical Support
Online Services on the World Wide Web
To locate product-specific information, refer to the Enterasys Web page at the
following address:
http://www.enterasys.com
Global Technical Assistance Center
If you have additional questions, contact the Global Technical Assistance
Center using one of these methods:
Telephone (24 hours a day, 365 days a year): (603) 332-9400
Fax: (603)337-3075
Electronic Mail: support@enterasys.com
Getting Help 1-3
Page 16

Introduction
Mailing Address:
Enterasys Networks, Inc.
Technical Support
35 Industrial Way
Rochester, NH 03867
FTP:
ftp.cabletron.com
Login: anonymous
Password: your email address
1-4 Getting Help
Page 17

Chapter 2
Overview of NetSight Element Manager
Key NetSight Element Manager features; customizing the NetSight Element Manager platform;
backing up data files
NetSight Element Manager for Windows™ provides a powerful and easy-to-use tool for
monitoring and managing Enterasys and Cabletron devices from a Microsoft Windows
workstation. Its open architecture and broad feature set also make it an attractive platform
for third party development of management applications.
in
NetSight Element Manager support on the Solaris platform is limited to the
NOTE
installation of NetSight Chassis Manager, either alone or integrated with
Hewlett Packard’s HP OpenView Network Node Manager, and only for
Solaris 2.7. See your NetSight Element Manager Installation Guide for
more information.
About NetSight Element Manager
NetSight Element Manager -- like its predecessor SPECTRUM Element Manager -- is
comprised of several independent but interrelated applications:
• The Network Status application is responsible for polling nodes in the central
database. It provides you with feedback regarding the status of devices on your
network through the central NetSight Element Manager user interface via the List
Views, Tree Views, and Maps. Node status is propagated right up through these views
and onto your desktop via NetSight Element Manager’s minimized icon. Key features
of this user interface are highlighted in the Management and Monitoring
Workspace, beginning on page 2-5.
• The Event Manager application is responsible for alarm and event management. It
receives traps from network nodes and events from other NetSight Element Manager
processes, maintains the Log Views in which you view received events, and carries out
2-1
Page 18

Overview of NetSight Element Manager
any actions that you have configured on reception of a particular trap or event. Alarm
and event management is highlighted in Alarm and Event Handling, beginning on
page 2-11.
•The Scheduler tool allows you to schedule unattended data back-ups and network
discovery sessions that will launch automatically at a scheduled time and date. With
the Scheduler, you can also configure and activate groups of “pager calendars” so that
network technicians can be automatically paged in response to network alarms or
events. The Scheduler is highlighted in Scheduler Tool, beginning on page 2-12.
•The Remote Administration Tools suite let you easily perform management tasks
(such as TFTP downloads, trap table configuration, or setting up MIB statistics polling
or MIB downloads) on an individual device or groups of devices. A MAC Address
Locator Tool also allows you to search one or more devices for the port through which
a selected MAC address is communicating. The Remote Administration Tools
section, page 2-12, briefly describes this powerful tool suite.
Among its features are:
• A primary window where you can navigate between the Map View, List View, Tree
View, and Log View workspaces to activate windows to monitor and manage your
network (such as Map windows and alarm Log View windows). A central menu bar
provides access to most management options.
• A graphical interface that lets you sort, rearrange, and resize column displays, select
icons for nodes in Map View, List View, and Tree View displays, and customize the
toolbar.
• Full-featured on-line assistance, including Wizards for common tasks,
context-sensitive help with a glossary and index, and a status bar with hint text. The
on-line documentation set is also launchable from the NetSight Element Manager
primary window.
• A dockable Workspace area which you can use to access and organize your List View,
Map View, Tree View, and Log View windows (as shown in Figure 2-1). You can
create folders within a view hierarchy to further nest the contents of your view
windows.
• Toolbars which can be docked to the primary NetSight Element Manager window, or
undocked as floating tool palettes (as shown in Figure 2-1). Toolbars are automatically
activated when a related view is active; you can also choose which toolbars you want
to display via the View—>Toolbars menu option.
2-2 About NetSight Element Manager
Page 19
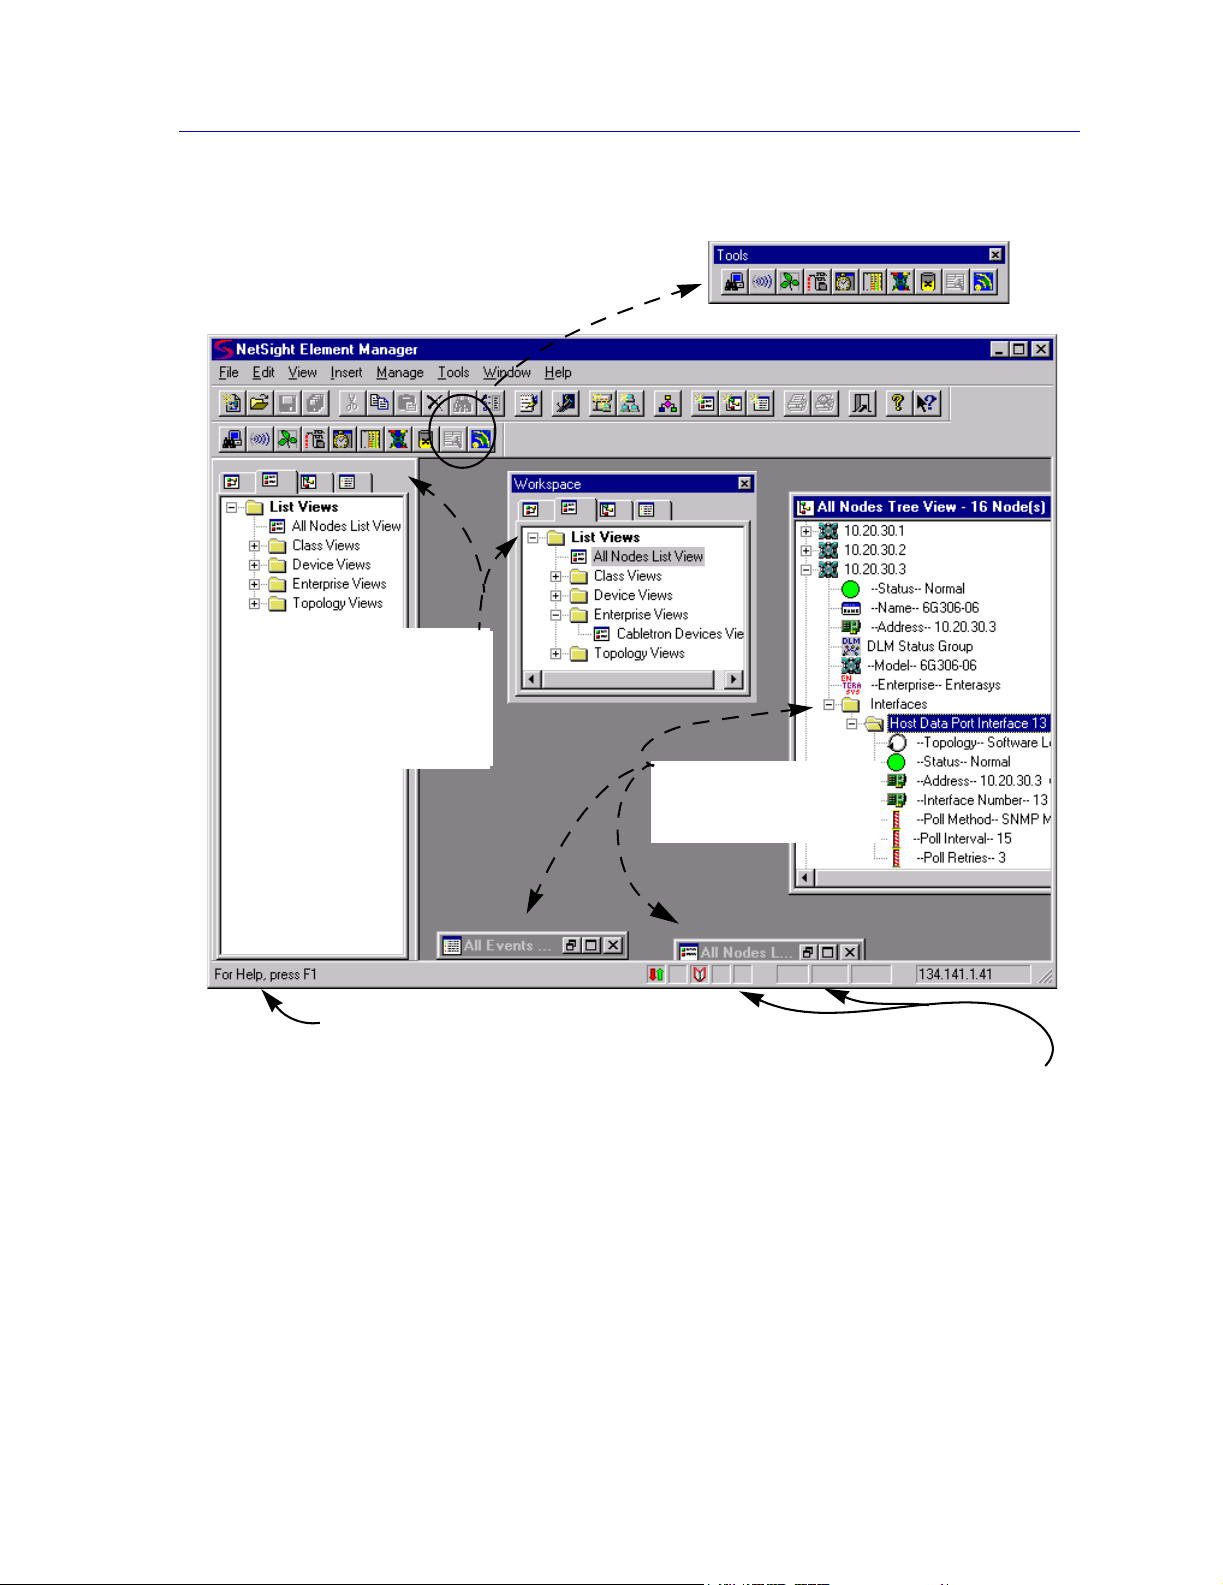
Toolbars can be undocked to become floating
tool palettes (either inside or outside the main
window) or be docked to a different place.
The Workspace can
also be undocked,
and placed either
inside or outside the
main window.
Overview of NetSight Element Manager
Views can be minimized,
but must remain in the
main window area.
Hint text displays here
when you move the cursor
over any toolbar button.
Figure 2-1. The Primary NetSight Element Manager Window,
with Docked and Undocked Workspace and Toolbars
• Drag-and-drop functionality for copy or link operations, so that it’s easy to transfer
data from one management window to the next within the same application (e.g., from
a List View to a Map View), or between applications (e.g., from a NetSight Element
Manager List View to a device group in Remote Administration Tools).
Icons representing various services are displayed
here when those services are active: node polling
service, Scheduler (not shown), alarm and event
service, and discover. Text displays also indicate
key positions, which can affect navigation.
About NetSight Element Manager 2-3
Page 20
Overview of NetSight Element Manager
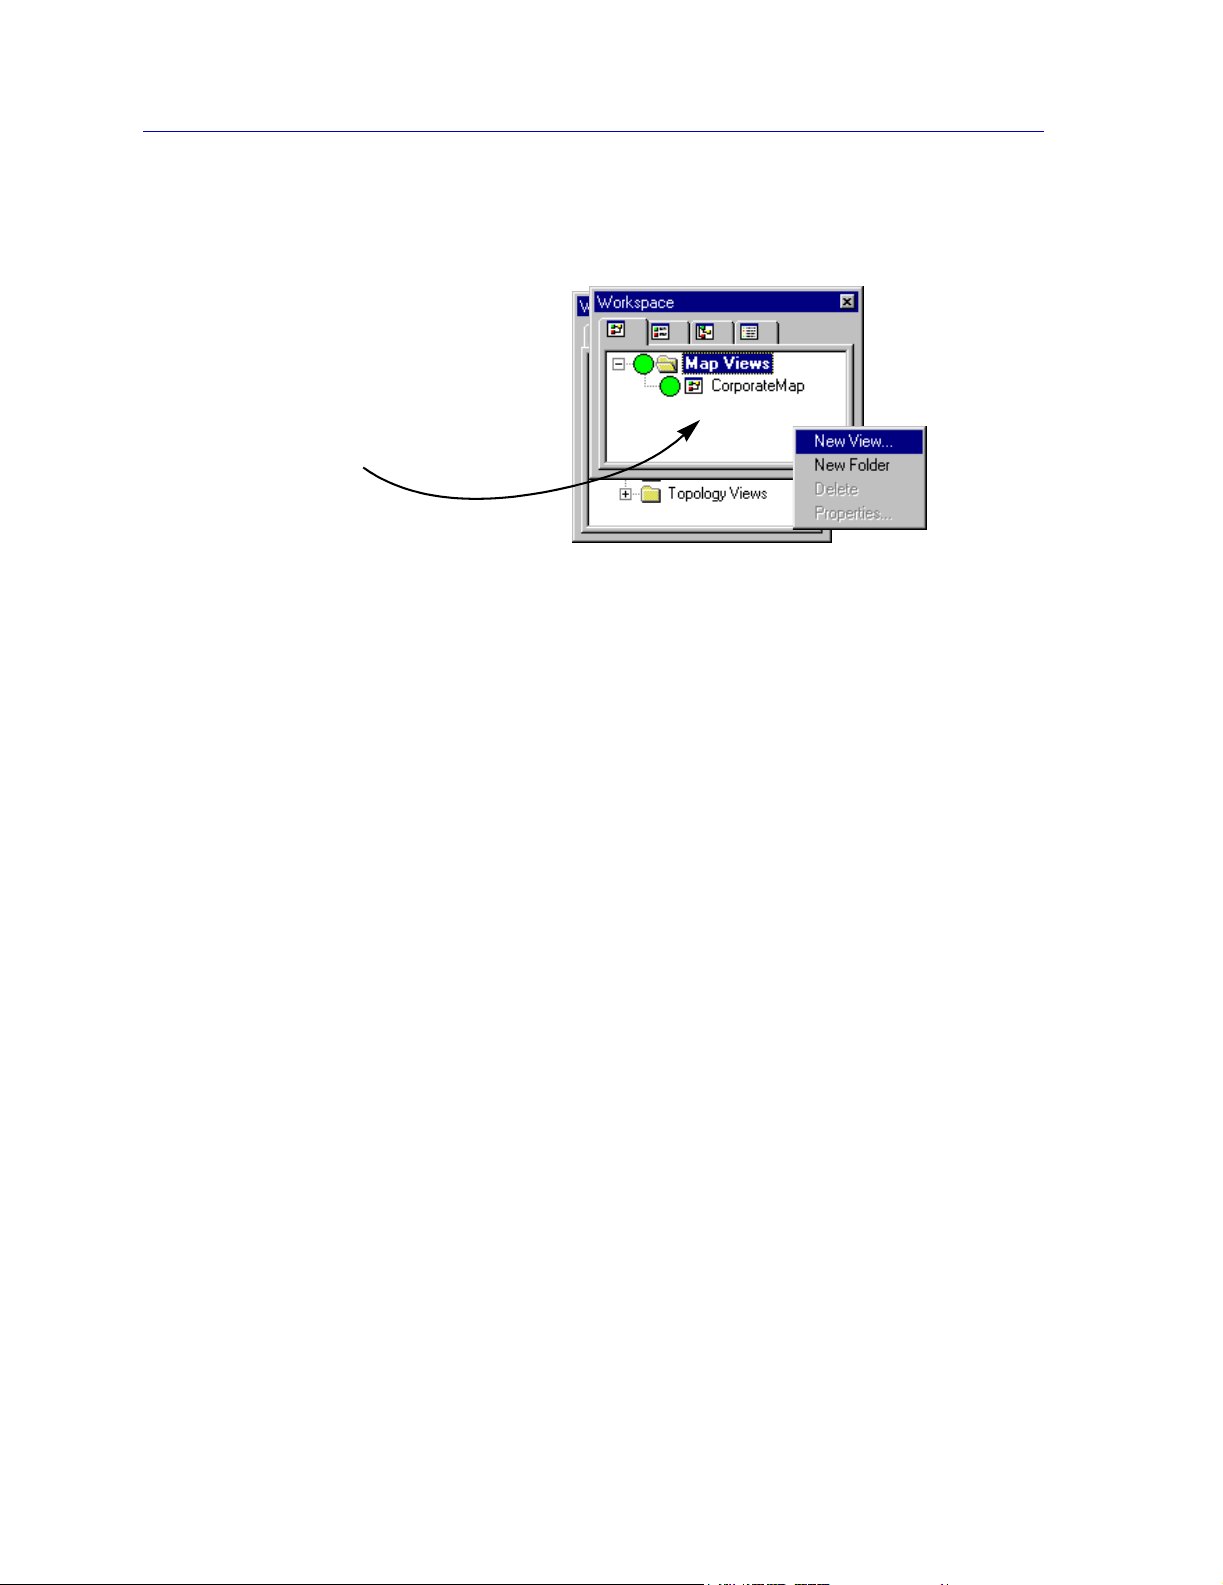
• Right-mouse button functionality for quick access to commonly-used menu
commands (as shown in Figure 2-2).
Clicking the right mouse button in
NetSight Element Manager
windows or workspaces, or on
elements in those windows, will
often bring up a menu with
commonly used management
selections.
Figure 2-2. Sample Right Mouse Functionality
• Print spooling to the Microsoft Windows Print Manager for record keeping purposes.
Printable information includes maps, device lists, alarm statistics, and other statistical
information (including RMON data). The Print Preview option is available to let you
view the material as it would appear on the page before it is actually spooled to the
system printer.
• OLE functionality to embed and link data with management Map files.
The following sections provide an overview of some key NetSight Element Manager
functions.
Network Discovery
The Discover application provides several key features; among these are:
Discover Script Capability
By creating Discover scripts, you can store the parameters of a discovery from one
management session to the next, so that you can repeat a configured discovery session at
any time.
Subnet Discovery
The Discover application is capable of searching based on a subnet address, rather than
requiring that a range of IP addresses be specified (although you can enter a range if
desired). You can also configure multiple subnets or IP address ranges to be discovered
within the same script.
Scheduled Discovery
By linking Discover scripts with the Scheduler application, you can automate the Discover
application so that it will run unattended at periodic intervals.
2-4 About NetSight Element Manager
Page 21

Overview of NetSight Element Manager
IP or Host Locator
An additional tool linked to but run separately from the Discover application allows you to
resolve host names to IP addresses, and vice versa. You can also discover the IP addresses
and host names of all devices located on a subnet, and locate both the IP and hostname for
a device by its MAC address.
Automatic Creation of the Node Database
Your discovered nodes are automatically entered into NetSight Element Manager’s
central node database, and the Discover window remains open so that you can view the list
of discovered devices. The database is also automatically saved after each discovery.
Secondary Discover and Discover Reset
The first time you run a device discover script, all IP addresses in the subnet or address
range you have specified will be queried, and all discovered devices will be listed in the
discover window and automatically added to the central node database. This is called a
NEW Discovery. The second time you run any device discover, however — even a device
script which has not yet been run —NetSight Element Manager will perform a
SECONDARY Discover, querying only those IP addresses which did not respond to the
first discover. This process allows you to use a discover script to periodically survey a
subnet, domain, or range of IP addresses for any nodes that might have been down or
simply not present during the initial discovery, without the time and bandwidth cost of
continually re-polling for nodes which have already been successfully discovered. You
can force a return to NEW Discovery mode by clicking the Reset button in the Discover
Manager window; deleting any node from the central database will also reset the device
script counters to NEW Discovery mode.
Discover Wizard
A Wizard is provided to walk you through each step of configuring and performing a
discovery.
The Discover application is covered in Chapter 3, Discovering Nodes.
Management and Monitoring Workspace
NetSight Element Manager provides four work areas that allow you to choose how to
view information about the devices in your central node database: the List View, Tree
View, Map View, and Log View. Each provides a slightly different (and
user-configurable) look at the central node database, each comes with default views to get
you started, and each provides you with the ability to create one or more views specifically
designed to display the node information you need to successfully manage your network.
The following sections highlight each of these workspaces, and provide sample
illustrations of the workspaces and the windows available from them.
About NetSight Element Manager 2-5
Page 22
Overview of NetSight Element Manager
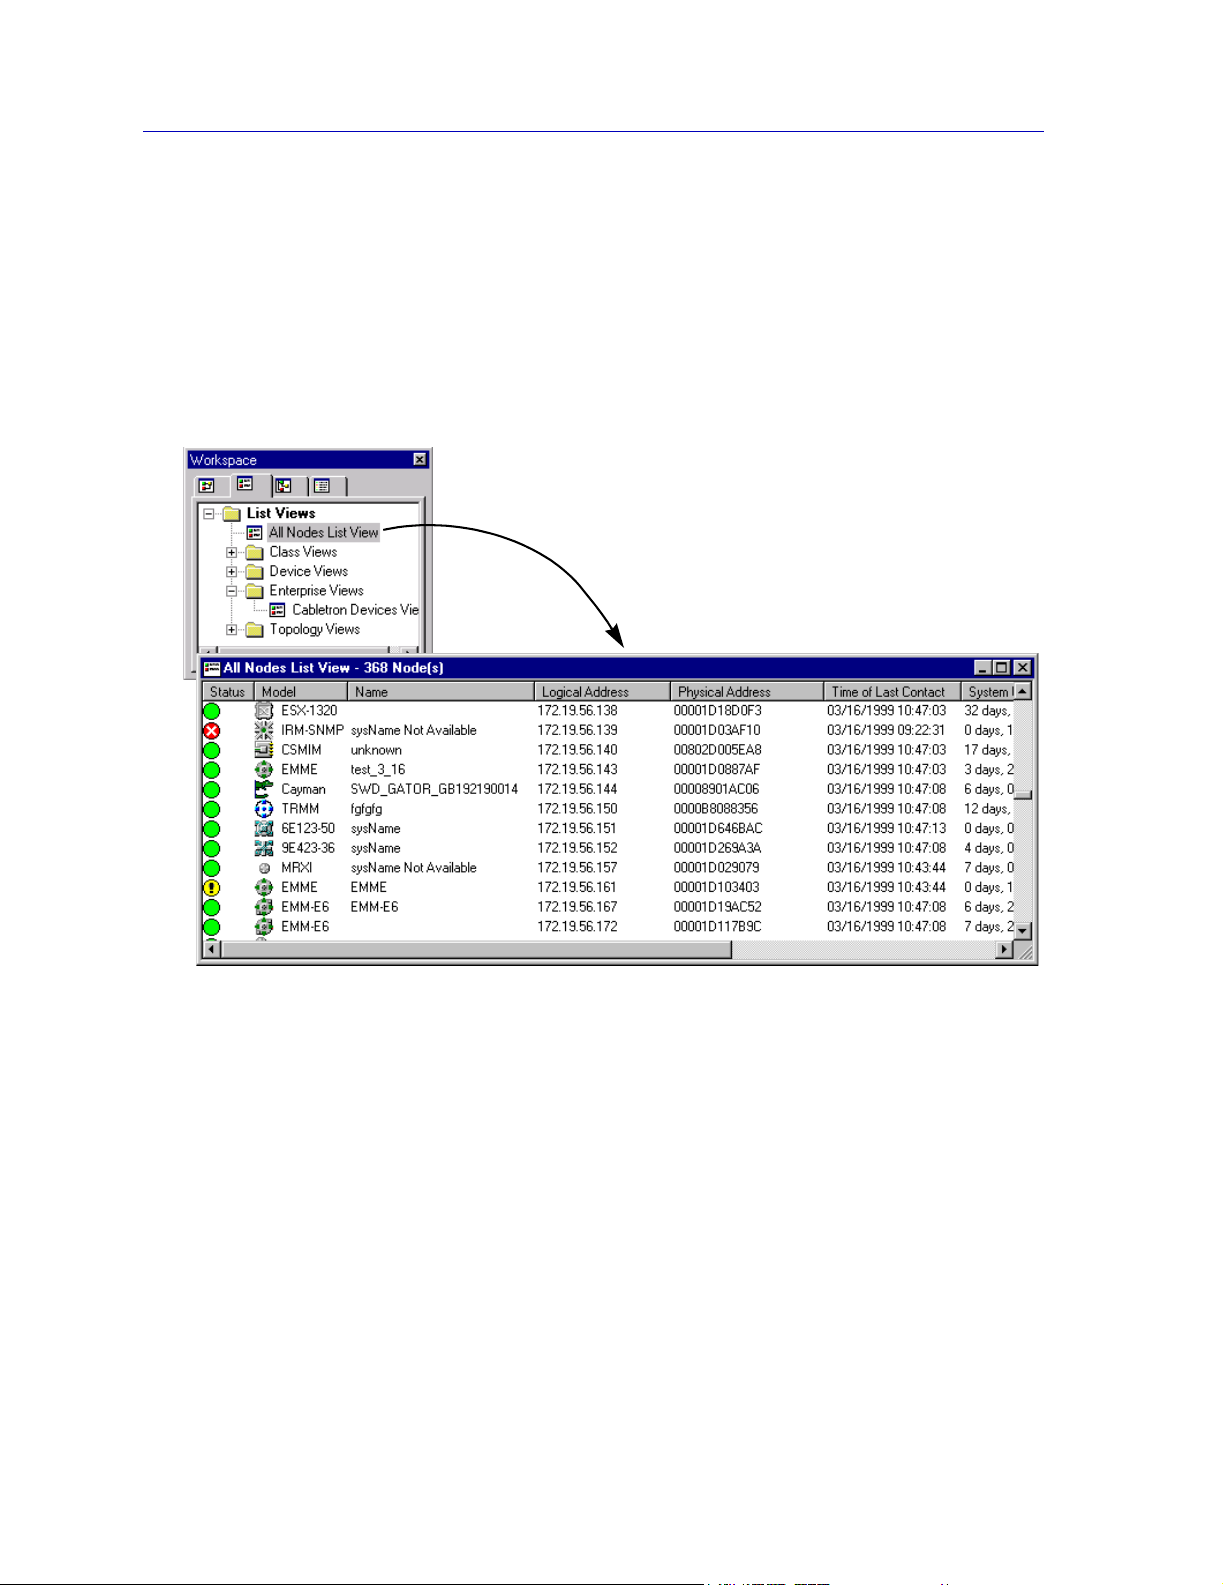
List Views
The List View workspace allows you to view and create specialized lists of the devices in
your central node database. A default set of views is provided for you; you can also create
your own views, selecting both the nodes and the information about each node you wish to
display. Figure 2-3 illustrates a sample List View workspace and an associated List View
window.
Figure 2-3. Sample List View Workspace and Window
List View features include:
Multiple List Views
You can create multiple List Views to view portions of your node database. The read-only
All Nodes List View displays every viewable node in your database, and a set of
pre-defined List Views displays various subsets of that database; you can customize this
feature by editing a pre-defined view and/or creating an entirely new one to display node
information in the way that works best for you. Each List View also provides an Excluded
Nodes feature, which allows you to remove one or more nodes from a view without
removing them from the database or changing the parameters of the view’s filter.
2-6 About NetSight Element Manager
Page 23

Overview of NetSight Element Manager
The List View Workspace
Individual List Views are represented as icons within the List View workspace; these
icons are arranged in a standard tree hierarchy (using a standard Microsoft Windows tree
view control). Double-clicking on a List View icon within the tree opens its associated
List View window.
The List View workspace also provides organizational structure to your List Views. The
tree starts at the top-level All Nodes List View, and branches into more specifically
defined List Views. You can also nest List View icons within folders to further stratify the
tree hierarchy.
Detailed Node Information
NetSight Element Manager can display the following information for each node: Status,
Model, Name, Label (descriptive alias), Logical (IP or IPX) Address, Physical (MAC)
Address, Time of Last Contact, System Up Time, Status Group (DLM – Distributed LAN
Management – information), Classes (functional class supported by the node, e.g., router,
switch, ATM, etc.), Enterprise (vendor), Topologies supported by the node (e.g., token
ring, FDDI, Ethernet, etc.), and Events (whether a trap or event concerning the node has
been detected). You can create List Views which select nodes to be displayed based on
one or more of these parameters, including subnet, enterprise, class, topology, and status
group.
Tree Views
Customizable Node Properties
Each node icon has its own Properties window, which you can use to provide additional
descriptive notes for reference, assign a label, change the community name and the
interval/retry parameters to be used for polling, and choose icons to represent the node’s
topology, model, and enterprise.
The Tree View workspace provides access to and allows you to configure a different look
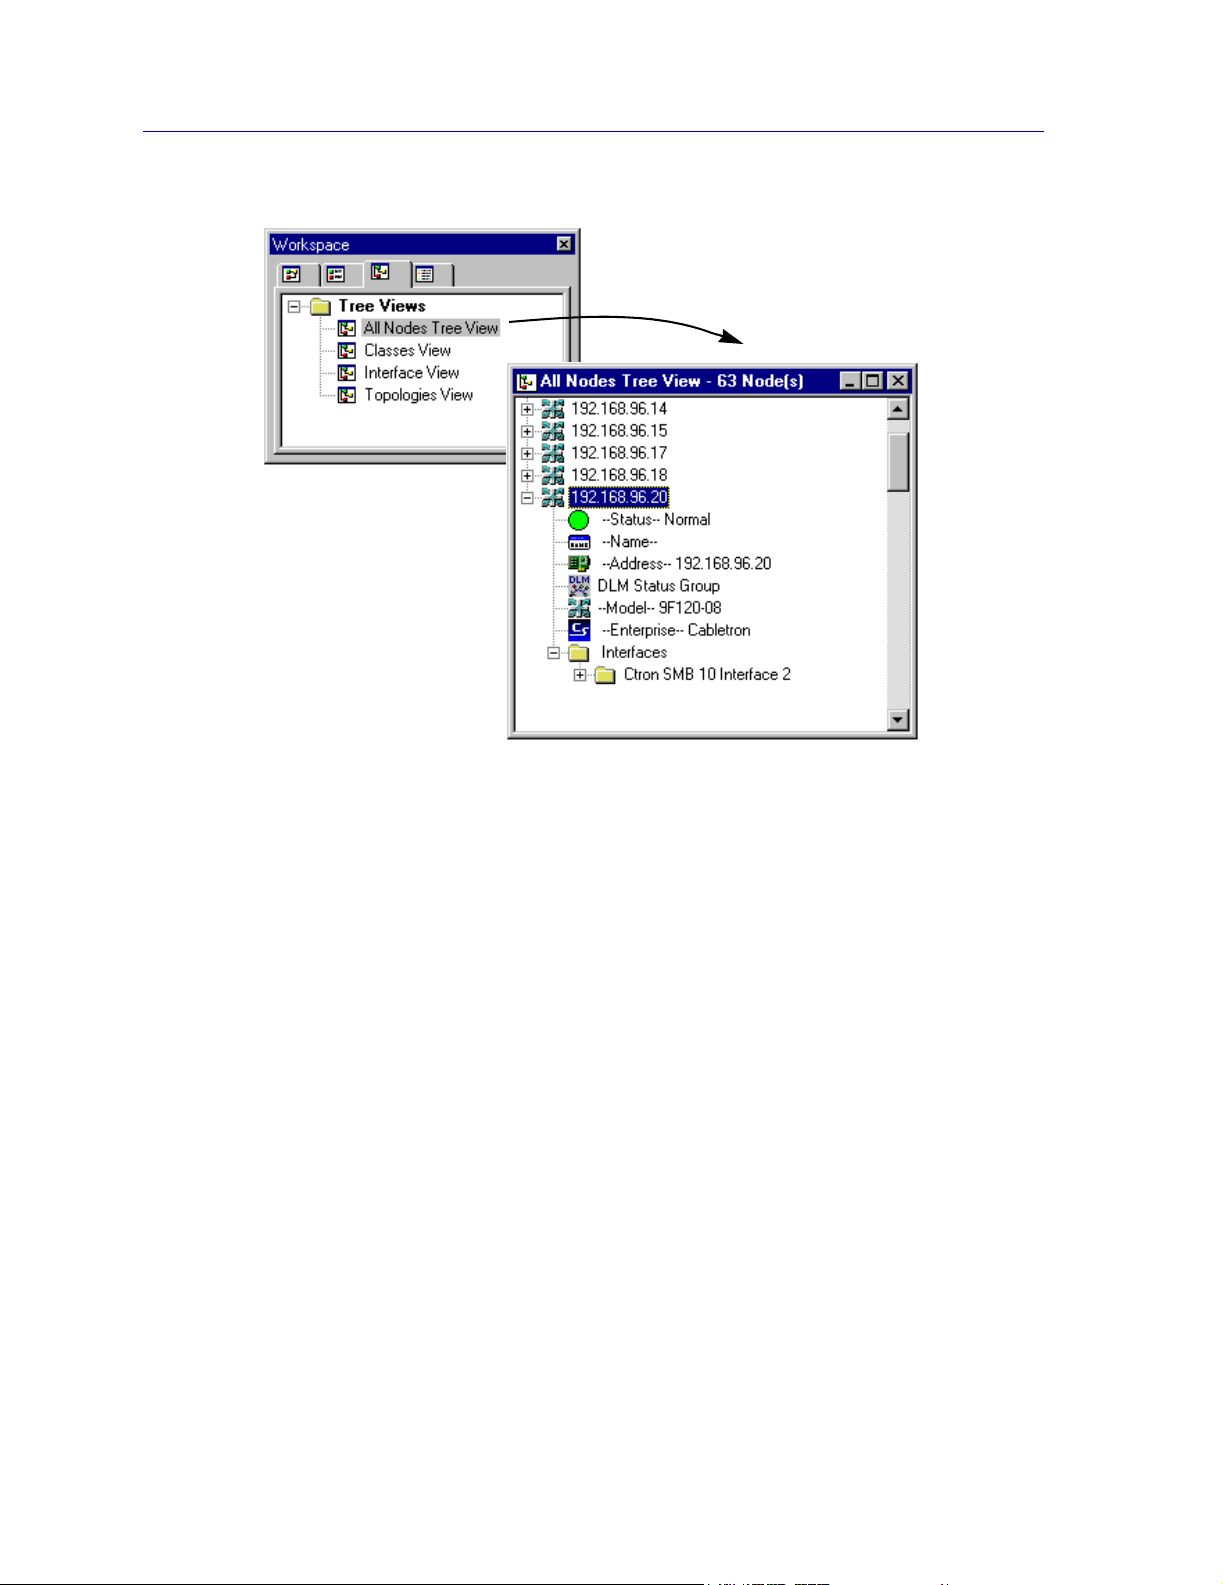
at the nodes in your database: the Tree Views. Tree Views display summary information
about nodes and their interfaces within a tree hierarchy (using a standard Microsoft
Windows tree view control). Figure 2-4 illustrates a sample Tree View workspace and an
associated Tree View window.
About NetSight Element Manager 2-7
Page 24
Overview of NetSight Element Manager
Figure 2-4. Sample Tree View Workspace and Associated Tree View Window
Each node icon in a Tree View window is presented at the top layer in the tree hierarchy.
By expanding the display of each node icon, you can view progressively more detailed
information about the node (such as polling status, name, IP address, DLM status
information, model type, and enterprise) and the interface through which NetSight
Element Manager is communicating with the node (such as interface topology, address,
index, and polling information).
You can use a Tree View window to glean basic information about each node and its
polled interface without bringing up its management window; or, by double-clicking on a
node icon, you can open the management window for the selected node.
As with the List View windows, NetSight Element Manager provides a read-only All
Nodes Tree View which displays every node in the database; a set of predefined Tree
Views (based on classes, interfaces, and topologies) is also provided. The pre-defined
views can be edited to suit your needs, or you can create entirely new views as necessary.
Also as with List Views, an Excluded Nodes feature allows you to remove one or more
nodes from a view without removing them from the database or changing the parameters
of the view’s filter.
2-8 About NetSight Element Manager
Page 25
Map Views
Overview of NetSight Element Manager
Map View windows in NetSight Element Manager provide a third — and perhaps the
most flexible — means for viewing information about your network. Using maps, you can
create a visual representation of your network: grouping devices by location rather than
function, and using a variety of graphical tools (including bitmap backgrounds and drawn
objects) to represent connections and other pertinent information about the physical
structure of your network. Maps also support Microsoft’s OLE (Object Linking and
Embedding), which can be used to link or embed data created via other applications into a
map document.
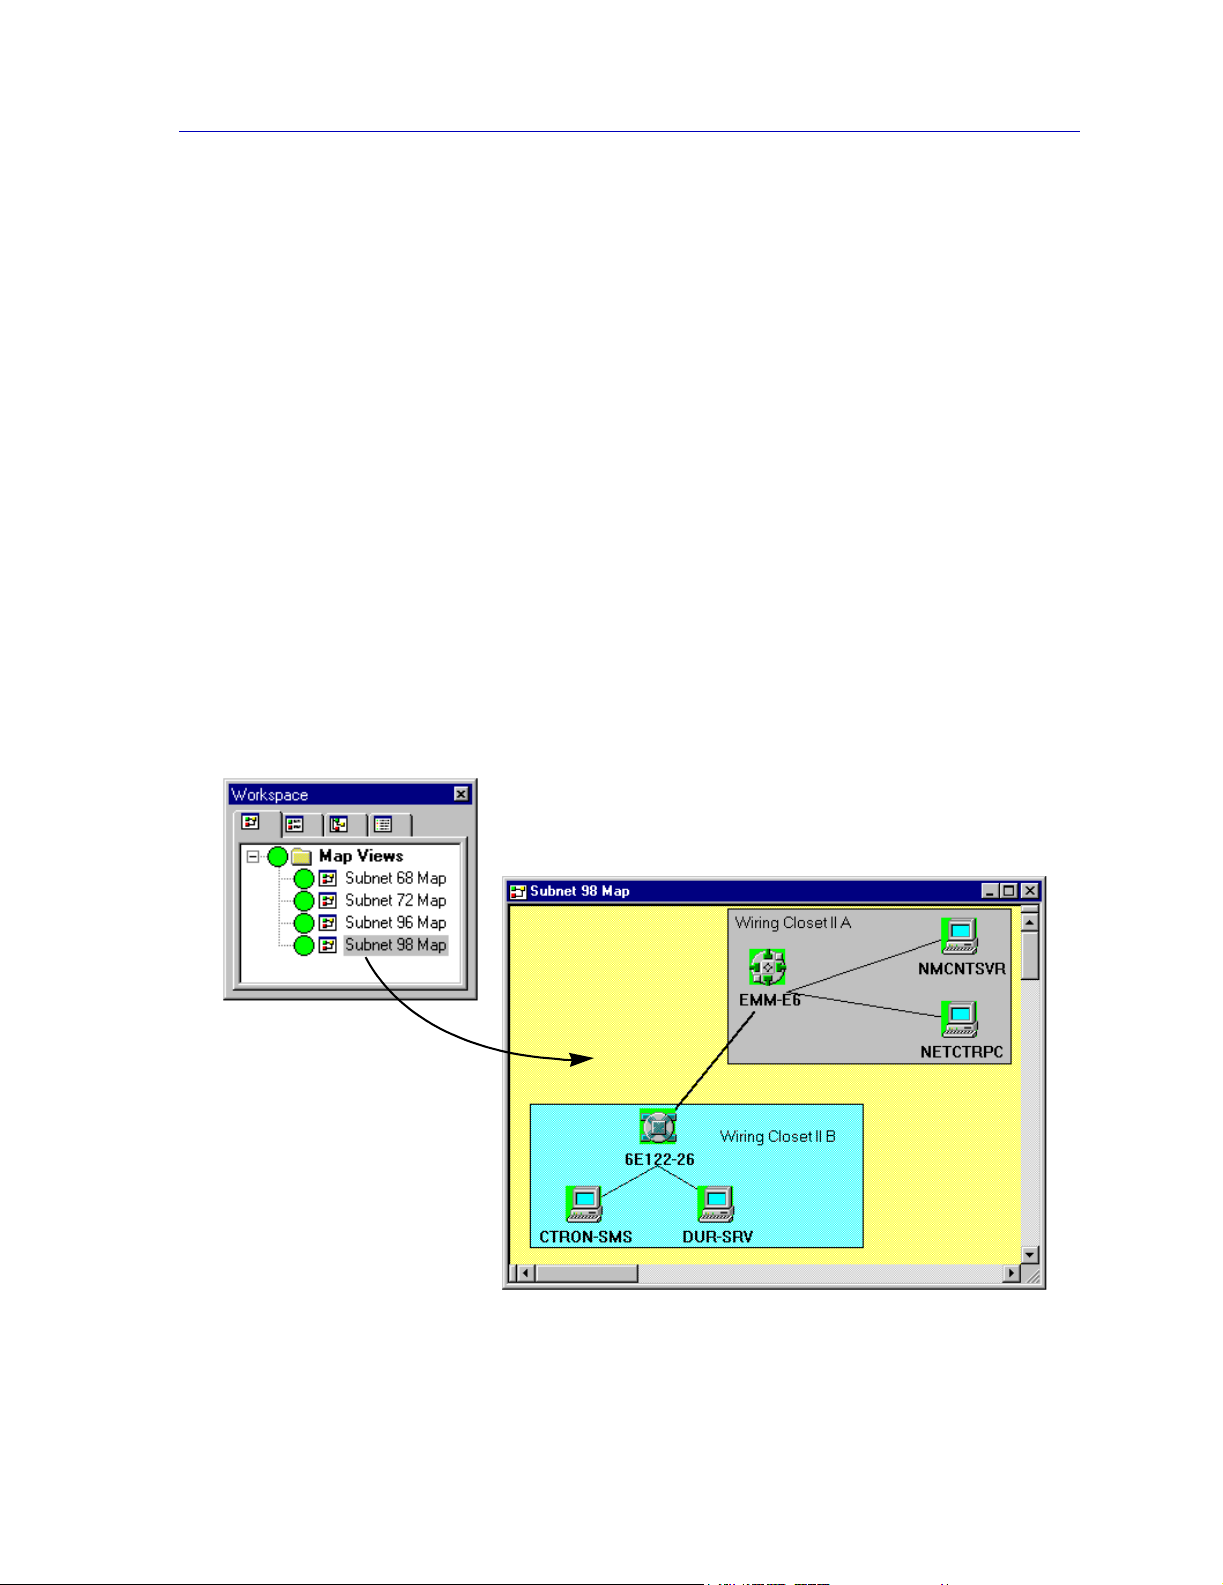
NetSight Element Manager’s map feature allows you to create a three-dimensional
representation of your network by allowing you to show not only relationships between
devices, but relationships between groups of devices. Individual Map Views can be linked
to other Map Views to create a hierarchical structure which is graphically represented in
the Map View workspace, again via the Microsoft standard tree control. The overall status
of each individual map is also displayed in the workspace; for related maps, each map’s
status includes the status of any submaps with which it is associated. These status reports
are propagated up the hierarchy, whether individual maps are closed or open — giving
you a bird’s-eye view of your network status at all times.
As with the other workspaces, you can create folders in which to nest groups of Map
icons; double-clicking on a Map icon will open the associated Map window. Figure 2-5
illustrates a sample Map View workspace and an associated Map window.
Figure 2-5. Sample Map View Workspace and Map Window
About NetSight Element Manager 2-9
Page 26
Overview of NetSight Element Manager
Log Views
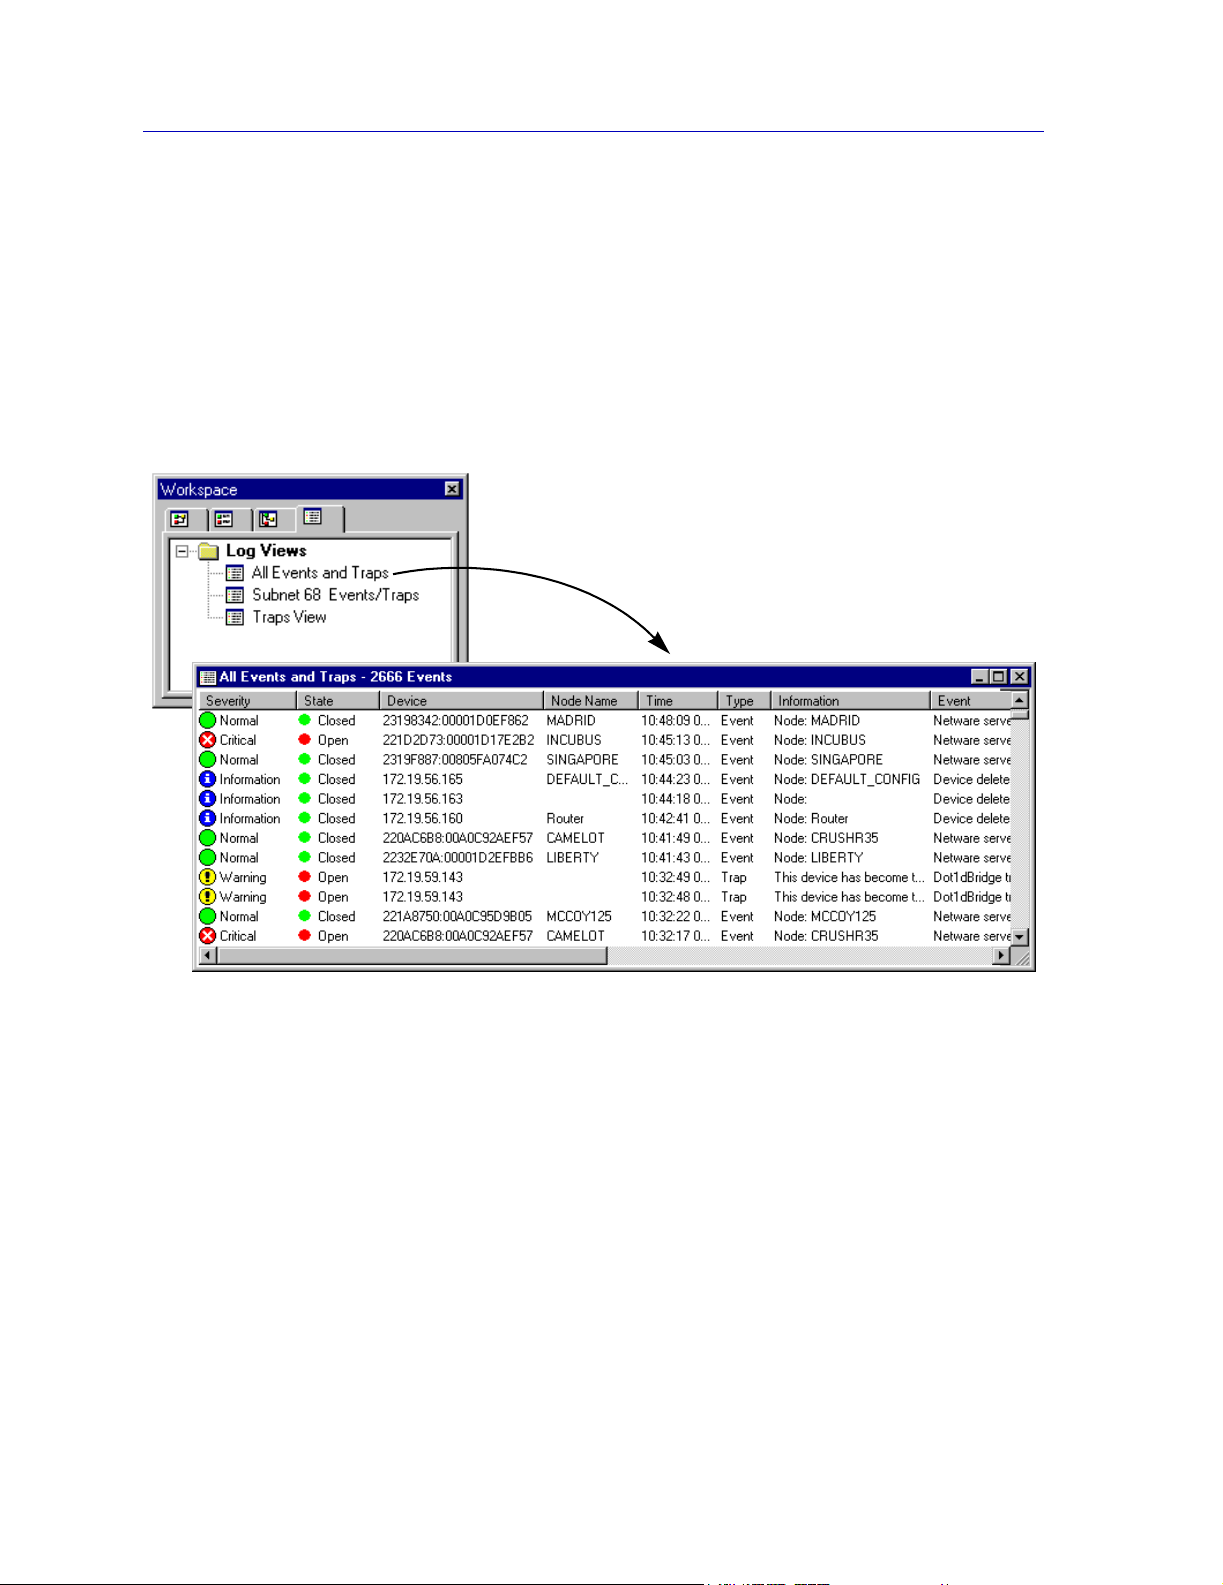
NetSight Element Manager provides a Log View workspace, which contains information
about traps and software events. Like the other workspaces, the Log View workspace —
illustrated in Figure 2-6 — allows you to create, access, and organize the Log View
windows which provide the foundation of alarm and event management. Individual Log
View windows appear as icons within the Log View tree hierarchy; you can create folders
in which to nest individual Log View icons, and double-clicking on a Log View icon will
open the associated Log View window. For more on alarm and event management, refer
to Alarm and Event Handling, page 2-11.
Figure 2-6. Sample Log Views Workspace and Associated Log View
Excluding Nodes
In addition to providing almost unlimited means for viewing the contents of the central
node database, NetSight Element Manager also provides a means for temporarily
excluding certain nodes from view — either from a specific view window, or from the
central node database itself.
When you exclude a node from a specific view, the node is placed into that view’s
individual excluded nodes list. It will no longer be visible from that view, but it remains in
the database and will be displayed in any other view as appropriate.
2-10 About NetSight Element Manager
Page 27

When you exclude a node from the central node database, that node is no longer displayed
in any view, and is moved to the Excluded Nodes database. Though these nodes can no
longer be displayed or managed, they are protected from re-discovery, and they can be
re-included in the central node database at any time. Excluded nodes can also be deleted
entirely.
The Excluded Nodes database can be viewed via the View—>Excluded Nodes menu
option available via the primary NetSight Element Manager window; for more
information on this feature, see Chapter 4, List Views.
Alarm and Event Handling
NetSight Element Manager provides powerful alarm and event handling capabilities via
the independent Alarm and Event Service. The Event User Connection Service receives
all incoming messages issued by devices configured to send traps to your workstation, as
well as system events issued by the NetSight Element Manager Network Status process or
another of its component processes (e.g., Discover or Scheduler). Because it is an
independent process, the Event User Connection Service can operate without NetSight
Element Manager running, receiving (and, where appropriate, acting on) traps issued by
your networking devices or events issued by one of NetSight Element Manager’s
component services.
Overview of NetSight Element Manager
You can create multiple Log Views to view a single trap/event database; you can also
define a separate set of View Filters for each Log View window. The Alarm and Event
handler allows you to define two types of event handling actions: foreground actions,
which you can apply interactively to a received trap or event; and background actions,
which provide unattended checking for a specified trap or event’s occurrence, and then
activate the pre-determined event handling response.
Trap and event data can be exported to HTML for report generation capability on an
internal Web server, and used in conjunction with the Pager alarm notification tool (part of
the Scheduler tool described on page 2-12).
For more information about alarm and event handling, see the Alarm and Event Handling
User’s Guide; for more information about the Scheduler application, see the Tools Guide.
The NetSight Element Manager Tool Suite
NetSight Element Manager includes a number of powerful utility applications — or tools
— which ease the task of monitoring and managing your network. Among these tools are
Remote Administration Tools, the Scheduler, and MIB Tools.
The NetSight Element Manager Tool Suite 2-11
Page 28

Overview of NetSight Element Manager
Remote Administration Tools
Remote Administration Tools is a utility suite which allows you to conveniently perform
routine management tasks on a single device — or on a group of devices — from your
remote workstation, rather than requiring local terminal access to each device. Among
these tasks are:
• Configuring TFTP and BOOTP sessions with a selected device or device group.
• Adding workstation IP addresses to the trap table(s) of a selected device or device
group.
• Searching a group of devices for the port through which a specified MAC address is
communicating.
• Performing MIB SETs, using a template of MIB objects and values, on one or more
devices.
• Performing MIB GETs, using a template of MIB objects, from one or more devices for
statistics and trend analysis.
• Performing a soft reboot on selected devices.
• Changing access community names on selected devices.
For more information about these tools, see the Remote Administration Tools User’s
Guide, included in your documentation set.
Scheduler Tool
The Scheduler tool allows you to schedule certain administrative actions so that they can
be performed while your workstation is unattended. These actions include:
• Performing discovery sessions (using scripts defined using the Discover application).
• Launching selected programs, including TFTP downloads, MIB statistics recordings,
• Backing up files (NetSight Element Manager data files, or any other files you choose).
• Setting up automated paging (by defining individuals or groups of individuals to be
For more information about the Scheduler tool, see the Tools Guide, included in your
documentation set.
and MIB loads via the Remote Administration Tools application.
paged, and specifying their availability to be paged). The paging feature is integrated
with NetSight Element Manager alarm and event handling, so that a scheduled page
can be performed as part of an interactive foreground action, or an unattended
background action.
2-12 The NetSight Element Manager Tool Suite
Page 29

MIB Tools
Overview of NetSight Element Manager
The MIB Tools suite of MIB browsing and editing tools comprises:
• The MIB Browser — a simple graphical interface you can use to contact and query
SNMP nodes on your network and examine their supported MIBs (as long as the MIBs
are imported into the MIB Tools database). MIB Browser also lets you conveniently
perform SETs on contacted devices.
• MIB Details — a display of the descriptive information for management objects that
you query from a node.
• The MIB Editor, which lets you manipulate your database of network vendor’s MIBs.
An extensive MIB database is provided with MIB Tools; you can input new MIBs
(stored in ASCII text format) into this database, or you can delete any unnecessary
MIBs (or MIB portions) so that the database maintains the precise MIB information
that you need to manage your nodes.
•The Device Manager, which allows you to maintain a database of node IP addresses
that you frequently contact, and displays summary information about these nodes.
•A Preferences option, which lets you view and change configuration settings for the
MIB Tools suite.
Customizing NetSight Element Manager
There are a number of ways you can adjust NetSight Element Manager’s settings to
customize its operation in the way that works best in your management environment.
These are detailed in the following sections.
You can also do some batch customization outside of the NetSight Element Manager
TIP
Adjusting Default Settings
platform; see Appendix A, Batch Customization via AddTool, AddImage, and
AddDevType, for more information.
The Options window controls the default settings for NetSight Element Manager and
some of its components. These settings control the operation of many basic features and
functions in NetSight Element Manager, and they are referenced throughout the document
set. You may want to adjust these settings so that they better suit your specific network
management needs.
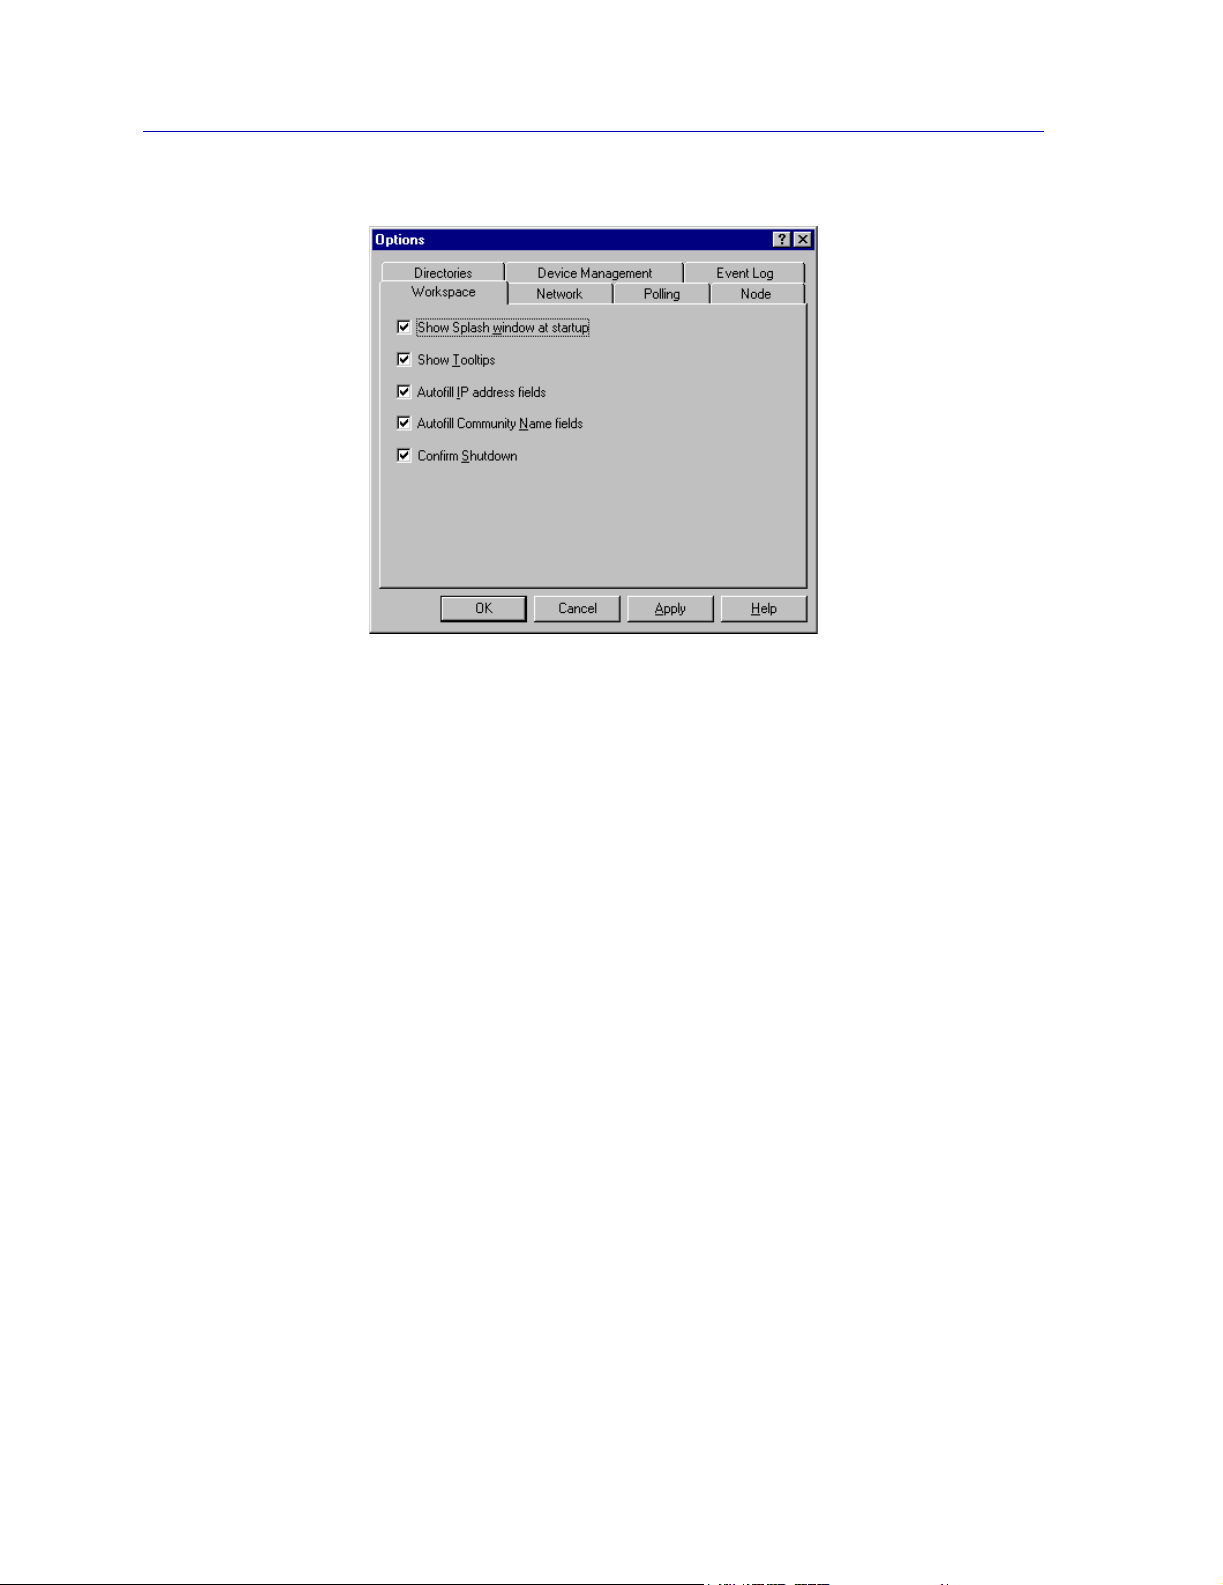
The Options window — accessed by selecting Tools—>Options from the primary
window menu bar — has seven tabbed pages, each of which controls a set of related
functions in NetSight Element Manager. Each tabbed page and the options it controls is
discussed in the following sections.
Customizing NetSight Element Manager 2-13
Page 30
Overview of NetSight Element Manager
Figure 2-7. The Options Window (with Workspace Options Selected)
Workspace Options
The Workspace options (displayed by default, as illustrated in Figure 2-7) control various
settings for the NetSight Element Manager interface. You select or deselect each option by
clicking the associated checkbox. A checked box indicates that the associated option is
selected; a blank box indicates that option is deselected.
Show Splash window at startup
The Splash window is an identifying screen that will briefly appear when you initialize
NetSight Element Manager. Selecting this option will cause the screen to be displayed;
deselecting it will suppress the screen.
Show Tooltips
Tooltips are small pop-up windows that provide user assistance by identifying controls
such as toolbar buttons. Selecting Show Tooltips will cause these to be displayed when
the mouse cursor is dragged over a toolbar icon; deselecting the option will suppress them.
You may want to leave this option selected until you are comfortable visually identifying
all the toolbar options by their icons.
Autofill IP address fields
When this option is selected, the dotted decimal IP address octets set via the Network
options (or via the Welcome Wizard) will be automatically entered in any field that
requires an IP address.
2-14 Customizing NetSight Element Manager
Page 31

Network Options
Overview of NetSight Element Manager
Autofill Community Name fields
When this option is selected, the community name text set via the Network options (or via
the Welcome Wizard) will be automatically entered in any field that requires a community
name.
Confirm Shutdown
By default, when you shut down NetSight Element Manager (via the File—>Exit menu
option, the Exit toolbar icon, or the Close button in the main application window), a
message window opens asking you to confirm your action with a Ye s (exit) or No (remain
open). Deselecting this option will cause the confirmation window to be suppressed and
the application will immediately shut down; leaving it selected will cause the confirmation
window to be displayed.
The Network options (Figure 2-8) allow you to set the default Community Name, IP
Address prefix, and Address Mask that will be used when you attempt to add entries into
the node database (either manually or through a discovery).
TIP
TIP
When you initialize NetSight Element Manager for the first time, a Welcome Wizard will
guide you through setting up the product. The information entered through the Welcome
Wizard appears (and can be edited) here.
Community Name
The Community Name is a basic security mechanism implemented in SNMP. It acts as
both a local and remote password for IP devices, and provides different levels of access
(i.e., read only, read-write, and super user) to the device’s information. Community names
and their level of access must be configured at each device. Generally, the default
community names for a device are set at “public” for all levels of access.
If you have adequate privileges, there are several ways you can edit a device’s community
name: via Local Management, as described in your local management documentation; via
any MIB utility — like NetSight Element Manager’s MIB Tools suite — that allows you to
perform SNMP GETs and SETs; or via the Community Names component of the Remote
Administration Tools.
Customizing NetSight Element Manager 2-15
Page 32

Overview of NetSight Element Manager
Figure 2-8. The Network Options
NOTE
NetSight Element Manager uses the Community Name to gain access to devices that you
want to manage. You specify the community name you want to use to access a device
when the device is inserted (as documented in Chapter 4, List Views) or discovered (as
documented in Chapter 3, Discovering Nodes). You can also change the community
name NetSight Element Manager uses to communicate with a device via the Device
Properties windows (also documented in Chapter 4, List Views). For full device
management, you should select a community name which provides super user access.
The community name set in the Network Options window serves as the default value
entered in any field which requires a community name; however, you can always enter a
specific community name on a case-by-case basis in any of the windows that require one.
To check whether a device is active on the network — and consequently to turn the device
icon green on Map Views, List Views, and Tree Views — NetSight Element Manager
issues polls for device interface information. This type of poll does not require community
name access to the device, since it is merely a check of network health. If you cannot
access a device’s management windows — even though its icon appears green on the map
— check that the community name you are using to access the device still has valid read,
read/write, or super user access.
To set the default community name:
1. Click in the Community Name text field, and type in a community name
which will be used as NetSight Element Manager’s default value.
See your local management documentation or the Remote Administration Tools User’s
Guide included with your documentation for more information on community names.
2-16 Customizing NetSight Element Manager
Page 33

Overview of NetSight Element Manager
IP Address Autofill
As with community names, an IP address is required to add devices to, or modify existing
devices in, the central node database. (The Insert Device and Device Discover Properties
windows both have an IP address entry field.) The IP Address Autofill option allows you
to specify the network or subnet identifying octets (in dotted decimal IP format) you wish
to be entered by default in any required IP Address field (again, you can change the IP
address on a case-by-case basis).
To set the default IP Address Autofill prefix:
1. Click in the IP Address text field, and type in the network or subnet identifying
octets (in dotted decimal IP format) which you wish to use as a prefix.
Address Mask
An address mask is used to determine whether a given destination IP address (in this case,
that of managed devices) exists on the same network or subnetwork as a given source IP
address (in this case, that of yourNetSight Element Manager workstation). The Address
Mask field lets you set a default value which will be used when NetSight Element
Manager polls for IP devices during a Network Discovery.
The appropriate address mask depends upon your network configuration. If your network
contains subnets, entering the appropriate subnet mask in this field will identify the
network, subnet, and host portions of the IP addresses in the address range. For example,
on a Class B network containing an IP address of 132.177.118.24, a subnet mask of
255.255.255.0 would identify the first two octets (132.177) as the network portion of the
address, the third octet (118) as the subnet portion, and the final octet (24) as the host
portion.
Polling Options
If your network does not contain subnets, entering the appropriate network mask in this
field will identify the network portion of the IP addresses in the address range. For
example, on a Class B network containing an IP address of 132.177.118.24, a network
mask of 255.255.0.0 would identify the first two octets (132.177) as the network portion
of the address.
To set the default Address Mask:
1. Click in the Address Mask text field, and type in the network or subnet
identifying octets which you wish to use as the mask.
The Polling options (Figure 2-9) let you configure how NetSight Element Manager
contacts nodes in your database (and consequently how often their contact status is
refreshed in List View, Tree View, or Map View windows).
Customizing NetSight Element Manager 2-17
Page 34

Overview of NetSight Element Manager
Figure 2-9. The Polling Options
NOTE
Node Polling
Node polling establishes how often the contact status between NetSight Element Manager
and the IP devices in your node database will be refreshed. You configure node polling by
setting the interval for a polling cycle and the number of nodes that will be polled during
that interval. In essence, you use the node polling options to limit the amount of network
traffic that NetSight Element Manager generates as it polls devices for their status.
The above figure shows the defaults for NetSight Element Manager: a 5-second polling
cycle with 10 poll packets issued within that cycle. With a database of 100 managed
nodes, this means that it will take 50 seconds to poll the entire node database and fully
refresh the contact status of nodes in the List Views, Tree Views, and Map Views — since
there will be 10 iterations of the 5-second polling cycle to determine the contact status
with all 100 nodes.
The status of polled nodes is maintained as is between polling cycles. If a node goes down
during a polling cycle, its icon will remain Green/Up until NetSight Element Manager
re-polls it and determines the loss of contact. For an immediate update of a specific
node’s status, highlight the device, then select Manage—>Query Status from the primary
window menu bar, or Query Status from the right mouse menu.
You can configure polling for an individual node so that it is polled less frequently than
the refresh time required to poll the entire node database. For example, if one of your 100
managed IP nodes was at the far end of a T1 link, and you would like that node to be
polled hourly (rather than at the refresh rate established via Node polling), you could set
an individual poll rate for that device to be 3600 seconds (via the Device Properties
2-18 Customizing NetSight Element Manager
Page 35

TIP
Overview of NetSight Element Manager
window, as described in Configuring Node Interface Poll Settings in Chapter 4). This
would override the polling refresh rate of the database (once per 50 seconds), by instead
having NetSight Element Manager issue a once-hourly poll to that individual node.
However, you cannot configure polling so that contact status with an individual node is
refreshed more frequently than the refresh rate established by the Node database polling
settings. Even if you configured one of your 100 managed nodes to be polled every 10
seconds for contact status, it would still be subject to the refresh rate of the entire node
database. In actuality, its contact status would only be updated once during the 50 seconds
it takes to fully poll the node database.
If you have a mission-critical node, you can keep Chassis Manager running to be
constantly appraised of its contact status. Because the Chassis Manager application uses
its own polling mechanism (independent of the node database polling in NetSight Element
Manager), you can determine the status of the node by using the Contact Status symbol in
Chassis Manager’s Logical View window. Refer to your individual device-specific User’s
Guides for more information on using Chassis Manager; refer to the Device
Management Options section, following, for more information on setting the Chassis
Manager poll settings. You can also issue an immediate status poll at any time via the
Query Status options described above.
TIP
Use the following fields to establish the refresh rate of polling for all nodes in your node
database:
Interval (sec)
The amount of time that elapses between groups of poll packets. The number of intervals
required to complete a poll cycle will depend on how many devices are in your node
database, and how many are being polled during each interval.
To set the Interval value:
1. Click in the Interval text field, and type in the number of seconds you want
NetSight Element Manager to wait between each set of polling packets. The
range is from 1 to 60 seconds; the default is 5 seconds.
Packets
The number of poll packets that will be sent to devices eligible for polling during each
polling interval.
To set the Packets (number of polled devices) value:
1. Click in the Packets text field, and type in the number of IP devices you want
polled during each poll Interval. The range is from 1 to 25.
To determine the amount of time it will take NetSight Element Manager to complete one
poll of all nodes in your database, divide the number of nodes in your database by the
Packets value and multiply by the Interval (sec) value.
Customizing NetSight Element Manager 2-19
Page 36

Overview of NetSight Element Manager
Node Options
The Node options (shown in Figure 2-10) let you configure the default contact poll
settings that will be established when IP devices are added to the node database.
Default Poll Settings
Unlike the poll settings configured via the Polling Options tabbed page, the Node Options
default poll settings determine the default poll values that will be assigned to each
individual node via its Properties window. In most instances, these default poll settings
will have no bearing on how often the node is actually polled, since the Node Polling
settings determine the amount of time it takes NetSight Element Manager to poll every
device in the database.
Figure 2-10. The Node Options
In general, it is advisable to leave the Default Poll Settings at their initial values; if you
have a few specific devices you’d like to poll less frequently than the configured Polling
Options values would achieve, use the individual nodes’ Properties windows to edit these
default settings.
The Default Poll Settings let you configure the following:
Interval (sec)
The default number of seconds configured for polling an individual IP device. Note that in
general, the polling settings for updating the status of individual IP devices will be
overridden by the Node options configured in the Polling page. The interval set in this
field will only take precedence if it is longer than the duration required to poll the entire
node database (as configured via the Polling Options page).
2-20 Customizing NetSight Element Manager
Page 37

Overview of NetSight Element Manager
To change the interval (if desired):
1. Click in the Interval (sec) text field, and type in the poll interval to be used as
a default when adding new devices. The range is from 5 to 9,999 seconds.
Retries
If individual device polling is in effect, this will determine the default number of times
after a failed poll that NetSight Element Manager will re-poll a device before declaring it
in a Critical (contact unavailable) state. To change the default Retries setting:
1. Click in the Retries text field, and type in the number of polls which will be
issued to an individual device before declaring a contact unavailable status.
The range is from 0 to 100 retries; the default is 3 retries.
Timeout (sec)
This field determines the default duration between retry polls to an individual device. To
change the Timeout value:
1. Click in the Timeout (sec) text field, and type in the duration (in seconds)
between re-polls after the initial poll failure. The range is from 1 to 90
seconds; the default is 4 seconds.
NOTE
Directories Options
This Timeout value can only be configured here, for all nodes; individual Node Properties
windows do not provide the option of setting this value.
The Directories page lists the default locations used by NetSight Element Manager and its
components to store and retrieve files. It also allows you to change the default Map and
Export directories.
Customizing NetSight Element Manager 2-21
Page 38

Overview of NetSight Element Manager
Figure 2-11. The Directories Options
TIP
Map files
This field specifies the default directory that is used when you save a map. You can either
override the default value in the Save Map window as each new map is saved, or you can
set a new default location here. Refer to Chapter 6, Creating Network Maps, for more
information on creating and saving maps. The default directory is \NetSight Element
Manager x.x\Maps.
To specify the default Map directory:
1. In the Map files text field, type in the full directory path for the directory in
which you want to save map files by default. Be sure the directory already
exists, or the change will not be accepted.
or
Click Browse. A standard Microsoft Browse window opens. Use the directory
tree to select the directory (folder) which you would like to use as the default.
If you change the default map location, map files stored there will still be automatically
backed up with the Data File Manager; however, if you also have map files in the original
directory (or in any other directory), those will not be automatically backed up. If you
store map files in more than one directory, be sure to back them up manually.
Data files
This read-only field indicates the directory where NetSight Element Manager stores its
workspace configuration information (including information about the nodes in the List
Views and Tree Views). The default directory is \NetSight Element Manager x.x\Data.
2-22 Customizing NetSight Element Manager
Page 39

TIP
Overview of NetSight Element Manager
Log files
This read-only field indicates the directory used to store log files generated by NetSight
Element Manager’s processes or applications (e.g., the alarm and event handling service).
The default directory is \NetSight Element Manager x.x\Log.
Executable files
This read-only field indicates the directory whereNetSight Element Manager stores its
executable files and dynamic link libraries (DLLs). The default directory is \NetSight
Element Manager x.x\Bin.
Exported files
This field displays the default directory to be used in any export action taken from within
NetSight Element Manager or one of its component applications (like RMON), regardless
of the export file type (*.csv, *.txt, *.htm, etc.). The default directory is \NetSight Element
Manager x.x\Export.
If you change the default export file location, files stored there will still be automatically
backed up with the Data File Manager; however, if you also have exported files in the
original directory (or in any other directory), those will not be automatically backed up. If
you store exported data files in more than one directory, be sure to back them up
manually.
Device Management Options
The Device Management options (Figure 2-12) let you configure the poll settings to be
used by the Chassis Manager and SmartSwitch/Matrix chassis management applications.
Figure 2-12. The Device Management Options Window
Customizing NetSight Element Manager 2-23
Page 40

Overview of NetSight Element Manager
Chassis Manager Settings
The Chassis Manager settings let you establish how the Chassis Manager and
SmartSwitch/Matrix Chassis View applications poll a monitored device. There are two
settings which you can configure:
Poll Rate
The interval, in seconds, at which the Chassis Manager or SmartSwitch/Matrix Chassis
View will poll a device to check whether it is alive on the network (i.e., has a green
contact status).
To change the poll rate:
1. Click in the Poll Rate text field, and type in the interval to be used when
Chassis Manager polls a device for its contact status. The range is from 5 to
9999 seconds; the default is 30 seconds.
Retries
The Retries field determines the number of polls that the Chassis Manager or
SmartSwitch/Matrix Chassis View will issue to a device after the first failed poll before
declaring a lost contact state. To change the Retries setting:
TIP
Event Log Options
1. Click in the Retries text field, and type in the number of polls which must fail
(after the initial poll failure) before Chassis Manager declares that contact is
unavailable. The range is from 0 to 10 retries; the default is 2 retries.
You can also edit the ctron.ini file (located in the /windows directory for Windows 2000,
or in the /winnt directory for Windows NT) to specify the interval between retry polls from
Chassis Manager or the SmartSwitch Chassis View. Alter the
BackgroundTrysInterval=X line, where X is the number of seconds between retry polls.
The default setting is 15 seconds.
The Event Log options (Figure 2-13) allow you to set the size of the alarm and event
service’s event cache (which stores trap and event information). The event cache is a
memory-mapped data file that is activated when NetSight Element Manager’s alarm and
event service initializes. All traps and events that are received are uniquely identified and
stored in this file. The file is a wrap-around buffer which overwrites the earliest entries
with each new incoming trap or event. Refer to your Alarm and Event Handling User’s
Guide, included in your documentation set, for more information about the event cache
and other aspects of alarm and event handling.
2-24 Customizing NetSight Element Manager
Page 41

Overview of NetSight Element Manager
Figure 2-13. The Event Log Options Window
You can establish an hourly purge of the event cache file by specifying that traps or events
which meet certain conditions be deleted. These conditions are defined by three Event Log
options you select or de-select by clicking in the associated checkbox. The fourth option
— Set log size — allows you to control the overall size of the cache.
Clear deleted events hourly
Checking this option will activate an hourly purge of all events marked as deleted. If this
option is deselected, events marked as deleted will simply be overwritten as the cache
wraps at their position.
Clear acknowledged and closed events hourly
Checking this option will activate an hourly purge of all events that have been
administratively acknowledged or closed during the previous hour. If this option is
deselected, no such purge will take place, and acknowledged and closed events will
simply be overwritten in the normal course of the event cache wrap.
Clear normal and informational events hourly
Checking this option will activate an hourly purge of all events received during the
previous hour that have a severity level of Normal or Informational. If this option is
deselected, no such purge will take place, and normal and informational events will
simply be overwritten in the normal course of the event cache wrap.
Set log size
This option will allow you to change the size of the event cache from between 1000 and
10000 entries; the default size of the cache is 3000 entries.
Customizing NetSight Element Manager 2-25
Page 42

Overview of NetSight Element Manager
To set the options in the Event Log Options window:
1. To activate the Clear deleted events, Clear acknowledged and closed
events, or Clear normal and informational events options, click to check
the appropriate selection.
2. To set a new event cache size:
a. Click to check the Set log size option. Note that if this option is not
selected, the cache size text field will not be editable.
b. Click in the associated text field and type in the desired cache size. The
range is 1000–10000 entries.
3. Click Apply to set your selection and remain in the Options window, or OK to
set the selection and exit the Options window.
Once you apply any change, the appropriate changes are immediately made to the event
cache (e.g., all normal and informational events will be deleted), and from that point the
cache will be updated hourly as configured. Note that each time you make and set a
change in the Event Log Options window, you will restart the hourly purge cycle based on
the time of configuration.
Customizing the Toolbar
NetSight Element Manager provides access to a number of tool applications via its Tools
menu and accompanying Tools toolbar. You can customize this access by adding items to
or removing items from both the menu and toolbar, or editing their tool tip, hint text,
and/or icon image. This process is described below.
You can also do some batch customization of the Tools menu and toolbar outside of the
TIP
NetSight Element Managerplatform; see Appendix A, Batch Customization via AddTool,
AddImage, and AddDevType, for more information.
To access the customize window:
1. Select Tools—>Customize from the primary window menu bar. The
Customize window, Figure 2-14, opens.
2-26 Customizing NetSight Element Manager
Page 43

Overview of NetSight Element Manager
TIP
Adding a Tool Entry
Figure 2-14. The Customize Window
The top portion of the window allows you to define the menu pick, hint, and tool tip text
that will label your new selection, as well as the graphic image that will be used as its tool
bar icon. The lower portion of the window allows you to assign the appropriate executable
and any necessary arguments; it also allows you to define certain launch parameters. You
can use these same fields to edit any existing entry in the toolbar or menu.
Information about the configuration of the Tools menu and toolbar is stored in the
Tools.dat file (\NetSight Element Manager x.x\data); to preserve your customization, be
sure to back up this file. See Backing Up Data Files, beginning on page 2-30, for more
information.
When you add an entry to the Tools menu, you must also add a corresponding icon to the
Tools toolbar, and vice versa. To do so:
1. Click on the Add button in the upper-right corner of the window. A new menu
item with default text (&New Menu Item) will be added to the Menu Items list
box, with an edit box around it.
Customizing NetSight Element Manager 2-27
Page 44

Overview of NetSight Element Manager
2. In the edit box provided, enter the text you want to appear in the Tools menu
for the new entry. Place an ampersand (&) before the character you’d like to
use for the access key.
If you select an access key that is already in use, a message window will note this when
NOTE
you try to enter your new item name. If you choose to configure an access key, it must be
unique or the new Tools item cannot be added.
3. In the Hint text field, enter the text you want displayed in the status bar at the
bottom left of the primary NetSight Element Manager window when the menu
item is selected or the cursor is positioned over its associated toolbar icon.
This information is optional; you can also leave the field blank.
4. In the Tool Tip text field, enter the text you want displayed in the tooltip
pop-up when the cursor is positioned over the associated toolbar icon. This
field is also optional, and can be left blank.
5. To select an image to use for the toolbar icon, click on Select to launch the
Select Image window, Figure 2-15. Once there:
TIP
If the executable you have selected already has an icon associated with it, that icon will be
displayed by default; you can use the icon image provided, or change this default via the
following steps.
a. Click Browse and in the resulting File Open window, select the bitmap file
you wish to use as a basis for the toolbar icon, then click Open. The
selected bitmap image will be displayed in the Images: display area in the
window. (If the image is too big in either dimension to be fully displayed, a
message window opens, indicating that the image will be cropped to fit.)
b. Click the Small Image radio button, then move the resulting square
selection cursor around on the image to select the portion you wish to
display for the toolbar icon, and click again to make the selection. The
image portion you have selected will be displayed below the Small Image
radio button. Move the cursor and click again to change this selection until
you find the one you want.
c. If you wish, click the Large Image radio button, then move the resulting
square selection cursor around to select the image portion you wish to
display for a large icon, and click again to make the selection. The image
portion you have selected will be displayed below the Large Image radio
button. Move the cursor and click again to change this selection until you
find the one you want. This image isn’t displayed anywhere except in this
window, but you may want to go ahead a select one for consistency. If
you don’t select one, the default image will remain in place.
2-28 Customizing NetSight Element Manager
Page 45

Overview of NetSight Element Manager
Figure 2-15. Select Image Window
d. Click OK to save your image selection(s) and return to the Customize
window.
TIP
6. Use the Browse button to the right of the Command field to locate the
executable you wish to launch with your new Tools menu selection. The
executable path and file name cannot be entered directly into the Command
field; you must select it via the Browse window.
7. Use the Arguments field to add any arguments that can be accepted by your
chosen executable and that you want added by default each time the icon or
menu pick is selected.
Clicking on the Build button will launch a Build window that may help you construct the
appropriate argument string; for more details on how to use this window, see Building an
Argument List in Chapter 4, List Views.
Note that if you select an argument symbol that will extract information from the NetSight
Element Manager database (for example, %i to insert an IP address, or %c to insert a
community name), the menu item and tool bar icon for your application will only become
available when a device is selected in a List, Tree, or Map View — this will guarantee that
the appropriate argument information can be obtained.
If you select a specific value for a build argument, or if you do not specify any build
arguments, your Tools menu item and its accompanying icon will always be available.
8. If you wish, you may also specify a Working Directory for your tool. Use the
Browse button to the right of the Working Directory field to locate the
appropriate directory. The directory name cannot be entered directly into the
field; you must select it via the Browse window.
Customizing NetSight Element Manager 2-29
Page 46

Overview of NetSight Element Manager
9. In the Show field, use the drop-down list to select the default display mode for
your tool application: Normally, Hidden, Minimized, or Maximized.
10. Click to select the Launch at Start-up option if you want this tool launched
automatically with NetSight Element Manager.
11. Click OK to add your new option.
Editing a Tool Entry
You can also edit any of the configured values for a Tool entry (either one you have
added, or one of the default entries provided); to do so:
1. Open the Customize window by selecting Tools—>Customize from the
primary NetSight Element Manager window.
2. In the Menu Items list box, click to select the item you wish to edit. The
remaining window fields will fill with the values set for the selected item.
3. Edit the existing values as desired; see the previous section for details.
4. Click OK to save your changes and exit the Customize window.
Removing a Tool Entry
You can also delete any existing Tool entry, as follows:
1. Open the Customize window by selecting Tools—>Customize from the
primary NetSight Element Manager window.
2. In the Menu Items list box, click to select the item you wish to remove, then
click on Delete. The selected item and its associated parameters will be
removed from the window.
3. Click OK to save your changes and exit the Customize window.
Backing Up Data Files
We strongly recommend that you back up your NetSight Element Manager files on a
regular basis. The Scheduler will do that automatically (see the Scheduler chapter in the
Tools Guide for more information). This section describes how you can also perform this
function manually, with the Data File Manager.
The Data File Manager is preset to backup specified files and file types in five directories
located in the \NetSight Element Manager x.x directory: \Data, \Bin, \Filters (and its
automatically-created subdirectories), \Maps (or your configured Maps directory), and
\Export (or your configured Exported Files directory). An editable configuration file
determines the specific files and file types that will be backed up; you can edit this file to
add additional files or file types, but they must reside in one of the five directories
specified above.
2-30 Backing Up Data Files
Page 47

TIP
Overview of NetSight Element Manager
If you change the default Maps and/or Exported Files directory (via the Directories
Options available in the Tools—>Options window), the Data File Manager will
automatically back up any specified files that reside in the new default directories. Any
files that reside in the original default directories, however, will no longer be backed up.
The following files and file types are included in the Backup Configuration file by default;
they will be backed up and maintained in your backup directory as long as they reside in
one of the defined backup directories.
• rmflt.mdb and rmflt.ldb — These database files maintain RMON packet capture
filter definitions.
• *.csv, *.htm, *.mrf, and *.txt — Files which contain exported data
• *.map — .MAP map files (viewable format)
• *.mmp — SmartSwitch 9000 Chassis Configuration files (from SPECTRUM Element
Manager version 2.0)
• *.dmf — SmartSwitch and Matrix Chassis Configuration files
• *.mrm — .MRM map files (import format)
• *.filter — Files with information for viewing filters for log view events
• *.action — Files containing definitions for configured foreground actions — actions
that must be manually initiated in response to an event
• *.backgroundaction — Files containing definitions for configured background
actions — actions that are executed automatically in response to specific events
• ae_log.mdb — Alarm and Events log database
• Classes.dat — Contains definitions for node classes
• Discovers.dat — Scripts used in network discovers
• EvtCache.dat — The cache which stores the most recent traps and events
• Exnodes.dat — Excluded nodes
• Groups. dat — Information on DLM status groups
• Intrface.dat — Interface information displayed in Tree Views, List Views, and the
Node Properties window
• Nodes.dat — Node information displayed in Tree Views, List Views, and the Node
Properties window
• Port.dat — Reserved for future use
• RemoteAd.mdb — The Remote Administration Tools database
• Sessions.dat — Definitions for Netstat, NetSight Element Manager, and scheduler
connections
Backing Up Data Files 2-31
Page 48

Overview of NetSight Element Manager
• Subnet.dat — Subnet definitions
• Tools.dat — Information on items in the Tools menu
• Wrkspace.dat — Configuration of window placement and other appearance
properties within the primary NetSight Element Manager window.
• CSMIBDS.MDB — MIB database.
•*.def and*.trapdef — Trap definition files.
To access the Data File Manager:
1. Exit any current management sessions. NetSight Element Manager must be
closed for the backup utility to operate.
2. Select the Data File Manager icon in your NetSight Element Manager
program group. The Data File Manager window opens, as illustrated in
Figure 2-16.
Figure 2-16. Accessing the Data File Manager Window
The Data File Manager window provides access to each of the Data File Manager
functions: Edit Configuration File, which allows you to select the files and/or file types
that will be backed up; Backup, which performs the backup action; Restore from saved,
which replaces the current set of files with a previously-backed-up version; and Restore
from new, which replaces all listed files with their original default versions.
The following sections detail how to perform each operation.
2-32 Backing Up Data Files
Page 49

Editing the Backup Configuration File
When you perform a backup action, the Data File Manager looks in five directories in the
\NetSight Element Manager x.x directory — \Data, \Bin, \Filters (and its
automatically-created subdirectories), \Maps (or your configured Maps directory), and
\Exports (or your configured Exported Files directory) — for the files and/or file types
specified in the Backup Configuration File. Any files you wish to back up must be either
specifically named (Tools.dat) in the Backup Configuration File or of a type (*.map) listed
in the file; files must also be present in one of the five directories.
If you change the default Maps and/or Exported Files directory (via the Directories
TIP
Options available in the Tools—>Options window), the Data File Manager will
automatically back up any specified files that reside in the new default directories. Any
files that reside in the original default directories, however, will no longer be backed up.
To view or edit the list of data files that will be backed up, click on Edit Configuration
File. A text file display (stored as \NetSight Element Manager x.x\bin\emanfil.db),
showing the current list of files and file types that will be backed up (Figure 2-17).
Overview of NetSight Element Manager
Figure 2-17. Sample NetSight Element Manager Backup Configuration
Backing Up Data Files 2-33
Page 50

Overview of NetSight Element Manager
To edit this list:
1. Create a file backup entry by using the text editor to type a new line that
specifies the file name, or the *.XXX file extension (for all files of a similar
type). Remember, only files in the five pre-set directories will be backed up, so
you needn’t specify a path for any files you add to the list.
2. Save and exit the text file.
We encourage you to add the following files to your Backup Configuration file, if
applicable:
• Any data files in your \Bin directory that have been placed as Linked Objects in a map
(e.g., sound recorder files, Paintbrush files, database files, etc.)
Performing a Backup
1. In the main Data File Manager window, click on Backup. A window opens
(Figure 2-18), prompting you to specify the directory path in which to copy the
backup files.
The current
backup directory
path
For best results, we recommend that you store a copy of your backed-up files in a
NOTE
directory that is not a sub-directory of your NetSight Element Manager installation
directory.
2. Click OK. As the backup proceeds, you will be prompted to authorize the
overwriting of any existing files. If any part of the procedure fails (for example,
if you attempt to backup a specific file that does not reside in one of the five
preset directories), you will be notified of the error.
Click here if you
want your backup
directory to reside
on another network
drive.
Figure 2-18. Select Backup Directory Window
2-34 Backing Up Data Files
Page 51

3. When the backup is complete, a successful backup message will be
displayed. Click OK to exit this window and complete the backup procedure.
If even one file listed in the Backup Configuration file could not be found, a message
NOTE
window opens noting that the backup operation failed. This doesn’t mean the entire
operation failed; it just indicates the failure to back up the missing file.
Restoring Files from a Backup Set
If you have backed up your data files from SPECTRUM Element Manager version 2.x
WARNING
before installing NetSight Element Manager version 3.0, do not restore these data files
directly into version 3.0! The 3.0 installation process performs some necessary
conversion functions on these files to make them compatible with framework changes. If
you attempt to use version 2.x data files that have not undergone this conversion process
will produce unexpected behavior. As soon as you have installed version 3.0 and verified
that your files are working correctly, we recommend that you do another backup of your
3.0 data files.
Overview of NetSight Element Manager
1. In the main Data File Manager window, click on Restore from saved. A
window opens, prompting you to specify the directory path from which to copy
the archived files back into their original locations. This will be the same
directory path you chose in the steps described above.
2. Click OK. Two pop-ups open in quick succession: one to indicate the files are
being backed up, and a second to indicate the procedure was successful. You
will be given the opportunity to cancel the operation if you are overwriting an
existing file or, if the procedure fails, you will be notified of the error.
3. Click OK to exit the final prompt window.
Restoring Default Files
To restore your configuration files to their original condition without re-installing:
1. Click on Restore from new. A message appears, reminding you that this
operation will destroy some or all of your data files, and reset much of your
configuration to default values.
2. Click OK. Two pop-ups open in quick succession: one to indicate that the files
are being restored, and a second to indicate the procedure was successful.
You will be given the opportunity to cancel the operation if you are overwriting
an existing file or, if the procedure fails, you will be notified of the error.
3. Click OK to exit the final prompt window.
Backing Up Data Files 2-35
Page 52

Overview of NetSight Element Manager
2-36 Backing Up Data Files
Page 53

Chapter 3
Discovering Nodes
Accessing the Discover Manager window; creating and modifying Discover scripts; executing Discover
scripts; the Discover process; starting the Discover Wizard; launching the Scheduler application; using
the IP or Host Locator; using the Subnets window
The Discover Manager application allows you to locate devices on a network. You can
perform a Discover process within a specified range of IP (Internet Protocol) addresses, on
an entire subnet, or on a combination of the two. The Discover application automatically
explores the defined network segment, creates a list of discovered devices, and assigns an
icon to each of them. The discovered nodes are then automatically integrated into
NetSight Element Manager’s central node database, and consequently displayed as
appropriate in any List or Tree Views (see Chapter 4, List Views, and Chapter 5, Tree
Views, for more information).
The Discover application operates using scripts, which are created and saved within the
application (allowing them to be run repeatedly if desired). You can create a new Discover
script by using either the Discover Manager window (Figure 3-1) or the Discover Wizard,
which will lead you step by step through the Discover process (see Starting the Discover
Wizard on page 3-19). The following sections describe the use of the Discover Manager
window to create, modify, and execute Discover scripts.
Accessing the Discover Manager Window
To access the Discover Manager window from the NetSight Element Manager primary
window:
1. Select Tools —> Discover Manager from the primary window menu bar.
or
Click the Discover Manager button ( ) on the NetSight Element Manager
Standard toolbar.
The Discover Manager window, Figure 3-1, opens.
3-1
Page 54

Discovering Nodes
Figure 3-1. The Discover Manager Window
The Discover Manager window lists all Discover scripts you have created, including their
names, descriptions, and execution intervals. The Discover Manager window is the central
interface through which you create new scripts and modify, execute, and delete existing
scripts; from this window, you can also choose to run the Discover Wizard, and launch the
Scheduler application. (For more information about the Scheduler application, see the
Tools Guide.)
Creating and Modifying Discover Scripts
Discover scripts are created and modified using the Discover Properties window
(Figure 3-2). When you are creating a new Discover script, this window will supply three
tabbed pages — General, Device, and Schedule — which allow you to specify all desired
parameters.
Accessing the Discover Properties Window
To create a new Discover script:
1. Click New.
or
Click the right mouse button on an existing script name or in the central area
of the window, and choose New from the resulting menu.
The Discover Properties window, Figure 3-2, opens.
3-2 Creating and Modifying Discover Scripts
Page 55

Discovering Nodes
To modify an existing Discover script:
1. In the Discover Manager window, highlight the script to be modified, and click
Properties.
or
Click the right mouse button on the script to be modified, and select
Properties from the resulting menu.
The Discover Properties window, also illustrated in Figure 3-2, opens.
Figure 3-2. The Discover Properties Window
Creating and Modifying Discover Scripts 3-3
Page 56

Discovering Nodes
Using the Discover Properties window, you can name your script, enter an IP range for an
IP Discovery process, and assign a community name. You can also define and select entire
subnets for a Subnet Discovery, select a Script Filter for a discovery, and define the time
interval at which your discovery will take place.
Setting General Discover Properties
The General page of the Discover Properties window is used to name and describe your
Discover script (as shown in Figure 3-3). The script’s name and description will be listed
in the Discover Manager window.
To name and describe your Discover script:
1. If necessary, click on General tab in the Discover Properties window. The
General page (Figure 3-3) opens.
2. Highlight the contents of the Name: field, and type the name of your Discover
script. By default, each new script is named New Discover X, where X
increments as necessary to create a unique name.
Figure 3-3. The General Page of the Discover Properties Window
3-4 Creating and Modifying Discover Scripts
Page 57

3. In the Description: field, enter a description of the Discover script. This
description opens with the script’s name in the Discover Manager window,
and may help you to select from among the available scripts.
4. Enter any additional information you wish to store about the script in the
Notes: field. Note that this information is not displayed anywhere else.
5. Define your remaining Discover script parameters as explained in the
following sections, or click OK to save your entries and return to the Discover
Manager window.
Setting Device Discovery Parameters
A Device Discover script can discover devices within a single IP address range or a series
of ranges. It can also search one or more subnets, and limit its discoveries to SNMP
devices only or Cabletron devices only. You define Device Discovery parameters using
the Device page of the Discover Properties window (Figure 3-4), accessed by clicking on
the Device tab.
Discovering Nodes
Figure 3-4. The Device Page of the Discover Properties Window
Creating and Modifying Discover Scripts 3-5
Page 58

Discovering Nodes
To define a Device Discovery script, you must specify a range of IP addresses to be
queried and assign at least one community name that will give the Discover application
read access to the devices you wish to discover. IP address ranges can be individually
specified, or entire subnets can be selected; you can also combine subnets and specific
ranges in a single script, as long as the total number of addresses to be queried does not
exceed 2000. If you choose, you can also assign a Script Filter that will limit the discovery
to SNMP devices only or Cabletron devices only.
Defining IP Address Ranges
To set the IP address range (or ranges) for your Device Discovery:
1. To define a new IP address range, click New to the right of the Address
Ranges group box; or click the right mouse button anywhere in the Address
Ranges group box, and select New from the resulting menu.
To modify an existing IP address range, highlight the IP Address range that
you wish to change, and click Properties; or click the right mouse button on
the IP address range that you wish to modify, and select Properties from the
resulting menu.
NOTE
The Address Range Properties window (Figure 3-5) opens.
Figure 3-5. The Address Range Properties Window
When you are defining a new address range, the Starting Address, Ending Address, and
Address Mask fields will contain the autofill values you configured via the Welcome
Wizard or via the Network page in the Tools—>Options window (provided the autofill
function has been enabled via the Workspace page of the Tools—>Options window). See
Network Options in Chapter 2 for more information about configuring these defaults.
2. Place the cursor in the Starting Address field, and enter the address at
which your Discover script should begin.
3. Place the cursor in the Ending Address field (using the Tab key or the
mouse), and enter the address at which the Discovery should end.
3-6 Creating and Modifying Discover Scripts
Page 59

NOTE
Discovering Nodes
Although you can define address ranges beginning with 0 and ending with 255 (for
example, 132.117.18.0 to 132.117.18.255), devices at the .0 and .255 addresses will not
be discovered.
4. If you wish to specify an address mask other than the default value, enter the
desired address mask in the Address Mask field.
The appropriate address mask depends upon your network configuration. If
your network contains subnets, entering the appropriate subnet mask in this
field will identify the network, subnet, and host portions of the IP addresses in
the address range. For example, on a Class B network containing an IP
address of 132.177.118.24, a subnet mask of 255.255.255.0 would identify
the first two octets (132.177) as the network portion of the address, the third
octet (118) as the subnet portion, and the final octet (24) as the host portion.
If your network does not contain subnets, entering the appropriate network
mask in this field will identify the network portion of the IP addresses in the
address range. For example, on a Class B network containing an IP address
of 132.177.118.24, a network mask of 255.255.0.0 would identify the first two
octets (132.177) as the network portion of the address.
5. Click OK when your entries are complete. The information you entered
displays in the appropriate fields in the Address Ranges group box.
6. Repeat this process to define additional address ranges for your script.
Each discover script can be configured to query up to 2000 IP addresses; if the number of
NOTE
IP addresses on your network exceeds 2000, you must define and execute multiple
Discover scripts.
7. Define your remaining Discover script parameters as explained in the
following sections, or click OK to save your entries and return to the Discover
Manager window.
Defining and Selecting Subnets
Using the Subnets group box, you can also select entire subnets on which to perform a
Discovery. When a Subnet Discovery is executed, the Discover application will query
every address in the specified subnet, making it unnecessary to define an IP Address range
that encompasses an entire subnet.
Creating and Modifying Discover Scripts 3-7
Page 60

Discovering Nodes
TIP
Subnets will be defined automatically each time a device is added to the node database
(either manually or via a Discover script); they can also be defined manually, either via the
Discover Properties window (as described in this section) or via the View—>Subnets
window available from the NetSight Element Manager primary window menu bar. (See
Using the Subnets Window, page 3-27, for more information about viewing subnets.)
This subnet information is used to determine the map hierarchy created via the automatic
subnet mapping feature; for more information on this feature, see Generating Submaps
Automatically in Chapter 6, Creating Network Maps.
To specify a subnet (or subnets) for your device discover script:
1. To define a new subnet, click New to the right of the Subnets group box; or
click the right mouse button anywhere in the Subnets group box, and select
New from the resulting menu.
To modify an existing subnet, highlight the subnet entry that you wish to
change, and click Properties; or click the right mouse button on the subnet
entry that you wish to modify, and select Properties from the resulting menu.
The Subnet Properties window (Figure 3-6) opens.
Figure 3-6. The Subnet Page of the Subnet Properties Window
2. Place the cursor in the Subnet field and type the network and subnet portions
of the IP Address for the subnet that you wish to discover. For example, to
discover the subnet containing the Class B IP Address 132.177.118.24, type
132.177.118.0 in the Subnet field).
3-8 Creating and Modifying Discover Scripts
Page 61

Discovering Nodes
3. If necessary, place the cursor in the Subnet Mask field and type the subnet
mask for the subnet that you wish to discover. Note that the value set here will
determine the number of IP addresses which are included in the defined
subnet, regardless of whether or not this value correctly reflects the number of
devices each of your subnets contains. For example, a Class B network
typically defines the third byte of the IP address as the subnet identifier, and
the fourth byte as the host identifier. In this kind of network, each subnet (as
defined by each possible value of the third byte) can contain a maximum of
256 nodes on it (the number of possible values for the fourth byte). However,
if you incorrectly identify the subnet mask for such a network as 255.255.0.0,
the discover application interprets this to mean that each subnet has 65,536
IP addresses (256 possible values of the third byte, times 256 possible values
for the fourth byte). Since each discover script is limited to querying a
maximum of 2000 addresses, this kind of incorrect mask setting would
prevent you from completing your script. By default, the Subnet Mask will be
set to 255.255.255.0, limiting the size of the subnet to a maximum of 256
devices. The Nodes field just below the Subnet Mask field indicates the
number of nodes the Discover application understands your defined subnet to
contain; it will update once you have saved your subnet changes, closed the
Subnet Properties window, and re-opened it.
NOTE
The Nodes field in the Subnet Properties window is not the same as the nodes value
displayed in the View—>Subnets window (see Figure 3-20, page 3-28); that value
indicates the actual number of nodes in the central node database that reside on the
defined subnet.
4. On the General page of the Subnet Properties window (Figure 3-7), place the
cursor in the Name text box, and type in a name for your subnet entry. By
default, manually-created subnets are assigned the name New Subnet X,
where X will increment as necessary to create a unique name.
Automatically-created subnets are assigned the subnet address as their
default name.
Creating and Modifying Discover Scripts 3-9
Page 62

Discovering Nodes
Figure 3-7. The General Page of the Subnet Properties Window
TIP
5. In the Description text box, enter a description for your subnet entry. This
description is not displayed in the Discover Properties window, but will be
displayed in the View—>Subnets window accessible from the primary
window menu bar (see Figure 3-20 on page 3-28).
6. Enter any additional information about the subnet in the Notes text box.
7. Click OK to save your subnet discovery parameters and exit the Subnet
Properties window. The address and name of the defined subnet displays in
the Subnets group box on the Device page of the Discover Properties
window.
8. Repeat Steps 2-8 to define additional Subnets for your script.
9. To include a defined subnet in your Discover script, click on the checkbox to
the left of the subnet address in the Subnets group box. A check mark
displays in the checkbox to indicate that the subnet discovery has been
selected for inclusion in the script.
10. Define your remaining Discover script parameters as explained in the
following sections, or click OK to save your entries and return to the Discover
Manager window.
You can combine one or more IP address ranges with one or more subnets in a single
device discover script, as long as the total number of addresses to be queried in a single
script does not exceed 2000.
3-10 Creating and Modifying Discover Scripts
Page 63

Defining a Community Name
Once you have specified the IP addresses that will be queried during the Discover, you
must supply the discover application with one or more community names that will provide
at least Read access to the devices you wish to discover.
When a script with more than one assigned community name is executed, the Discover
application will query each address in the specified address range(s) and/or subnet(s)
using the first community name listed in the Community Names group box. If a node
responds, the other community names are not used to query that node. If there is no
response to the first query, the address is queried again using the second listed community
name. This process is repeated until a response is returned or until all listed community
names have been used to query the address. If no response is elicited from an address after
using all community names assigned to the script, the Discover application gives up on
that address, and moves on to the next one.
To select a community name for use in your Discover script:
1. To define a new community name, click New to the right of the Community
Names group box; or click the right mouse button anywhere in the
Community Names group box, and select New from the resulting menu.
To modify an existing community name, highlight the community name
that you wish to change, and click Properties; or click the right mouse button
on the community name that you wish to modify, and select Properties from
the resulting menu.
Discovering Nodes
NOTE
The Community Name Properties window (Figure 3-8) opens.
Figure 3-8. The Community Name Properties Window
If a default community name has been specified (either via the Welcome Wizard or via the
Network page of the Tools—>Options window) and the autofill function has been
activated (via the Workspace page of the Tools—>Options window), the Community
Name properties window will contain a default community name value.
2. If the Community Name: field contains a default name, it will be highlighted.
If you wish to use a different community name, type the new name into the
field.
3. Click OK to save the community name and close the window. The community
name you have entered will be listed in the Community Names group box.
Creating and Modifying Discover Scripts 3-11
Page 64

Discovering Nodes
4. To add another community name to your script, repeat steps 2-4.
5. Define your remaining Discover script parameters as explained in the
Selecting a Script Filter
If you would like to further refine a device discovery script, you can add one of two Script
Filters: one which restricts the discovery to Cabletron devices, and one which restricts it to
devices which respond to an SNMP query.
1. Click on the Script Filters drop-down menu; the three available filters will be
following sections, or click OK to save your entries and return to the Discover
Manager window.
displayed, as illustrated in Figure 3-9.
Figure 3-9. Script Filter Options
2. Click to select the appropriate filter:
All Devices — the script will discover and add to the central node database
all devices in the specified subnet(s) or IP address range(s) that respond to
either an SNMP or a PING query. This is the default value.
SNMP only devices — the script will discover and add to the central node
database only those devices in the specified subnet(s) or IP address range(s)
that respond to an SNMP query. Selecting this filter eliminates the discovery
of “Ping” devices.
Cabletron only devices — the script will discover and add to the central
node database only those devices in the specified subnet(s) or IP address
range(s) that respond to an SNMP query and are identified as Cabletron
devices. Selecting this filter eliminates the discovery of third-party devices.
3. Define your remaining Discover script parameters as explained in the
previous sections, or click OK to save your selection and return to the
Discover Manager window.
3-12 Creating and Modifying Discover Scripts
Page 65

Setting a Discover Interval
Defining a Discover Interval for your Discover script allows you to automatically start
your script and determine how often (in minutes) your script will be automatically
executed. The Discover Interval is defined using the Schedule page of the Discover
Properties window (Figure 3-10), accessed by clicking on the Schedule tab.
Once you have defined an interval and saved the script, NetSight Element Manager will
automatically execute the script, and continually re-execute it according to the defined
time interval. The script will continue to run at the defined interval until its Discover
Interval is changed to 0 (zero), the script is deleted, or the NetSight Element Manager
application is closed.
If you define a script with a Discover Interval, and then exit NetSight Element Manager,
NOTE
the script will be automatically executed the next time you start NetSight Element
Manager.
To set an interval for your Discover script:
Discovering Nodes
1. In the Discover Interval field, enter the desired number of minutes between
automatic executions of your Discover script. This interval will define the
amount of time between the beginning of one discover session and the
beginning of the next one (so be sure you define an interval that allows
enough time for each session to complete). The default value of 0 (zero)
indicates that manual execution of the script is required.
2. Define any remaining Discover script parameters, or click OK to save your
interval and return to the Discover Manager window.
Note that scheduled discovers behave a little differently than manually-executed
discovers; see The Discover Process, page 3-16, for more information.
Creating and Modifying Discover Scripts 3-13
Page 66

Discovering Nodes
Figure 3-10. The Schedule Page of the Discover Properties Window
Executing Discover Scripts
Once you have established the parameters for your Discover scripts, they are listed in the
Discover Manager window (as shown in Figure 3-11), and can be executed at any time.
1. In the Discover Manager window, click to highlight the name of the Discover
script to be executed, and click Execute.
or
In the Discover Manager window, click the right mouse button on the name of
the desired Discover script to reveal the Discover Manager menu, and select
Execute.
3-14 Executing Discover Scripts
Page 67

You can’t execute a discover script while a
Net Discover window is still open — either
because there is a discover still in progress,
or because the window was not closed
when a previous discover completed.
Figure 3-11. The Discover Manager Window
Discovering Nodes
You cannot execute a new discover session if a previous session is still running or if the
Discover window from a previous session is still open. If either of these conditions exists,
a footer message at the bottom of the Discover Manager window will indicate that a
discover is in progress (as illustrated in Figure 3-11). To clear this condition, close the
Discover Manager window, activate the Network Discover window (which may be
minimized or hidden behind the main NetSight Element Manager window), wait for the
active discover session to complete (or stop it, as described in Stopping a Discover in
Progress, page 3-17), close the Network Discover window, re-launch the Discover
Manager, and execute your new session.
When you have successfully launched a discover session, the Discover Manager window
automatically closes, and the Network Discover window (Figure 3-12, below) opens. For
more detailed information about this window and the discover process, see the following
sections.
Executing Discover Scripts 3-15
Page 68

Discovering Nodes
The Discover Process
Once a Discover script has been manually executed, the Discover Manager window
closes, and the Network Discover window (Figure 3-12) opens.
Figure 3-12. Network Discover Window
A discover proceeds in a single phase: each IP address in the defined address ranges
and/or subnets is queried in turn; as each response is received, information about the
responding device (including status, model, name, and IP address) appears in the Discover
window. A footer message at the bottom of the window indicates the total number of IP
addresses which will be queried during the discover session, and the number of IP
addresses which remain to be contacted.
When the Discover process is complete, all discovered devices which match the
configured criteria are automatically added to NetSight Element Manager’s central node
database. A progress indicator shows the status of this automatic integration; the Discover
window also remains open after the discover is complete, allowing you to view the list of
discovered nodes.
3-16 The Discover Process
Page 69

NEW and SECONDARY Discovers
Discovery sessions are divided into two types: NEW and SECONDARY. The first time
you run a device discover script, all IP addresses in the subnet or address range you have
specified will be queried, and all discovered devices will be listed in the discover window
and automatically added to the central node database. This is called a NEW Discovery.
The second time you run any device discover, however — even a device script which has
not yet been run — NetSight Element Manager will perform a SECONDARY Discover,
querying only those IP addresses which did not respond to the first discover.
When a NEW Discovery is performed, new information which may be discovered about an
TIP
IP address will not overwrite the information about that address which is currently in the
central node database. For example, if an IP address previously assigned to an EMME is
moved to a SmartSwitch 6000, the discover application does not record this change in the
database.
Stopping a Discover in Progress
1. Select File—>Exit from the Network Discover window’s menu bar.
Discovering Nodes
or
Click the close button in the upper-right corner of the Network Discover
window. A message window like the one illustrated in Figure 3-13 opens.
Figure 3-13. Cancel Discover Confirmation Window
2. Click Yes to stop the discover and add any discovered nodes to the database;
click No to stop the discover without adding any partial results to the
database; or click on Cancel to continue the discover.
Restarting a Completed Discover
You can also re-start a completed discover from the Discover window; note that this will
launch the selected script in SECONDARY discover mode, unless the discover counter
has been reset.
1. In the Network Discover window, select File—>Rediscover. The original
discover script will be re-launched, in SECONDARY discover mode.
The Discover Process 3-17
Page 70

Discovering Nodes
Re-starting a completed discover script from the Network Discover window has the same
effect as re-executing the script from the Discover Manager window.
Scheduled Discovers
A scheduled discover script — one which launches automatically at selected intervals —
behaves a little differently than a manually-executed script. Once a scheduled discover is
complete, the Network Discover window will close automatically; you need not close it
manually, as with a normally-executed script. (In fact, the Network Discover window for a
scheduled discover is minimized by default, so it is only visible if you choose to view it.)
If you have left a manually-executed discover window open, a scheduled discover will
close this window for you so that it can execute. And if a manually-executed script is still
in progress when a scheduled discover interval expires, the scheduled discover will wait
the length of the interval before it attempts to launch again.
You can also schedule discover sessions at specific dates and/or times via the Scheduler
TIP
application; see the Too ls G u id e for more information.
Deleting a Discover Script
1. In the Discover Manager window, highlight the name of the Discover script to
be deleted, and click Delete.
or
In the Discover Manager window, right-click on the name of the Discover
script to be deleted, and select Delete from the resulting menu.
A delete confirmation window (Figure 3-14) opens.
Figure 3-14. The Script Deletion Confirmation Window
2. Click Yes to confirm the deletion. The script will be removed from the
Discover Manager window.
3-18 Deleting a Discover Script
Page 71

Starting the Discover Wizard
To use the Discover Wizard to create a new Discover script:
1. In the Discover Manager window, click Wizard.
or
Click the right mouse button anywhere in the Discover Manager window,
select Wizard from the resulting menu.
To use the Discover Wizard to modify an existing Discover script:
1. In the Discover Manager window, highlight the name of the script that you
wish to modify, and click Wizard.
or
Click the right mouse button on the name of the script that you wish to
modify, and choose Wizard from the resulting menu.
Follow the directions in the Wizard to create or modify a discover script.
Discovering Nodes
Launching the Scheduler Application
Once you have created your Discover scripts, you can use the Scheduler application to
automatically execute selected scripts at scheduled times and dates. To launch the
Scheduler application from the Discover Manager window:
1. Click Scheduler.
or
Click the right mouse button anywhere in the Discover Manager window, and
choose Scheduler from the resulting menu.
For more information about using the Scheduler application, consult the Tools Guide,
included with your documentation.
Using the IP or Host Locator Tool
The IP or Host Locator Tool serves as an adjunct to the Discover functionality. Its primary
function is to resolve host names to IP addresses, and vice versa; it can also resolve host
names to IP addresses for an entire subnet, locate the MAC address associated with a
matched host name/IP pair, and locate both the host name and IP address for a given MAC
address.
To launch the IP or Host Locator Tool:
1. Select Tools —>Host/IP Locator from the primary window menu bar.
Starting the Discover Wizard 3-19
Page 72

Discovering Nodes
or
Click the IP or Host Locator button ( ) on the NetSight Element Manager
Standard toolbar.
The IP or Host Locator window, Figure 3-15, opens.
By default, the IP,
Host, and Get MAC
Address fields
display the values
assigned to your
workstation
Figure 3-15. The IP or Host Locator Window
The following sections describe some common uses for this tool. Note that multiple
instances of the IP or Host Locator tool can be run simultaneously, allowing you to
perform more than one lookup task at a time.
Matching a Host Name to an IP Address
To use the Locator Tool to locate the IP address associated with a known host name:
1. Click Clear to clear the default values from the IP and Host fields.
2. In the Host field, enter the host name of the device whose IP address you
wish to locate.
3. If you wish to ping the device once its IP address is located, click to select the
Ping found devices option; in the text field provided, specify a timeout
period, in seconds. If the device does not respond to the ping request within
the specified timeout, the ping will be considered to be unsuccessful.
4. Click on Update, or press Enter on the keyboard. If the host name can be
resolved, its associated IP address will be displayed in the IP address fields; if
you have selected the Ping option, a message window will indicate the
success or failure of the ping attempt. If the host name cannot be resolved, a
message window appears, indicating that the selected host name could not
be found.
3-20 Using the IP or Host Locator Tool
Page 73

Once located, IP addresses can be copied (using the right-mouse edit menu or Ctrl-C on
TIP
the keyboard) and pasted (via Edit—>Paste) into the Insert Device window for addition to
the central node database. For more information about inserting devices individually, see
Chapter 4, List Views.
Matching an IP Address to a Host Name
You can also use a known IP address to locate a device’s host name. To do so:
1. Click Clear to clear the default values from the IP and Host fields.
2. Enter the IP address of the device whose host name you wish to locate in the
IP or Full IP field.
3. If you wish to ping the device once its host name is located, click to select the
Ping found devices option; in the text field provided, specify a timeout
period, in seconds. If the device does not respond to the ping request within
the specified timeout, the ping will be considered to be unsuccessful.
4. Click on Update, or press Enter on the keyboard. If the IP address can be
resolved, its associated host name will be displayed in the Host field; if you
have selected the Ping option, a message window will indicate the success or
failure of the ping attempt. If the IP address cannot be resolved, a message
window appears, indicating that the selected IP could not be found.
Discovering Nodes
Locating the MAC Address for a Host Name/IP Pair
Once you have resolved a host name/IP pair, you can use the Get MAC address button to
locate the device’s MAC address.
1. Enter an IP or host name in the appropriate field, and click Update to resolve
the pair.
2. Click on Get MAC address. The MAC address associated with the IP/Host
pair will be displayed in the text box to the right of the button.
You cannot use an IP or host name alone to retrieve a MAC address; you must first resolve
the pair to activate the Get MAC address button.
If you have a MAC address and wish to find the associated IP and/or host name, use the
TIP
MAC Search feature described in Matching a MAC Address to a Host Name and IP,
beginning on page 3-25.
Using the IP or Host Locator Tool 3-21
Page 74

Discovering Nodes
Subnet Search
You can also use the Locator Tool to locate (and ping, if desired) all IP addresses on a
subnet or a portion of a subnet, resolve host names to the located IP addresses, and resolve
MAC addresses to the located IP/hostname pair. To do so:
1. Click Clear to clear the default values from the IP and Host fields.
2. In the IP field, enter the appropriate bytes of the subnet address:
To search an entire subnet, enter the first three bytes of the subnet address;
To search a portion of a subnet, enter the first three bytes of the subnet
address; in the fourth byte field, enter the IP at which you want the search to
start.
3. If you have chosen to search only a portion of a subnet, click to select the
Start subnet/MAC search using 4th numeric IP value shown above
option. A check mark opens in the selection box.
4. Because searching an entire subnet can be time-consuming, you can
configure the Locator Tool to stop at pre-defined intervals, asking if you want
to continue the search. To activate this option, click to select Prompt every
XX devices, and use the text field provided to enter the number of devices
that will be located between prompts. The default value is 10.
TIP
Once the search begins, a Stop Searching button will also appear, allowing you to stop
the search at any time.
5. If you wish to ping each found device once it is located, select the Ping found
devices option; in the text field provided, specify a timeout period, in seconds.
If a device does not respond to the ping request within the specified timeout,
the ping will be considered to be unsuccessful.
6. For the quickest Subnet search, click to select the Do not resolve host
names during subnet search option. This kind of search will locate only IP
addresses (and ping them if you have selected that option); no host name or
MAC resolution will take place. Note that selecting this option inactivates the
Identify MAC address option described in the next step.
7. For the most detailed Subnet search, click to select the Identify MAC
addresses during search option. Though time-consuming, this subnet
search gives you complete IP, host, and MAC resolution for all devices in the
subnet (or subnet portion) you have specified.
8. Click Subnet to start the search. The Locator window will expand (see
Figure 3-16) to display a list box containing the results of the search. A Stop
Searching button will also appear just above the list box; click this button at
3-22 Using the IP or Host Locator Tool
Page 75

If you have
selected the
Prompt option,
a message
window like
this one opens
at the defined
interval.
Discovering Nodes
any time to stop a search in progress. If you have selected the Prompt option,
a message window opens at the selected interval, asking if you want to
continue the search. Click Yes to continue, or No to stop.
Click here to
stop a search
in progress at
any time.
Search results are
displayed here.
Figure 3-16. A Subnet Search in Progress
If you have selected the Identify MAC address and/or Ping options, these results will
also be displayed in the list box. If no device is found at a specified IP address, question
marks (???) display in place of a host name.
Once the search is complete, five buttons display just above the list box display (see
Figure 3-17): Select All, Copy IPs, Copy Unnamed IPs, Copy Pinged IPs, and Copy
Unpingable IPs.
Using the IP or Host Locator Tool 3-23
Page 76

Discovering Nodes
NOTE
Figure 3-17. Completed Subnet Search
You can use these buttons to copy one, several, or all discovered IP addresses to the
clipboard for pasting into the central node database or any text document:
1. Click Select All to select all discovered IP addresses, or click and drag with
your mouse to select a contiguous portion of the discovered address list.
or
Click Copy Unnamed IPs, Copy Pinged IPs, or Copy Unpingable IPs to
select specific groups of IPs. (Note that these buttons only activate when IPs
of the noted kind are displayed in the list box.)
2. Click Copy IPs to copy the selected IP addresses to the clipboard. Use any
Paste command as usual to copy the contents of the clipboard into a text or
other document, or use Edit—>Paste from the primary window menu bar to
sequentially paste the copied IP addresses into a series of Insert Device
windows for addition to the central node database.
Only the located IP address is copied during the Copy IPs process; no additional
information, though highlighted in the list box display, is copied to the clipboard.
3-24 Using the IP or Host Locator Tool
Page 77

Matching a MAC Address to a Host Name and IP
You can also use a known MAC address and subnet location to locate the associated IP
address and host name. To do so:
1. Click Clear to clear the default values from the IP and Host fields.
2. In the IP field, enter the appropriate bytes of the subnet address:
To search an entire subnet, enter the first three bytes of the subnet address;
To search a portion of a subnet, enter the first three bytes of the subnet
address; in the fourth byte field, enter the IP at which you want the search to
start.
3. If you have chosen to search only a portion of a subnet, click to select the
Start subnet/MAC search using 4th numeric IP value shown above
option. A check mark displays in the selection box.
4. Because searching an entire subnet can be time-consuming, you can
configure the Locator Tool to stop at pre-defined intervals, asking if you want
to continue the search. To activate this option, click to select Prompt every
XX devices, and use the text field provided to enter the number of devices
that will be located between prompts. The default value is 10.
Discovering Nodes
TIP
Once the search begins, a Stop Searching button will also appear, allowing you to stop
the search at any time.
5. Click MAC search, and enter the MAC address whose IP and host name you
wish to find in the window which appears (see Figure 3-18).
Figure 3-18. MAC Search Window
6. Click OK to start the search. The Locator window will expand (see
Figure 3-19) and a Stop Searching button displays just above the list box;
click this button at any time to stop a search in progress. If you have selected
the Prompt option, a message window opens at the selected interval, asking
if you want to continue the search. Click Yes to continue, or No to stop.
Using the IP or Host Locator Tool 3-25
Page 78

Discovering Nodes
TIP
When the MAC
address is found, a
message window
displays its associated
IP address and host
name; the information
will also appear in the
list box.
When the selected MAC address is located, a message window will display, indicating the
host name and IP address associated with the found MAC; this information will also be
displayed in the list box. If the address is not located, a message window opens when the
search is complete, indicating that the selected address could not be found.
You can use the Copy IP buttons to paste any located IP addresses to any text document;
you can also paste found IPs directly into the central node database via the Edit—>Paste
command. See page 3-24 for more information.
If the MAC address could
not be found, a message
window like this one will
be displayed when the
search is complete.
Figure 3-19. Find MAC Address Search
3-26 Using the IP or Host Locator Tool
Page 79

Using the Subnets Window
With the Subnets window, you can define and view subnet entries which can be used in
Discover scripts. The Subnets window is accessed by selecting View—>Subnets from the
NetSight Element Manager primary window menu bar. Any subnet entries that appear in
the Subnets window will also appear in the Subnets group box on the Device page of the
Discover Properties window, and vice versa (see Defining and Selecting Subnets,
page 3-7).
The Subnets window will list subnet entries for any subnet on which an IP or Subnet
Discovery has been previously performed. For example, if you have previously performed
an IP Discovery using the IP Address range of 132.177.118.0 —> 132.177.118.100, the
Subnets window will contain an entry for the 132.177.118.0 subnet (assuming that this is a
Class B network, with a subnet mask of 255.255.255.0).
If you have manually added a device to a view or a map, a subnet entry will be listed for
that device’s subnet as well. For example, if you manually add a device with an IP address
of 132.177.118.24 to any of your views or maps, the Subnets window will contain an entry
for the 132.177.118.0 subnet (assuming that this is a Class B network, with a subnet mask
of 255.255.255.0).
Discovering Nodes
TIP
This subnet information is used to determine the map hierarchy created via the automatic
subnet mapping feature; for more information on this feature, see Generating Submaps
Automatically in Chapter 6, Creating Network Maps
When defining subnet entries using the Subnets window, you use the same Subnet
Properties window that is used in the Discover application when defining subnets for use
in a Discover script.
To launch the Subnets window from the NetSight Element Manager primary window:
1. Select View—>Subnets from the primary window menu bar. The Subnets
window, Figure 3-20, opens.
Using the Subnets Window 3-27
Page 80

Discovering Nodes
Figure 3-20. The Subnets Window
The Subnets window displays entries for all manually-defined (via this window or the
Discover application) subnets; if you have manually added a node to the central node
database, a subnet entry will be listed for that node’s subnet as well.
Each subnet entry will be listed with its name, description, the network and subnet
portions of its IP Address, its subnet mask, and count of the nodes in the central node
database that reside on that subnet. A subnet’s name, description, and address are all
defined using the Subnet Properties window. Automatically-created subnet entries are
named with their IP address by default; no default description is provided.
Note that the Nodes value displayed here does not have the same meaning as the Nodes
TIP
value displayed in the Subnet Properties window (Figure 3-6, page 3-8); that value
indicates the maximum number of nodes that could be included in a subnet defined by the
given subnet mask, and does not indicate how many nodes on a specific subnet have been
added to the central node database.
Creating and Modifying a Subnet Entry
To create a new subnet entry or modify an existing one:
1. To define a new subnet, click New; or click the right mouse button
anywhere in the Subnets window, and select New from the resulting menu.
To modify an existing subnet, highlight the subnet entry that you wish to
change, and click Properties; or click the right mouse button on the subnet
entry that you wish to modify, and select Properties from the resulting menu.
The Subnet Properties window (Figure 3-7, page 3-10) opens.
3-28 Using the Subnets Window
Page 81

2. Follow the steps outlined in Defining and Selecting Subnets, beginning on
page 3-7. The procedure for defining and modifying subnet entries is the
same from this window or when configuring a discover script.
3. Click OK to save your subnet discovery parameters and exit the Subnet
Properties window. The name, description, address, and subnet mask of the
defined subnet opens in the Subnets window.
Deleting a Subnet Entry
Deleting a subnet entry will not delete that subnet’s nodes from NetSight Element
NOTE
Manager’s central node database.
1. In the Subnets window, highlight the name of the subnet(s) to be deleted, and
click Delete.
Discovering Nodes
TIP
or
In the Subnets window, click the right mouse button on the subnet to be
deleted, and select Delete from the resulting menu.
The selected subnet entry will be deleted from the Subnets window, as well as from the
Subnets group box on the Device page of the Discover Properties window (see Defining
and Selecting Subnets, page 3-7, for more information).
If you delete a subnet entry from either the Subnets window or from the Subnets group box
on the Device page of the Discover Properties window, that subnet will not be included in
any automatic subnet mapping that takes place. See Generating Submaps Automatically
in Chapter 6, Creating Network Maps, for more information on subnet mapping.
Using the Subnets Window 3-29
Page 82

Discovering Nodes
3-30 Using the Subnets Window
Page 83

Chapter 4
List Views
Using list views to view node information; using the List View workspace; creating and editing list
views; changing the appearance of your list views; excluding nodes; adding network elements to the
node database; editing node properties
NetSight Element Manager stores information about all discovered or manually-inserted
devices in one place: its central node database. This information can be viewed in a wide
variety of customizable ways via List Views, Tree Views, and Maps.
About List Views
One of the ways NetSight Element Manager allows you to see, organize, and work with
the nodes in your database is through List Views. List Views, as their name implies,
display the contents of your central node database in a collection of lists. These lists can be
configured in a variety of ways: you can choose the information about each node that you
wish to display, the order in which that information will be displayed, and the font used to
display it; you can also choose which nodes you wish to display in a list by configuring a
filter which selects or omits nodes based on the characteristics you choose. Specific nodes
can also be excluded from individual List Views, while remaining present in the central
node database. List Views provide enormous flexibility in the display of your central node
database without altering its contents.
NetSight Element Manager provides you with several default list views, including a
read-only view called the All Nodes List View, which always displays the entire contents
of your central node database. Each List View can be accessed and (where appropriate)
edited via the List View Workspace; the workspace also allows you to create new list
views, and organize your views via folders.
The List View Workspace
Using the List View workspace you can access and edit existing views, create new ones,
and organize your views by arranging them in a hierarchy of folders.
4-1
Page 84

List Views
Click on this tab to bring the
List View Workspace into
view.
Indicates the folder
contains one or more list
views. Click on the folder
to expand and view the
contents of the folder.
Indicates the folder is
expanded and all the
contents are displayed.
Figure 4-1. Getting Around the List View Workspace
The default views provided with NetSight Element Manager are arranged in a series of
folders which group them by type. All of these default views — except the read-only All
Nodes List View — can be edited or deleted; you can also add additional views to each of
the default folders, or empty the folders and remove them entirely.
Adding a Folder to the Workspace
As a means of organizing a collection of List Views, you can add folders to the List View
page of the workspace; each folder you create will be contained within the base List
Views folder, and each can contain one or more list views, as well as additional folders.
Note that folders are a workspace display convention only, and they can only be created
from within the workspace itself.
These menus are
available by
right-clicking on the
appropriate folder
(above) or view (below).
To create a folder:
1. Display the List View page of the workspace by clicking on the tab in
the Workspace View.
2. Click the right mouse button on the folder to which you want to add a new
folder; that folder will be highlighted (as illustrated in Figure 4-2), and a menu
opens.
To add a folder at the top level of the List View hierarchy, click to select the main List
TIP
Views folder.
4-2 About List Views
Page 85

Click the right mouse
button on the appropriate
folder to add a new folder
beneath that selection in
the hierarchy.
Figure 4-2. Adding a New Folder to the List View Workspace
3. In the resulting menu, click to select New Folder. A new folder will
automatically be added in the branch you have selected.
Renaming a Folder
List Views
By default, all new folders are named with the designation New Folder X, where X
represents a sequential index; you can rename your folders, as follows:
1. Click once to highlight the folder whose name you wish to change, then after a
brief pause click again. The folder name will be enclosed in an editable text
box (as illustrated in Figure 4-3), and the existing name will be highlighted.
2. Click again to place the cursor anywhere in the name, and edit as desired; or,
simply begin typing to replace the highlighted text entirely.
3. Press Enter to set your change.
The All Nodes List View
Figure 4-3. Changing a Folder Name
The All Nodes List View provides the most comprehensive look at the contents of your
central node database. This special default view will always appear at the root of your List
View hierarchy (as displayed in the List View workspace), and cannot be edited or
deleted; by design, it displays information about every node in the central node database.
About List Views 4-3
Page 86

List Views
Figure 4-4. The All Nodes List View
The All Nodes List View display includes 11 of the 13 possible descriptive columns
available, including Status, Model, Name, Logical Address, Physical Address, Time of
Last Contact, System Up Time, Enterprise, Classes, Topologies, and Status Group; Label
and Event information is omitted (but can be selected for other views). As with the other
List Views, the contents of the All Nodes List View can be sorted by any one or more of
the available columns, and its display format can be changed; the nodes which are
displayed (and the information which is displayed about them), however, cannot.
In addition to changing the arrangement of information in the All Nodes List View, the
TIP
one other feature you can edit is the font used to display list view information. For more
information about changing fonts on this and other list views, see Selecting a Display
Font, page 4-14.
Other Default List Views
In addition to the All Nodes List View, a variety of other default views — organized in
folders by type — is also provided; these views can be used as is, edited to better suit your
needs, or deleted entirely. Each of these views includes a pre-set filter which excludes all
nodes not of the type specified by the view’s name.
Default views provided are:
Class Views
The default class views filter devices based on their functional class, displaying only those
devices which provide the noted functionality: ATM (the ATM View), bridging (the
Bridges View), FDDI (the FDDI View), repeating (the Repeaters View), routing (the
Routers View), or switching (the Switches View). Devices which belong to more than one
of these functional classes will be displayed in all appropriate views.
4-4 About List Views
Page 87

Device Views
A single default Device View — the All Devices View — displays all IP devices.
Enterprise Views
A single default Enterprise View allows you to display only your Cabletron and Enterasys
devices.
Topology Views
Two default topology views filter out all devices that do not provide Ethernet (Ethernet
View) or Token Ring (Token Ring View) topology support.
List View Display Options
In addition to selecting both the nodes and the information about those nodes that will be
displayed, you can also select the arrangement of this information in a selected list view
window. These display format options apply to all views, including the All Nodes List
Vie w.
List Views
Using the List View Toolbar
The appearance of the list views you create can be changed according to which
information needs to have priority in the view, and how you want it displayed. The List
View toolbar — and the associated options available via the primary window View menu
— will enable you to change the size and amount of information displayed in your list
view by choosing one of four display options:
Large Icon Format (View—>Large Icon) The nodes are represented by
Small Icon Format (View—>Small Icon) The nodes are represented by
Figure 4-5. The List View Toolbar
large model icons with labels below them, labeled and
sorted by assigned Name (sysName by default). Icons
are arranged in rows and sorted left to right and top to
bottom.
small model icons with their labels to the right,
labeled and sorted by assigned Name (sysName by
default). Icons are arranged in rows and sorted left to
right and top to bottom.
About List Views 4-5
Page 88

List Views
Small Icon Detail Format (View—>Small Icon Detail) Each node appears as a
line in a multicolumn format. The columns consist of
the information you have chosen to display from the
List View Properties window (or the default columns,
in the case of the All Nodes List View), in the order
you have specified there. For each displayed
information type which includes an icon, the small
(16x16 pixel) graphic will be displayed. This is the
default view format; it will be applied each time
NetSight Element Manager is launched.
Large Icon Detail Format (View—>Large Icon Detail) Each node appears as a
line in a multicolumn format. The columns consist of
the information you have chosen to display from the
List View Properties window (or the default columns,
in the case of the All Nodes List View), in the order
you have specified there. For each displayed
information type which includes an icon, the large
(32x32 pixel) graphic will be displayed.
Any change made to the display format is applied to the currently selected view for the
duration of the current NetSight Element Manager session or until another View selection
is made; once NetSight Element Manager is closed and re-opened, however, all views will
revert back to the default Small Icon Detail format.
Sorting Nodes
TIP
The List View toolbar also contains the Find icon:
Find This feature allows you to search for a specific node
in a List View by any of its associated information;
see Searching a List View, page 4-7, for more
information on this feature.
By default, List Views displayed in the Small Icon Detail and Large Icon Detail formats
described above are sorted in Logical (IP) Address order. However, these views can also
be re-sorted by the information in one or more columns. Text fields are sorted
alphabetically, numeric fields are sorted numerically, and mixed fields are sorted
alpha-numerically; Enterprise, Classes, and Topology values are sorted numerically by
assigned identifiers rather than alphabetically by group name.
If Status is selected as a sort column, the sort will update automatically as necessary.
Sorting is accomplished by clicking on the column heading button for the information you
wish to sort by. Clicking on the same column heading more than once alternately sorts the
selected information in ascending and descending order; clicking on more than one
column heading creates a multi-level sort. The current sort order is indicated by a number
4-6 About List Views
Page 89

List Views
and a greater-than or less-than sign displayed in the selected column settings: a
greater-than sign (>) indicates that the information in the associated column is sorted in
ascending order; a less-than sign (<) indicates that the information is sorted in
descending order. You can choose as many levels as you want for your sort, and you can
mix ascending and descending sorts in different columns. To return the view to the default
sort order, select the Reset Sort Order option available on the right-mouse menu.
Figure 4-6, below, illustrates the default (Logical Address) sort order, and the same view
with a multi-level sort applied. Note that the multi-level sort mixes ascending and
descending orders in the different columns.
By default, List Views are sorted in
Logical (IP) Address order; if you
wish, you can also apply a
multi-level sort, selecting the
columns whose information you
wish to sort by, and toggling each
column’s sort between ascending
and descending order.
Figure 4-6. Sorting Nodes
Searching a List View
Using the Find feature, you can search a List View for any value displayed in its columns.
The Find window will search the contents of the active List View for a text string (with
options for searching a partial string and for case sensitivity), or for a specific value
displayed in a selected column type. You can also search upwards or downwards from
your current position, and choose to continue the search when the top or bottom of the
displayed view is reached.
About List Views 4-7
Page 90

List Views
To access the Find window:
1. Open or activate the List View that you wish to search.
2. Select Edit—>Find from the primary window menu bar.
or
Click on the List View toolbar.
The List View Find window, Figure 4-7, opens.
Use this text box to enter a string you wish
to match in any available List View column.
You can specify a case-sensitive search, or
allow for a
partial match
of the string.
If you select a specific column to search, use this
drop-down list to select which of the available
strings to search for.
The status bar displays the type
of search currently in effect.
Figure 4-7. List View Find Window
You can perform two different kind of searches with this window: you can enter any text
string you wish to match fully or partially in any column (using the top text box); or you
can search for any one of the available values in a selected column (using the lower text
box).
To search for a value in ANY column:
1. In the Column to search list box, make sure the All columns option is
selected.
4-8 About List Views
Page 91

List Views
2. In the Text to find (in ANY column) text box at the top of the window, enter
the string you wish to match. Note that this field will not be available unless
the All columns option is selected in the Column to search list box. For your
convenience, the ten most recent search strings will be listed in a drop-down
menu.
3. To make your search case-sensitive, click to deselect the Any case option in
the lower right corner of the window. To match any case, leave the option
selected.
4. If you want your search string to be matched as a whole word, click to
deselect the Partial option. If you want to allow a partial match, leave the
option selected.
5. Use the Direction options to specify whether to search Up or Down from the
entry currently selected in the active List View. Whichever direction you
choose, you will be given the opportunity to start over when the top or bottom
of the list is reached.
6. Click on Find Next to begin the search. Each match will be highlighted as it is
found; to find additional matches, click on Find Next again.
or
Click on Select All to immediately highlight all matches.
If the selected value is not found, a message window will notify you of the failure.
To search for a value in a SELECTED column:
1. In the Column to search list box, click to select the column whose values you
wish to search. You can restrict your search to any one of the following
columns, as long as it is displayed in the active List View: Logical Address,
Model, Name, Physical Address, Status Group, System UpTime, and
Time of Last Contact.
2. Click on the arrow to the right of the Available values (in SELECTED
column) field to select the value you wish to search for. All values which
appear in the selected column will be available for your search; these are the
only values that can be used for this kind of search. Note that this field will not
be available if the All columns option is selected in the Column to search
list box.
3. Use the Direction options to specify whether to search Up or Down from the
entry currently selected in the active List View. Whichever direction you
choose, you will be given the opportunity to start over when the top or bottom
of the list is reached.
4. Click on Find Next to begin the search. Each match will be highlighted as it is
found; to find additional matches, click on Find Next again.
or
Click on Select All to immediately highlight all matches.
About List Views 4-9
Page 92

List Views
Creating and Editing List Views
You can create a variety of list views customized to meet your network management
needs, either by editing any of the default views provided (except the All Nodes List
View) or by creating entirely new views. User-defined filter criteria allow you to select
which nodes will be displayed; List View display properties allow you to select which
information about those nodes will be displayed.
To create a new list view:
1. Select Window —> New List View from the primary window menu bar.
or
Click on the toolbar.
or
In the List View Workspace, click the right mouse button on any folder or in
any blank area, and select New View from the menu that appears.
The New List View window, Figure 4-8, opens.
The Columns
check list allows you
to choose which
attributes are
displayed in the list
view; you can also
change the order in
which this
information will be
displayed. For more
information, see
Selecting Node
Information to
Display, page 4-11.
Figure 4-8. The New List View Window
4-10 Creating and Editing List Views
Page 93

NOTE
List Views
When you add a new list view by any of the means described above, it will be added to the
folder which is currently selected in the List View workspace; if you add a list view by
right-clicking in a blank area of the workspace, the new view will be added to the root
folder. Once a List View has been added, it cannot be moved from folder to folder. All
folders and views are listed in the workspace in alphabetical order.
To edit an existing list view:
1. With the appropriate list view open and selected in the NetSight Element
Manager primary window, select View —> Properties from the primary
window menu bar.
or
In the List View Workspace area, click the right mouse button on the name or
icon associated with the view you wish to edit, and select Properties from the
resulting menu.
or
Click with the right mouse button anywhere in the view you wish to edit, and
select List View Properties from the resulting menu.
The List View Properties window will be displayed.
The procedures for creating a new List View and editing an existing one are virtually
identical; they are described in the following sections.
If you open the List View Properties window for the All Nodes List View, note that all
NOTE
fields are grayed out; remember, the only thing you can change about this view is the font
in which its information is displayed. See Selecting a Display Font, page 4-14, for more
information.
Selecting Node Information to Display
The main List View Properties window allows you to assign or change the name of your
list view, select the information that will be displayed for each node, and select the order
in which it will be displayed.
To set up or modify a list view:
1. By default, a new list view will be named New List View X, where X will
increment sequentially as necessary to provide a unique name. To change
this default (or the original name assigned to any view), highlight the text in
the Name field and delete, then enter a new name.
Creating and Editing List Views 4-11
Page 94

List Views
TIP
2. In the Columns list box, click to select the information you’d like displayed
about each node in the view; click again to deselect any option you do not
wish to view. Each selection in this list will add a column of information to your
list view. Each of the available options is described below; you must select at
least one column to create or save your view.
You can also use the Select All and Unselect All buttons to select or deselect all available
column options.
3. The column options you have selected display in the list view in the same
order they are listed in the Columns field; to change this order, click to select
the option you want to move, and use the Move Up and Move Down buttons
to change its position as necessary. Repeat to order all selected options as
desired.
A list view configured in this way will display the information you have selected for all
nodes in the central node database, using the default display font. To change the node
types that will be included in your view, use the Filters option (described in Selecting the
Nodes to Display: Using Filters, page 4-15); to change the display font, use the Font
option (described in Selecting a Display Font, page 4-14).
For more information about the view-specific Excluded Nodes list displayed at the bottom
TIP
of the List View Properties window, see Excluding Nodes from an Individual View,
page 4-18.
Node Information Options
List views can include up to 13 columns of information about the nodes they display.
Information available for display includes:
Status
Indicates the status of NetSight Element Manager’s contact with the node. The possible
states are:
• Critical (Red) - The node is in critical condition; it is no longer in contact with
NetSight Element Manager.
• War ning (Yellow) - The status icon turns yellow to indicate that NetSight Element
Manager has received a trap from the represented node; the icon will remain yellow
until the trap is acknowledged.
If any node in your central node database is in a Critical or Warning state, this status
TIP
condition will be propagated right up to your desktop via the minimized NetSight Element
Manager icon — the Task Bar icon representing NetSight Element Manager will change
from the inactive window title bar color to the active window title bar color.
4-12 Creating and Editing List Views
Page 95

List Views
• Unknown (Blue) - A blue status icon indicates that NetSight Element Manager has not
yet been able to contact the represented node, and has not yet determined whether or
not that contact will be successful. A node icon is blue only temporarily, while
NetSight Element Manager determines whether or not contact can be made: if contact
is successfully made, the icon will turn green; if not, it will turn red. Performing an
individual node status query (using the Manage—>Query Status option from the
primary window menu bar, or the Query Status option available from the right-mouse
menu) will temporarily turn a node status icon blue, while the status query is being
made.
• Normal (Green) - NetSight Element Manager is successfully communicating with the
represented node, and the node is operating properly on the network. Green is also the
default color for a map icon which is not currently associated with an IP address.
• Undefined (Gray) - A gray status icon for a node indicates that polling has been
disabled, and the node’s current status is not known.
Name
This column displays the user-defined name of the node. You can assign a name for the
node in the General properties page in the Device Properties window. By default, devices
will display any configured MIB II sysName value.
NOTE
Note that changing a node’s name via its Properties window changes only the
information in NetSight Element Manager’s central node database; no name changes are
set at the device. If you wish to leave the MIB II sysName displayed, and assign an
additional label, use the Label field described below. For more information on
configuring node properties — including setting both Name and Label values — see
Editing Device Properties, page 4-29.
Label
Displays a user-set alias for a node; no default label is provided.
Logical Address
Displays the IP (Internet Protocol) address for devices.
Physical Address
Displays the MAC address for devices.
Time of Last Contact
Lists the date and time of NetSight Element Manager’s last successful contact with the
node.
System Up Time
The length of time the device has been operating since its last boot up, displayed in a days,
HH:MM:SS format.
Creating and Editing List Views 4-13
Page 96

List Views
Status Group
If the device is part of a Distributed LAN Management status group, it will be indicated
here. Both the name assigned to the DLM group and the node’s position in that group
(“DLM Agent” or “DLM Client of (IP Address)” ) will be displayed. For more
information on configuring and using Distributed LAN Management functions, see the
DLM Status Groups chapter in the NetSight Element Manager Tools Guide, included
with your document set.
Model
Indicates the model name of the device, along with the icon which represents that model
type.
Classes
Displays the functional classes supported by the selected node (Router, Bridge, Switch,
ATM, etc.), represented by the appropriate class icon(s).
Enterprise
Displays the enterprise, or vendor — Cabletron, Enterasys, etc. — which manufactured
the selected node.
Topologies
Displays the topology (or topologies) supported by the node.
Events
Indicates whether or not the Alarm and Event log has received traps and/or events related
to the node.
Selecting a Display Font
The Font Window allows you to select the font style and size for any displayed text. You
can change the font setting for any list view, including the otherwise-uneditable All Nodes
List View.
1. Click on Font from the appropriate New List View or List View Properties
window. The Font window, Figure 4-9, opens.
4-14 Creating and Editing List Views
Page 97

Figure 4-9. Font Window
List Views
Change your font settings as desired using the Fonts, Font Style, and Size fields, then
click on OK to set your changes.
Selecting the Nodes to Display: Using Filters
Using the View Filter window, you can set up filters that determine which of the nodes
stored in the central node database will be displayed in your list view. You can filter nodes
based on specific Subnet, Status Group, Enterprise, Class, and/or Topology attributes.
With the exception of the All Nodes List View, the default views provided by NetSight
NOTE
Element Manager were created with the use of filters. For example, the Cabletron
Devices View filters out all devices except Cabletron and Enterasys devices.
Remember, you can edit any of the default views except the All Nodes List view; the
default views can also serve as models to help you create your own custom views.
To open the View Filter window:
1. Click on Filter from the New List View or List View Properties window. The
View Filter window, Figure 4-10, opens.
Creating and Editing List Views 4-15
Page 98

List Views
The check boxes above
the filter categories allow
you to either select or
de-select all of the specific
attributes listed. You must
leave at least one attribute
selected in each category.
Figure 4-10. View Filter Window
Filter Categories
TIP
Available filter categories are:
Subnets
NetSight Element Manager automatically creates a subnet entry each time a node is added
to the database; subnet entries can also be defined via the Discover application and/or via
the View—>Subnets option in the primary window menu bar. All subnets which have
been created will be displayed in this list box; use this list to select the subnets whose
nodes you wish to display in your list view.
See Chapter 3, Discovering Nodes, for more information on creating and using subnet
entries.
Status Groups
Any DLM Status Groups you have created will be displayed in this list box. You can
choose to display only those nodes which are part of one or more selected status groups, or
those which are part of any defined status group.
Enterprises
The Enterprise category allows you to filter nodes by hardware or software manufacturer.
The vendor codes available for filtering are Cabletron, 3Com, Cisco Systems, Novell,
Silicon Graphics, IBM, Sun Microsystems, Hewlett-Packard, Microsoft, Xyplex, Cayman,
Digital, Compaq, and Enterasys. You can also choose to filter on nodes whose vendor
code is unknown.
4-16 Creating and Editing List Views
Page 99

List Views
Classes
Lists the functional classes that NetSight Element Manager can detect. Classes available
for filtering include:
• Repeater • Router • Generic Bridge
• Router/Gateway • Ethernet/Token Ring Bridge • Switch
• Ethernet/FDDI Bridge • Ethernet/WAN Bridge • PBX
• Multi-Topology Bridge • FDDI Concentrator • Terminal Server
• Server • ATM
Nodes which support more than one functional class will be displayed in any view for
which one of its classes is selected. You can also choose to filter on nodes whose
functional class is unknown.
Topologies
Lists the topologies that NetSight Element Manager will recognize. Topologies listed
include:
• Regular 1822 • HDH 1822 • Local Talk
• RFC 877 X.25 • Ethernet CSMACD • ISO 8802.3
• ISO 8802.6 MAN • ISO 88022 LLC • 3 Mbit Ethernet
• StarLAN • Token Bus • Token Ring
• HyperChannel • FDDI • Lap B
•T1 •T-3 •E1
• Basic ISDN • Primary ISDN • PPP
•Serial Line IP •CLNP/IP •XNS/IP
• Software Loopback • Ultra Tech • SMDS
• Proteon 80Mbit • Proteon 10Mbit • ATM
• AAL5 over ATM • RS-232 • Parallel Port
• Arcnet • Arcnet Plus • SMDS DXI
• SONET • SONET Path • SONET VT
•SDLC •V.35 •Frame Relay
• Frame Relay Service • HIPPI • HSSI
• X.25 • Proprietary Multiplexing • X25PLE
• M10X25 • Proprietary Virtual/Internal • Generic Modem
• Proprietary PPP Serial • SMDS Intercarrier Interface • Other
Creating and Editing List Views 4-17
Page 100

List Views
Creating the Filter
TIP
As with classes, nodes which support more than one topology will be displayed in any
view for which one of its topologies is selected. You can also choose to filter on nodes
whose topology is unknown.
When you create a filter, you select the specific attributes in each category that define the
nodes you want to display, and de-select the attributes that define nodes you do not want
to display. Filter categories are linked by logical ANDs, and attributes within categories
are linked by logical ORs; this means that, in order to be displayed in a filtered view, a
node must match at least one selected attribute in each category. You must leave at least
one attribute selected in each category.
To specify a view filter:
1. In each filter category list box, click on the check box next to the specific
attribute to include or exclude associated nodes from the list view.
You can also use the select and deselect check boxes located above each filter category
list box to either select or deselect all of its specific attributes; remember, however, that
you must leave at least one attribute selected in each category in order to create your
filter.
2. Click on OK to set the filter parameters.
Once you have finished configuring all of the parameters for your list view, click OK in
the New List View window or List View Properties window to create the new list view or
modify an existing view.
Excluded Nodes
NetSight Element Manager’s architecture — which stores all node information in a central
database, and lets you choose how to view it — provides you with great flexibility in the
management and storage of node information. One of the ways you can manage your
collected node information is through the use of Excluded Nodes. There are two levels of
node exclusion: exclusion from an individual view, and exclusion from all views.
Excluding Nodes from an Individual View
Excluding a node from an individual List, Tree, or Map View removes that node from the
selected view only — the node’s information is still stored in the central node database,
and it will be displayed as appropriate in other views. For a map view, excluding a node
from the current (or active) view simply removes the icon from the map; no record of that
node’s former place on the map is maintained. For a List View or Tree View, however,
excluding a node from the active view places it on a special excluded nodes list associated
with the selected view. This list is displayed in the view’s Properties window, as
4-18 Excluded Nodes
 Loading...