

Page 1

GE
Sensing
Optica
General Eastern Dew Point Analyzer
Operator’s Manual
Page 2
GE
Sensing
Optica
General Eastern Dew Point Analyzer
Operator’s Manual
A40238752C
January 2006
The Optica Dew Point Analyzer is a General Eastern Instruments product. General Eastern Instruments has
joined other GE high-technology sensing businesses under a new name—GE Sensing.
Page 3

January 2006
Warranty Each instrument manufactured by GE Infrastructure Sensing is
warranted to be free from defects in material and workmanship. Liability
under this warranty is limited to restoring the instrument to normal
operation or replacing the instrument, at the sole discretion of GE
Infrastructure Sensing. Fuses and batteries are specifically excluded
from any liability. This warranty is effective from the date of delivery to
the original purchaser. If GE Infrastructure Sensing determines that the
equipment was defective, the warranty period is:
• one year for general electronic failures of the instrument
• one year for mechanical failures of the sensor
If GE Infrastructure Sensing determines that the equipment was damaged
by misuse, improper installation, the use of unauthorized replacement
parts, or operating conditions outside the guidelines specified by GE
Infrastructure Sensing, the repairs are not covered under this warranty.
The warranties set forth herein are exclusive and are in lieu of
all other warranties whether statutory, express or implied
(including warranties or merchantability and fitness for a
particular purpose, and warranties arising from course of
dealing or usage or trade).
Return Policy If a GE Infrastructure Sensing instrument malfunctions within the
warranty period, the following procedure must be completed:
1. Notify GE Infrastructure Sensing, giving full details of the problem,
and provide the model number and serial number of the instrument. If
the nature of the problem indicates the need for factory service, GE
Infrastructure Sensing will issue a RETURN AUTHORIZATION
number (RA), and shipping instructions for the return of the
instrument to a service center will be provided.
2. If GE Infrastructure Sensing instructs you to send your instrument to
a service center, it must be shipped prepaid to the authorized repair
station indicated in the shipping instructions.
3. Upon receipt, GE Infrastructure Sensing will evaluate the instrument
to determine the cause of the malfunction.
Then, one of the following courses of action will then be taken:
• If the damage is covered under the terms of the warranty, the
instrument will be repaired at no cost to the owner and returned.
• If GE Infrastructure Sensing determines that the damage is not
covered under the terms of the warranty, or if the warranty has
expired, an estimate for the cost of the repairs at standard rates will be
provided. Upon receipt of the owner’s approval to proceed, the
instrument will be repaired and returned.
iii
Page 4

January 2006
Table of Contents
Chapter 1: Features and Capabilities
Introduction. . . . . . . . . . . . . . . . . . . . . . . . . . . . . . . . . . . . . . . . . . . . . . . . . . . . . . . . . . . . . . . . . . . . . . . . . . . . 1-1
Electronics Enclosure . . . . . . . . . . . . . . . . . . . . . . . . . . . . . . . . . . . . . . . . . . . . . . . . . . . . . . . . . . . . . . . . . . . 1-2
Front Panel. . . . . . . . . . . . . . . . . . . . . . . . . . . . . . . . . . . . . . . . . . . . . . . . . . . . . . . . . . . . . . . . . . . . . . . . . 1-2
Input/Output Capability . . . . . . . . . . . . . . . . . . . . . . . . . . . . . . . . . . . . . . . . . . . . . . . . . . . . . . . . . . . . . 1-3
The System . . . . . . . . . . . . . . . . . . . . . . . . . . . . . . . . . . . . . . . . . . . . . . . . . . . . . . . . . . . . . . . . . . . . . . . . . . . . 1-3
System Components. . . . . . . . . . . . . . . . . . . . . . . . . . . . . . . . . . . . . . . . . . . . . . . . . . . . . . . . . . . . . . . . 1-3
System Planning. . . . . . . . . . . . . . . . . . . . . . . . . . . . . . . . . . . . . . . . . . . . . . . . . . . . . . . . . . . . . . . . . . . . 1-3
Sensors . . . . . . . . . . . . . . . . . . . . . . . . . . . . . . . . . . . . . . . . . . . . . . . . . . . . . . . . . . . . . . . . . . . . . . . . . . . . . . . . 1-3
Dew Point Sensors. . . . . . . . . . . . . . . . . . . . . . . . . . . . . . . . . . . . . . . . . . . . . . . . . . . . . . . . . . . . . . . . . . 1-4
Temperature Sensor . . . . . . . . . . . . . . . . . . . . . . . . . . . . . . . . . . . . . . . . . . . . . . . . . . . . . . . . . . . . . . . . 1-4
Pressure Sensor . . . . . . . . . . . . . . . . . . . . . . . . . . . . . . . . . . . . . . . . . . . . . . . . . . . . . . . . . . . . . . . . . . . . 1-4
Theory of Operation . . . . . . . . . . . . . . . . . . . . . . . . . . . . . . . . . . . . . . . . . . . . . . . . . . . . . . . . . . . . . . . . . . . . 1-4
Hygrometer Function . . . . . . . . . . . . . . . . . . . . . . . . . . . . . . . . . . . . . . . . . . . . . . . . . . . . . . . . . . . . . . . 1-4
Hygrometer Calibration . . . . . . . . . . . . . . . . . . . . . . . . . . . . . . . . . . . . . . . . . . . . . . . . . . . . . . . . . . . . . 1-5
Other Hygrometer Applications . . . . . . . . . . . . . . . . . . . . . . . . . . . . . . . . . . . . . . . . . . . . . . . . . . . . . 1-6
The PACER Cycle. . . . . . . . . . . . . . . . . . . . . . . . . . . . . . . . . . . . . . . . . . . . . . . . . . . . . . . . . . . . . . . . . . . . . . . . 1-6
iv
Page 5

January 2006
Table of Contents (cont.)
Chapter 2: Installation
Introduction . . . . . . . . . . . . . . . . . . . . . . . . . . . . . . . . . . . . . . . . . . . . . . . . . . . . . . . . . . . . . . . . . . . . . . . . . . . 2-1
Benchtop Installation. . . . . . . . . . . . . . . . . . . . . . . . . . . . . . . . . . . . . . . . . . . . . . . . . . . . . . . . . . . . . . . . . . . 2-1
Mounting the Benchtop. . . . . . . . . . . . . . . . . . . . . . . . . . . . . . . . . . . . . . . . . . . . . . . . . . . . . . . . . . . . . 2-1
Using the Rack Mounting Option . . . . . . . . . . . . . . . . . . . . . . . . . . . . . . . . . . . . . . . . . . . . . . . . . . . . 2-2
Wiring the Benchtop. . . . . . . . . . . . . . . . . . . . . . . . . . . . . . . . . . . . . . . . . . . . . . . . . . . . . . . . . . . . . . . . 2-5
Wall-Mount Installation. . . . . . . . . . . . . . . . . . . . . . . . . . . . . . . . . . . . . . . . . . . . . . . . . . . . . . . . . . . . . . . . . 2-6
Mounting the Wall-Mount. . . . . . . . . . . . . . . . . . . . . . . . . . . . . . . . . . . . . . . . . . . . . . . . . . . . . . . . . . . 2-6
Wiring the Wall-Mount. . . . . . . . . . . . . . . . . . . . . . . . . . . . . . . . . . . . . . . . . . . . . . . . . . . . . . . . . . . . . . 2-7
Output Wiring. . . . . . . . . . . . . . . . . . . . . . . . . . . . . . . . . . . . . . . . . . . . . . . . . . . . . . . . . . . . . . . . . . . . . . . . . . 2-8
Analog Outputs . . . . . . . . . . . . . . . . . . . . . . . . . . . . . . . . . . . . . . . . . . . . . . . . . . . . . . . . . . . . . . . . . . . . 2-9
Alarm Outputs . . . . . . . . . . . . . . . . . . . . . . . . . . . . . . . . . . . . . . . . . . . . . . . . . . . . . . . . . . . . . . . . . . . . 2-10
Serial Output . . . . . . . . . . . . . . . . . . . . . . . . . . . . . . . . . . . . . . . . . . . . . . . . . . . . . . . . . . . . . . . . . . . . . . 2-12
Sensor Information. . . . . . . . . . . . . . . . . . . . . . . . . . . . . . . . . . . . . . . . . . . . . . . . . . . . . . . . . . . . . . . . . . . . 2-12
Sampling Lines . . . . . . . . . . . . . . . . . . . . . . . . . . . . . . . . . . . . . . . . . . . . . . . . . . . . . . . . . . . . . . . . . . . . 2-13
Ensuring Heat Transfer . . . . . . . . . . . . . . . . . . . . . . . . . . . . . . . . . . . . . . . . . . . . . . . . . . . . . . . . . . . . 2-14
High Dew Point Measurements . . . . . . . . . . . . . . . . . . . . . . . . . . . . . . . . . . . . . . . . . . . . . . . . . . . . 2-14
Filter Requirements. . . . . . . . . . . . . . . . . . . . . . . . . . . . . . . . . . . . . . . . . . . . . . . . . . . . . . . . . . . . . . . . 2-15
Flow Rate . . . . . . . . . . . . . . . . . . . . . . . . . . . . . . . . . . . . . . . . . . . . . . . . . . . . . . . . . . . . . . . . . . . . . . . . . 2-15
Sensor Installation . . . . . . . . . . . . . . . . . . . . . . . . . . . . . . . . . . . . . . . . . . . . . . . . . . . . . . . . . . . . . . . . . . . . 2-16
Model 1111H Sensor . . . . . . . . . . . . . . . . . . . . . . . . . . . . . . . . . . . . . . . . . . . . . . . . . . . . . . . . . . . . . . 2-16
Model D-2 Sensor . . . . . . . . . . . . . . . . . . . . . . . . . . . . . . . . . . . . . . . . . . . . . . . . . . . . . . . . . . . . . . . . . 2-16
Model 1311DR Sensor . . . . . . . . . . . . . . . . . . . . . . . . . . . . . . . . . . . . . . . . . . . . . . . . . . . . . . . . . . . . . 2-17
Model 1311XR Sensor . . . . . . . . . . . . . . . . . . . . . . . . . . . . . . . . . . . . . . . . . . . . . . . . . . . . . . . . . . . . . 2-18
Model SIM-12H Heated Sensor and Components . . . . . . . . . . . . . . . . . . . . . . . . . . . . . . . . . . . 2-20
Connecting the Sensors . . . . . . . . . . . . . . . . . . . . . . . . . . . . . . . . . . . . . . . . . . . . . . . . . . . . . . . . . . . 2-21
v
Page 6

January 2006
Table of Contents (cont.)
Chapter 3: Operation
Introduction. . . . . . . . . . . . . . . . . . . . . . . . . . . . . . . . . . . . . . . . . . . . . . . . . . . . . . . . . . . . . . . . . . . . . . . . . . . . 3-1
Normal Operation . . . . . . . . . . . . . . . . . . . . . . . . . . . . . . . . . . . . . . . . . . . . . . . . . . . . . . . . . . . . . . . . . . . . . . 3-1
Operating the VGA Optica. . . . . . . . . . . . . . . . . . . . . . . . . . . . . . . . . . . . . . . . . . . . . . . . . . . . . . . . . . . . . . . 3-2
Operating the 4x40 Optica . . . . . . . . . . . . . . . . . . . . . . . . . . . . . . . . . . . . . . . . . . . . . . . . . . . . . . . . . . . . . . 3-3
Network Operation . . . . . . . . . . . . . . . . . . . . . . . . . . . . . . . . . . . . . . . . . . . . . . . . . . . . . . . . . . . . . . . . . . . . . 3-3
Process Pressure . . . . . . . . . . . . . . . . . . . . . . . . . . . . . . . . . . . . . . . . . . . . . . . . . . . . . . . . . . . . . . . . . . . . . . . 3-4
Actively Measuring Process Pressure . . . . . . . . . . . . . . . . . . . . . . . . . . . . . . . . . . . . . . . . . . . . . . . . 3-4
Manually Entering Pressure . . . . . . . . . . . . . . . . . . . . . . . . . . . . . . . . . . . . . . . . . . . . . . . . . . . . . . . . . 3-4
Measuring at a Different Pressure . . . . . . . . . . . . . . . . . . . . . . . . . . . . . . . . . . . . . . . . . . . . . . . . . . . 3-4
Scenario 1: Measurement Without Enabling the Process Pressure Feature. . . . . . . . . . . . . 3-5
Scenario 2: Measurement Requiring the Process Pressure Feature . . . . . . . . . . . . . . . . . . . . 3-6
Status Line Indications. . . . . . . . . . . . . . . . . . . . . . . . . . . . . . . . . . . . . . . . . . . . . . . . . . . . . . . . . . . . . . . . . . 3-8
Factory Default Settings . . . . . . . . . . . . . . . . . . . . . . . . . . . . . . . . . . . . . . . . . . . . . . . . . . . . . . . . . . . . 3-9
Sensor Balancing. . . . . . . . . . . . . . . . . . . . . . . . . . . . . . . . . . . . . . . . . . . . . . . . . . . . . . . . . . . . . . . . . . . . . .3-10
Helpful Hints For Operating the Unit . . . . . . . . . . . . . . . . . . . . . . . . . . . . . . . . . . . . . . . . . . . . . . . . . . . . 3-10
Supercooled Dew Points . . . . . . . . . . . . . . . . . . . . . . . . . . . . . . . . . . . . . . . . . . . . . . . . . . . . . . . . . . . 3-11
Contamination . . . . . . . . . . . . . . . . . . . . . . . . . . . . . . . . . . . . . . . . . . . . . . . . . . . . . . . . . . . . . . . . . . . . 3-11
Mirror Flooding . . . . . . . . . . . . . . . . . . . . . . . . . . . . . . . . . . . . . . . . . . . . . . . . . . . . . . . . . . . . . . . . . . . . 3-13
Sample Line Maintenance. . . . . . . . . . . . . . . . . . . . . . . . . . . . . . . . . . . . . . . . . . . . . . . . . . . . . . . . . .3-13
Pressure Effects . . . . . . . . . . . . . . . . . . . . . . . . . . . . . . . . . . . . . . . . . . . . . . . . . . . . . . . . . . . . . . . . . . . 3-13
vi
Page 7

January 2006
Table of Contents (cont.)
Chapter 4: Programming the VGA Optica
Introduction . . . . . . . . . . . . . . . . . . . . . . . . . . . . . . . . . . . . . . . . . . . . . . . . . . . . . . . . . . . . . . . . . . . . . . . . . . . 4-1
Programming Fundamentals . . . . . . . . . . . . . . . . . . . . . . . . . . . . . . . . . . . . . . . . . . . . . . . . . . . . . . . . . . . 4-1
The Keys . . . . . . . . . . . . . . . . . . . . . . . . . . . . . . . . . . . . . . . . . . . . . . . . . . . . . . . . . . . . . . . . . . . . . . . . . . . 4-2
Data Entry Fields . . . . . . . . . . . . . . . . . . . . . . . . . . . . . . . . . . . . . . . . . . . . . . . . . . . . . . . . . . . . . . . . . . . 4-2
Units of Measure . . . . . . . . . . . . . . . . . . . . . . . . . . . . . . . . . . . . . . . . . . . . . . . . . . . . . . . . . . . . . . . . . . . . . . . 4-4
User Equations. . . . . . . . . . . . . . . . . . . . . . . . . . . . . . . . . . . . . . . . . . . . . . . . . . . . . . . . . . . . . . . . . . . . . . . . . 4-4
Menu 1 . . . . . . . . . . . . . . . . . . . . . . . . . . . . . . . . . . . . . . . . . . . . . . . . . . . . . . . . . . . . . . . . . . . . . . . . . . . . . . . . 4-6
Analog Outputs . . . . . . . . . . . . . . . . . . . . . . . . . . . . . . . . . . . . . . . . . . . . . . . . . . . . . . . . . . . . . . . . . . . . 4-6
Pressure Input. . . . . . . . . . . . . . . . . . . . . . . . . . . . . . . . . . . . . . . . . . . . . . . . . . . . . . . . . . . . . . . . . . . . . . 4-7
Alarms . . . . . . . . . . . . . . . . . . . . . . . . . . . . . . . . . . . . . . . . . . . . . . . . . . . . . . . . . . . . . . . . . . . . . . . . . . . . . 4-8
Automatic Cleaning and Balance Function. . . . . . . . . . . . . . . . . . . . . . . . . . . . . . . . . . . . . . . . . . . 4-9
Data Fields. . . . . . . . . . . . . . . . . . . . . . . . . . . . . . . . . . . . . . . . . . . . . . . . . . . . . . . . . . . . . . . . . . . . . . . . 4-11
Buzzer/Sound . . . . . . . . . . . . . . . . . . . . . . . . . . . . . . . . . . . . . . . . . . . . . . . . . . . . . . . . . . . . . . . . . . . . . 4-11
Network Menu . . . . . . . . . . . . . . . . . . . . . . . . . . . . . . . . . . . . . . . . . . . . . . . . . . . . . . . . . . . . . . . . . . . . 4-12
Datalog . . . . . . . . . . . . . . . . . . . . . . . . . . . . . . . . . . . . . . . . . . . . . . . . . . . . . . . . . . . . . . . . . . . . . . . . . . . 4-13
Download Screen . . . . . . . . . . . . . . . . . . . . . . . . . . . . . . . . . . . . . . . . . . . . . . . . . . . . . . . . . . . . . . . . . 4-14
Menu 2 . . . . . . . . . . . . . . . . . . . . . . . . . . . . . . . . . . . . . . . . . . . . . . . . . . . . . . . . . . . . . . . . . . . . . . . . . . . . . . . 4-15
General . . . . . . . . . . . . . . . . . . . . . . . . . . . . . . . . . . . . . . . . . . . . . . . . . . . . . . . . . . . . . . . . . . . . . . . . . . . 4-16
Special. . . . . . . . . . . . . . . . . . . . . . . . . . . . . . . . . . . . . . . . . . . . . . . . . . . . . . . . . . . . . . . . . . . . . . . . . . . . 4-16
User Equation . . . . . . . . . . . . . . . . . . . . . . . . . . . . . . . . . . . . . . . . . . . . . . . . . . . . . . . . . . . . . . . . . . . . . 4-16
Communication Parameters . . . . . . . . . . . . . . . . . . . . . . . . . . . . . . . . . . . . . . . . . . . . . . . . . . . . . . . 4-17
Serial Output Data. . . . . . . . . . . . . . . . . . . . . . . . . . . . . . . . . . . . . . . . . . . . . . . . . . . . . . . . . . . . . . . . . 4-18
Set Time & Date . . . . . . . . . . . . . . . . . . . . . . . . . . . . . . . . . . . . . . . . . . . . . . . . . . . . . . . . . . . . . . . . . . . 4-19
Restore Defaults. . . . . . . . . . . . . . . . . . . . . . . . . . . . . . . . . . . . . . . . . . . . . . . . . . . . . . . . . . . . . . . . . . . 4-19
Saving Configuration Files . . . . . . . . . . . . . . . . . . . . . . . . . . . . . . . . . . . . . . . . . . . . . . . . . . . . . . . . . . . . . 4-20
vii
Page 8

January 2006
Table of Contents (cont.)
Chapter 5: Programming the 4x40 Optica
Introduction. . . . . . . . . . . . . . . . . . . . . . . . . . . . . . . . . . . . . . . . . . . . . . . . . . . . . . . . . . . . . . . . . . . . . . . . . . . . 5-1
Programming Technique. . . . . . . . . . . . . . . . . . . . . . . . . . . . . . . . . . . . . . . . . . . . . . . . . . . . . . . . . . . . . . . . 5-2
Programmable Functions . . . . . . . . . . . . . . . . . . . . . . . . . . . . . . . . . . . . . . . . . . . . . . . . . . . . . . . . . . . . . . . 5-4
Analog Outputs. . . . . . . . . . . . . . . . . . . . . . . . . . . . . . . . . . . . . . . . . . . . . . . . . . . . . . . . . . . . . . . . . . . . . 5-4
Communication Parameters . . . . . . . . . . . . . . . . . . . . . . . . . . . . . . . . . . . . . . . . . . . . . . . . . . . . . . . . 5-4
Serial Output Units. . . . . . . . . . . . . . . . . . . . . . . . . . . . . . . . . . . . . . . . . . . . . . . . . . . . . . . . . . . . . . . . . . 5-5
Serial Output Setup . . . . . . . . . . . . . . . . . . . . . . . . . . . . . . . . . . . . . . . . . . . . . . . . . . . . . . . . . . . . . . . . . 5-5
Alarms . . . . . . . . . . . . . . . . . . . . . . . . . . . . . . . . . . . . . . . . . . . . . . . . . . . . . . . . . . . . . . . . . . . . . . . . . . . . . 5-6
Data Fields . . . . . . . . . . . . . . . . . . . . . . . . . . . . . . . . . . . . . . . . . . . . . . . . . . . . . . . . . . . . . . . . . . . . . . . . . 5-7
Pressure Input. . . . . . . . . . . . . . . . . . . . . . . . . . . . . . . . . . . . . . . . . . . . . . . . . . . . . . . . . . . . . . . . . . . . . . 5-7
Automatic Cleaning and Balance Function . . . . . . . . . . . . . . . . . . . . . . . . . . . . . . . . . . . . . . . . . . . 5-8
Buzzer and Sounds . . . . . . . . . . . . . . . . . . . . . . . . . . . . . . . . . . . . . . . . . . . . . . . . . . . . . . . . . . . . . . . . 5-11
General Settings. . . . . . . . . . . . . . . . . . . . . . . . . . . . . . . . . . . . . . . . . . . . . . . . . . . . . . . . . . . . . . . . . . . 5-11
User Equations . . . . . . . . . . . . . . . . . . . . . . . . . . . . . . . . . . . . . . . . . . . . . . . . . . . . . . . . . . . . . . . . . . . . 5-11
Set Time and Date . . . . . . . . . . . . . . . . . . . . . . . . . . . . . . . . . . . . . . . . . . . . . . . . . . . . . . . . . . . . . . . . . 5-12
Special . . . . . . . . . . . . . . . . . . . . . . . . . . . . . . . . . . . . . . . . . . . . . . . . . . . . . . . . . . . . . . . . . . . . . . . . . . . .5-12
User Default Settings . . . . . . . . . . . . . . . . . . . . . . . . . . . . . . . . . . . . . . . . . . . . . . . . . . . . . . . . . . . . . .5-12
Factory Calibrations . . . . . . . . . . . . . . . . . . . . . . . . . . . . . . . . . . . . . . . . . . . . . . . . . . . . . . . . . . . . . . .5-12
Chapter 6: Network-Based Programming
Introduction. . . . . . . . . . . . . . . . . . . . . . . . . . . . . . . . . . . . . . . . . . . . . . . . . . . . . . . . . . . . . . . . . . . . . . . . . . . . 6-1
Programming Screens . . . . . . . . . . . . . . . . . . . . . . . . . . . . . . . . . . . . . . . . . . . . . . . . . . . . . . . . . . . . . . . . . . 6-1
Chapter 7: Maintenance
Minor Maintenance of Sensor Optics . . . . . . . . . . . . . . . . . . . . . . . . . . . . . . . . . . . . . . . . . . . . . . . . . . . . 7-1
Cleaning the Sensor Mirror . . . . . . . . . . . . . . . . . . . . . . . . . . . . . . . . . . . . . . . . . . . . . . . . . . . . . . . . . . 7-1
Balancing the Sensor Optics . . . . . . . . . . . . . . . . . . . . . . . . . . . . . . . . . . . . . . . . . . . . . . . . . . . . . . . . 7-2
Field Replacement of Sensor Mirrors . . . . . . . . . . . . . . . . . . . . . . . . . . . . . . . . . . . . . . . . . . . . . . . . . . . . 7-4
Replacing the Sensor Mirror . . . . . . . . . . . . . . . . . . . . . . . . . . . . . . . . . . . . . . . . . . . . . . . . . . . . . . . . . 7-5
Test and Calibration . . . . . . . . . . . . . . . . . . . . . . . . . . . . . . . . . . . . . . . . . . . . . . . . . . . . . . . . . . . . . . . . . . . . 7-6
Troubleshooting. . . . . . . . . . . . . . . . . . . . . . . . . . . . . . . . . . . . . . . . . . . . . . . . . . . . . . . . . . . . . . . . . . . . . . . . 7-6
The Display Doesn’t Light Up . . . . . . . . . . . . . . . . . . . . . . . . . . . . . . . . . . . . . . . . . . . . . . . . . . . . . . . . 7-6
“Service” Appears on the STATUS Display Line. . . . . . . . . . . . . . . . . . . . . . . . . . . . . . . . . . . . . . . . 7-6
Incorrect Dew Point Display . . . . . . . . . . . . . . . . . . . . . . . . . . . . . . . . . . . . . . . . . . . . . . . . . . . . . . . . . 7-7
“Balance” Remains on the Status Line . . . . . . . . . . . . . . . . . . . . . . . . . . . . . . . . . . . . . . . . . . . . . . . 7-8
No Analog Output . . . . . . . . . . . . . . . . . . . . . . . . . . . . . . . . . . . . . . . . . . . . . . . . . . . . . . . . . . . . . . . . . . 7-8
No Serial Output. . . . . . . . . . . . . . . . . . . . . . . . . . . . . . . . . . . . . . . . . . . . . . . . . . . . . . . . . . . . . . . . . . . . 7-8
viii
Page 9

January 2006
Table of Contents (cont.)
Appendix A: Specifications
Performance. . . . . . . . . . . . . . . . . . . . . . . . . . . . . . . . . . . . . . . . . . . . . . . . . . . . . . . . . . . . . . . . . . . . . . . . . . . A-1
Accuracy. . . . . . . . . . . . . . . . . . . . . . . . . . . . . . . . . . . . . . . . . . . . . . . . . . . . . . . . . . . . . . . . . . . . . . . . . . . A-1
Measurement Ranges . . . . . . . . . . . . . . . . . . . . . . . . . . . . . . . . . . . . . . . . . . . . . . . . . . . . . . . . . . . . . . A-1
Response Time . . . . . . . . . . . . . . . . . . . . . . . . . . . . . . . . . . . . . . . . . . . . . . . . . . . . . . . . . . . . . . . . . . . . . A-1
Functionality . . . . . . . . . . . . . . . . . . . . . . . . . . . . . . . . . . . . . . . . . . . . . . . . . . . . . . . . . . . . . . . . . . . . . . . . . . . A-2
Alarms . . . . . . . . . . . . . . . . . . . . . . . . . . . . . . . . . . . . . . . . . . . . . . . . . . . . . . . . . . . . . . . . . . . . . . . . . . . . . A-2
Operating ranges . . . . . . . . . . . . . . . . . . . . . . . . . . . . . . . . . . . . . . . . . . . . . . . . . . . . . . . . . . . . . . . . . . A-2
Physical (bench mount) . . . . . . . . . . . . . . . . . . . . . . . . . . . . . . . . . . . . . . . . . . . . . . . . . . . . . . . . . . . . . . . . . A-2
Physical (wall mount) . . . . . . . . . . . . . . . . . . . . . . . . . . . . . . . . . . . . . . . . . . . . . . . . . . . . . . . . . . . . . . . . . . . A-2
Optional Accessories . . . . . . . . . . . . . . . . . . . . . . . . . . . . . . . . . . . . . . . . . . . . . . . . . . . . . . . . . . . . . . . . . . . A-3
Appendix B: Humidity Equations and Conversion Chart
Introduction . . . . . . . . . . . . . . . . . . . . . . . . . . . . . . . . . . . . . . . . . . . . . . . . . . . . . . . . . . . . . . . . . . . . . . . . . . . B-1
Vapor Pressure. . . . . . . . . . . . . . . . . . . . . . . . . . . . . . . . . . . . . . . . . . . . . . . . . . . . . . . . . . . . . . . . . . . . . . . . . B-1
Humidity. . . . . . . . . . . . . . . . . . . . . . . . . . . . . . . . . . . . . . . . . . . . . . . . . . . . . . . . . . . . . . . . . . . . . . . . . . . . . . . B-2
Appendix C: Configuring the Serial Interface
Wiring to a Personal Computer . . . . . . . . . . . . . . . . . . . . . . . . . . . . . . . . . . . . . . . . . . . . . . . . . . . . . . . . . C-1
Appendix D: Chilled Mirror Sensors
Introduction . . . . . . . . . . . . . . . . . . . . . . . . . . . . . . . . . . . . . . . . . . . . . . . . . . . . . . . . . . . . . . . . . . . . . . . . . . . D-1
Depression. . . . . . . . . . . . . . . . . . . . . . . . . . . . . . . . . . . . . . . . . . . . . . . . . . . . . . . . . . . . . . . . . . . . . . . . . . . . . D-1
Measurement Range . . . . . . . . . . . . . . . . . . . . . . . . . . . . . . . . . . . . . . . . . . . . . . . . . . . . . . . . . . . . . . . . . . . D-2
Comparing Optica Models . . . . . . . . . . . . . . . . . . . . . . . . . . . . . . . . . . . . . . . . . . . . . . . . . . . . . . . . . . . . . . D-3
Appendix E: Glossary
Appendix F: Automatic Balance (for earlier software versions)
Programming Automatic Balance for a VGA Optica . . . . . . . . . . . . . . . . . . . . . . . . . . . . . . . . . . . . . . F-1
Programming Automatic Balance for a 4x40 Optica . . . . . . . . . . . . . . . . . . . . . . . . . . . . . . . . . . . . . F-1
ix
Page 10

January 2006
Table of Contents (cont.)
Appendix G: Communicating with the OPTICA Using Ethernet
Direct Communication. . . . . . . . . . . . . . . . . . . . . . . . . . . . . . . . . . . . . . . . . . . . . . . . . . . . . . . . . . . . . . . . . .G-1
Computer Communication. . . . . . . . . . . . . . . . . . . . . . . . . . . . . . . . . . . . . . . . . . . . . . . . . . . . . . . . . . . . . . G-1
Determining the Available Commands. . . . . . . . . . . . . . . . . . . . . . . . . . . . . . . . . . . . . . . . . . . . . . . G-2
Retrieving the Alarm Settings. . . . . . . . . . . . . . . . . . . . . . . . . . . . . . . . . . . . . . . . . . . . . . . . . . . . . . . . G-3
Retrieving the Alarm Types. . . . . . . . . . . . . . . . . . . . . . . . . . . . . . . . . . . . . . . . . . . . . . . . . . . . . . . . . . G-4
Retrieving Supported Units. . . . . . . . . . . . . . . . . . . . . . . . . . . . . . . . . . . . . . . . . . . . . . . . . . . . . . . . . . G-5
Retrieving Labels and Functions. . . . . . . . . . . . . . . . . . . . . . . . . . . . . . . . . . . . . . . . . . . . . . . . . . . . . G-6
Retrieving Analog Output Information . . . . . . . . . . . . . . . . . . . . . . . . . . . . . . . . . . . . . . . . . . . . . . .G-8
Retrieving the Measured and Calculated Values. . . . . . . . . . . . . . . . . . . . . . . . . . . . . . . . . . . . . . G-8
4X40 Optica Configuration . . . . . . . . . . . . . . . . . . . . . . . . . . . . . . . . . . . . . . . . . . . . . . . . . . . . . . . . .G-10
x
Page 11

Chapter 1
Page 12

Features and Capabilities
Introduction. . . . . . . . . . . . . . . . . . . . . . . . . . . . . . . . . . . . . . . . . . . . . . . . . . . . 1-1
Electronics Enclosure . . . . . . . . . . . . . . . . . . . . . . . . . . . . . . . . . . . . . . . . . . . 1-2
The System . . . . . . . . . . . . . . . . . . . . . . . . . . . . . . . . . . . . . . . . . . . . . . . . . . . . 1-3
Sensors . . . . . . . . . . . . . . . . . . . . . . . . . . . . . . . . . . . . . . . . . . . . . . . . . . . . . . . . 1-3
Theory of Operation . . . . . . . . . . . . . . . . . . . . . . . . . . . . . . . . . . . . . . . . . . . . 1-4
The PACER Cycle. . . . . . . . . . . . . . . . . . . . . . . . . . . . . . . . . . . . . . . . . . . . . . . . 1-6
Page 13

Introduction The GE Infrastructure Sensing Optica is a multi-purpose
chilled-mirror hygrometer, suitable for use in a wide variety of
applications. The Optica can function with any GE Infrastructure
Sensing chilled-mirror sensor to provide the following measurement
ranges (depending on the sensor selected):
• dew/frost point from –80°C to +85°C (–112°F to +185°F)
• relative humidity from 0.002% to 100%
January 2006
• moisture content from 500 ppb
The Optica also measures and displays gas pressure using a GE
Infrastructure Sensing PT-30A or PT-300A pressure sensor, or a
user-supplied 4–20mA or 0–5 VDC pressure sensor.
Note: If the pressure is known to be constant, a fixed pressure can be
programmed, eliminating the need for a pressure sensor.
Using the Optica, you can simultaneously measure and display dew
point, temperature and pressure, with a wide variety of units of
measure. The Optica is Ethernet-ready, so you can access the unit
using the Internet for remote monitoring applications. You can use the
data logging function to record and upload weeks of data.
to over 5.71 × 10⁵ ppm
v
v
Features and Capabilities 1-1
Page 14
January 2006
Electronics Enclosure The Optica is available in two configurations:
• a benchtop model, with an optional rack-mount adapter available
• a wall-mount unit, housed in a NEMA-4 enclosure, suitable for
industrial environments
See Chapter 2, Installation, for details on how to mount the Optica.
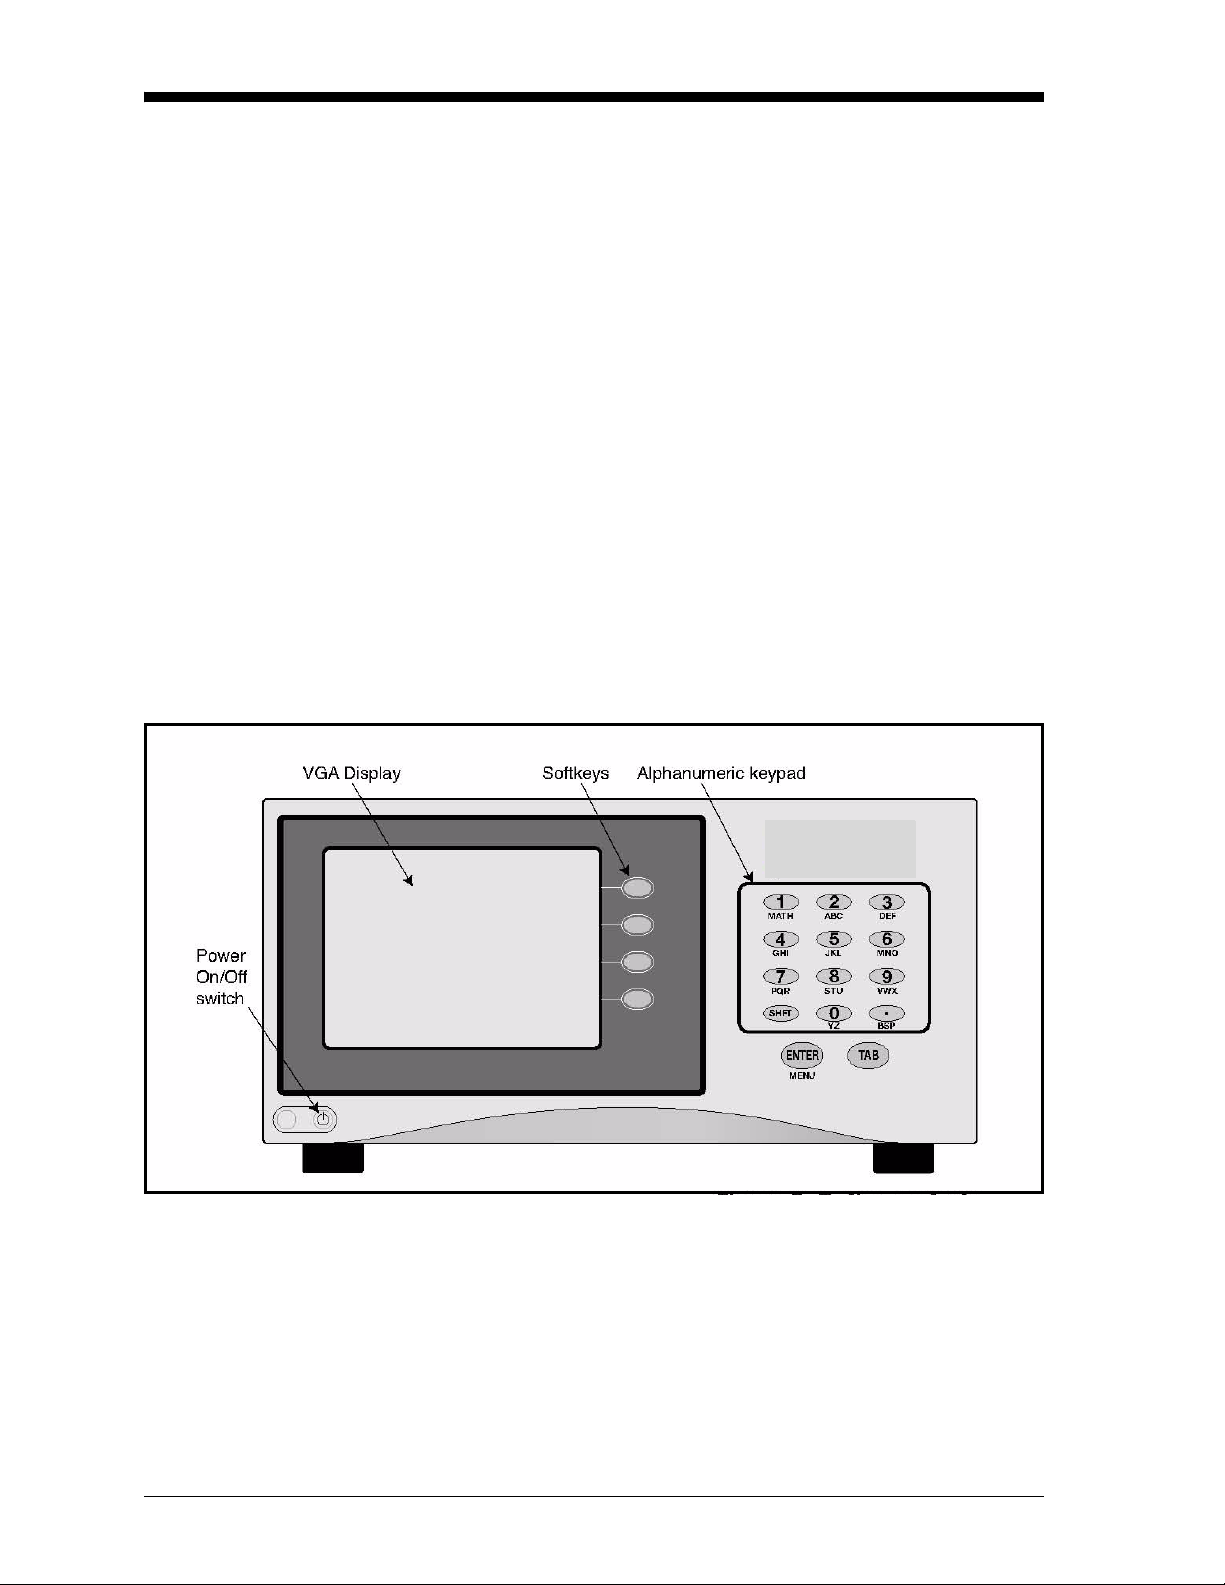
Front Panel The Optica’s front panel is shown in Figure 1-1 below. The panel
includes: a display, an alphanumeric keypad for data entry, ENTER
and TAB keys, and four softkeys to the right of the display screen.
Two display options are available:
• a high-resolution full-color liquid crystal display (LCD) with data
graphing and on-screen programming capability (referred to as the
“VGA” unit). See Figure 1-1 below.
• a 4-line by 40-character alphanumeric display (referred to as the
“4x40” unit).
Figure 1-1: Optica Benchtop Version with VGA Display
1-2 Features and Capabilities
Page 15

Input/Output Capability Available inputs and outputs include the following:
• 4-wire Resistance Temperature Detector (RTD) input
• 4–20 mA and 0–5 VDC Pressure Sensor inputs
• two simultaneous analog outputs, each with 4–20 mA and 0–5
VDC capability
• two independent alarm relays (Form C, 5 Amp)
• serial communications port
• Ethernet 10BaseT (on VGA Optica only)
The Optica uses the GE Infrastructure Sensing patented
Programmable Automatic Contaminant Error Reduction (PACER)
system to insure measurement accuracy.
Detailed specifications for the Optica are given in Appendix A.
January 2006
The System
System Components A complete Optica system consists of the following items:
• Electronic monitor • Temperature sensor (optional)
• Dew point sensor • Pressure sensor (optional)
• Interconnecting sensor cable • Maintenance kit
• AC line cord • User’s Manual
• Certification that the unit is traceable to the National Institute
of Standards and Technology (Certificate of Conformance)
System Planning The Optica can be used for a wide variety of measurement
applications, including the measurement of dew points of gasses that
are at pressures that exceed the measurement range of GEI’s sensors.
In this situation be sure to check the section Process Pressure on
page 3-4 for installation planning.
Sensors The Optica can be configured with a chilled-mirror dew point sensor.
The specific sensor is chosen according to the expected dew point
range and the environment in which the dew point is to be
determined. In addition, the Optica can be configured with a
temperature and/or pressure sensor. GE Infrastructure Sensing
provides the following sensors for various applications:
Features and Capabilities 1-3
Page 16

January 2006
Dew Point Sensors • Model 1111H — Single-stage sensor
• Model 1211H — Two-stage sensor; high pressure and temperature
• Model D-2 — Two-stage sensor
• Model SIM-12H — Two-stage heated sensor
• Model 1311DR — Four-stage, liquid or air cooled sensor
• Model 1311XR — Five-stage, liquid cooled sensor
Temperature Sensor • Model T-100E
Pressure Sensor • Model PT-30A or PT-300A
Theory of Operation Optical condensation hygrometry is a precise technique for
determining the water vapor content in gases by directly measuring
dew point or frost temperatures. Using this technique, a metallic
mirror is cooled until it reaches a temperature at which a thin layer of
condensation begins to form on it. The dew layer is detected optically,
and the mirror is held at that temperature. The mirror temperature,
measured with a platinum resistance thermometer, is an accurate
indicator of the dew or frost point. Because these hygrometers are so
accurate, they are widely used as a standard in many of the world’s
metrology laboratories.
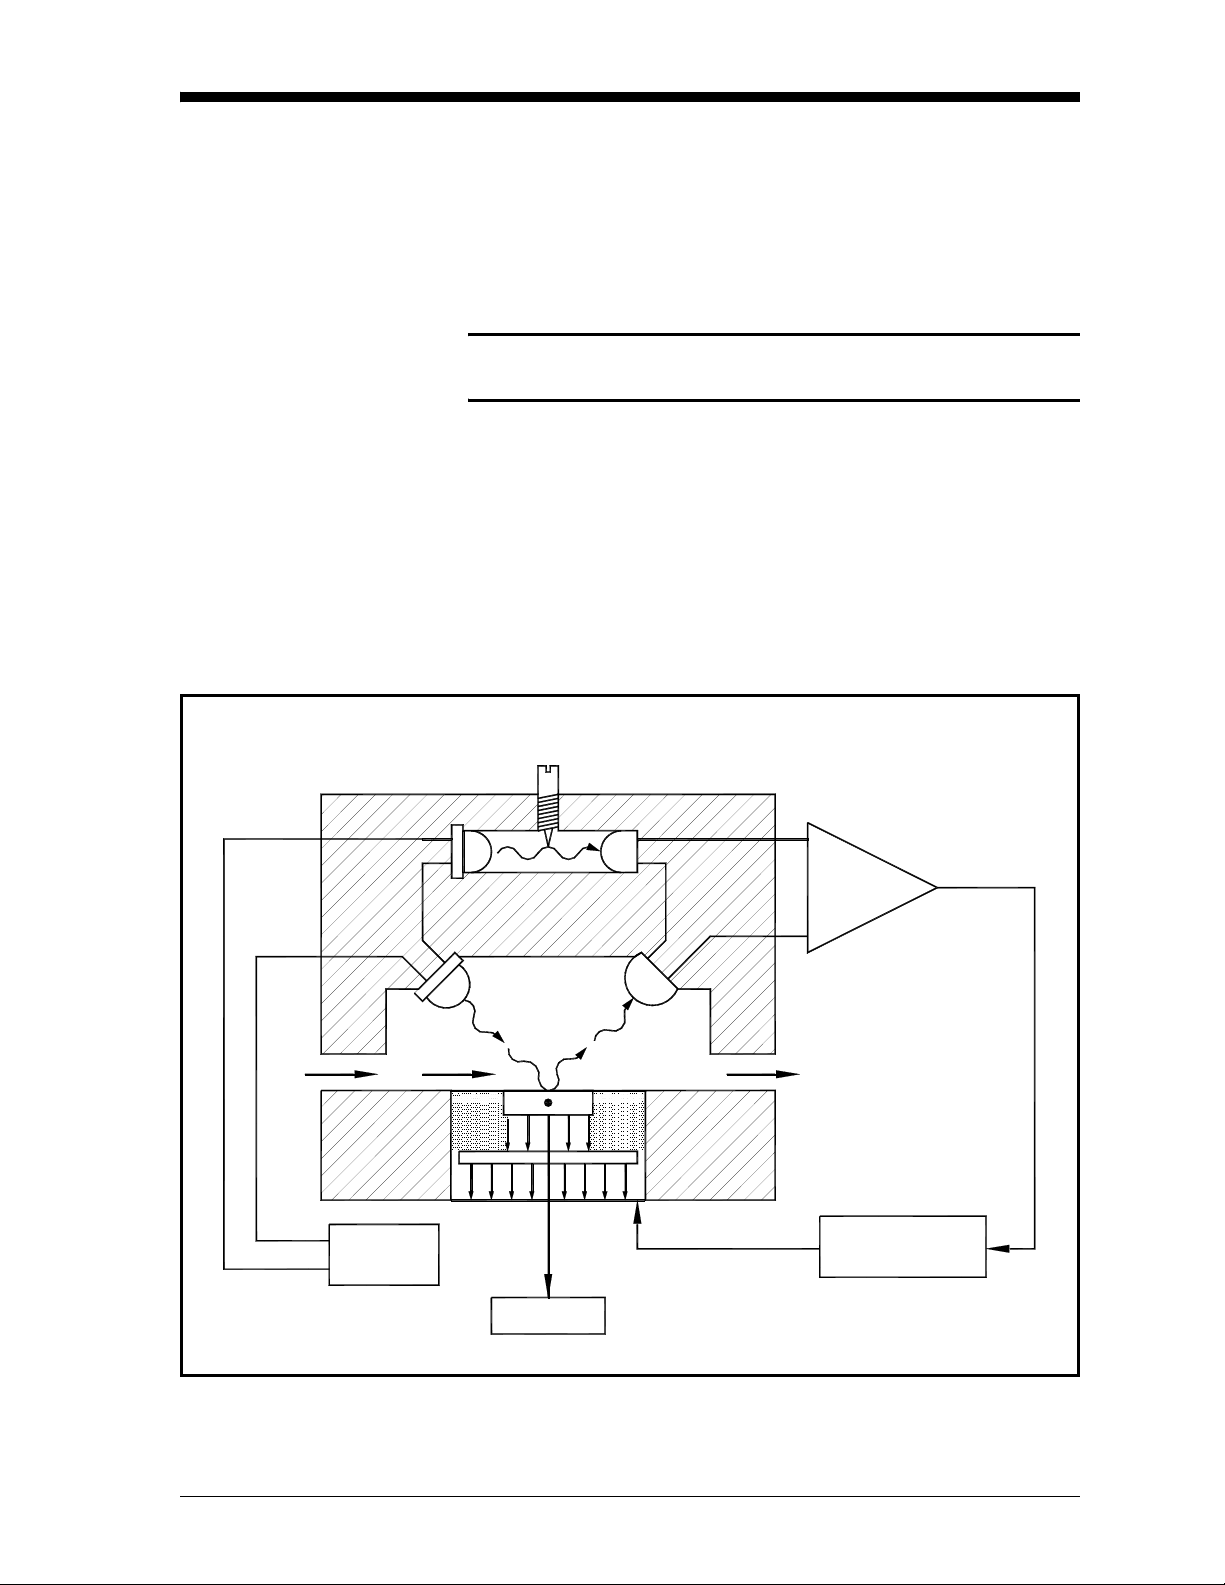
Hygrometer Function Figure 1-2 on page 1-5 illustrates how GE Infrastructure Sensing
hygrometers detect and measure dew point. The condensate mirror is
illuminated with a high-intensity, solid state, light emitting diode
(LED). A photodetector monitors the LED light reflected from the
mirror. The photodetector is fully illuminated when the mirror is clear
of dew, and it receives less light as dew forms. A separate LED and
photodetector pair are used as a known reference to compensate for
any thermally induced changes in the optical components. The
photodetectors are arranged in an electrical bridge circuit, the output
current of which is proportional to the light reflected from the mirror.
The bridge output controls the electrical current to the thermoelectric
cooler.
A large bridge current develops when the mirror is dry, causing the
mirror to cool toward the dew point. As dew begins to form on the
mirror, less light is reflected, and the bridge output decreases. This, in
turn, causes a decrease in cooling current. A rate feedback loop
within the amplifier ensures critical response, causing the mirror to
stabilize quickly at a temperature that maintains a thin dew or frost
layer on the mirror surface. A precision thermometer element
embedded within the mirror directly monitors this dew point
temperature.
1-4 Features and Capabilities
Page 17
January 2006
Hygrometer Calibration The Optica unit can be sent to the National Institute of Standards and
Technology (NIST) in Gaithersburg, Maryland for certification or to
any National Standards lab for calibration against their primary
humidity standards. A calibrated instrument can then be used as a
transfer standard in local laboratories to calibrate lower echelon
instruments.
Caution!
Field calibration is not recommended.
Hygrometers used as calibration standards must have the following
characteristics:
• The mirror thermometer must have suitable long-term accuracy
(such as that obtained with a platinum resistance thermometer).
• A means should be provided for viewing the dew or frost
formation on the mirror.
LED
Regulation
Optical Reference
41.2°F
Gain
Thermoelectric
Heat Pump Power
Dew Point Temperature
(Precision Thermometer)
Figure 1-2: Chilled-Mirror Hygrometer Diagram
Features and Capabilities 1-5
Page 18

January 2006
Other Hygrometer Applications
Many GE Infrastrucure Sensing Chilled Mirror Hygrometers are used
in industrial applications in addition to metrology. The optical
condensation hygrometer is not readily damaged or contaminated by
industrial process gases that can degrade other secondary
measurement schemes such as saturated salt and polymer-based
sensors. If the sensor or sampling components should become
contaminated with oils, salts, etc., they can be cleaned without harm
to the sensor or impairment to the system accuracy. The performance
of the hygrometer can be checked at any time by heating the mirror
above the dew point, causing the dew deposit to evaporate, then
reclosing the servoloop and checking to see that the system cools and
returns to the same dew point.
The GE Infrastructure Sensing optical condensation sensors cover a
wide range of applications limited only by the heat pumping
capabilities of the thermoelectrically-cooled mirror.
At high dew points (up to 100°C), the sensor is limited by the thermal
properties of the solid state optical components as well as the
thermoelectric heat pump capacity.
In a typical application measuring sub-ambient dew points, a twostage thermoelectrically-cooled mirror can reach a temperature
approximately 65°C lower than an ambient (heat sink) temperature of
+25°C. The thermoelectric cooler pumps heat from the mirror into the
heat sink. By reducing the temperature of the heat sink with a coolant
such as chilled water, or by applying the sensor in a low-temperature
condition such as monitoring of a test chamber, even lower dew
points can be measured. In meteorological applications where the
heat sink temperature is considerably lower, frost points down to –
75°C can be monitored.
Four- and five-stage sensors are available for measuring the lowest
dew/frost points.
The PACER Cycle GE Infrastructure Sensing has developed and patented a
compensation technique called PACER (Programmable Automatic
Contaminant Error Reduction) that is very effective in reducing the
Raoult Effect error associated with soluble contaminants, particularly
for near-ambient dew points. The Optica is equipped with the PACER
cycle as well as AUTO balance as found on earlier models. The user
can choose which self-cleaning and balancing routine to run
depending on the severity of contamination.
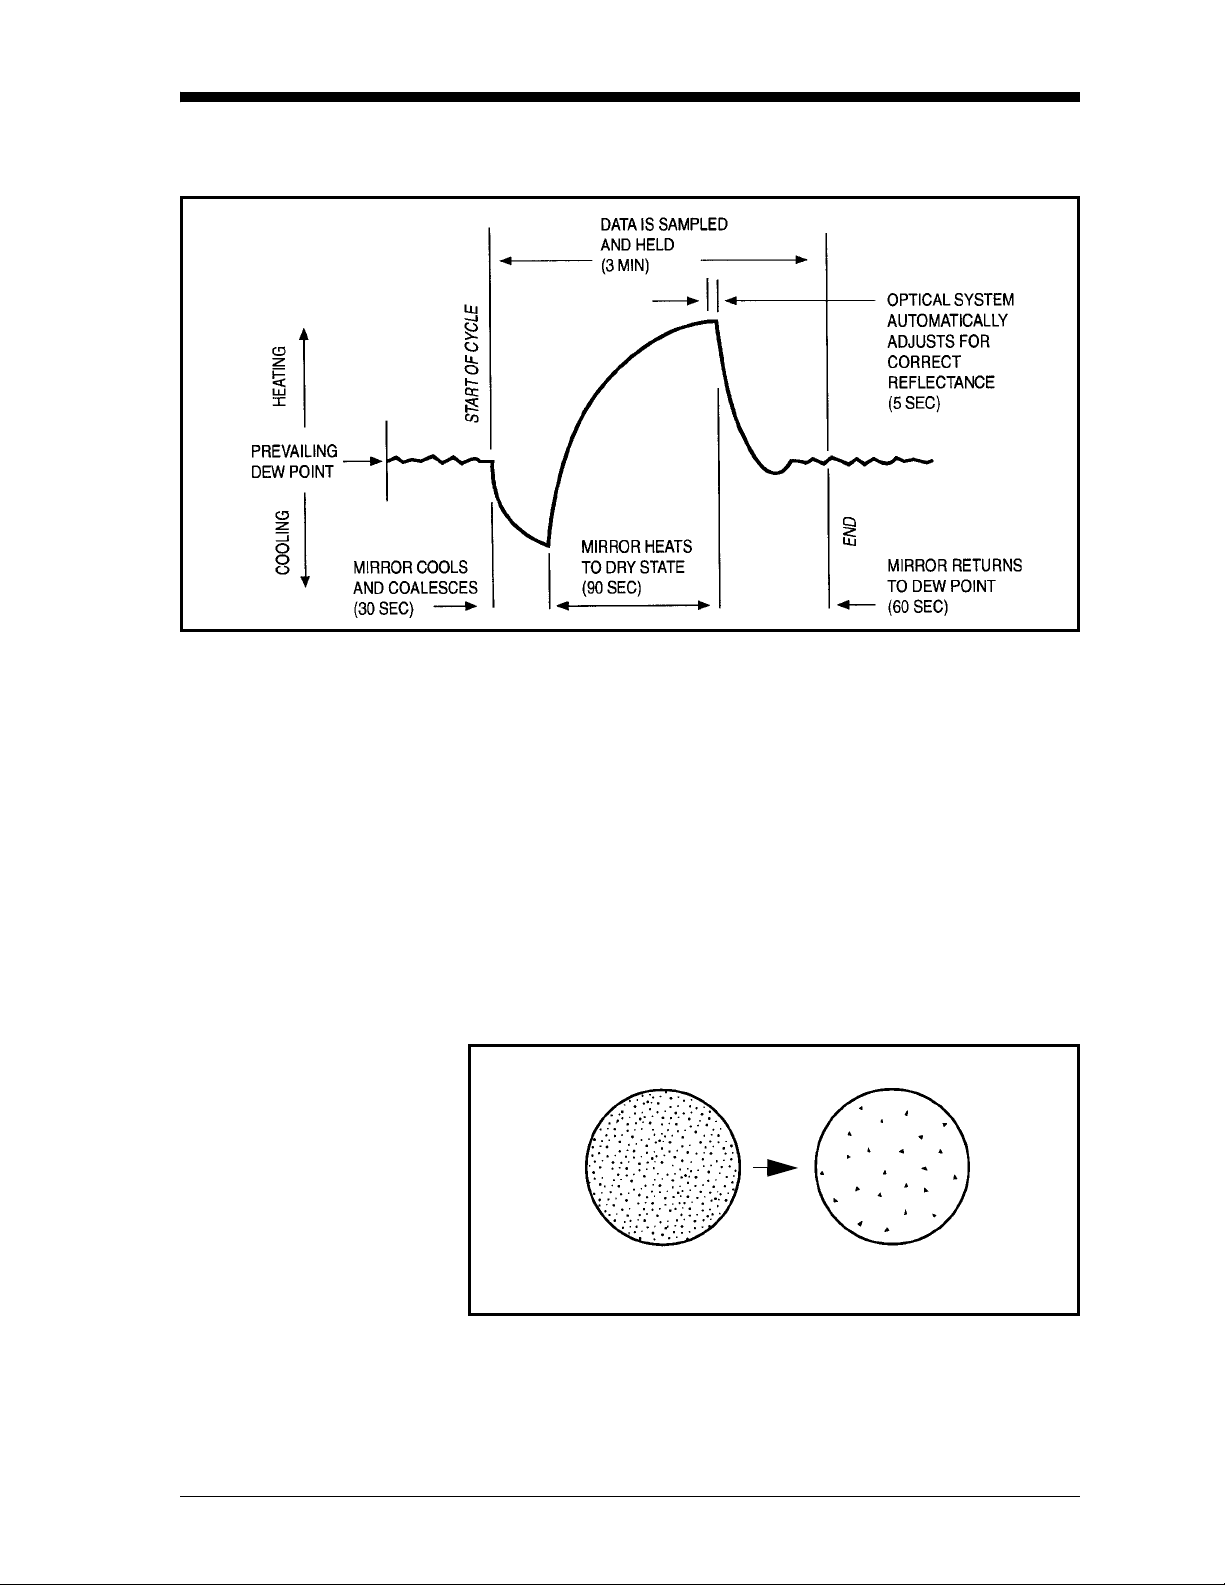
The PACER cycle, diagrammed in Figure 1-3 on page 1-7, begins
with a coalescence period, during which the mirror is cooled well
below the dew point of the sample gas, condensing out a large amount
of water.
1-6 Features and Capabilities
Page 19
The PACER Cycle (cont.)
January 2006
Figure 1-3: A Typical PACER Cycle
This excess water easily dissolves any water-soluble contaminants.
The mirror is then heated. During the heating phase, the large puddles
of water gradually evaporate, carrying increasingly heavy
concentrations of salts as the puddles become smaller. Finally, when
all the puddles have evaporated, dry “islands” of crystallized salt are
left on the mirror. The area between the islands (80-85% of the mirror
surface) is now clean and shiny, whereas before the PACER cycle it
may have been completely covered. The total amount of
contamination has not been reduced, but instead, redistributed as
shown in Figure 1-4 below, with more clean mirror surface available
for dew formation. The reflected light signal is then electronically
balanced against the reference.
Before
PACER Cycle
After
PACER Cycle
Figure 1-4: Results of the PACER Cycle
Features and Capabilities 1-7
Page 20

Chapter 2
Page 21

Installation
Introduction. . . . . . . . . . . . . . . . . . . . . . . . . . . . . . . . . . . . . . . . . . . . . . . . . . . . 2-1
Benchtop Installation . . . . . . . . . . . . . . . . . . . . . . . . . . . . . . . . . . . . . . . . . . . 2-1
Wall-Mount Installation . . . . . . . . . . . . . . . . . . . . . . . . . . . . . . . . . . . . . . . . . 2-6
Output Wiring . . . . . . . . . . . . . . . . . . . . . . . . . . . . . . . . . . . . . . . . . . . . . . . . . . 2-8
Sensor Information . . . . . . . . . . . . . . . . . . . . . . . . . . . . . . . . . . . . . . . . . . . . 2-12
Sensor Installation . . . . . . . . . . . . . . . . . . . . . . . . . . . . . . . . . . . . . . . . . . . . . 2-16
Page 22
January 2006
Introduction This chapter explains the installation of the benchtop and wall-mount
versions of the Optica, the various sensors used with the system, and
the I/O and power wiring.
Benchtop Installation
Mounting the Benchtop
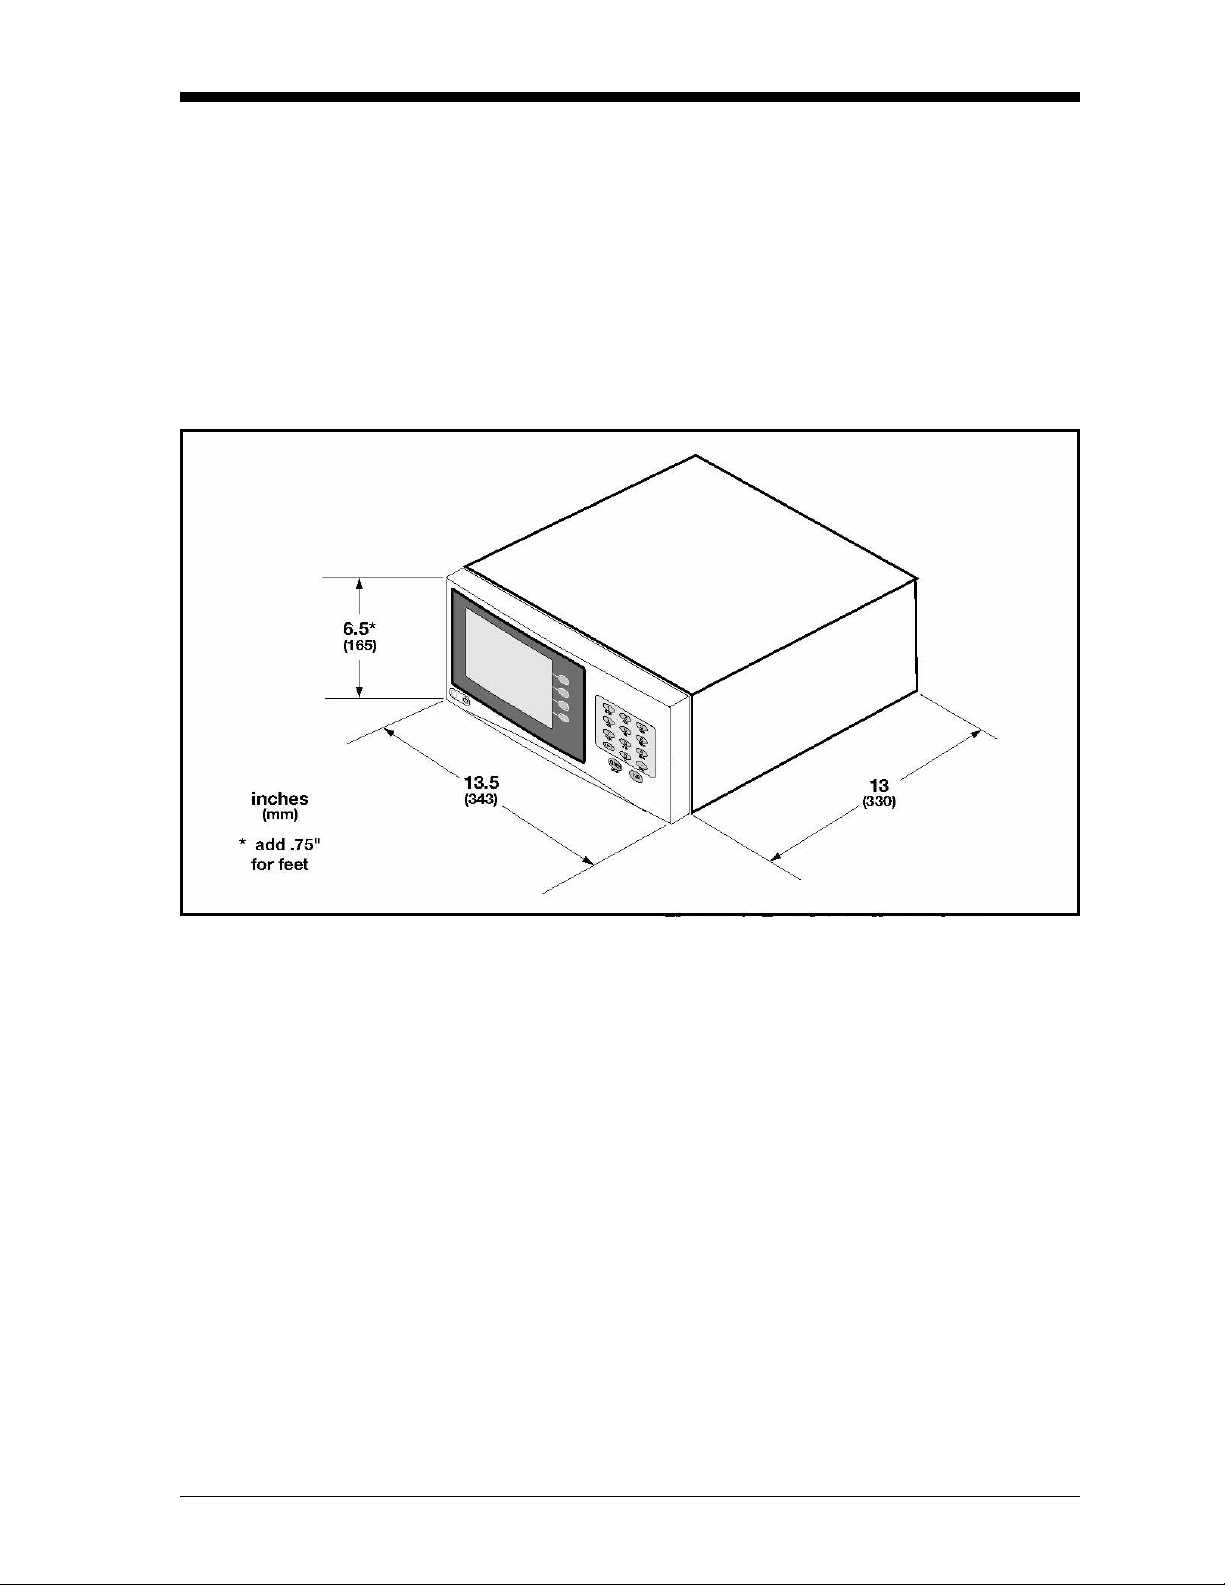
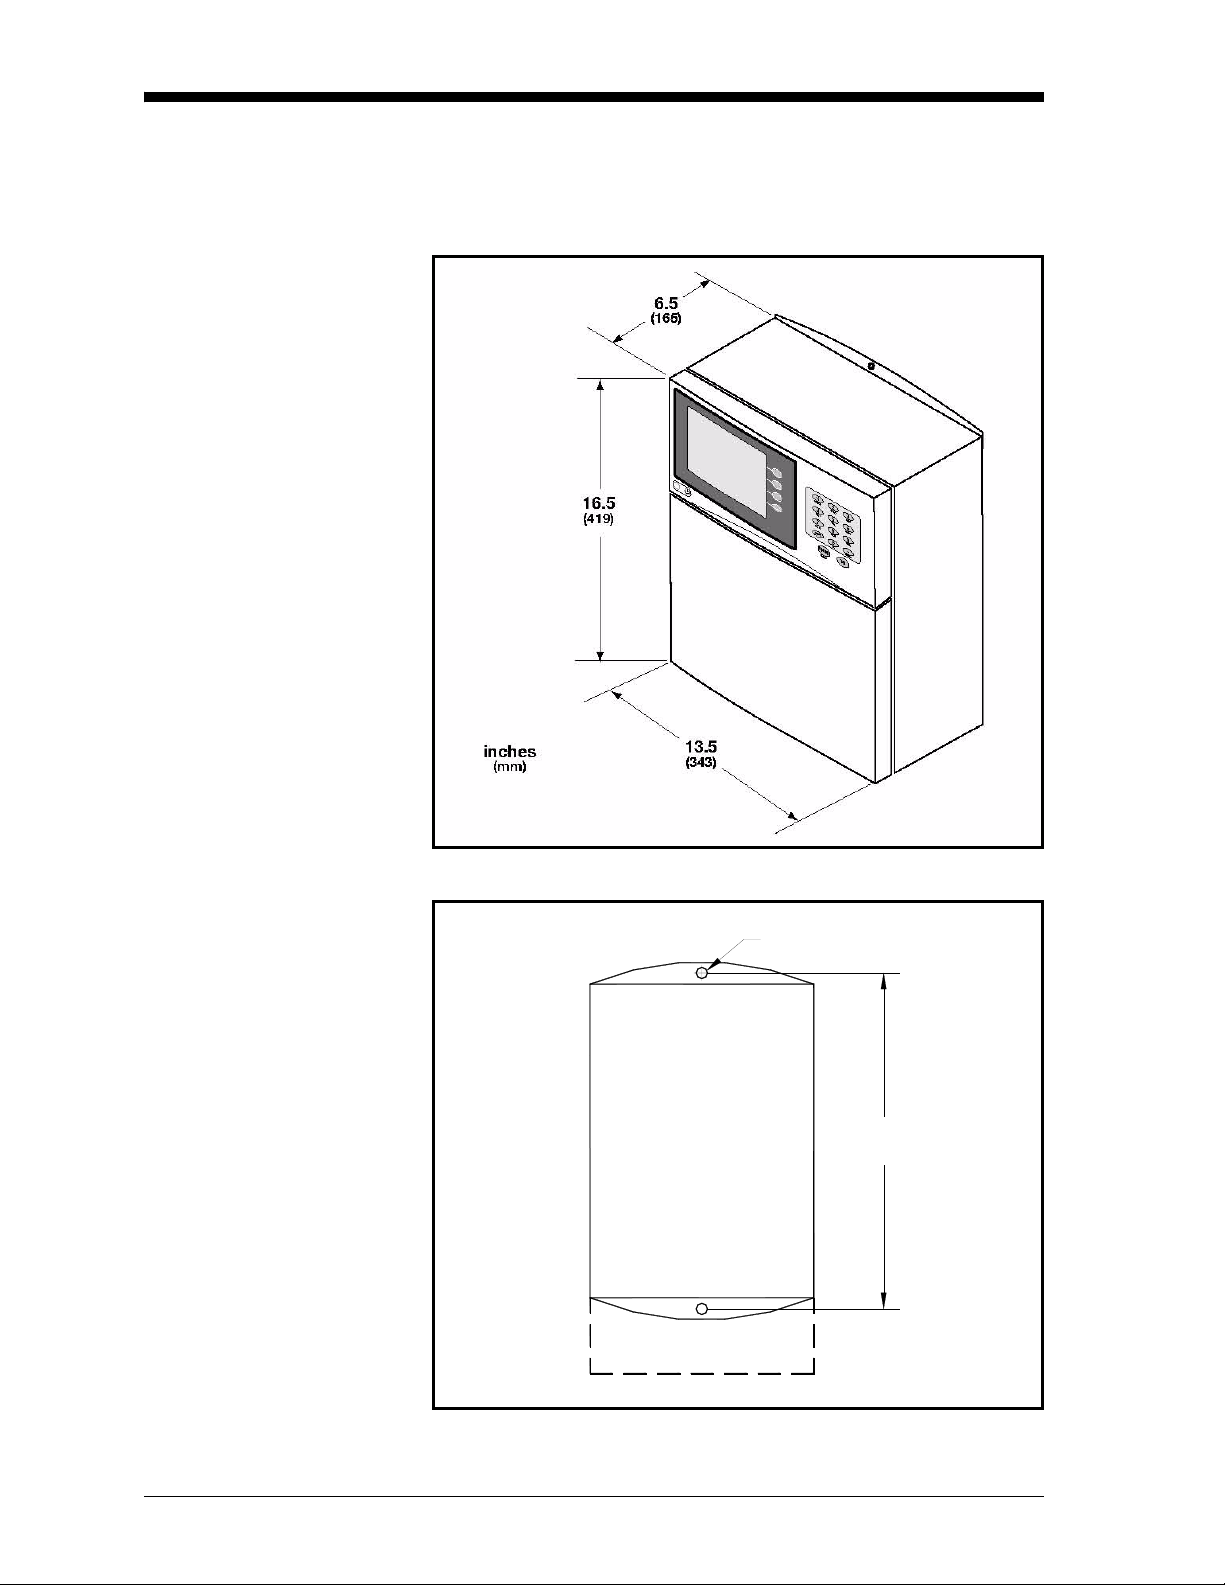
The Optica benchtop dimensions are shown in Figure 2-1 below. Two
feet on the bottom of the case can be unfolded to raise up the front for
easier viewing, if desired.
Figure 2-1: Optica Benchtop Dimenisons
Installation 2-1
Page 23
January 2006
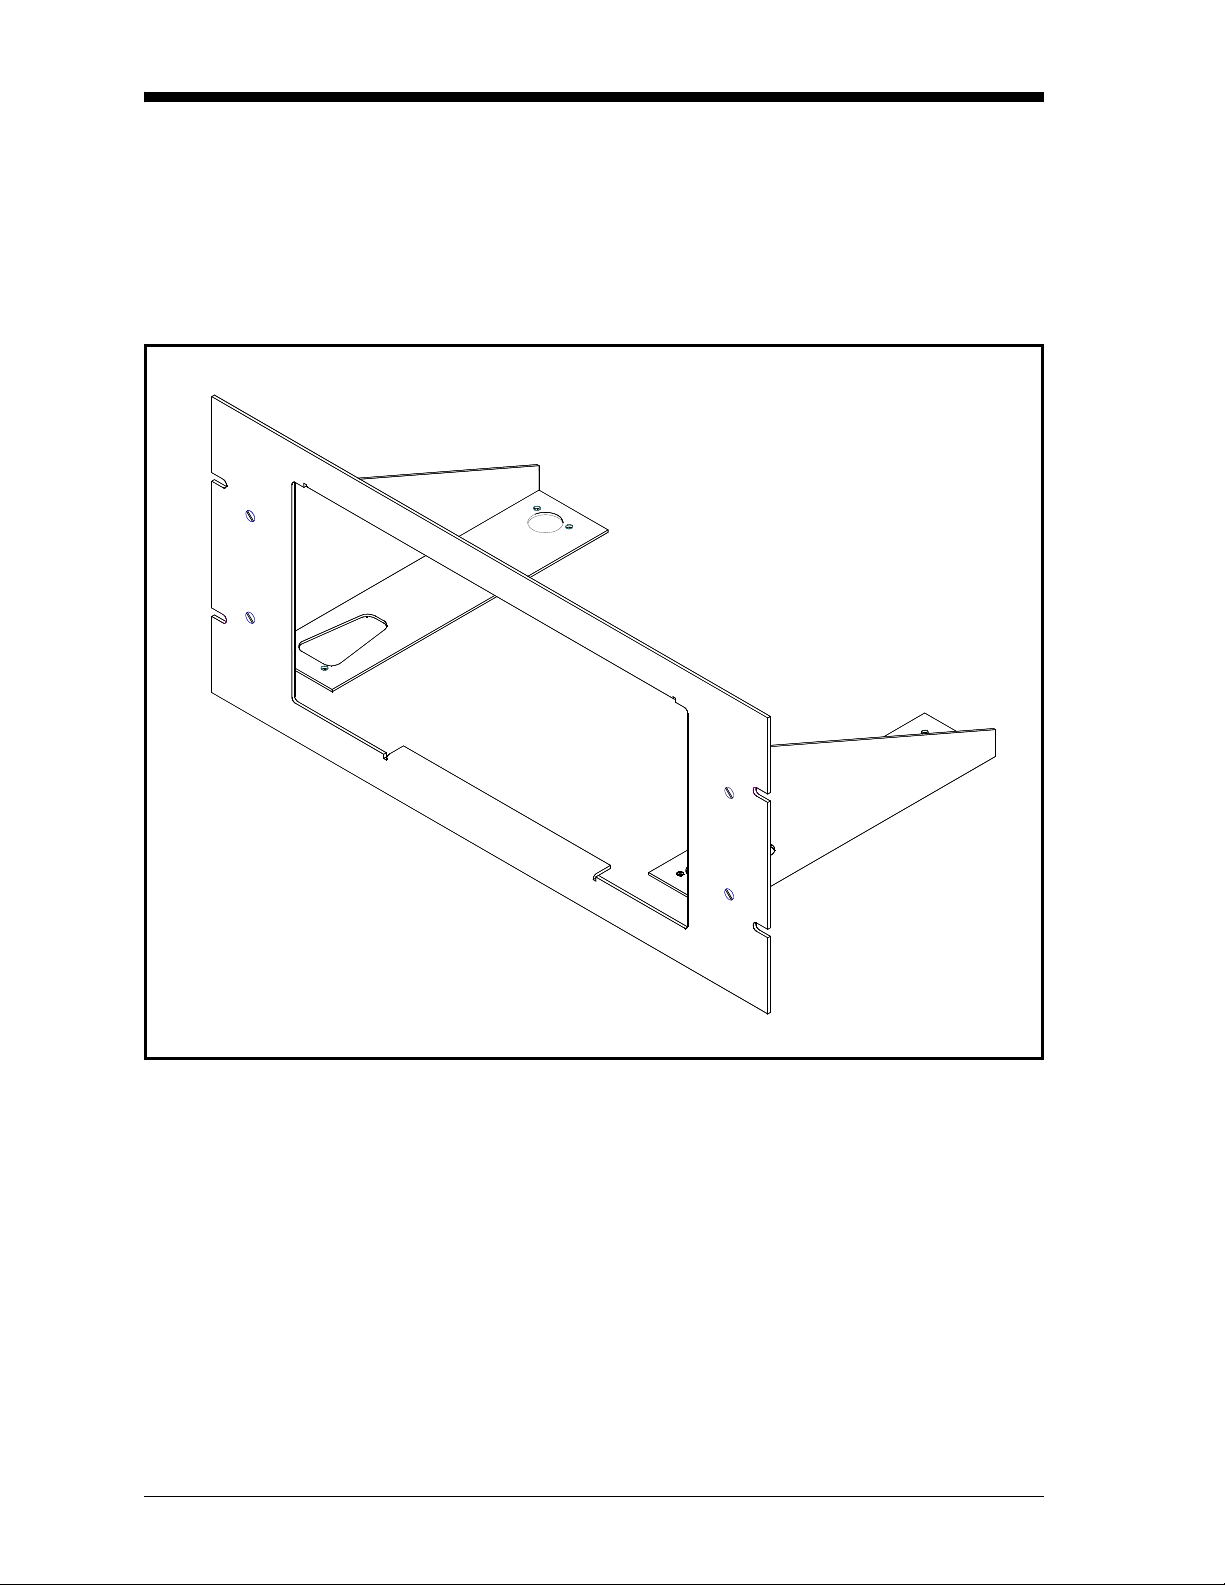
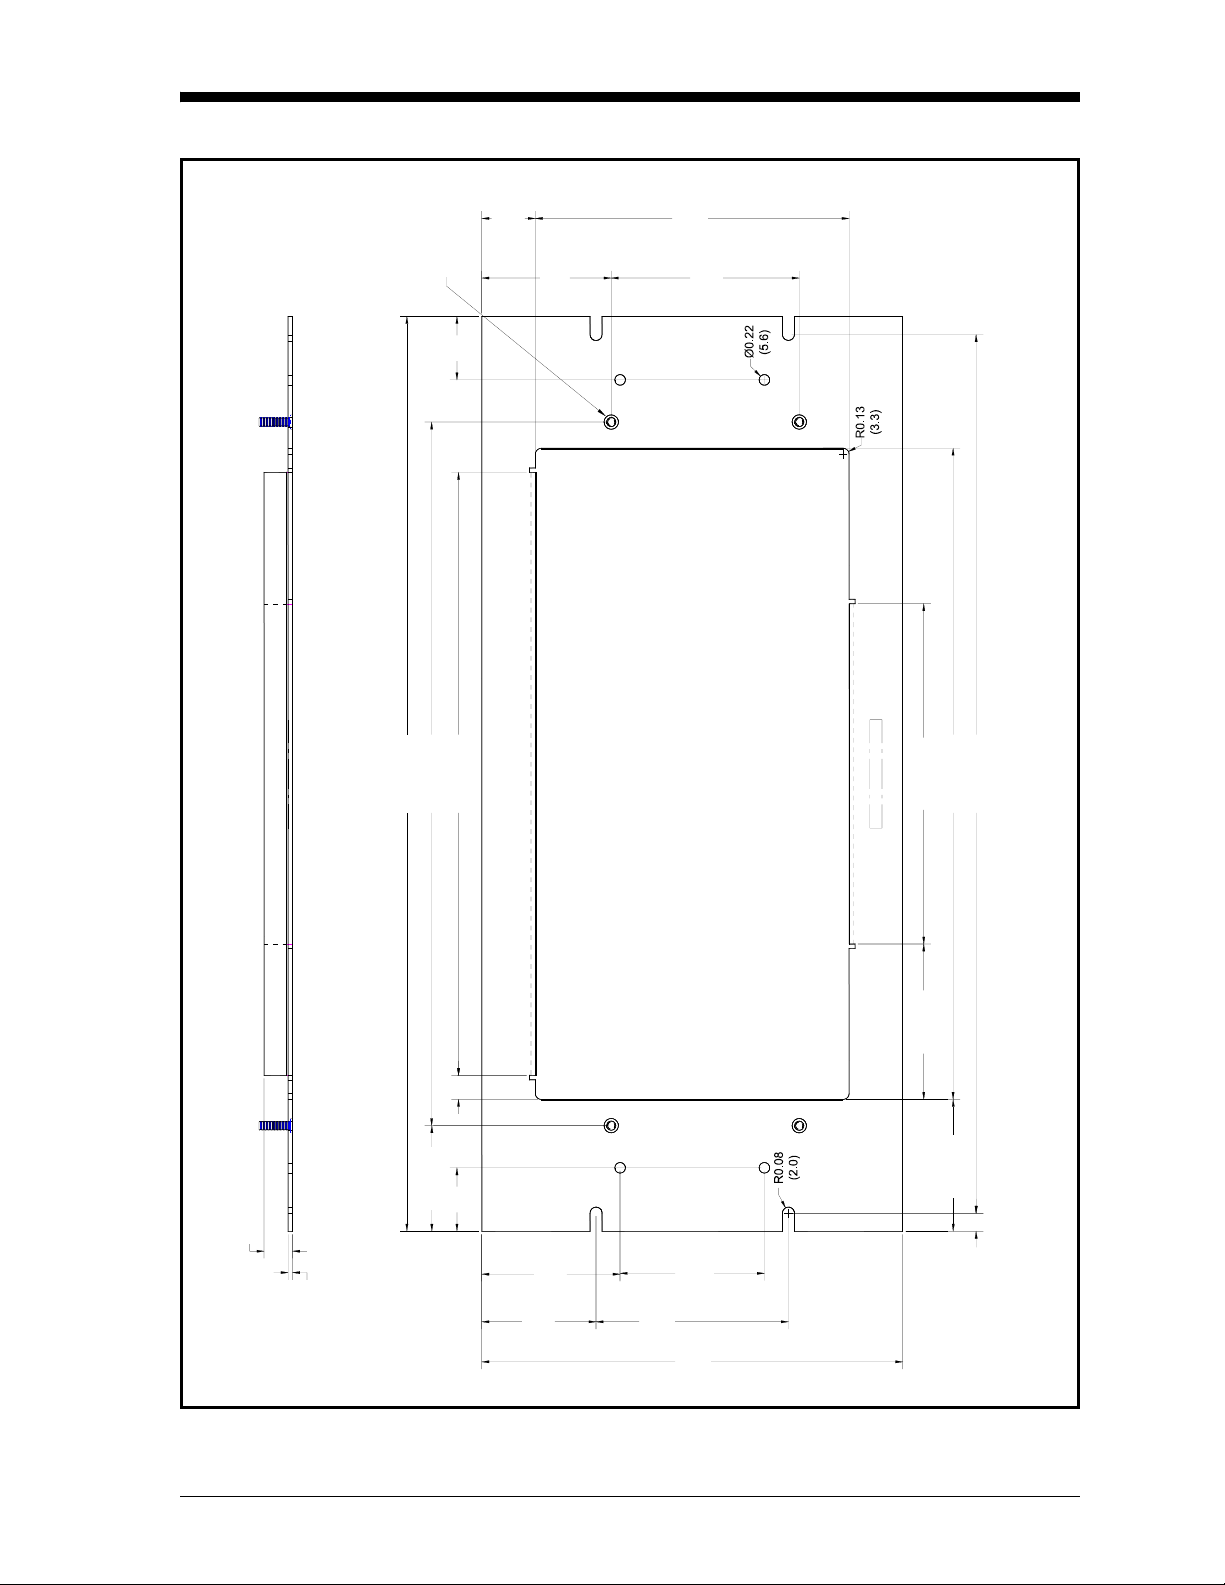
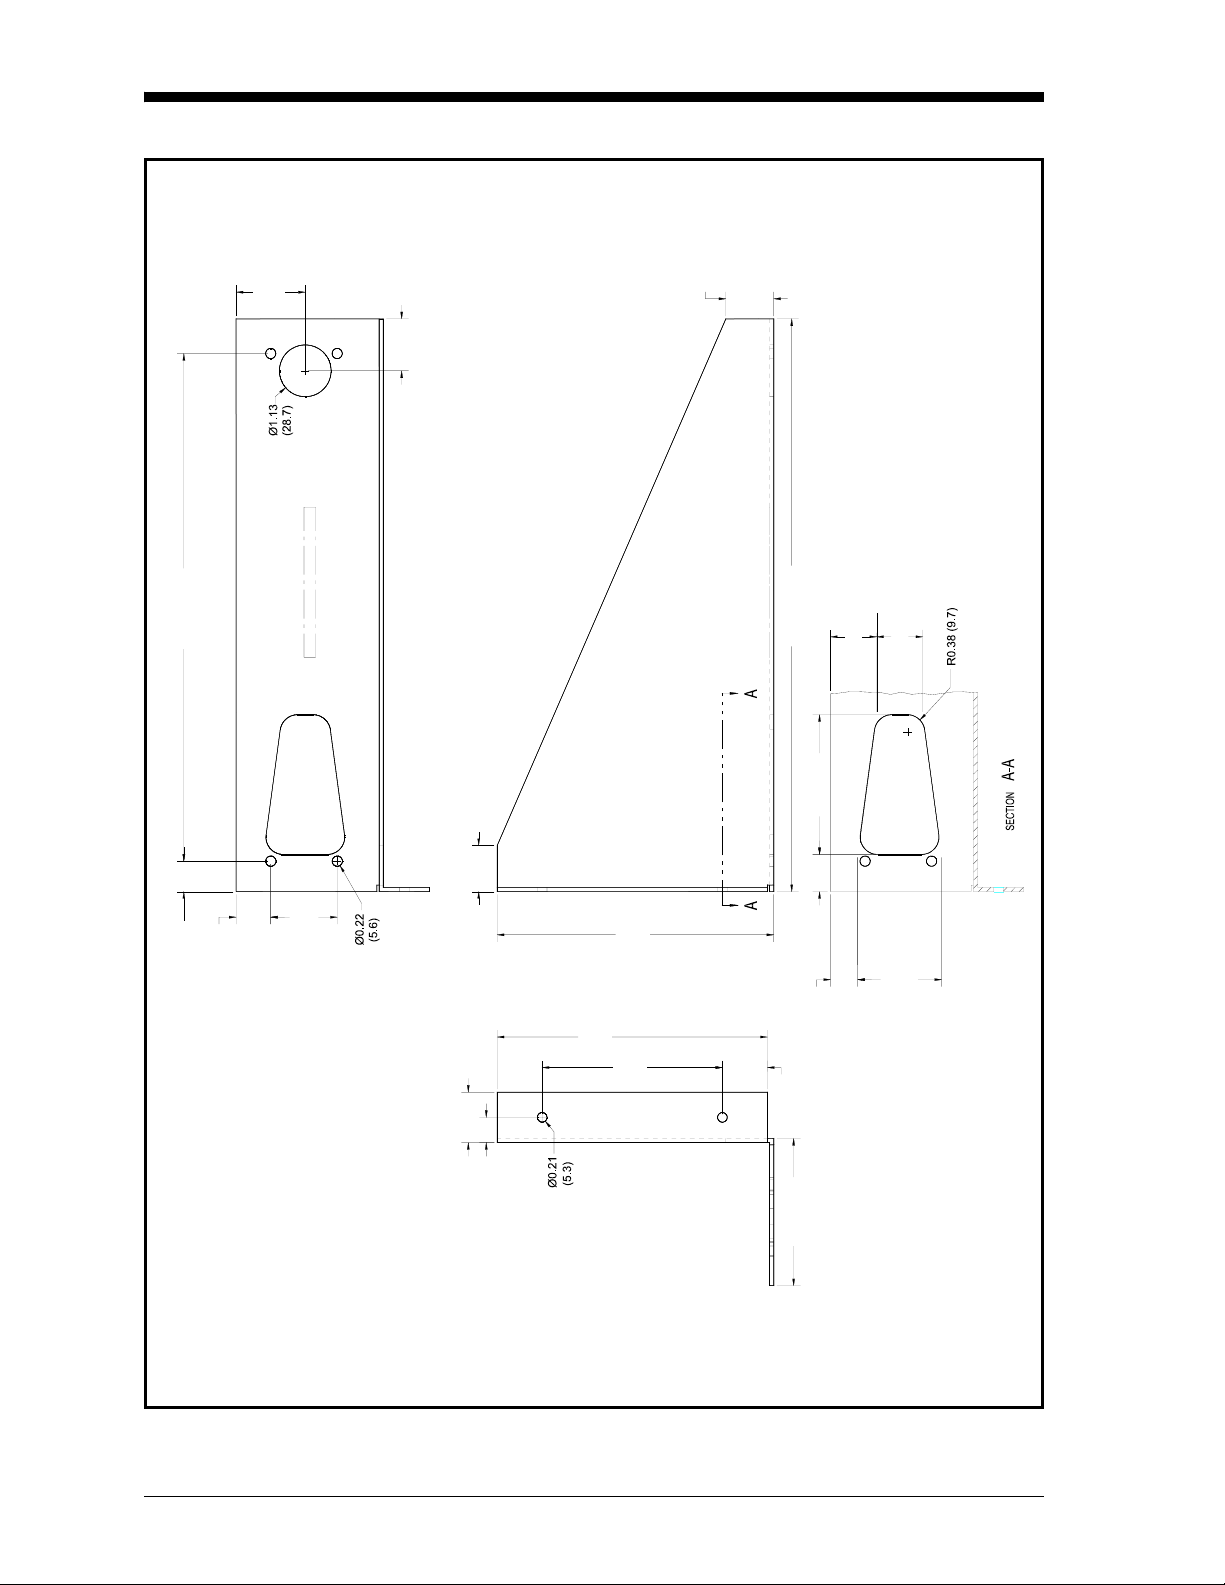
Using the Rack Mounting Option
There is an optional kit for mounting the benchtop unit in a standard
19-inch rack (see Figure 2-2 below, Figure 2-3 on page 2-3, and
Figure 2-4 on page 2-4). The two brackets are attached to the front
panel using four No. 8 screws. The Optica is mounted to the brackets
using the eight mounting holes located just in front of and behind the
unit’s feet.
Figure 2-2: Optica Rack-Mount Adapter
2-2 Installation
Page 24
January 2006
1.11
(28.2)
4 places
FH-032-8
1.32
(33.5)
19.00 (482.6)
14.62 (371.3)
12.53 (318.3)
2.69
(68.3)
6.52
(165.6)
3.91
(99.3)
7.07 (179.6)
18.25 (463.6)
13.53 (343.7)
3.23 (82.0)
0.50 (12.7)
2.19 (55.6)
1.32
(33.5)
0.59 (15.0)
2.88
0.09
(2.3)
(73.2)
2.38
(60.5)
3.00
(76.2)
4.00
(101.6)
2.74 (69.6)
0.38
(9.7)
Note: Dimensions are in inches (millimeters).
8.75
(222.3)
Figure 2-3: Optica Rack-Mount Adapter - Front Panel
Installation 2-3
Page 25
January 2006
1.04
1.50
(38.1)
1.13 (28.7)
(26.4)
Note: Dimensions are in inches (millimeters).
11.00 (279.4)
1.00 (25.4)
1.44
(36.6)
0.66 (16.8)
0.75 (19.1)
1.09 (27.7)
0.55 (14.0)
6.00
(152.4)
5.86
(148.8)
3.91
(99.3)
12.41 (315.2)
1.00 (25.4)
1.00 (25.4)
0.80 (20.3) 3.03 (77.0)
1.82
(46.2)
0.59 (15.0)
0.98 (24.9)
3.19 (81.0)
Figure 2-4: Optica Rack-Mount Adapter - Bracket
2-4 Installation
Page 26
January 2006
Wiring the Benchtop
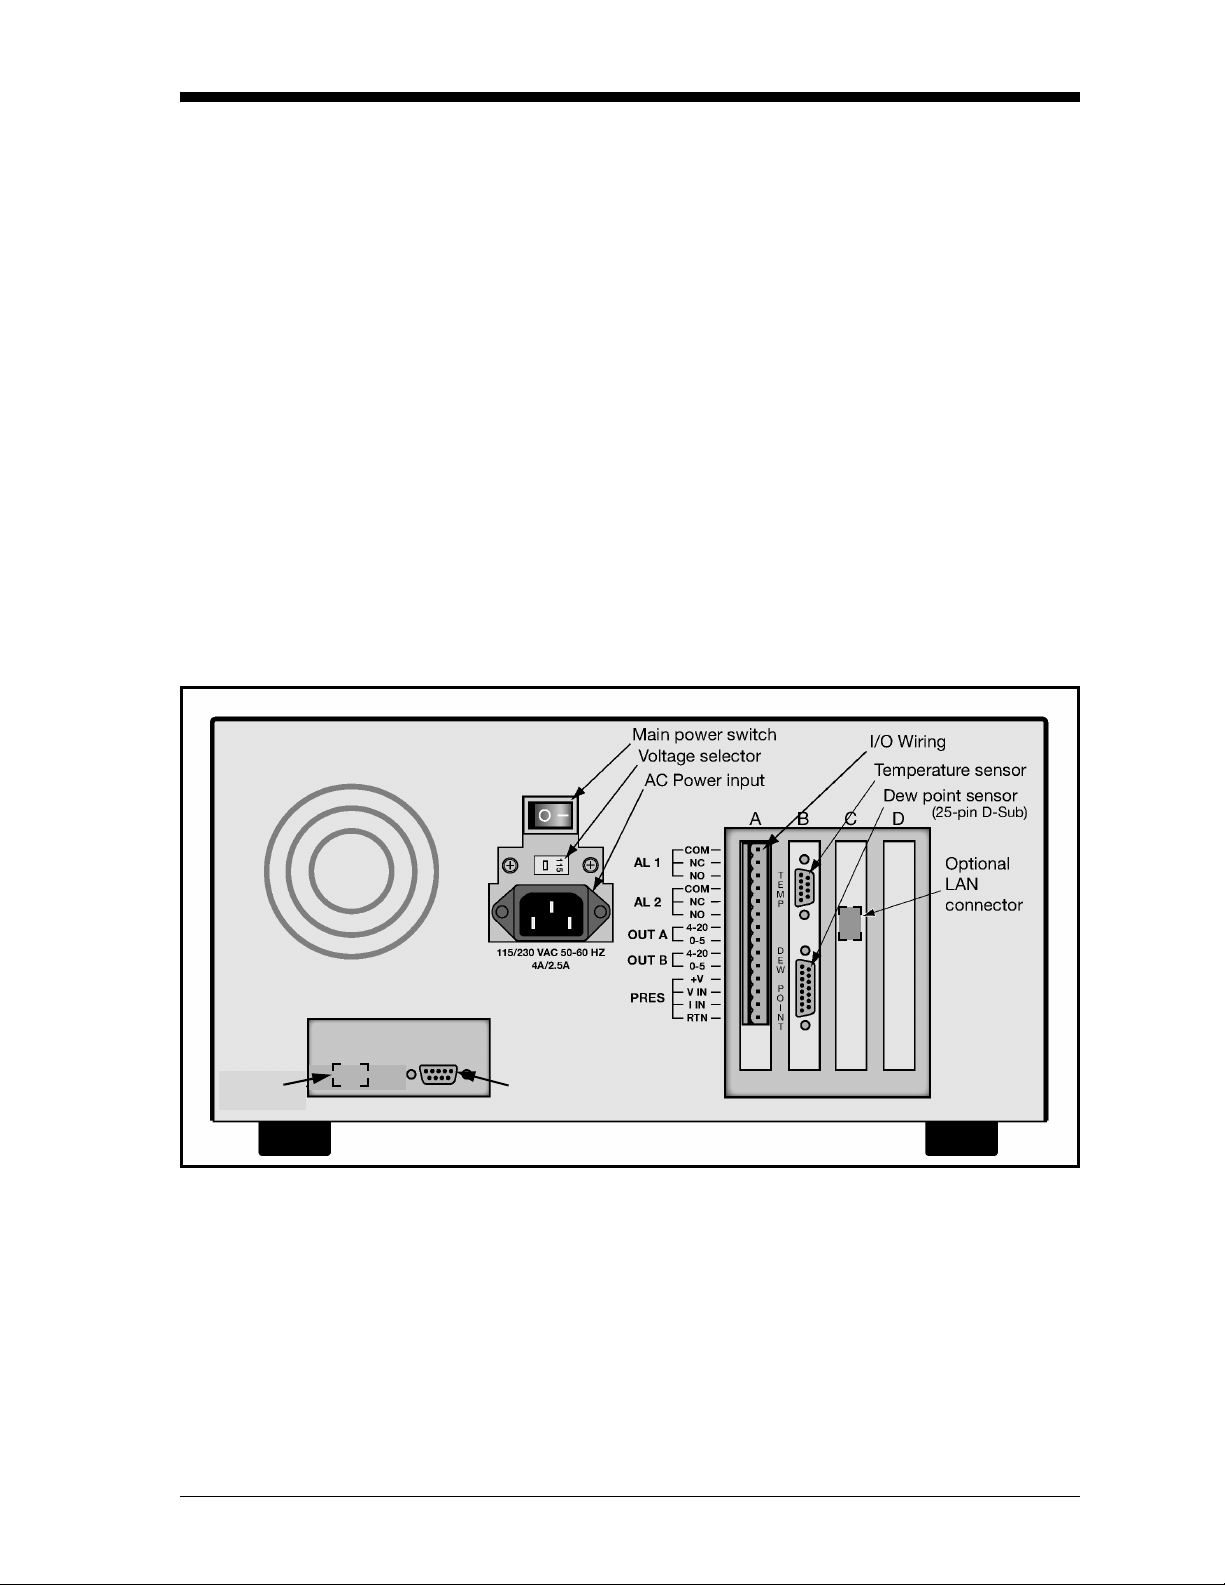
Input Power The Optica operates with input power from 90 to 126 VAC at 4 amps,
or from 208 to 252 VAC at 2.5 amps. It is designed for a nominal 100,
115 or 230 VAC source. A switch on the rear panel selects the
appropriate voltage range (see Figure 2-5 below):
• The 115 VAC setting operates over a range of 90 to 126 VAC
• The 230 VAC setting operates over a range of 200 to 253 VAC
The Optica’s voltage and frequency rating are listed on the rear panel.
Sensors Connect the dew point sensor cable to the 25-pin connector in Slot B
on the Optica’s rear panel (see Figure 2-5 below). Connect the
optional temperature sensor cable to the 9-pin connector in Slot B on
the rear panel. The optional pressure sensor and other I/O wiring
connects to the terminal block in Slot A.
Optional
LAN
connector*
*
Serial
Port
Figure 2-5: Optica Benchtop Rear Panel
Note: *Depending on the model revision, the LAN connector is
located in one of two places.
Installation 2-5
Page 27
January 2006
Wall-Mount Installation The Optica Wall-Mount unit is designed to mount on a flat, vertical
surface, such as a wall or panel. To mount the wall-mount version, see
Figure 2-6 and Figure 2-7 below.
Mounting the Wall-Mount
Figure 2-6: Optica Wall-Mount Dimenisons
Ø.261 (6.63 mm)
2 places
1/4" hardware
is recommended.
17.43"
(443 mm)
Allow adequate space
below unit for cabling.
Figure 2-7: Optica Wall-Mount - Mounting Hole Locations
2-6 Installation
Page 28
January 2006
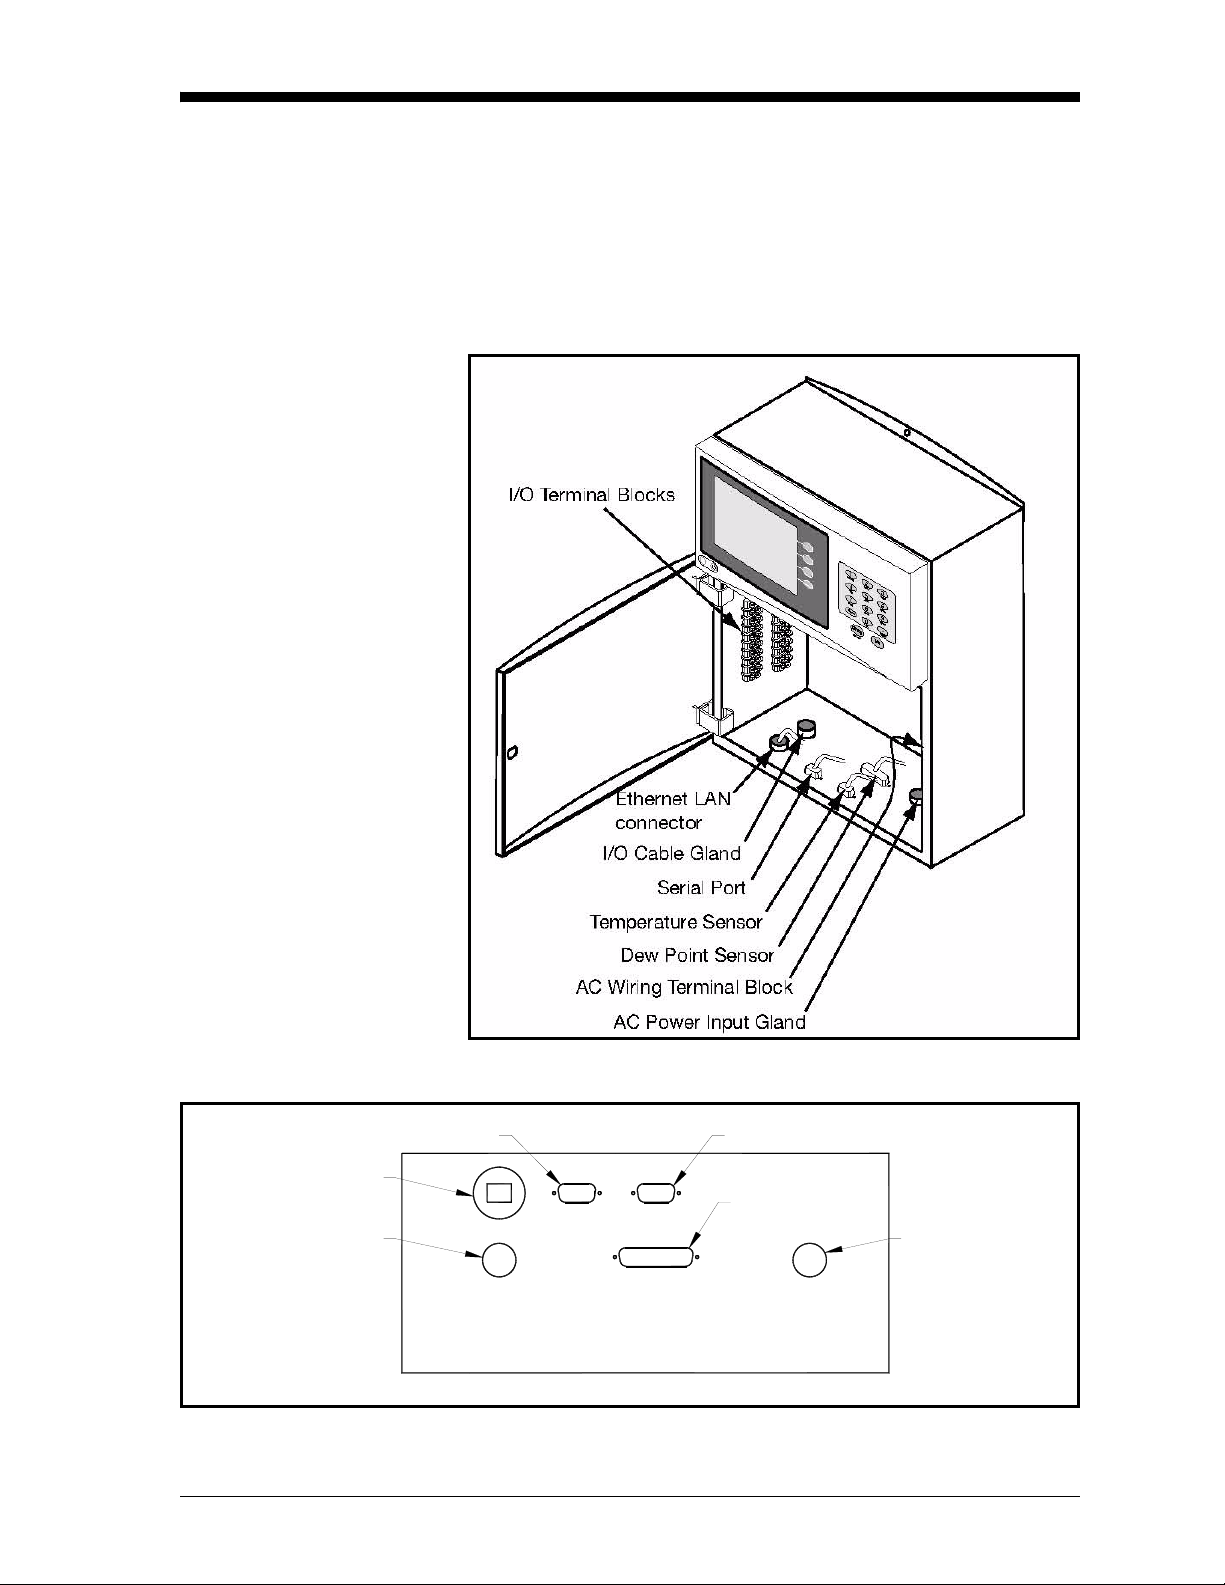
Wiring the Wall-Mount All connections to the wall-mount unit are made through the panel at
the bottom of the case as shown in Figure 2-8 below. Any I/O cabling
is brought into the unit through a gland at the lower left of the case
and connects to the terminal blocks on the left side of the case. Wiring
for these connections is shown in Figure 2-11 on page 2-8. The dew
point sensor and temperature sensor cable connectors are located near
the center of this panel.
Figure 2-8: Wall-Mount Wiring Entrance Locations
Optional Ethernet
LAN Connector
Gland for
I/O Wiring
Serial Port
LAN
IN/OUT
COM
TEMP
DEW POINT
Temperature Sensor
Dew Point Sensor
AC LINE
90/250 VAC 47-63 Hz
4 ASB 250V TYPE T
Gland for
AC Power
Wiring
Figure 2-9: Wall-Mount Bottom Panel (viewed from under the unit)
Installation 2-7
Page 29
January 2006
Input Power Power wiring enters the case through a gland fitting at the lower right
of the unit and connects to a screw terminal block mounted on the
right side of the case. Wiring of this terminal block is shown in
Figure 2-10 below. The voltage and frequency rating and tolerances,
as well as fusing data, are listed on the bottom of the unit.
Top
FrontL
G
N
of
Case
Figure 2-10: Wall-Mount AC Power Wiring
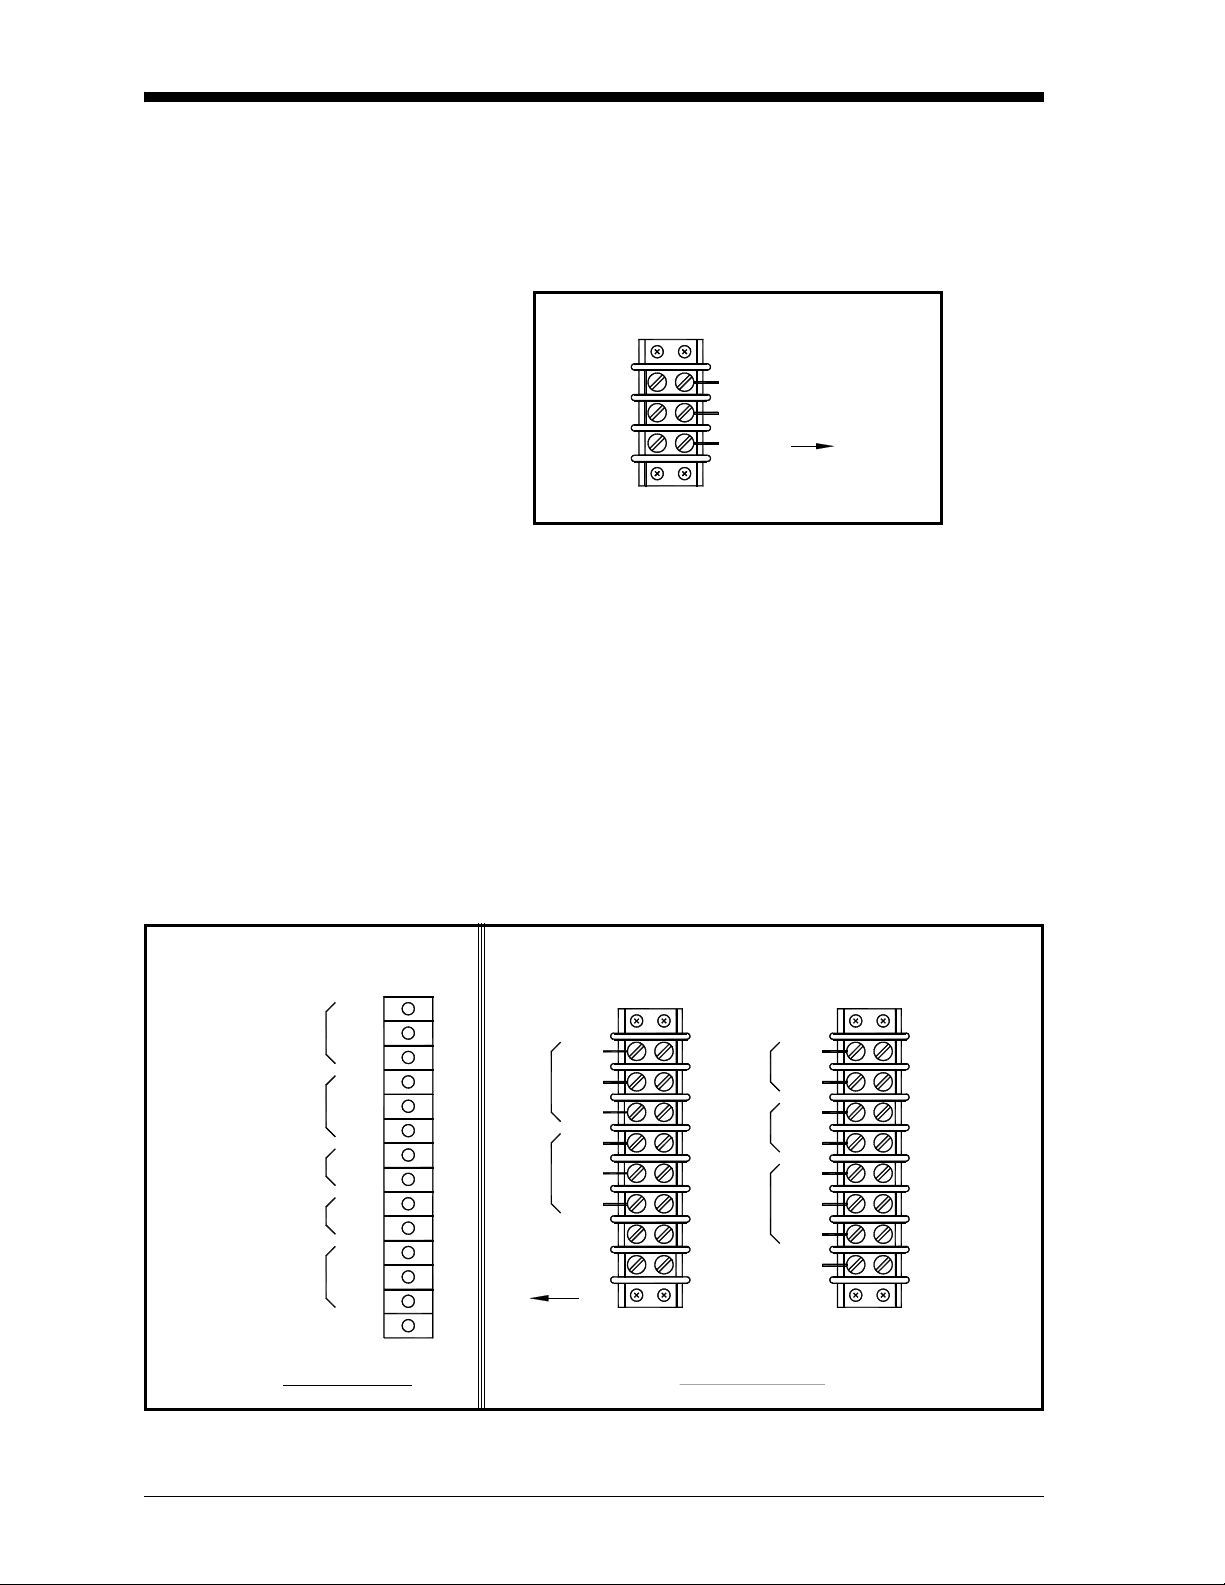
Output Wiring The benchtop outputs are connected to removable terminal blocks on
the rear panel. Figure 2-5 on page 2-5 shows the location of the
benchtop terminal blocks and Figure 2-11 below shows the Slot A
connections.
ALARM 1
ALARM 2
OUT A
OUT B
PRESSURE
COM
NC
NO
COM
NC
NO
4-20
0-5
4-20
0-5
+V
V in
I in
RTN
The Wall-Mount Optica input/output terminal blocks are located
inside the front door as shown in Figure 2-8 on page 2-7. Cabling is
brought in through the gland on the bottom of the unit and wired to
the terminal blocks shown in Figure 2-11 below.
Note: Output programming is described in Chapters 4, 5 and 6.
Slot A
COM
AL1 NC
NO
COM
AL2 NC
NO
Front
of
Case
Top
OUT A
OUT B
PRES
4-20
0-5
4-20
0-5
+V
V in
I in
RTN
Benchtop Unit
Wall-Mount Unit
Figure 2-11: Benchtop and Wall-Mount Input/Output Terminal Blocks
2-8 Installation
Page 30

January 2006
Analog Outputs Note: When the Optica is being programmed, the analog outputs
provide 4–20mA and 0–5 VDC signals representing the
designated parameters.
• For 4–20mA output, connect to terminals labelled 4–20 (+) and
RTN (–).
Note: The maximum load allowed for current output is 500 Ohms.
• For 0–5 VDC output, connect to terminals labelled 0–5 (+) and
RTN (–).
Note: The maximum load allowed for voltage output is 5 mA.
Example: Assume a temperature output, scaled to range from 0°C (Tlower) to
100°C (Tupper), with a measured actual temperature of 23°C
(Tactual):
The voltage output is calculated by:
Tactual Tlower–()
Vout
----------------------------------------------
Tupper Tlower–()
5×=
yielding an output voltage of 1.15V.
23 0–()
---------------------
100 0–()
The current output is calculated by:
Tactual Tlower–()
Iout mA()
yielding an output current of 7.68 mA.
----------------------------------------------
Tupper Tlower–()
23 0–()
---------------------
100 0–()
5× 1.15V=
16()× 4+ 7.68mA=
20 4–()× 4+=
Installation 2-9
Page 31

January 2006
Additional Voltage Outputs It is possible to use either of the analog current outputs as an
additional voltage output by connecting a precision resistor from the
current output to its return. A voltage will be produced equal to the
output current times the load resistance. To produce a voltage output
range of 1 to 5 volts, connect a 250 ohm resistor (0.1% tolerance
recommended).
Using a 250 ohm resistor, the voltage output is calculated by::
Tactual Tlower–()
Vout
yielding an output voltage of 1.92V for this example.
----------------------------------------------
Tupper Tlower–()
23 0–()
---------------------
100 0–()
4× 1+ 1.92V=
51–()× 1+=
Alarm Outputs Each alarm output connects to the contacts of a 5-Amp, Form C
(SPDT) relay.
Make connections as follows:
• For normally open contacts, connect to NO and COM.
• For normally closed contacts, connect to NC and COM.
Any available parameter can be used to control an alarm relay by
programming the parameter name and its threshold values. An alarm
can also be programmed to monitor the state of the Control, PACER
Balance, or Service indicators. (See Chapter 4, 5 or 6 for
programming instructions).
Two threshold values are programmed for each parameter—an upper
and a lower value. These values designate an alarm band. How they
are used depends on the alarm type programmed. Details of the alarm
bands are shown below.
2-10 Installation
Page 32

January 2006
Set Point Alarm For the Set Point alarm type, the alarm band provides hysteresis to
prevent frequent operation of the alarm relay when the parameter is
near the specified value. The relay is activated when the parameter
exceeds the upper limit, and deactivated when the parameter goes
below the lower limit.
Figure 2-12: Set Point Alarm
Inner Band Alarm For the Inner Band alarm type, the alarm relay activates whenever
the parameter value is between the lower and upper limits.
Figure 2-13: Inner Band Alarm
Outer Band Alarm For the Outer Band alarm, the alarm relay activates whenever the
parameter value is greater than the upper limit or less than the lower
limit.
Figure 2-14: Outer Band Alarm
Installation 2-11
Page 33

January 2006
Serial Output The Serial Output connector is located at the lower left of the rear
panel of the bench-mount unit, and the bottom panel of the wallmount unit. The output provides RS-232C serial communications
between the unit and a terminal or a PC running in terminal emulation
mode.
The connector is a standard 9-pin D connector. For connection to
another serial device, the cable is wired as shown below. For a basic
interface without handshaking, only pins 2, 3 and 5 (RX, TX and
GND) on the Optica connector are needed. Pin connections are given
for both 25-pin and 9-pin devices.
Table 2-1: Serial Output Connections
Optica Connector 25-Pin Device 9-Pin Device
Pin Connection Pin
2 (RX) 3 (TX) 3 (TX)
3 (TX) 2 (RX) 2 (RX)
4 (DTE) 6 (DSR) 6 (DSR)
5 (GND) 7 (GND) 5 (GND)
6 (DSR) 20 (DTE) 4 (DTE)
7 (RTS) 4 (CTS) 8 (CTS)
8 (CTS) 5 (RTS) 7 (RTS)
The baud rate, format of the data, number of stop bits, number of data
bits, and parity can all be programmed using the menus.
Connection
Pin
Connection
Sensor Information GE Infrastructure Sensing produces a variety of sensors compatible
with the Optica, ranging from one to five stages of thermoelectric
cooling. A comparison chart listing specifications of each sensor is
given in Appendix E. The following sections provide information on
installing the following GE Infrastructure Sensing dew point sensors:
• Model 1111H — Single-stage sensor
• Model 1211H — Two-stage sensor; for high pressure and temp.
• Model D-2 — Two-stage sensor
• Model SIM-12H — Two-stage heated sensor
• Model 1311DR — Four-stage heated sensor
• Model 1311XR — Five-stage water-cooled sensor
2-12 Installation
Page 34

January 2006
Sensor Information
(cont.)
When selecting a location for installing a sensor, consider the
following criteria:
• Locate the sensor as close as is practical to the source of the gas to
be measured, to keep the sampling lines as short as possible. This
minimizes the system response time and reduces the error rate at
low frost points due to sample line outgassing.
• Choose a sensor location that provides access to the dewpoint
sample cavity cover, to facilitate periodic mirror cleaning.
Caution!
Never place the sensor in a location where temperatures
rise above the maximum rated temperature for the device.
See Appendix D for complete sensor specifications.
Sampling Lines Keep the length of sample tubing between the source and the sensor
short, for quick response and highest accuracy.
All sampling line compression fittings provided with the sensor are
for ¼-inch diameter tubing, unless otherwise specified at the time of
order.
The material used for the inlet lines can have an important effect on
the validity of the readings. Do not use rubber hose or plastic tubing
such as PVC or Tygon, because of their hygroscopic nature.
When measuring frost points below –30°C, sample gas leaving the
sensor outlet should be vented through an additional line three to six
feet long, since backflow of ambient moisture into the sensor can take
place even under positive pressure. Use stainless steel tubing and
fittings, and ensure that all plumbing is completely free from leaks.
At dew/frost points above –20°C, tubing material is not as critical.
Copper, Teflon, polypropylene, aluminum or brass tubing and fittings
may be used. The sampling system should allow for periodic
cleaning. It may be helpful to install a tee and closing valve on the
inlet side, to permit the sensor to be shut off while the sampling lines
are flushed. At very low humidities, even a trace amount of
contamination can alter measured frost point, so cleanliness is
particularly important.
Installation 2-13
Page 35

January 2006
Ensuring Heat Transfer Be sure the sensor has an adequate heat sink when operating in hot
environments. The sensor must never be allowed to reach a
temperature above its rated limit. It is not sufficient merely to ensure
that the sensor is in an environment whose temperature is below the
rated limit; a means must be supplied to remove heat from the sensor.
When the Model 1111H or D-2 sensors are used at ambient
temperatures of 20° to 24°C, full rated depression can be achieved by
mounting the sensor on a smooth, thermally conductive surface (such
as metal), which tends to remain at the ambient temperature.
If possible, do not operate the sensor continuously at or near full
depression. Doing so may decrease the anticipated life of the
thermoelectric heat pump.
High Dew Point Measurements
Using Heated Sensors When measuring dew points at or above the ambient temperature, the
sensor must be heated to a temperature of at least 5 to 10°C above the
highest anticipated dew point (but not higher than the sensor
temperature rating). Some sensors can be mounted on a liquid heat
exchanger, or a temperature-controlled electric hot plate, or installed
in a heated enclosure. GE Infrastructure Sensing recommends closedloop active control of the elevated sensor body temperature.
Sample Lines for High Dew
Point Measurements
The sensor base should be coated with zinc-oxide-filled silicone
thermal grease and securely anchored to the heat sink with suitable
fasteners. Allow ½ hour for the sensor to reach thermal equilibrium
after adjusting the temperature of the heat sink.
The GE Infrastructure Sensing SIM-12H high temperature sensor is
designed for high-temperature applications. It measures dew points
above ambient temperature without condensation problems.
Sampling lines carrying gas to the sensor must be heated and
insulated when the dew point of the gas is above the sample line’s
ambient temperature. The simplest way to achieve this is to use heater
tape (either thermostatically controlled, or continuously operating,
and sized to provide the required temperature rise). At high
temperatures, use stainless steel tubing with adequate insulation to
avoid hot and cold sections in the line and to avoid water absorption/
desorption cycling as the heater is thermostatically controlled. Heated
sampling lines (HSL) are available from GE Infrastructure Sensing.
2-14 Installation
Page 36

January 2006
Filter Requirements If the gas to be monitored is free from particulates and hydrocarbon
liquids or vapor, filtering is not necessary. However, most sample gas
streams contain some particulates, and using a filter reduces the need
for frequent mirror cleaning. On the other hand, filtering tends to
slow the system’s response, particularly at low frost points.
The series 912 filters manufactured by Balston Company (or
equivalent) are effective for most applications. For particulates and
liquid hydrocarbons, use a Balston type DX filter element.
To filter out very fine particles, the type DX can be followed by a type
BX filter. A type CI filter can be used to remove hydrocarbon vapors.
If the sample gas is heavily and routinely contaminated, we
recommend using a quick-change filter element. Avoid using glass
wool, cellulose, and other hygroscopic materials as a filter medium.
Flow Rate It is important to have adequate flow through the sensor. Too little
flow can slow the response (particularly at very low frost points). Too
much flow can cause instability of the control system at high dew
points and can reduce the depression capability of the thermoelectric
cooler at very low dew points. Too much flow also accelerates the
rate of system contamination. A flow rate of 2 to 2.5 ft3/h (a little
over 1 liter/min) is ideal for most applications. In many cases, flow
rates between 0.2 and 5 ft3/h (0.1 and 2.5 liter/min) may be used.
Installation 2-15
Page 37

January 2006
Sensor Installation This section provides installation details for the GE Infrastructure
Sensing line of chilled-mirror humidity sensors.
Model 1111H Sensor The Model 1111H is an open-type sensor (see Figure 2-15 below).
It can be threaded into standard pipe fittings or mounted in a type
0111D pressure boss, which encloses it and adapts it for ¼-inch
compression fittings. When installing the sensor in the pressure boss,
remove the black aluminum sensor cover.
For maximum thermal conductivity, the base of the Model 0111D
pressure boss should be coated with heat-conducting grease. When so
installed on a surface suitable for dissipating heat, the sensor will
achieve its maximum rated depression. See the Chilled Mirror Sensor
Comparison Chart in Appendix D.
Figure 2-15: Model 111H Sensor
Model D-2 Sensor The Model D-2 is a general purpose, two-stage sensor with 65°C
(117°F) of depression capability. It features wetted parts of stainless
steel and glass, for durability in demanding industrial applications.
The Model D-2 can be used as a benchtop sensor, mounted to a heat
sink, or mounted to a cooling fan for maximum operating range.
Advanced features include field-replaceable optics and cooler
assemblies, and auxiliary visible light optics with a viewing window
for inspecting the mirror during operation (see Figure 2-16 below).
For maximum thermal conductivity, the base of the Model D-2 sensor
should be coated with heat-conducting grease. When so installed on a
surface suitable for dissipating heat, the sensor will achieve its
maximum rated depression. See the Chilled Mirror Sensor
Comparison Chart in Appendix D.
Figure 2-16: Model D-2 Sensor
2-16 Installation
Page 38

January 2006
Model 1311DR Sensor The 1311DR is a stainless steel, liquid cooled, four-stage sensor
suitable for measuring dew points between –75°C and +25°C.
Mount the 1311DR sensor so that the air inlet and exhaust openings
are free from obstruction (see Figure 2-17 below). If the sensor is
liquid cooled, vertical wall mounting is recommended, observing the
“UP” arrow on the case. This ensures that condensation forming on
cold portions of the 1311DR will drain from the enclosure.
At room temperatures (25°C) with air cooling, dew points from
–65°C to +25°C can be measured. When operating it without liquid
cooling, switch on the built-in fan. For lower frost point
measurements, a chilled-water coolant loop can be used for cooling.
Make sure the fan switch is off when using liquid cooling.
Sample flow rates from 0.5 to 5 standard cubic feet per hour
(0.25 to 2.5 liters per minute) should be used.
Caution!
If it can be avoided, do not operate the sensor
continuously at or near full depression. Doing so may
decrease the life of the thermoelectric heat pump.
Liquid cooling is required for measuring frost points below –65°C
(at 25°C ambient), and may be used to create faster response at higher
dew point temperatures. If a recirculating chiller is used, it should
have a capacity of at least 300 watts at the coolant temperature.
Switch the internal fan ON if air cooling is used; leave it OFF for
liquid cooling.
Install the gas sampling lines according to the instructions listed in
the section Sampling Lines on page 2-13.
Figure 2-17: Model 1311DR Sensor
Installation 2-17
Page 39

January 2006
Model 1311XR Sensor The 1311XR is a stainless steel, water cooled, five-stage sensor (see
Figure 2-18 below) that can measure frost points as low as –80°C.
The sample gas flow rate should be between 1 and 5 ft3/h. The
maximum permissible coolant temperature is +50°C; the minimum is
–10°C. A minimum coolant flow rate of 0.1 gallons per minute must
be maintained for most dew point measurements. If the fourth stage
power supply control is set below –65°C, the minimum coolant flow
rate is 0.25 gal/min. The coolant temperature affects the maximum
dew/frost point depression. For frost points of –80°C, coolant
temperature should be below 20°C.
Figure 2-18: Model 1311XR Sensor
Electrical Connections All the electrical connectors on the Model 1311XR dew/frost point
sensor are unique. The cables supplied with the sensor can only
interconnect the system in one way. Connect the cables as follows:
1. Plug the instrument into a 115/230 VAC power outlet.
2. Connect the 37-pin round black connector on the back of the
instrument to the 19-pin military-style connector on the back of
the 1311XR sensor.
3. Connect the 17-pin military style connector on the back of the
1311XR sensor to the 24-pin round connector on the back of the
heat pump controller module.
4. Connect the 9-pin round connector on the back of the heat pump
controller module to the 8-pin rectangular connector on the back
of the fourth stage heat pump power supply.
5. Plug the heat pump power supply into a 115/230 VAC outlet.
Coolant Connect the two 3/8-inch brass compression fittings on the back of
the 1311XR sensor to the coolant lines. Do not run the instrument
without sufficient coolant flow.
Suitable coolants include water, glycol and other noncorrosive
liquids. The coolant can be recirculated liquid or tap water that is
cooled or chilled. If a recirculating chiller is used, it should have a
capacity of at least 600 watts at the coolant temperature.
Sample Gas Fittings The 1311XR sensor has 1/4-inch stainless steel compression fittings
for sample gas inlet and outlet at the back of the sensor chassis.
2-18 Installation
Page 40

January 2006
Heat Pump Controller
Settings
The 1311XR’s heat pump controller module has the following
settings:
Table 2-2: Model 1311XR Heat Pump Controller Settings
Setting Function
When set to AUTO, the system operates fully automatically, controlling the heat
pump in response to any dew/frost point within its operating range. In AUTO mode,
the controller senses the current supplied by the Optica to the top two stages of the
AUTO
Below –55°C
–65°C to –10°C
Above –25°C
thermoelectric coolers. The controller switches on the fourth stage power supply, as
required to maintain the mirror temperature at the dew/frost point.
The AUTO setting is recommended for most applications.
If the frost point is known to be below –55°C, the switch can be set to this position to
provide slightly faster response than the AUTO setting. However, depression is
limited at this setting. If frost points approaching –80°C are to be measured, use the
AUTO setting.
If the dew/frost point is known to be between –65°C and –10°C, the switch can be
set to this position to reduce overshoot and settling time.
If the dew/frost point is known to be above –25°C, the switch can be set to this
position to reduce overshoot and settling time.
Fourth-Stage Power
Supply Control Knob
Heat Pump Controller
Error Indicators
Note: The third-stage power indicator may blink in any setting. This
is normal.
The control knob on the 1311XR’s fourth-stage power supply sets the
power consumption limit and the coolant requirement when
measuring dew/frost points using the AUTO or BELOW –55°C
settings. Set this knob to the lowest anticipated dew/frost point.
If the control is set lower than necessary, the system dissipates excess
power and requires additional cooling to remove the extra heat
generated. If the setting is too high, the system may not be able to
reach the true dew/frost point.
To allow the 1311XR sensor to act as a turnkey system (whereby it
will cover its entire range automatically), set the switch to AUTO and
the power supply control knob to the –80°C position.
The heat pump controller module has two overheat indicators
connected to thermal shutdown switches. If either indicator comes on,
check for and correct any problems before continuing operation.
Check the cable connections, coolant flow and coolant temperature.
Installation 2-19
Page 41

January 2006
Purging the Sensor Caution!
The 1311XR must be purged after each use, either with
the sample gas after measuring it, or with another dry
gas source. Otherwise, condensation inside the sensor
housing may cause corrosion and eventual failure of the
thermoelectric coolers.
For extremely dry gas measurements, the 1311XR sensor enclosure
must be purged with a gas having a frost point lower than –20°C. For
intermediate temperatures, any gas having a frost point at least as low
as the sample gas can be used.
The sample gas outflow from the sensor can be used for this purpose,
if it is suitable (non-explosive, non-lethal, etc). Introduce the purge
gas to the enclosure via the purge fitting on the rear of the sensor. The
simplest method for purging is to run the sample gas outflow through
the U-tube supplied with the sensor.
Model SIM-12H Heated Sensor and Components
Type SIM-HFT Heated
Filter Module
Type SIM-HFM Heated
Flow Meter
The SIM-12H heated sensor module is suitable for measuring dew/
frost points between –10°C and +85°C. It contains precision heating,
as well as cooling, capability. Three separate heaters are located in the
sensor walls, 120 degrees apart. Three temperature sensors measure
the body temperature at those points, and three control circuits
precisely adjust the temperature of each heater. Any detected
temperature gradient across the sensor cavity is immediately
eliminated, resulting in very even control. All three heaters are
controlled by the temperature set by the front panel selector knob.
The sensor is a two-stage unit, providing 65°C of depression
capability, and 60°C actual measurement range.
The SIM-HFT heated filter module allows the sample gas to be
purged of particulate contaminants prior to entering the sensor.
The incoming gas is first passed through a 90-micron prefilter, then a
15-micron final filter. All parts in contact with the sample are heated
to a constant 105°C, eliminating any possibility of condensation. The
sintered filters are easily removed for cleaning or replacing if
required.
The SIM-HFM heated flow meter module allows the sample gas flow
rate to be both measured and controlled at a rate that is optimum for
the sensor. A metering valve mounted on the front panel allows
control over a range of 0 to 2 ft3/h. All parts in contact with the
sample gas are heated to a constant 105°C, so that no condensation
occurs. The flow meter is normally mounted downstream from the
heated sensor.
2-20 Installation
Page 42

January 2006
Type SIM-HSL Heated
Sampling Line
Type SIM-MPL Mounting
Plate
The SIM-HSL heated sampling line is self-regulated at a temperature
high enough to ensure that no condensation occurs. The line is made
of ¼-inch outside diameter Teflon, with stainless steel fittings.
The SIM-MPL mounting plate is designed to accept one, two or three
heated modules: the heated sensor, the heated filter, and the heated
flow meter. The mounting plate provides a convenient method of
wall-mounting the entire heated sampling system. When ordered with
one or more modules, the factory performs all mounting, plumbing
and wiring work, thus providing a complete system ready for
installation.
Connecting the Sensors Dew point, temperature and pressure sensors provided by GE
Infrastructure Sensing for the Optica monitor are pre-wired with
connectors installed. Plug these connectors into their corresponding
sockets as shown in Figure 2-5 on page 2-5 for the benchtop unit, or
Figure 2-8 on page 2-7 for the wall-mount unit.
Installation 2-21
Page 43

Chapter 3
Page 44

Operation
Introduction. . . . . . . . . . . . . . . . . . . . . . . . . . . . . . . . . . . . . . . . . . . . . . . . . . . . 3-1
Normal Operation . . . . . . . . . . . . . . . . . . . . . . . . . . . . . . . . . . . . . . . . . . . . . . 3-1
Operating the VGA Optica . . . . . . . . . . . . . . . . . . . . . . . . . . . . . . . . . . . . . . . 3-2
Operating the 4x40 Optica. . . . . . . . . . . . . . . . . . . . . . . . . . . . . . . . . . . . . . . 3-3
Network Operation . . . . . . . . . . . . . . . . . . . . . . . . . . . . . . . . . . . . . . . . . . . . . 3-3
Process Pressure . . . . . . . . . . . . . . . . . . . . . . . . . . . . . . . . . . . . . . . . . . . . . . . 3-4
Status Line Indications . . . . . . . . . . . . . . . . . . . . . . . . . . . . . . . . . . . . . . . . . . 3-8
Sensor Balancing . . . . . . . . . . . . . . . . . . . . . . . . . . . . . . . . . . . . . . . . . . . . . . 3-10
Helpful Hints For Operating the Unit . . . . . . . . . . . . . . . . . . . . . . . . . . . . . 3-10
Page 45

January 2006
Introduction Operating instructions fall into three categories:
• Normal Operation - Using the unit’s controls.
• Setup and Programming - Customizing the unit for specialized
applications (not required for many conventional applications).
Note: The unit is shipped pre-programmed to meet typical
requirements. The factory default settings are listed in
Table 3-2 on page 3-9. Complete programming instructions
are given in Chapters 4, 5, and 6.
• Maintenance - Manually testing the unit’s cooling capacity,
cleaning the mirror, and other operations that might be required on
a regular basis, or when a problem is suspected, depending on the
application. Details are given in Chapter 7, Maintenance.
Normal Operation Normal operation of the Optica is very simple. To turn the unit on,
check that the main power switch on the rear of the benchtop unit is
set to ON (—), then press the right-hand side of the power switch
(located at the lower left corner on the front of the unit).
The Optica begins its power-up sequence, which lasts about a minute.
The unit’s software version is displayed on the initial screen. The
status line displays Initializing. Next, the Optica performs a PACER
balance. The PACER balance typically requires five to fifteen minutes,
depending on the sensor chosen and the humidity of the sample gas
during the balance cycle. The status line displays Balance Acquiring.
Once the balance cycle is completed and the unit reaches steady state,
Control is displayed in the status bar at the bottom of the screen.
The sensor can be controlled using the softkeys to the right of the
display, shown on the screen below. The operator can manually heat
or cool the sensor, or initiate a PACER balance cycle.
Operation 3-1
Page 46

January 2006
Operating the VGA Optica
The parameters chosen during programming are displayed
numerically in the top half of the screen, and graphically at the
bottom (see Figure 3-1 below). To program the unit, see Chapter 4.
A balance indicator is shown as a vertical bar on the right side of the
screen. It shows the state of the feedback control loop controlling the
mirror temperature. When the system reaches steady-state (the
Control status indicator is displayed), the balance indicator should be
near the center of its range. If the balance indicator is near the top or
bottom of its range, the dew point sensor may need to have its optics
signal level adjusted (see Balancing the Sensor Optics on page 7-2).
Figure 3-1: Typical VGA Display Screen
3-2 Operation
Page 47

January 2006
Operating the 4x40 Optica
The parameters chosen during programming are displayed
numerically on the top three lines of the display. For programming,
see Chapter 5. A typical 4x40 display screen is shown below. The
system status is shown in the lower left, and the balance indicator is
shown in the lower right.
Tdew ° C 8.47996 Heat
%RH 10.3
Tmp ° C 25.355
Control
Cool
Pacer
Figure 3-2: Typical 4x40 Display Screen
The balance indicator should show about five to seven blocks in
normal operation. If it shows fewer than four or more than eight, the
dew point sensor may need to have its optics signal level adjusted
(see Figure 3-3 below and Balancing the Sensor Optics on page 7-2).
Heat
Cool
Pacer
Heat
Cool
Pacer
Heat
Cool
Pacer
Sensor not
well-balanced
Sensor
balanced
Sensor not
well-balanced
Figure 3-3: Possible Balance Indicator Displays
Network Operation The VGA Optica can be operated and programmed remotely over a
network. Networked operation is very similar to operation using the
front panel. For programming from a network, see Chapter 6. A
typical network screen is shown in Figure 3-4 below.
Figure 3-4: Typical Network Screen
Operation 3-3
Page 48

January 2006
Process Pressure The Optica provides several ways of measuring or specifying sample
gas pressure (needed for pressurized humidity measurements). You
can:
• actively measure the pressure at the dew point sensor, or
• manually enter the pressure, if it is known and stable, or
• “sample-off” a high-pressure gas sample for measurement at a
lower pressure (usually atmospheric) and let the Optica calculate
dew point at the process pressure.
For example: a sensor with a maximum pressure rating of 300psi
cannot be subjected to a process pressure of 500 psi. A sampling
system can be arranged to allow the measurement to be made at
atmospheric pressure. The Optica can then calculate and display
the dew point at the process pressure (see Scenario 2 on page 3-6).
Actively Measuring Process Pressure
Manually Entering Pressure
Measuring at a Different Pressure
Use when the process pressure is within the specifications of the dew
point sensor and can be measured directly. In the Pressure Input
menu, set the Pressure Input to V or I as appropriate for the pressure
sensor. Set the Process Pressure Status to Disabled.
Note: The pressure measured by the pressure sensor will be used to
compute the vapor pressure.
Use when the process pressure is a known and fixed value, and will
not be actively measured. In the Pressure Input menu, set the Pressure
Input to Use Default. Enter the pressure into the Default field. Set the
Process Pressure Status to Disabled.
Note: The default pressure entered will be used to compute the vapor
pressure.
Use when: the humidity must be measured at a pressure that is lower
or higher than the process pressure, but the reported value must
represent the humidity at the process pressure. Scenario 2 below gives
examples of programming the Optica for this case.
Note: The process pressure is entered manually and the humidity
sensor pressure may be measured or manually entered.
Examples of the use of the Process Pressure menu are shown
3-4 Operation
Page 49

January 2006
Scenario 1: Measurement Without Enabling the Process Pressure Feature
Measuring Vapor Pressure
Without a Pressure Sensor
Process pressure is 100psi, within the range of a typical GE
Infrastructure Sensing chilled mirror sensor. Since vapor pressure and
dew point are pressure-dependent, a flow meter is installed
downstream of the sensor to assure that the sensor cavity is at the
process pressure (see Figure 3-5 below).
Figure 3-5: Measurement Scenario 1
To measure vapor pressure without a pressure sensor, make the
following entries in the Pressure Input menu section for this example:
• Input: Use Default
• Units: psia
• Default: 100
• Process Status: Disabled
Measuring Vapor Pressure
With a Pressure Sensor
To measure vapor pressure with a 4-20 mA, 0-30 psia pressure sensor,
connect the sensor to the Optica’s terminal block and make the
following entries in the Pressure Input menu:
• Input: Iin 4-20
• Units: psia
• Upper: 30.00
• Lower: 0.00
• Process Status: Disabled
Measuring Dew Point In this scenario, dew point can be measured without knowledge of gas
pressure. Connect the equipment as shown above, with or without a
pressure sensor, and follow the normal operating procedures.
Operation 3-5
Page 50

January 2006
Scenario 2: Measurement Requiring the Process Pressure Feature
Process pressure is 500 psi, above the measurement range of a typical
GE Infrastructure Sensing chilled mirror sensor. A flow meter is
installed upstream of the sensor cavity to expand the gas to be within
the measurable range of the dew point sensor. Since we wish to
measure the dew point of the process gas and dew point is pressure
dependent, an accurate dew point measurement at the process
pressure requires accommodating for the expansion to the sensor
cavity pressure by using the Optica’s Process Pressure feature (see
Figure 3-6 below).
Measuring Vapor Pressure
Without a Pressure Sensor
Figure 3-6: Measurement Scenario 2
To measure vapor pressure without a pressure sensor, make the
following entries in the Pressure input menu section for this example:
• Input: Use default
• Units: psia
• Default: 14.7 (the pressure at the dew point sensor)
In addition, to accommodate the pressure expansion, the following
entries are required in the Process section:
• Status: enabled
• Pressure: 500 (specify the process pressure with the same units
as the default pressure specified above)
3-6 Operation
Page 51

January 2006
Measuring Vapor Pressure
With a Pressure Sensor
Measuring Dew Point With
or Without a Pressure
Sensor
To measure vapor pressure with a 4-20 mA, 0-30 psia pressure sensor,
connect the equipment as shown above and make the following
entries in the Pressure Input menu section.
• Input: Iin 4-20
• Units: psia
• Upper: 30.00
• Lower: 0.00
In addition, to accommodate the pressure expansion, the following
entries are required in the Process section:
• Status: enabled
• Pressure: 500 (specify the process pressure with the same units
as the default pressure specified above)
In Scenario 2, the dew point measurement requires both the sensor
pressure and the process pressure to be known. Sensor pressure can
be entered as a default value, or measured, as above, and the process
pressure must be entered in the Process Pressure field.
Example (using standard atmospheric conditions at 25°C)
P1 = 500 psia
P2 = 14.7 psia
As measured by the GEI chilled mirror dew point sensor:
Tdew2 = –40°C @ P2
e2 = 0.1283 mbar
Per Dalton’s Law of Partial Pressure:
e1 = (P2/P1) × e2 = (500/14.7) × 0.1283 = 4.36 mbar
Using standard vapor pressure equations, the actual pressurized dew
point is calculated by the Optica to be:
Tdew1 = –4.022°C
Operation 3-7
Page 52

January 2006
Status Line Indications The status line at the bottom of the display shows whether the unit is
ready for normal operation, or is still in its start-up phase, or needs
service. The following is a complete list of status indications:
Table 3-1: Status Indications
Indication Meaning
Initializing The unit is initializing.
Balance
The unit is performing a PACER balance to clear
the mirror.
Acquiring The unit is acquiring stable mirror temperature.
Service
Control
The sensor optics require service, cleaning or
adjustment.
The unit is actively controlling the mirror
temperature at a stable dew point.
Alarm 1 Alarm 1 has activated.
Alarm 2 Alarm 2 has activated.
Lockout
Heat, Cool, and PACER front panel controls are
disabled.
Heat Sensor Heating is active.
Cool Sensor Cooling is active.
3-8 Operation
Page 53

January 2006
Factory Default Settings As shipped from the factory, the Optica is normally programmed with
the configuration shown in Table 3-2 below.
Table 3-2: Factory Default Values
Function Setting
Analog Output A
Analog Output B
Pressure Input 1
Alarm 1
Alarm 2
Humidity, Units: Tdew °C, Range: –40°C to +60°C
Temperature, Units: Tmp °C, Range: 0 to 100°C
Units: psia, Range: 0–30, Default pressure: 14.70,
Process pressure: disabled, 14.70
Disabled, Humidity, Units: Tdew °C, Set Point: 100.00
Disabled, Temperature, Units: Tmp °C, Set Point: 100.00
Auto Balance Interval: 720 minutes, Automatic, Disabled, Hold
Data Field 1
Data Field 2
Data Field 3
Data Field 4
Data Field 5
Data Field 6
Humidity, Units: Tdew °C, Range: –40.000 to +60.000°C, Color: green, 1 decimal
Humidity, Units: %RH, Range: 0 to 100, Color: blue, 1 decimal
Temperature, Units: Tmp °C, Range: 0 to 100, Color: red, 1 decimal
Pressure, Units: psia, Range: 0 to 100, Color: yellow, 1 decimal
Humidity, Units: ppmv, Range: 0 to 1,000,000, Color: brown, 1 decimal
Humidity, Units: ppmw, Range: 0 to 100, Color: violet, 1 decimal
Buzzer 15 msec
General Data Fields: 3, Lockout: disabled, Offsets and filters: 0
Special Molecular Weight of Gas: 28.9645
User Equation None entered
Communication
Parameters
Serial Outputs
Selected
Outputs
Data Log
Mode: All, Baud rate: 9600, Parity: none, Data bits: 8, Stop bits: 1,
Flow control: none
Humidity: Units: Tdew °C, Format: DP=##.#, Separator: CR-LF, Terminator: CR-LF,
Interval: 1 second, Time Stamp: Enabled, Show Status: Enabled
Temperature: Units: Tmp °C, Format: DP=##.#, Separator: CR-LF, Terminator: CR-LF,
Interval: 1 second, Time Stamp: Enabled, Show Status: Enabled
Pressure: Units: psia, Format: DP=##.#, Separator: CR-LF, Terminator: CR-LF,
Interval: 1 second, Time Stamp: Enabled, Show Status: Enabled
Humidity, Units: Tdew °C
Humidity, Units: % RH
Temperature, Units: Tmp °C
Status: Disabled, Interval: 1 second, Separator: comma, Terminator: CR-LF,
Parameters: humidity, Units: Tdew °C
Operation 3-9
Page 54

January 2006
Sensor Balancing During normal operation, the sensor mirror surface may become
partially obscured with salts or other contaminants from the sample
gas. The balance indicator displayed on the screen shows whether the
system is operating near the center of its normal range, or has been
forced away from the center by mirror contamination. In general, it is
recommended to start with an AUTO balance cycle provided
relatively clean gases are being used. If the Service status indicator is
displayed after an AUTO cycle, the mirror is likely still dirty and may
require use of a PACER cycle (described in detail on page 1-6). In
most applications, it is desirable to perform a balance operation
periodically to maintain optimum performance. The interval and type
of balance are configurable as described in chapters on Optica
programming.
If the Service indicator is displayed after a balance operation, the
sensor may need to be adjusted (see Balancing the Sensor Optics on
page 7-2).
Helpful Hints For Operating the Unit
Time response At dew points above 0°C, the system stabilizes within
a few minutes at a consistent dew layer. The status Control is
displayed when the system is stable and readings are valid.
When the system is operating at low frost points (below –40°C), extra
care may be required when interpreting readings because of the
longer response times of the system. Time response depends on a
number of factors including dew/frost point, slew rate, upstream
filtering, and flow rate.
• As the dew/frost point becomes lower, water molecules in the air
sample become scarcer, and it takes longer to condense a frost
layer on the mirror thick enough to establish an equilibrium
condition.
• Mirror temperature slew rate depends on dew point and depression
(the temperature difference between the mirror and the sensor
body); at higher dew points and moderate depressions, it is
typically 1.5°C/second. At lower dew points and/or larger
depressions, the slew rate is slower.
• Flow rate affects response by determining the rate at which water
vapor is supplied or carried off.
There is, of course, a trade-off between response time, control system
stability, and sensitivity to contamination.
3-10 Operation
Page 55

January 2006
Supercooled Dew Points Slightly below the freezing point, water can exist in a supercooled
liquid state for extended periods of time. Extra care may be needed
when making measurements in the frost point region of 0 to –20°C,
because the mirror temperature may temporarily stabilize at the
supercooled dew point, 0.5 to 1°C below the actual frost point.
To assure that the unit is operating in the ice phase within this
temperature range, allow the instrument to operate continuously.
Before manually clearing a frost layer, take a reading, and afterwards
allow sufficient time to reform a stable frost layer before taking
further readings.
Contamination
Mirror Cleanliness Proper operation of a condensation hygrometer depends on the
condition of the mirror surface. In general, accuracy is reduced when
contaminants accumulate on the mirror.
However, the mirror does not have to be microscopically clean. In
fact, the mirror performs best a few hours after cleaning, when
nucleation sites have formed. On an unscratched, freshly cleaned
mirror, there are relatively few nucleation sites on which dew or frost
deposits can form, and more time is required to collect a condensation
layer at low frost points. Also, overshoot may occur, which can cause
oscillations as the temperature stabilizes.
Particulate Contaminants Particulate matter that is insoluble in water may accumulate on the
mirror surface, but does not affect the instrument accuracy until the
mirror reflectance is reduced substantially. In many cases, particulates
improve instrument response by providing condensation sites.
Operation 3-11
Page 56

January 2006
Water-Soluble
Contaminants
Contaminants which readily dissolve in water, such as naturally
occurring salts, are detrimental to accurate vapor concentration
measurement by any condensation method. These materials readily
go into solution with the water condensate on the mirror surface, and
then reduce the vapor pressure in accordance with Raoult’s Law. As
the concentration increases with time, the saturation vapor pressure of
the liquid solution decreases.
The unit responds to this lower vapor pressure by elevating the mirror
temperature in order to maintain a vapor pressure that is in
equilibrium with the partial pressure of atmospheric water vapor. The
displayed dew point, therefore, drifts upward above the true dew
point. Because the measurement error increases gradually, it often
goes undetected.
To determine whether dissolved contaminants are affecting dew point
measurement, perform the following steps:
1. Note the indicated dew point.
2. Clean the mirror.
3. Balance the detector by initiating a PACER cycle.
4. Measure the dew point again.
If the new reading is lower than the first reading, it is likely that
soluble material was present in sufficient quantity to cause a
measurement error.
Gaseous Contaminants When a gaseous material that has a higher condensation temperature
than that of water is present (even in very low concentrations), the
unit will eventually control on that material, rather than on water. The
system then displays the condensation temperature of the
contaminant, not of water. Such material accumulates on the mirror
only when chilled. In the normal atmosphere, gaseous contaminants
do not have a detectable effect.
3-12 Operation
Page 57

January 2006
Minimizing the Effects of
Contaminants
The following steps are suggested for maintaining optimum
performance:
• Use the PACER feature to reduce the effect of contaminants on the
unit’s performance (see The PACER Cycle on page 1-6).
• Reduce the gas flow rate to reduce the rate of accumulation of
contaminants on the mirror.
• Clean the mirror according to the recommended optics cleaning
procedure (see Cleaning the Sensor Mirror on page 7-1). To
determine the proper cleaning interval for a given set of conditions,
take a dew point reading before and after the cleaning. Any
appreciable shift indicates that under these conditions, the mirror
should be cleaned more often.
Mirror Flooding If there is an abrupt transition from dry to moist conditions
(particularly when accompanied by a transition from cold to warm
temperatures), the mirror may accumulate an overload of moisture. It
then may take several minutes before the sensor dries out and valid
readings can be obtained. The drying process can be accelerated by
heating the sensor.
Sample Line Maintenance Contaminated sample lines slow the unit’s response time and can
cause erroneous readings, usually on the high side. Clean the sample
lines as often as necessary. To determine the required cleaning
frequency, take dew point readings before and after cleaning the lines,
sensor cavity, and mirror. If the two readings differ appreciably, the
sampling lines should be cleaned more often. To reduce the rate of
contamination, reduce flow and/or install a filter upstream.
Pressure Effects If the pressure of the gas is increased or reduced from atmospheric
pressure, but the mixing ratio (moisture content) stays constant, the
dew point is correspondingly increased or decreased. The Optica
displays the dew/frost point at the pressure to which the sensor
chamber is exposed. The sensor location and hookup arrangement can
influence the pressure.
When the pressure at the sensor is different from the process pressure,
the Optica can perform a conversion from the measured pressure to
the desired process pressure (see Process Pressure on page 3-4 for
details).
Alternatively, the dew point change due to pressure change can be
calculated by using Dalton’s Law and the Smithsonian Tables or a
proper nomograph. Appendix C contains basic data for these
calculations.
Operation 3-13
Page 58

Chapter 4
Page 59

Programming the VGA Optica
Introduction. . . . . . . . . . . . . . . . . . . . . . . . . . . . . . . . . . . . . . . . . . . . . . . . . . . . 4-1
Programming Fundamentals. . . . . . . . . . . . . . . . . . . . . . . . . . . . . . . . . . . . . 4-1
Units of Measure. . . . . . . . . . . . . . . . . . . . . . . . . . . . . . . . . . . . . . . . . . . . . . . . 4-4
User Equations . . . . . . . . . . . . . . . . . . . . . . . . . . . . . . . . . . . . . . . . . . . . . . . . . 4-4
Menu 1 . . . . . . . . . . . . . . . . . . . . . . . . . . . . . . . . . . . . . . . . . . . . . . . . . . . . . . . . 4-6
Menu 2 . . . . . . . . . . . . . . . . . . . . . . . . . . . . . . . . . . . . . . . . . . . . . . . . . . . . . . . 4-15
Saving Configuration Files. . . . . . . . . . . . . . . . . . . . . . . . . . . . . . . . . . . . . . 4-20
Page 60

January 2006
Introduction The Optica is programmed at the factory to display and output the
data required for many applications (see Table 3-2 on page 3-9). In
these cases, no further programming is required.
By programming the Optica, the following categories of data can be
customized for your application:
• the front panel display (up to six parameters displayed numerically
and, on the VGA screen, a graphical display)
• pressure input
• analog outputs
• serial output
• built-in alarms
• datalogging
• miscellaneous functions
Programming Fundamentals
A built-in help system is included to answer questions you may have
while operating the unit. Select the HELP button and press ENTER to
access it.
Programming is accomplished using two main menu screens and
several secondary screens. Each screen displays data fields and
control buttons. Use the TAB key to step through the fields on each
screen—through both the data fields and the control buttons.
• when a data field is selected, you can change the value of the field
as described on page 4-2.
• when a control button is selected, pressing ENTER performs the
button’s function.
• The MORE control button accesses the next programming
menu.
• The OK control button returns to the previous level.
• The HELP button accesses the unit’s built-in help system.
Programming the VGA Optica 4-1
Page 61

January 2006
The Keys The following keys on the Optica’s front panel are used for
programming:
• ENTER Performs the function shown on a selected control button.
• TAB Moves cursor to the next field or control button to select it.
• SHIFT An alternate action key—each press toggles SHIFT-KEY
mode on or off. When SHIFT-KEY mode is on, a green
annunciator is displayed in the lower left corner of the screen.
SHIFT-KEY mode does the following:
• accesses the alphabetic characters below the keys on the
alphanumeric keyboard.
• causes the TAB key to move the cursor backwards through the
fields.
• Ten alphanumeric keys For entering numbers, letters and math
functions.
• BSP (Backspace) During direct data entry, deletes the character to
the left of the cursor.
• Four softkeys:
• during normal operation, control the sensor heating and
cooling, and balance function.
• during programming, move the cursor on the screen and select
specific characters for each key on the alphanumeric keyboard.
Data Entry Fields There are two types of data entry fields:
• direct entry
• drop-down boxes
Direct-Entry Fields Direct-entry fields allow new values to be entered directly from the
alphanumeric keyboard. Use the left and right softkeys to move the
flashing cursor on the screen to the desired character.
• To enter numeric data, just press the appropriate key.
• To enter alphanumeric data, first press SHIFT to access the letters
on the keypad, and then press the appropriate key containing the
desired letter. Finally, press the UP or DOWN arrow softkeys to
step through the letters available for that key, both upper and lower
case.
4-2 Programming the VGA Optica
Page 62

January 2006
Direct-Entry Fields (cont.) Note: It is NOT necessary to press ENTER after setting each value
into its field.
Figure 4-1 below shows a typical direct-entry field, with the GrphMin
(Graph Minimum) field selected and ready for numeric input from the
keypad.
Figure 4-1: Typical Direct-Entry Field
Drop-Down Boxes Most programming is done using drop-down boxes that allow the
user to select from a list of possible choices for the field.
First, select the field with the TAB key. A drop-down list showing the
available options opens immediately below the selected field. Be
careful not to confuse this drop-down list with other fields below the
selected one—they look similar. Use the UP and DOWN arrow
softkeys to select the desired value for the field. When finished, press
TAB to move to the next field.
Figure 4-2 below shows a drop-down entry box, with the GrphColor
(Graph Color) field selected and ready for choosing the desired color
using the UP and DOWN arrow softkeys.
Figure 4-2: Typical Drop-Down Box
Programming the VGA Optica 4-3
Page 63

January 2006
Units of Measure Table 4-1 below shows the units of measure available for each
parameter:
Table 4-1: Available Units of Measure
Parameter Available Units
Humidity
Temperature
Pressure
Tdew °C, Tdew °F, %RH, Twet °C, Twet °F, ppmv,
ppmw, Grains/lb, Grains/SCF, g/kg, g/m
kj/kg(0), kj/kg(32), BTU/lb(0), BTU/lb(32), pw(mbar)
Tmp °C, Tmp °F, Tmp °K, Tmp °R
psia, mbar, bar, Pa, kPa, mmHg, inHg, kg/Cm2,
Dyne/Cm
2
3
, lb/mft3,
User Equations In some applications an output may be needed that is not a simple
function of a single parameter, but a combination of two or three. One
or more user equations can be defined within the Optica to calculate
new parameters that meet the application’s requirements. The
equation can be formed from following elements:
• the identifiers for the measured or derived parameter units (listed
in Table 4-2 on page 4-5).
• the math operators +, –, ×, /, (, ) and ^ (accessed through the math
key in SHIFT mode)
• the math functions LOG and LN
• constants
• other user equations
The new parameter defined by this equation is given a name and can
be displayed or output just like any other parameter.
User Equations are entered from Menu 2 (see page 4-15). A list of
parameters and other elements is displayed. Each element is specified
by an identifier such as “A1.” Use these identifiers to form the
equation. In addition, another user equation can be used as an
equation element by entering its identifier.
4-4 Programming the VGA Optica
Page 64

User Equations (cont.)
January 2006
Table 4-2: User Equation Parameters
Identifier Units Identifier Units
Humidity Units: Temperature Units:
A0 Tdew °C A17 Tmp °C
A1 Tdew °F A18 Tmp °F
A2 %RH A19 Tmp °K
A3 Twet °C A20 Tmp °R
A4 Twet °F Pressure Units:
A5 ppmv A21 PSIA
A6 ppmw A22 mbar
A7 grains/lb A23 bar
A8 grains/scf A24 Pa
A9 g/kg A25 kPa
A10 g/m3 A26 mmHg
A11 lb/mft3 A27 inHg
A12 kj/kg(0) A28 kg/cm2
A13 kj/kg(32) A29 Dynes/cm2
A14 BTU/lb(0) A31 User Equation 1
A15 BTU/lb(32) A32 User Equation 2
A16 pw(mbar) A33 User Equation 3
The equation 2 × Tdew °F + (%RH / Twet°C) would be entered as
2 × A1 + (A2 / A3)
Programming the VGA Optica 4-5
Page 65

January 2006
Menu 1 The first menu is shown in Figure 4-3 below. This menu is accessed
by selecting the Menu control button on the main screen and pressing
ENTER.
Figure 4-3: Menu 1
Menu 1 allows programming of the following items:
Analog Outputs For more information on using the analog outputs, see Analog
Outputs on page 2-9.
Table 4-3: Analog Output Options
Item Function Available Options
Output
Parameter
Units
Upper Limit
Lower Limit
Choose which output channel is being programmed A and/or B
Choose which parameter will be output on the
selected channel
Choose the units for this parameter
Set the parameter value that will produce full-scale
output
Set the parameter value that will produce zero
output
Humidity, Temperature,
Pressure or User Equation
(See Table 4-1 on page 4-4
for the parameter chosen)
(Enter a number)
(Enter a number)
4-6 Programming the VGA Optica
Page 66

January 2006
Pressure Input For more information on using these items, see Process Pressure on
page 3-4.
Table 4-4: Pressure Input Options
Item Function Available Options
Input
Units
Upper Limit
Lower Limit
Default
Process
Status
Pressure
Choose which pressure input channel is in use, or
disable this input.
Choose the units for the pressure input. (See Table 4-1 on page 4-4 for
Set the pressure that corresponds to full-scale input. (Enter a number.)
Set the pressure that corresponds to zero volts or
4 mA input.
Pressure value to be used if the measured input is
disabled.
Enter a process pressure when it is different from the
pressure at the dew point sensor (see page 3-4).
Set whether the process pressure is active (enabled). Enable/Disable
Enter the process pressure, if this feature is enabled. (Enter a number.)
V in (0-5), I in (4-20), or Use
Default
parameter chosen.)
(Enter a number.)
(Enter a number.)
Programming the VGA Optica 4-7
Page 67

January 2006
Alarms For more information on using the alarms, see Alarm Outputs on
page 2-10.
Table 4-5: Alarm Options
Item Function Available Options
Alarm
Status
Parameter*
Units*
Type
Upper*
Lower*
*These fields ar ignored if the alarm is set to Control, Service, or PACER.
Choose which alarm relay is being programmed. 1 and/or 2
Set whether or not the alarm is enabled. Enabled or Disabled
Set the parameter that can activate this alarm.
Set the units for this parameter.
Set the type of condition that will activate the alarm
The upper side of the alarm band Enter a number.
The lower side of the alarm band Enter a number.
The Upper and Lower limits set the alarm thresholds as described
below for each alarm type (see details on page 2-10):
Humidity, Temperature,
Pressure or User Equation
(See Table 4-1 on page 4-4
for parameter chosen.)
SetPoint, Inner Band, Outer
Band, Control, Service, PACER
• SetPoint: alarm activates when parameter exceeds upper limit, and
deactivates when parameter is less than lower limit.
• Inner Band: alarm activates when parameter is between upper and
lower limits.
• Outer band: alarm activates when parameter is outside upper and
lower limits.
• Control: alarm activates when Optica is actively controlling mirror
temperature.
• Service: alarm activates when Service indicator is activated.
• PACER: alarm activates when PACER balance is active.
4-8 Programming the VGA Optica
Page 68

January 2006
Automatic Cleaning and Balance Function
Note: For Optica Analyzers with earlier versions of software, see
Appendix F.
Optica Analyzers with version XXX software have been upgraded to
include the ability to program the PACER self-cleaning and
rebalancing cycle to run once per day at a preset time. This is referred
to as a Clock Time Interval. When the unit is programmed in this
manner, the front panel PACER softkey is disabled. The Elapsed Time
Interval initiates the PACER at a preset time after the last PACER was
run. The automatic balance cycle will always run upon power up of
the analyzers.
To program the Automatic Cleaning & Balance Function on the
Optica VGA monitor:
1. Make sure the internal clock of the Optica has the correct time.
a. From the main screen enter Menu, then More, then Set Time
and Date.
b. Highlight the Date and Time fields and use the Keypad and
Softkeys to set the correct time.
2. Set the Time Programmed Balance Cycle.
a. Enter Menu and go to the Automatic Balance Section.
b. Open the Type pull down menu and choose one of the four
selections (see Table 4-6 below).
Table 4-6: Automatic Cleaning and Balance Functions
Item Function Type
AUTO Heats the mirror and balances the optics. Elapsed Time Interval
PACER
AUTO-D Heats the mirror and balances the optics. Clock Time Interval
PACER-D
First cools the mirror to develop a thick dew/frost
layer, then heats and balances the optics.
First cools the mirror to develop a thick dew/frost
layer, then heats and balances the optics.
Elapsed Time Interval
Clock Time Interval
Note: The PACER function will provide more thorough cleaning than
the AUTO function because it first develops a thick dew/frost
layer into which soluble contaminants dissolve. When heated,
some of the contaminants are flash-evaporated and the
remaining residue accumulates in clusters, resulting in an
approximately 85% cleaner surface. The PACER cycle
generally takes longer to complete.
Programming the VGA Optica 4-9
Page 69

January 2006
Automatic Cleaning and
Balance Function (cont.)
3. Manually clean the mirror as required.
Note: Manual cleaning provides the most thorough cleaning.
4. After manual cleaning, initiate the Automatic Cleaning &
Balancing.
5. To program a specific time of day at which to initiate the
Automatic Cleaning and Balancing:
a. Highlight either Auto-D or Pacer-D.
b. In the Enter Time dialog box, input the time of day that you
would like to initiate the balance cycle in a 24-hour format (for
example, 13:30 would be 1:30 PM).
Note: In this mode the front panel Pacer initiation function is
disabled. Powering down and restarting the unit will have no
effect on the time programmed, however the PACER will run
on startup as is the normal function.
6. To program an elapsed time to initialize the Automatic Cleaning
and Balancing:
a. Highlight either Auto or Pacer.
b. In Interval dialog box, input the elapsed time in minutes (for
example, 720 would enable the balance cycle to run every 12
hours).
Note: If the unit is powered down and restarted, or the Automatic
Balance is initiated from the font or by using a LAN, the
elapsed time will reset.
Note: Show Status should read “Enabled”.
7. Select either Track or Hold for the analog outputs
(4-20mA/0-5VDC).
Note: If Track is selected, the actual temperature of the mirror will
be transmitted. If Hold is selected, the last prevailing dew
point, measured before the balance cycle was initiated, will be
transmitted during the time that the balance cycle is running.
IMPORTANT: For environments or a gas sample where the mirror
accumulates contamination rapidly, the use of an
inline filter is recommended. Lower flow rates will
also reduce the accumulation of contaminants.
4-10 Programming the VGA Optica
Page 70

Data Fields
Table 4-7: Data Field Options
Item Function Available Options
January 2006
Field
Parameter
Units
GrphMax
GrphMin
GrphColor
Decimals
Graph line number and numeric display number to
be programmed
For the field selected above, choose which
parameter will be output.
Choose the units for this parameter See Table 4-1 on page 4-4 for
Set the parameter value that will produce full-scale
on the graph.
Set the parameter value that will produce zero on the
graph.
Set the color for the selected graph line. Black, Red, Green, Orange,
The number of decimal places for the numeric display
1, 2, 3, 4, 5 or 6
Humidity, Temperature,
Pressure or User Equation
the parameter chosen.
(enter a number)
(Enter a number.)
Blue, Violet, Yellow or Brown
Enter a number (6 maximum).
Buzzer/Sound
Table 4-8: Buzzer/Sound Option
Item Function Available Options
Buzzer/Sound Sets the length (apparent loudness) of keyclick
sounds.
Enter length of keyclick sound
in msec (150 msec maximum).
Programming the VGA Optica 4-11
Page 71

January 2006
Network Menu Networking settings including IP Address, Subnet Mask and Default
Gateway. Generally, you will obtain these settings from your network
administrator. This menu is accessed by selecting the Network
control button on Menu 1 and pressing ENTER.
Figure 4-4: Network Menu
Table 4-9: Network Settings Options
Item Function Available Options
Host Name Enter the host name for the Optica unit of the LAN.
Domain Enter the Domain name for the local network.
IP Address
Type*
IP Address*
Subnet Mask*
Default
Gateway*
OK button Save changes and return to the previous screen. Enter a number (6 maximum).
Help button Display help for the network screen.
Use the left and right arrow keys to select between
DHCP and Static IP.
If you choose to specify an IP address, you must
enter it here.
If you choose to specify an IP address, you must
enter a Subnet Mask.
If you choose to specify an IP address, you must
enter a Default gateway.
Get the IP from the Server,
or Specify an IP Address.
Enter four decimal integers
between 0 and 255.
Enter four decimal integers
between 0 and 255.
Enter four decimal integers
between 0 and 255.
*You may need to contact your local network administrator for this information.
4-12 Programming the VGA Optica
Page 72

January 2006
Datalog Enter parameters for automatically logging data within the Optica.
This menu is accessed by selecting the Data Log control button on
Menu 1 and pressing ENTER.
Figure 4-5: Datalog Menu
The large window below the center of the screen shows a list of
parameters chosen for logging.
Table 4-10: Datalog Options
Item Function Available Options
Status* Enable or disable datalog. Enabled/Disabled
Interval* Enter the logging interval in seconds. Enter a number.
Decimals Enter the number of decimal places for logged data. Enter a number (6 maximum).
Separator* Choose separator to be used between parameters. Space, Comma, Tab
Terminator* Choose the terminator(s) for each group of data. CR, CR-LF, LF
Parameters Set the parameter to be programmed (below). Humidity, Temperature,
Pressure, or User Equation
Units Set the units for the selected parameter. See Table 4-1 on page 4-4.
REMOVE Control button to remove selected item from the list. Select button and press ENTER.
ADD Control button to add the selected unit to the list. Select button and press ENTER.
RESET Delete datalog files. Select button and press ENTER.
DOWNLOAD Control button to display the logged data on the
Download screen (see below).
Select button and press ENTER.
*Indicated items apply to the entire datalog file.
Programming the VGA Optica 4-13
Page 73

January 2006
Datalog (cont.) Use the UP and DOWN arrow keys to select items in the center
window.
Logged data are stored in a file, named with the file’s creation time
and date. If logging is in progress at midnight, a new file is
automatically started at that time. To view or output the logged data,
select the Download control button and press ENTER. The Optica
will display the Download screen, described below.
Download Screen The Download Screen is accessed by pressing Download on the
Datalog screen. It contains the following elements:
• a list of any saved files containing logged data (upper left)
• an area for displaying logged data (center)
• View button — displays the contents of the selected file name
• OK button — return to the previous screen
• Download button — send the selected file to the serial port
• HELP button — display help system
• Up arrow button — scroll the displayed data upwards
• Down arrow button — scroll the displayed data downwards
Figure 4-6: Download Screen
4-14 Programming the VGA Optica
Page 74

January 2006
Menu 2 Menu 2 is shown in below. This menu is accessed by selecting More
on Menu 1, and pressing ENTER.
Figure 4-7: Menu 2
Programming the VGA Optica 4-15
Page 75

January 2006
General
Table 4-11: General Options
Item Function Available Options
Number of
Data Fields
Lockout
Dew Point
Offset
Dew Point
Filter
Temperature
Offset
Temperature
Filter
Pressure
Offset
Pressure
Filter
Set the number of parameters to be displayed.
Set whether or not Heat, Cool, and PACER functions
can be activated by the softkeys on the front panel.
Enter offset value for Dew Point parameter in °C.
Enter filter value for Dew Point parameter.
Enter offset value for Temperature parameter in °C.
Enter filter value for Temperature parameter.
Enter offset value for Pressure parameter in psia.
Enter filter value for Pressure parameter.
1, 2, 3, 4, 5, 6
Disabled/Enabled
Enter value by which the Dew
Point parameter will be offset.
Enter number of readings to be
averaged to create filtered
Dew Point.
Enter the value by which the
Temperature parameter will be
offset.
Enter number of readings to be
averaged to create filtered
Temperature.
Enter value by which Pressure
parameter will be offset.
Enter number of readings to be
averaged to create filtered
Pressure.
Special
Table 4-12: Special Option
Item Function Available Options
Mol. Wt. Gas:
The molecular weight of the gas being analyzed
(Default value is molecular weight of dry air: 28.9645)
Enter a number.
User Equation
Table 4-13: User Equation Options
Item Function Available Options
Selection Select which equation to enter or edit. 1, 2, 3
Label: Enter the test label for the selected equation. Enter an alphanumeric name.
Using the keypad, enter the
Equation
Enter the user equation (see User Equations on
page 4-4).
alphanumeric codes for the
equation elements, shown in
Table 4-2 on page 4-5.
4-16 Programming the VGA Optica
Page 76

Communication Parameters
Table 4-14: Communication Parameter Options
Item Function Available Options
All (Data is sent continuously.);
Mode Set the method for sending data.
Query (Data is sent when
requested by receiving device.)
Query mode is described below.
January 2006
Baud
Parity Set the parity as required by the receiving device. None, Odd or Even
Data Bits
Stop Bits
Flow Control
Set the baud rate as required by the receiving device.
Set the number of data bits as required by the
receiving device.
Set the number of stop bits as required by the
receiving device
Set the Flow Control mode as required by the
receiving device.
300, 600, 1200, 2400, 4800,
9600, 19200, 38400, 57600
7 or 8
1, 1.5 or 2
None, X-OFF, RTS/CTS
Query Mode Format:
Command: Returns . . .
$HELP < > Help string
Note: The symbol < > indicates a carriage return.
$GETDATA 0 <item> <item> <item> ... <item> Requested data items
$GETSTATUS 0 < > Status string
Query mode examples:
$GETDATA 0 0 1 < > returns the Dew Point °C, Dew Point °F
Note: The 0 and 1 above, following the “GETDATA 0” command, reference the numeric suffix of
the parameter identifier from Table 4-2 on page 4-5. For example A0 has units Tdew °C, so
the 0 requests Tdew °C.
$GETSTATUS < > Returns a string of 1s and 0s corresponding to PACER,
Service, Control, Heat, Cool, Alarm 1, Alarm 2
Programming the VGA Optica 4-17
Page 77

January 2006
Serial Output Data
Table 4-15: Serial Output Data Options
Item Function Available Options
Selected
Outputs
Time Stamp* Output date and time with each data string. Enabled/Disabled
Show Status*
Parameter Select a parameter to configure.
Units Set the units for the selected parameter.
Format* Choose output format for the selected parameter. Dp=##.#, ###.#(Dp), No Label
Separator* Choose separator to be used between parameters. Space, Comma, TAB, CR, CR-LF
Terminator* Choose the terminator(s) for each group of data. Comma, CR, CR-LF
Interval (sec)* Enter the output interval in seconds. Enter a number.
Decimals
The units of currently selected parameters are
shown, along with the number of decimals for each
unit.
Output dew point sensor status with each data string
(Heat, Cool, Balance, PACER, Service, Alarm 1,
Alarm 2).
Enter the number of decimal places for the selected
parameter.
Units of selected output are
displayed. Select one with the
UP/DOWN keys to change it or
delete it using REMOVE.
Enabled/Disabled
Humidity, Temperature, Pressure or User Equation
See Table 4-1 on page 4-4 for
available units.
Enter a number (6 maximum).
ADD button
REMOVE
button
Control button to add the configured parameter to
the output list, using the units and number of
decimals designated.
Control button to remove from the output list the
parameter selected at the top of the serial output
menu.
Select button and press ENTER.
Select button and press ENTER
4-18 Programming the VGA Optica
Page 78

January 2006
Set Time & Date The Time and Date menu is accessed by selecting Set Time and
Date on Menu 2, and pressing ENTER.
To set the Optica’s internal clock, press TAB to select each field of
the date and time, and press the up and down softkeys to set each
field. When the settings are correct, tab to the OK button and press
ENTER.
Figure 4-8: Time and Date
Restore Defaults To access this choice, select the Restore Defaults button on Menu 2,
and press ENTER.
This screen resets all programmable items to the factory defaults
shown in Table 3-2 on page 3-9. Press TAB to select Yes, and press the
ENTER key.
Programming the VGA Optica 4-19
Page 79

January 2006
Saving Configuration Files
This option allows the user to save a configuration file and then load
it onto the system for future use.
Note: To activate the selected configuration, the system must be
reset.
To save the current configuration file:
1. Select Configuration on the Main Screen. A screen similar to the
one shown below in Figure 4-9 appears.
2. Type a file name under Save Configuration File and click SAVE.
The name will appear under Load Configuration File.
3. To load or delete an existing configuration file, highlight the name
under Load Configuration File and click LOAD or DELETE as
desired.
4. To exit the Configuration screen click OK.
Figure 4-9: Configuration Screen
4-20 Programming the VGA Optica
Page 80

Chapter 5
Page 81

Programming the 4x40 Optica
Introduction. . . . . . . . . . . . . . . . . . . . . . . . . . . . . . . . . . . . . . . . . . . . . . . . . . . . 5-1
Programming Technique . . . . . . . . . . . . . . . . . . . . . . . . . . . . . . . . . . . . . . . . 5-2
Programmable Functions. . . . . . . . . . . . . . . . . . . . . . . . . . . . . . . . . . . . . . . . 5-4
Page 82

January 2006
Introduction The 4x40 Optica can be easily programmed to choose the data to be
displayed, the data to be output on the analog or serial outputs, and
the alarm settings. A typical data display is shown in Figure 5-1
below:
Tdew ° C 8.47996 Heat
%RH 10.3
Tmp ° C 25.355
Control
Figure 5-1: 4x40 Optica Typical Data Display
Table 5-1 below lists the 4x40 Optica’s programmable functions.
Each function has a number of settings (listed on the following
pages). Values for some settings are selected from a list of choices;
others are entered as numeric or alphanumeric data using the keypad.
Table 5-1: Programming Functions
Cool
Pacer
Function Settings
About Displays software version
Analog Outputs Parameter choice, units and scaling
Communication Parameters Baud rate, parity, # data bits, etc.
Serial Output Units Parameter choice, units/data format
Serial Output Setup Serial data string format
Alarms Parameter choice and alarm limits
Data Fields Parameters & units for displayed data
Pressure Input Units, scaling and default values
Automatic Balance Frequency and type of balance
Buzzer and Sounds Keyclick loudness
General Settings Offsets, filters, lockout
User Equations Set user defined calculated values.
Set Time and Date Enter the current time and date.
Special Set molecular weight of sample gas.
User Default Settings Restore default settings.
Factory Calibration For factory use only.
Programming the 4x40 Optica 5-1
Page 83

January 2006
Programming Technique The functions of the four softkeys to the right of the display change
according to the current state of the unit. These functions, if any, are
displayed at the right edge of the screen. While programming, these
keys are labelled UP, DOWN, LEFT (displayed as <<<<) and RIGHT
(displayed as >>>>).
Below is the general method for programming the unit:
1. To access the programming menus, press the ENTER/MENU key.
2. Press the DOWN key to step through the functions that can be
programmed (shown in Table 5-1 on page 5-1).
3. For a particular function, press the RIGHT key to display the first
setting for the function. Press the DOWN key to step through its
available settings.
4. For a particular setting, press the RIGHT key to open the setting for
editing.
If the setting uses a list of specific choices, the DOWN key and/or
UP key are shown. Press them to step through the choices.
If the setting requires a numeric or alphanumeric entry, use the
keypad to enter the data.
Note: To enter numeric data, just press the appropriate key.
To enter alphanumeric data, first press SHIFT to access the
letters on the keypad, and then press the appropriate key
containing the desired letter. Finally, press the up or down
arrow softkeys to step through the letters available for that
key, both upper and lower case.
Note that certain settings have numeric values that are
restricted to certain choices. For example, the number of stop
bits for serial output may be 1, 1.5, or 2, and may have no
other values. This entry is selected from a list of choices, not
entered as a numeric value.
5. After choosing a value for a setting, press ENTER to lock it in.
Or, you can press the LEFT key to cancel the entry (restoring the
original value) and return to choose another setting.
To return to the function choice, press the LEFT key.
5-2 Programming the 4x40 Optica
Page 84

January 2006
Programming Technique
(cont.)
Analog Outputs
Down
Up
A typical programming screen (for setting the Analog Outputs) is
shown in Figure 5-2 below.
Analog Outputs UP
Output A Parameter
DOWN
>> Temperature
<<<<
Figure 5-2: Typical Analog Outputs Programming Screen
An example of programming the Serial Baud Rate is shown in below.
Press the DOWN and RIGHT (>>>>) softkeys as shown to select the
parameter to be programmed, choose the value using the UP and
DOWN softkeys, and press ENTER.
Press "left" softkey (<<<<) to cancel
and/or return to previous position.
Communication
Parameters
Down
Serial Output
Units
Down
Up
Up
>>>>
Serial Mode
DOWN UP
Baud
DOWN
DOWN
UP
Parity
UP
>>>>
DOWN
DOWN
DOWN
1200
600
300
Figure 5-3: Programming the 4x40 Optica
UP
ENTER
UP
UP
Baud rate
set
Programming the 4x40 Optica 5-3
Page 85

January 2006
Programmable Functions
Analog Outputs
Setting Description Available Options
Table 5-2: Analog Output Options
Output A Parameter
Output A Units
Output A Upper
Output A Lower
Output B Parameter
Output B Units
Output B Upper
Output B Lower
Communication Parameters
Choose which parameter will be
output on analog channel A.
Choose the units for scaling this
parameter.
Set the parameter value that will
produce full-scale output.
Set the parameter value that will
produce zero output.
Choose which parameter will be
output on analog channel A.
Choose the units for scaling this
parameter.
Set the parameter value that will
produce full-scale output.
Set the parameter value that will
produce zero output.
Humidity, Temperature, Pressure or
User Equation
See Table 4-1 on page 4-4 for the
parameter chosen.
Enter a number.
Enter a number.
Humidity, Temperature, Pressure or
User Equation
See Table 4-1 on page 4-4 for the
parameter chosen.
Enter a number.
Enter a number.
Table 5-3: Communication Parameter Options
Setting Description Available Options
Serial Mode
Baud
Parity
Number of Data Bits
Number of Stop Bits
Serial Flow Control
5-4 Programming the 4x40 Optica
Set whether data is transmitted
continuously or on demand.
Set the baud rate to be compatible
with the receiving device.
Set the parity as required by the
receiving device.
Set the number of data bits as
required by the receiving device.
Set the number of stop bits as required
by the receiving device.
Set the flow control as required by the
receiving device.
All, Query (see Query Mode Format on
page 4-17)
300, 1200, 2400, 4800, 9600, 19200,
38400, 57600
None, Odd, Even, Mark or Space
7 or 8
1, 1.5 or 2
None, Software, Hardware
Page 86

Serial Output Units
Setting Description Available Options
January 2006
Table 5-4: Serial Output Unit Options
Humidity Units* Set the units for humidity.
Temperature Units* Set the units for temperature.
Pressure Units* Set the units for pressure.
User Units* Set the selected user equation.
*Note: The TAB key selects or deselects the desired output units. If selected, the number of decimals can
be set using a keypad entry (0-6).
See Table 4-1 on page 4-4 for the
parameter chosen.
See Table 4-1 on page 4-4 for the
parameter chosen.
See Table 4-1 on page 4-4 for the
parameter chosen.
Choose from any available User
Equation.
Serial Output Setup
Table 5-5: Serial Output Setup Options
Setting Description Available Options
Format
Field Separator
Choose the output format for the
selected parameter.
Choose the separator to be used
between parameters.
For humidity, e.g., Dp=##.#, ###.#(Dp),
No Prompt
Space, Comma, Tab, CR, CR-LF
Record Terminator
Interval in seconds
Show Status*
Time Stamp
Choose the terminator(s) for each
group of data.
Enter the output interval in seconds
(for Serial Mode: All).
Output dew point sensor status with
each data string (Heat, Cool, Balance,
PACER, Service, Alarm 1, Alarm2).
Output date and time with each data
string.
Comma, CR, CR-LF
Enter a number.
Enabled/Disabled
Enabled/Disabled
Programming the 4x40 Optica 5-5
Page 87

January 2006
Alarms For more information on using the alarms, see Alarm Outputs on
page 2-10.
Table 5-6: Alarm Options
Setting Description Available Options
Alarm #1 Enable or disable Alarm 1. Enabled/Disabled
Alarm #1 Parameter
Alarm #1 Units Set the units for this parameter.
Alarm #1 Type
Alarm #1 Upper The upper side of the alarm band. Enter a number.
Alarm #1 Lower The lower side of the alarm band. Enter a number.
Alarm #2 Enable or disable Alarm 2. Enabled/Disabled
Alarm #2 Parameter
Alarm #2 Units Set the units for this parameter.
Alarm #2 Type
Alarm #2 Upper The upper side of the alarm band. Enter a number.
Alarm #2 Lower The lower side of the alarm band. Enter a number.
Choose the parameter to control
Alarm 1.
Set the type of condition that will activate Alarm 1.
Choose the parameter to control
Alarm 2.
Set the type of condition that will activate Alarm 2.
Humidity, Temperature, Pressure or
User Equation
See Table 4-1 on page 4-4 for the
parameter chosen.
Set Point, Inner Band, Outer Band,
Control, Service, PACER
Humidity, Temperature, Pressure or
User Equation
See Table 4-1 on page 4-4 for the
parameter chosen.
Set Point, Inner Band, Outer Band,
Control, Service, PACER
The Upper and Lower limits set the alarm thresholds. Alarm types are
listed below (see details on page 2-10):
• SetPoint: Alarm activates when parameter exceeds upper limit;
deactivates when parameter is less than lower limit.
• Inner Band: Alarm activates when parameter is between upper and
lower limits.
• Outer band: Alarm activates when parameter is outside upper and
lower limits.
• Control: Alarm activates when the Optica is actively controlling
mirror temperature.
• Service: Alarm activates when the Service indicator is activated.
• PACER: Alarm activates when the PACER balance is active.
5-6 Programming the 4x40 Optica
Page 88

Data Fields
Setting Description Available Options
January 2006
Table 5-7: Data Field Options
Line 1 Parameter
Line 1 Units
Line 1 Decimals
Line 2 Parameter
Line 2 Units
Line 2 Decimals
Line 3 Parameter
Line 3 Units
Line 3 Decimals
Choose which parameter will be
output on Line 1.
Set the units for the selected
parameter.
Enter the number of decimal places
for displayed data.
Choose which parameter will be
output on Line 2.
Set the units for the selected
parameter.
Enter the number of decimal places
for displayed data.
Choose which parameter will be
output on Line 3.
Set the units for the selected
parameter.
Enter the number of decimal places
for displayed data.
Humidity, Temperature, Pressure or
User
See Table 4-1 on page 4-4 for the
parameter chosen.
Enter a number (0-6).
Humidity, Temperature, Pressure or
User
See Table 4-1 on page 4-4 for the
parameter chosen.
Enter a number (0-6).
Humidity, Temperature, Pressure or
User
See Table 4-1 on page 4-4 for the
parameter chosen.
Enter a number (0-6).
Pressure Input
Table 5-8: Pressure Input Options
Setting Description Available Options
Analog Input #
Input Units Choose the units for pressure units. See Table 4-1 on page 4-4 for units.
Input Upper
Input Lower
Input Default
Process Pressure
Default
Process Pressure
Choose which pressure input channel
is in use, or disable this input.
Set the pressure that corresponds to
full-scale input.
Set the pressure that corresponds to
zero volts or 4 mA input.
Pressure value to be used if a
measured input is disabled.
Set whether the process pressure is
active (enabled) (see page 3-4).
Enter the process pressure (if this
feature is enabled).
4-20 mA, 0-5 volt, User Default
Enter a number.
Enter a number.
Enter a number.
Enabled/Disabled
Enabled/Disabled
Programming the 4x40 Optica 5-7
Page 89

January 2006
Automatic Cleaning and Balance Function
Note: For Optica Analyzers with earlier versions of software, see
Appendix F.
Optica Analyzers with version XXX software have been upgraded to
include the ability to program the PACER self-cleaning and
rebalancing cycle to run once per day at a preset time. This is referred
to as a Clock Time Interval. When the unit is programmed in this
manner, the front panel PACER softkey is disabled. The Elapsed Time
Interval initiates the PACER at a preset time after the last PACER was
run. The automatic balance cycle will always run upon power up of
the analyzers.
To program the Automatic Cleaning & Balance Function on the
Optica 4X40 monitor:
1. Make sure the internal clock of the Optica has the correct time.
From the main screen:
a. Press the ENTER key.
b. Press the DOWN soft key until Set Time and Date is
displayed.
c. Press the >>>> soft key.
d. Press the >>>> soft key.
e. Highlight the Date and Time fields using the tab key. Use the
keypad and softkeys to set the correct time.
5-8 Programming the 4x40 Optica
Page 90

January 2006
Automatic Cleaning and
Balance Function (cont.)
2. Set the Time Programmed Balance Cycle:
a. Press the ENTER key to access the Main menu.
b. Press the DOWN soft key until Auto Balance is shown.
c. Press the >>>> soft key.
d. Press the >>>> to set the interval. Use the soft keys and the key
pad.
e. Press the ENTER key when done.
f. Press the DOWN soft key to select the pacer type.
g. Press the >>>> to enter selection mode.
h. Press the DOWN soft key until the desired pacer type is
displayed.
i. Press the ENTER key to select.
j. Press the DOWN soft key to enable the PACER status.
k. Press the >>>> soft key to enter selection mode.
l. Press the UP or DOWN soft key until the enabled status is
displayed.
m. Press the ENTER key to save the selection.
n. Press the <<<< key several times to exit the menu.
o. Under the Type pull down menu there will be four selections
(see Table 5-9 below).
Table 5-9: Automatic Cleaning and Balance Functions
Item Function Type
AUTO Heats the mirror and balances the optics. Elapsed Time Interval
PACER
AUTO-D Heats the mirror and balances the optics. Clock Time Interval
PACER-D
First cools the mirror to develop a thick dew/frost
layer, then heats and balances the optics.
First cools the mirror to develop a thick dew/frost
layer, then heats and balances the optics.
Elapsed Time Interval
Clock Time Interval
Note: The PACER function will provide more thorough cleaning than
the AUTO function because it first develops a thick dew/frost
layer into which soluble contaminants dissolve. When heated,
some of the contaminants are flash evaporated and the
remaining residue accumulates in clusters, resulting in the
cleaning of much of the mirror’s surface. The PACER cycle
generally takes longer to complete.
Programming the 4x40 Optica 5-9
Page 91

January 2006
Automatic Cleaning and
Balance Function (cont.)
3. Manually clean the mirror as required.
Note: Manual cleaning provides the most thorough cleaning.
4. After manual cleaning, initiate the Automatic Cleaning &
Balancing cycle. (This can be done by powering the analyzer off
then on again, if the front panel softkey is disabled).
5. To program a specific time of day at which to initiate the
Automatic Cleaning and Balancing:
a. Highlight either Auto-D or Pacer-D.
b. In the Set Time section, input the time of day that you would
like to initiate the balance cycle in a 24-hour format (for
example, 13:30 will be 1:30 PM ).
Note: In this mode the front panel Pacer initiation function is
disabled. Powering down and restarting the unit will have no
effect on the time programmed, however the PACER will run
on startup as is the normal function.
6. To program an elapsed time to initialize the Automatic Cleaning
and Balancing:
a. Highlight either AUTO or Pacer.
b. In the set time section, input the elapsed time in minutes. (For
example: 720 would enable the balance cycle to run every 12
hours).
Note: If the unit is powered down and restarted, or the Automatic
Balance is initiated from the font or using a LAN, the elapsed
time will reset.
Note: Show Status should read "Enabled".
7. Select either Track or Hold for the analog outputs
(4-20mA/0-5VDC).
Note: If Track is selected, the actual temperature of the mirror will
be transmitted. If Hold is selected, the last prevailing dew
point, measured before the balance cycle was initiated, will be
transmitted during the time that the balance cycle is running.
8. Power down and restart the Optica 4x40 display analyzer for the
settings to take effect.
IMPORTANT: For environments or a gas sample where the mirror
accumulates contamination rapidly, the use of an
inline filter is recommended. Lower flow rates will
also reduce the accumulation of contaminants
5-10 Programming the 4x40 Optica
Page 92

Buzzer and Sounds
Setting Description Available Options
January 2006
Table 5-10: Buzzer and Sounds Option
Buzzer Timing
Sets the length (apparent loudness) of
keyclick sounds.
General Settings
Table 5-11: General Setting Options
Setting Description Available Options
Dew Point Offset Enter the offset value for the Dew Point
parameter.
Dew Point Filter Enter the filter value for the Dew Point
parameter.
Temperature Offset Enter the offset value for the
Temperature parameter.
Temperature Filter Enter the filter value for the Temperature
parameter.
Pressure Offset Enter the offset value for the Pressure
parameter.
Pressure Filter Enter the filter value for the Pressure
parameter.
Enter length of keyclick sound in msec
(150 msec maximum).
Enter the value by which the Dew
Point parameter will be offset.
Enter the number of readings to be
averaged to create filtered Dew Point.
Enter the value by which the
Temperature parameter will be offset.
Enter the number of readings to be
averaged to create filtered Temp.
Enter the value by which the Pressure
parameter will be offset.
Enter the number of readings to be
averaged to create filtered Pressure.
Lockout Set whether or not the Heat, Cool, and
PACER functions can be activated by the
softkeys on the front panel.
OFF / ON
User Equations See User Equations on page 4-4 for programming information.
Table 5-12: User Equation Options
Setting Description Available Options
Select Equation Choose an equation to enter or edit. 1, 2, or 3
Edit Label #1*
Edit Equation #1*
*The equation number shown is the one chosen in “Select Equation.”
Enter or edit the label identifying
equation 1.
Enter or edit equation 1 using the
equation elements shown in Table 4-2
on page 4-5.
Alphanumeric
See Table 4-2 on page 4-5.
Programming the 4x40 Optica 5-11
Page 93

January 2006
Set Time and Date
Table 5-13: Set Time and Date Options
Setting Description Available Options
Set Time Sets the time. Enter digits, one at a time, pressing
Set Date Sets the date.
TAB to move to the next digit.
Special
Table 5-14: Special Options
Setting Description Available Options
The molecular weight of the gas being
Gas Mole Weight
analyzed. (The default value is the
molecular weight of air: 28.9645)
Enter a number.
User Default Settings
Table 5-15: User Default Setting Options
Setting Description Available Options
Restore Defaults
Factory Calibrations
Setting Description Available Options
For factory use only.
Restore settings to factory defaults
shown in Table 3-2 on page 3-9.
Table 5-16: Factory Calibration Options
NO, YES
5-12 Programming the 4x40 Optica
Page 94

Chapter 6
Page 95

Network-Based Programming
Introduction. . . . . . . . . . . . . . . . . . . . . . . . . . . . . . . . . . . . . . . . . . . . . . . . . . . . 6-1
Programming Screens. . . . . . . . . . . . . . . . . . . . . . . . . . . . . . . . . . . . . . . . . . . 6-1
Page 96

January 2006
Introduction The VGA Optica can also be programmed remotely from a computer
over a network, using a browser program such as Internet Explorer.
It may be necessary to download and install the Sun Java Runtime
Environment (JRE) obtained from the GE Infrastructure Sensing
distribution CD or Sun’s website. If the Sun JRE is not installed on a
machine that connects to Optica via Ethernet, a web page will direct
the user to Sun’s website.
To set up the Optica’s networking configuration, see Chapter 4 for
programming using the Optica’s VGA programming method, and
follow the instructions listed in Network Menu on page 4-12.
Programming Screens Detailed information on using the Optica Web interface is available
via the Help buttons. Programming is very similar to programming of
the VGA unit described in Chapter 4, Programming the VGA Optica.
Of course, you use the mouse to click directly on fields and control
buttons instead of selecting items with the TAB key described in
Chapter 4.
A typical main data screen is shown below:
Figure 6-1: Typical Main Data Screen
Network-Based Programming 6-1
Page 97

January 2006
Programming Screens
(cont.)
Click on Menu to display the Data programming screen:
Figure 6-2: Data Programming Screen
Press More... to display the Other Options screen.
Figure 6-3: Typical Main Data Screen
6-2 Network-Based Programming
Page 98

January 2006
Programming Screens
(cont.)
Press Display from the main data screen to configure the Main
Display screen.
Figure 6-4: Main Display Screen
Network-Based Programming 6-3
Page 99

Chapter 7
Page 100

Maintenance
Minor Maintenance of Sensor Optics. . . . . . . . . . . . . . . . . . . . . . . . . . . . . . 7-1
Field Replacement of Sensor Mirrors. . . . . . . . . . . . . . . . . . . . . . . . . . . . . . 7-4
Test and Calibration . . . . . . . . . . . . . . . . . . . . . . . . . . . . . . . . . . . . . . . . . . . . 7-6
Troubleshooting . . . . . . . . . . . . . . . . . . . . . . . . . . . . . . . . . . . . . . . . . . . . . . . . 7-6
 Loading...