

Page 1

NETWORK TESTING
CHROMATIC DISPERSION
ANALYZER
FTB-5800 for FTB-400
USER GUIDE
Page 2

Copyright © 2002–2007 EXFO Electro-Optical Engineering Inc. All rights
reserved. No part of this publication may be reproduced, stored in a
retrieval system or transmitted in any form, be it electronically,
mechanically, or by any other means such as photocopying, recording or
otherwise, without the prior written permission of EXFO Electro-Optical
Engineering Inc. (EXFO).
Information provided by EXFO is believed to be accurate and reliable.
However, no responsibility is assumed by EXFO for its use nor for any
infringements of patents or other rights of third parties that may result from
its use. No license is granted by implication or otherwise under any patent
rights of EXFO.
EXFO’s Commerce And Government Entities (CAGE) code under the North
Atlantic Treaty Organization (NATO) is 0L8C3.
The information contained in this publication is subject to change without
notice.
Trademarks
EXFO’s trademarks have been identified as such. However, the presence
or absence of such identification does not affect the legal status of any
trademark.
Units of Measurement
Units of measurement in this publication conform to SI standards and
practices.
Patents
The Chromatic Dispersion Analyzer is protected by US patent 6,429,929 and
foreign equivalents; EXFO’s Universal Interface is protected by US patent
6,612,750.
Version number 1.3.3
ii FTB-5800
Page 3

Contents
Contents
Certification Information ........................................................................................................v
1 Introducing the FTB-5800 Chromatic Dispersion Analyzer ........................ 1
Main Features .........................................................................................................................1
Basic Theory ............................................................................................................................3
Typical Applications ................................................................................................................3
Conventions ............................................................................................................................4
2 Getting Started with Your Chromatic Dispersion Analyzer ....................... 5
Inserting and Removing Test Modules ...................................................................................5
Starting the Chromatic Dispersion Analyzer Application .......................................................10
Exiting the Application .........................................................................................................12
3 Setting Up Your Chromatic Dispersion Analyzer ...................................... 13
Setting the Wavelength Range .............................................................................................13
Setting the Wavelength Step ................................................................................................14
Setting the Averaging Time ..................................................................................................16
Specifying the Fiber Under Test .............................................................................................17
Defining the Automatic Fiber Name Format .........................................................................20
4 Operating Your Chromatic Dispersion Analyzer ....................................... 23
Installing the EXFO Universal Interface (EUI) .........................................................................23
Cleaning and Connecting Optical Fibers ...............................................................................24
Selecting the Source Type .....................................................................................................26
Verifying the Intensity of the Source .....................................................................................27
Performing Reference Measurements ...................................................................................28
Applying a Chromatic Dispersion Reference .........................................................................33
Creating a File .......................................................................................................................34
Measuring Chromatic Dispersion ..........................................................................................35
Saving Your Results ...............................................................................................................38
5 Managing Results ....................................................................................... 41
Recalling a Saved File ............................................................................................................42
Analyzing Results from the Results Graph ............................................................................43
Analyzing Results from the Results Table ..............................................................................52
Keeping Track of Acquisitions ...............................................................................................54
Establishing Thresholds ........................................................................................................56
Documenting Results ............................................................................................................59
Exporting Results and Graphs to Clipboard ..........................................................................61
Printing Results .....................................................................................................................62
Chromatic Dispersion Analyzer iii
Page 4

Contents
6 Exporting CD Analyzer Files with the File Export Tool .............................65
Starting and Exiting the File Export Tool ...............................................................................65
Setting Export Parameters ....................................................................................................67
Exporting Chromatic Dispersion Files ....................................................................................69
7 Maintenance ................................................................................................71
Cleaning EUI Connectors ......................................................................................................72
Cleaning Detector Ports ........................................................................................................74
Recalibrating the Unit ...........................................................................................................75
Recycling and Disposal (Applies to European Union Only) ....................................................76
8 Troubleshooting ..........................................................................................77
Solving Common Problems ...................................................................................................77
Viewing Online Documentation ............................................................................................79
Finding Information on the EXFO Web Site ..........................................................................79
Contacting the Technical Support Group ..............................................................................80
Transportation ......................................................................................................................81
9 Warranty ......................................................................................................83
General Information .............................................................................................................83
Liability .................................................................................................................................84
Exclusions .............................................................................................................................84
Certification ..........................................................................................................................84
Service and Repairs ...............................................................................................................85
EXFO Service Centers Worldwide ..........................................................................................86
A Technical Specifications ..............................................................................87
B Measuring Chromatic Dispersion: Theory .................................................89
Method Behind the Chromatic Dispersion Analyzer ..............................................................89
Using Data Fits to Obtain Dispersion ....................................................................................90
Helping You Manage Chromatic Dispersion ..........................................................................92
Index .................................................................................................................93
iv FTB-5800
Page 5

Certification Information
Certification Information
F.C.C. Information
Electronic test equipment is exempt from Part 15 compliance (FCC) in
the United States. However, compliance verification tests are
systematically performed on most EXFO equipment.
Information
Electronic test equipment is subject to the EMC Directive in the European
Union. The EN61326 standard prescribes both emission and immunity
requirements for laboratory, measurement, and control equipment.
This unit has undergone extensive testing according to the European Union
Directive and Standards.
Chromatic Dispersion Analyzer v
Page 6
Certification Information
Application of Council Directive(s):
73/23/EEC - The Low Voltage Directive
89/336/EEC - The EMC Directive
Manufacturer’s Name:
EXFO ELECTRO-OPTICAL ENG.
Manufacturer’s Address:
400 Godin Avenue
Quebec, Quebec
Canada G1M 2K2
(418) 683-0211
Equipment Type/Environment:
Industrial Scientific Equipment
Trade Name/Model No.:
FTB-5800 Chromatic Dispersion Analyzer
Year of Conformity Assessment:
2002
Standard(s) to which Conformity is Declared:
EN 61326: 1997/ A2:
2001
Electrical Equipment for Measurement, Control and Laboratory
Use - EMC Requirements
EN 55022: 1998/ A1:
2000
Limits and methods of measurement of radio disturbance characteristics of
information technology equipment
I, the undersigned, hereby declare that the equipment specified above conforms to the above Directive and Standards.
Manufacturer
Signature:
Full Name:
Stephen Bull, E. Eng
Position:
Vice-President Research and
Development
Address:
400 Godin Avenue Quebec, Quebec,
Canada
Date:
February 25,2002
DECLARATION OF CONFORMITY
vi FTB-5800
Page 7
1 Introducing the FTB-5800
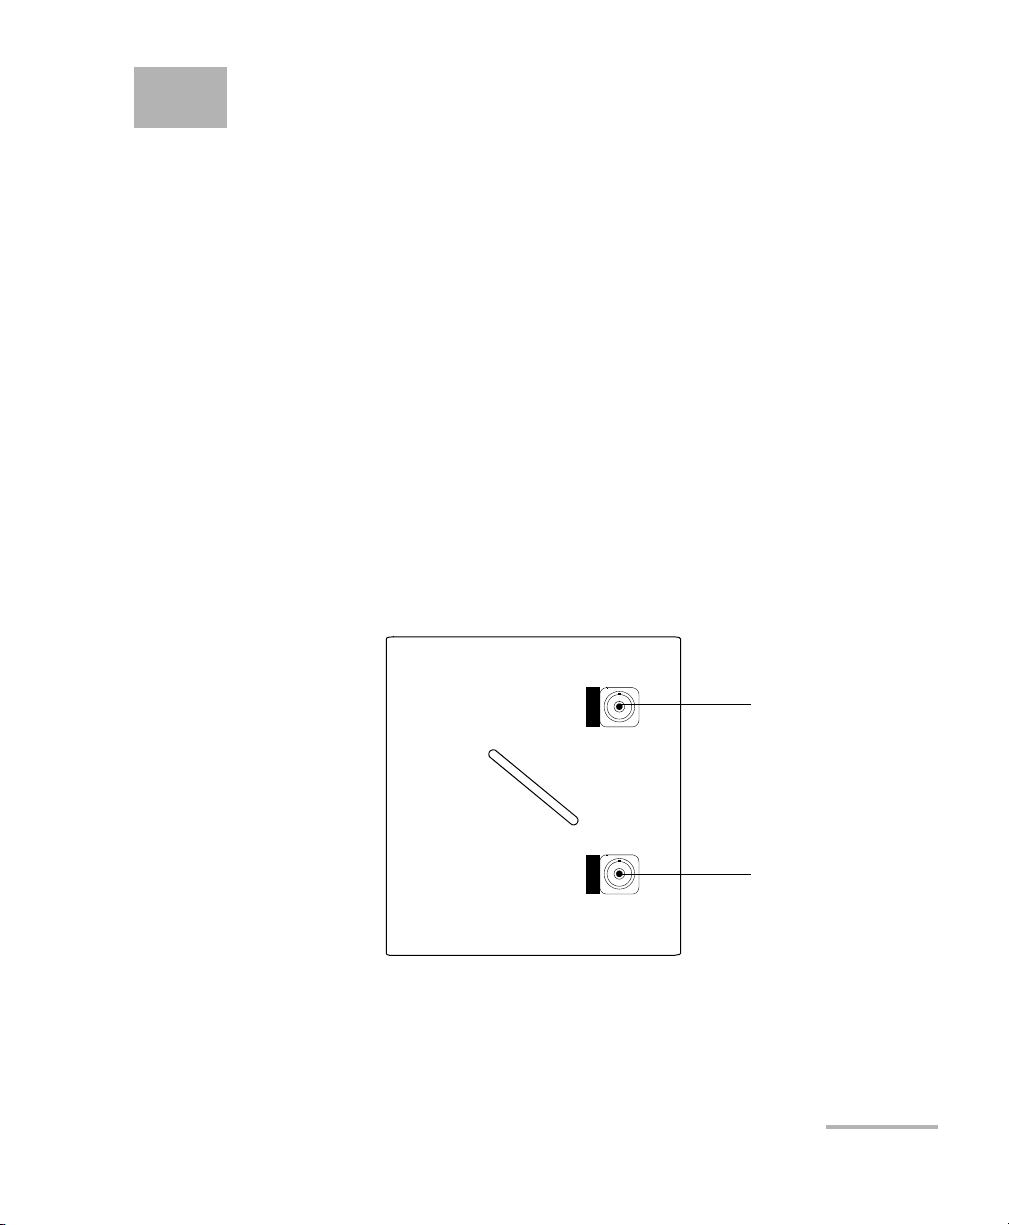
FTB-5800
CHROMATIC DISPERSON ANALYZER
LOW POWER
HIGH POWER/REF
High-power/
reference
port
Low-power
port
Chromatic Dispersion
Analyzer
In today’s advanced optical network, chromatic dispersion management
has become an important issue. Present-day networks must deal with high
data rates, high channel counts and long distances between
optical-electrical-optical regenerators.
Main Features
The FTB-5800 Chromatic Dispersion Analyzer is a reliable solution to
chromatic dispersion management. It uses the phase-shift measurement
method to measure phase variations at fixed frequencies and combines
them relative group delays.
Fitting equations are then applied to the computed data to calculate
chromatic dispersion. This method allows for more accurate and precise
results in the C and L bands.
Chromatic Dispersion Analyzer 1
Page 8

Introducing the FTB-5800 Chromatic Dispersion Analyzer
Main Features
The architecture of the FTB-5800 Chromatic Dispersion Analyzer places the
wavelength selector in the receiver, which avoids the necessity for any
communication between the receiver and the source. This allows you to
take measurements even though the source is kilometers away, without
interfering with the accuracy of results.
The FTB-5800 Chromatic Dispersion Analyzer is offered as a compact,
portable and field-ready module used in the FTB-400 Universal Test System
and combined with the FLS-5800 for optimal test results. The FTB-5800
Chromatic Dispersion Analyzer comes with user-friendly software, which
allows you to perform your acquisition, and then view, analyze and save
your results easily.
2 FTB-5800
Page 9

Introducing the FTB-5800 Chromatic Dispersion Analyzer
Basic Theory
Basic Theory
Chromatic dispersion is the natural broadening of light pulses as they travel
through optical fiber. The propagation characteristics of each wavelength
depend on the refractive index of the medium and on the non-linearity of
the propagation constant. These affect the travel time of each wavelength
through the fiber medium. An initially narrow pulse is widened as a result
of this, and as the pulses spread, they begin to overlap, causing the bit error
rate to increase.
High data rates mean pulses are closely spaced in time and have less room
to spread before they overlap. High channel count increases the difficulty
in correcting dispersion since each channel experiences different levels of
dispersion.
Long distances between regenerators require that dispersion be managed
very precisely because the effects accumulate over distance. As link length
and bit rate increase, the effects of chromatic dispersion also increase.
Chromatic dispersion is therefore one of the main factors limiting data
transfer for modern optical networks.
Typical Applications
Getting precise chromatic dispersion parameters helps you choose the
right dispersion-compensated fiber or material in order to reverse the
dispersion and dispersion slope before data are interpreted by the receiver.
Chromatic Dispersion Analyzer 3
Page 10
Introducing the FTB-5800 Chromatic Dispersion Analyzer
Conventions
Conventions
Before using the product described in this manual, you should understand
the following conventions:
WARNING
Indicates a potentially hazardous situation which, if not avoided,
could result in death or serious injury. Do not proceed unless you
understand and meet the required conditions.
CAUTION
Indicates a potentially hazardous situation which, if not avoided,
may result in minor or moderate injury. Do not proceed unless you
understand and meet the required conditions.
CAUTION
Indicates a potentially hazardous situation which, if not avoided,
may result in component damage. Do not proceed unless you
understand and meet the required conditions.
IMPORTANT
Refers to information about this product you should not overlook.
4 FTB-5800
Page 11
2 Getting Started with Your
Chromatic Dispersion
Analyzer
IMPORTANT
The power consumption of the module is relatively high. Therefore,
it is not recommended to use it with battery or to activate other
power consuming modules at the same time on the platform.
Inserting and Removing Test Modules
CAUTION
Never insert or remove a module while the FTB-400 Universal Test
System is turned on. This will result in immediate and irreparable
damage to both the module and unit.
WARNING
When the laser safety LED ( ) is flashing on the FTB-400, at least
one of your modules is emitting an optical signal. Please check all
modules, as it might not be the one you are currently using.
To insert a module into the FTB-400 Universal Test System:
1. Exit ToolBox and turn off your unit.
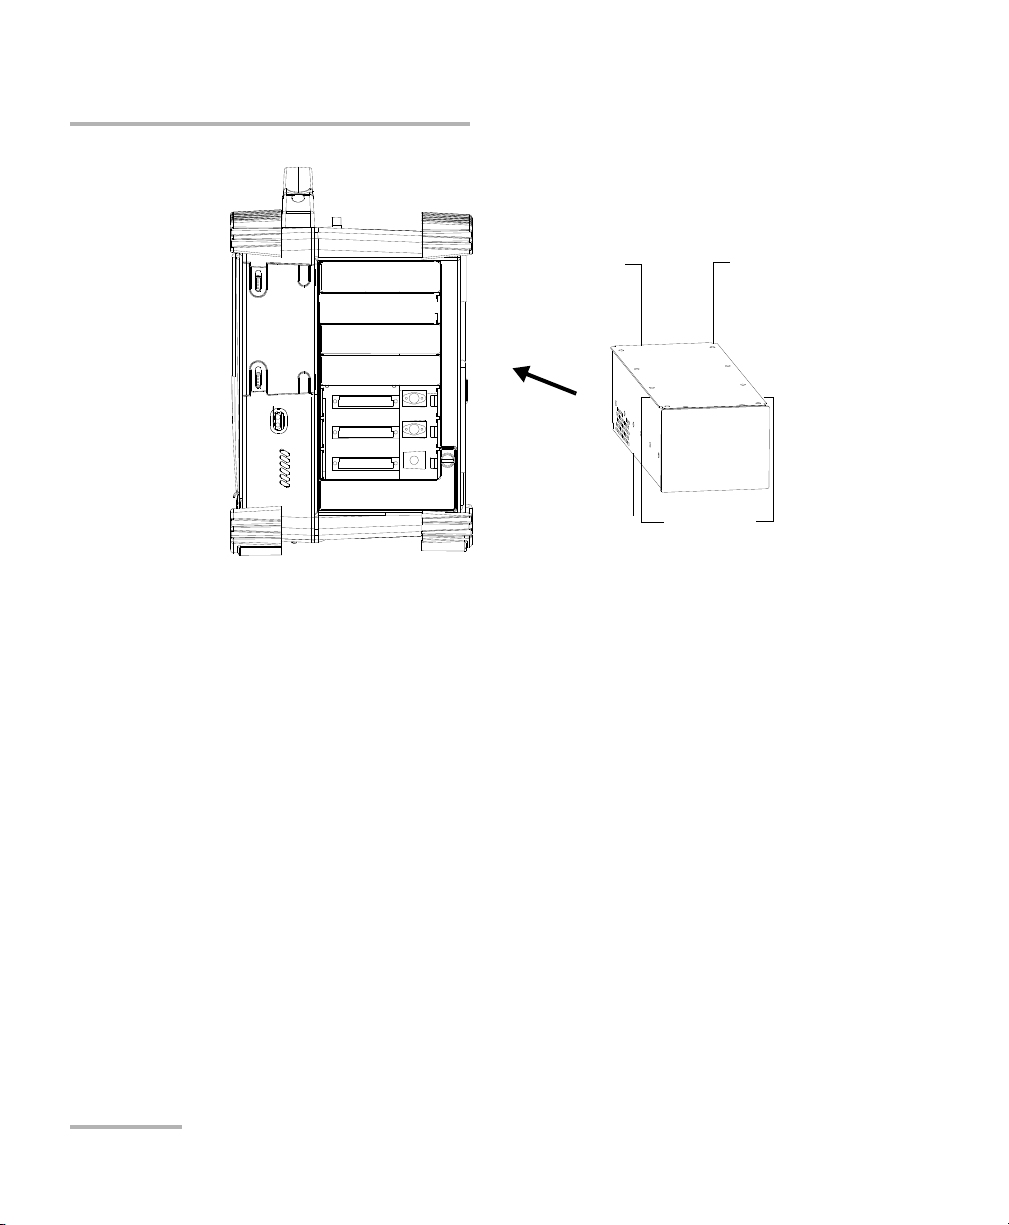
2. Position the FTB-400 so that its right panel is facing you.
3. Take the module and place it so that the connector pins are at the
back, as explained and shown below. Identification sticker must be
facing down and connector pins at the left of the retaining screw hole.
CAUTION
Inserting a module upside down could result in permanent damage
to the module, as the connector pins might be bent.
Chromatic Dispersion Analyzer 5
Page 12
Getting Started with Your Chromatic Dispersion Analyzer
FTB-400 right panel
(7-slot receptacle
shown)
Protruding
edges on top
Retaining screw
hole at the
back
Connector
pins at the
back
Identification sticker
facing down
Inserting and Removing Test Modules
4. Insert the protruding edges of the module into the grooves of the
receptacle’s module slot.
6 FTB-5800
5. Push the module all the way to the back of the slot, until the retaining
screw makes contact with the receptacle casing.
6. Place the FTB-400 so that its left panel is facing you.
Page 13
Getting Started with Your Chromatic Dispersion Analyzer
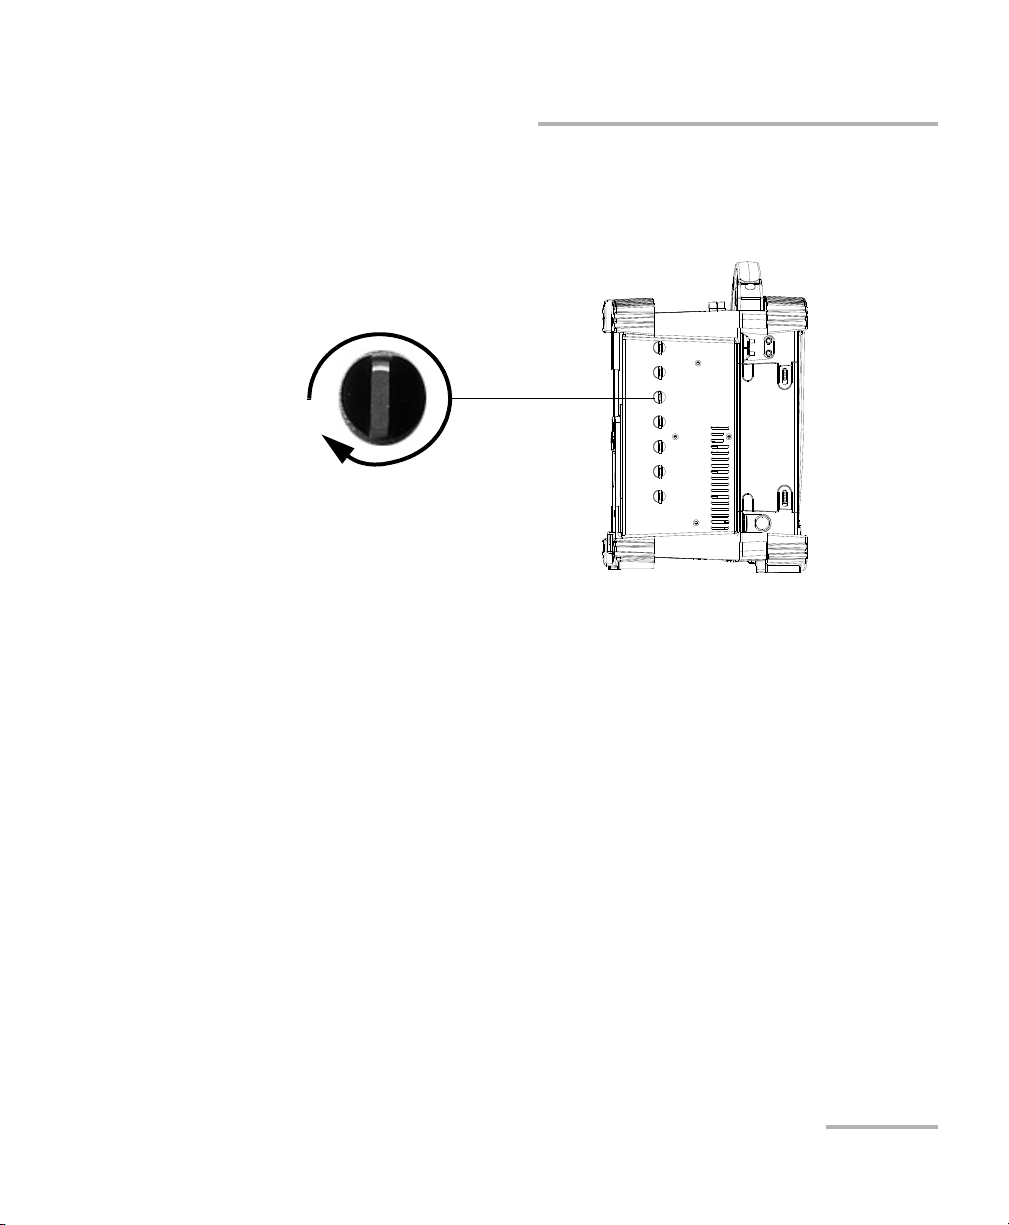
Turn retaining screw knob
clockwise
FTB-400 left panel
(7-slot unit shown)
Inserting and Removing Test Modules
7. While applying slight pressure to the module, turn the retaining screw
clockwise until it is tightened. This will secure the module into its
“seated” position.
When you turn on the unit, the startup sequence will automatically detect
the module.
Chromatic Dispersion Analyzer 7
Page 14
Getting Started with Your Chromatic Dispersion Analyzer
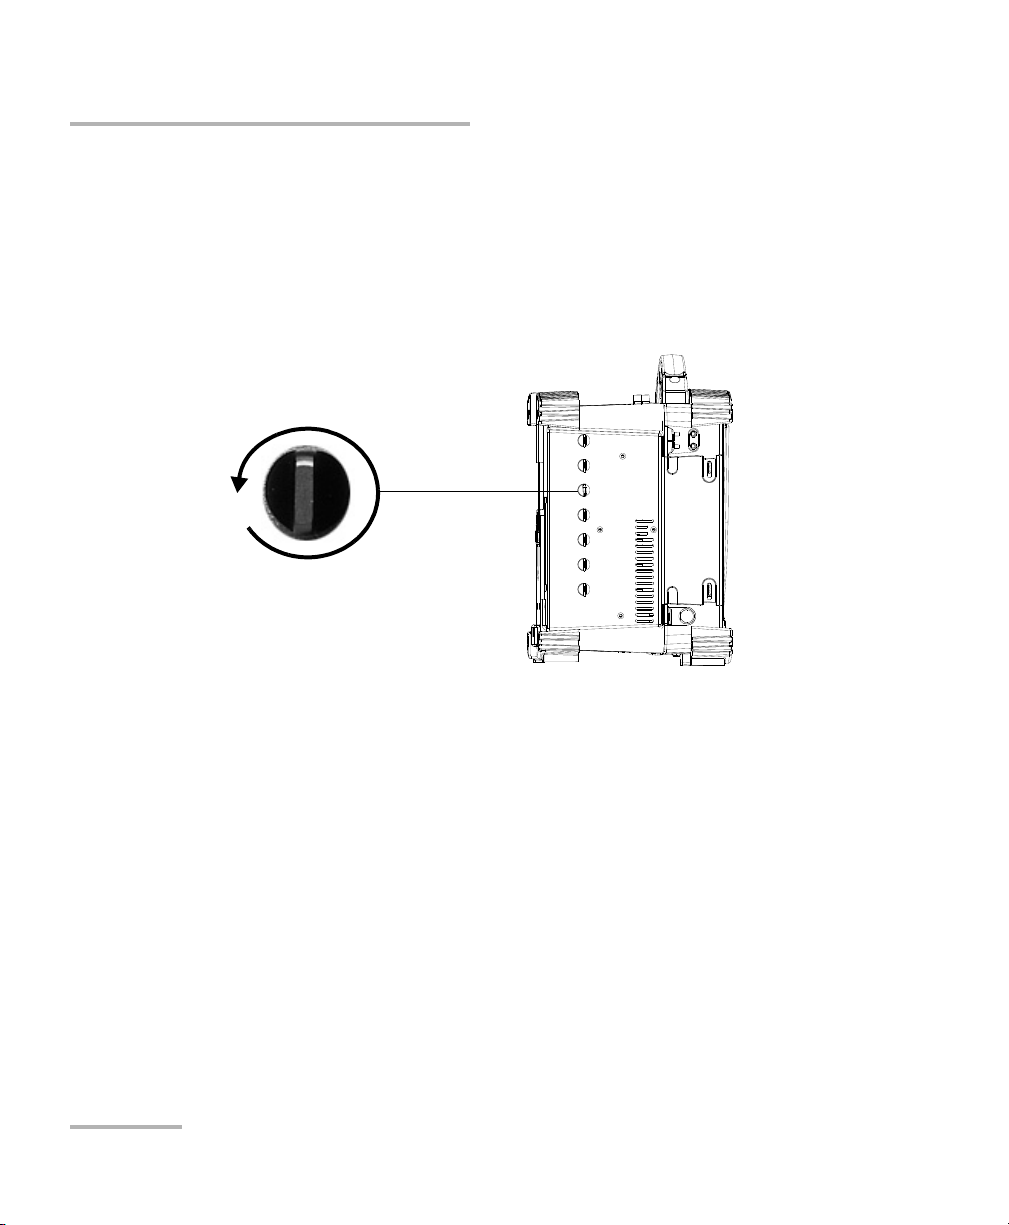
Turn retaining screw knob(s)
counterclockwise
FTB-400 left panel
(7-slot unit shown)
Inserting and Removing Test Modules
To remove a module from the FTB-400 Universal Test System:
1. Exit ToolBox and turn off your unit.
2. Position the FTB-400 so that the left panel is facing you.
3. Turn the retaining screw counterclockwise until it stops.
The module will be slowly released from the slot.
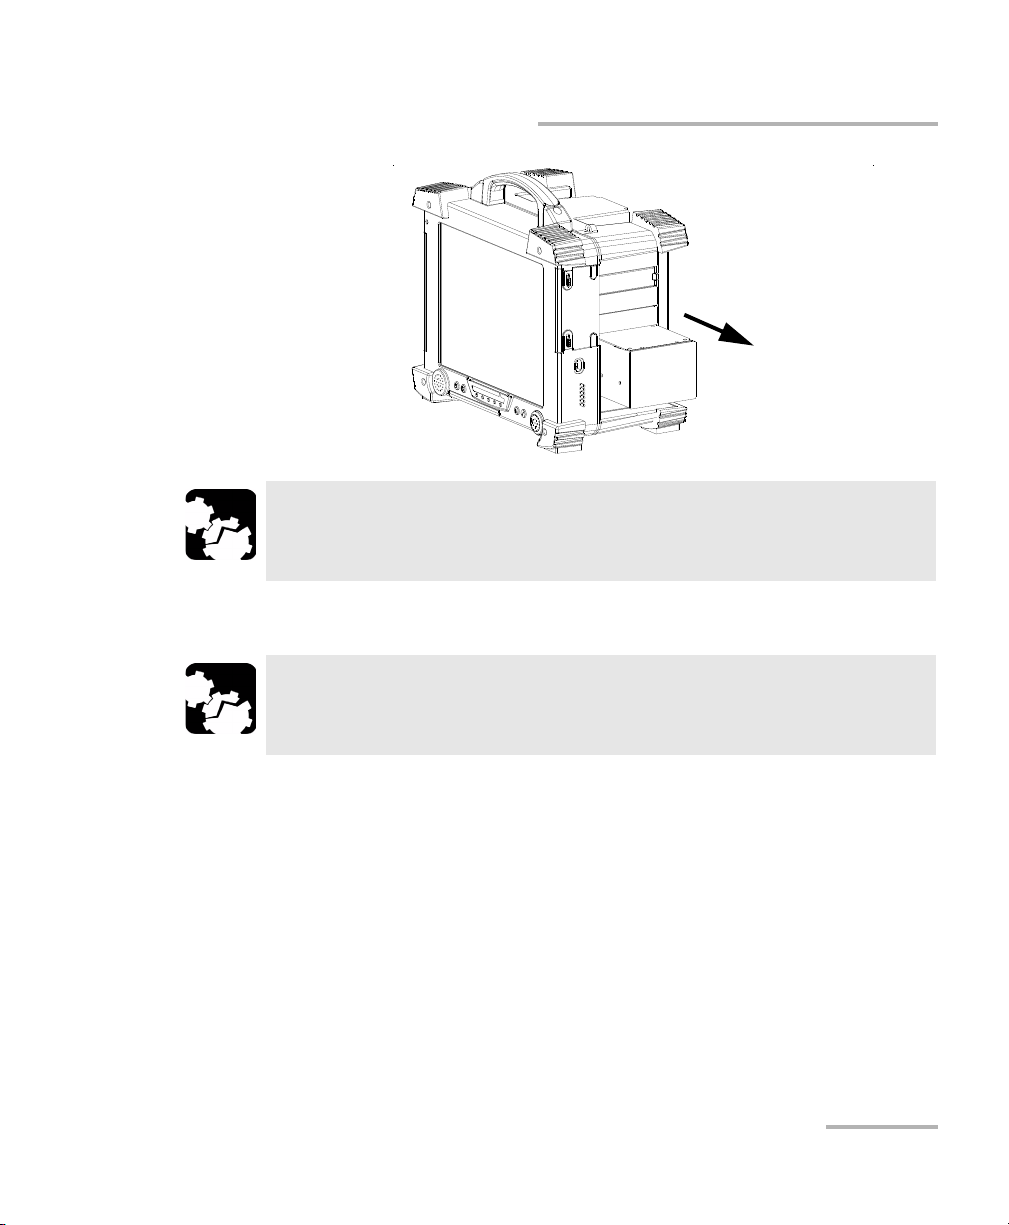
4. Place the FTB-400 so that the right panel is facing you.
5. Hold the module by its sides or by the handle (NOT by the connector)
and pull it out.
8 FTB-5800
Page 15
Getting Started with Your Chromatic Dispersion Analyzer
Inserting and Removing Test Modules
CAUTION
Pulling out a module by a connector could seriously damage both
the module and connector. Always pull out a module by its casing.
6. Cover empty slots with the supplied protective covers.
CAUTION
Failure to reinstall protective covers over empty slots will result in
ventilation problems.
Chromatic Dispersion Analyzer 9
Page 16
Getting Started with Your Chromatic Dispersion Analyzer
Starting the Chromatic Dispersion Analyzer Application
Starting the Chromatic Dispersion Analyzer
Application
Your FTB-5800 Chromatic Dispersion Analyzer module may be fully
configured and controlled from its dedicated ToolBox application.
Note: For details about ToolBox, refer to the FTB-400 Universal Test System user
guide.
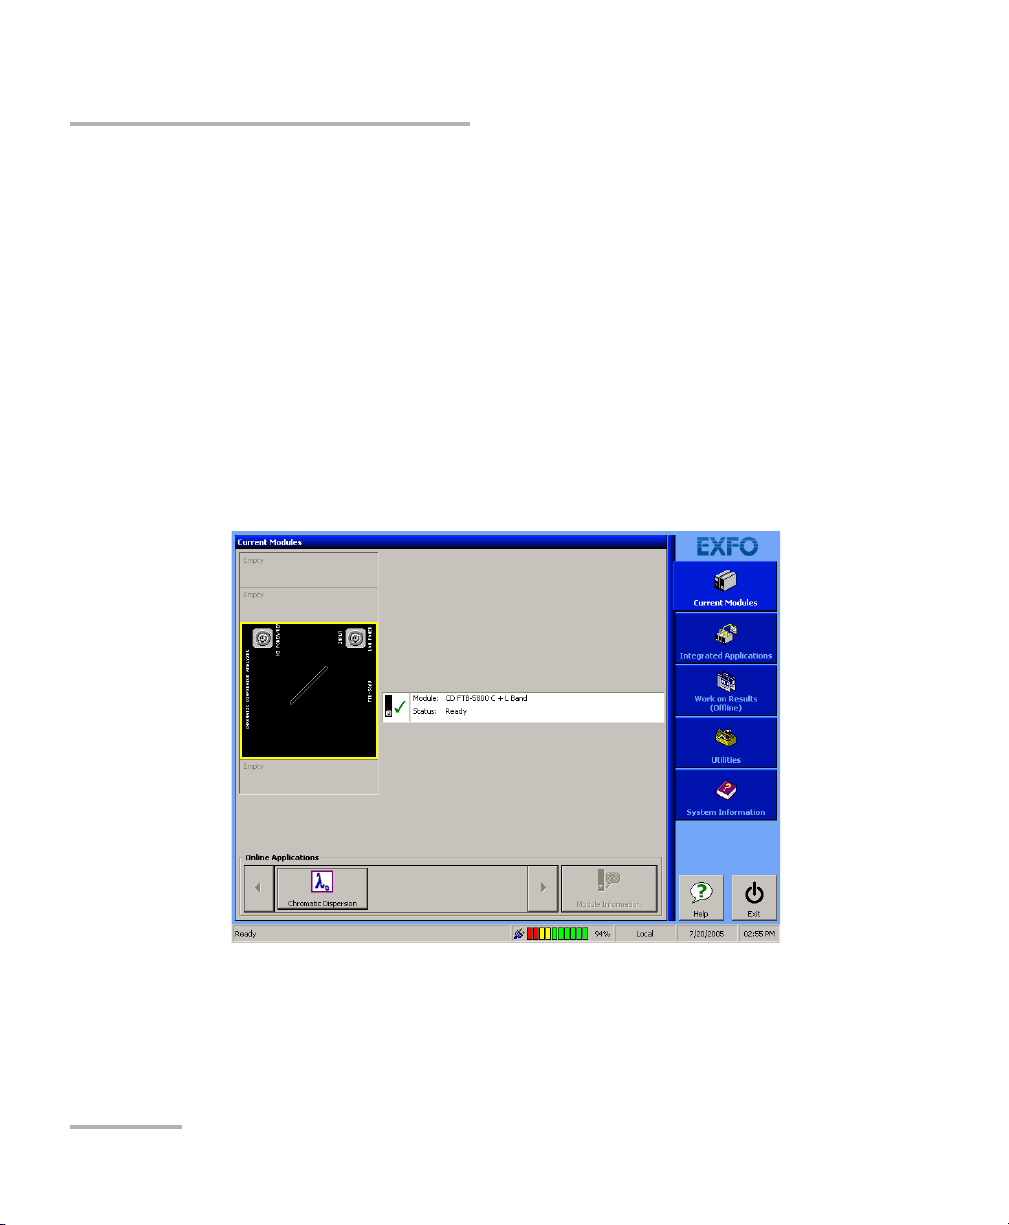
To start the Chromatic Dispersion Analyzer application:
1. From the Current Modules function tab, select the row corresponding
to the module you wish to use. It will turn white to indicate that it is
highlighted.
2. Press the corresponding button in the Online Applications box.
10 FTB-5800
Page 17
Getting Started with Your Chromatic Dispersion Analyzer
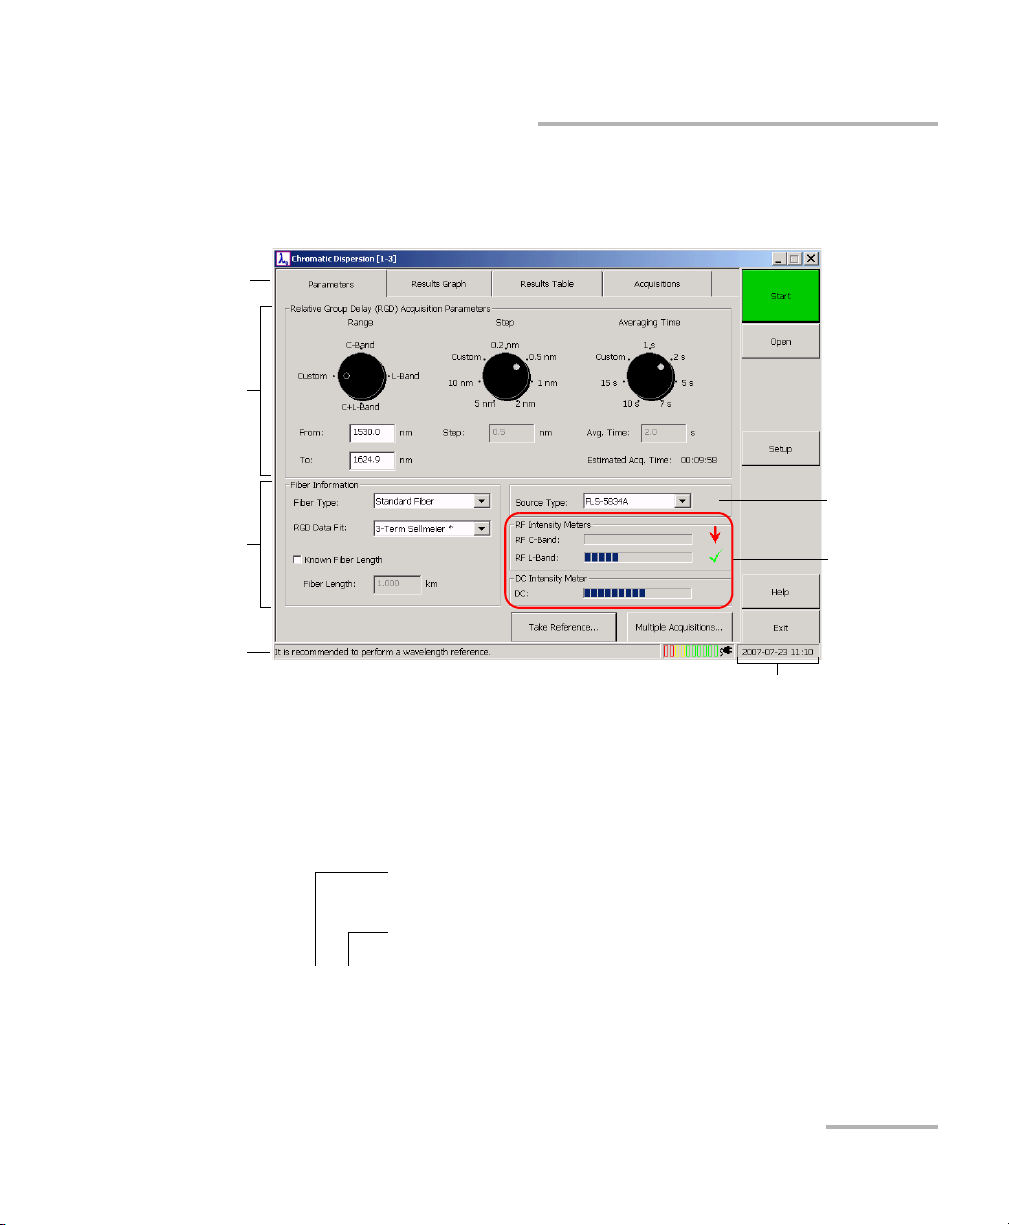
Ta bs
RGD
parameters
panel
Fiber
Information
panel
Intensity
meters
Status bar
Button bar
Source type
Slot number in which module is inserted
(0 identifies first slot)
Unit housing the module
(1 identifies FTB-400)
[1– 1]
Starting the Chromatic Dispersion Analyzer Application
The main window (shown below) contains all the commands required to
control the Chromatic Dispersion Analyzer:
Title Bar
The title bar is located at the top of the main window. It displays the
module name and its position in the FTB-400 Universal Test System. The
module position is identified as follows:
Note: On some 7-slot backplanes, slots are marked with a letter from A to G.
Chromatic Dispersion Analyzer 11
Page 18
Getting Started with Your Chromatic Dispersion Analyzer
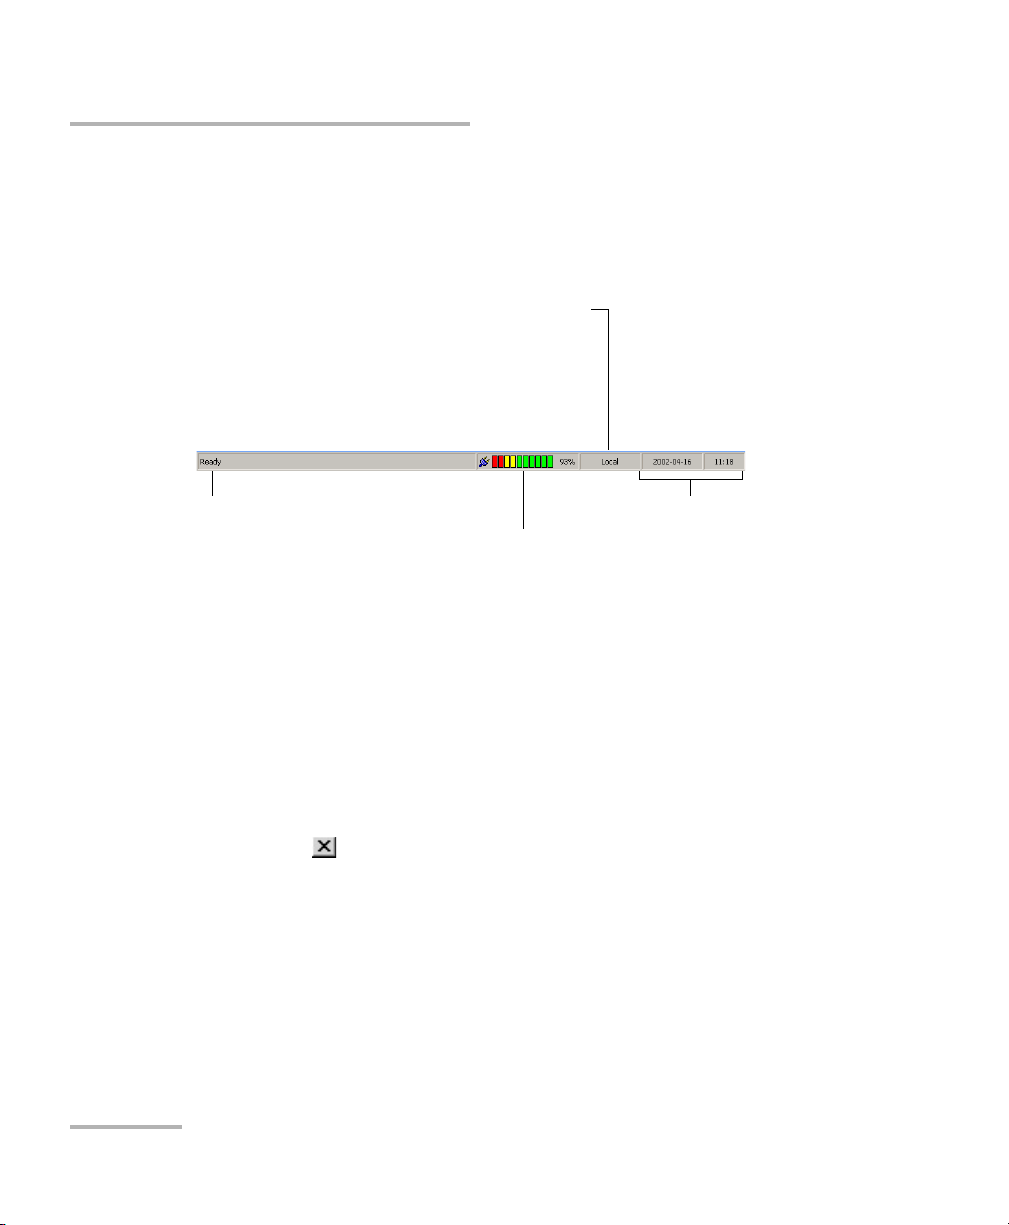
Current date and timeModule/unit status
Local: Module controlled locally only.
Remote: Module controlled remotely, but local
commands can also be used (some products only).
Lockout: Module controlled remotely only.
Battery indicator
Control mode
Exiting the Application
Status Bar
The status bar, located at the bottom of the main window, identifies the
current operational status of the FTB-5800 Chromatic Dispersion Analyzer.
For more information about automating or remotely controlling the
FTB-5800 Chromatic Dispersion Analyzer, refer to the FTB-400 Universal
Test System user guide.
Exiting the Application
Closing any application that is not currently being used is a good way to
free up system memory.
To close the application from the main window:
³ Click on (in the top right corner of the main window).
³ Click on the Exit button located at the bottom of the function bar.
12 FTB-5800
Page 19
3 Setting Up Your Chromatic
Dispersion Analyzer
The parameters you set will be kept in memory after turning off the
FTB-400 Universal Test System.
Setting the Wavelength Range
You can set the wavelength range within which you want to perform your
acquisitions. You can work with predefined bands (C, L or C+L) or set the
wavelength range by using the custom option. This option could be useful
to perform acquisitions in a specific area of a band or between two bands.
IMPORTANT
Make sure you connect the source corresponding to the wavelength
range you select at the other end of the link.
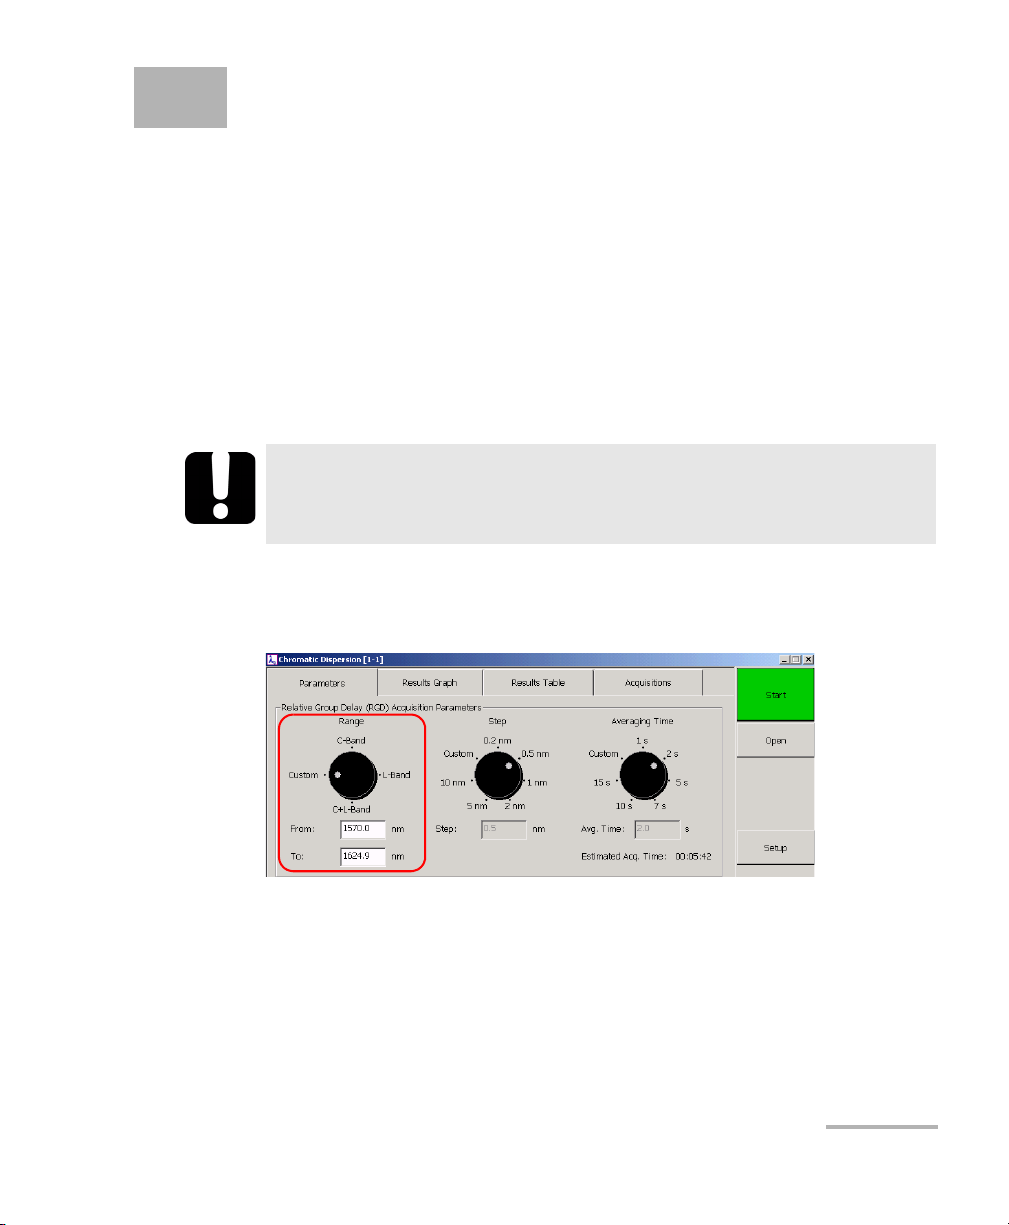
To select a predefined wavelength range:
On the Parameters tab, use the Range dial.
To set the wavelength range using the custom option:
1. On the Parameters tab, set the Range dial to Custom.
2. Enter your values in the From: and To : fields. The values you enter
must be between 1530 and 1625 nm, which are, respectively, the lower
limit of the C band and the upper limit of the L band.
Chromatic Dispersion Analyzer 13
Page 20
Setting Up Your Chromatic Dispersion Analyzer
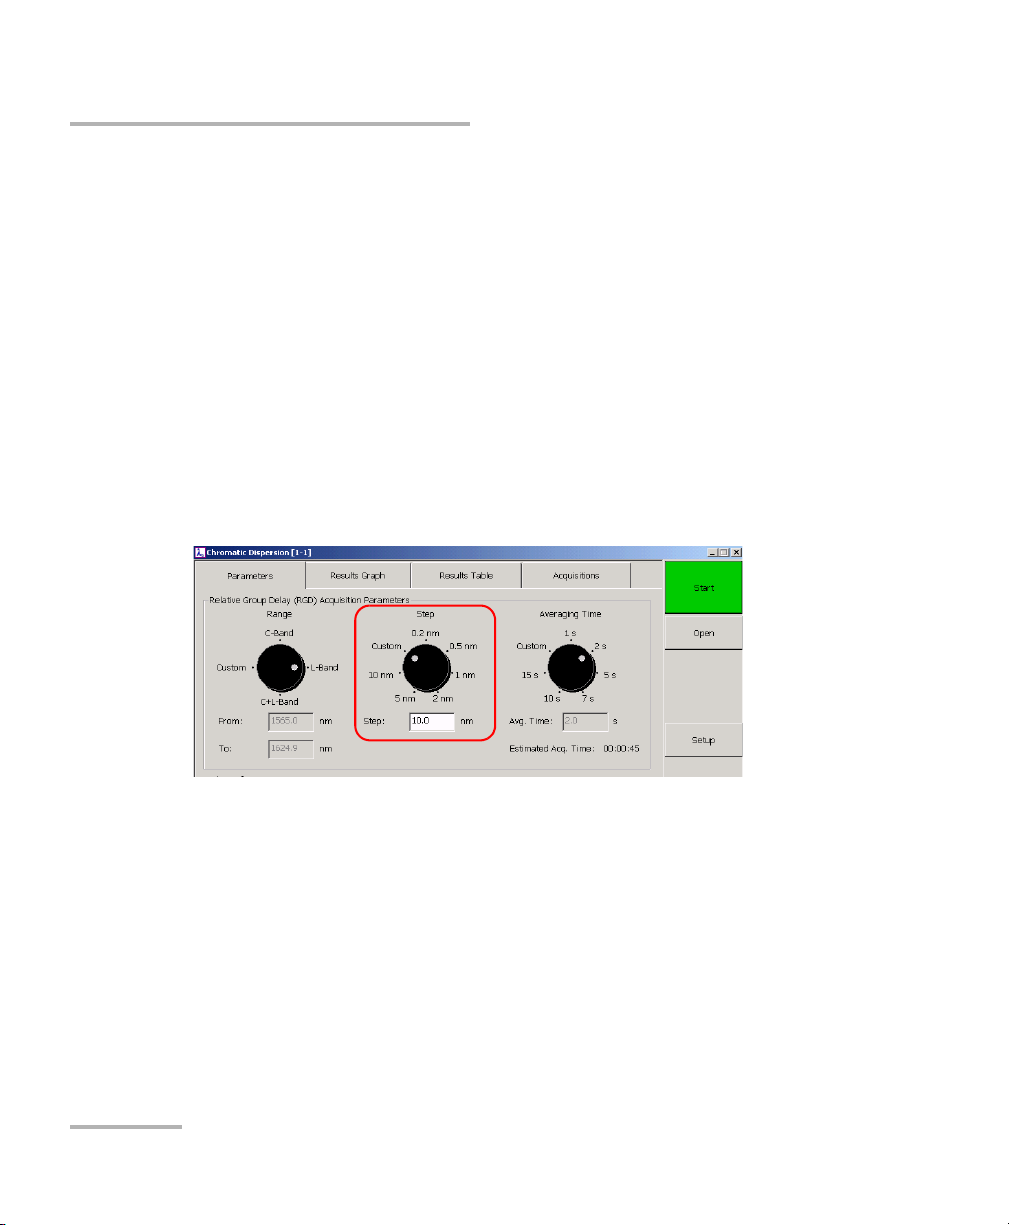
Setting the Wavelength Step
Setting the Wavelength Step
The wavelength step corresponds to the interval, in nanometers, at which
the system will take RGD measurements within the selected wavelength
range. You can either choose one of the preprogrammed step or specify
the desired value with the custom option.
Note: The smaller the step you choose, the higher the accuracy of your
measurement will be and the longer the acquisition will take. For unknown
fiber type or amplified links, EXFO strongly recommends selecting the
smallest step possible.
To select a predefined wavelength step:
On the Parameters tab, use the Step dial.
14 FTB-5800
Page 21

Setting Up Your Chromatic Dispersion Analyzer
λmax λmin–
λΔ
Setting the Wavelength Step
To set the wavelength step using the custom option:
1. In the Parameters tab, set the Step dial to Custom.
2. Enter the desired value in the Step box. The value must be between
0.1 nm and the wavelength range you chose previously.
Moreover, the final measurement point, may not correspond to the
upper limit of the wavelength range if the wavelength span
is not an integer value of
A warning message will indicate if your step is too small or too large.
Chromatic Dispersion Analyzer 15
Page 22
Setting Up Your Chromatic Dispersion Analyzer
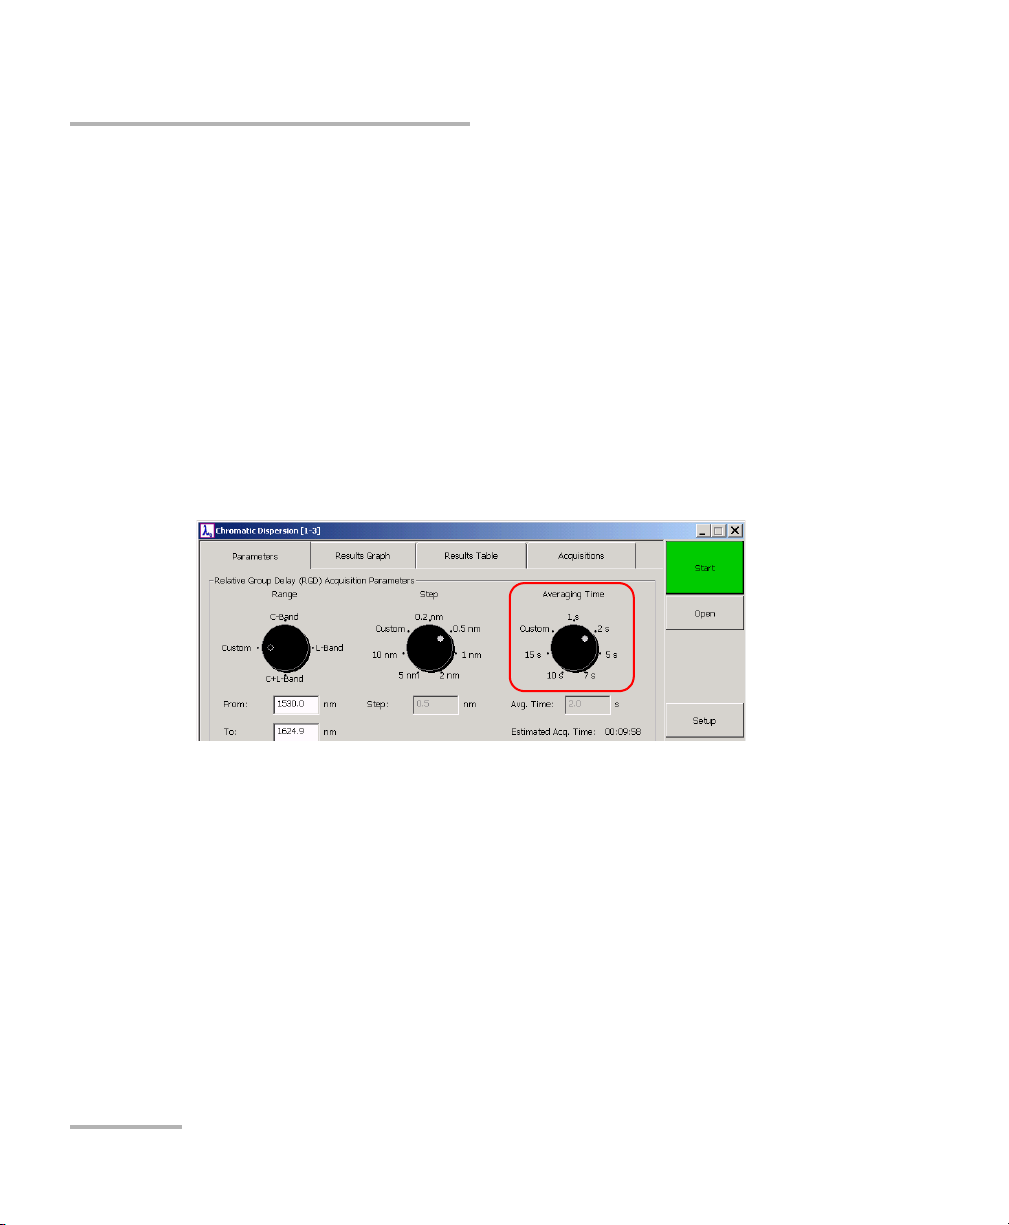
Setting the Averaging Time
Setting the Averaging Time
The averaging time is the time the system spends on one specific point or
wavelength. You can either choose one of the preprogrammed values or
specify the desired averaging time with the custom option.
Note: The stronger the signal, the faster a signal-to-noise ratio (SNR) will be
reached. If your signal is weak, increase the averaging time in order to
increase the accuracy of your results. Beyond a certain time limit, however,
the accuracy you gain will be insignificant.
To select a predefined averaging time:
On the Parameters tab, use the Averaging Time dial.
To set averaging time using custom option:
1. In the Parameters tab, set the Averaging Time dial to Custom.
2. Enter a value between 1.0 s and 60.0 s in the Avg Time box. The system
will warn you if the value exceeds those limits.
Note: The averaging time displayed on the screen does not take stabilizing time
into account. The Estimated Acq. Time field will give you an idea of the
overall time your acquisition will take, including the time needed for the
system to stabilize, as this time can vary.
16 FTB-5800
Page 23

Setting Up Your Chromatic Dispersion Analyzer
Specifying the Fiber Under Test
Specifying the Fiber Under Test
Before making an acquisition, you must also enter information on the fiber
you are going to test. This information includes the fiber type, the data fit
and the fiber length. You can also specify the distance units to be used.
Whether you know the fiber length or not will affect your results display.
³ Unknown fiber length: results will show the total dispersion.
³ Known fiber length: results will give out the dispersion per kilometer.
Note: The units you modify are only used when you specify the fiber length. On
the scales, as well as for calculation, the distance will always remain in
kilometers.
Chromatic Dispersion Analyzer 17
Page 24
Setting Up Your Chromatic Dispersion Analyzer
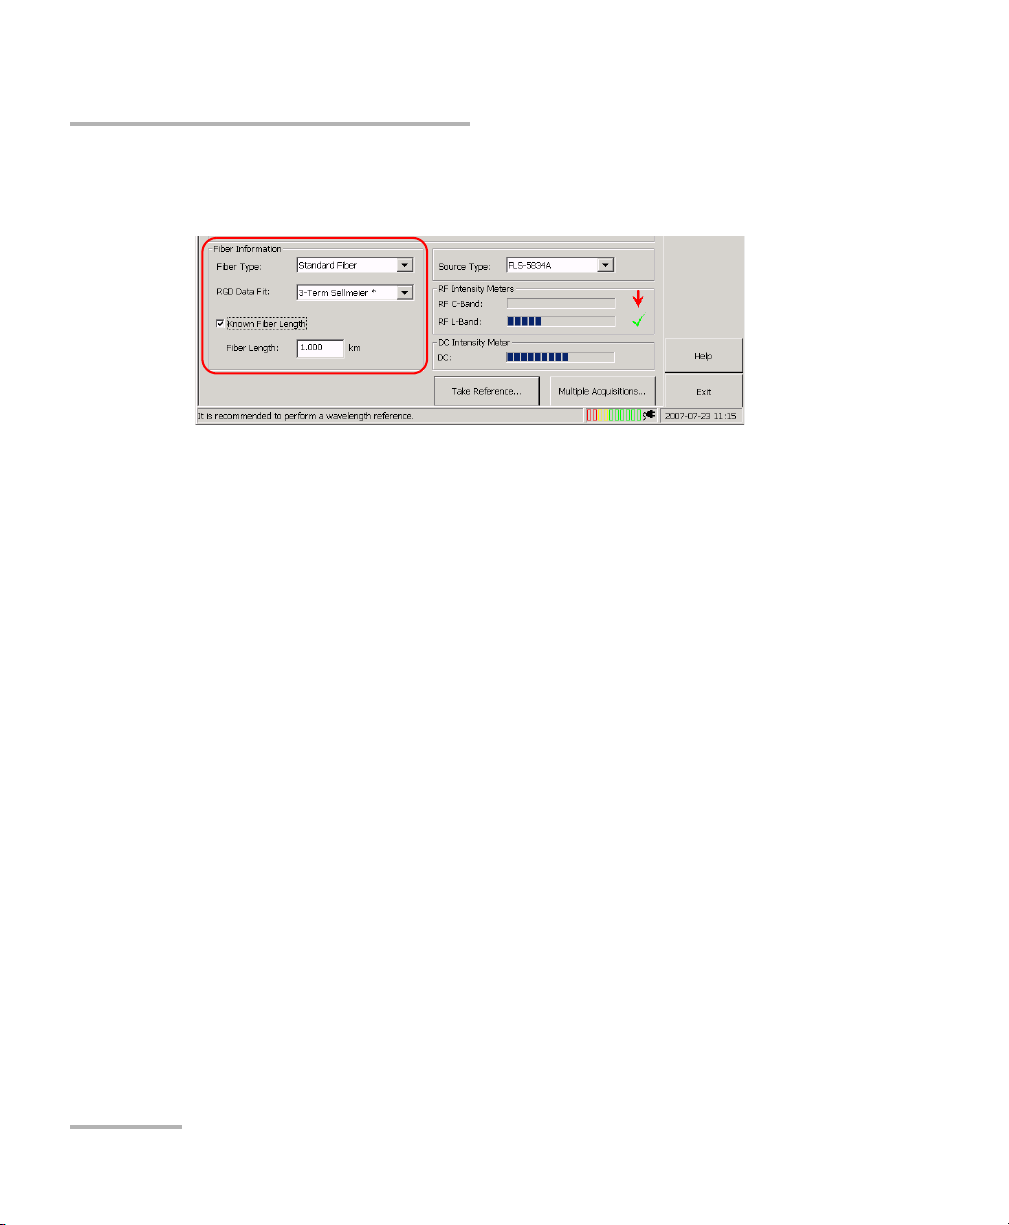
Specifying the Fiber Under Test
To specify the fiber under test:
In the Parameters tab, undr Fiber Information, set the fiber parameters.
³ In the Fiber Type list, select the appropriate value.
Note: If you do not know the fiber type, select “Unknown Fiber Type”. If your fiber
is made of more than one type of fiber, either enter the dominant fiber type
or select “Unknown Fiber Type”.
³ The application will designate a default fit according to the fiber type; it
will be marked by an asterisk (*) to indicate that it is a default value. If
necessary, in the RGD Data Fit list, select the desired data fit.
Note: The RGD data fit you select here will be applied to the relative group delay
for the next acquisition. However, once in the Results Graph tab, it is
possible to interpret your results by selecting another fit.
³ If you know the fiber length, select the Known Fiber Length box and
enter the appropriate fiber length in the corresponding box. By default,
the value is in kilometers.
18 FTB-5800
Page 25
Setting Up Your Chromatic Dispersion Analyzer
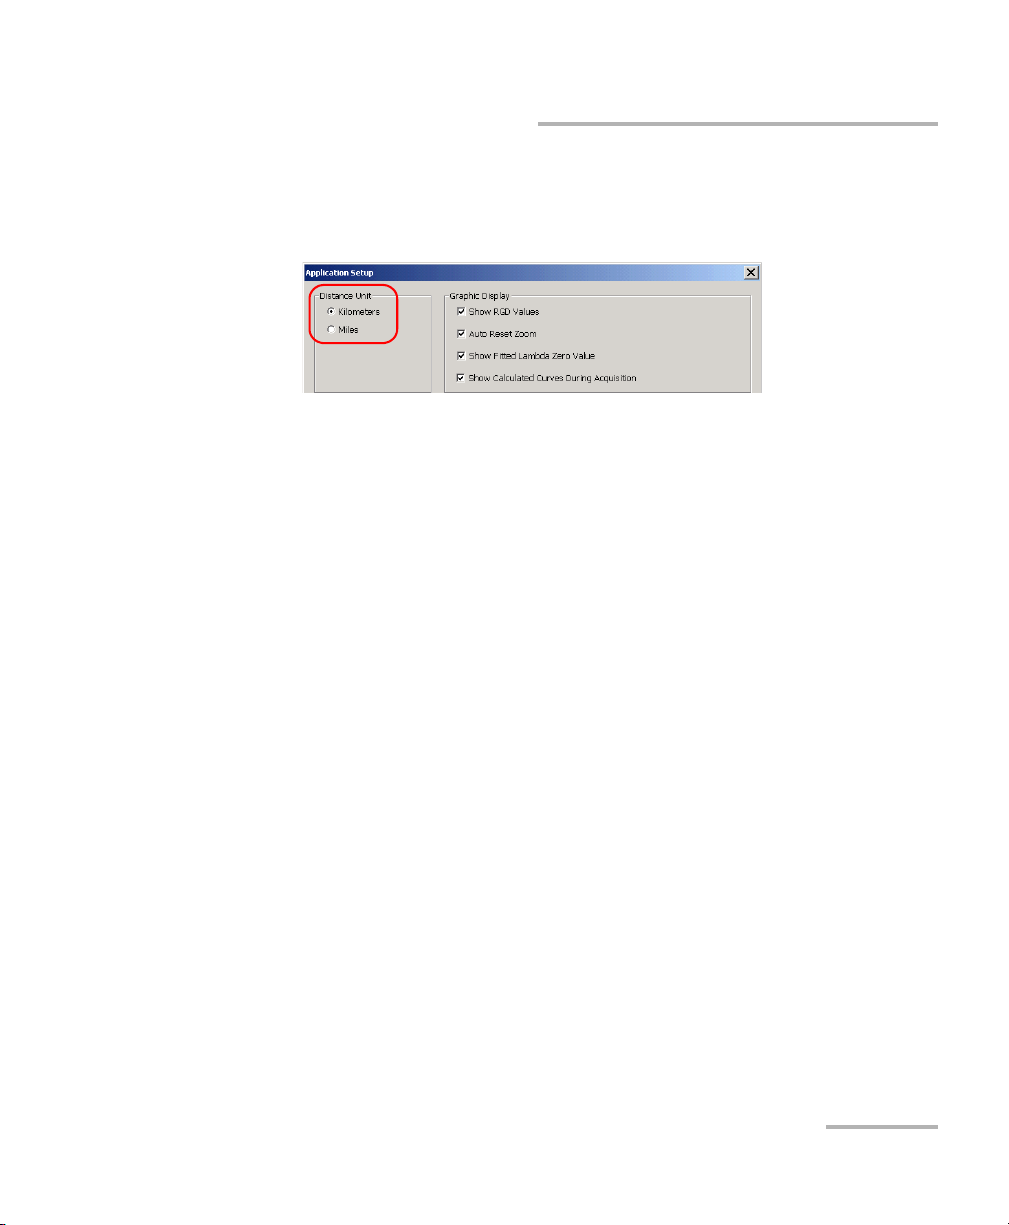
Specifying the Fiber Under Test
To modify the distance units:
1. On the button bar, click the Setup button, to access the Application
Setup dialog box.
2. Under Distance Unit, select the desired units.
3. Click OK to confirm the new settings or Cancel to discard them.
Chromatic Dispersion Analyzer 19
Page 26

Setting Up Your Chromatic Dispersion Analyzer
Defining the Automatic Fiber Name Format
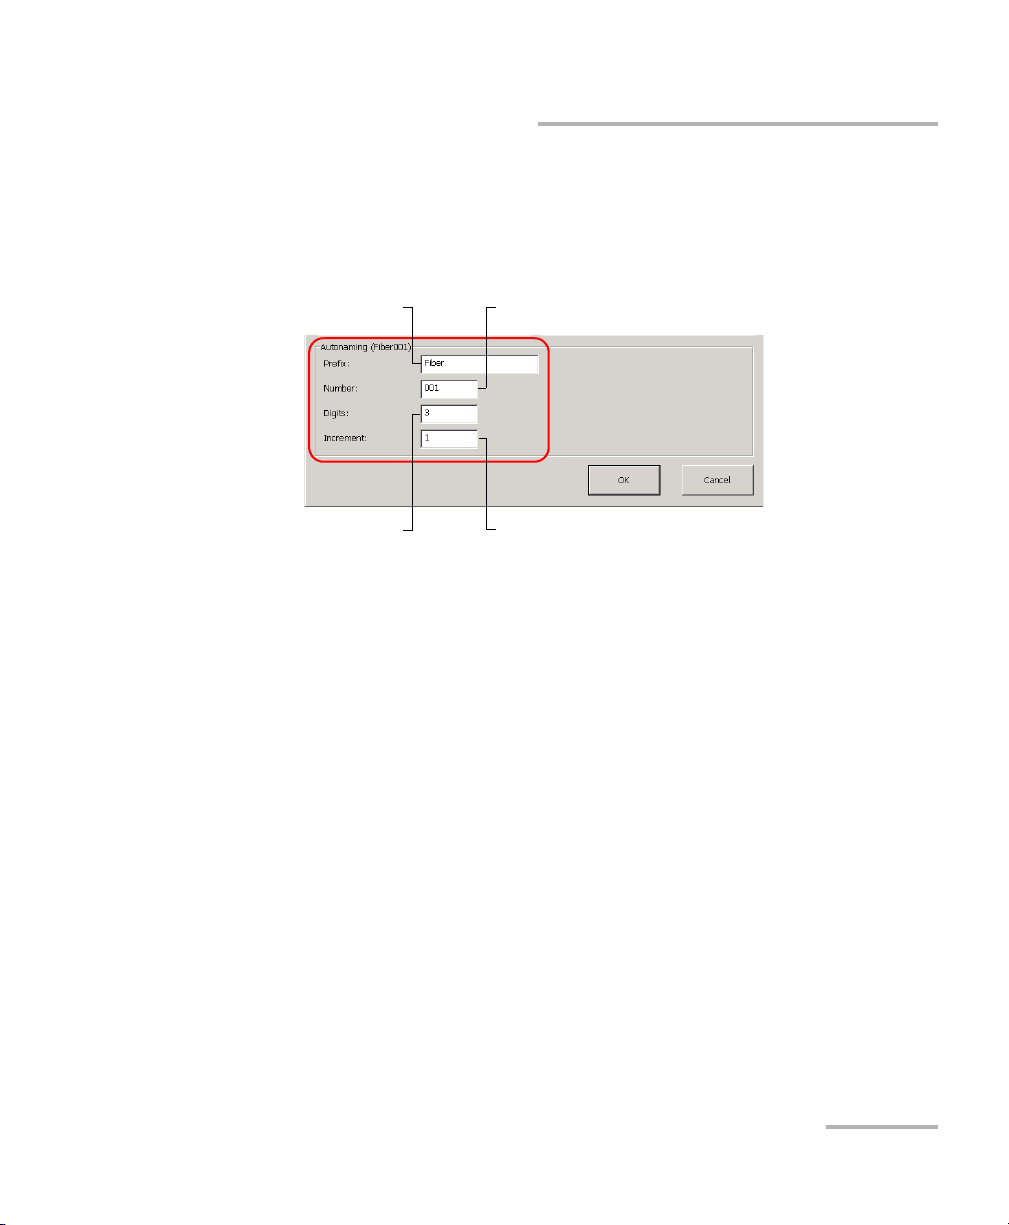
Defining the Automatic Fiber Name Format
Each time you make a new acquisition, the fiber name changes
automatically according to a pattern you will have previously defined. This
name is made of a static part (prefix) and a variable part that will be
incremented.
The increment can be positive, negative or null (zero). Entering zero gives
you the opportunity to use the same acquisition fiber name.
Note: The number you can enter will depend on the number of digits you have
specified. For example, if you set two digits, the maximum you can enter
is 99. Once the system reaches 99, it will step back to 00. If the selected
increment is negative, when the system reaches 00, it will step back to 99.
If you do not enter any prefix or number, the fiber will be identified with
one number only.
Note: You can modify the fiber name later, when the acquisitions are complete.
For more information, see Documenting Results on page 59.
Note: You cannot define the automatic fiber name format in offline mode.
20 FTB-5800
Page 27
Setting Up Your Chromatic Dispersion Analyzer
Number of digits composing the
fiber identification number
Value that will be added to the fiber identification
number to build the next fiber name
Static part Variable part (incremented)
Defining the Automatic Fiber Name Format
To define the fiber name format:
1. On the button bar, click Setup.
2. Under Autonaming, set the various parameters according to your
needs.
Chromatic Dispersion Analyzer 21
Page 28

Page 29
4 Operating Your Chromatic
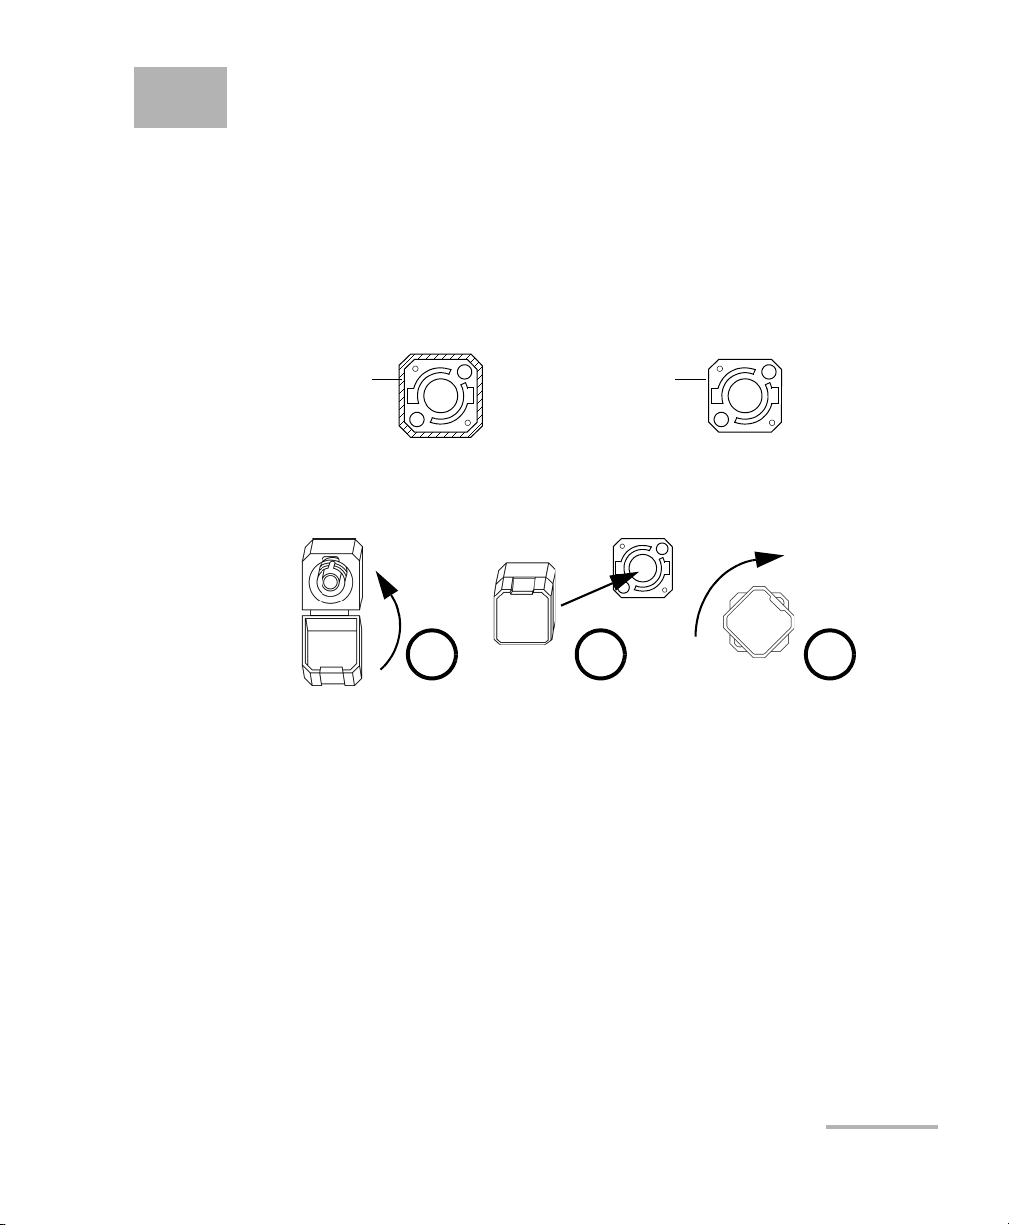
Bare metal
(or blue border)
indicates UPC
option
Green border
indicates APC
option
2 3 4
Dispersion Analyzer
Installing the EXFO Universal Interface (EUI)
The EUI fixed baseplate is available for connectors with angled (APC) or
non-angled (UPC) polishing.A green border around the baseplate indicates
that it is for APC-type connectors.
To install an EUI connector adapter onto the EUI baseplate:
1. Hold the EUI connector adapter so the dust cap opens downwards.
2. Close the dust cap in order to hold the connector adapter more firmly.
3. Insert the connector adapter into the baseplate.
4. While pushing firmly, turn the connector adapter clockwise on the
baseplate to lock it in place.
Chromatic Dispersion Analyzer 23
Page 30

Operating Your Chromatic Dispersion Analyzer
Cleaning and Connecting Optical Fibers
Cleaning and Connecting Optical Fibers
IMPORTANT
To ensure maximum power and to avoid erroneous readings:
³ Always clean fiber ends as explained below before inserting
them into the port. EXFO is not responsible for damage or
errors caused by bad fiber cleaning or handling.
³ Ensure that your patchcord has appropriate connectors. Joining
mismatched connectors will damage the ferrules.
To connect the fiber-optic cable to the port:
1. Clean the fiber ends as follows:
1a. Gently wipe the fiber end with a lint-free swab dipped in isopropyl
alcohol.
1b. Use compressed air to dry completely.
1c. Visually inspect the fiber end to ensure its cleanliness.
2. Carefully align the connector and port to prevent the fiber end from
touching the outside of the port or rubbing against other surfaces.
If your connector features a key, ensure that it is fully fitted into the
port’s corresponding notch.
3. Push the connector in so that the fiber-optic cable is firmly in place,
thus ensuring adequate contact.
If your connector features a screwsleeve, tighten the connector
enough to firmly maintain the fiber in place. Do not overtighten, as this
will damage the fiber and the port.
Note: If your fiber-optic cable is not properly aligned and/or connected, you will
notice heavy loss and reflection.
24 FTB-5800
Page 31

Operating Your Chromatic Dispersion Analyzer
Cleaning and Connecting Optical Fibers
IMPORTANT
The FTB-5800 module is particularly sensitive to unclean fibers. Your
results can be erroneous if your fiber is dirty. Verify the fiber end
with a portable fiber-optic microscope (e.g., EXFO’s FOMS) or fiber
inspection probe (e.g., EXFO’s FIP).
WARNING
Verifying the fiber end WHILE THE SOURCE IS ACTIVE WILL result in
permanent eye damage.
Chromatic Dispersion Analyzer 25
Page 32

Operating Your Chromatic Dispersion Analyzer
Selecting the Source Type
Selecting the Source Type
Different sources can be used for testing with your Chromatic Dispersion
Analyzer. The different sources allow you work on either the C-band, the
L-band or the C+L-bands.
Source Type Available Bands
FLS-5834, FLS-5804, FLS-5803 C, L, C+L
FLS-5834A C+L
Note: If you change the source type, you must perform a new reference
measurement. For details, see Performing Reference Measurements on
page 28.
To select the source type:
On the Parameters tab, select the desired source in the corresponding list.
26 FTB-5800
Page 33

Operating Your Chromatic Dispersion Analyzer
Verifying the Intensity of the Source
Verifying the Intensity of the Source
The intensity meters allow you to make sure a source is connected to the
other end of the link and that this source corresponds to the band you are
testing.
RF Intensity
Meter indicates...
Power too low
(Signal is too
weak to be
measured)
Power too high
(Signal is too
strong to be
measured)
To verify the intensity of the source:
On the Parameters tab, consult the RF Intensity Meters indicators. Green
check marks indicate an appropriate intensity. Up or down arrows indicate
that the intensity is respectively too low or too high. You can also check DC
intensity from the DC Intensity Meter.
Possible causes/solution
³ Source is not active.
³ Source is active but in the wrong bandwidth.
³ Connected source is not an FLS-5800 CD/PMD Analyzer Source.
³ Source is defective.
³ Discontinuities in the optical link.
³ High-frequency modulation of the optical signal has been overly
reduced because of a saturated EDFA.
³ Use the High Power port instead of the Low Power port.
³ Use an attenuator with a null dispersion to take your
measurement. For more information, please contact EXFO.
Chromatic Dispersion Analyzer 27
Page 34

Operating Your Chromatic Dispersion Analyzer
Performing Reference Measurements
Performing Reference Measurements
IMPORTANT
To ensure the best possible results, EXFO recommends performing
reference measurements for wavelength and for chromatic
dispersion. Furthermore, you must perform a wavelength reference
BEFORE performing the chromatic dispersion reference.
Skipping wavelength reference may lead to inaccurate results. You
cannot perform both references in a single step.
Reference
type
Wavelength Before each test session
Chromatic
dispersion
Recommended reference
frequency
and every time the
application recommends it.
Once every month and
every time the source or
patchcord is changed.
Remarks
³ Adjusts the source wavelength precisely.
³ The application will advise you to take a
wavelength reference whenever the
need arises (after selecting a different
source type, after module initialization,
after a certain period of time or when
temperature varies), but never during
acquisitions.
When references are necessary, a
message will appear in the status bar,
recommending a new reference.
³ Used to cancel out source, analyzer and
patchcord dispersion.
It will be taken according to the sources
you have selected
(C-source; C-reference).
³ Important for low-chromatic-dispersion
measurement.
28 FTB-5800
Page 35

Operating Your Chromatic Dispersion Analyzer
Performing Reference Measurements
To take a wavelength reference:
Note: If the application has prompted you for a wavelength reference (after
initialization), you will be brought to step 3 of this procedure automatically.
1. Ensure that the fiber is properly connected to the Ref/High Power port.
2. On the Parameters tab, click the Tak e Refer e nce button.
Chromatic Dispersion Analyzer 29
Page 36

Operating Your Chromatic Dispersion Analyzer
Performing Reference Measurements
3. On the Wa velength tab, select the source band corresponding to the
source you intend to use.
4. Once your information is entered, click Take Re f e r ence.
30 FTB-5800
Page 37

Operating Your Chromatic Dispersion Analyzer
Performing Reference Measurements
To take a chromatic dispersion reference:
1. Ensure that a wavelength reference has been performed.
2. Ensure that the fiber is properly connected to the Ref/High Power port.
3. In the Parameters tab, click the Take R e f erence button.
Chromatic Dispersion Analyzer 31
Page 38

Operating Your Chromatic Dispersion Analyzer
Performing Reference Measurements
4. On the CD tab, identify the source from which the reference will be
taken. In the following dialog box, enter the source model and source
serial number in the appropriate boxes. This data will also be displayed
on the Results Table tab in the application main window.
5. Once your information is entered, click the Take Reference button.
Note: There is no reference setup, so the reference will be valid for all kinds of
tests using various parameters.
32 FTB-5800
Page 39

Operating Your Chromatic Dispersion Analyzer
Applying a Chromatic Dispersion Reference
Applying a Chromatic Dispersion Reference
Chromatic dispersion references can be taken after the results have been
acquired. This is useful if you did not have a source and patchcords at hand
before performing acquisitions (source and Chromatic Dispersion Analyzer
can be many kilometers apart).
Once your reference is taken, you can apply it to your results. The
patchcord and analyzer dispersion will be substracted from your results.
For more information on references and their importance, see Performing
Reference Measurements on page 28.
IMPORTANT
The reference will be applied to the entire file, not only to the
specific acquisition that is selected.
To apply a chromatic dispersion reference to your results:
1. On the Acquisitions tab, select any line.
2. Click the Apply Current Reference button.
Chromatic Dispersion Analyzer 33
Page 40

Operating Your Chromatic Dispersion Analyzer
Creating a File
Creating a File
Each time you make an acquisition, the results are added to those already
displayed under the Application tab. By default, when you save your
results, they will be all stored in the same file. If you want your results to be
stored in different files, you must explicitly create a new file BEFORE
making a new acquisition or set of acquisitions.
To create a file:
1. On the button bar, click Open.
2. In the Open File dialog box, click New File.
You are now ready to perform acquisitions.
34 FTB-5800
Page 41

Operating Your Chromatic Dispersion Analyzer
Measuring Chromatic Dispersion
Measuring Chromatic Dispersion
You can perform both single and multiple acquisitions on fibers.
To perform multiple acquisitions on the same fiber you must define the
number of measurements and the interval between them.
The average time between acquisitions must be of at least five minutes.
The five-minute period takes into account the time the application might
take to characterize the fiber link, depending on the quality of the signal. In
order for the value entered here to be valid, you must add five minutes to
the estimated acquisition time.
IMPORTANT
Do not change the test fiber between two acquisitions of a
multiple-measurement test since parameters set for a specific fiber
may not apply to all fibers.
If you stop an acquisition before it is complete, the results acquired until
then will be displayed. However, in some cases, a minimum number of
points must be acquired for the application to calculate chromatic
dispersion and display a trace (e.g., at least three points for the
3-Term Sellmeier type and at least five for the 5-Term Sellmeier).
To perform single or multiple acquisitions on a fiber:
1. If necessary, create a file (see Creating a File on page 34).
2. Set the general acquisition parameters as explained in Setting Up Your
Chromatic Dispersion Analyzer on page 13.
3. On the Parameters tab, click the Multiple Acquisitions button to
access the parameters dialog box.
Chromatic Dispersion Analyzer 35
Page 42

Operating Your Chromatic Dispersion Analyzer
Measuring Chromatic Dispersion
4. Set the parameters.
³ Single acquisition: clear the Multiple Acquisitions check box.
³ Multiple acquisitions: select the Multiple Acquisitions box and set
the parameters.
5. Click OK to confirm.
6. Verify that the fiber is properly connected and that the source is
activated in the right band.
36 FTB-5800
Page 43

Operating Your Chromatic Dispersion Analyzer
Measuring Chromatic Dispersion
7. On the button bar, click Start.
The Start button becomes a red Stop button. The application
automatically goes to the Results Graph tab. You can move to the
Results Table tab to see your results.
Note: The application takes some time to evaluate the power of the source. The
stronger the signal, the shorter the acquisition.
To stop the acquisition before it is complete:
Click the Stop button. The button changes back to a green Start button.
Chromatic Dispersion Analyzer 37
Page 44

Operating Your Chromatic Dispersion Analyzer
Saving Your Results
Saving Your Results
Once your acquisition is done, you must save your results if you intend to
use them for further analysis later on.
Note: If the file has not been saved yet or if some changes have been made to a
saved file, an asterisk appears beside the filename in the title bar.
IMPORTANT
When the application saves the results, all the acquisitions present
under the Acquisition tab will be stored in the same file.
Consequently, if you have opened an already existing file, the
results of the new acquisitions will be appended to this file.
If you want your results to be stored in different files, you must
explicitly create a new file BEFORE making a new acquisition or set
of acquisitions (see Creating a File on page 34).
The application will prompt you if you have not saved the results before
creating a new file or exiting.
To save your results:
1. On the button bar, click the Save button.
Note: If a keyboard is connected to the FTB-400, you can also use the Ctrl+S
shortcut key to save your results.
38 FTB-5800
Page 45

Operating Your Chromatic Dispersion Analyzer
Saving Your Results
2. Select the folder in which you want to save your data or create a folder
by clicking the New Folder button.
3. In the Filename box, type the name you want to give to your file (if the
virtual keyboard is not displayed, select the Filename box again.) The
file format is xxx.ExfoCD.
4. Click OK.
You know that the file is saved when the asterisk beside the name
disappears.
Chromatic Dispersion Analyzer 39
Page 46

Page 47

5 Managing Results
Your FTB-5800 Chromatic Dispersion Analyzer allows you to work with two
types of results:
³ Newly acquired results
³ Results loaded from existing files
To view and analyze your results, the application provides:
³ A graph and a table presenting details for a specific acquisition
³ A window giving you an overview of all the available acquisitions
You can zoom in on specific areas of the graph or remove points that are
too far from the average. You can also specify which curves will be
displayed (dispersion, RGD).
Finally, the Chromatic Dispersion Analyzer allows you to print or to export
results and related information.
Chromatic Dispersion Analyzer 41
Page 48

Managing Results
Recalling a Saved File
Recalling a Saved File
It is possible to reload existing files in .exfocd format. These files can also
be opened directly from Windows Explorer (the Chromatic Dispersion
Analyzer application starts automatically).
To open a file from the Chromatic Dispersion Analyzer:
1. On the button bar, click the Open button to recall the desired file.
Note: If a keyboard is connected to the FTB-400, you can also use the Ctrl+O
shortcut key to open your file.
2. Select the file and click OK.
42 FTB-5800
Page 49

Managing Results
Relative Group
Delay scale
Dispersion
scale
Wavelength
scale
Dispersion
curve
Measured
data point
RGD curve
Data fit type
Marker
Zoom
parameters
Analyzing Results from the Results Graph
Analyzing Results from the Results Graph
The application presents a graph containing details about the current
acquisition, including the fitted lambda zero value (extrapolated
wavelength at which the dispersion equals 0), the dispersion, the RGD
curve (illustrating the fitted points) and the measured RGD points. The
fitted lambda zero value, the RGD curve and the RGD points can be shown
or hidden, according to your needs.
The graph is based on three scales:
³ Dispersion scale: displays results in ps/nm-km or in ps/nm if the fiber
length is not known or not entered.
³ Relative Group Delay (RGD): displays results in ps.
³ Waveleng th: displays the wavelength in nm.
Chromatic Dispersion Analyzer 43
Page 50

Managing Results
Analyzing Results from the Results Graph
Even if you have acquired your results with a particular type of data fitting,
during your analysis, you may want to apply another type of fit. You should
choose the type of fit you want to apply to your results carefully so as to
minimize error. Some types of fits such as the Cubic and 5-Term Sellmeier
should not be used to extrapolate data.
Note: A minimum amount of points must be acquired for the fit to be calculated
and for the dispersion to be displayed. The minimum number of points
varies according to the fit.
The Chromatic Dispersion Analyzer also provides you with tools to help you
focus on certain data in the graph.
³ You can set the marker to a specific point of the graph to view the
results related to this point. Once you have positioned the marker, it
will keep its position for the next acquisition.
³ You can zoom in on specific areas of the graph to have a better view or
zoom out to see extrapolated data. It is also possible to revert to default
zoom manually or automatically when the corresponding option is
activated.
In some cases, it is useful to deactivate the automatic zoom reset. For
example, if you are analyzing a file containing many acquisitions, it
allows you to define the zoom once and then apply it to all traces.
Otherwise, you would have to define the zoom for each trace.
44 FTB-5800
Page 51

Managing Results
Analyzing Results from the Results Graph
To show or hide the fitted lambda zero value:
1. On the button bar, click Setup.
2. Under Graphic Display,
select the Show Fitted Lambda Zero Value check box to show the
value.
OR
clear the Show Fitted Lambda Zero Value check box to hide the
value.
Confirm the changes with OK.
Chromatic Dispersion Analyzer 45
Page 52

Managing Results
Analyzing Results from the Results Graph
To show or hide the RGD curves and/or RGD values
1. On the button bar, click Setup.
2. Under Graphic Display,
Click the Show RGD Values and/or Show Calculated Curves During
Acquisition check boxes to show the corresponding elements.
OR
Clear the Show RGD Values and/or Show Calculated Curves During
Acquisition check boxes to hide the corresponding elements.
3. Click OK.
46 FTB-5800
Page 53

Managing Results
Analyzing Results from the Results Graph
To interpret results using a different type of fit:
On the Results Graph tab, in the RGD Data Fit list, select the desired type
of fit.
Chromatic Dispersion Analyzer 47
Page 54

Managing Results
Marker
Analyzing Results from the Results Graph
To position the marker:
³ Drag the marker to the point you want to focus on.
³ Use the right and left arrows to move the marker to the desired
position.
³ Select the marker and move it with the FTB-400 selection dial.
48 FTB-5800
Page 55

Managing Results
Analyzing Results from the Results Graph
To zoom in on results or zoom out:
1. On the Results Graph tab, click the magnifying glass button.
2. Enter the desired range by putting a lower and upper limit value in the
fields of your choice. The wavelength, dispersion and RGD will be
magnified accordingly.
Note: You can only use the zoom function on extrapolated values that are within
the 1200 to 1700 nm wavelength acquisition range. Extrapolated values are
representative of the selected fit and might not represent the true behavior
of the fiber.
³ In the first level, you can enter the wavelength values you want to
see extrapolated in the Lower Limit and Upper Limit boxes.
³ You can also click More Details to access to additional parameters
for the zoom function. Enter the Dispersion or RGD value you
want to see extrapolated, in the Lower Limit and Upper Limit
boxes.
3. When you are done, click OK.
Chromatic Dispersion Analyzer 49
Page 56

Managing Results
Analyzing Results from the Results Graph
To revert the zoom factor to its default value:
1. On the Results Graph tab, click the magnifying glass button.
2. Click the Reset Zoom button to reset the graph view so that all the
acquisition points are visible.
50 FTB-5800
Page 57

Managing Results
Analyzing Results from the Results Graph
To have the zoom reset automatically:
1. On the button bar, click Setup.
2. Under Graphic Display, select the Auto Reset Zoom check box.
Chromatic Dispersion Analyzer 51
Page 58

Managing Results
Analyzing Results from the Results Table
Analyzing Results from the Results Table
The columns presented on the Results Table tab are detailed below. They
show you part of the data you need to know to analyze your results. The
content of the table can also be sorted for easier management. For
information on acquisition status (pass/fail)
³ The first column indicates if the data in this row is used to calculate the
final results.
³ Waveleng th: indicates the wavelength at which the dispersion has
been calculated.
³ RGD: corresponds to the measured relative group delay.
³ Fitted RGD: corresponds to the relative group delay obtained from the
fitted curve over the measured RGD.
³ RGD Deviation: corresponds to the absolute value between the RGD
and the Fitted RGD.
³ Dispersion (ps/nm): Dispersion value when fiber length is unknown.
³ Dispersion (ps/nm-km): Coefficient of dispersion when fiber length is
known.
52 FTB-5800
Page 59

Managing Results
Analyzing Results from the Results Table
When applicable, in the dispersion and coefficient of dispersion columns,
the acquisition status is indicated by (pass) or (fail). For more
information, see Establishing Thresholds on page 56.
If you want to lower your RGD’s mean square error rate, you can remove
the points with a larger RGD deviation from the graph. This way, they will
no longer be taken into account when applying the fit. As soon as you
remove one point, the RGD, fitted RGD, RGD deviation, dispersion and
coefficient of dispersion are recalculated.
Note: The points you remove will remain visible on the graph, but grayed out.
If you want to remove acquisitions permanently, see Keeping Track of
Acquisitions on page 54.
To automatically sort data:
In the results table, select the column header corresponding to the
criterion you want to use to sort data.
Chromatic Dispersion Analyzer 53
Page 60

Managing Results
Keeping Track of Acquisitions
To select or deselect points:
Select or deselect the corresponding boxes in the first column of the results
table.
Keeping Track of Acquisitions
The application offers a general view of both the current acquisitions and
those from a reloaded file. When a problem occurs, such as a fiber break,
you may want to delete the corresponding erroneous measurement. This
could be useful to avoid distorting results. The removal will only be
effective if you save changes (see Saving Your Results on page 38). If you
want to discard the changes, simply answer “No” when the application will
prompt you to save the file.
54 FTB-5800
Page 61

Managing Results
Keeping Track of Acquisitions
To display an overall view of the results:
Click the Acquisitions tab.
To delete unwanted results:
1. Inthe provided list, select the acquisition to be deleted and click Delete
Acquisition.
2. A confirmation message will be displayed. Click Yes to confirm.
3. Repeat steps 1 and 2 for each acquisition you want to delete.
Chromatic Dispersion Analyzer 55
Page 62

Managing Results
Establishing Thresholds
Establishing Thresholds
You can establish two types of thresholds: the dispersion and slope 0
thresholds.
The Dispersion Threshold will be displayed when the fiber you test
surpasses the dispersion level you allowed. It is applied to every
wavelength and will be displayed in the Results Table tab, where you will
have three possible results:
³ if your acquisition did not exceed the specified threshold.
³ if your acquisition exceeded the specified threshold.
³ --- if there are not enough points to calculate the fit or for the dispersion
per kilometer if the fiber length is unknown.
Note: Symbols are only displayed if you have selected a threshold.
56 FTB-5800
Page 63

Managing Results
Establishing Thresholds
The Slope 0 Threshold is the slope of the dispersion curve evaluated at
the points where the dispersion is null (lambda 0). In the Results Graph
tab, you will have four possible results:
³ Pass if the slope at lambda 0 is less than or equal to the threshold.
³ Fail if it is greater than the threshold.
³ Fit if your slope at lambda 0 did not respect FOTP standard 169. This
standard requires other points within 100 nm; otherwise, the slope at
lambda 0 is not reliable and can only be used as a reference.
³ --- if you did not select any thresholds.
Chromatic Dispersion Analyzer 57
Page 64

Managing Results
Establishing Thresholds
To establish your thresholds:
1. On the button bar, click Setup.
2. Set the thresholds as required.
³ If you want to establish a dispersion threshold, select the
³ If you want to establish a slope 0 threshold, select the Slope 0
Dispersion Threshold check box and enter the values in the
appropriate boxes.
Threshold check box and enter the values in the appropriate
boxes.
3. When you are done, click OK.
58 FTB-5800
Page 65

Managing Results
Documenting Results
Documenting Results
For easier management, you may want to add comments and information
about the tests that were performed. It is possible to include general and
specific information.
General information concerns jobs, receiver and source. Specific
information is related to measurements. This information could be
included later in reports or in exported ASCII files.
To add general information:
1. On the button bar, click Notepad.
2. In Notepad, fill the boxes according to your needs.
3. When you are done, click OK.
Chromatic Dispersion Analyzer 59
Page 66

Managing Results
Documenting Results
To add specific information:
1. On the Acquisitions tab, select the acquisition you wish to comment
(the row must be highlighted).
2. On the Results Table, fill in the Comments box.
The modifications will only be effective if you save them (see Saving Your
Results on page 38). If you want to discard the changes, simply answer
“No” when the application will prompt you to save the file.
60 FTB-5800
Page 67

Managing Results
Exporting Results and Graphs to Clipboard
Exporting Results and Graphs to Clipboard
The FTB-5800 Chromatic Dispersion Analyzer offers you the possibility of
quickly building your own reports by copying results and graphs to the
clipboard. Afterwards, the content of the clipboard can be pasted onto a
word-processor document of your choice. Graphs are exported exactly as
you see them on the screen (zoom factor and display are kept) and
converted to .bmp format.
Note: Only the points that are selected on the Results Table tab will be exported.
If you prefer to work with raw data to build your own tables and graphs,
see Exporting CD Analyzer Files with the File Export Tool on page 65.
IMPORTANT
Since information is stored to the clipboard, you cannot export
both results and graph simultaneously. You must copy them one at
a time.
To export the results table to the clipboard:
1. On the Results Table tab, ensure that all the points you want to export
are selected (the box appearing in the first column is checked).
2. On the button bar, click Copy to Clipboard.
You can now paste the content of the clipboard onto a word-processor
document, for example.
To export the graph to the clipboard:
1. On the Results Table tab, ensure that all the points you want to export
are selected (the check box appearing in the first column is selected).
2. Click the Results Graph tab.
3. On the button bar, click Copy to Clipboard.
You can now paste the content of the clipboard onto a word-processor
document, for example.
Chromatic Dispersion Analyzer 61
Page 68

Managing Results
Printing Results
Printing Results
The Chromatic Dispersion Analyzer allows you to print reports containing
test information and results. You can customize the report’s content by
selecting the sections, their order of appearance, as well as the
acquisitions that will be included. In fact, it is possible to print reports
including all the acquisitions listed on the Acquisitions tab or only the
current one.
To print a report:
1. On the button bar, click Print.
2. Specify which sections must appear in the report by selecting and
clearing the corresponding check boxes.
Note: The Select All and Clear All buttons allow you to quickly add/remove
selections.
3. If necessary, rearrange the order of the sections in the report:
3a. Select the section you want to move (ensure that the
corresponding line is highlighted).
3b. Click the Move Up and Move Down buttons.
3c. Repeat steps 3a and 3b for each section you want to move.
62 FTB-5800
Page 69

Managing Results
Printing Results
4. Select Print All Acquisitions or Print Current Acquisition Only,
depending on the type of report you need.
5. If necessary, set the printer parameters by using the Set Up Current
Printer button.
6. When you are done, click the OK button to start printing.
Chromatic Dispersion Analyzer 63
Page 70

Page 71

6 Exporting CD Analyzer Files
with the File Export Tool
The File Export tool has been designed to export chromatic dispersion files
to specific formats:
³ text files
³ comma-delimited (.csv) files
You can also fully customize the contents of the generated files by
exporting only the information you need.
Starting and Exiting the File Export Tool
To start the export tool:
In ToolBox, click the Work o n Results function tab. Click the Chromatic
Dispersion tab and click CD File Export.
Chromatic Dispersion Analyzer 65
Page 72

Exporting CD Analyzer Files with the File Export Tool
Function
tabs
Files to be
exported
Information
about the
export
process
Starting and Exiting the File Export Tool
The File Export tool main window is displayed.
To exit the export tool:
³ Click (in the top right corner of the main window).
66 FTB-5800
³ Click the Exit button located at the bottom of the function tabs bar.
Page 73

Exporting CD Analyzer Files with the File Export Tool
Setting Export Parameters
Setting Export Parameters
Before exporting data in one format to another, you must define:
³ Which information must be exported: You can export general test
information (fiber ID, acquisition parameters, source and receiver
information, etc.) as well as points from the acquired traces. This is
particularly useful if you intend to build your own graphs using
Microsoft Excel, for instance.
³ The conversion type (to text or to comma-delimited format).
³ Where to export files.
The parameters you set will remain unchanged until you choose to modify
them. They will still be available after the FTB-400 Universal Test System (or
the computer) has shut down.
Chromatic Dispersion Analyzer 67
Page 74

Exporting CD Analyzer Files with the File Export Tool
Setting Export Parameters
To set export parameters:
1. If necessary, open the File Export tool (see Starting and Exiting the File
Export Tool on page 65).
2. Select the desired conversion type.
3. On the Settings function tab, select all the check boxes corresponding
to the information you want to export.
Note: If you select Results Table, all points acquired during the test will be
exported.
4. Under Export Folder, click Browse to specify in which folder the
exported files will be stored.
68 FTB-5800
Page 75

Exporting CD Analyzer Files with the File Export Tool
Exporting Chromatic Dispersion Files
Exporting Chromatic Dispersion Files
Once the export parameters are set, you are now ready to start exporting
your files. Files that cannot be exported (e.g., files already open in another
application or corrupt files) will be skipped and their export status will
change to “Failed”.
IMPORTANT
To avoid errors during file export, ensure that all the files you intend
to use are closed.
To export chromatic dispersion files:
1. If necessary, start the export tool (see Starting and Exiting the File
Export Tool on page 65).
2. If necessary, set the export parameters (see Setting Export Parameters
on page 67).
3. Click the Converter function tab of the File Export tool.
Chromatic Dispersion Analyzer 69
Page 76

Exporting CD Analyzer Files with the File Export Tool
Successful export
Unsuccessful
export
Exporting Chromatic Dispersion Files
4. Select the files.
4a. Under Files To Be Exported, click Add.
A standard Open dialog box is displayed, allowing you to choose
the desired files.
Note: You can speed up file selection by choosing several files at the same time.
4b. When you are done, in the dialog box, click Open to transfer the
files to the list.
Note: You can remove a specific file by selecting it and using Remove. If you want
to quickly empty the list, choose Remove All.
5. Under Export Control, start the export process using the Export
File(s) button.
70 FTB-5800
Page 77

7 Maintenance
To help ensure long, trouble-free operation:
³ Always clean fiber-optic connectors before using them.
³ Keep the unit free of dust.
³ Clean the unit casing and front panel with a cloth slightly dampened
with water.
³ Store unit at room temperature in a clean and dry area. Keep the unit
out of direct sunlight.
³ Avoid high humidity or significant temperature fluctuations.
³ Avoid unnecessary shocks and vibrations.
³ If any liquids are spilled on or into the unit, turn off the power
immediately and let the unit dry completely.
Use of controls, adjustments, and procedures for operation and
maintenance other than those specified herein may result in
hazardous radiation exposure.
WARNING
Chromatic Dispersion Analyzer 71
Page 78

Maintenance
Push
Turn
Pull
3
4
5
Cleaning EUI Connectors
Cleaning EUI Connectors
Regular cleaning of EUI connectors will help maintain optimum
performance. There is no need to disassemble the unit.
If any damage occurs to internal connectors, the module casing will
have to be opened and a new calibration will be required.
To clean EUI connectors:
1. Remove the EUI from the instrument to expose the connector
baseplate and ferrule.
IMPORTANT
2. Moisten a 2.5 mm cleaning tip with one drop of isopropyl alcohol
(alcohol may leave traces if used abundantly).
3. Slowly insert the cleaning tip into the EUI adapter until it comes out on
the other side (a slow clockwise rotating movement may help).
4. Gently turn the cleaning tip one full turn, then continue to turn as you
withdraw it.
5. Repeat steps 3 to 4 with a dry cleaning tip.
72 FTB-5800
Page 79

Cleaning EUI Connectors
Note: Make sure you don’t touch the soft end of the cleaning tip.
6. Clean the ferrule in the connector port as follows:
6a. Deposit one drop of isopropyl alcohol on a lint-free wiping cloth.
IMPORTANT
Isopropyl alcohol may leave residues if used abundantly or left to
evaporate (about 10 seconds).
Avoid contact between the tip of the bottle and the wiping cloth,
and dry the surface quickly.
6b. Gently wipe the connector and ferrule.
6c. With a dry lint-free wiping cloth, gently wipe the same surfaces to
ensure that the connector and ferrule are perfectly dry.
6d. Verify connector surface with a portable fiber-optic microscope
(e.g., EXFO’s FOMS) or fiber inspection probe (e.g., EXFO’s FIP).
Maintenance
WARNING
Verifying the surface of the connector WHILE THE UNIT IS ACTIVE
WILL result in permanent eye damage.
7. Put the EUI back onto the instrument (push and turn clockwise).
8. Throw out cleaning tips and wiping cloths after one use.
Chromatic Dispersion Analyzer 73
Page 80

Maintenance
Cleaning Detector Ports
Cleaning Detector Ports
Regular cleaning of detectors will help maintain measurement accuracy.
Always cover detectors with protective caps when unit is not in use.
To clean detector ports:
1. Remove the protective cap and adapter (FOA) from the detector.
2. If the detector is dusty, blow dry with compressed air.
3. Being careful not to touch the soft end of the swab, moisten a cleaning
tip with only one drop of isopropyl alcohol.
Alcohol may leave traces if used abundantly. Do not use bottles that
distribute too much alcohol at a time.
IMPORTANT
IMPORTANT
4. While applying light pressure (to avoid breaking the detector window),
gently rotate the cleaning tip on the detector window.
5. Repeat step 4 with a dry cleaning tip or blow dry with compressed air.
6. Discard the cleaning tips after one use.
74 FTB-5800
Page 81

Maintenance
Recalibrating the Unit
Recalibrating the Unit
Manufacturing and service center calibrations are based on the
ISO/IEC 17025 Standard, which states that calibration documents must not
contain a recommended calibration interval, unless this has been
previously agreed upon with the customer.
Validity of specifications depends on operating conditions. For example,
the calibration validity period can be longer or shorter depending on the
intensity of use, environmental conditions and unit maintenance. You
should determine the adequate calibration interval for your unit according
to your accuracy requirements.
Under normal use, EXFO recommends calibrating your unit every year.
Chromatic Dispersion Analyzer 75
Page 82

Maintenance
Recycling and Disposal (Applies to European Union Only)
Recycling and Disposal
(Applies to European Union Only)
Recycle or dispose of your product (including electric and
electronic accessories) properly, in accordance with local
regulations. Do not dispose of it in ordinary garbage receptacles.
This equipment was sold after August 13, 2005 (as identified by
the black rectangle).
³ Unless otherwise noted in a separate agreement between EXFO and a
customer, distributor or commercial partner, EXFO will cover costs
related to the collection, treatment, recovery and disposal of
end-of-lifecycle waste generated by electronic equipment introduced
after August 13, 2005 to an European Union member state with
legislation regarding Directive 2002/96/EC.
³ Except for reasons of safety or environmental benefit, equipment
manufactured by EXFO, under its brand name, is generally designed to
facilitate dismantling and reclamation.
For complete recycling/disposal procedures and contact information, visit
the EXFO Web site at www.exfo.com/recycle.
76 FTB-5800
Page 83

8 Troubleshooting
Solving Common Problems
Fatal Error Consequences Recommended Solution
Module temperature is
too high for operation.
Module temperature is
too low for operation.
There is a critical module
error.
a. See Technical Specifications on page 87.
Operating Error Consequences Recommended Solution
Source power is too high. The reference or
The module will stop
functioning.
The module will stop
functioning.
The module will stop
functioning.
acquisition will not be
permitted.
Use the system within the
recommended operation
temperature.
Use the system within the
recommended operation
temperature.
Try restarting the application.
If the problem persists, contact
EXFO.
³ Check if you have the right input
port.
³ Check if there is an amplifier in
your fiber link.
³ Use the intensity meter to check
the source’s signal.
³ Add an attenuator to the link.
a
a
Source power is too low. The reference or
acquisition
will not be permitted.
Chromatic Dispersion Analyzer 77
³ Check if the fiber link is
damaged.
³ Use the intensity meter to check
the source signal.
³ Check your connections.
³ Make sure your fiber link is not
too long.
Page 84

Troubleshooting
Solving Common Problems
Warning Consequences Recommended Solution
Source power is low. Some points will be
grayed out on the graph.
The power of the source
is too high.
Module temperature is
very high.
Some points will be
grayed out on the graph.
The accuracy of your
measurements can be
affected.
Module temperature is
very low.
The accuracy of your
measurements can be
affected.
³ Check if you have the right
input port.
³ Check if the fiber link is
damaged.
³ Check for irregularities in the
fiber.
³ Use the intensity meter to
check the source’s signal.
³ Make sure your fiber link is not
too long.
³ Use the intensity meter to
check the source signal.
³ Check for irregularities in the
fiber.
Use the system within the
recommended operation
temperature.
a
Use the system within the
recommended operation
temperature.
a
a. See Technical Specifications on page 87.
78 FTB-5800
Page 85

Troubleshooting
Viewing Online Documentation
Viewing Online Documentation
An online version of the FTB-5800 Chromatic Dispersion Analyzer user
guide is conveniently available at all times from the application.
To access the online user guide:
Simply click on Help in the function bar.
Finding Information on the EXFO Web Site
The EXFO Web site provides answers to frequently asked questions (FAQs)
regarding the use of your FTB-5800 Chromatic Dispersion Analyzer.
To access FAQs:
1. Ty pe http://www.exfo.com in your Internet browser.
2. Click on the Support tab.
3. Click on FAQs and follow the on-screen instructions. You will be given
a list of questions pertaining to your subject.
The EXFO Web site also provides the product’s most recent technical
specifications.
Chromatic Dispersion Analyzer 79
Page 86

Troubleshooting
Ver.
Mfg.
date
P/N
S/N
Made in Canada QST442B
465 Godin Avenue
Vanier (Quebec) G1M 3G7 CANADA
**************** A
January 2020
542392-3D
FTB-5800-XX
Connector code
Contacting the Technical Support Group
Contacting the Technical Support Group
To obtain after-sales service or technical support for this product, contact
EXFO at one of the following numbers. The Technical Support Group is
available to take your calls from Monday to Friday, 7:30 a.m. to 8:00 p.m.
(Eastern Time in North America).
Technical Support Group
400 Godin Avenue
Quebec (Quebec) G1M 2K2
CANADA
To accelerate the process, please have information such as the name and
the serial number (see the product identification label—an example is
shown below), as well as a description of your problem, close at hand.
1 866 683-0155 (USA and Canada)
Tel.: 1 418 683-5498
Fax: 1 418 683-9224
support@exfo.com
80 FTB-5800
Page 87

Troubleshooting
Transportation
Transportation
Maintain a temperature range within specifications when transporting the
unit. Transportation damage can occur from improper handling. The
following steps are recommended to minimize the possibility of damage:
³ Pack the unit in its original packing material when shipping.
³ Avoid high humidity or large temperature fluctuations.
³ Keep the unit out of direct sunlight.
³ Avoid unnecessary shocks and vibrations.
Chromatic Dispersion Analyzer 81
Page 88

Page 89

9 Warranty
General Information
EXFO Electro-Optical Engineering Inc. (EXFO) warrants this equipment
against defects in material and workmanship for a period of one year from
the date of original shipment. EXFO also warrants that this equipment will
meet applicable specifications under normal use.
During the warranty period, EXFO will, at its discretion, repair, replace,
or issue credit for any defective product, as well as verify and adjust the
product free of charge should the equipment need to be repaired or if the
original calibration is erroneous. If the equipment is sent back for
verification of calibration during the warranty period and found to meet all
published specifications, EXFO will charge standard calibration fees.
The warranty can become null and void if:
³ unit has been tampered with, repaired, or worked upon by
unauthorized individuals or non-EXFO personnel.
³ warranty sticker has been removed.
IMPORTANT
³ case screws, other than those specified in this guide, have been
removed.
³ case has been opened, other than as explained in this guide.
³ unit serial number has been altered, erased, or removed.
³ unit has been misused, neglected, or damaged by accident.
THIS WARRANTY IS IN LIEU OF ALL OTHER WARRANTIES EXPRESSED,
IMPLIED, OR STATUTORY, INCLUDING, BUT NOT LIMITED TO, THE
IMPLIED WARRANTIES OF MERCHANTABILITY AND FITNESS FOR A
PARTICULAR PURPOSE. IN NO EVENT SHALL EXFO BE LIABLE FOR
SPECIAL, INCIDENTAL, OR CONSEQUENTIAL DAMAGES.
Chromatic Dispersion Analyzer 83
Page 90

Warranty
Liability
Liability
EXFO shall not be liable for damages resulting from the use of the product,
nor shall be responsible for any failure in the performance of other items to
which the product is connected or the operation of any system of which
the product may be a part.
EXFO shall not be liable for damages resulting from improper usage or
unauthorized modification of the product, its accompanying accessories
and software.
Exclusions
EXFO reserves the right to make changes in the design or construction of
any of its products at any time without incurring obligation to make any
changes whatsoever on units purchased. Accessories, including but not
limited to fuses, pilot lamps, batteries and universal interfaces (EUI) used
with EXFO products are not covered by this warranty.
This warranty excludes failure resulting from: improper use or installation,
normal wear and tear, accident, abuse, neglect, fire, water, lightning or
other acts of nature, causes external to the product or other factors beyond
EXFO’s control.
IMPORTANT
EXFO will charge a fee for replacing optical connectors that were
damaged due to misuse or bad cleaning.
Certification
EXFO certifies that this equipment met its published specifications at the
time of shipment from the factory.
84 FTB-5800
Page 91

Warranty
Service and Repairs
Service and Repairs
EXFO commits to providing product service and repair for five years
following the date of purchase.
To send any equipment for service or repair:
1. Call one of EXFO’s authorized service centers (see EXFO Service
Centers Worldwide on page 86). Support personnel will determine if
the equipment requires service, repair, or calibration.
2. If equipment must be returned to EXFO or an authorized service
center, support personnel will issue a Return Merchandise
Authorization (RMA) number and provide an address for return.
3. If possible, back up your data before sending the unit for repair.
4. Pack the equipment in its original shipping material. Be sure to include
a statement or report fully detailing the defect and the conditions under
which it was observed.
5. Return the equipment, prepaid, to the address given to you by support
personnel. Be sure to write the RMA number on the shipping slip. EXFO
will refuse and return any package that does not bear an RMA number.
Note: A test setup fee will apply to any returned unit that, after test, is found to
meet the applicable specifications.
After repair, the equipment will be returned with a repair report. If the
equipment is not under warranty, you will be invoiced for the cost
appearing on this report. EXFO will pay return-to-customer shipping costs
for equipment under warranty. Shipping insurance is at your expense.
Routine recalibration is not included in any of the warranty plans. Since
calibrations/verifications are not covered by the basic or extended
warranties, you may elect to purchase FlexCare Calibration/Verification
Packages for a definite period of time. Contact an authorized service center
(see EXFO Service Centers Worldwide on page 86).
Chromatic Dispersion Analyzer 85
Page 92

Warranty
EXFO Service Centers Worldwide
EXFO Service Centers Worldwide
If your product requires servicing, contact your nearest authorized service
center.
EXFO Headquarters Service Center
400 Godin Avenue
Quebec (Quebec) G1M 2K2
CANADA
EXFO Europe Service Center
Omega Enterprise Park, Electron Way
Chandlers Ford, Hampshire S053 4SE
ENGLAND
EXFO China Service Center/
Beijing OSIC
Beijing New Century Hotel
Office Tower, Room 1754-1755
No. 6 Southern Capital Gym Road
Beijing 100044
P. R . C H I N A
1 866 683-0155 (USA and Canada)
Tel.: 1 418 683-5498
Fax: 1 418 683-9224
quebec.service@exfo.com
Tel.: +44 2380 246810
Fax: +44 2380 246801
europe.service@exfo.com
Tel.: +86 (10) 6849 2738
Fax: +86 (10) 6849 2662
beijing.service@exfo.com
86 FTB-5800
Page 93

A Technical Specifications
SPECIFICATIONS
a
Model FTB-5800
Wavelength range (nm) 1530 to 1625
1200 to 1700
b
Wavelength step (nm) Minimum 0.1
Measurement points Maximum 950, user-definable
Dynamic rangec(dB) 42
Wavelength uncertaintyd(accuracy) (nm) 0.1
Dispersion uncertainty
d
(accuracy) (ps/nm) 20 km of G.652 1.6
120 km of G.652 3.1
20 km of G.655 1.9 (guaranteed)
20 km 80 km 120 km
Dispersion repeatabilityd(ps/nm) 0.04 0.2 1.1
Zero-dispersion wavelength λ0repeatabilityd(nm) 0.1 0.14 0.8
Dispersion slope repeatability λ
0
d
(%) 0.03 0.05 0.25
Minimum fiber length (km) < 1
Maximum fiber length (km)
e
> 5400
Measurement time per pointe(s) Minimum < 1
NOTES
a. All specifications are typical with 4 seconds averaging time per point (where applicable),
at a temperature of 23 ºC ± 1 ºC, with FC connectors and after warmup time.
b. Displayed range. Values may be extrapolated.
c. Dynamic range is defined as the difference between the strongest signal and the
weakest signal the receiver can detect. Extra averaging may be required.
Uncertainty (accuracy) is not guaranteed at limits of range.
d. C+L band.
e. Including EDFAs.
f. Additional gain setting time may be required prior to the first point of each band.
GENERAL SPECIF ICATION S
Size (H x W x D) (module) 9.6 cm x 10 cm x 26 cm (3 3/4 in x 3 15/16 in x 10 1/4 in)
Weight (module) 2 kg (4.5 lb)
IMPORTANT
The following technical specifications can change without notice.
The information presented in this section is provided as a reference
only. To obtain this product’s most recent technical specifications,
visit the EXFO Web site at www.exfo.com.
Chromatic Dispersion Analyzer 87
Page 94

Page 95

B Measuring Chromatic
Dispersion: Theory
EXFO’s Chromatic Dispersion Analyzer applies the phase-shift method,
which consists of measuring the phase variation of a sinusoidal intensity
modulated signal at a specific wavelength to obtain the relative group
delay of a fiber. The derivative of the relative group delay calculated from
fitted equations on computed results gives the dispersion, the
zero-dispersion wavelength and the dispersion slope.
Method Behind the Chromatic Dispersion Analyzer
In EXFO’s Chromatic Dispersion Analyzer, the light source is a broadband
source, which is intensity modulated at a high frequency. This light is
injected into the fiber under test and the modulated light travels along the
fiber. The high-frequency intensity modulation propagates at a speed that
depends on wavelength and polarization. Values are obtained for the
differences in travel time between modulation at different wavelengths.
The higher the number of wavelengths at which this is done, the more
accurate the chromatic dispersion results will be.
The first fixed filter in the receiver extracts the portion of the light that will
follow an optical path. A second filter, which is a time-tunable filter, will
extract a second part of the original signal and then follow a different
optical path.
Different path combinations are added using a chopper. The amplitude of
the high-frequency signals are measured and digitized. The phase
difference is then computed using the different amplitudes. This value is
stored along with the tunable filters position and a new measurement
cycle begins. A new time delay is computed and stored with wavelength
data. When sufficient data is accumulated, chromatic dispersion can be
computed.
Chromatic Dispersion Analyzer 89
Page 96

Measuring Chromatic Dispersion: Theory
1200 nm λ 1600 nm≤≤
τλ() ABλ2Cλ
2–
++=
D λ() 2Bλ Cλ
3–
–()=
τλ() ABλ2Cλ++=
D λ() 2Bλ C+=
D λ()
D1560()D 1530()–
30
-------------------------------------------------
°
λ 1560–()⋅
⎩⎭
⎨⎬
⎧⎫
D 1560()+=
D λ()
D1565()D 1530()–
35
-------------------------------------------------
°
λ 1565–()⋅
⎩⎭
⎨⎬
⎧⎫
D1565()+=
D λ()
D 1625()D 1565()–
60
-------------------------------------------------
°
λ 1625–()⋅
⎩⎭
⎨⎬
⎧⎫
D 1625()+=
1200 nm λ 1600 nm≤≤
τλ() ABλ Cλλ()ln++=
D λ() BCC λ()ln++=
Using Data Fits to Obtain Dispersion
Using Data Fits to Obtain Dispersion
This section gives you details about the way EXFO uses the data fits to
obtain dispersion. Once group delays are computed, equations are fitted in
order to obtain dispersion, dispersion slope and zero-dispersion
wavelengths. The dispersion curve of typical singlemode fibers follows
certain equations used to interpolate zero-dispersion wavelength and
slope. The following table graph shows the equations applied to
singlemode fibers in specific wavelength ranges.
Fiber Type
and Wavelength Range
Standard SM
Dispersion-shifted
1500 nm-1600 nm
Non-zero dispersion-shifted
up to 1560 nm
Non-zero dispersion-shifted
1530 nm-1565 nm (C Band)
1565 nm-1625 nm (L Band)
Dispersion-shifted
Expression for D
90 FTB-5800
Page 97

Measuring Chromatic Dispersion: Theory
50nm λ 1450nm≤≤
τλ() ABλ2Cλ
2–
++=
D λ() 2Bλ Cλ
3–
–()=
750nm λ 1450 n m≤≤
τλ() ABλ2Cλ
2–
++=
D λ() 2Bλ Cλ
3–
–()=
D λ()
D 1565()D1530()–
35
-------------------------------------------------
°
λ 1565–()⋅
⎩⎭
⎨⎬
⎧⎫
D 1565()+=
Using Data Fits to Obtain Dispersion
Fiber Type
and Wavelength Range
50/125
62.5/125
Non-zero dispersion-shifted
1530 nm-1565 nm
As the previous table demonstrates, specific fits are recommended for
specific types of fiber and specific wavelength ranges. Fits should be used
carefully when extrapolating parameters to obtain maximum precision.
³ The 3-Term Sellmeier applies mostly to standard fibers with single zero
dispersion at 1300 nm.
³ The 5-Term Sellmeier has five zero crossings. Since it is extremely
elastic, it should be used with caution when extrapolating because the
fit may curve away from the true results beyond fitted points.
Expression for D
³ The same warning applies to the cubic fit.
³ The lambda-log-lambda fit is applicable to dispersion-shifted fibers
with a zero dispersion wavelength in the 1550 nm wavelength region.
³ The linear fit is useful when there are too few measurements for
multiple parameter fits to be used. It is applicable to all fibers if the
range is sufficiently small.
The fits will give you a tool to obtain the dispersion slope and zerodispersion point.
Chromatic Dispersion Analyzer 91
Page 98

Measuring Chromatic Dispersion: Theory
Helping You Manage Chromatic Dispersion
Helping You Manage Chromatic Dispersion
The zero-dispersion wavelength (where dispersion is at zero) corresponds
to the wavelength point at which the fiber under test reaches its maximum
bandwidth. The slope from this zero-dispersion point indicates how fast
dispersion rises as wavelength increases. Key chromatic dispersion
parameters are the dispersion zero and the slope at zero dispersion.
Getting precise chromatic dispersion parameters helps you choose the
right dispersion-compensated fiber or material in order to reverse the
dispersion and dispersion slope before the data is interpreted by the
receiver at the other end of the line.
The effects of chromatic dispersion decrease with a reduction in the
absolute value of the fiber chromatic dispersion or with dispersion
compensation.
92 FTB-5800
Page 99

Index
Index
A
accessing File Export ................................... 65
accuracy, results.......................................... 28
acquiring multiple traces............................. 35
acquisition, stopping................................... 37
after-sales service ........................................ 80
application
exiting ................................................... 12
File Export.............................................. 65
starting, single-module.......................... 10
applying fits, precautions for ...................... 44
ASCII files, generating ................................. 65
automatic names for fibers ......................... 20
averaging time
definition............................................... 16
strong signal.......................................... 16
using preprogrammed times ................. 16
weak signal............................................ 16
B
bands
C............................................................ 13
C+L ....................................................... 13
L ............................................................ 13
referencing ............................................ 28
Busy, module status .................................... 12
C
calibration
certificate............................................... 75
interval .................................................. 75
caution
of personal hazard................................... 4
of product hazard.................................... 4
CD analyzer, internal design of.................... 89
certification information ................................v
choosing the right wavelength step ............ 15
chromatic dispersion
definition ................................................. 3
factors.................................................... 92
managing .............................................. 92
measuring.............................................. 37
reference................................................ 28
taking a reference .................................. 31
cleaning
detector ports ........................................ 74
EUI connectors....................................... 72
fiber ends............................................... 24
front panel............................................. 71
clipboard, exporting results to..................... 61
connectors, cleaning.................................... 72
conventions, safety........................................ 4
converting files ............................................ 65
copying results to clipboard ........................61
creating a file .............................................. 34
csv files........................................................ 65
customer service.......................................... 85
D
defining fiber name..................................... 20
detecting module .......................................... 7
detector port, cleaning ................................ 74
dispersion curve........................................... 43
distance units, modifying ............................ 19
documenting results.................................... 59
DUT, naming ...............................................20
E
entering fiber length ................................... 19
equipment returns....................................... 85
establishing thresholds................................ 56
EUI
baseplate ...............................................23
connector adapter ................................. 23
dust cap................................................. 23
Chromatic Dispersion Analyzer 93
Page 100

Index
EUI connectors, cleaning ............................. 72
EXFO service centers.................................... 86
EXFO universal interface. see EUI
EXFO Web site............................................. 79
exiting application................................. 12, 65
exporting
chromatic dispersion files ...................... 65
results.................................................... 61
F
FAQs............................................................ 79
fiber ends, cleaning..................................... 24
fiber length known/unknown...................... 17
fiber name format, defining........................ 20
fiber type fit
default................................................... 19
for link of more than one type............... 18
for unknown fiber type link ................... 18
File Export, accessing/quitting ..................... 65
files
creating ................................................. 34
exporting ............................................... 65
format of ............................................... 65
fits
3-Term Sellmeier.................................... 91
5-Term Sellmeier.................................... 91
cubic...................................................... 91
equations............................................... 90
lambda log lambda ............................... 91
linear ..................................................... 91
format, file .................................................. 65
front panel, cleaning................................... 71
H
help. see online user guide
I
identification label ...................................... 80
identification, slot ....................................... 11
inserting a module ........................................ 5
intensity meter ............................................27
intensity of the source................................. 27
interval between acquisitions ...................... 35
L
label, identification...................................... 80
M
main window ..............................................11
maintenance
detector ports ........................................ 74
EUI connectors....................................... 72
front panel............................................. 71
general information ............................... 71
marker
positioning............................................. 48
utility ............................................... 44, 48
measurement, reference.............................. 28
module
detection ................................................. 7
insertion................................................... 5
removal.................................................... 5
status..................................................... 12
module position .......................................... 11
mounting EUI connector adapter ................ 23
multiple measurements ............................... 35
N
naming fibers .............................................. 20
notepad
filling additional information ................. 59
function ................................................. 59
O
online user guide......................................... 79
opening a saved file .................................... 42
94 FTB-5800
 Loading...