

Page 1
FTB-5600
Distributed PMD Analyzer for FTB-500
User Guide
Page 2

Copyright © 2009 EXFO Electro-Optical Engineering Inc. All rights reserved.
No part of this publication may be reproduced, stored in a retrieval system
or transmitted in any form, be it electronically, mechanically, or by any
other means such as photocopying, recording or otherwise, without the
prior written permission of EXFO Electro-Optical Engineering Inc. (EXFO).
Information provided by EXFO is believed to be accurate and reliable.
However, no responsibility is assumed by EXFO for its use nor for any
infringements of patents or other rights of third parties that may result from
its use. No license is granted by implication or otherwise under any patent
rights of EXFO.
EXFO’s Commerce And Government Entities (CAGE) code under the North
Atlantic Treaty Organization (NATO) is 0L8C3.
The information contained in this publication is subject to change without
notice.
Trademarks
EXFO’s trademarks have been identified as such. However, the presence
or absence of such identification does not affect the legal status of any
trademark.
Units of Measurement
Units of measurement in this publication conform to SI standards and
practices.
Version number 2.0.0
ii FTB-5600
Page 3

Contents
Contents
Certification Information ........................................................................................................v
1 Introducing the FTB-5600 Distributed PMD Analyzer ................................ 1
Basic Distributed PMD Analyzer Operation .............................................................................2
Frequently Used Terms ............................................................................................................3
Conventions ............................................................................................................................5
2 Safety Information ....................................................................................... 7
3 Getting Started with your FTB-5600 ........................................................... 9
Inserting and Removing Test Modules ....................................................................................9
Starting the Distributed PMD Analyzer Application ..............................................................14
Exiting the Application .........................................................................................................16
4 Setting up and Operating your Distributed PMD Analyzer ..................... 17
Cleaning and Connecting Optical Fibers ...............................................................................18
Installing the EXFO Universal Interface (EUI) .........................................................................20
Setting up General Acquisition Parameters ...........................................................................21
Setting up the Graph Display ................................................................................................23
Setting up Storage Options ..................................................................................................25
Displaying PMD-Related Columns in the Main Window ........................................................29
Setting up Cable Information ...............................................................................................31
Performing an Acquisition ....................................................................................................33
Using the Bidirectional File Creator .......................................................................................47
5 Managing Results ....................................................................................... 55
Opening an Existing File .......................................................................................................57
Saving a File ..........................................................................................................................59
Using Zoom Controls ............................................................................................................62
Section Event Table ...............................................................................................................63
Section Status .......................................................................................................................65
Positioning Markers on the Display .......................................................................................69
Editing Sections ....................................................................................................................70
Using Markers to Measure PMD Differences (Delta PMD Tab) ...............................................81
Estimating Results ................................................................................................................83
Viewing Trace Information ....................................................................................................85
Generating Reports ...............................................................................................................93
Distributed PMD Analyzer iii
Page 4

Contents
6 Maintenance ................................................................................................95
Cleaning EUI Connectors ......................................................................................................96
Recalibrating the Unit ...........................................................................................................98
Recycling and Disposal (Applies to European Union Only) ....................................................99
7 Troubleshooting ........................................................................................101
Obtaining Online Help ........................................................................................................101
Contacting the Technical Support Group ............................................................................102
Transportation ....................................................................................................................103
8 Warranty ....................................................................................................105
General Information ...........................................................................................................105
Liability ...............................................................................................................................106
Exclusions ...........................................................................................................................107
Certification ........................................................................................................................107
Service and Repairs .............................................................................................................108
EXFO Service Centers Worldwide ........................................................................................109
A Technical Specifications ............................................................................111
B Distributed Cumulative PMD Measurement Theory ...............................113
C Acquisition Data .......................................................................................117
D Optimizing Measurements .......................................................................121
Basic Verification Steps .......................................................................................................121
Use a Larger Number of SOPs and Wavelengths .................................................................122
Perform Two-Sided Measurements .....................................................................................123
Perform Multiple Measurements .........................................................................................123
Select an Optimized PMD Scale for the Acquisition ............................................................124
Use an Appropriate Residual PMD for the Acquisition ........................................................125
Use an Optimized Number of Averagings ...........................................................................127
Use an Appropriate OTDR Pulse Length ..............................................................................128
Use an Appropriate Spatial Smoothing Filter Value ............................................................129
Use a Receive Fiber .............................................................................................................134
Index ...............................................................................................................135
iv FTB-5600
Page 5

Certification Information
Certification Information
F.C.C. Information
Electronic test equipment is exempt from Part 15 compliance (FCC) in
the United States. However, compliance verification tests are
systematically performed on most EXFO equipment.
Information
Electronic test equipment is subject to the EMC Directive in the European
Union. The EN61326 standard prescribes both emission and immunity
requirements for laboratory, measurement, and control equipment.
This unit has undergone extensive testing according to the European Union
Directive and Standards.
Distributed PMD Analyzer v
Page 6

Certification Information
Application of Council Directive(s): 2006/95/EC - The Low Voltage Directive
2004/108/EC - The EMC Directive
And their amendments
Manufacturer’s Name: EXFO Electro-Optical Engineering Inc.
Manufacturer’s Address: 400 Godin Avenue
Quebec, Quebec
Canada, G1M 2K2
(418) 683-0211
Equipment Type/Environment: Test & Measurement / Industrial
Trade Name/Model No.: FTB-5600
Distributed PMD Analyzer
Standard(s) to which Conformity is Declared:
EN 61010-1:2001 Safety Requirements for Electrical Equipment for Measurement,
Control, and Laboratory Use, Part 1: General Requirements.
EN 61326-1:2006 Electrical Equipment for Measurement, Control and Laboratory
Use - EMC Requirements – Part 1: General requirements
EN 60825-1:1994 +A2:2001
+A1:2002
Safety of laser products – Part 1: Equipment classification,
requirements, and user’s guide
EN 55022: 1998 +A2: 2003 Information technology equipment - Radio disturbance
characteristics - Limits and methods of measurement
I, the undersigned, hereby declare that the equipment specified above conforms to the above Directive and Standards.
Manufacturer
Signature:
Full Name: Stephen Bull, E. Eng
Position: Vice-President Research and
Development
Address: 400 Godin Avenue, Quebec (Quebec),
Canada, G1M 2K2
Date: January 09, 2009
DECLARATION OF CONFORMITY
vi FTB-5600
Page 7
1 Introducing the FTB-5600
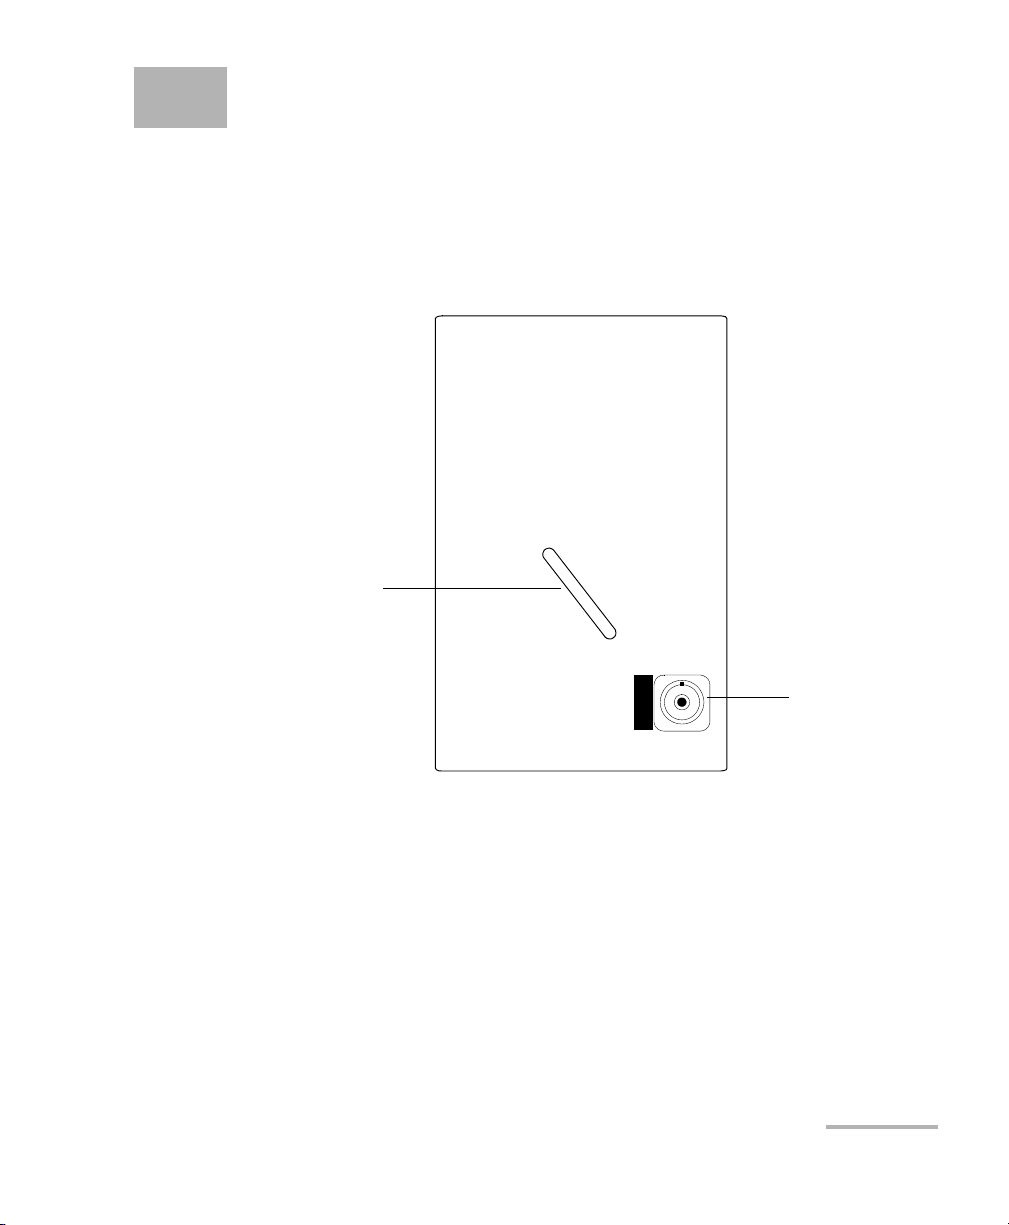
FTB-5600
DISTRIBUTED PMD ANALYZER
Handle
Detector port
Distributed PMD Analyzer
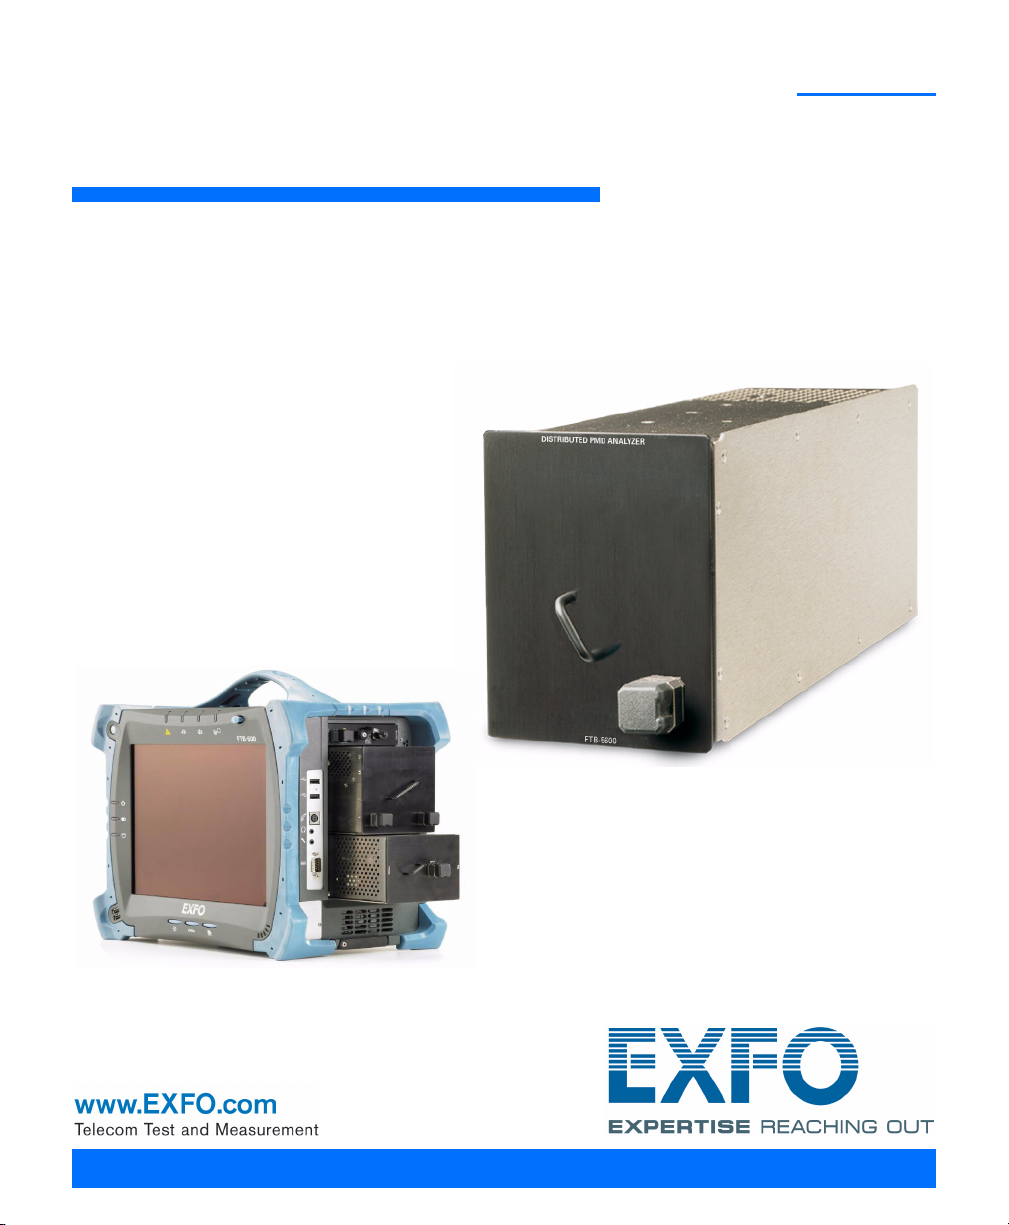
The FTB-5600 is composed of an OTDR, a tunable laser source and a
polarization scrambler. It characterizes PMD along a link. Its key feature is
to identify fiber sections with a strong PMD value, then enabling the
correction of the link by replacing faulty sections.
The results include:
³ A cumulative PMD curve and an OTDR trace
³ A PMD section table that provides the PMD for each section identified
by the instrument.
³ An estimation table that can be used to analyze the effect of removing
strong PMD sections of the link.
The result of the acquisition will be displayed as a graph, as well as several
Distributed PMD Analyzer 1
result tables to help you analyze the data better.
Page 8

Introducing the FTB-5600 Distributed PMD Analyzer
Basic Distributed PMD Analyzer Operation
Basic Distributed PMD Analyzer Operation
IMPORTANT
In order to use the FTB-5600 to its most optimised level, you must
have a solid knowledge on how OTDRs function.
You can make acquisitions according to three different modes:
³ Quick Check
³ Standard
³ Advanced
Each mode is explained in Setting up General Acquisition Parameters on
page 21.
The FTB-5600 does a series of actions in taking a measurement.
³ The instrument takes an OTDR trace and displays it. This step only
takes a few seconds. At this point, you should inspect the trace to see if
there are any problems.
³ Then, the instrument measures the SOPs. This will take more or less
time depending on the accuracy and sensitivity requested. The
remaining time and SOPs to measure are indicated in the status bar of
the application. After measuring about 10 SOPs, you will see a
temporary cumulative PMD curve.
³ Once all of the SOPs are acquired, the instrument computes the actual
PMD curve.
2 FTB-5600
Page 9

Introducing the FTB-5600 Distributed PMD Analyzer
Frequently Used Terms
Frequently Used Terms
Some specific terms are used frequently in this user guide.
Term Definition
APD Avalanche photo diode.
Beating length Length required in the fiber for the Fast Polarization to
be ahead by one complete period over the Slow
Polar iza tio n.
Bidirectional A combination of two traces taken from opposite
directions of a same fiber. The trace can overlap fully,
partly, or not at all.
Cumulative PMD The PMD value up to a distance in a fiber.
Depolarization Light that is not polarized. In the case of the FTB-5600,
we use this term to define zone on the fiber where the
instrument cannot perform a measurement since light
is entirely depolarised. For more information, see page
67.
DGD Differential group delay.
Estimation table Table used to estimate the PMD value of a link by
changing values of target strong PMD sections.
FUT Fiber under test
OTDR Optical time domain reflectometer.
PBS Polarization beam splitter
PMD Polarisation mode dispersion.
PMD coefficient Represents the PMD characteristics of one particular
length of the fiber. Since PMD adds to the square, its
unit is typically calculated in picoseconds per square
root of kilometer.
PMD resolution Sets the minimum PMD value to be measured on the
link.
Distributed PMD Analyzer 3
Page 10

Introducing the FTB-5600 Distributed PMD Analyzer
Frequently Used Terms
Term Definition
PMD scale Sets the best scale to measure a PMD of this value.
PMD section The PMD value of a fiber section
Pulse width Width of the OTDR pulse, in nanoseconds, used to
measure the link. A longer pulse allows you to probe
further along the fiber, but results in a lower resolution.
A shorter pulse width provides higher resolution , but a
smaller distance range.
RS-POTDR Random-scrambling tuneable polarization-sensitive
OTDR
Sensitivity Sets the electronic sensitivity.
SOP State of polarisation. Here, SOP has a broader sense: it
means a group of OTDR traces taken at different
frequencies, but with the same SOP. The SOP is the unit
that is used to compute the distributed PMD curve.
SOA Semiconductor optical amplifier
4 FTB-5600
Page 11

Introducing the FTB-5600 Distributed PMD Analyzer
Conventions
Conventions
Before using the product described in this manual, you should understand
the following conventions:
WARNING
Indicates a potentially hazardous situation which, if not avoided,
could result in death or serious injury. Do not proceed unless you
understand and meet the required conditions.
CAUTION
Indicates a potentially hazardous situation which, if not avoided,
may result in minor or moderate injury. Do not proceed unless you
understand and meet the required conditions.
CAUTION
Indicates a potentially hazardous situation which, if not avoided,
may result in component damage. Do not proceed unless you
understand and meet the required conditions.
IMPORTANT
Refers to information about this product you should not overlook.
Distributed PMD Analyzer 5
Page 12

Page 13
2 Safety Information
CLASS 1
LASER PRODUCT
WARNING
Do not install or terminate fibers while a light source is active.
Never look directly into a live fiber and ensure that your eyes are
protected at all times.
WARNING
Use of controls, adjustments and procedures for operation and
maintenance other than those specified herein may result in
hazardous radiation exposure or impair the protection provided by
this unit.
Your instrument is a Class 1 laser product in compliance with standards
IEC60825-1: 2001, 2007 and 21CFR1040.10. Laser radiation may be
encountered at the output port.
The following label indicates that a product contains a Class 1 source:
Note: Label shown for information purposes only. It is not affixed to your product.
Distributed PMD Analyzer 7
Page 14

Page 15
3 Getting Started with your
FTB-5600
Inserting and Removing Test Modules
CAUTION
Never insert or remove a module while the FTB-500 is turned on.
This will result in immediate and irreparable damage to both the
module and unit.
WARNING
When the laser safety LED ( ) is flashing on the FTB-500, at least
one of your modules is emitting an optical signal. Please check all
modules, as it might not be the one you are currently using.
To insert a module into the FTB-500:
1. Exit ToolBox and turn off your unit.
2. Position the FTB-500 so that its right panel is facing you.
Distributed PMD Analyzer 9
Page 16
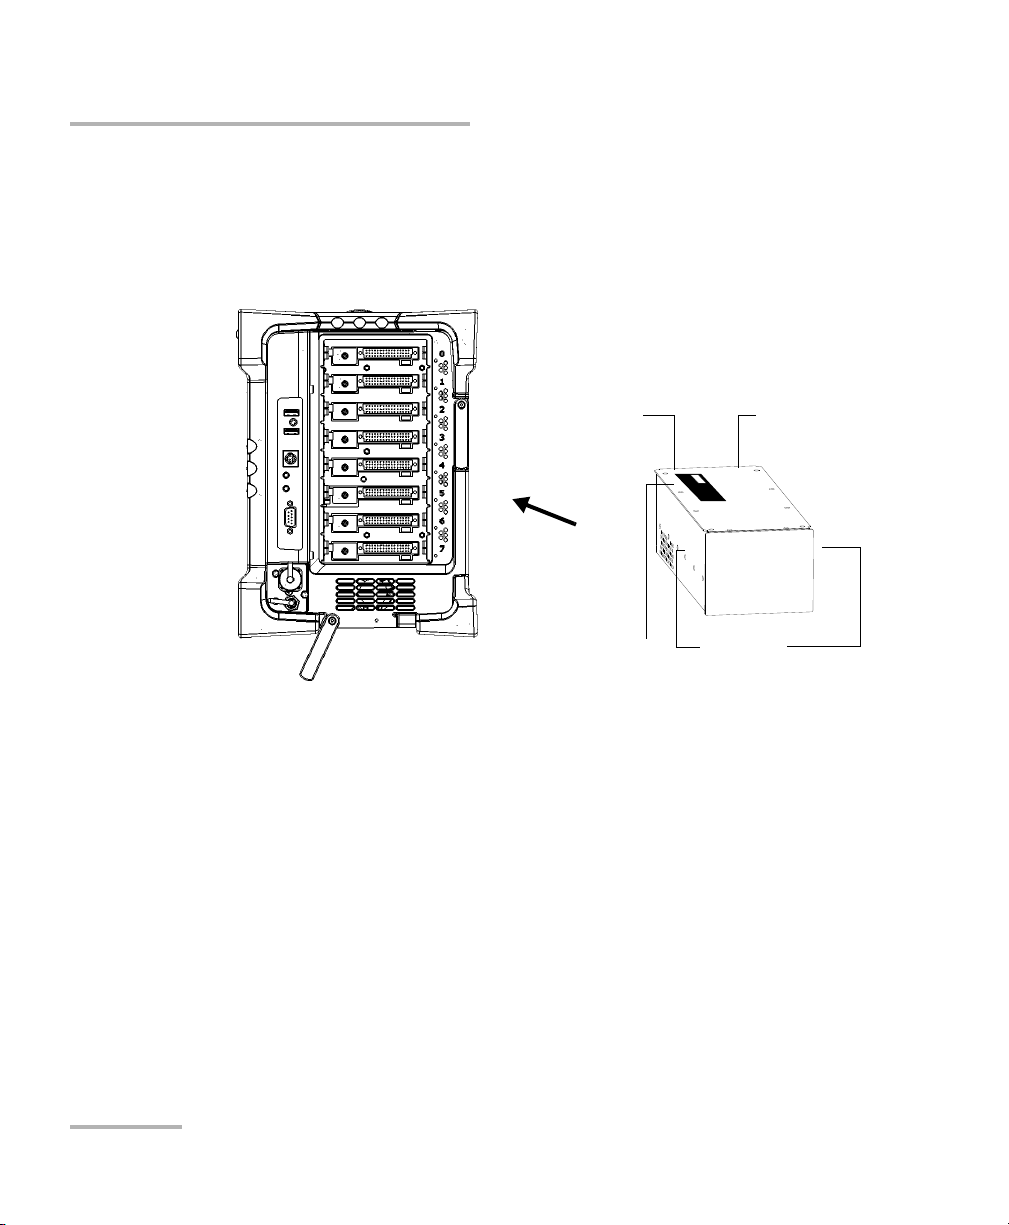
Getting Started with your FTB-5600
Protruding
edges on top
Identification sticker
facing up
Connector
pins at the
back
Retaining screw
hole at the
back
FTB-500 right panel
Inserting and Removing Test Modules
3. Take the module and place it so that the connector pins are at the
back, as explained and shown below.
Identification sticker must be facing up and connector pins at the right
of the retaining screw hole.
4. Insert the protruding edges of the module into the grooves of the
receptacle’s module slot.
5. Push the module all the way to the back of the slot, until the retaining
screw makes contact with the receptacle casing.
6. Place the FTB-500 so that its left panel is facing you.
10 FTB-5600
Page 17
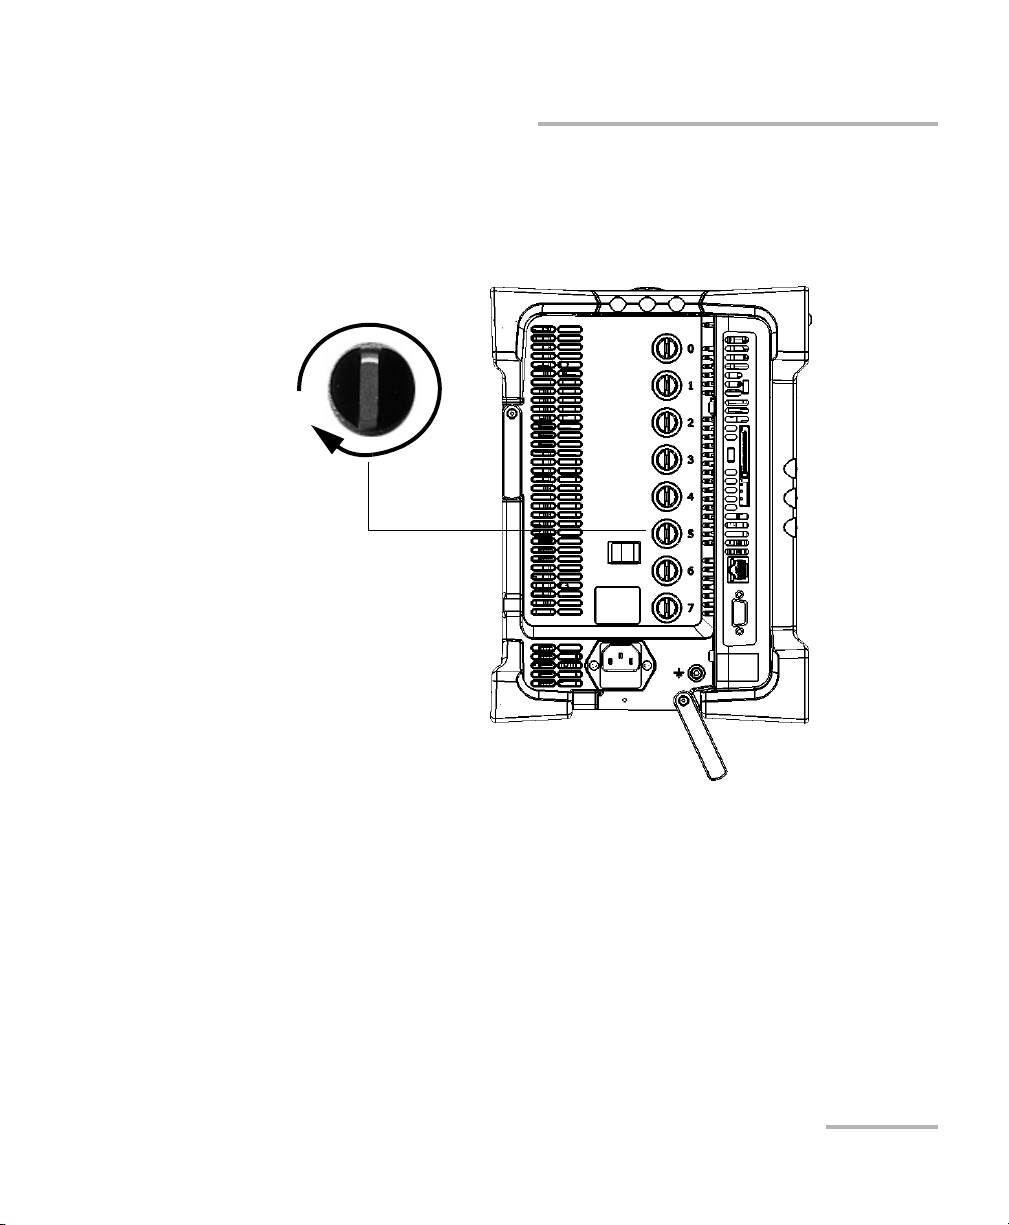
Getting Started with your FTB-5600
Turn retaining screw knob
clockwise
FTB-500 left panel
Inserting and Removing Test Modules
7. While applying slight pressure to the module, turn the retaining screw
clockwise until it is tightened.
This will secure the module into its “seated” position.
When you turn on the unit, the startup sequence will automatically detect
the module.
Distributed PMD Analyzer 11
Page 18
Getting Started with your FTB-5600
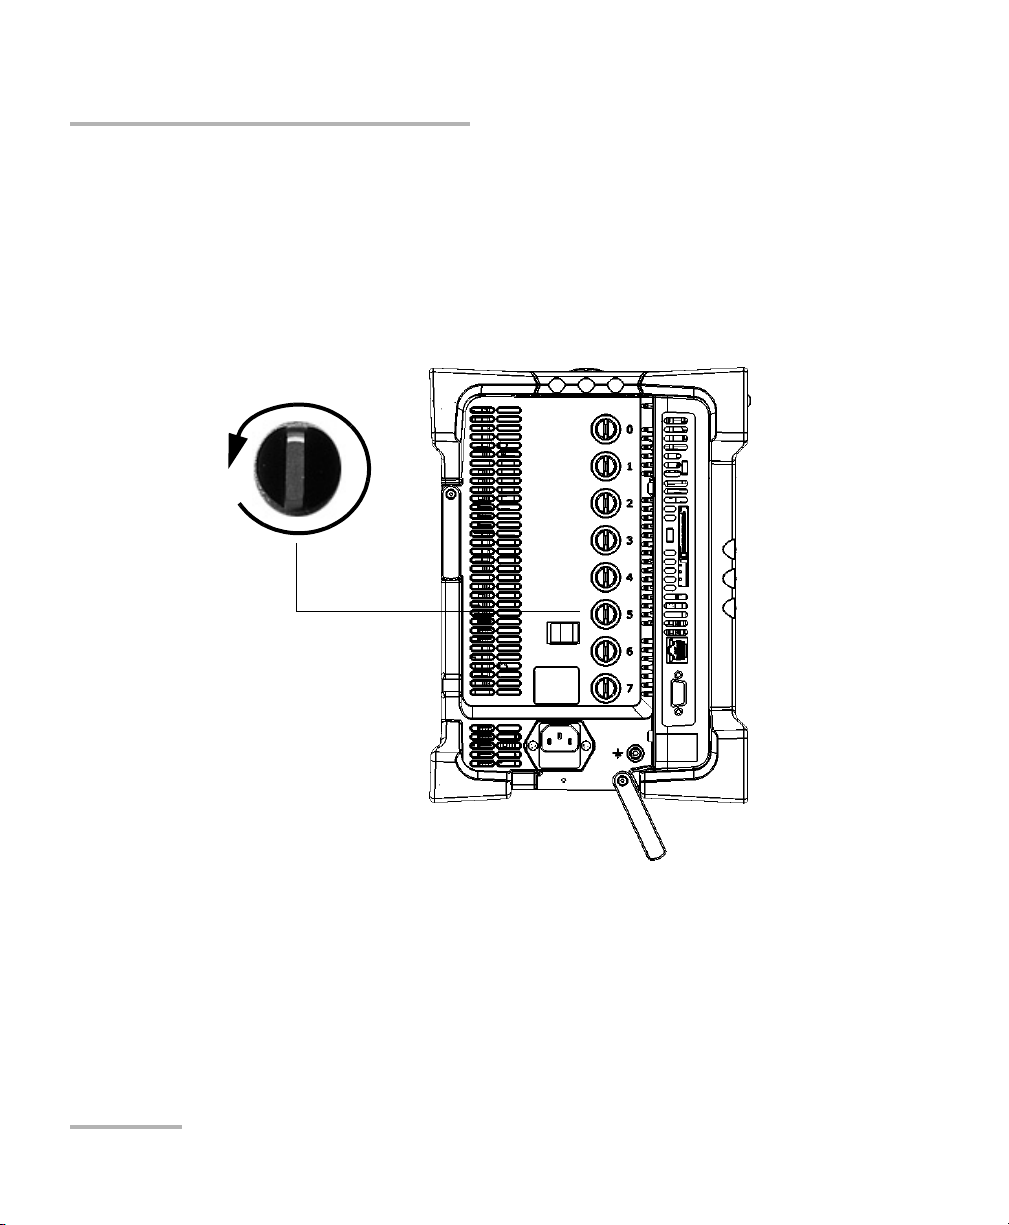
Turn retaining screw knob(s)
counterclockwise
FTB-500 left panel
Inserting and Removing Test Modules
To remove a module from the FTB-500:
1. Exit ToolBox and turn off your unit.
2. Position the FTB-500 so that the left panel is facing you.
3. Turn the retaining screw counterclockwise until it stops.
The module will be slowly released from the slot.
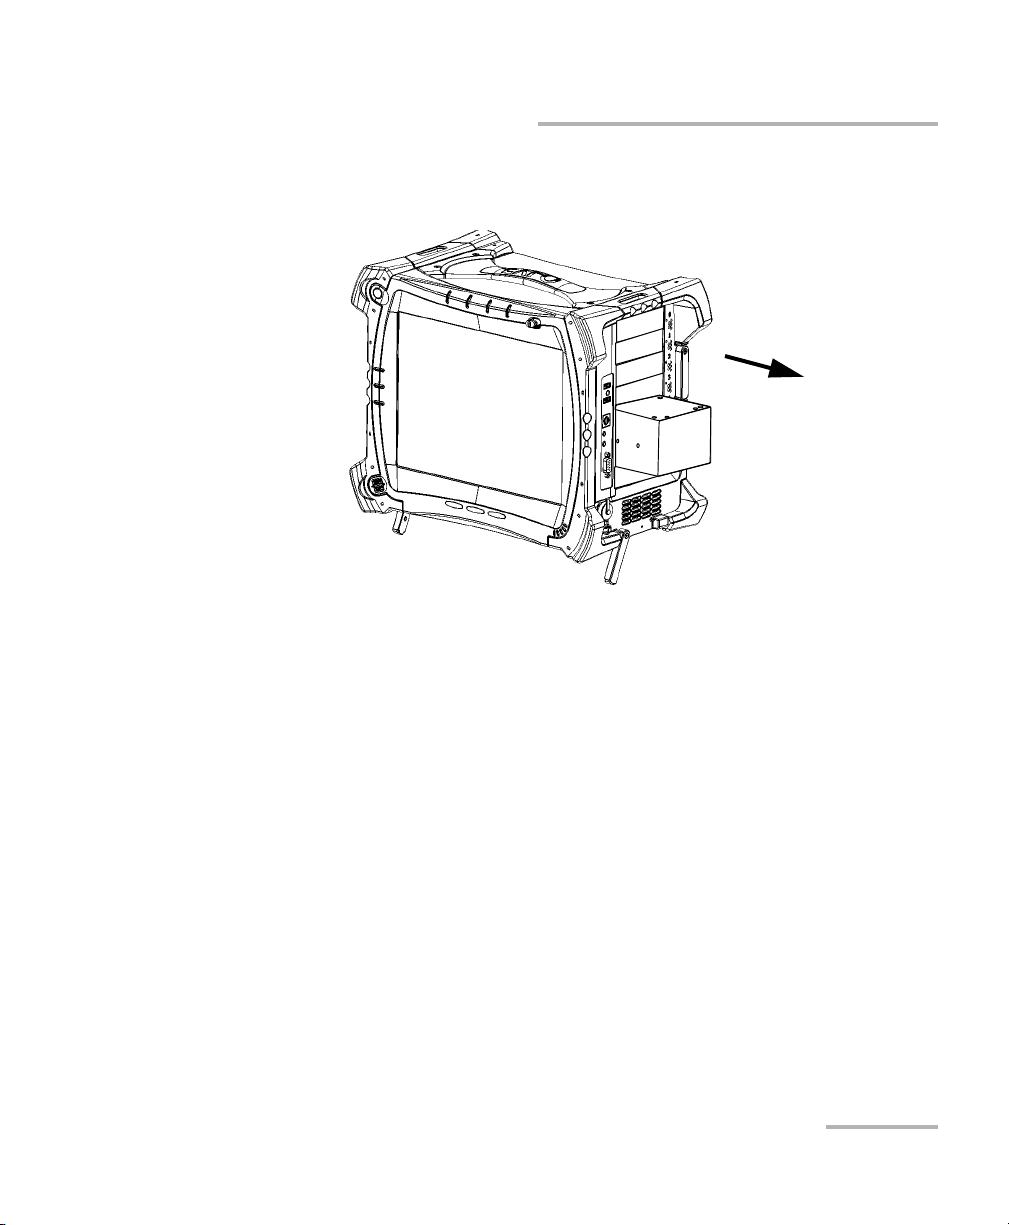
4. Place the FTB-500 so that the right panel is facing you.
12 FTB-5600
Page 19
Getting Started with your FTB-5600
Inserting and Removing Test Modules
5. Hold the module by its sides or by the handle (NOT by the connector)
and pull it out.
Distributed PMD Analyzer 13
Page 20
Getting Started with your FTB-5600
Starting the Distributed PMD Analyzer Application
Starting the Distributed PMD Analyzer
Application
Your FTB-5600 Distributed PMD Analyzer module can be configured and
controlled from its dedicated ToolBox application.
Note: For details about ToolBox, refer to the FTB-500 user guide.
To start the application:
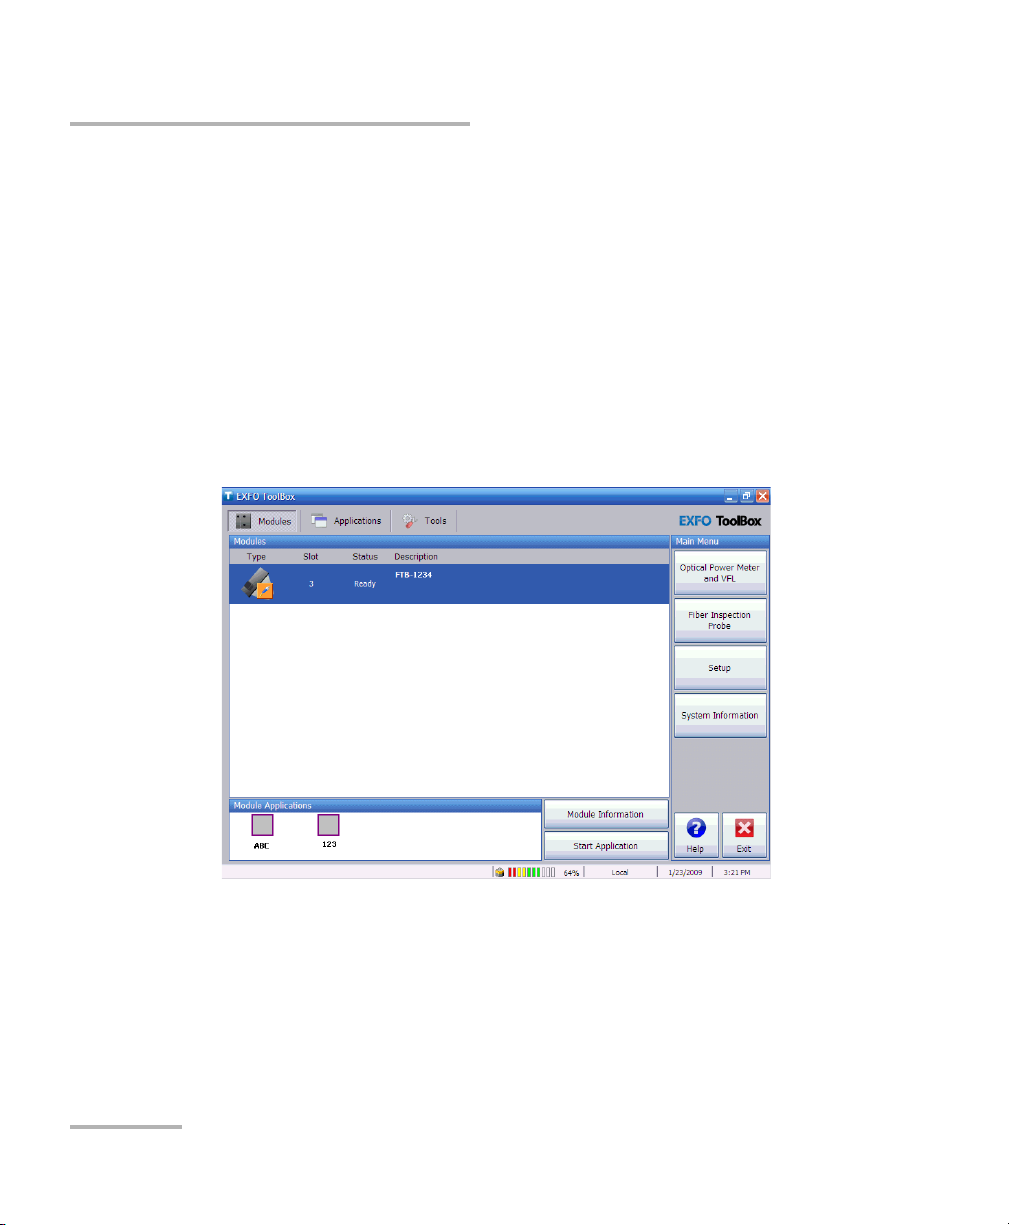
1. From the main window, select the module to use.
It will turn blue to indicate that it is highlighted.
2. Click the corresponding button in the Module Applications box.
14 FTB-5600
Page 21
Getting Started with your FTB-5600
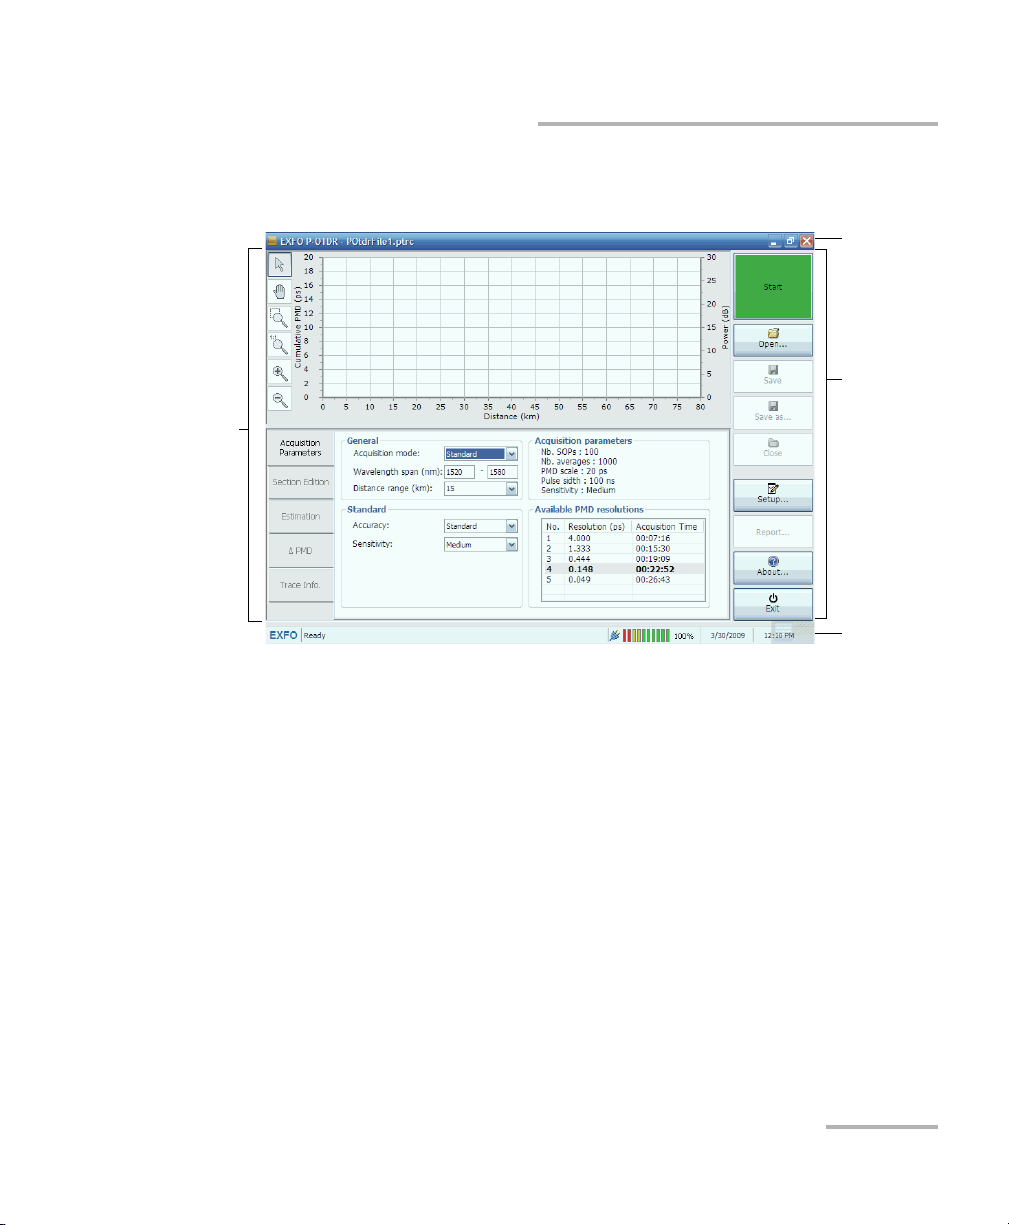
Data
display and
control
center
Title bar
Function
buttons
Status bar
Starting the Distributed PMD Analyzer Application
The main window (shown below) contains all the commands required to
control the Distributed PMD Analyzer:
Distributed PMD Analyzer 15
Page 22
Getting Started with your FTB-5600
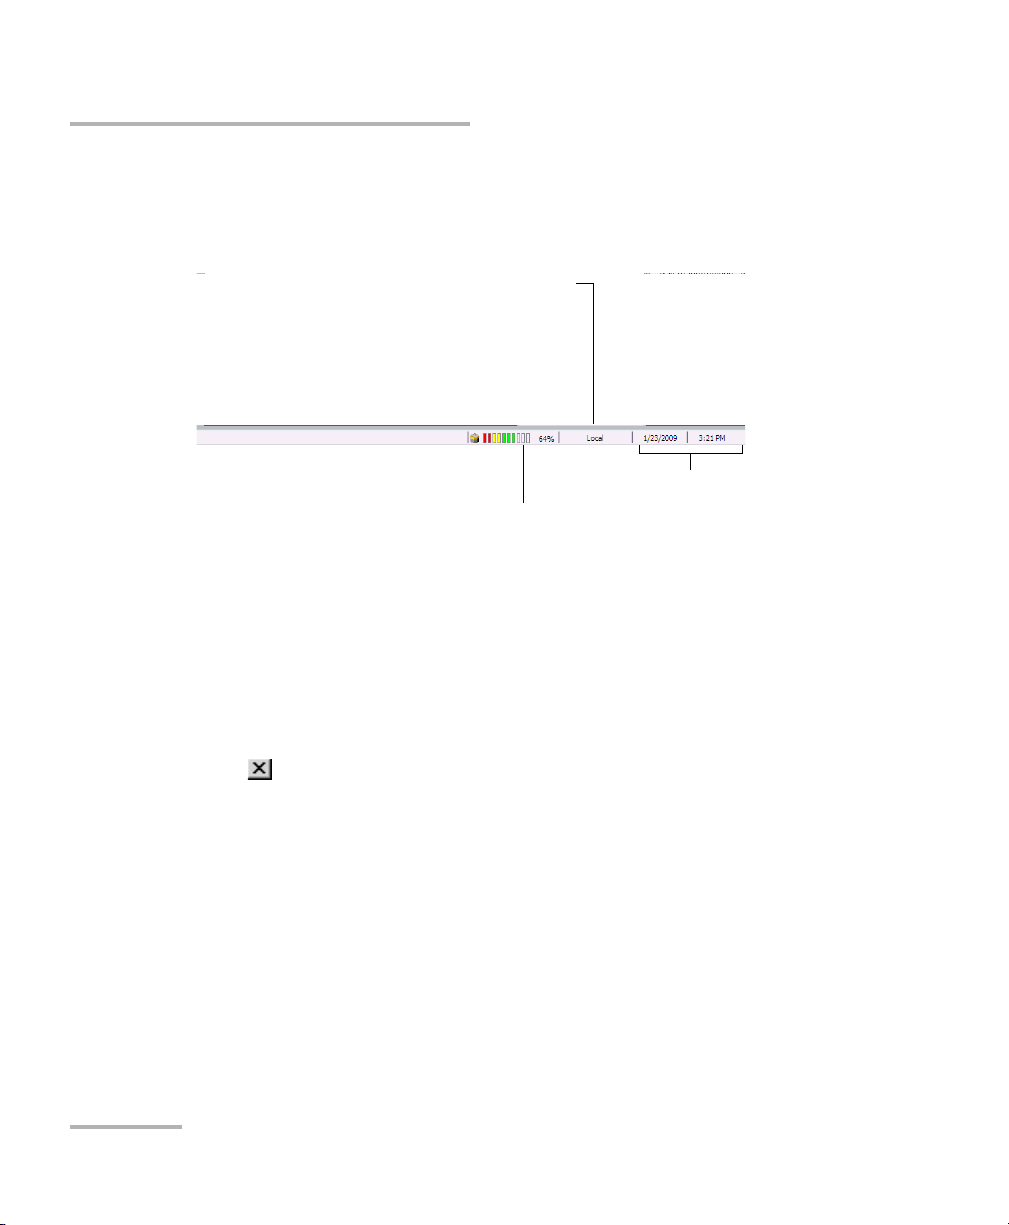
Current date and time
Local: Module controlled locally only.
Remote: Module controlled remotely, but local
commands can also be used (some products only).
Lockout: Module controlled remotely only.
Battery indicator
Control mode
Exiting the Application
Status Bar
The status bar, located at the bottom of the main window, identifies the
current operational status of the FTB-5600 Distributed PMD Analyzer.
Exiting the Application
Closing any application that is not currently being used helps freeing
system memory.
To close the application from the main window:
Click in the top right corner of the main window.
OR
Click the Exit button located at the bottom of the function bar.
16 FTB-5600
Page 23

4 Setting up and Operating your
Distributed PMD Analyzer
IMPORTANT
In order to use the FTB-5600 to its most optimised level, you must
have a solid knowledge on how OTDRs function. This includes:
³ Interpreting OTDR traces
³ Understanding the effect of the pulse on a trace
³ Understanding the contents of an event trace
³ Manipulating events on a trace
The instructions and theory in this user documentation take into
account that such notions are already known by you.
Distributed PMD Analyzer 17
Page 24

Setting up and Operating your Distributed PMD Analyzer
Cleaning and Connecting Optical Fibers
Cleaning and Connecting Optical Fibers
IMPORTANT
To ensure maximum power and to avoid erroneous readings:
³ Always inspect fiber ends and make sure that they are clean as
explained below before inserting them into the port. EXFO is
not responsible for damage or errors caused by bad fiber
cleaning or handling.
³ Ensure that your patchcord has appropriate connectors. Joining
mismatched connectors will damage the ferrules.
To connect the fiber-optic cable to the port:
1. Inspect the fiber using a fiber inspection microscope. If the fiber is
clean, proceed to connecting it to the port. If the fiber is dirty, clean it as
explained below.
2. Clean the fiber ends as follows:
2a. Gently wipe the fiber end with a lint-free swab dipped in isopropyl
alcohol.
2b. Use compressed air to dry completely.
2c. Visually inspect the fiber end to ensure its cleanliness.
18 FTB-5600
Page 25

Setting up and Operating your Distributed PMD Analyzer
Cleaning and Connecting Optical Fibers
3. Carefully align the connector and port to prevent the fiber end from
touching the outside of the port or rubbing against other surfaces.
If your connector features a key, ensure that it is fully fitted into the
port’s corresponding notch.
4. Push the connector in so that the fiber-optic cable is firmly in place,
thus ensuring adequate contact.
If your connector features a screwsleeve, tighten the connector
enough to firmly maintain the fiber in place. Do not overtighten, as this
will damage the fiber and the port.
Note: If your fiber-optic cable is not properly aligned and/or connected, you will
notice heavy loss and reflection.
Distributed PMD Analyzer 19
Page 26
Setting up and Operating your Distributed PMD Analyzer
Bare metal
(or blue border)
indicates UPC
option
Green border
indicates APC
option
2 3 4
Installing the EXFO Universal Interface (EUI)
Installing the EXFO Universal Interface (EUI)
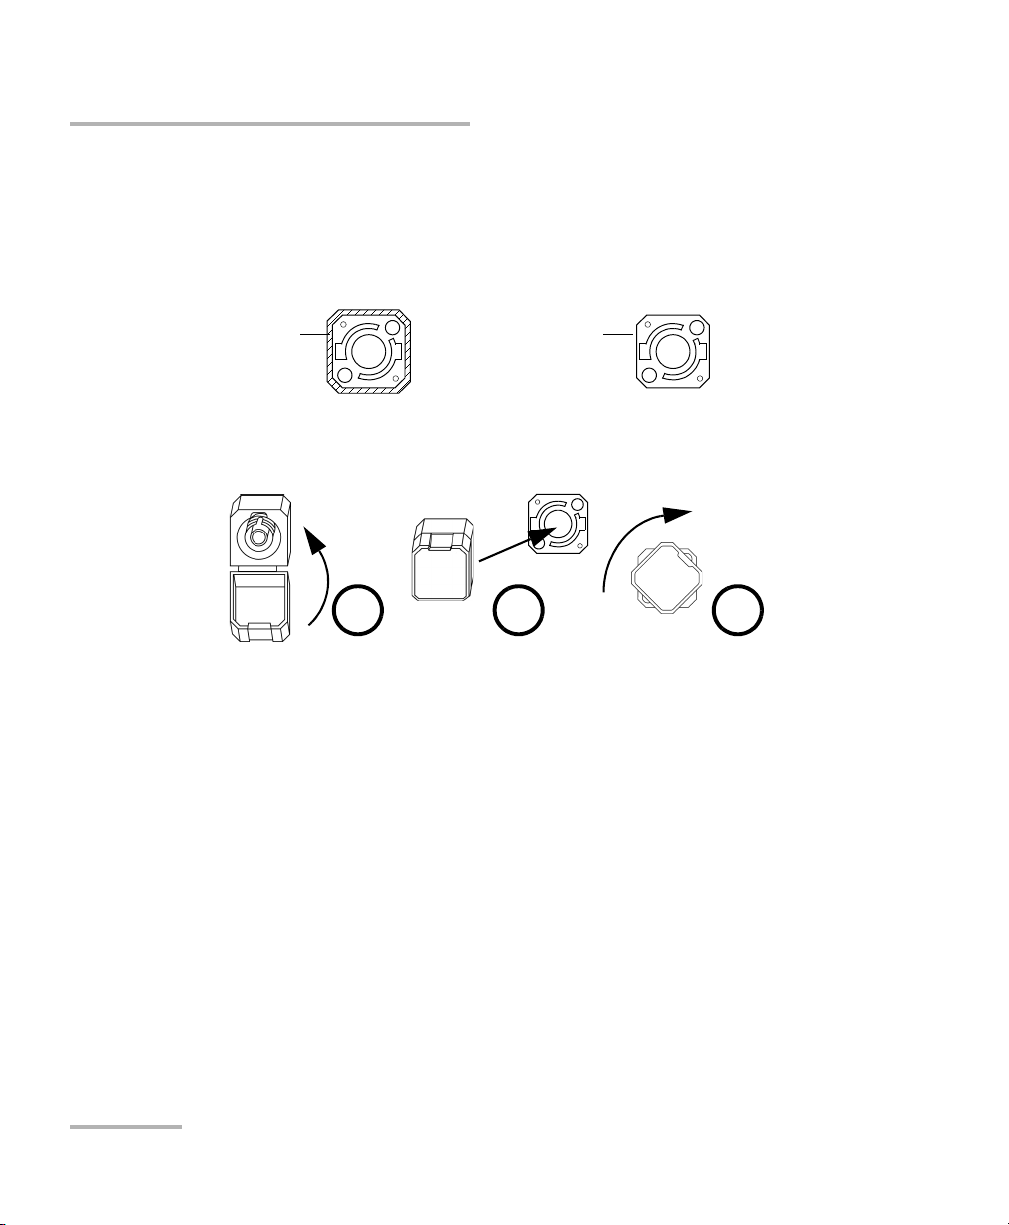
The EUI fixed baseplate is available for connectors with angled (APC) or
non-angled (UPC) polishing. A green border around the baseplate
indicates that it is for APC-type connectors.
To install an EUI connector adapter onto the EUI baseplate:
1. Hold the EUI connector adapter so the dust cap opens downwards.
2. Close the dust cap in order to hold the connector adapter more firmly.
3. Insert the connector adapter into the baseplate.
4. While pushing firmly, turn the connector adapter clockwise on the
baseplate to lock it in place.
20 FTB-5600
Page 27
Setting up and Operating your Distributed PMD Analyzer
Setting up General Acquisition Parameters
Setting up General Acquisition Parameters
The general acquisition parameters influence how the acquisition occurs.
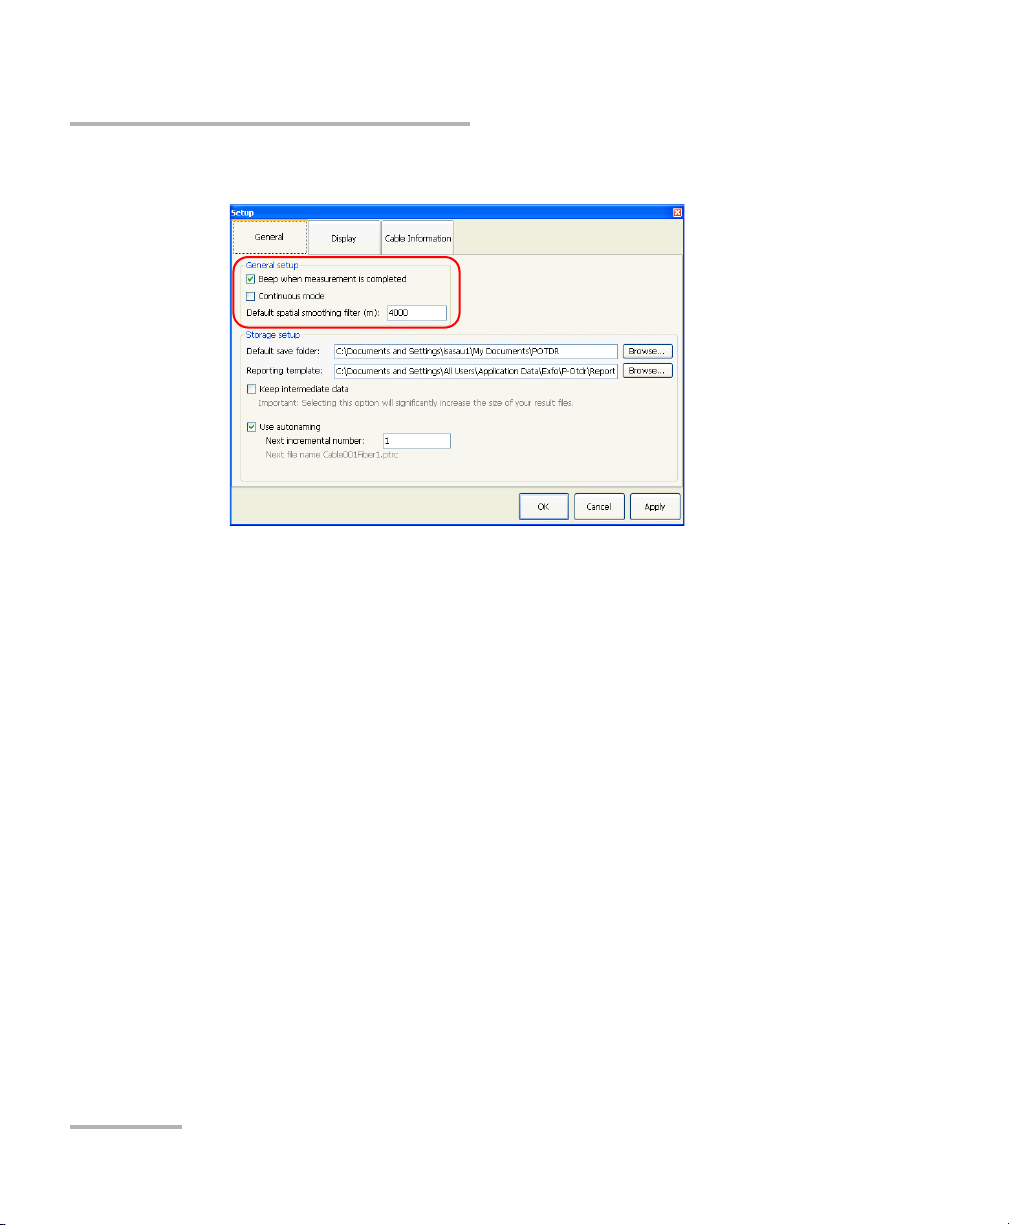
³ You can select whether the unit beeps after each measurement or not.
³ You can set the acquisition to be continuous, or requiring that you start
each measurement manually.
³ You can set the default spatial smoothing filter, in meters. The spatial
smoothing filter helps improving the measurement results in filtering
the cumulative PMD curve. The default value is 4000 m. Increase this
value if the PMD cumulative curve is appropriate, but wavy, for
example. Decrease this value if you are interested in seeing where the
PMD begins to increase. You can find more information on the spatial
smoothing filter in Use an Appropriate Spatial Smoothing Filter Value
on page 129.
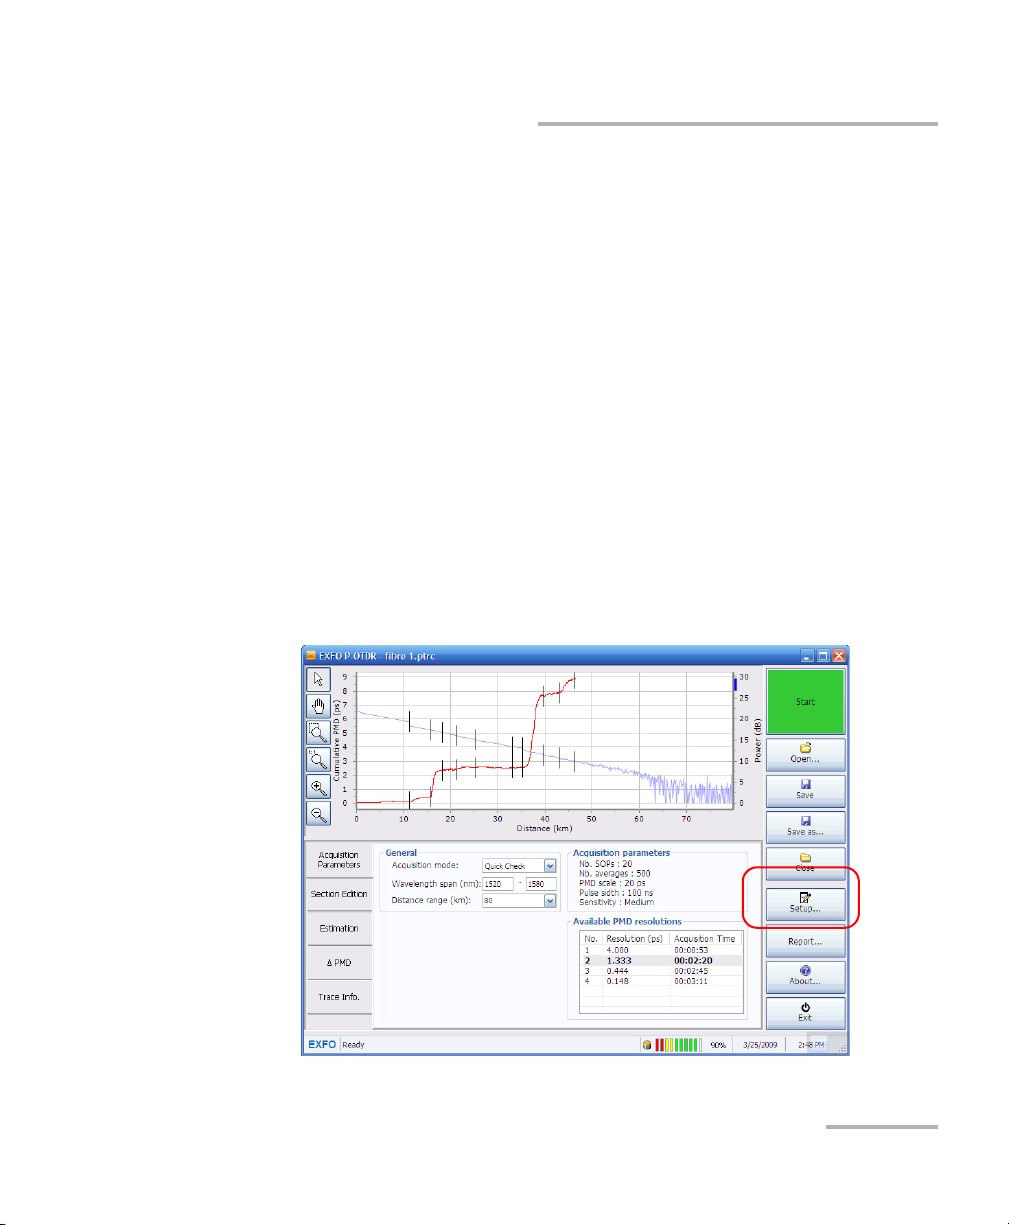
To change the general acquisition parameters:
1. From the main window, press Setup.
Distributed PMD Analyzer 21
Page 28
Setting up and Operating your Distributed PMD Analyzer
Setting up General Acquisition Parameters
2. Select the General tab.
3. Modify the parameters as desired under General setup.
4. Press Apply to use the new settings, or OK to use the new settings and
close the window.
22 FTB-5600
Page 29
Setting up and Operating your Distributed PMD Analyzer
Setting up the Graph Display
Setting up the Graph Display
The graph display parameters will help you improve how result graphs are
displayed.
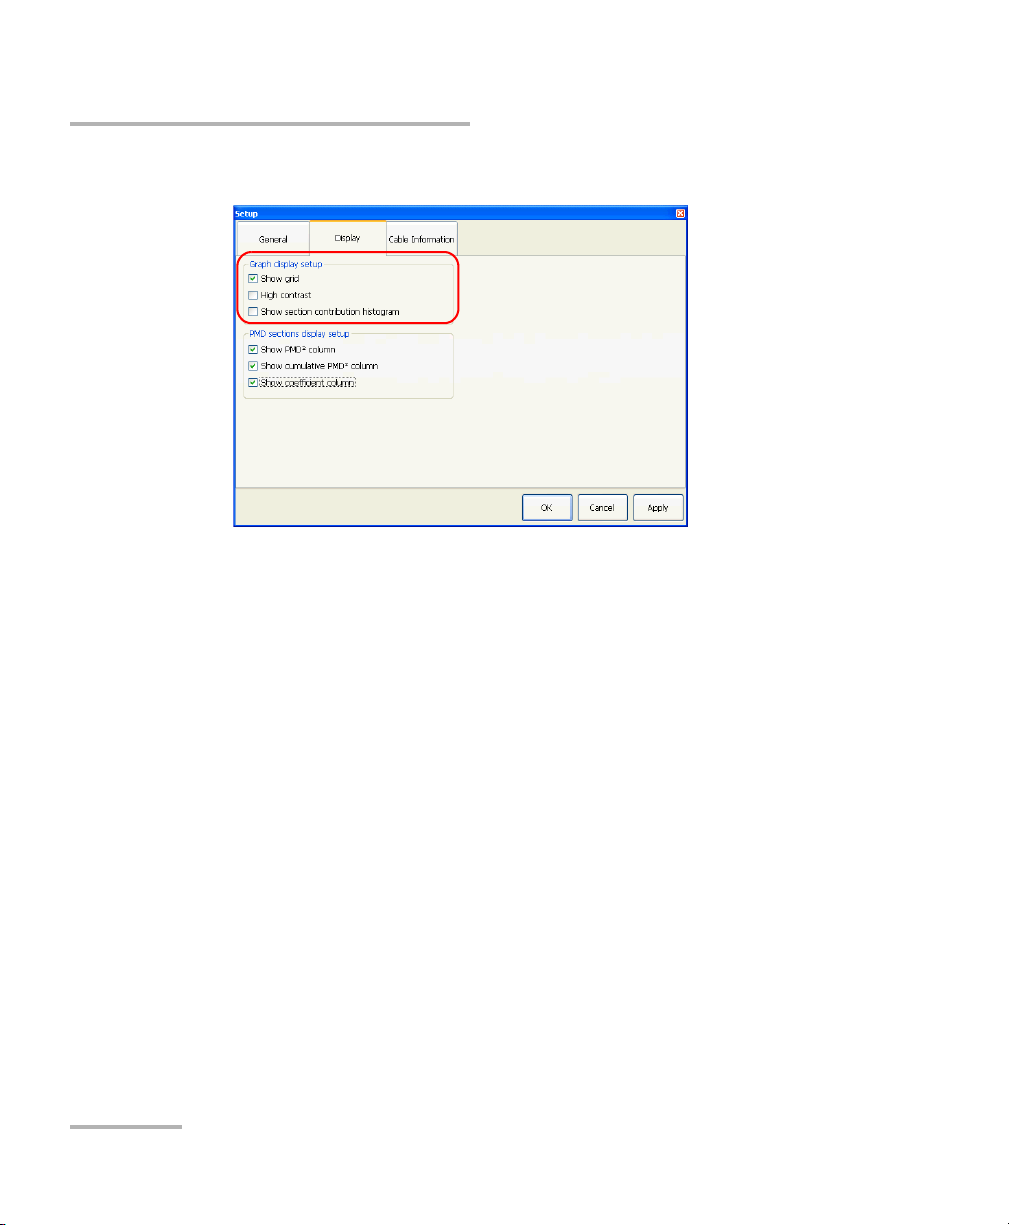
³ You can display or hide the grid.
³ You can use the high contrast view if the lighting quality prevents you
from seeing the graph properly (glare from the sun, darkness).
³ You can show or hide the section contribution histogram. This
histogram is a graphic representation of the contents of the Contr.%
column in the section table.
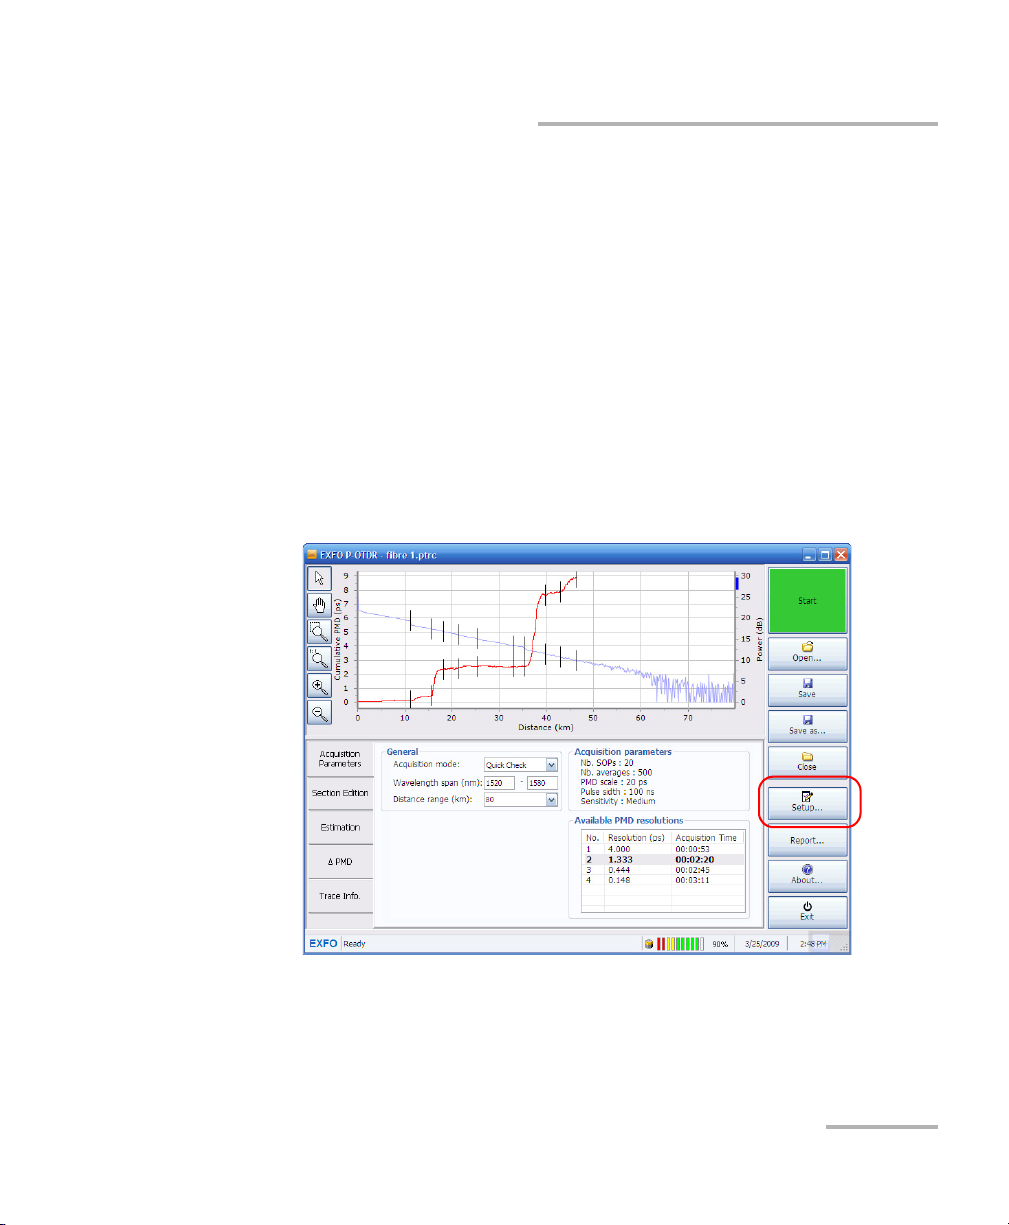
To change the graph display parameters:
1. From the main window, press Setup.
Distributed PMD Analyzer 23
Page 30
Setting up and Operating your Distributed PMD Analyzer
Setting up the Graph Display
2. Select the Display tab.
3. Modify the parameters as desired under Graph display setup.
4. Press Apply to use the new settings, or OK to use the new settings and
close the window.
24 FTB-5600
Page 31

Setting up and Operating your Distributed PMD Analyzer
Setting up Storage Options
Setting up Storage Options
The FTB-5600 will automatically save the acquisition files during the test.
You can set where the unit saves the data, select which template is used
for creating reports, and you can use an autonaming scheme to facilitate
and speed up your work.
You can also decide to keep the intermediate data while performing
acquisitions. This option should be used when there is a problem with your
unit or a measurement. Once you have acquired this data, which
represents all of the actions done by the unit when performing the test, you
can take the resulting file and send it to EXFO for troubleshooting
purposes.
IMPORTANT
Keeping the intermediate data will increase the size of the result file
in a significant manner.
Distributed PMD Analyzer 25
Page 32

Setting up and Operating your Distributed PMD Analyzer
Setting up Storage Options
To set up the storage options:
1. From the main window, select Setup.
2. Select the General tab.
26 FTB-5600
Page 33

Setting up and Operating your Distributed PMD Analyzer
Setting up Storage Options
3. Under Storage setup, enter the paths for the default save folder and
the reporting template. You can also use the Browse button to open a
standard navigation window.
4. If desired, select the Keep intermediate data option.
Distributed PMD Analyzer 27
Page 34

Setting up and Operating your Distributed PMD Analyzer
Setting up Storage Options
5. If desired, activate the autonaming feature. If you want the
incrementation to start on a specific number, enter it in the Next
incremental number box. You will see a preview of the next file name
at the bottom of the window.
Note: If your acquisition is set to continuous, the autonaming feature is
automatically selected and you cannot change this setting.
IMPORTANT
If you had previously saved files that have the same name as those
created by the autonaming feature, they will be replaced without
any notification.
6. Press Apply to use the new settings, or OK to use the new settings and
close the window.
28 FTB-5600
Page 35

Setting up and Operating your Distributed PMD Analyzer
Displaying PMD-Related Columns in the Main Window
Displaying PMD-Related Columns in the Main
Window
You can decide to hide or display the following columns in the main
window:
³ PMD
³ Cumulative PMD
³ PMD coefficient
Note: If you decide to hide or display those columns, the change will take effect
immediately in the result tabs
To display PMD-related columns in the main window:
1. From the main window, press Setup.
2
2
Distributed PMD Analyzer 29
Page 36

Setting up and Operating your Distributed PMD Analyzer
Displaying PMD-Related Columns in the Main Window
2. Select the Display tab.
3. Under PMD sections display setup, select which column or columns
you want to display.
4. Press Apply to use the new settings, or OK to use the new settings and
close the window.
30 FTB-5600
Page 37

Setting up and Operating your Distributed PMD Analyzer
Setting up Cable Information
Setting up Cable Information
The cable information is useful to help you differentiate your various
acquisitions. It will also appear in reports you generate for your
acquisitions.
To set the cable information:
1. From the main window, select Setup.
Distributed PMD Analyzer 31
Page 38

Setting up and Operating your Distributed PMD Analyzer
Setting up Cable Information
2. Select the Cable Information tab.
3. Enter the information as needed.
4. Press Apply to confirm the information, or OK to confirm the
information and close the window.
32 FTB-5600
Page 39

Setting up and Operating your Distributed PMD Analyzer
Performing an Acquisition
Performing an Acquisition
IMPORTANT
When measuring PMD, it is very important that the launch fiber is
not moved.
You can perform the test according to three acquisition modes:
³ Quick Check: This mode is used to obtain a fast overview of a link. All
you have to do is set the distance range for the link. To perform a Quick
Check, see Performing a Quick Check Acquisition on page 35.
³ Standard: This mode is the general test mode. All you have to set is the
accuracy and sensitivity levels. This mode is selected by default when
you open the application. To perform a standard acquisition, see
Performing a Standard Acquisition on page 37.
³ Advanced: This mode is used to perform an optimized acquisition. You
will have to set all of the parameters individually. This acquisition will
take more time to per form, but will return more details and can be fully
optimized. To perform an advanced acquisition, see Pe r for m i n g an
Advanced Acquisition on page 41.
Distributed PMD Analyzer 33
Page 40

Setting up and Operating your Distributed PMD Analyzer
Performing an Acquisition
The FTB-5600 does a series of actions in taking a measurement.
³ The instrument takes an OTDR trace and displays it. This step only
takes a few seconds. At this point, you should inspect the trace to see if
there are any problems.
³ Then, the instrument measures the SOPs. This will take more or less
time depending on the accuracy and sensitivity requested. The
remaining time and SOPs to measure are indicated in the status bar of
the application. After measuring about 10 SOPs, you will see a
temporary cumulative PMD curve.
³ At this point, considering that the overall measurement process is quite
long, EXFO strongly recommends that you make a general inspection
of the OTDR trace to verify that the instrument is properly connected
and that the FUT is OK.
³ Once all of the SOPs are acquired, the instrument computes the actual
PMD curve.
34 FTB-5600
Page 41

Setting up and Operating your Distributed PMD Analyzer
Performing an Acquisition
Performing a Quick Check Acquisition
The main purpose of the quick check is to have an estimate of the
cumulative PMD of the link to select the appropriate PMD scale.
Using the Quick Check OTDR trace and cumulative PMD curve, you can
verify the following:
³ The injection level: it should be within the injection level accepted
range, as it is the case with an OTDR. If it is not, correct the connection
at the instrument. This will improve the dynamic range.
³ The link length: the range value may be updated with the link length
seen on the trace. This reduces the size of the file and accelerates both
processing and acquisition times.
³ The link PMD maximum value could be used to set the PMD scale of
the advanced settings. This may have a major impact on the
acquisition time.
³ Where the PMD trace ends. If it ends very far from the end of the link,
then the number of averages could be increased to improve the
dynamic range.
This mode uses a low number of SOPs, therefore the measurement will not
be accurate. You should not use this acquisition mode to characterize
entire links. The default PMD scale for this mode is 20 ps.
Distributed PMD Analyzer 35
Page 42
Setting up and Operating your Distributed PMD Analyzer
Performing an Acquisition
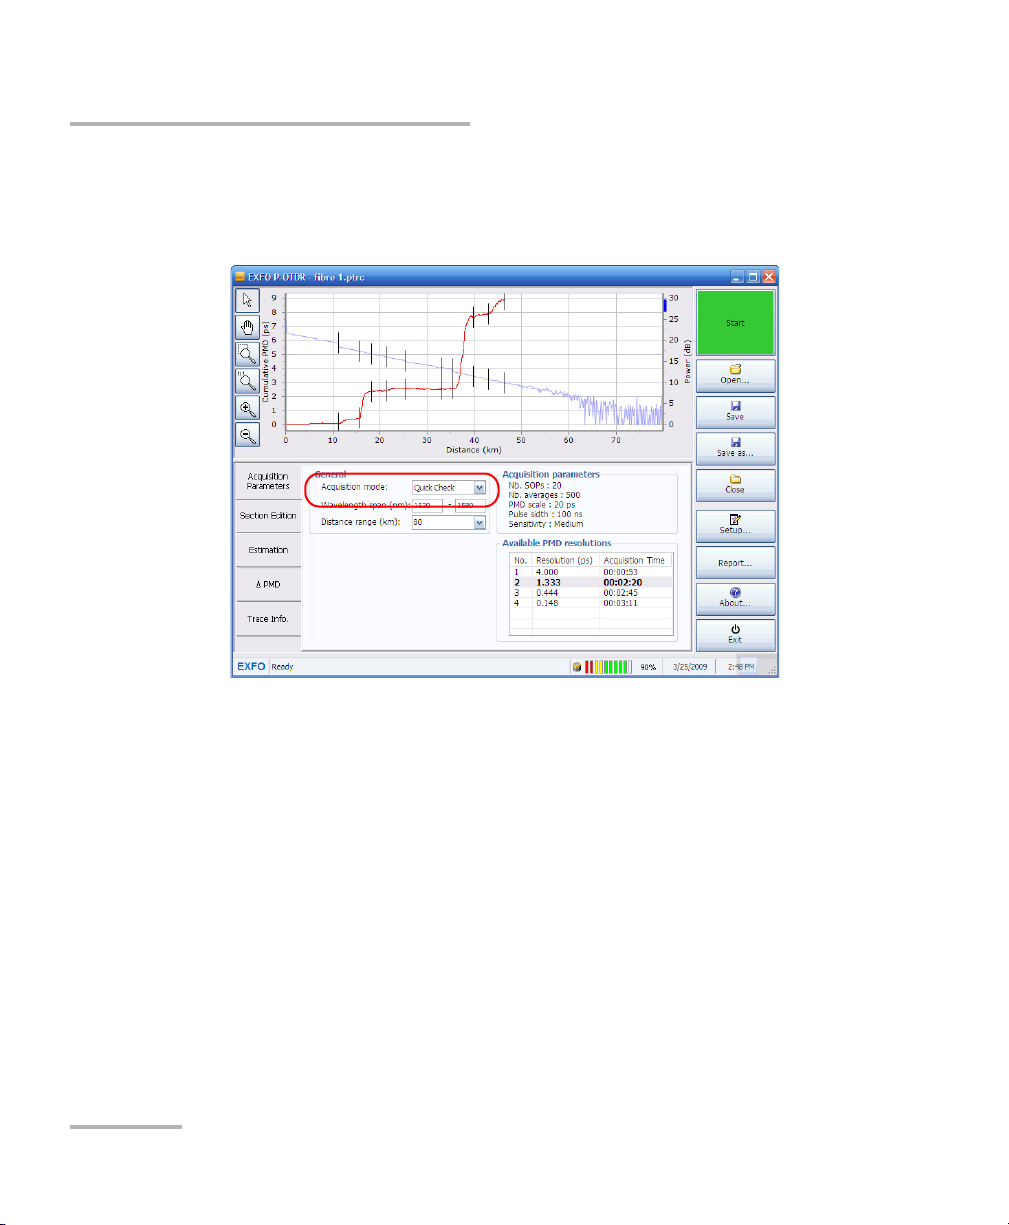
To perform a Quick Check acquisition:
1. From the main window, under General, select the Quick Check
acquisition mode.
36 FTB-5600
Page 43

Setting up and Operating your Distributed PMD Analyzer
Performing an Acquisition
2. Set the distance range, in kilometers, from the list of available values.
You can also type in the value directly. Reducing the range to the part of
the link that you want to measure will increase measurement speed
and decrease the resulting file size. If you do not know the length of the
link, you can rely on the OTDR trace to estimate it.
3. Press Start.
The acquisition starts. You can see the remaining time in the status bar.
Performing a Standard Acquisition
The acquisitions are more optimized for characterizing the link correctly
rather than for the acquisition time. The default PMD scale for this mode is
20 ps. EXFO recommends setting the accuracy to the standard level and
the sensitivity to the medium level for an acquisition of about 30 minutes.
The accuracy of the measurement changes the number of SOPs and
residual PMD. A higher level of SOPs will yield a more accurate result, but
longer acquisition time.
Accuracy Number of SOPs PMD Resolution (fs)
Low 50 1333
Medium 100 148
High 200 50
Distributed PMD Analyzer 37
Page 44

Setting up and Operating your Distributed PMD Analyzer
Difference between
injection and OTDR
trace level where
the PMD curve ends
Performing an Acquisition
The sensitivity of the measurement allows you to increase the PMD
measurement range. A greater sensitivity increases the number of averages
and will take longer to be achieved.
Sensitivity
Number of
Averages
Electronic
Sensitivity
Low 500 Low APD gain
Medium 1000 High APD gain
High 2000 High APD gain
To improve the dynamic range for your acquisition, consider the following:
³ For less than 13 dB, put the sensitivity to low. This means an acquisition
of about 15 minutes with three resolutions.
³ Setting the sensitivity to medium will improve the dynamic range and
means an acquisition of about 30 minutes with three resolutions.
³ Setting the sensitivity to high will give you the optimal dynamic range
and means an acquisition of about 1 hour with three resolutions.
Note: You can obtain the dynamic range of the trace by subtracting the
backscatter level at the fiber end from the injection level accepted range
value.
38 FTB-5600
Page 45
Setting up and Operating your Distributed PMD Analyzer
Performing an Acquisition
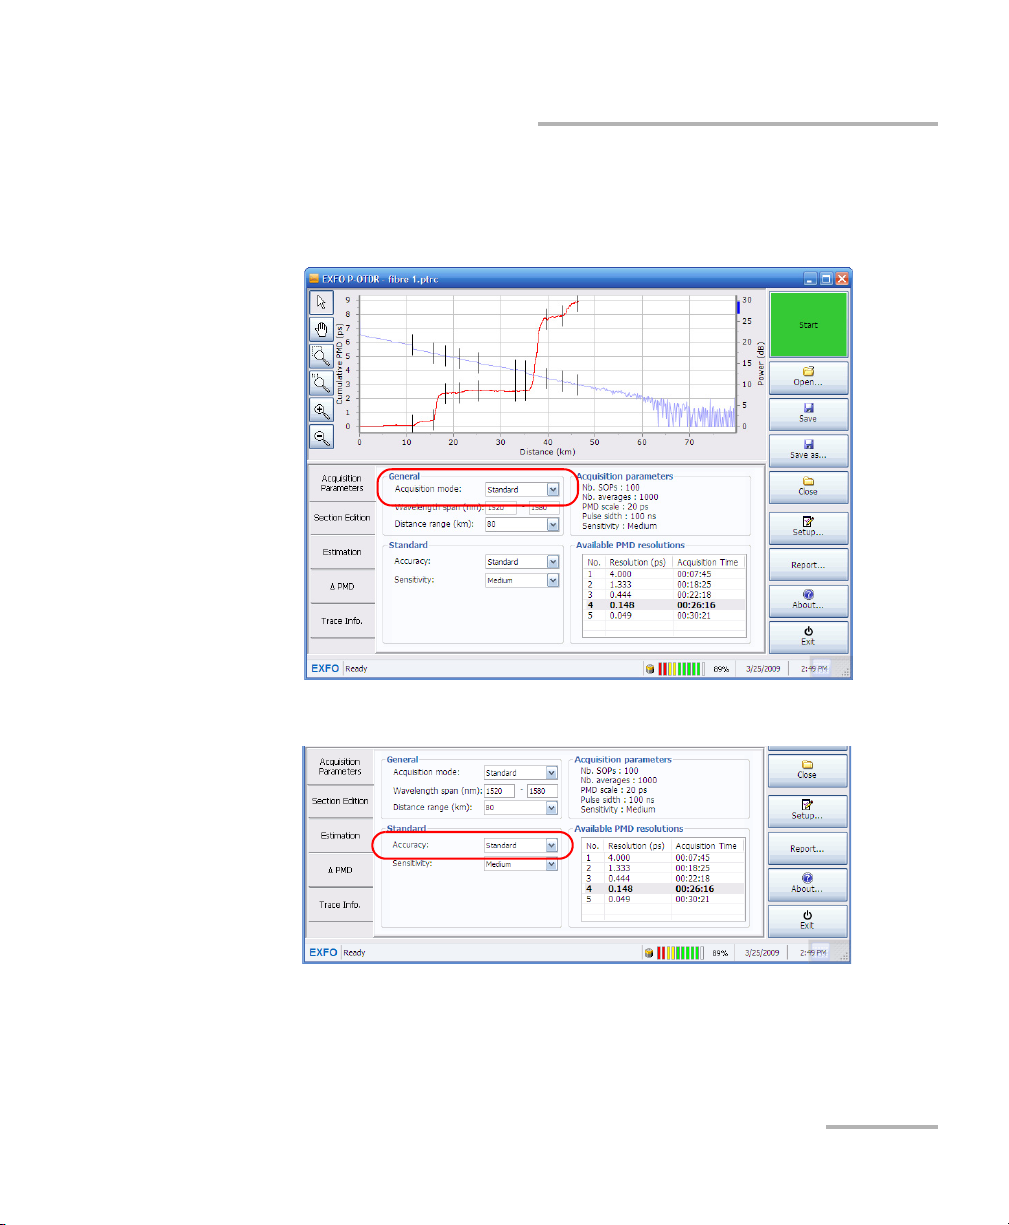
To perform a standard acquisition:
1. From the main window, under General, select the Standard
acquisition mode.
2. Set the accuracy of the measurement by selecting a value in the list.
Distributed PMD Analyzer 39
Page 46
Setting up and Operating your Distributed PMD Analyzer
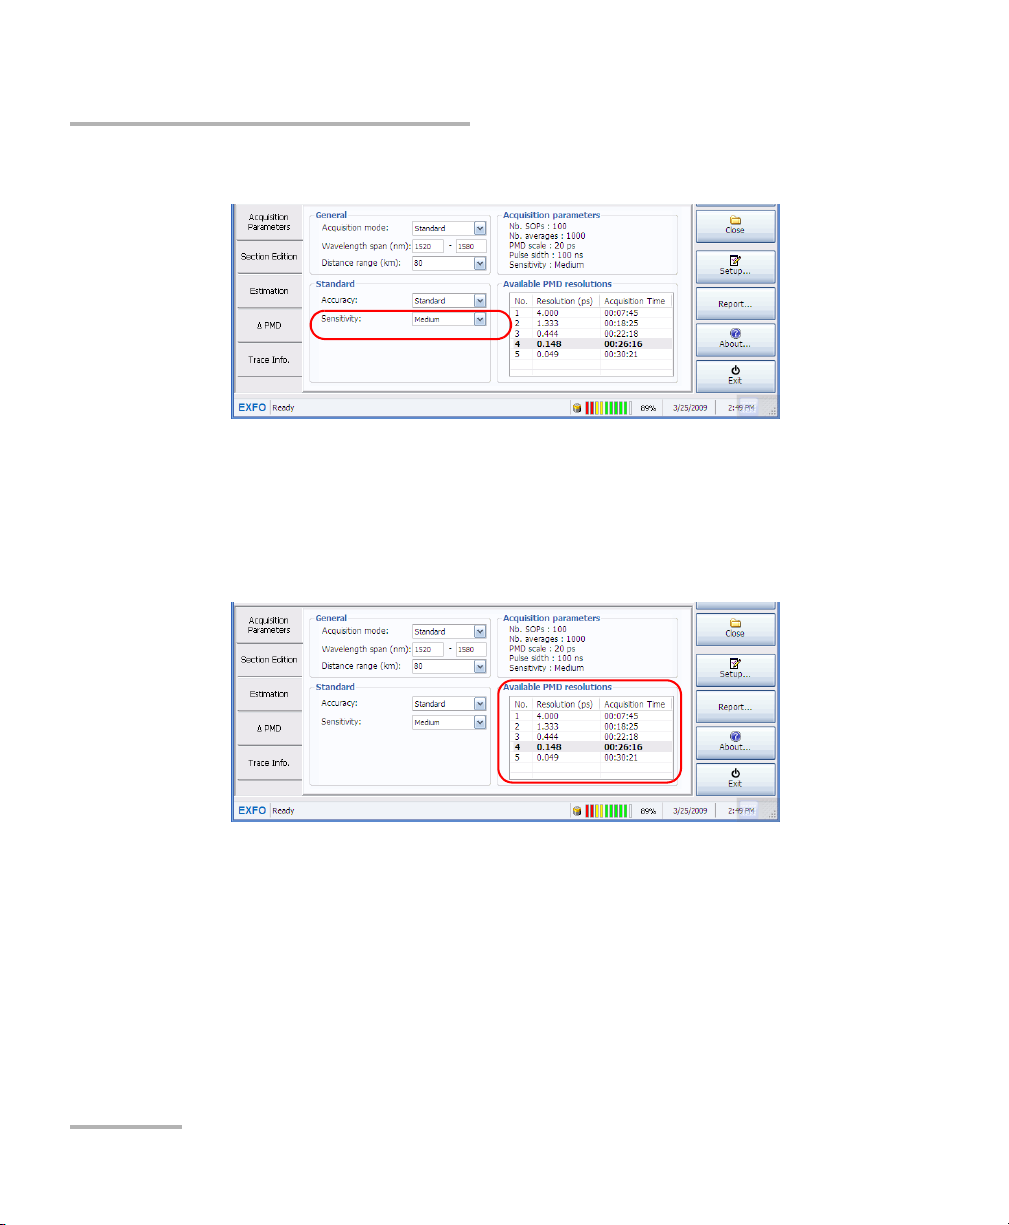
Performing an Acquisition
3. Set the sensitivity of the measurement by selecting a value in the list.
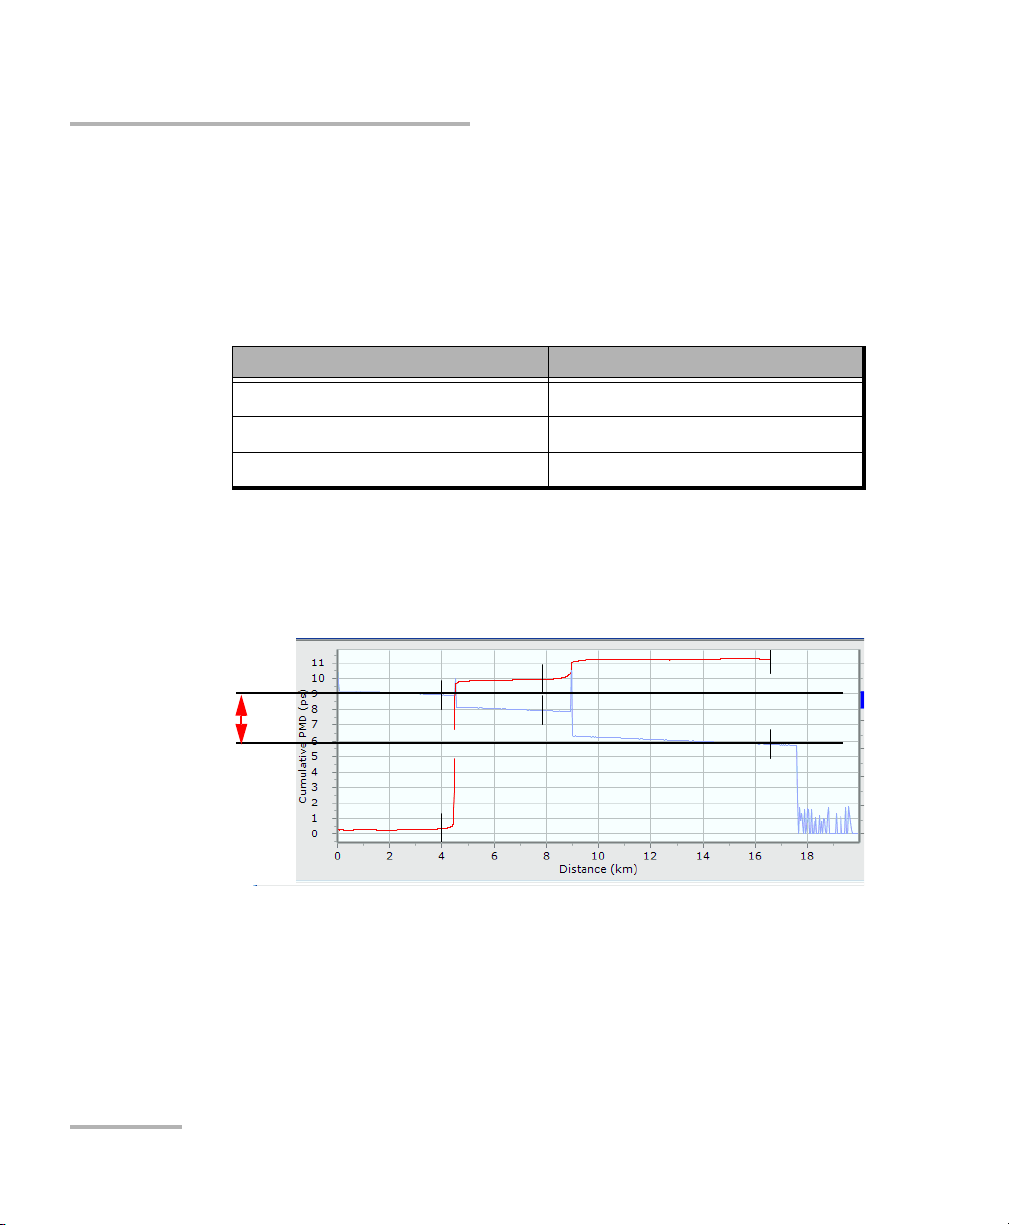
4. Select the PMD resolution that can best fit the minimum measurable
value for your PMD scale.
Note: The PMD resolution will influence the acquisition time; the estimated value
is next to each scale.
5. Press Start.
The acquisition starts. You can see the remaining time in the status bar.
40 FTB-5600
Page 47

Setting up and Operating your Distributed PMD Analyzer
Performing an Acquisition
Performing an Advanced Acquisition
The advanced acquisition parameters will help you perform a more
accurate test. For more information on setting the parameters to optimize
your acquisition, see Optimizing Measurements on page 121.
³ The number of polarization states (SOP) used will change the accuracy
for your acquisition as it increases. However, it will also increase the
acquisition time accordingly.
EXFO recommends a measurement of at least 100 SOPs in order to
have a significant cumulative PMD curve. A value of 50 SOPs will return
a crude measurement. The most accurate measurements will be done
with a number of SOPs ranging from 400 to 1000.
³ The number of averages sets each individual OTDR trace number of
averages. These OTDR traces are used to build the cumulative PMD
curve. A higher number of averages decreases the noise and increases
the acquisition time.
EXFO recommends a value of 500 averages; use more if the
measurement range is too small. A value below 500 may affect the
precision of the acquisition estimated time.
³ The PMD scale sets the target value of the cumulative PMD of the FUT
to be measured. If you already know the PMD value of the FUT, select
the closest value in the list. You can also crudely evaluate this value by
performing a Quick Check (see Performing a Quick Check Acquisition
on page 35 for details). If you see that the PMD curve is very wavy and
is at the same level as the PMD resolution, the PMD scale value is too
high.
³ The pulse width sets the length of the OTDR pulse used to characterize
the PMD cumulative curve. Increasing the value also increase
acquisition time. EXFO recommends using a pulse width of 100 ns. If
more dynamic range is required and that there are no depolarized
sections, you can use a pulse width of up to 275 ns. If there are
depolarized sections, using a lower value such as 50 ns may help.
Distributed PMD Analyzer 41
Page 48
Setting up and Operating your Distributed PMD Analyzer
Difference between
injection and OTDR
trace level where
the PMD curve ends
Performing an Acquisition
³ The sensitivity parameter sets the electronic APD gain. You should use
the high setting unless you are interested only in the very beginning of
the link. The sensitivity of the measurement is dependant on the PMD
range. A greater sensitivity increases the number of averages and will
take longer to be achieved. Consider the following to improve your
dynamic range.
Sensitivity Number of Averages to Select
Low 500
Medium 1000
High 2000
Note: You can obtain the dynamic range of the trace by subtracting the
backscatter level at the fiber end from the injection level accepted range
value.
42 FTB-5600
³ The PMD resolution is the minimum value to be measured. EXFO
recommends setting this value to the lowest value of interest for your
testing purposes. A smaller PMD resolution signifies a larger number of
PMD steps and increases acquisition time.
Page 49

Setting up and Operating your Distributed PMD Analyzer
Performing an Acquisition
For rough measurements in links with high PMD, you should use a
value between 0.4 and 1 ps. For low PMD measurements, use a value
around 50 ps and at least 100 SOPs. For faster measurements of small
PMD values, use a lower setting, such as 2 ps.
To perform an advanced acquisition:
1. From the main window, under General, select the Advanced
acquisition mode.
Distributed PMD Analyzer 43
Page 50
Setting up and Operating your Distributed PMD Analyzer
Performing an Acquisition
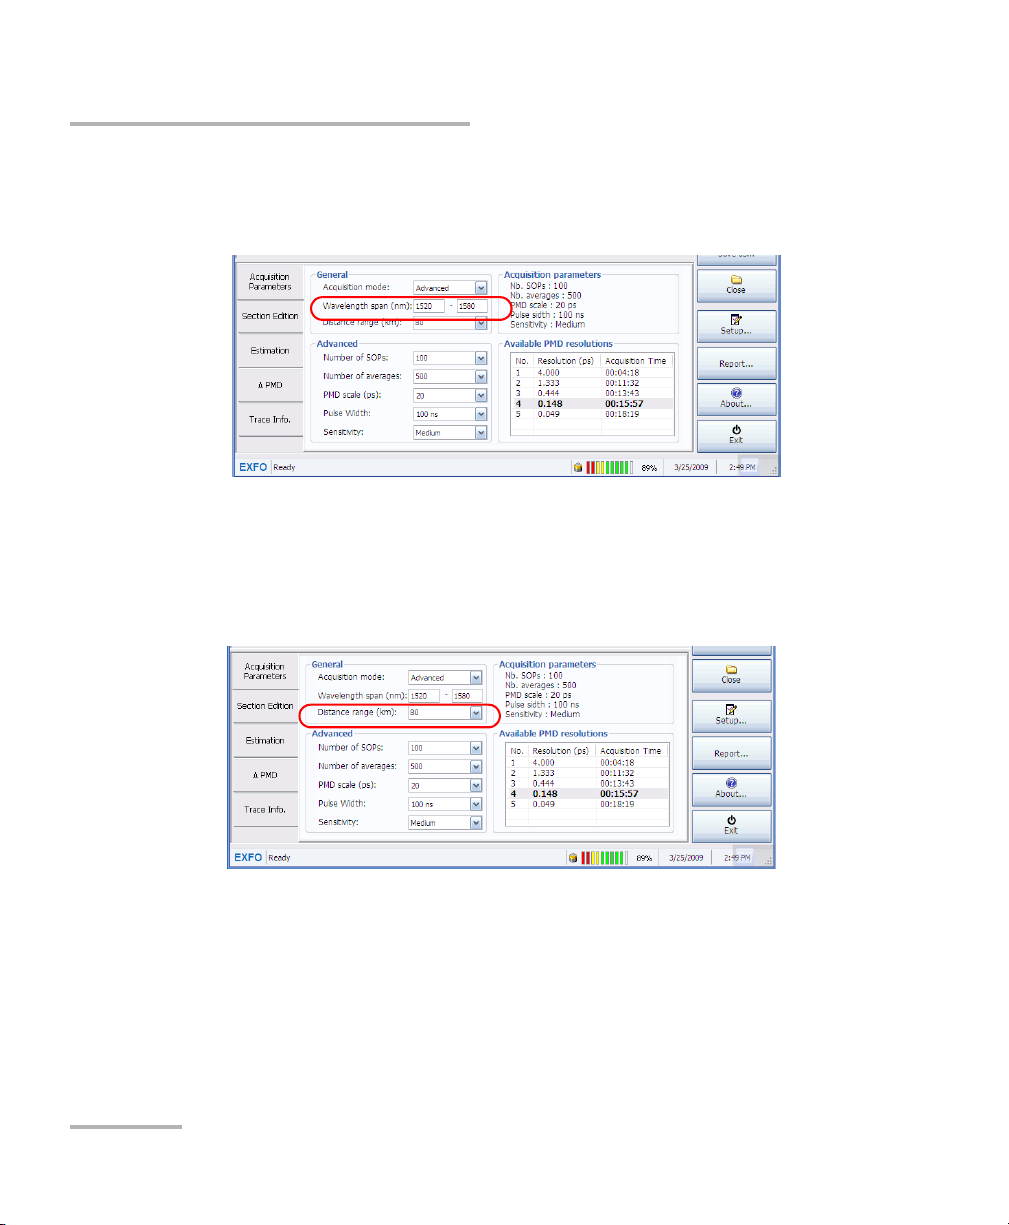
2. Set the wavelength span for your test. The default range is 1520 nm to
1580 nm. EXFO does not recommend changing this range unless you
want to perform a very specific test.
3. Set the distance range, in kilometers, from the list of available values,
or you can enter your own manually. Reducing the range to the part of
the link that you want to measure will increase measurement speed
and decrease the resulting file size. If you do not know the length of the
link, you can rely on the OTDR trace to estimate it.
44 FTB-5600
Page 51
Setting up and Operating your Distributed PMD Analyzer
Performing an Acquisition
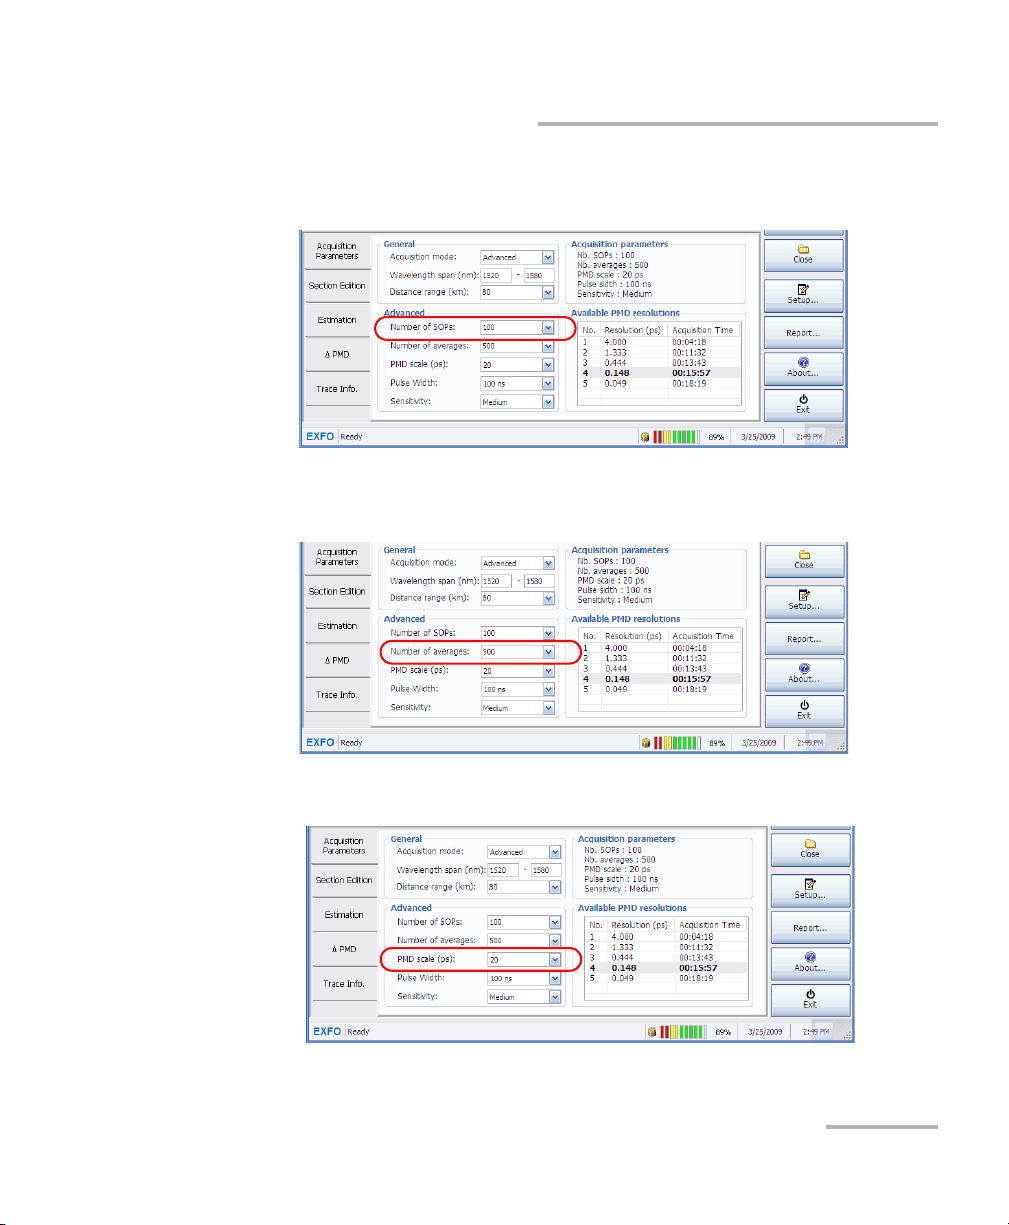
4. Under Advanced, select the number of SOPS from the list of available
values. You can also type in a value directly.
5. Select the number of averages for the measurement. You can also type
in a value directly.
6. Select the PMD scale, in ps.
Distributed PMD Analyzer 45
Page 52

Setting up and Operating your Distributed PMD Analyzer
Performing an Acquisition
7. Select the pulse width, in ns
8. Select the sensitivity level.
46 FTB-5600
Page 53
Setting up and Operating your Distributed PMD Analyzer
Using the Bidirectional File Creator
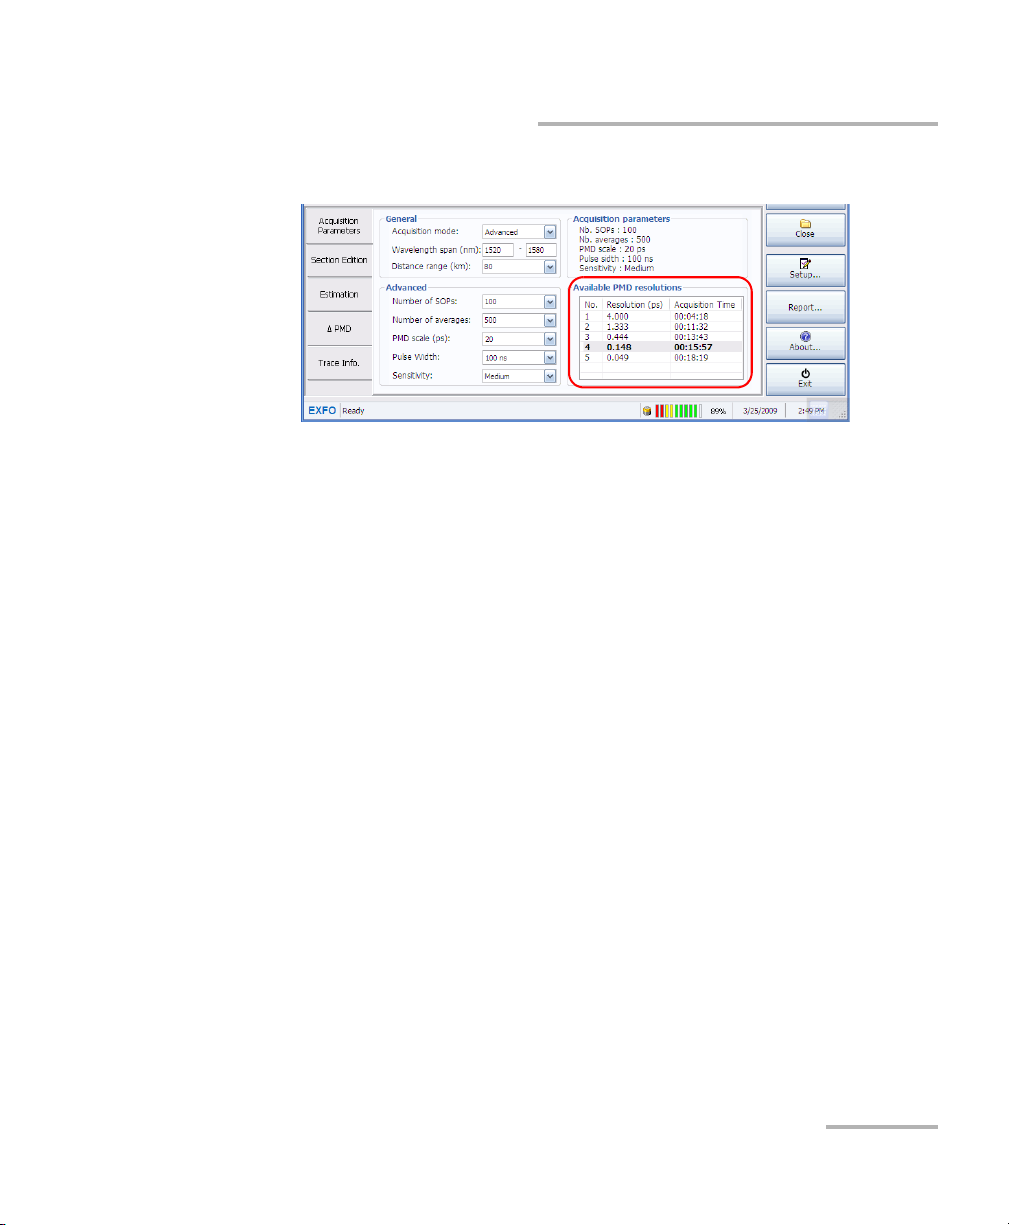
9. Select the appropriate PMD resolution from the list.
A summary of the parameters is displayed on-screen.
10. Press Start.
The acquisition starts. You can see the remaining time and number of
SOPs in the status bar.
Using the Bidirectional File Creator
Since PMD accumulates in quadratic manner, the higher the PMD, the
more difficult it is to measure weak PMD variations. Using a measurement
coming from each end of the link you want to characterize and combining
the two measurements into one bidirectional trace file can help you
improve the precision of the measurement all over the link.
When measuring links that are too long for the dynamic range of the unit,
creating a bidirectional trace by combining the traces coming from each
end doubles the effective measurement range.
The files can therefore overlap fully, partly, or not overlap at all.
Note: You cannot use a bidirectional file you have already created to create a
new bidirectional file.
Distributed PMD Analyzer 47
Page 54

Setting up and Operating your Distributed PMD Analyzer
Using the Bidirectional File Creator
To create a bidirectional file:
1. From Windows, select start, then All Programs > EXFO > Programs.
OR
From ToolBox, select the Applications tab, then P-OTDR Bidirectional
File Creator.
2. Select the trace file you want to use for the A -> B side by using the
corresponding Open button.
48 FTB-5600
Page 55

Setting up and Operating your Distributed PMD Analyzer
Using the Bidirectional File Creator
3. Select the trace file you want to use for the B -> A side by using the
corresponding Open button.
Distributed PMD Analyzer 49
Page 56

Setting up and Operating your Distributed PMD Analyzer
Using the Bidirectional File Creator
4. If the two traces do not allow the automatic calculation of the length of
the link (for example, they do not cover the same distance), or if you
want to specify a length yourself, select the corresponding option, then
enter the value you want.
50 FTB-5600
Page 57

Setting up and Operating your Distributed PMD Analyzer
Using the Bidirectional File Creator
5. If you want to specify an estimation of the PMD on the link, select the
corresponding option.
6. Click Generate to start the bidirectional file creation.
Distributed PMD Analyzer 51
Page 58

Setting up and Operating your Distributed PMD Analyzer
Using the Bidirectional File Creator
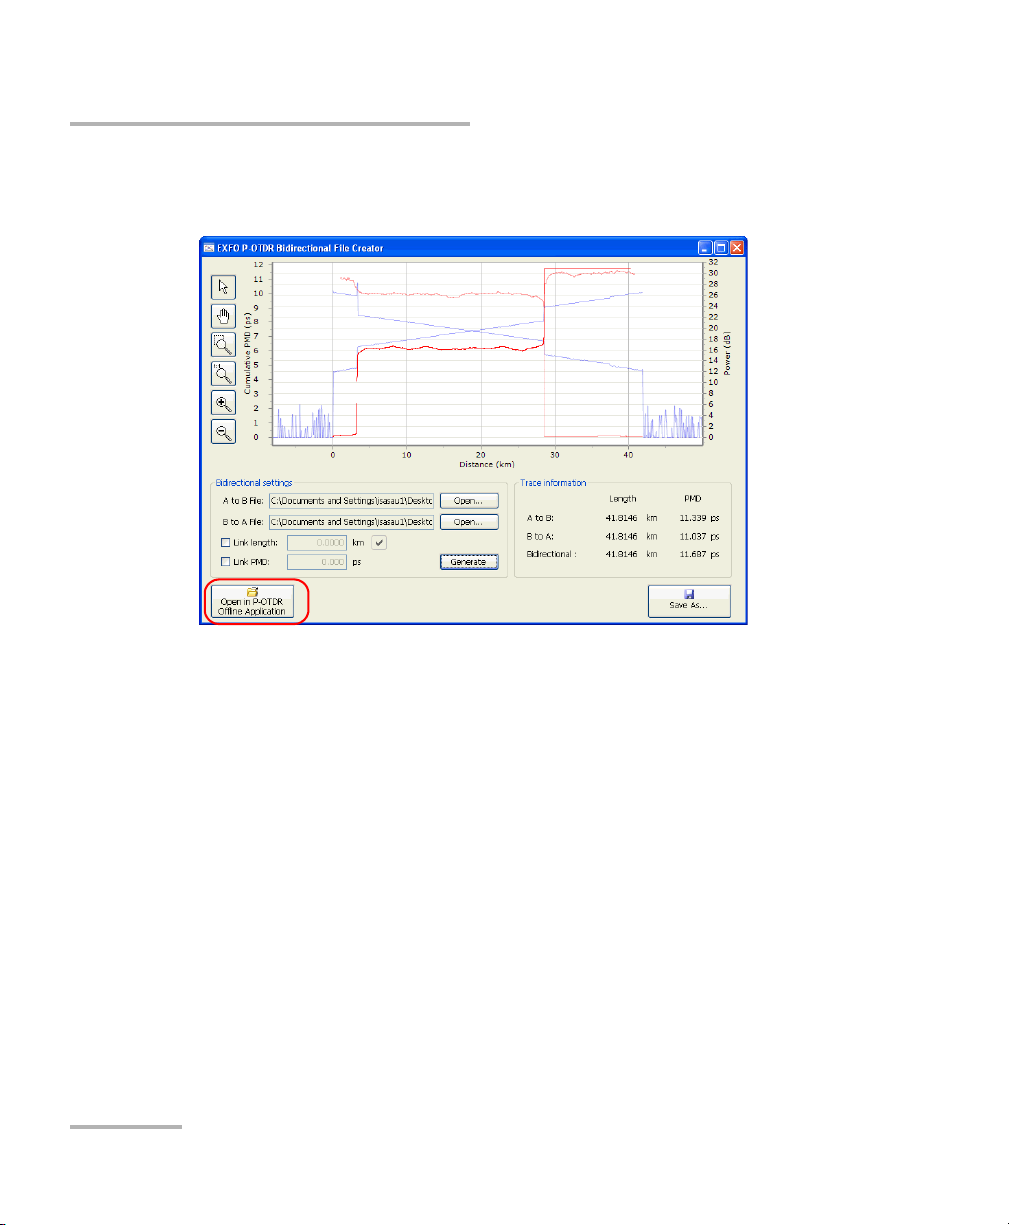
The resulting traces appear on-screen once the application is done
creating the file.
52 FTB-5600
Page 59

Setting up and Operating your Distributed PMD Analyzer
Using the Bidirectional File Creator
To save the created bidirectional trace:
1. Select Save as, then select a name and location for your file.
2. Select Save.
Note: For information on using the zooming tools, see Using Zoom Controls on
page 62.
Distributed PMD Analyzer 53
Page 60
Setting up and Operating your Distributed PMD Analyzer
Using the Bidirectional File Creator
To open the created trace in the P-OTDR application to analyze it:
Once the trace was created and saved, select Open in P-OTDR.
Note: A bidirectional file is always identified as such in the title bar of the P-OTDR
application window.
54 FTB-5600
Page 61
5 Managing Results
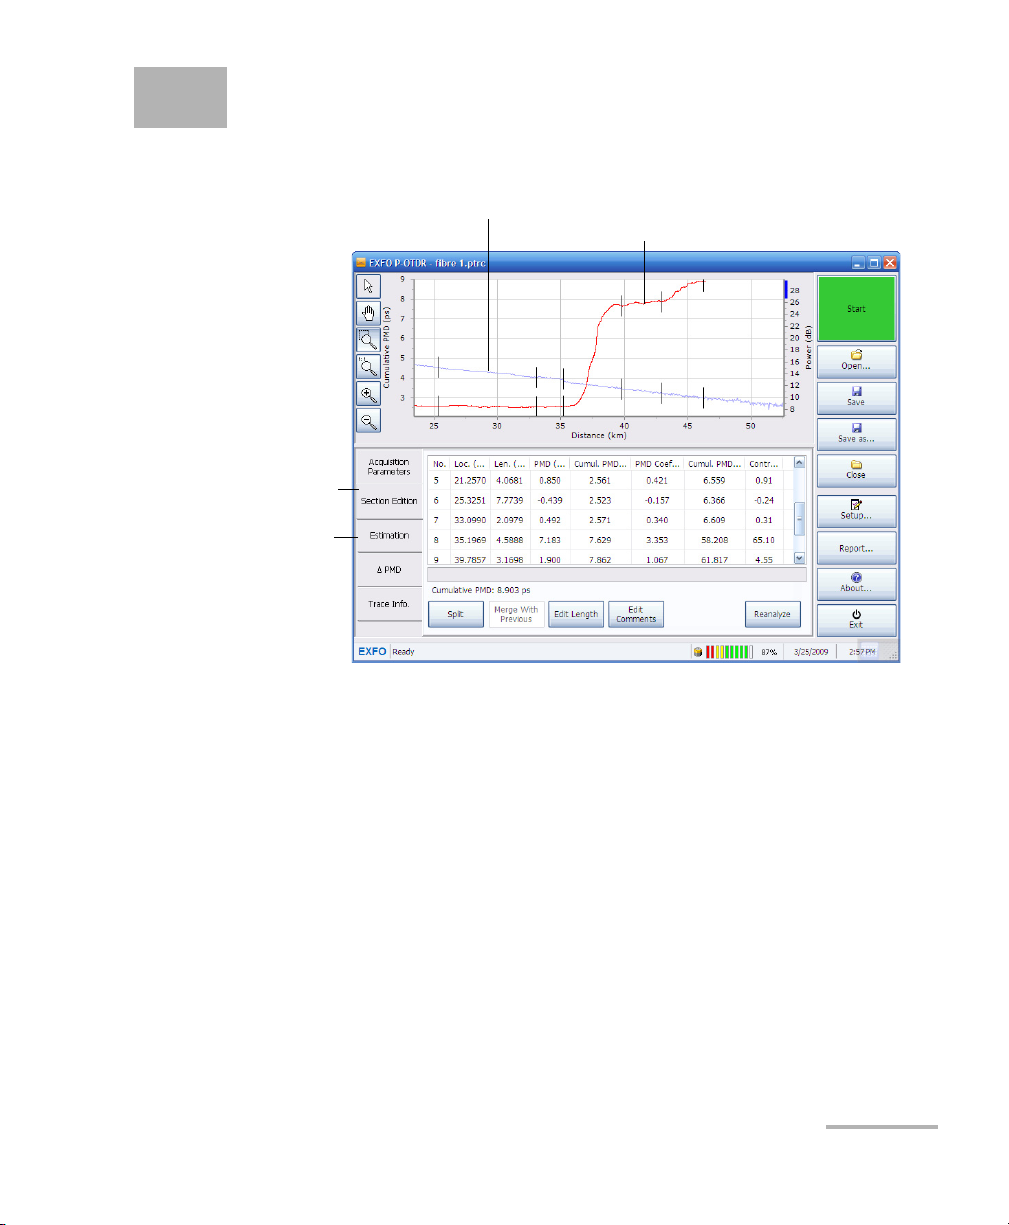
OTDR Trace
Cumulative PMD curve as
function of the distance
PMD section table to
view and edit current
sections
PMD estimation table to
analyze the effect of
modifying sections
Once the acquisition is complete, you can see data appear on-screen.
Distributed PMD Analyzer 55
You can perform result analyses directly in the FTB-5600, but you can also
use the offline application that you can access through ToolBox. The offline
application is identical to the online application, except that you cannot
make acquisitions with it; therefore, you will see that the Start button, as
well as the Acquisition Parameters are disabled.
Page 62

Managing Results
To access the offline application:
1. From ToolBox, select the Applications tab.
Note: Depending on which applications are installed on your platform, the
Applications tab may look different.
2. Select P-OTDR.
3. Press Start Application.
56 FTB-5600
Page 63

Managing Results
Opening an Existing File
Opening an Existing File
If you are working with the offline mode of the application, or want to open
a file you have previously acquired, you can either open it and modify it as
needed, or open it as a read-only file, to avoid any accidental modification.
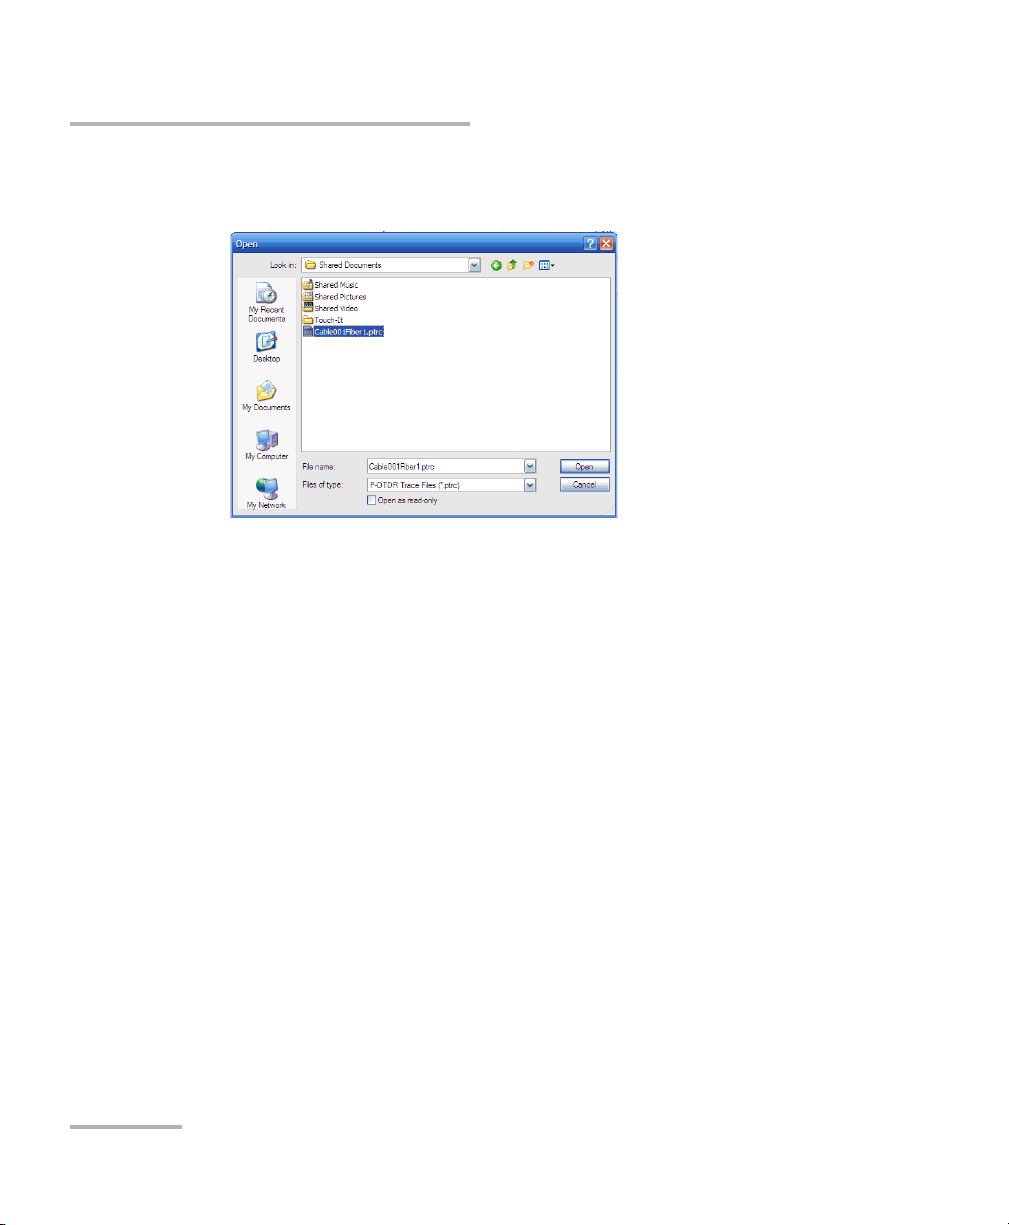
To open an existing file:
1. From the main window, press Open.
Distributed PMD Analyzer 57
Page 64
Managing Results
Opening an Existing File
2. Select the file you want to open. If you want the file to open in
read-only mode, select the corresponding option.
3. Press Open.
58 FTB-5600
Page 65

Managing Results
Saving a File
Saving a File
Files can be saved either using the autonaming scheme or using a
personalized name.
The autonaming scheme is only available if you have selected the option as
explained in Setting up Storage Options on page 25 and if the file you are
saving is a new acquisition (as opposed to an already existing file that you
have opened).
IMPORTANT
Since acquisition files can be extremely large, they are directly sent
to the storage location and are not kept in memory to optimize the
operation speed of the unit.
If the location you have selected for saving files is external to the
unit (for example, a USB key or a drive linked through a network),
you must leave the external storage device or link in place while you
are working on your files. Otherwise, the unit cannot save the data
and you will lose any change made since the time you removed the
storage device or connection.
Distributed PMD Analyzer 59
Page 66

Managing Results
Saving a File
To save a file using the autonaming scheme:
From the main window, press Save.
60 FTB-5600
Page 67

To save a file using a personalized name:
1. From the main window, press Save As.
Managing Results
Saving a File
2. Enter a name for the file, then press Save.
Distributed PMD Analyzer 61
Page 68

Managing Results
Selection mode
Move view area
Zoom in on the defined area
Automatic zoom in
Full view
Automatic zoom out
Using Zoom Controls
Using Zoom Controls
Use the zoom controls to change the scale of the trace display.
Note: You cannot move the markers with the button.
To view specific portions of the graph:
³ You can define which portion of the graph will be visible by selecting
the button and dragging the graph with the stylus or your finger.
³ You can also zoom in on a specific area by selecting the button
and defining the zoom area with the stylus or your finger (a rectangle
with dotted lines will appear to help you define the area). Once you
release the stylus, the application automatically zooms in on the graph.
³ You can zoom in or out on the center of the portion of the graph that is
displayed by using, respectively, the or the button. The
application automatically adjusts the zoom.
To revert to the complete graph view:
Press the button.
62 FTB-5600
Page 69
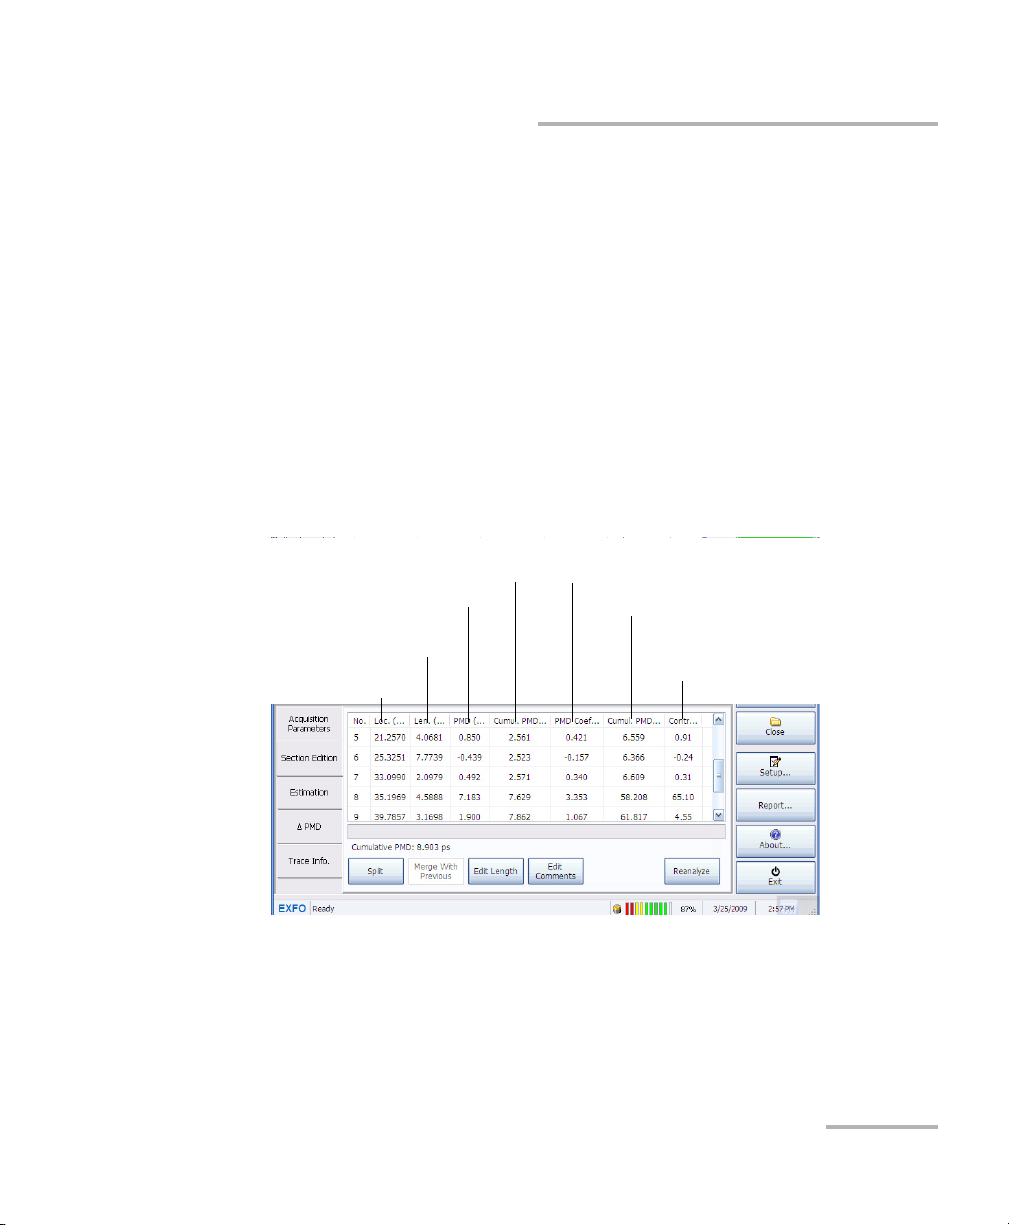
Managing Results
PMD characteristics of of one
particular length of fiber
Squared PMD contribution to the
total cumulative PMD value of the
section to the link
Squared cumulative PMD value
Value of the cumulative PMD
curve at the end of the section
Computed PMD value of the section
Distance between the beginning and
end of the section
Beginning of the section
Section Event Table
Section Event Table
After the acquisition is complete, you can see that a trace and a curve
appeared on-screen. They are the OTDR trace, and the cumulative PMD
curve. The latter is computed from a set of data that is called an SOP (state
of polarization). Several SOPs make one final cumulative PMD curve.
In order to interpret the measurements in the section table corresponding
to the PMD curve and working with them, you must take into account that
the PMD curve is square rooted. This means that the PMD value for each
section is the square root difference of the PMD cumulative curve section’s
last value and the PMD cumulative curve section’s first value.
Several indicators in the cumulative PMD table will help you with your
measurements :
You will also notice the cumulative PMD value at the bottom of the table.
This is particularly useful when you have many sections in your FUT and do
not want to go up and down the table constantly between operations to
see the cumulative value.
Distributed PMD Analyzer 63
Page 70

Managing Results
PM DSe ction CumulPMDSectionLastValue2CumulPMDSectionFirstValue
2
–=
Section Event Table
The PMD section value provides the PMD of a particular section over the
link. The section's PMD value is the square root difference of the PMD
cumulative curve section's last value and the PMD cumulative curve
section's first value. The formula is:
The contribution value provides a way to evaluate the contribution of a
specific section of the cumulative PMD of a link. Since PMD adds up to the
square, the contribution is computed in squares. The percentage of
contribution values are provided in square since it is mathematically not
possible to provide a square rooted percentage. Values would simply not
add up to 100 % and be harder to interpret.
Below, you can see an example of a fiber with two sections. The first
section has a value of 5 ps and the second section, of 10 ps. This will result
in a 11.2 ps of total cumulative PMD.
64 FTB-5600
Page 71

The percentage value of the first section is :
Contribution
52100%⋅
10
252
+
------------------------20%==
Contribution
102100%⋅
10
252
+
--------------------------- 80%==
The percentage value of the second section is :
Managing Results
Section Status
In this example, removing the 10-ps section will make the cumulative PMD
square of the link fall from 125 ps
2
to 25 ps2. In a linear scale, it would fall
from 11.18 ps to 5 ps. You must therefore always remember that the
contribution is computed as square values.
Section Status
You can view the status of the section at all times in the table. If there is a
problem with the PMD of a section, you can see a status in the table that
will help you identify the quality of the measurement.
The statuses are explained in the table below:
Distributed PMD Analyzer 65
Page 72

Managing Results
Section Status
Status In PMD column In Status column Suggestion
Valid The PMD value is
shown
Under Range
(UnRg)
The first or last point in
the section has a PMD
value that is too weak
according to the
residual PMD of the
measurement.
Over Range
(OvRg)
The first or last point in
the section has a PMD
value that is too high
according to the
selected PMD range.
Low SNR
(LoSNR)
The dynamics of the
first or last point in the
section are not
sufficient to measure
PMD correctly for the
section.
The section is valid
A significant portion of
the cumulated PMD
curve for the section is
to weak according to
the measurement
resolution.
A significant portion of
the cumulated PMD
curve for the section is
too high according to
the selected PMD
scale.
The dynamics on the
section is not sufficient
to measure the
cumulated PMD curve
correctly.
Select a lower scale or
a smaller PMD range in
the acquisition
parameters
Select a higher scale or
broader PMD range in
the acquisition
parameters.
Lessen the losses
through the
connectors, increase
the number of
averagings or increase
the pulse size.
For more information,
see Use an Optimized
Number of Averagings
on page 127 and Use
an Appropriate OTDR
Pulse Length on
page 128.
66 FTB-5600
Page 73

Managing Results
Section Status
Status In PMD column In Status column Suggestion
High
Depolarization
(HiDep)
The first or last point in
the section shows a
high intrinsic
polarization level that
causes the
measurement to be
imprecise.
The concerned section
shows a strong level of
intrinsic that causes
the measurement to
be imprecise.
The beating length, the
local variations that
have to be measured,
is a lot shorter than the
size of the pulse.
Therefore the
polarization fluctuation
measured by the unit
vanished through the
pulses spatial
averaging and is not
picked up.
To improve the
situation, you can try
to move the section
cursors outside the
region where the
results are invalid,
increase the spatial
smoothing filter value
or taking a
measurement with a
shorter pulse.
Distributed PMD Analyzer 67
Page 74

Managing Results
Section Status
Status In PMD column In Status column Suggestion
Unstable Link
(Unst)
The first or last point in
the section shows
strong polarization
unstability.
The section shows
strong polarization
unstability.
Unstable sections
occur when on the
link, the polarization
moves at a speed
faster than the
acquisition time of a
wavelength’s step.
This phenomenon can
occur mainly when
measuring aerial links
when there are strong
winds.
Any section after an
unstable section is
unstable as well. To
improve the situation,
you can decrease
significantly the
number of averages.
68 FTB-5600
Page 75

Managing Results
Marker A
Marker B
Positioning Markers on the Display
Positioning Markers on the Display
Correctly positioning the cursors is a key element in having the appropriate
results. The fundamental element is to set the first maker just before the
beginning of the transition and the last marker just after the end of the
transition.
Note: When you position the markers for the PMD, you will see that they might
not fit exactly with the automatically detected OTDR events on the trace.
Working with the exact location of the OTDR event markers will take the
network constraint into account, but adjusting the markers manually will
provide you with optimized measurements for your link.
If you use the spatial smoothing filter, you may have to adjust the markers,
as the curve may change.
Distributed PMD Analyzer 69
Page 76
Managing Results
Trace before treatment
Editing Sections
Editing Sections
Once your acquisition is complete the FTB-5600 built its own PMD section
table based on the OTDR automatic detection event algorithm. Since most
OTDR events do not coincide with PMD events, you may find that the table
contains events that are irrelevant to your test. You may want to edit some
sections of the link to improve your results.
Here is an example of a trace before and after irrelevant sections are
cleaned out:
70 FTB-5600
Page 77

Managing Results
Trace after treatment
Editing Sections
Distributed PMD Analyzer 71
Page 78

Managing Results
Editing Sections
Splitting Fiber Sections
Splitting sections can allow you to define a new segment by separating an
existing segment in two. This could help you pinpoint events that are more
relevant to your analysis than those automatically detected.
Splitting a fiber section cannot be undone, unless you reanalyze the
trace, as explained in Viewing Trace Information on page 85.
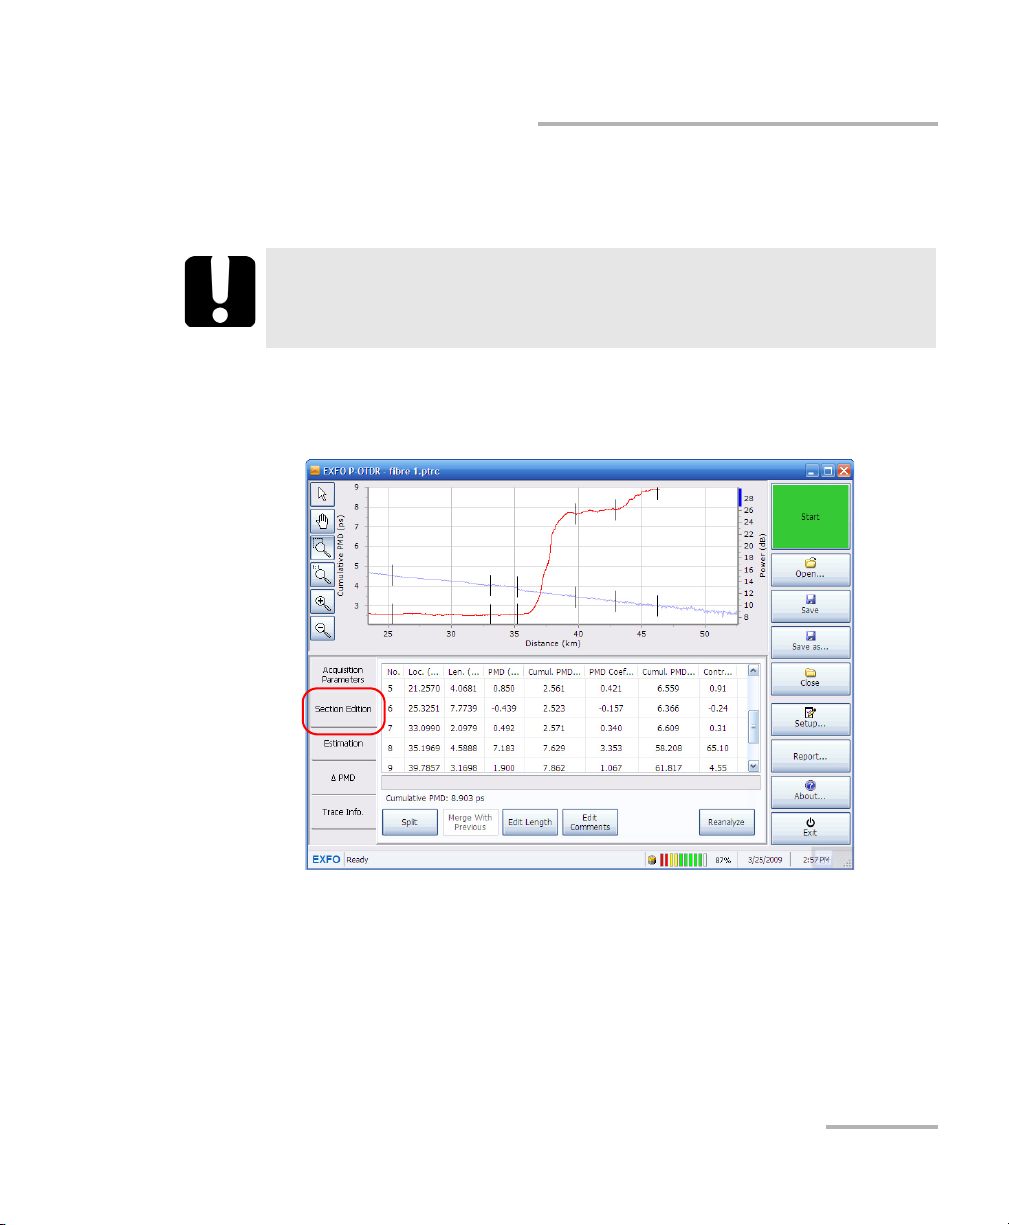
To split a fiber section:
1. From the main window, select the Section Edition tab.
IMPORTANT
72 FTB-5600
Page 79

Managing Results
2. Select the section you want to edit by pressing on it once.
3. Press Split.
Editing Sections
Distributed PMD Analyzer 73
Page 80

Managing Results
Editing Sections
4. Move the cursor using the arrow buttons to the desired location where
you want to split the segment. You can also click-drag the cursor to the
desired location.
The new segment you are creating is indicated in red in the table. You
will also see the two segments in gray on the graph.
Note: If you had comments in the segment you are splitting, they will remain with
the left-hand segment.
5. Press on Apply to split the segment, or on Cancel to return to the
Section Edition tab.
74 FTB-5600
Page 81
Managing Results
Editing Sections
Merging Fiber Sections
Merging fiber sections can be useful for removing irrelevant events.
IMPORTANT
Merging fiber sections cannot be undone, unless you reanalyze the
trace, as explained in Viewing Trace Information on page 85.
To merge a fiber section to another:
1. From the main window, select the Section Edition tab.
2. Select the section you want to merge by pressing on it once. The
section is always merged with the one above it.
Distributed PMD Analyzer 75
Page 82

Managing Results
Editing Sections
3. Press Merge with Previous.
The selected section is merged with the one above it, and you can see
the results on-screen.
Note: If there were comments in either section, they will be merged as well.
4. Press Apply to accept the merge, or Cancel to return to the Section
Edition tab.
76 FTB-5600
Page 83

Managing Results
Editing Sections
Editing Section Length
Editing the section length can allow you to include part of another section
to improve the section table measurements.
IMPORTANT
Editing a fiber section length cannot be undone, unless you
reanalyze the trace, as explained in Viewing Trace Information on
page 85.
To edit a fiber section length:
1. From the main window, select the Section Edition tab.
2. Select the section you want to edit by pressing on it once.
Distributed PMD Analyzer 77
Page 84

Managing Results
Editing Sections
3. Press Edit Length.
4. Use the arrow buttons to move the right end of the segment to its new
location. You can also click-drag the cursor to the desired position.
The other surrounding segments are updated accordingly.
5. Press Apply to accept the new segment length, or Cancel to return to
the Section Edition tab.
78 FTB-5600
Page 85

Managing Results
Editing Sections
Adding Comments to Segments
You can add comments to each fiber section to include important
information, or details on the events that could be helpful in later analyses.
To add comments to a segment:
1. From the main window, select the Section Edition tab.
2. Select the segment for which you want to add a comment by pressing
on it once.
Distributed PMD Analyzer 79
Page 86

Managing Results
Editing Sections
3. Press Edit Comments.
4. Type in the comment you want to add, then press Apply to keep the
comment, or Cancel to leave without adding a comment.
80 FTB-5600
Page 87

Managing Results
ΔPMD
CumulPMDCursorB2CumulPMDCursorA
2
–
CumulPMDCursorB
2
CumulPMDCursorA
2
–
----------------------------------------------------------------------------------------------------------------------=
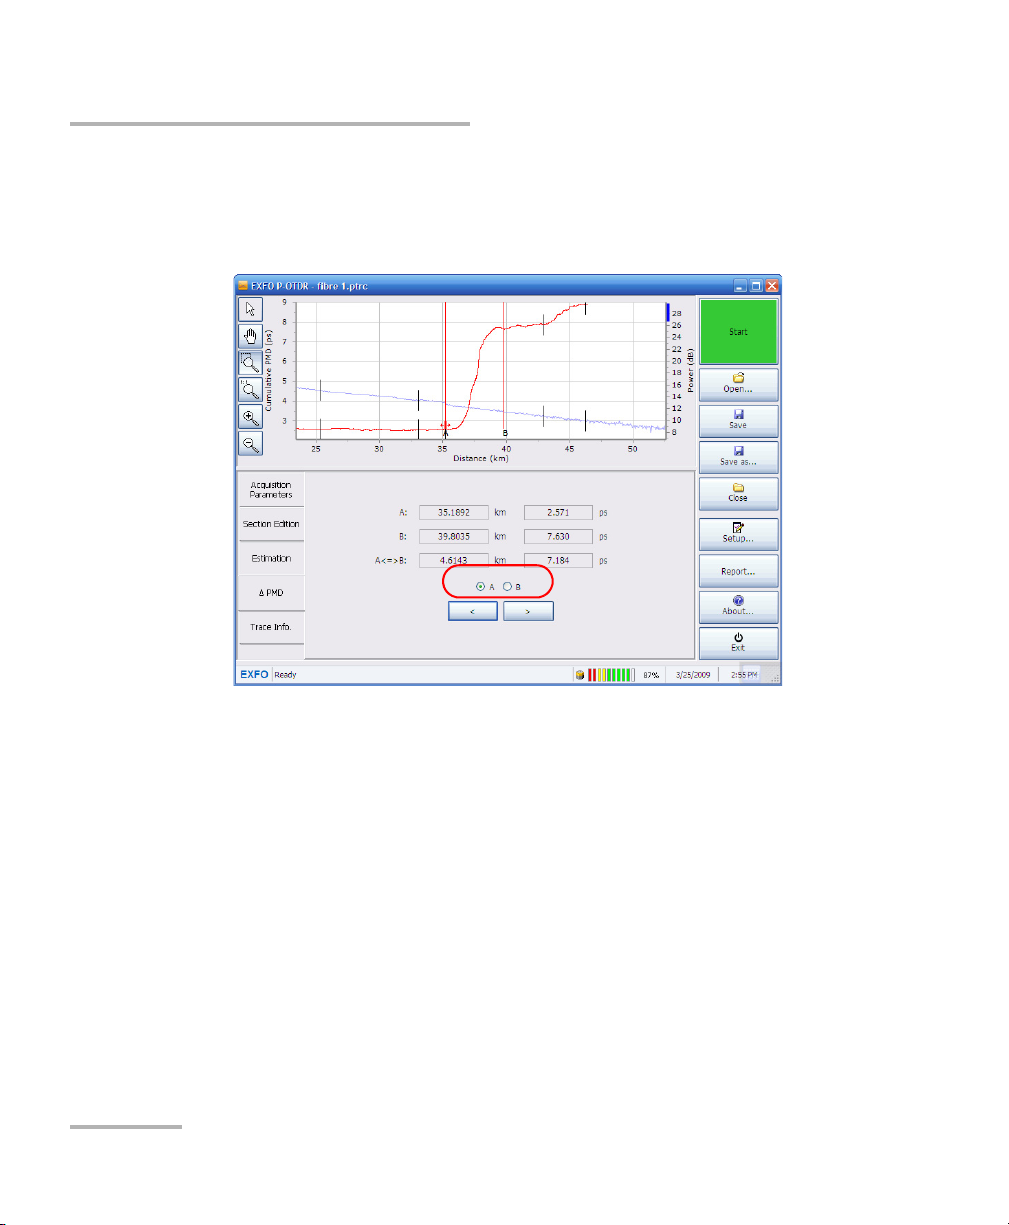
Using Markers to Measure PMD Differences (Delta PMD Tab)
Using Markers to Measure PMD Differences
(Delta PMD Tab)
The Delta PMD tab is used to measure sections along the cumulative PMD
curve. The measurement is performed with two cursors; cursor A indicates
the beginning of the measurement and cursor B indicates the end. On
screen, you will see the positions of the markers, as well as the PMD
cumulative values. The application then computes and displays the square
rooted difference between cumulative PMD at the position of the two
markers.
The equation below illustrates how the difference is calculated.
Distributed PMD Analyzer 81
Page 88
Managing Results
Using Markers to Measure PMD Differences (Delta PMD Tab)
To move the markers:
1. Select the Δ PMD tab.
2. Select which cursor to move.
3. Use the arrow buttons to move the cursor. You can also click-drag the
cursor to the desired position.
82 FTB-5600
Page 89

Managing Results
Estimating Results
Estimating Results
You can manage the fiber sections as desired to obtain a better
characterization. The FTB-5600 allows you to evaluate fiber section
replacement scenarios in the link without actually replacing the section
itself.
This is done by modifying one or some strong PMD sections of the link to
analyze. By modifying the PMD value or the coefficient of the section in
those links, you can see the simulated cumulative PMD value that will
result from those changes.
For example, you have made an acquisition with several sections. Let us
verify what happens to the cumulative PMD of the link if we set PMD value
of the eighth section to zero. The link cumulative PMD goes from 8.903 ps
to 5.273 ps.
Distributed PMD Analyzer 83
Page 90

Managing Results
Estimating Results
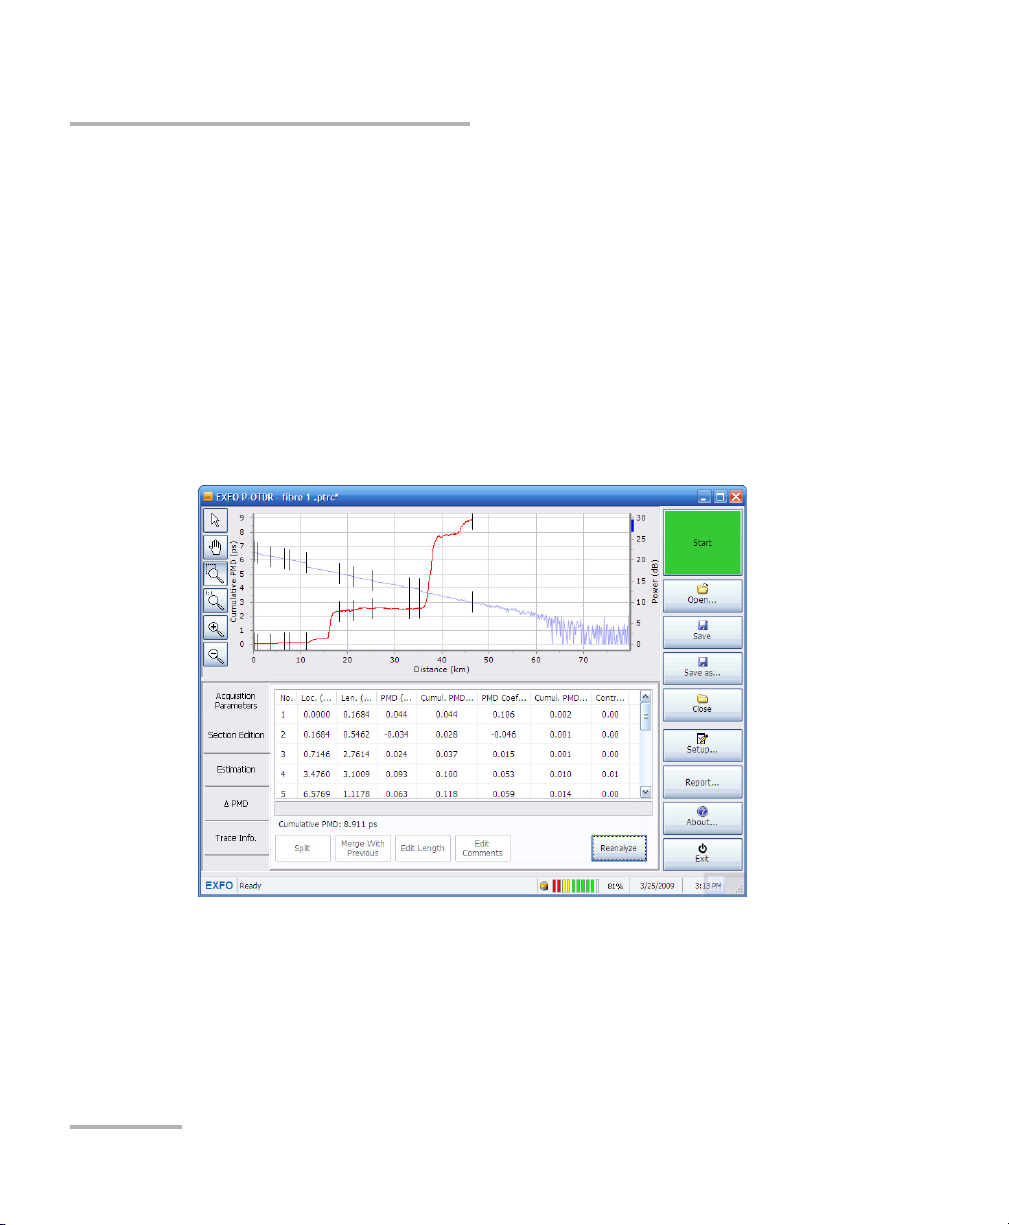
To work with the PMD estimation table:
1. From the main window, select the Estimation tab.
2. Select the row for which you want to change a value by pressing on it
once.
3. Modify the PMD or PMD coefficient values, as desired.
4. Press Apply to se the changes to the link.
To revert to the original values for the selected row, press Restore.
84 FTB-5600
Page 91

Managing Results
Viewing Trace Information
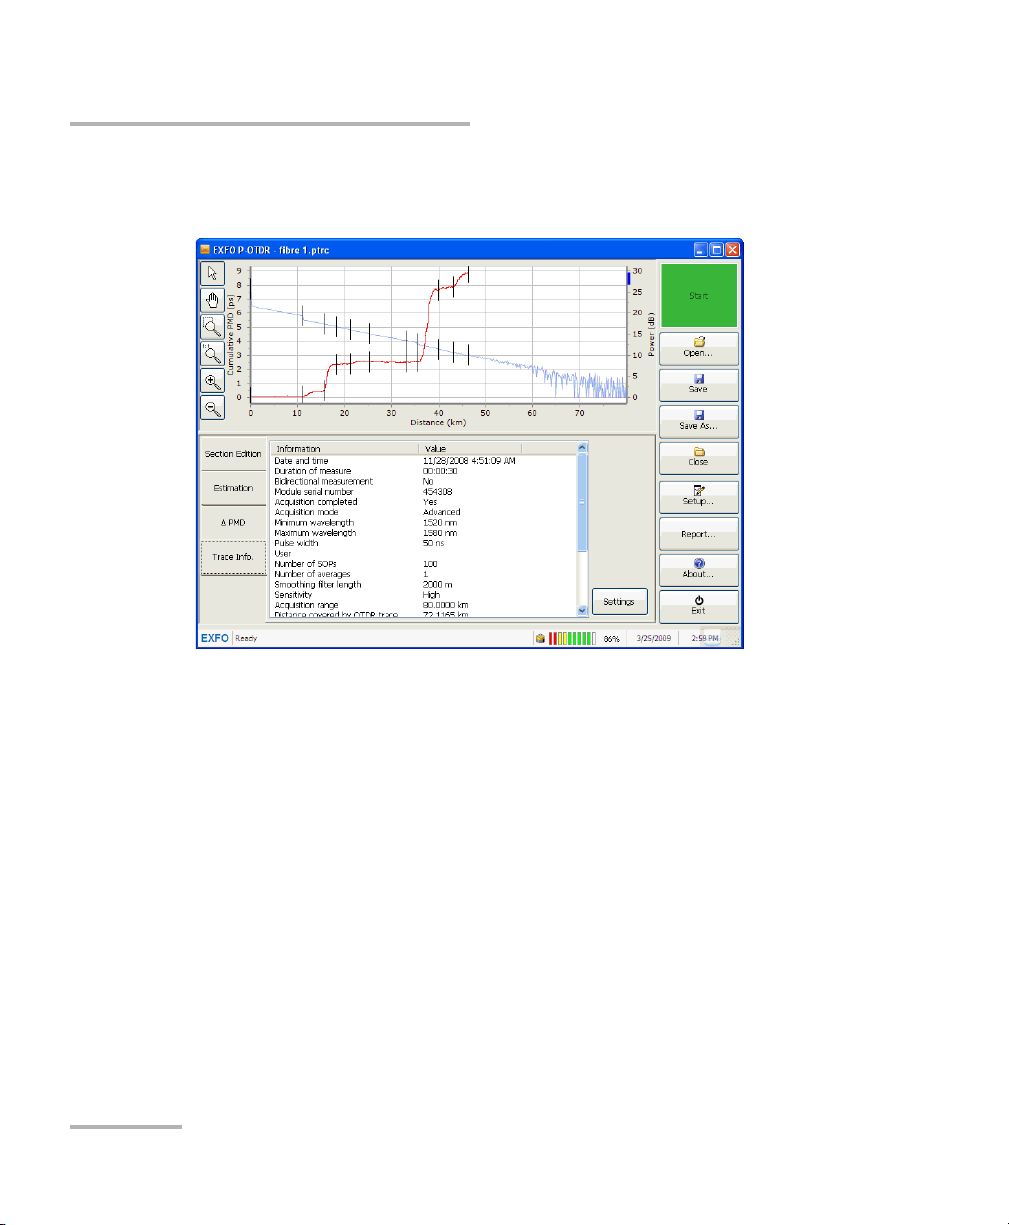
Viewing Trace Information
Once your acquisition is complete, you can view the details about it in the
Trace Info. tab. This information can be useful for future reference, or to
perform other tests. For example, if you have performed a quick check on
a link, you can now use the distance value calculated by the OTDR to put in
a standard or advanced acquisition for the distance range value.
From the Trace Inf o. tab, you can also change the cable and job
information, reanalyze a trace and change the spatial smoothing filter.
Note: You can find more information about the spatial smoothing filter in Setting
up General Acquisition Parameters on page 21 and Use an Appropriate
Spatial Smoothing Filter Value on page 129.
IMPORTANT
Reanalyzing a trace or changing the spatial smoothing filter will
delete the current estimation table, all of the comments you may
have added, as well as the modifications and estimations you have
performed in the section table. If you want to retain this
information for further use, you must save it before reanalyzing the
trace.
Distributed PMD Analyzer 85
Page 92
Managing Results
Viewing Trace Information
To view the trace information:
From the main window, select the Trace Inf o. tab.
86 FTB-5600
Page 93

Managing Results
Viewing Trace Information
If you are viewing the trace information for a bidirectional trace file you
have created with the Bidirectional File Creator utility, the information you
see is that of the A -> B trace. However, some of the information is
displayed differently :
³ The minimum wavelength is that of both measurements.
³ The maximum wavelength is that of both measurements.
³ The maximum number of SOPs is that of both measurements.
³ The number of averagings is the maximum value of both
measurements.
³ The acquisition range is the maximum value of both measurements.
³ The PMD scale is the maximum value of both measurements.
³ The PMD resolution is the minimum value of both measurements.
³ The distance covered by the OTDR trace is the length of the link.
³ The distance covered by the PMD trace is the length analyzed in
bidirectional mode.
Distributed PMD Analyzer 87
Page 94

Managing Results
Viewing Trace Information
To change the cable and job information:
1. From the main window, select the Trace I nfo. tab.
2. Press Settings.
3. Select the Information tab.
88 FTB-5600
Page 95

Managing Results
Viewing Trace Information
4. Enter information as desired. If you have already entered some
information in the Cable Information window as explained in Setting
up Cable Information on page 31, it will already be in the
corresponding boxes.
5. Press Apply to use the new information, then Close to exit the window.
To perform a new analysis on a trace:
1. From the main window, select the Trace I nfo. tab.
2. Press Settings.
Distributed PMD Analyzer 89
Page 96

Managing Results
Viewing Trace Information
3. Select the Analysis tab.
4. Press Reanalyze.
5. Press Close to return to the application.
90 FTB-5600
Page 97

Viewing Trace Information
To change the spatial smoothing filter:
1. From the main window, select the Trace I nfo. tab.
2. Press Settings.
Managing Results
3. Select the Analysis tab.
Distributed PMD Analyzer 91
Page 98

Managing Results
Viewing Trace Information
4. Change the filter value to the desired value in the list.
5. Press Apply to use this new value, then Close to exit the window.
92 FTB-5600
Page 99

Managing Results
Generating Reports
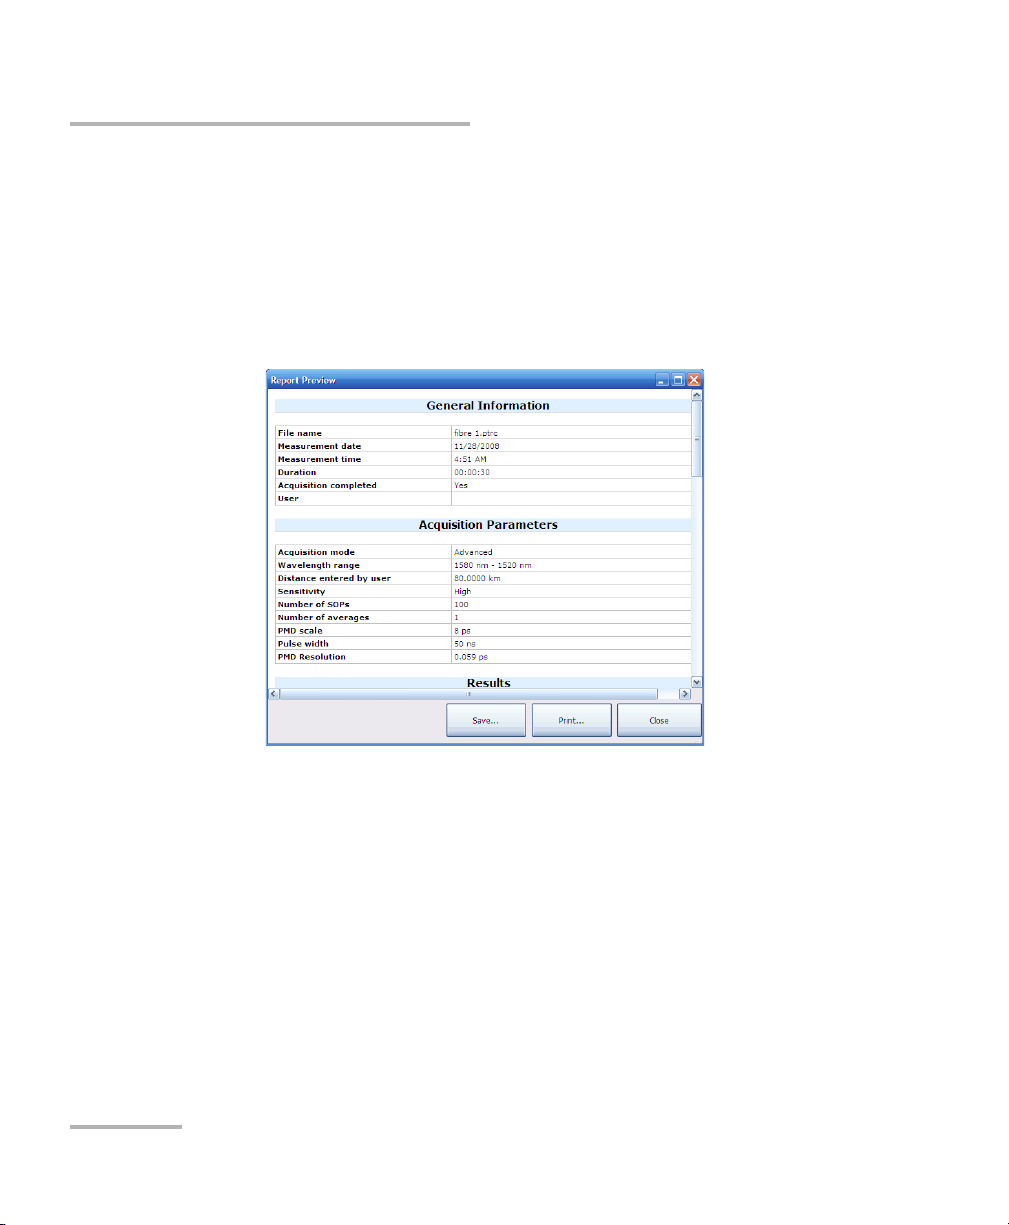
Generating Reports
Once your trace is cleaned up and that your measurements are optimized,
you can generate a report. This report can then be printed, or saved for
future consultation.
To generate a report:
1. From the main window, press Report.
Distributed PMD Analyzer 93
Page 100
Managing Results
Generating Reports
2. In the Report Preview window, select what you want to do:
³ Press Save to store the file. A standard Save As window opens to
³ Press Print to send the document to your printer. A standard Print
³ Press Close to return to the main window.
let you select a name and location.
window opens to let you select the printing options.
94 FTB-5600
 Loading...