

Page 1
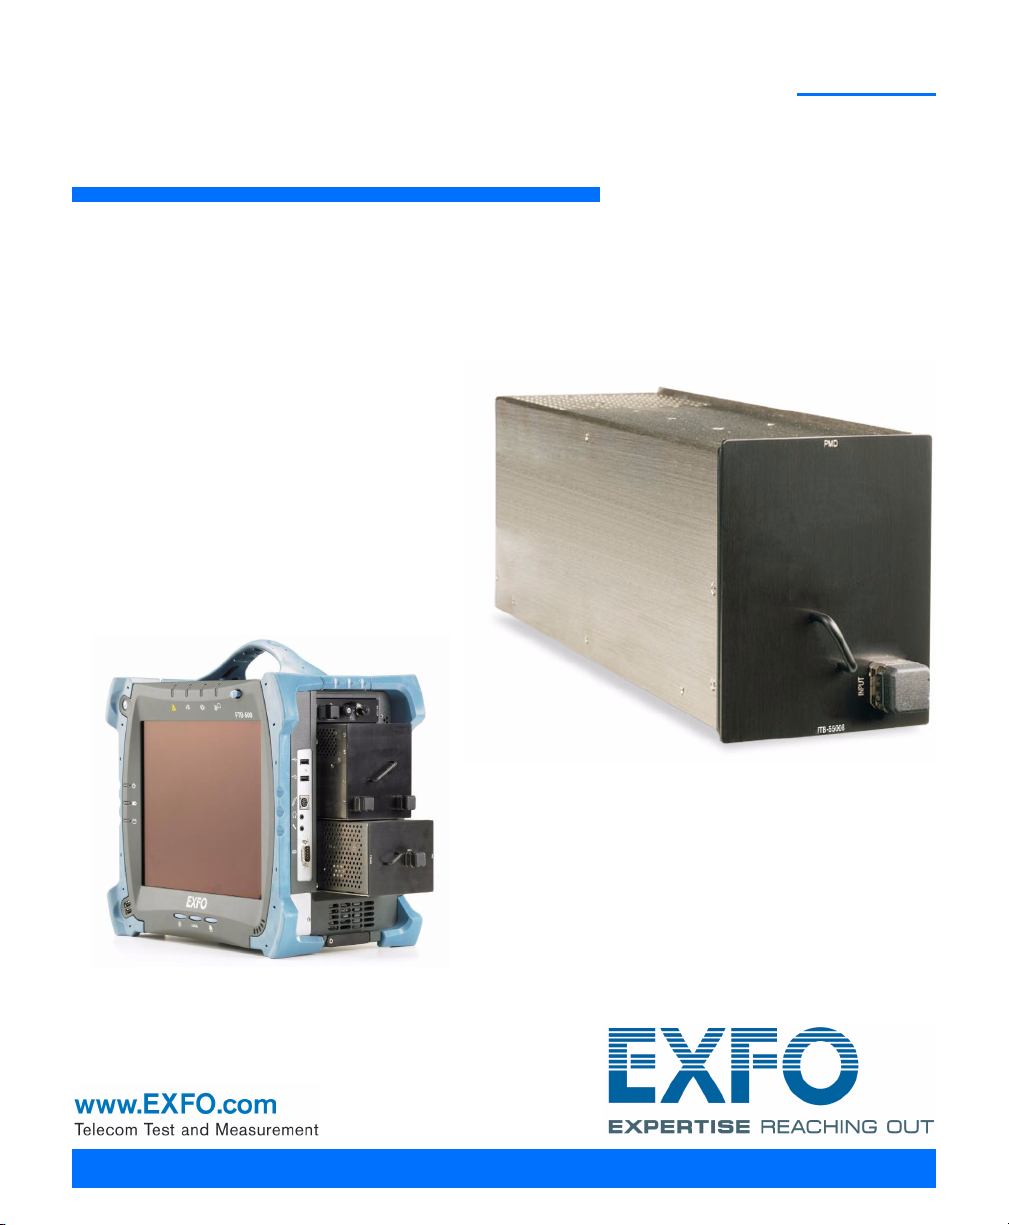
FTB-5500B
PMD Analyzer for FTB-500
User Guide
Page 2

Copyright © 2003–2009 EXFO Electro-Optical Engineering Inc. All rights
reserved. No part of this publication may be reproduced, stored in a
retrieval system or transmitted in any form, be it electronically,
mechanically, or by any other means such as photocopying, recording or
otherwise, without the prior written permission of EXFO Electro-Optical
Engineering Inc. (EXFO).
Information provided by EXFO is believed to be accurate and reliable.
However, no responsibility is assumed by EXFO for its use nor for any
infringements of patents or other rights of third parties that may result from
its use. No license is granted by implication or otherwise under any patent
rights of EXFO.
EXFO’s Commerce And Government Entities (CAGE) code under the North
Atlantic Treaty Organization (NATO) is 0L8C3.
The information contained in this publication is subject to change without
notice.
Trademarks
EXFO’s trademarks have been identified as such. However, the presence
or absence of such identification does not affect the legal status of any
trademark.
Units of Measurement
Units of measurement in this publication conform to SI standards and
practices.
Patents
The Polarization Mode Dispersion Analyzer is the subject of International
PCT application, publication number WO 2004/070341; EXFO’s Universal
Interface is protected by US patent 6,612,750.
Version number 4.0.1
ii FTB-5500B
Page 3

Contents
Contents
Certification Information ....................................................................................................... vi
1 Introducing the FTB-5500B Polarization Mode Dispersion Analyzer ......... 1
Main Features .........................................................................................................................1
Typical Applications ................................................................................................................2
Basic Polarization Mode Dispersion Theory .............................................................................3
Conventions ............................................................................................................................6
2 Safety Information ....................................................................................... 7
3 Getting Started with Your Polarization Mode Dispersion Analyzer .......... 9
Inserting and Removing Test Modules ....................................................................................9
Starting the Polarization Mode Dispersion Analyzer Application ..........................................13
Exiting the Application .........................................................................................................17
4 Setting Up the Polarization Mode Dispersion Analyzer ........................... 19
Defining the Automatic Fiber Name Format .........................................................................19
Customizing PMD Value and Coefficient Thresholds .............................................................20
Setting Acquisition Parameters .............................................................................................24
Preparing for Multiple Acquisitions on a Fiber ......................................................................28
Averaging Measurements .....................................................................................................31
5 Operating the Polarization Mode Dispersion Analyzer ............................ 33
Cleaning and Connecting Optical Fibers ...............................................................................33
Installing the EXFO Universal Interface (EUI) .........................................................................34
Setting Up Hardware for Measurements ...............................................................................36
Acquiring Traces ...................................................................................................................39
Performing a Null Measurement ...........................................................................................41
Viewing the Input Power Level .............................................................................................42
Polarization Mode Dispersion Analyzer iii
Page 4

Contents
6 Managing Results .......................................................................................43
Customizing Graph View ......................................................................................................43
Viewing Acquisition Results and Information .......................................................................44
Removing Unwanted Results ................................................................................................49
Viewing Statistics ..................................................................................................................51
Linking Distinct Fibers to a Single Fiber ................................................................................54
Creating New Result Files with Selected Fibers .....................................................................56
Documenting Results ............................................................................................................58
Defining a Template for Test Information ..............................................................................62
Saving Results Files ...............................................................................................................63
Exporting Results and Graphs ...............................................................................................64
Customizing Reports .............................................................................................................67
Printing Data ........................................................................................................................69
Closing Result Files ...............................................................................................................72
7 Exporting PMD Files with the File Converter ............................................73
Starting and Exiting the File Converter .................................................................................74
Setting Export Parameters ....................................................................................................76
Exporting PMD Files ..............................................................................................................78
8 Maintenance ................................................................................................81
Cleaning Fixed Connectors ....................................................................................................82
Cleaning EUI Connectors ......................................................................................................84
Recalibrating the Unit ...........................................................................................................86
Recycling and Disposal (Applies to European Union Only) ....................................................87
9 Troubleshooting ..........................................................................................89
Solving Common Problems ...................................................................................................89
Viewing Online Documentation ............................................................................................92
Contacting the Technical Support Group ..............................................................................93
Transportation ......................................................................................................................94
10 Warranty ......................................................................................................95
General Information .............................................................................................................95
Liability .................................................................................................................................96
Exclusions .............................................................................................................................97
Certification ..........................................................................................................................97
Service and Repairs ...............................................................................................................98
EXFO Service Centers Worldwide ..........................................................................................99
A Technical Specifications ............................................................................101
iv FTB-5500B
Page 5

Contents
B Using Third-Party Broadband Light Sources ........................................... 103
Compliance Criteria ............................................................................................................103
Uncertainty Formula ...........................................................................................................105
Index .............................................................................................................. 107
Polarization Mode Dispersion Analyzer v
Page 6

Certification Information
Certification Information
F.C.C. Information
Electronic test equipment is exempt from Part 15 compliance (FCC) in
the United States. However, compliance verification tests are
systematically performed on most EXFO equipment.
Information
Electronic test equipment is subject to the EMC Directive in the European
Union. The EN61326 standard prescribes both emission and immunity
requirements for laboratory, measurement, and control equipment.
This unit has undergone extensive testing according to the European Union
Directive and Standards.
vi FTB-5500B
Page 7

Certification Information
DECLARATION OF CONFORMITY
Application of Council Directive(s): 2006/95/EC - The Low Voltage Directive
Manufacturer’s Name: EXFO Electro-Optical Engineering Inc.
Manufacturer’s Address: 400 Godin Avenue
Quebec, Quebec
(418) 683-0211
Equipment Type/Environment: Test & Measurement / Industrial
Trade Name/Model No.: FTB-5500B
Standard(s) to which Conformity is Declared:
EN 61010-1:2001 Safety Requirements for Electrical Equipment for Measurement,
EN 61326-1:2006 Electrical Equipment for Measurement, Control and Laboratory
EN 60825-1:1994 +A2:2001
+A1:2002
EN 55022: 1998 +A2: 2003 Information technology equipment - Radio disturbance
I, the undersigned, hereby declare that the equipment specified above conforms to the above Directive and Standards.
Manufacturer
Signature:
Control, and Laboratory Use, Part 1: General Requirements.
Use - EMC Requirements – Part 1: General requirements
Safety of laser products – Part 1: Equipment classification,
requirements, and user’s guide
characteristics - Limits and methods of measurement
2004/108/EC - The EMC Directive
And their amendments
Canada, G1M 2K2
PMD Analyzer
Full Name: Stephen Bull, E. Eng
Position: Vice-President Research and
Address: 400 Godin Avenue, Quebec (Quebec),
Date: January 09, 2009
Development
Canada, G1M 2K2
Polarization Mode Dispersion Analyzer vii
Page 8

Page 9

1 Introducing the FTB-5500B
Polarization Mode Dispersion
Analyzer
Main Features
Polarization mode dispersion (PMD) is the dispersion of light propagating
along a fiber or through a device due to the birefringence property of the
material. This dispersion causes a delay between two principal states of
polarization
The FTB-5500B Polarization Mode Dispersion Analyzer takes full advantage
of the IEC- and TIA-approved interferometric method to offer a fast and
field-proof unit that can handle almost any situation. This unit, used with
the FLS-5800 CD/PMD Analyzer Source, features the best dynamic range on
the market to measure links longer than 200 km. The Polarization Mode
Dispersion Analyzer covers the O+C+L bandwidth.
The FTB-5500B Polarization Mode Dispersion Analyzer offers a dynamic
range higher than 50 dB for long-haul applications; multiple-measurement
capability for long-term monitoring; and an estimated second-order PMD
for DWDM system fiber certifications.
Polarization Mode Dispersion Analyzer 1
Page 10
Introducing the FTB-5500B Polarization Mode Dispersion Analyzer
Typica l A p p l i cations
The FTB-5500B Polarization Mode Dispersion Analyzer is a complete PMD
analyzer system. It measures PMD using the internationally recognized
interferometric method. The Polarization Mode Dispersion Analyzer
averages PMD over the complete source wavelength range without any
filtering, leaving all the source power for PMD measurement. The full
dynamic range remains available to test long fiber spans. It can withstand
small vibrations thanks to its fast measurement time and does not require
any special environmental setup to perform reliable measurements.
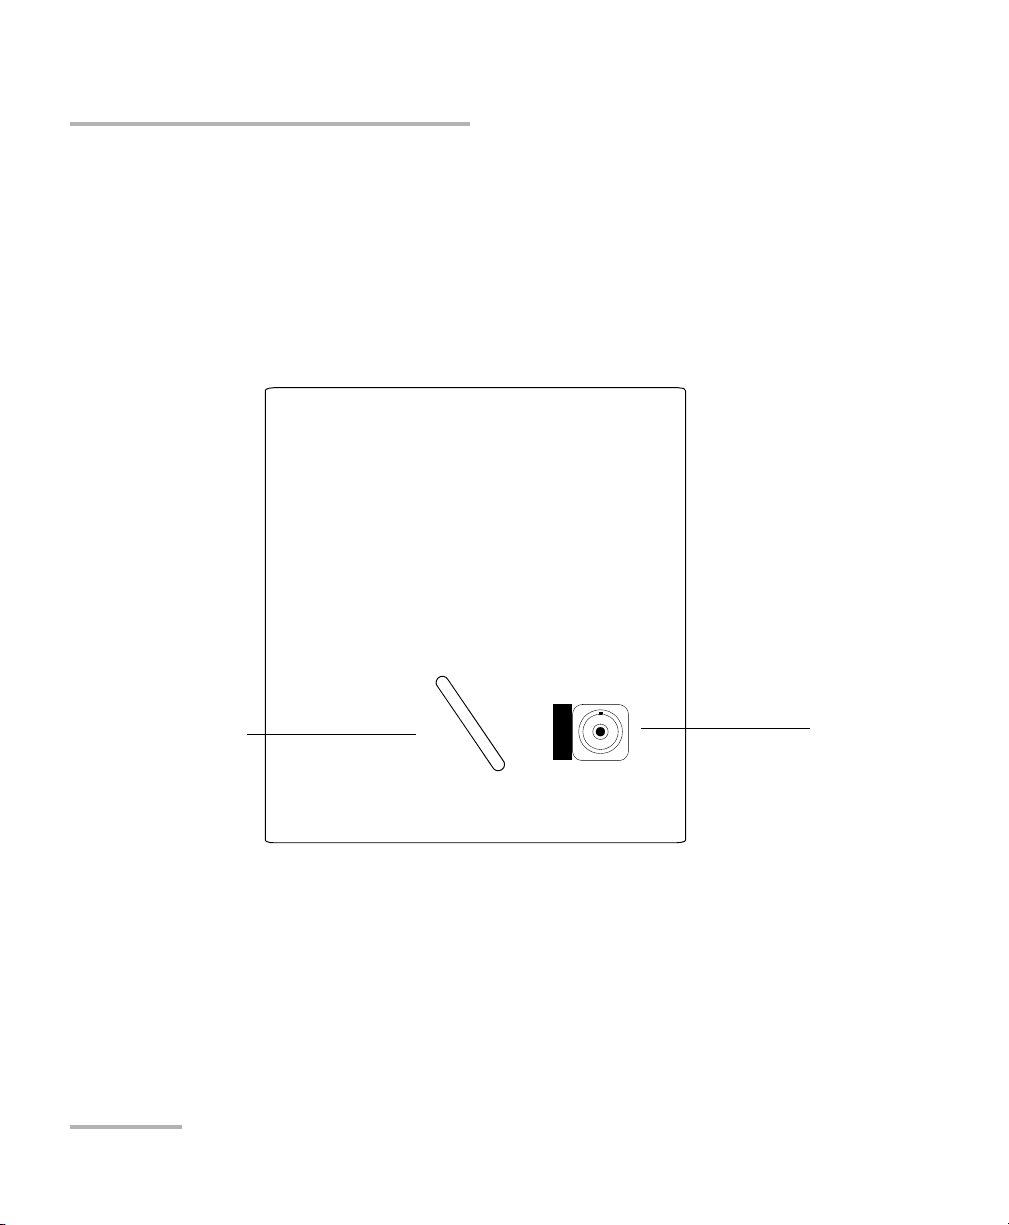
PMD
Handle
FTB-5500B
Port
Typical Applications
The Polarization Mode Dispersion Analyzer can also analyze a signal
transmitted through erbium-doped fiber amplifiers (EDFAs) providing a
total PMD value for the entire link.
2 FTB-5500B
Page 11

Introducing the FTB-5500B Polarization Mode Dispersion Analyzer
Basic Polarization Mode Dispersion Theory
Basic Polarization Mode Dispersion Theory
The dispersion phenomenon is described as a number of
non-intensity-dependant physical occurrences resulting directly in signal
loss (pulse spreading or time jitter in a digital system; distortion in an
analog system). PMD is an important type of signal dispersion. As
unrepeated link distances are increased and transmission rates pushed
upwards, PMD can significantly reduce system performance.
To better understand the impact of PMD, consider the example of a pulse
passing through a wave plate. Upon entering the wave plate, the pulse is
decomposed into polarization components aligned with each of the two
birefringent axes of the plate (known as the fast and slow axes). The
components propagating independently through the wave plate at different
group velocities will recombine at the end of the wave plate as a
superposition of two pulses split in time.
The delay between those pulses is designated as the differential group
delay (DGD) and is written as δτ. For a Gaussian, unchirped input pulse
of rms width σ0, the rms width at the output is given by
2
2
σ
= σ
+ r0 (1 − r0)•δτ
0
where r0 is the fraction of the input-pulse energy launched into one of the
birefringence axes.
2
Worst-case spreading occurs when the signal is perfectly split in two
(r0 = 1/2), while no spreading occurs if the input state of polarization
(SOP) of the launched signal is aligned with one of the birefringence axes.
To generalize this example, consider a long, weakly birefringent
telecommunications fiber as a concatenation of many, randomly
orientated birefringent wave plates. Each interface between two wave
plates redistributes the optical energy along both axes of the subsequent
wave plate. This transfer of energy is called mode coupling.
Polarization Mode Dispersion Analyzer 3
Page 12

Introducing the FTB-5500B Polarization Mode Dispersion Analyzer
Basic Polarization Mode Dispersion Theory
In a long fiber, numerous mode-coupling events occur along the fiber
length, so that light emerging from the output end is the superposition of a
number of pulses with different delays. Nonetheless, it turns out that for
any given optical frequency,
principal states of polarization (PSPs) such that a light pulse with the same
input SOP as the input PSP, undergoes no spreading. For a single wave
plate, the PSPs are the two birefringent axes, whereas for a concatenation
of wave plates, neither the input nor the output PSPs correspond to the
alignment of the birefringent axes anywhere.
Contrary to the case of a wave plate, the DGD and PSPs of a long fiber are
dependent on wavelength and fluctuate in time as a result of
environmental variations such as temperature, external mechanical
constraints, etc. Their behavior is random, both as a function of wavelength
at a given time and as a function of time at a given wavelength. Fortunately,
this behavior can be characterized statistically. It can be demonstrated that
the probability density function of δτ is Maxwellian and, by definition, PMD
is its rms value, that is:
ω, one can always find two orthogonal input
PMD =
Note: PMD is sometimes defined as the mean value of the DGD, which for a
Maxwellian distribution yields a value 17% lower than the rms definition.
If the average is calculated over
averaging window is sufficiently large (
4 FTB-5500B
√<DGD2>
ω, PMD is stable in time, provided that the
Δωδτ >> 1).
Page 13

Introducing the FTB-5500B Polarization Mode Dispersion Analyzer
Basic Polarization Mode Dispersion Theory
It is essential to keep in mind that DGD fluctuates in time and can be either
smaller or larger than its rms value or PMD. This results in a statistical
probability that a pulse (information bit) is broadened, and leads to the
eventual impaired ability of the receiver to efficiently decode the
information. This adverse PMD effect makes it a critical phenomenon in
limiting transmission of high-bit-rate information.
In the case of PMD in a long fiber, there is a specific state called input PSP.
In this state, when the input SOP of the signal is aligned with one of its
axes, it will propagate through the fiber without any spreading or distortion
of the signal. This phenomenon is defined as this specific input SOP such
that the output SOP is independent of optical frequency. Again, the worst
case occurs when the signal is equally split between both input PSPs.
For long telecom fibers with random coupling of energy between modes
(that is L >> h where h is the coupling length), PMD grows as the square
root of the distance, whereas PMD of strong HiBi fiber (negligible mode
coupling) is directly proportional to the distance. Therefore, the PMD
coefficient for negligible mode coupling is expressed as ps/km, while
the PMD coefficient for random mode coupling is defined as ps/km
1/2
.
Polarization Mode Dispersion Analyzer 5
Page 14

Introducing the FTB-5500B Polarization Mode Dispersion Analyzer
Conventions
Conventions
Before using the product described in this manual, you should understand
the following conventions:
WARNING
Indicates a potentially hazardous situation which, if not avoided,
could result in death or serious injury. Do not proceed unless you
understand and meet the required conditions.
CAUTION
Indicates a potentially hazardous situation which, if not avoided,
may result in minor or moderate injury. Do not proceed unless you
understand and meet the required conditions.
CAUTION
Indicates a potentially hazardous situation which, if not avoided,
may result in component damage. Do not proceed unless you
understand and meet the required conditions.
IMPORTANT
Refers to information about this product you should not overlook.
6 FTB-5500B
Page 15
2 Safety Information
WARNING
Do not install or terminate fibers while a light source is active.
Never look directly into a live fiber and ensure that your eyes are
protected at all times.
WARNING
Use of controls, adjustments and procedures for operation and
maintenance other than those specified herein may result in
hazardous radiation exposure or impair the protection provided by
this unit.
Your instrument is a Class 1 laser product in compliance with standards
IEC60825-1: 2001, 2007 and 21CFR1040.10. Laser radiation may be
encountered at the output port.
The following label indicates that a product contains a Class 1 source:
CLASS 1
LASER PRODUCT
Note: Label shown for information purposes only. It is not affixed to your product.
Polarization Mode Dispersion Analyzer 7
Page 16

Page 17
3 Getting Started with Your
Polarization Mode Dispersion
Analyzer
Inserting and Removing Test Modules
CAUTION
Never insert or remove a module while the FTB-500 is turned on.
This will result in immediate and irreparable damage to both the
module and unit.
WARNING
When the laser safety LED ( ) is flashing on the FTB-500, at least
one of your modules is emitting an optical signal. Please check all
modules, as it might not be the one you are currently using.
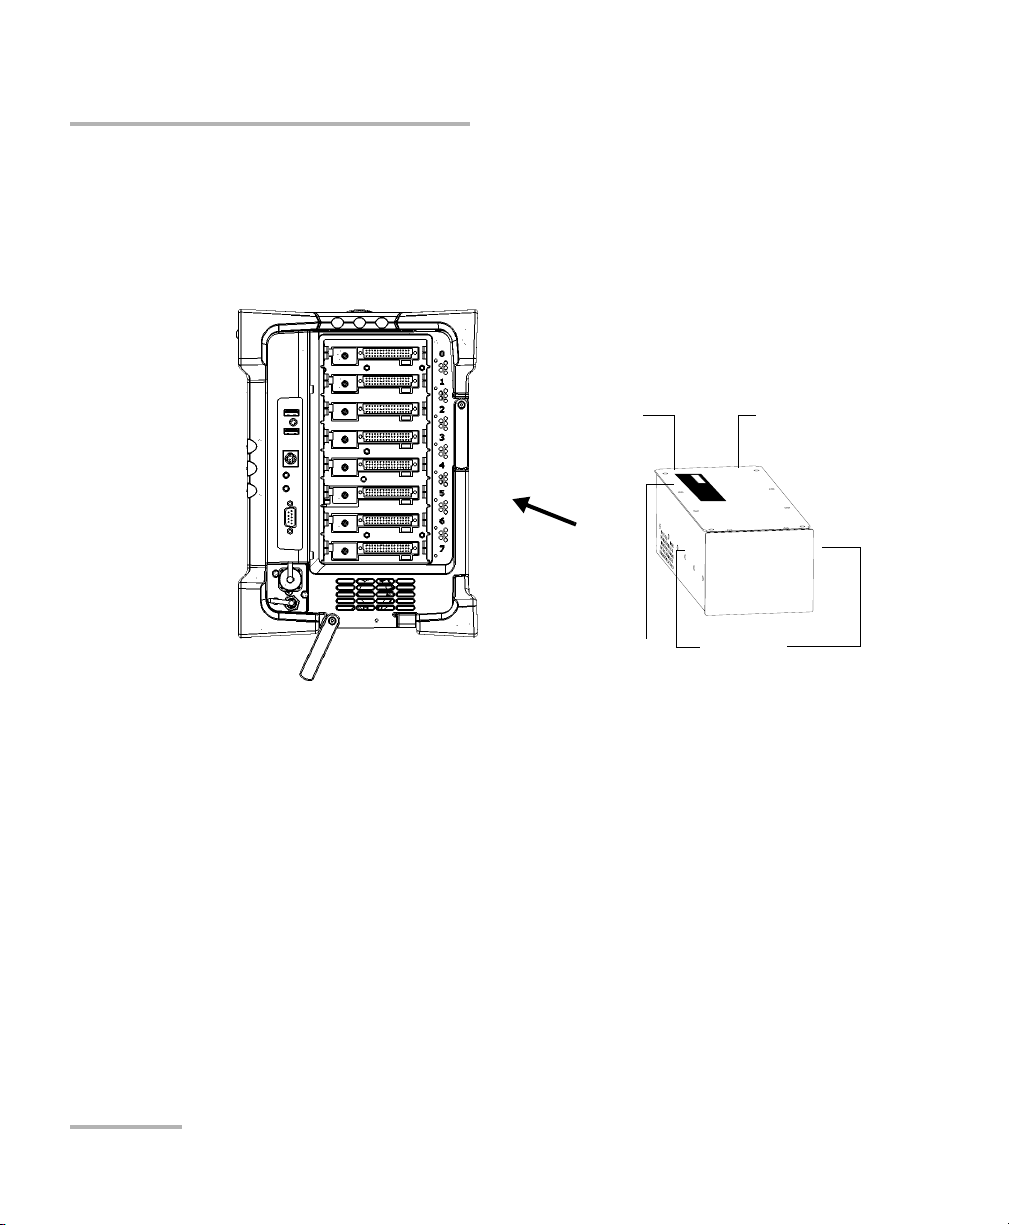
To insert a module into the FTB-500:
1. Exit ToolBox and turn off your unit.
2. Position the FTB-500 so that its right panel is facing you.
Polarization Mode Dispersion Analyzer 9
Page 18
Getting Started with Your Polarization Mode Dispersion Analyzer
Inserting and Removing Test Modules
3. Take the module and place it so that the connector pins are at the
back, as explained and shown below.
Identification sticker must be facing up and connector pins at the right
of the retaining screw hole.
FTB-500 right panel
4. Insert the protruding edges of the module into the grooves of the
5. Push the module all the way to the back of the slot, until the retaining
6. Place the FTB-500 so that its left panel is facing you.
Retaining screw
hole at the
back
Identification sticker
facing up
receptacle’s module slot.
screw makes contact with the receptacle casing.
Connector
pins at the
back
Protruding
edges on top
10 FTB-5500B
Page 19
Getting Started with Your Polarization Mode Dispersion Analyzer
Inserting and Removing Test Modules
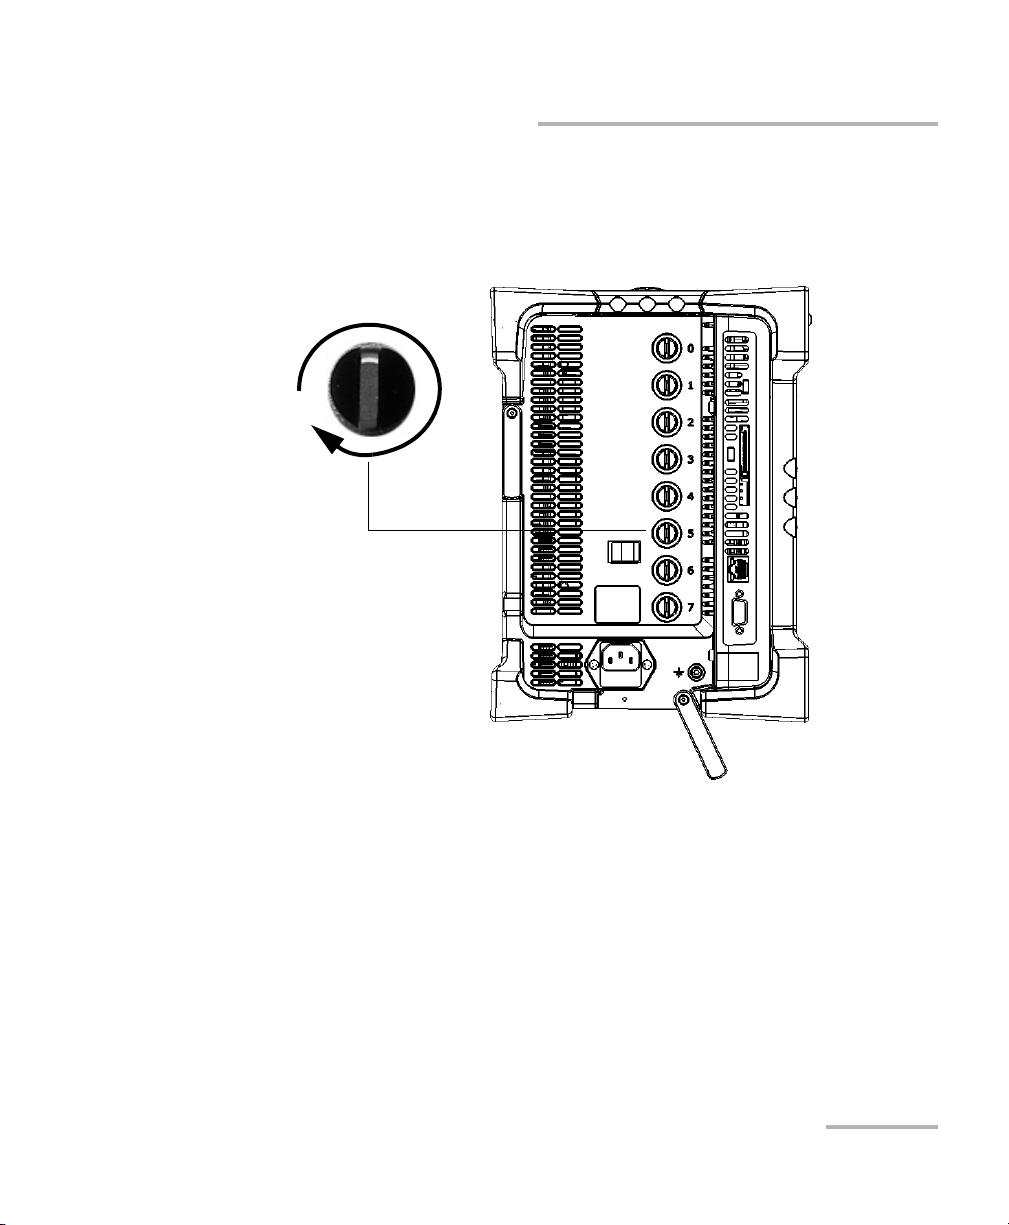
7. While applying slight pressure to the module, turn the retaining screw
clockwise until it is tightened.
This will secure the module into its “seated” position.
Turn retaining screw knob
clockwise
FTB-500 left panel
When you turn on the unit, the startup sequence will automatically detect
the module.
Polarization Mode Dispersion Analyzer 11
Page 20
Getting Started with Your Polarization Mode Dispersion Analyzer
Inserting and Removing Test Modules
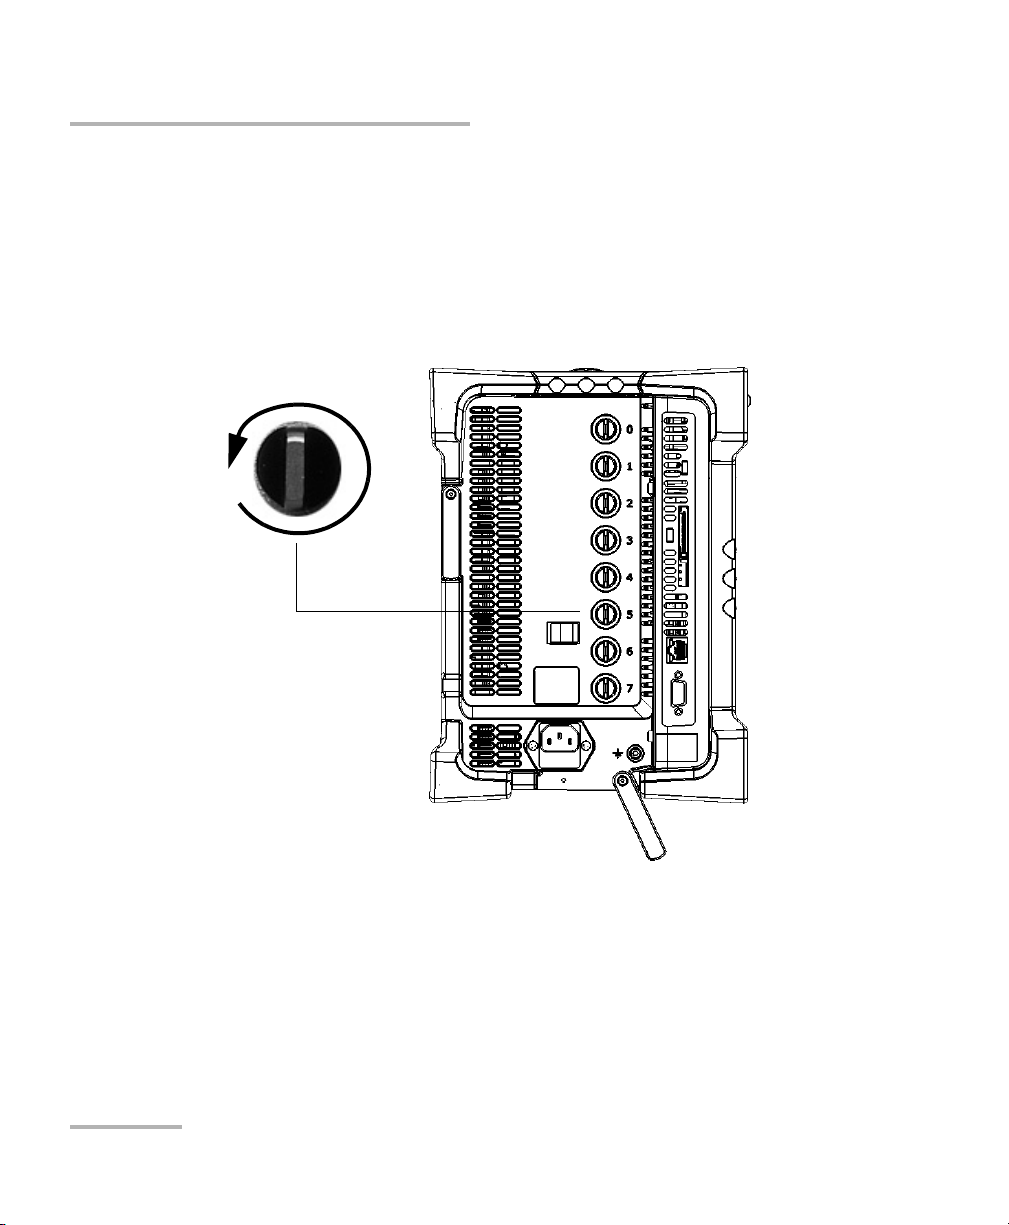
To remove a module from the FTB-500:
1. Exit ToolBox and turn off your unit.
2. Position the FTB-500 so that the left panel is facing you.
3. Turn the retaining screw counterclockwise until it stops.
The module will be slowly released from the slot.
Turn retaining screw knob(s)
counterclockwise
FTB-500 left panel
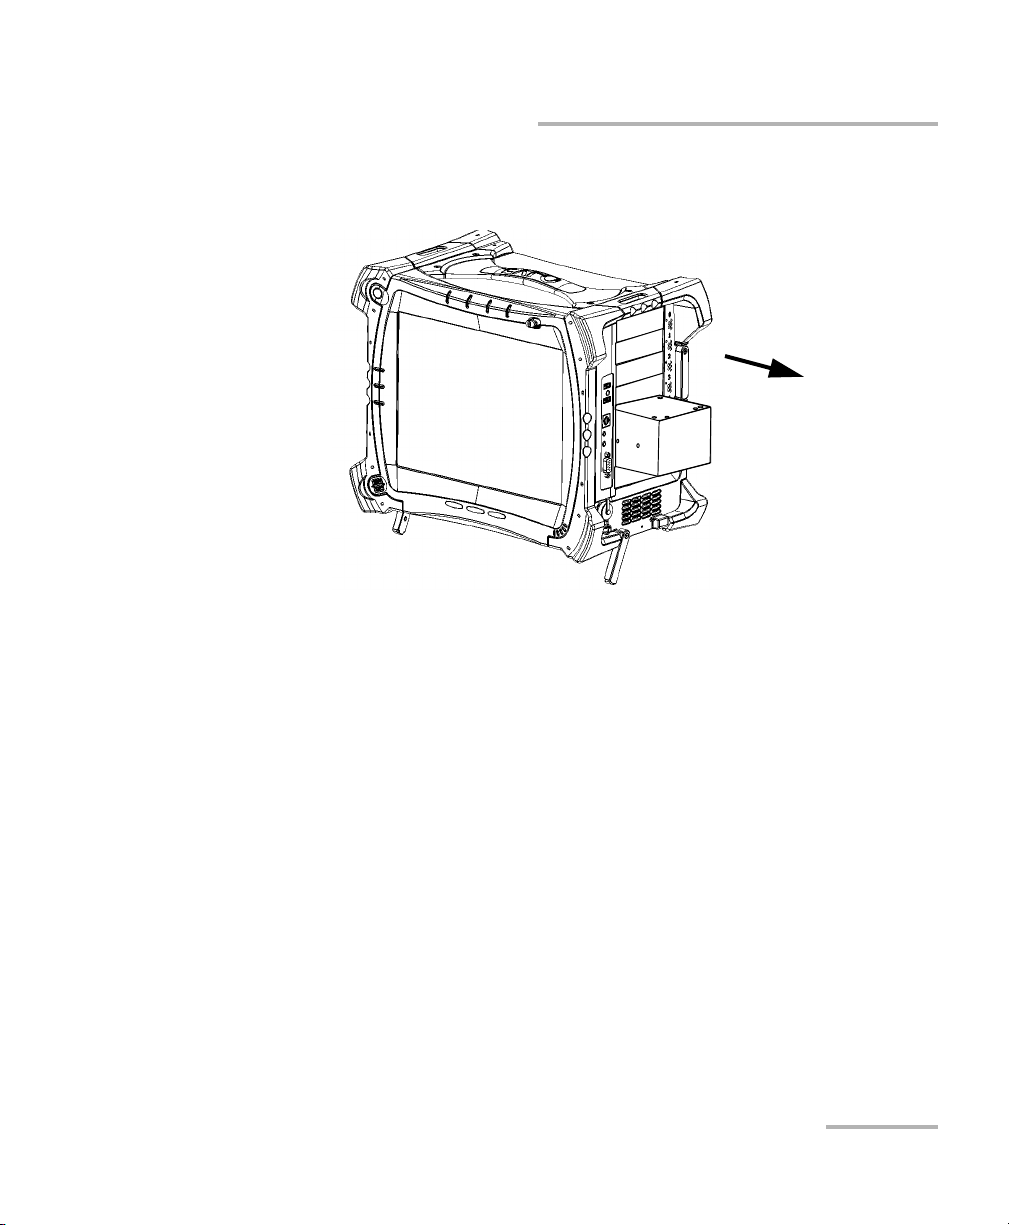
4. Place the FTB-500 so that the right panel is facing you.
12 FTB-5500B
Page 21
Getting Started with Your Polarization Mode Dispersion Analyzer
Inserting and Removing Test Modules
5. Hold the module by its sides or by the handle (NOT by the connector)
and pull it out.
Polarization Mode Dispersion Analyzer 13
Page 22
Getting Started with Your Polarization Mode Dispersion Analyzer
Starting the Polarization Mode Dispersion Analyzer Application
Starting the Polarization Mode Dispersion
Analyzer Application
Your FTB-5500B Polarization Mode Dispersion Analyzer module can be
configured and controlled from its dedicated ToolBox application.
Note: For details about ToolBox, refer to the FTB-500 user guide.
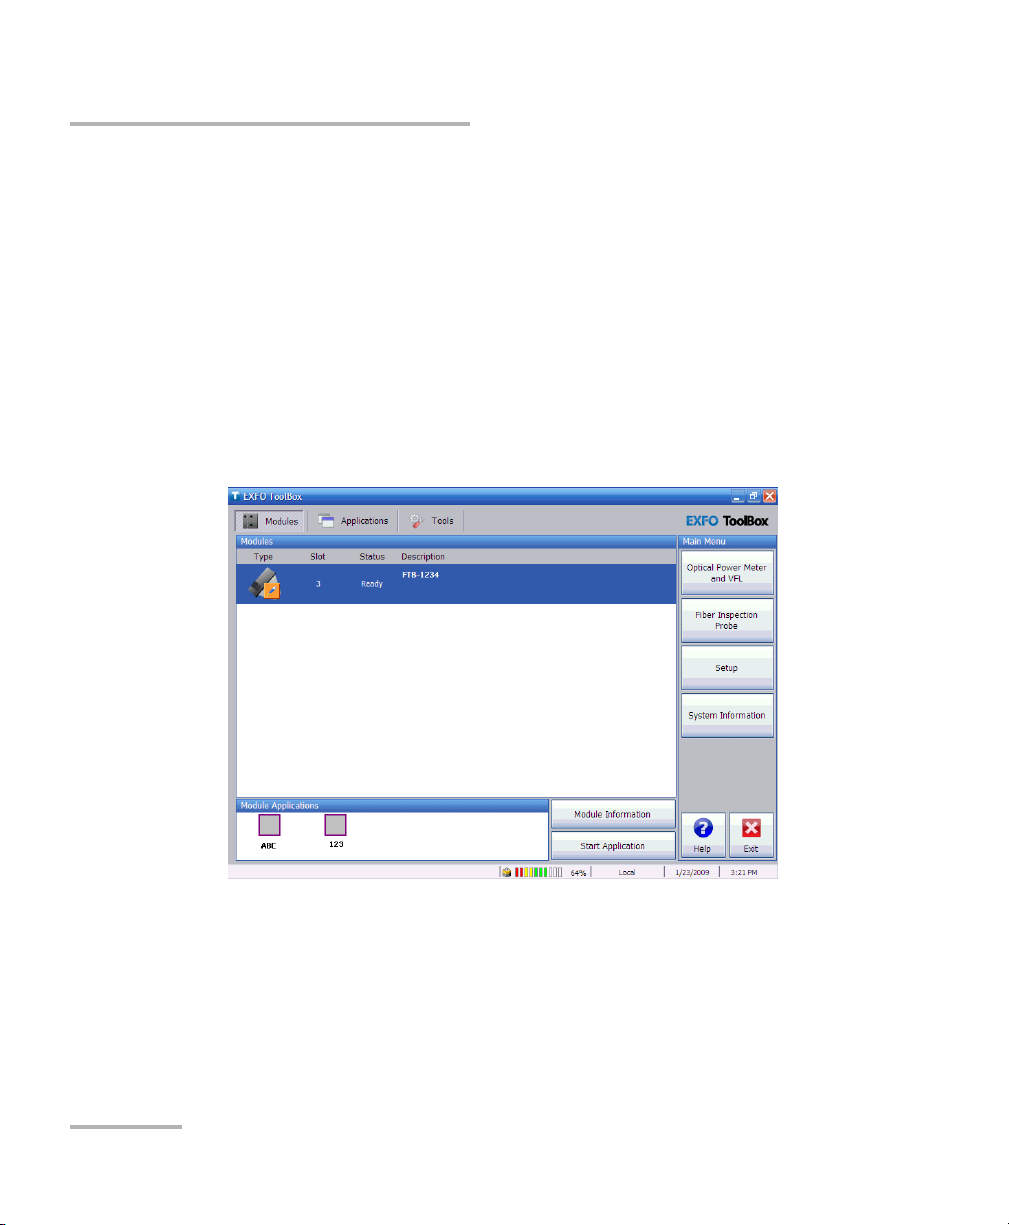
To start the application:
1. From the main window, select the module to use.
It will turn blue to indicate that it is highlighted.
2. Click the corresponding button in the Module Applications box.
14 FTB-5500B
Page 23
Getting Started with Your Polarization Mode Dispersion Analyzer
Starting the Polarization Mode Dispersion Analyzer Application
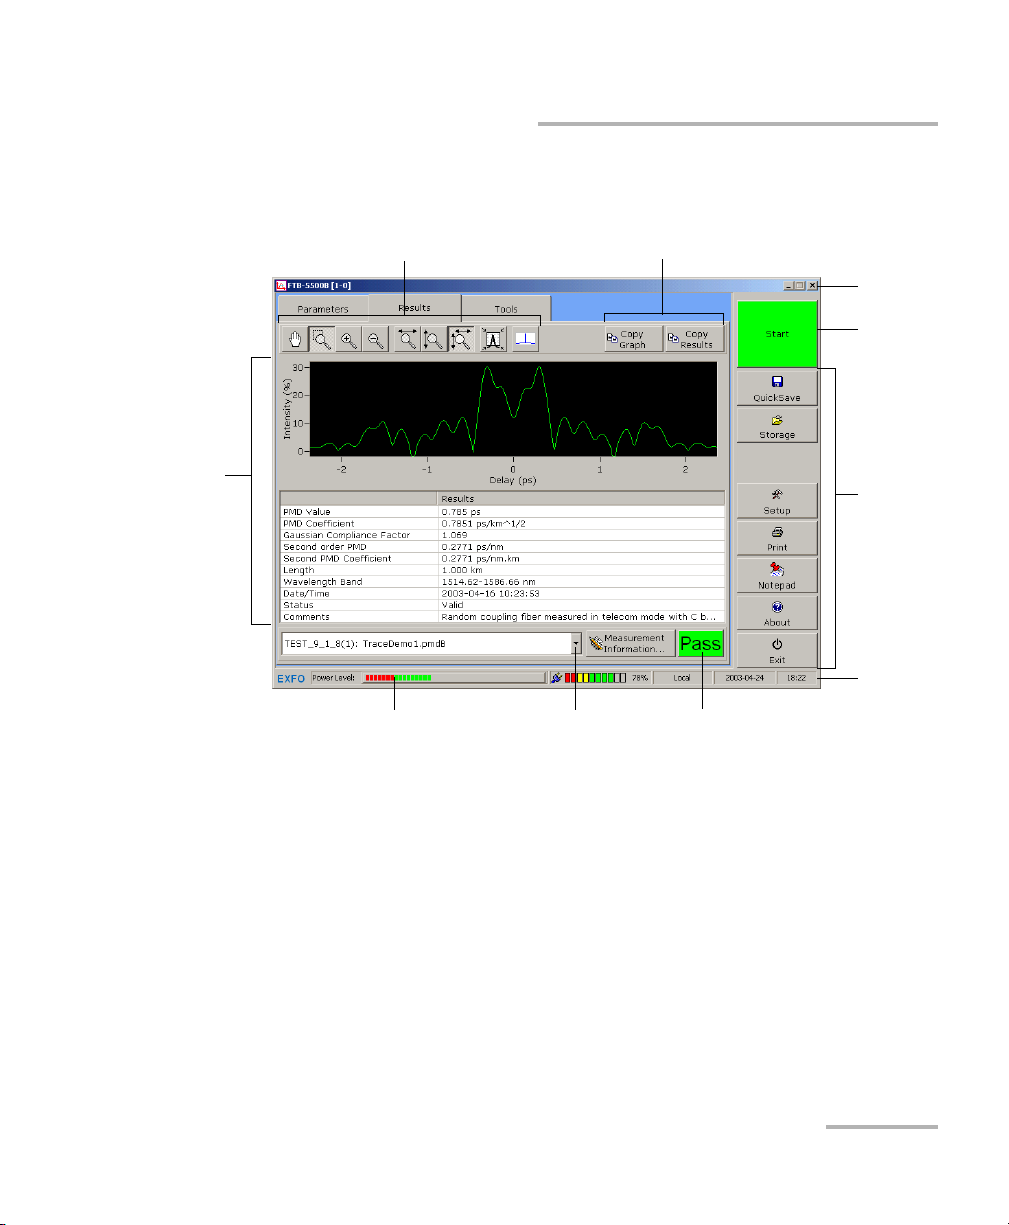
The main window (shown below) contains all the commands required to
control the Polarization Mode Dispersion Analyzer:
Data
display
Zoom controls
Power level
indicator
Measurement
selector
Export controls
Threshold indicator
specifies if measurement
exceeded value or not
Title bar
Start/Stop
button
Function
buttons
Status
bar
Polarization Mode Dispersion Analyzer 15
Page 24
Getting Started with Your Polarization Mode Dispersion Analyzer
Starting the Polarization Mode Dispersion Analyzer Application
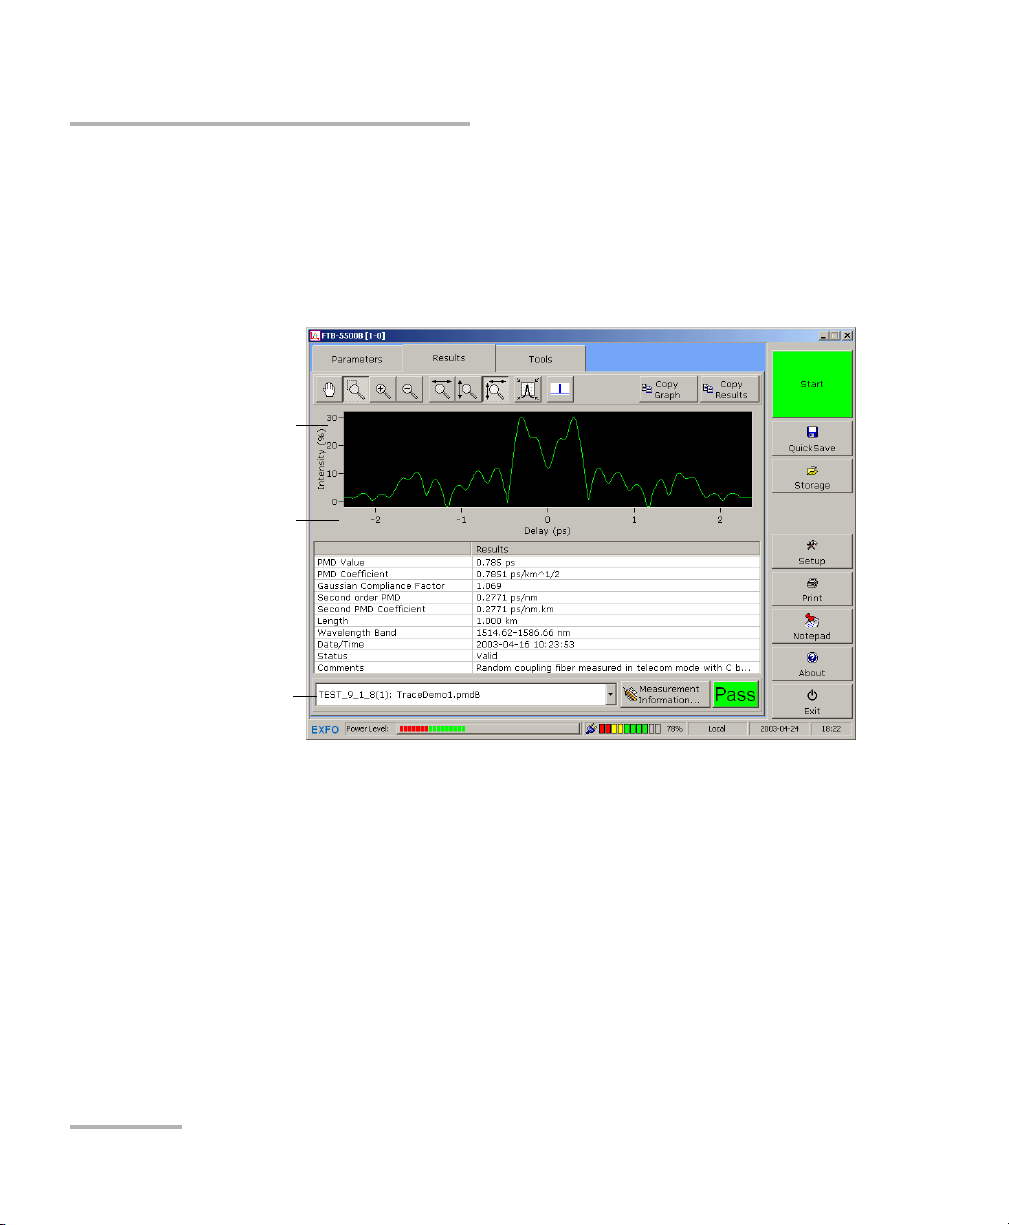
Data Display
The data display section shows both a graph and a table of results. The
graph presents a signal intensity trace as a function of delay. The table
presents information and results related to the measurement specified in
the measurement selector.
Signal
intensity in
percentage
PMD time
delay in
picoseconds
Measurement
selector
16 FTB-5500B
Page 25
Getting Started with Your Polarization Mode Dispersion Analyzer
Exiting the Application
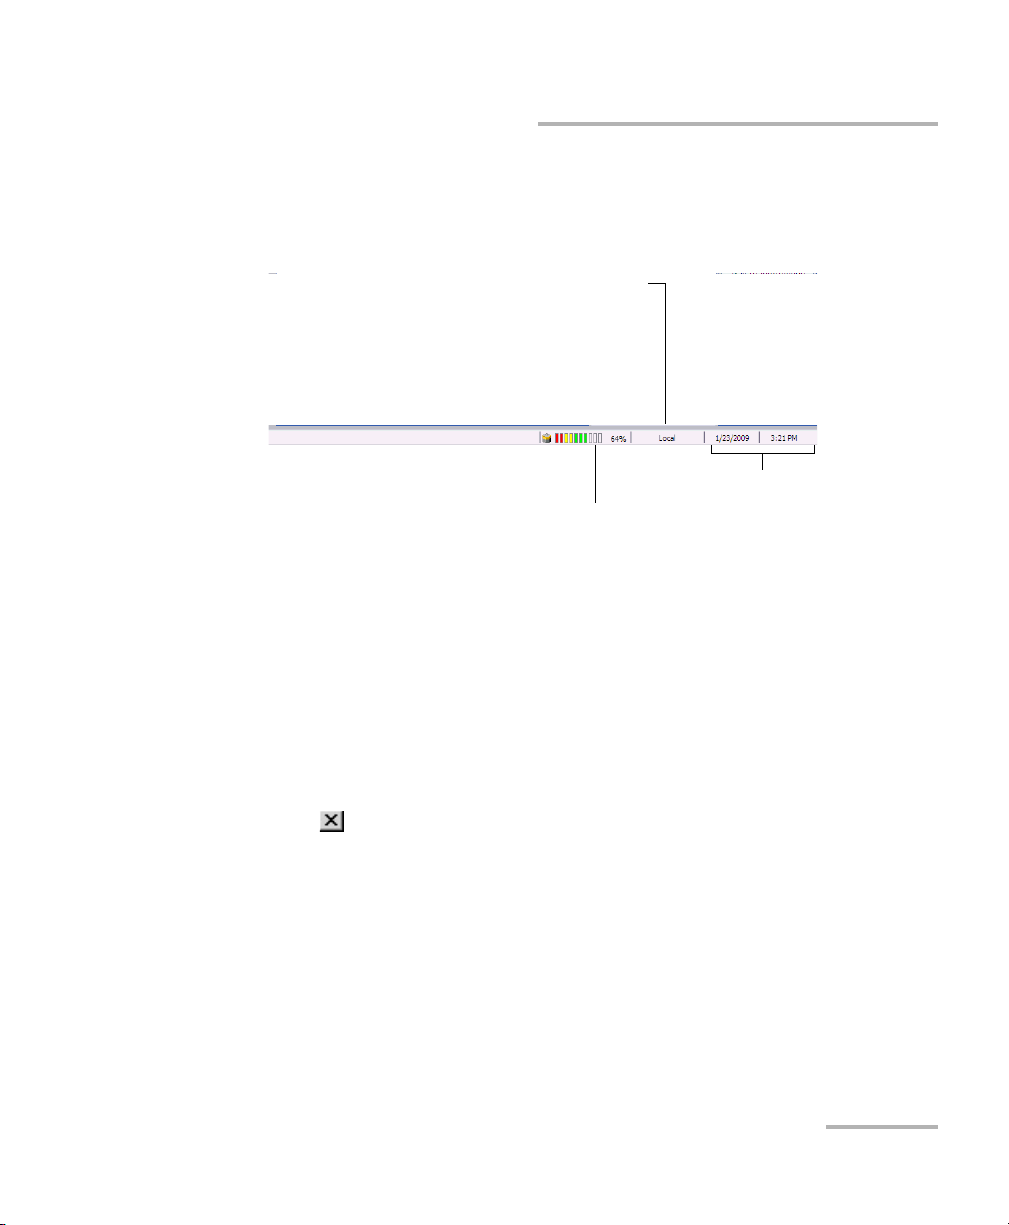
Status Bar
The status bar, located at the bottom of the main window, identifies the
operational status of the FTB-5500B Polarization Mode Dispersion Analyzer.
Control mode
Local: Module controlled locally only.
Remote: Module controlled remotely, but local
commands can also be used (some products only).
Lockout: Module controlled remotely only.
Current date and time
Battery indicator
For more information about automating or remotely controlling the
FTB-5500B Polarization Mode Dispersion Analyzer, refer to your platform
user guide.
Exiting the Application
Closing any application that is not currently being used helps freeing
system memory.
To close the application from the main window:
Click in the top right corner of the main window.
OR
Click the Exit button located at the bottom of the function bar.
Polarization Mode Dispersion Analyzer 17
Page 26

Page 27
4 Setting Up the Polarization
Mode Dispersion Analyzer
The many features of the Polarization Mode Dispersion Analyzer are
controlled by the Windows-compatible ToolBox software. Please refer to
the FTB-500 user guide for information regarding the FTB-500.
Defining the Automatic Fiber Name Format
Each time you make a new acquisition, the fiber name changes
automatically according to a pattern you will have previously defined. This
name corresponds to the concatenation of a static part (prefix) and a
variable part that will be incremented.
Note: The fiber name can be modified later with the measurement information
utility. For more information, see Documenting Results on page 58.
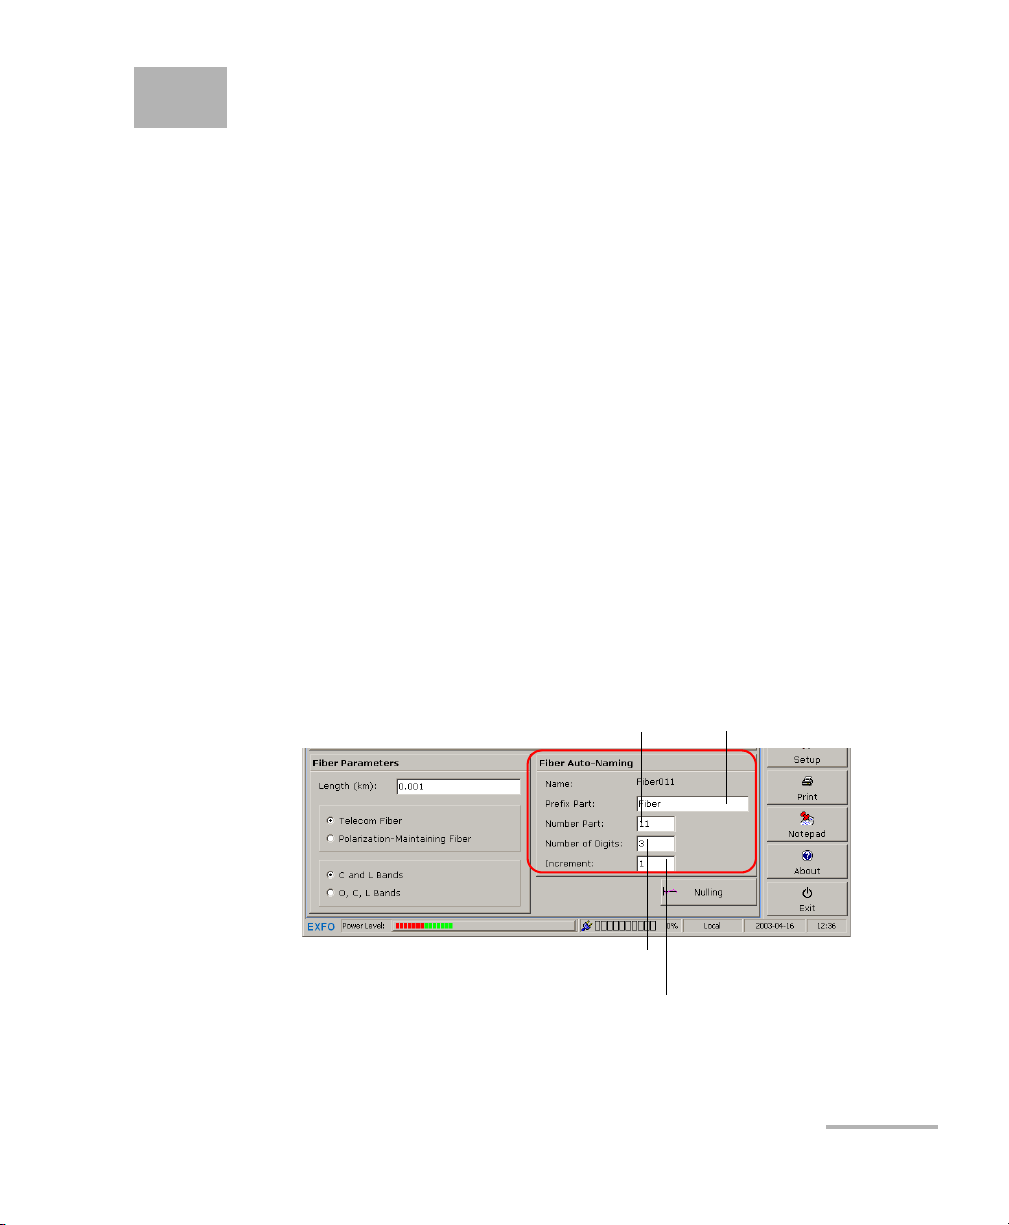
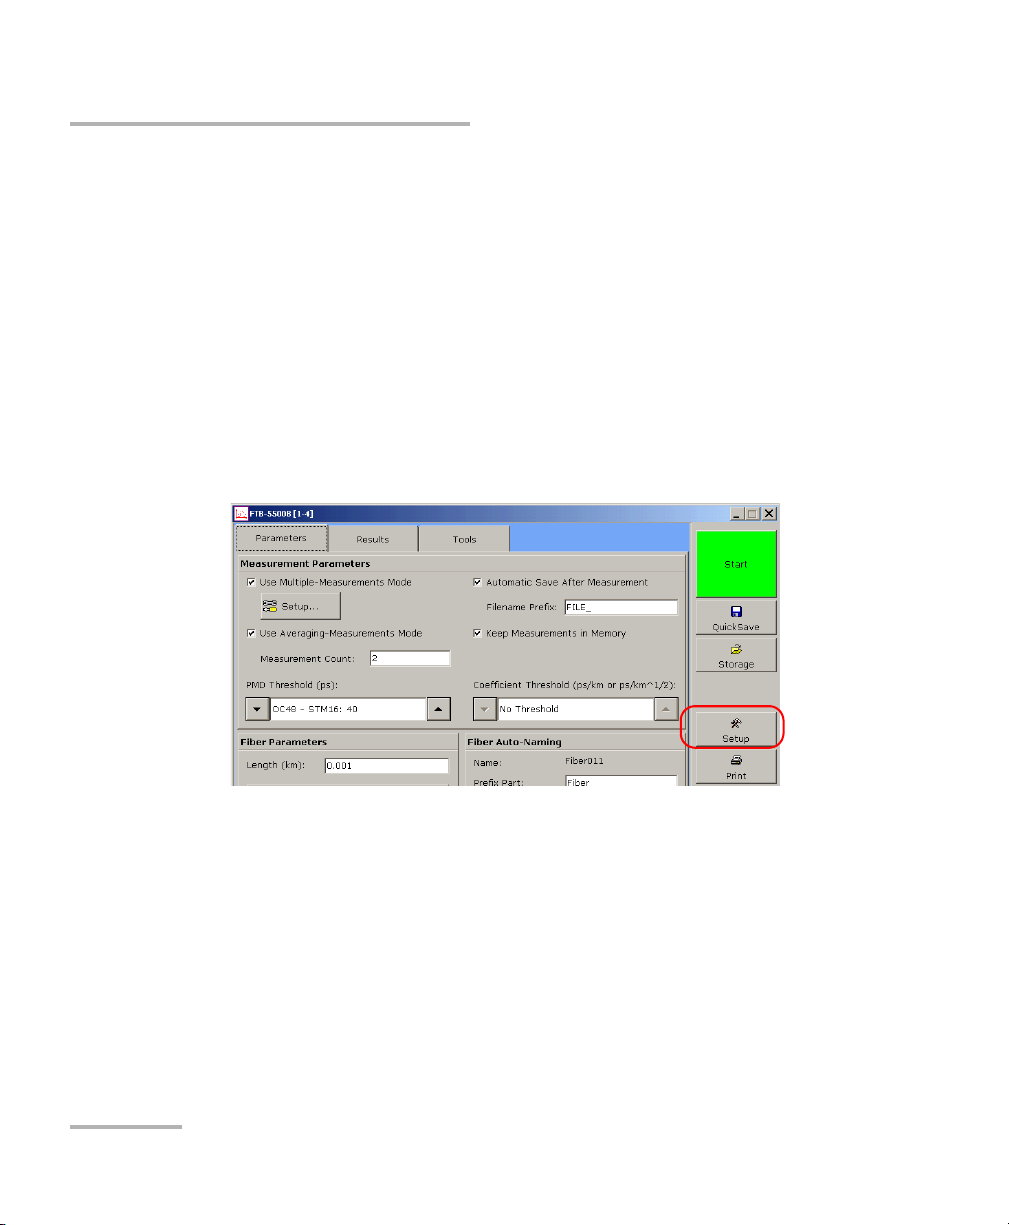
To define the fiber name format:
1. From the main window, click the Parameters tab.
2. From the Fiber Auto Naming panel, set the various parameters
according to your needs.
Fiber identification number. Will change
according to the specified increment value.
Number of digits composing the fiber
identification number.
Value that will be added the fiber identification
Polarization Mode Dispersion Analyzer 19
Displayed just before the
number in the fiber name.
number to build the next fiber name.
Page 28
Setting Up the Polarization Mode Dispersion Analyzer
Customizing PMD Value and Coefficient Thresholds
Customizing PMD Value and Coefficient
Thresholds
The Polarization Mode Dispersion Analyzer allows you to specify PMD and
coefficient values that will be used to determine whether the results are as
expected or if they exceed the specified limits.
Note: You cannot modify or delete the predefined thresholds provided with your
Polarization Mode Dispersion Analyzer.
To add a new threshold:
1. From the button bar, click Setup.
20 FTB-5500B
Page 29
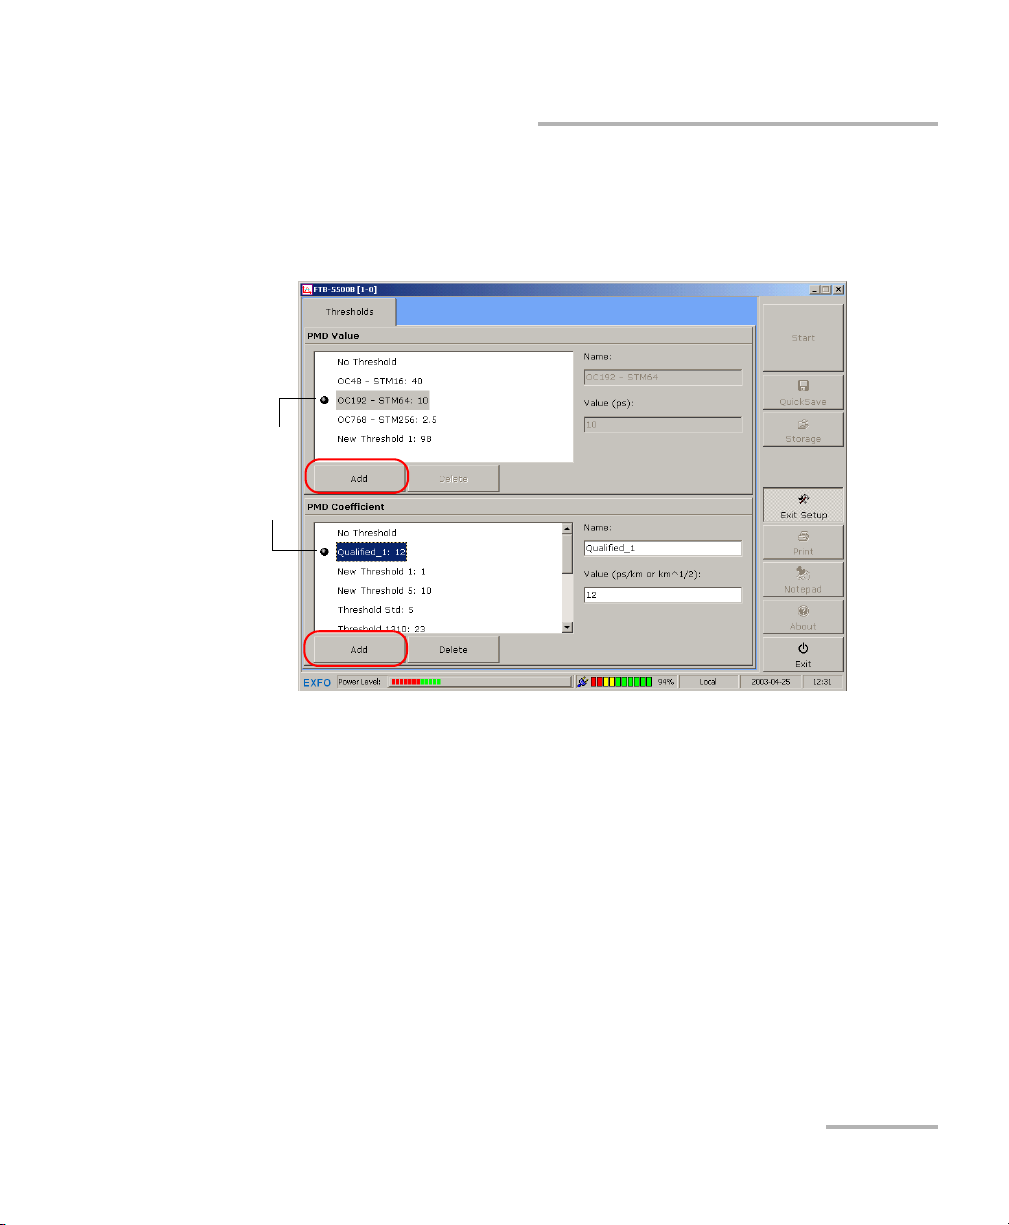
2. From the PMD Value panel, click Add.
Current
threshold values
(preceded by
bullets)
Setting Up the Polarization Mode Dispersion Analyzer
Customizing PMD Value and Coefficient Thresholds
OR
From the PMD Coefficient panel, click Add.
3. From the PMD Value list, select the threshold that has just been added.
OR
From the PMD Coefficient list, select the threshold that has just been
added.
4. Fill in the Name and Value boxes according to your needs.
Note: If you want the Polarization Mode Dispersion Analyzer to use this new
value next time you will make an acquisition, you will have to set it from
the main window Parameters tab (see Setting Acquisition Parameters on
page 24).
Polarization Mode Dispersion Analyzer 21
Page 30

Setting Up the Polarization Mode Dispersion Analyzer
Customizing PMD Value and Coefficient Thresholds
To m o d i fy a n e xisting threshold:
1. From the button bar, click Setup.
2. From the PMD Value list, select the threshold to be modified.
OR
From the PMD Coefficient list, select the threshold to be modified.
3. Modify the contents of the Name and Valu e boxes according to your
needs.
Note: If you want the Polarization Mode Dispersion Analyzer to use this new
value next time you will make an acquisition, you will have to set it from
the main window Parameters tab (see Setting Acquisition Parameters on
page 24).
22 FTB-5500B
Page 31

Setting Up the Polarization Mode Dispersion Analyzer
Customizing PMD Value and Coefficient Thresholds
To delete an existing threshold:
1. From the button bar, click Setup.
2. From the PMD Value list, select the threshold to be deleted.
OR
From the PMD Coefficient list, select the threshold to be deleted.
3. Click Delete.
To return to the main window:
From the button bar, click Exit Setup.
Polarization Mode Dispersion Analyzer 23
Page 32

Setting Up the Polarization Mode Dispersion Analyzer
Setting Acquisition Parameters
Setting Acquisition Parameters
Your FTB-5500B Polarization Mode Dispersion Analyzer allows you to
perform both single and multiple acquisitions on fibers. Regardless of the
type of acquisition you choose, you must define the parameters that will be
taken into account during the measurements. Parameters are kept in
memory even after turning off the FTB-500.
These parameters include:
Parameter Details
Fiber length Parameter compulsory since it will be used for PMD coefficient
calculations. The entered value must be equal to or greater
than 0.001 km (1 m).
Fiber type Must be set to one of the following types:
³ Tel ec om; also known as strong coupling. If you are working
directly in the field, you will probably use this fiber type.
³ Polarization-Maintaining; also known as weak coupling.
Note: Traces taken with a particular fiber type cannot
be reanalyzed with a different fiber type
afterwards.
Wavelength Must be set to one of the following values:
³ C and L Bands covers the 1460 nm to 1675 nm range.
³ O, C, L Bands covers the 1260 nm to 1675 nm range.
Note: Selecting the O, C, L Bands option will make your
Polarization Mode Dispersion Analyzer slower in
acquiring PMD data.
PMD value and
coefficient thresholds
24 FTB-5500B
Will act as a comparison value to determine whether results
are within a specific limit or not.
Page 33

Setting Up the Polarization Mode Dispersion Analyzer
Parameter Details
Results storage Offers the following possibilities:
³ Keep Files in Memory allows you to temporarily store the
results in memory for data processing purposes (for
example, statistics). However, the more files in memory,
the slower the application will be. You may prefer to save
results automatically and to process them later.
³ Automatic Save After Measurement: When you select this
option, the application saves every acquisition
automatically. It is particularly useful when taking multiple
measurements to avoid saturating memory. It is also
possible to save traces manually (see Saving Results Files
on page 63).
³ You may want to define your own prefix, which will be used
as the static part of the automatic file name when a new file
is generated.
The file will automatically be named in the following
format:
Setting Acquisition Parameters
Prefix
FILE_2002_12_10_10_25_14.pmdB
Date
(YYYY_MM_DD)
Time (HH_MM_SS)
Result file
extension
The default prefix is FILE.
Polarization Mode Dispersion Analyzer 25
Page 34

Setting Up the Polarization Mode Dispersion Analyzer
Setting Acquisition Parameters
To set the acquisition parameters:
1. From the main window, click the Parameters tab.
2. From the Fiber Parameters panel, set the fiber length, the fiber type
and the wavelength.
IMPORTANT
Ensure that the selected wavelength (bandwidth) is compatible
with the wavelength that will be used for your light source.
26 FTB-5500B
Page 35

Setting Up the Polarization Mode Dispersion Analyzer
Setting Acquisition Parameters
3. From the Measurement Parameters panel, select the PMD Threshold
and/or Coefficient Threshold list to set the PMD and/or coefficient
values.
Note: If you want to modify the contents of PMD Threshold or Coefficient
Threshold boxes, see Customizing PMD Value and Coefficient Thresholds
on page 20.
4. Set the data storage parameters.
The parameters that you have just set will be used when you make a new
acquisition.
Polarization Mode Dispersion Analyzer 27
Page 36

Setting Up the Polarization Mode Dispersion Analyzer
Preparing for Multiple Acquisitions on a Fiber
Preparing for Multiple Acquisitions on a Fiber
The multiple-measurement mode allows you to make multiple
acquisitions on the same fiber by defining the number of measurements
and the delay between them. The left part of the status bar indicates the
time left until the next measurement.
Results obtained for a specific fiber can be stored in the same file or in
distinct files. It is also possible to append new results to an existing file.
One
acquisition
per file
All acquisitions
in the same file
Before being able to use this mode, you must define the general
acquisition parameters as well as the parameters that will be specific to
multiple acquisitions only.
IMPORTANT
Do not change the test fiber between two acquisitions of a multiple
measurement mode test since parameters set for a specific fiber
may not apply to all fibers.
28 FTB-5500B
Page 37

Setting Up the Polarization Mode Dispersion Analyzer
Preparing for Multiple Acquisitions on a Fiber
To prepare for multiple acquisitions on a fiber:
1. From the main window, click the Parameters tab.
2. Set the general acquisition parameters as explained in Setting
Acquisition Parameters on page 24.
3. From the Measurement Parameters panel, select Use
Multiple-Measurements Mode.
4. From the Measurement Parameters panel, click Setup to set the
parameters.
Polarization Mode Dispersion Analyzer 29
Page 38

Setting Up the Polarization Mode Dispersion Analyzer
Preparing for Multiple Acquisitions on a Fiber
³ In the Measurement Count box, specify the number of
measurements the Polarization Mode Dispersion Analyzer will take
on the same fiber.
³ In the Measurement Interval boxes (h, m, s), specify the delay
between each measurement.
³ If you want the application to prompt you when an error occurs,
from the displayed dialog box, select the Show Error Message
After Measurement check box. However, be aware that, with this
option, the application interrupts the current test until someone
acknowledges the message.
³ If you want all results pertaining to a specific fiber to be saved to
the same file, select the Save in Same File check box.
Do the same if you want the new results to be appended to an
existing file and ensure that the desired file is open before starting
the test. For more information on opening result files, see Viewing
Acquisition Results and Information on page 44.
5. When you are done, click OK to confirm the new settings or Cancel to
discard changes.
The parameters that you have just set will be used when you make a new
acquisition.
30 FTB-5500B
Page 39

Setting Up the Polarization Mode Dispersion Analyzer
Averaging Measurements
Averaging Measurements
When you need extreme precision, you can add one polarization
scrambler at the source output port and one at the receiver input port and
use the averaging-measurements mode.
This testing mode will average the interferometric envelops at several
states of polarization, which allows very precise measurements. If you
intend to use this mode, you must provide a number of measurements
(scans) corresponding to the number of polarization states to test.
To average measurements:
1. From the main window, click the Parameters tab, select the Use
Averaging-Measurements Mode check box.
2. In the Measurement Count box, enter the number of measurements
that will be performed during the averaging process.
Polarization Mode Dispersion Analyzer 31
Page 40

Page 41

5 Operating the Polarization
Mode Dispersion Analyzer
Cleaning and Connecting Optical Fibers
IMPORTANT
To ensure maximum power and to avoid erroneous readings:
³ Always inspect fiber ends and make sure that they are clean as
explained below before inserting them into the port. EXFO is
not responsible for damage or errors caused by bad fiber
cleaning or handling.
³ Ensure that your patchcord has appropriate connectors. Joining
mismatched connectors will damage the ferrules.
To connect the fiber-optic cable to the port:
1. Inspect the fiber using a fiber inspection microscope. If the fiber is
clean, proceed to connecting it to the port. If the fiber is dirty, clean it as
explained below.
2. Clean the fiber ends as follows:
2a. Gently wipe the fiber end with a lint-free swab dipped in isopropyl
alcohol.
2b. Use compressed air to dry completely.
2c. Visually inspect the fiber end to ensure its cleanliness.
Polarization Mode Dispersion Analyzer 33
Page 42

Operating the Polarization Mode Dispersion Analyzer
Cleaning and Connecting Optical Fibers
3. Carefully align the connector and port to prevent the fiber end from
touching the outside of the port or rubbing against other surfaces.
If your connector features a key, ensure that it is fully fitted into the
port’s corresponding notch.
4. Push the connector in so that the fiber-optic cable is firmly in place,
thus ensuring adequate contact.
If your connector features a screwsleeve, tighten the connector
enough to firmly maintain the fiber in place. Do not overtighten, as this
will damage the fiber and the port.
Note: If your fiber-optic cable is not properly aligned and/or connected, you will
notice heavy loss and reflection.
34 FTB-5500B
Page 43

Operating the Polarization Mode Dispersion Analyzer
Installing the EXFO Universal Interface (EUI)
Installing the EXFO Universal Interface (EUI)
The EUI fixed baseplate is available for connectors with angled (APC) or
non-angled (UPC) polishing. A green border around the baseplate
indicates that it is for APC-type connectors.
Green border
indicates APC
option
Bare metal
(or blue border)
indicates UPC
option
To install an EUI connector adapter onto the EUI baseplate:
1. Hold the EUI connector adapter so the dust cap opens downwards.
2 3 4
2. Close the dust cap in order to hold the connector adapter more firmly.
3. Insert the connector adapter into the baseplate.
4. While pushing firmly, turn the connector adapter clockwise on the
baseplate to lock it in place.
Polarization Mode Dispersion Analyzer 35
Page 44

Operating the Polarization Mode Dispersion Analyzer
Setting Up Hardware for Measurements
Setting Up Hardware for Measurements
To measure PMD with the FTB-5500B Polarization Mode Dispersion
Analyzer, EXFO recommends that you use the FLS-110P Light Source or the
FLS-5800 CD/PMD Analyzer Source, which will provide you a larger
dynamic range. If you intend to use a third-party light source, see Using
Third-Party Broadband Light Sources on page 103.
Before making acquisitions, you must prepare your hardware properly.
To set up hardware for measurements with the FLS-5800 CD/PMD
Analyzer Source:
1. Clean and verify the quality of the connectors being used.
2. Connect the device under test (DUT) as shown below.
CD/PMD ANALYZER SOURCE
FLS-5800
ENTER
Setup
Out
On/Off Band C/L
Active
PMD
DUT
FTB-5500B
3. Turn on the FLS-5800 CD/PMD Analyzer.
4. Select the C bandwidth.
5. Tu rn t he so u rce o n.
Note: For more information on the FLS-5800, please refer to the FLS-5800
CD/PMD Analyzer Source user guide included with your product.
36 FTB-5500B
Page 45

Operating the Polarization Mode Dispersion Analyzer
Setting Up Hardware for Measurements
To set up hardware for measurements using the FLS-110P Light
Source:
1. Clean and verify the quality of the connectors being used.
2. Connect the device under test (DUT) as shown below.
PMD
DUT
FTB-5500B
3. Turn on the FLS-110P unit.
4. Press CW to ensure that it is emitting in CW mode.
Polarization Mode Dispersion Analyzer 37
Page 46

Operating the Polarization Mode Dispersion Analyzer
Setting Up Hardware for Measurements
5. If applicable, select the C bandwidth.
6. If the FLS-110 Light Source supply indicator flashes, press auto off to
deactivate the Auto Off mode. If this mode remains enabled, the light
source could stop emitting during the test.
7. Tu rn t he so u rce o n.
8. Press high to select the highest output power. The HIGH LED lights up.
Note: The low output power can be used but the accuracy of the PMD will be
affected.
Note: For more information on the FLS-110P, please refer to the FLS-110 Light
Source user guide included with your unit.
38 FTB-5500B
Page 47

Operating the Polarization Mode Dispersion Analyzer
Acquiring Traces
Acquiring Traces
The Polarization Mode Dispersion Analyzer allows you to acquire single or
multiple traces on a specific fiber. The results are displayed after each
acquisition, which means that, in the multiple measurement mode, if you
enter five as the number of acquisitions to be performed, the graph and
grid content will be updated five times with new results.
Many devices designed to measure PMD are based on the interferometric
method. This method supposes that the obtained curves correspond to
Gaussian interferograms. The patented design of the Polarization Mode
Dispersion Analyzer proposes a new approach.
To help you making links between the two methods, the application
provides you with a Gaussian compliance factor. This factor, multiplied by
the obtained PMD value, will give you the value you would obtain with a
Gaussian-based approach.
To start an acquisition:
1. Set acquisition parameters as described in Setting Acquisition
Parameters on page 24.
2. Verify that the fiber (DUT) is properly connected, that the setup is
appropriate, and that the source is activated.
3. From the button bar, click Start to start a measurement sequence.
Polarization Mode Dispersion Analyzer 39
Page 48

Operating the Polarization Mode Dispersion Analyzer
Acquiring Traces
When the measurement is complete, the new PMD results are displayed
both in the graph and in the grid.
Threshold indicator
specifies if measurement
exceeded value or not
40 FTB-5500B
Page 49

Operating the Polarization Mode Dispersion Analyzer
Performing a Null Measurement
Performing a Null Measurement
This feature allows you to perform an offset nulling of your FTB-5500B
Polarization Mode Dispersion Analyzer. During this operation, no light
should reach the detector port of the Polarization Mode Dispersion
Analyzer.
The very first time you insert an FTB-5500B Polarization Mode Dispersion
Analyzer into the FTB-500, the application will prompt you for a nulling.
EXFO recommends that you perform a null measurement just before
verifying the input power level to ensure the accuracy of the displayed
level.
To perform a null measurement:
1. From the main window, click the Parameters tab. Click Nulling and
follow the on-screen instructions.
2. When nulling is complete, click Close.
Polarization Mode Dispersion Analyzer 41
Page 50

Operating the Polarization Mode Dispersion Analyzer
Viewing the Input Power Level
Viewing the Input Power Level
The power level indicator is a visual aid to estimate the incoming signal
intensity as detected at the input port. The indicator remains visible at all
times at the bottom of the screen, except during acquisitions.
To ensure more accurate readings of the power level, EXFO recommends
that you perform a nulling first (see Performing a Null Measurement on
page 41). The input power level should be in the green area.
42 FTB-5500B
Page 51

6 Managing Results
Your FTB-5500B Polarization Mode Dispersion Analyzer allows you to work
with two types of results:
³ Newly acquired results
³ Results loaded from existing files
It also offers customizing, saving, export and printing features based on
these results.
Customizing Graph View
With the provided tools, you can zoom in on specific areas of the graph
(displayed in the main window Results tab) to have a better view. By
default, the application zooms in on the most significant area of the graph.
You can also choose to display the graph with a black or a white
background. Using a white background can be particularly useful before
exporting or printing the graph.
Polarization Mode Dispersion Analyzer 43
Page 52

Managing Results
Viewing Acquisition Results and Information
To view specific portions of the graph:
³ Select the desired type of zoom that will be applied when you will
press on the FTB-500 screen (or click on the graph with your mouse).
³ Select the desired mode (pan, zoom type, etc.).
Move view area
(pan)
Zoom in on a
selected area
Automatic zoom in
Automatic zoom out
To toggle between the available graph backgrounds:
Click the button to select the desired background.
Horizontal zoom
Vertical zoom
Horizontal and vertical zoom
To return to the original graph view:
Click the button to revert to most significant graph area.
Viewing Acquisition Results and Information
The application allows you to view current results and information directly
or reload data from existing files.
The application provides:
³ a window presenting details for the measurement that you specify
³ a window giving you an overview of all of the available measurements
44 FTB-5500B
Page 53

Managing Results
Viewing Acquisition Results and Information
Reloading Existing Files
You can reload existing files without losing the current results and
information.
To reload an existing file:
1. From the button bar, click Storage and click Open.
A standard Open dialog box is displayed, allowing you to select the
desired file.
Note: You can speed up file selection by selecting several files at the same time.
2. When you are done, from the displayed dialog box, click Open to load
the files.
3. From the button bar, click Exit Storage.
Note: If you omit to select a result from the list, the main window Results tab will
remain empty until you select one (see Viewing Results on page 46).
Polarization Mode Dispersion Analyzer 45
Page 54

Managing Results
Viewing Acquisition Results and Information
Viewing Results
The application presents a graph and a results grid containing details on
the specified measurement. It also offers a general view of both current
results and reloaded files. In the general view window, you can find a
legend of the symbols used to identify the measurement status.
Many devices designed to measure PMD are based on the interferometric
method. This method supposes that the obtained curves correspond to
Gaussian interferograms. The patented design of the Polarization Mode
Dispersion Analyzer proposes a new approach.
To help you making links between the two methods, the application
provides you with a Gaussian compliance factor. This factor, multiplied by
the obtained PMD value, will give you the value you would obtain with a
Gaussian-based approach.
To view a specific result and the related information:
1. From the main window Results tab, use the arrow next to the
measurement selector to specify which measurement to display.
Measurement
selector
46 FTB-5500B
Page 55

Managing Results
Viewing Acquisition Results and Information
2. From the provided dialog box, select the desired measurement. Click
Select to confirm your choice or Cancel to discard the changes.
The graph and the grid are automatically updated accordingly.
Since the application displays only one result at a time, if you want distinct
fibers to be considered as sections of a single fiber, use the linking feature
(see Linking Distinct Fibers to a Single Fiber on page 54).
Polarization Mode Dispersion Analyzer 47
Page 56

Managing Results
Viewing Acquisition Results and Information
To display an overall view of the results:
From the button bar, click Storage. All the current results and open files are
listed.
Measurement
status
Legend
button
Click Legend to display the list of the symbols used.
If you want to modify the information of a specific measurement, see
Documenting Results on page 58.
48 FTB-5500B
Page 57

Removing Unwanted Results
When a problem occurs, such as a fiber break, you may want to remove
the corresponding erroneous measurement. This could be useful to avoid
distorting results and statistics.
Note: You can only remove measurements (not fibers).
IMPORTANT
If you remove all measurements from a specific file (represented by
a ), this file will be deleted automatically from the hard disk of
your FTB-500.
Managing Results
Removing Unwanted Results
Polarization Mode Dispersion Analyzer 49
Page 58

Managing Results
Removing Unwanted Results
To remove unwanted results:
1. From the button bar, click Storage.
2. From the provided list, select the measurement to be removed and
click Remove.
3. A confirmation message will be displayed. Click Yes to confirm.
4. Repeat steps 1 to 3 for each measurement you want to remove.
The removal will only be effective if you save the changes (see Saving
Results Files on page 63). If you want to discard the changes, simply
answer “No” when the application will prompt you to save the file.
50 FTB-5500B
Page 59

Managing Results
Viewing Statistics
Viewing Statistics
The FTB-5500B Polarization Mode Dispersion Analyzer offers two types of
statistics:
³ Single fiber: based on measurements from a specific fiber
³ Multiple fiber: based on measurements from one or many fibers
The provided values include mean, standard deviation, minimum and
maximum results for PMD value, as well as coefficient.
Polarization Mode Dispersion Analyzer 51
Page 60

Managing Results
Viewing Statistics
To view statistics for a single fiber:
1. From the button bar, click Storage. Ensure that the results you intend
to use are displayed on the list. When you are done, click Exit Storage.
2. From the main window, click the Tools tab. Click Single-Fiber Statistics.
Statistics for the first fiber on the list appears in the grid.
Selected fiber
Measurements
associated with
selected fiber
Statistics values for the selected fiber
You can specify which measurements must be taken into account for
statistics by selecting or clearing the corresponding boxes.
The Select All button allows you to quickly select all the boxes.
The Select Valid button selects all the measurements that do not
exceed the specified thresholds.
52 FTB-5500B
Page 61

To view statistics for multiple fibers:
1. From the button bar, click Storage. Ensure that the results you intend
2. Click the Tools tab. Select Multiple-Fiber Statistics. Statistics based on
Selected fibers
Measurements
associated with
highlighted
fiber
Managing Results
Viewing Statistics
to use are displayed on the list. When you are done, click Exit Storage.
all the fibers on the list appears in the grid.
Statistics values based on all selected fibers
You can specify which fibers must be taken into account by selecting
or clearing the corresponding boxes from the selected fibers list. The
Select All and Deselect All buttons allow you to quickly perform
selections.
For each fiber, you can also specify which measurements must be
included in statistics. You simply have to click on the desired fiber to
display the related measurements and to select or clear the
corresponding measurement boxes.
The Select All button allows you to quickly select all the boxes.
The Select Valid button selects all the measurements that do not
exceed the specified thresholds.
Polarization Mode Dispersion Analyzer 53
Page 62

Managing Results
Linking Distinct Fibers to a Single Fiber
Linking Distinct Fibers to a Single Fiber
The FTB-5500B Polarization Mode Dispersion Analyzer allows you to link
distinct fibers so that you can view PMD value and coefficient exactly as if
they were sections of a single fiber. This is useful in cases where a long
fiber cannot be tested directly from one end to the other.
The application gives information about length, PMD value and coefficient
as well as the number of sections in the new fiber. The PMD value for the
entire link corresponds to the following equation:
Σ(PMD
To view results for the new fiber:
1. From the button bar, click Storage. Ensure that the results you intend
to use are displayed on the list. When you are done, click Exit Storage.
2
)
54 FTB-5500B
Page 63

Selected fibers
Measurements
associated with
highlighted
fiber
Managing Results
Linking Distinct Fibers to a Single Fiber
2. From the main window, click the Tools tab. Select Make Link.
Information based on all the fibers on the list appears in the grid.
Results and information based on all selected fibers
You can specify which fibers must be taken into account by selecting
or clearing the corresponding boxes from the selected fibers list. The
Select All and Deselect All buttons allow you to quickly perform
selections.
For each fiber, you can also specify which measurements must be
included in the statistics. Simply select the desired fiber to display the
related measurements and select or clear the corresponding
measurement boxes.
The Select All button allows you to quickly select all the boxes.
The Select Valid button selects all the measurements that do not
exceed the specified thresholds.
Polarization Mode Dispersion Analyzer 55
Page 64

Managing Results
Creating New Result Files with Selected Fibers
Creating New Result Files with Selected Fibers
It is possible to merge data taken from distinct files into a single file by
selecting the desired fibers. Creating this new file does not affect the
original files, unless you explicitly ask to overwrite one of the files.
To create a new result file:
1. From the button bar, click Storage. Ensure that the results you intend
to use are displayed on the list. When you are done, click Exit Storage.
2. From the main window, click the Too ls tab. Ensure that Multiple-Fiber
Statistics or Make Link is selected.
File generator
button
Selected fibers
Measurements
associated with
highlighted
fiber
You can specify which fibers must be taken into account by selecting
or clearing the corresponding boxes from the selected fibers list. The
Select All and Deselect All buttons allow you to quickly perform
selections.
56 FTB-5500B
Page 65

Managing Results
Creating New Result Files with Selected Fibers
For each fiber, you can also specify which measurements must be
included in statistics. Simply select the desired fiber to display the
related measurements and select or clear the corresponding
measurement boxes.
The Select All button allows you to quickly select all the boxes.
The Select Valid button selects all the measurements that do not
exceed the specified thresholds.
3. From the Tools tab, click Build File.
4. When prompted, name the file to your convenience and save it.
Polarization Mode Dispersion Analyzer 57
Page 66

Managing Results
Documenting Results
Documenting Results
For easier management, you may want to add comments and information
about the tests that are performed. It is possible to include general and
specific information.
General information concerns jobs, receiver and source. Specific
information is related to files, fibers and measurements. This information
could be included later in reports or in exported ASCII files.
To speed up general information entry, you can also define a template that
will be used for all new tests (see Defining a Template for Test Information
on page 62).
To add general information:
1. From the button bar, click Storage. Ensure that the results you intend
to use are displayed on the list. When you are done, select Exit
Storage.
2. From the main window, click the Results tab.
58 FTB-5500B
Page 67

Managing Results
Documenting Results
3. To specify which test must be documented, select any measurement
related to this test using the measurement selector.
3
Measurement
selector
4. Click Notepad to access the documentation window.
Results
documentation
indicator
5. Fill in the boxes according to your needs. When you are done, click
Exit Notepad.
Polarization Mode Dispersion Analyzer 59
2
Page 68

Managing Results
Documenting Results
To add specific information:
1. From the button bar, click Storage. Ensure that the results you intend
to use are displayed on the list. When you are done, click Exit Storage.
2. Select the item you wish to document with the measurement selector
and click the Measurement Information button to access the
documentation window.
Measurement
selector
60 FTB-5500B
Page 69

Managing Results
Documenting Results
3. Fill in the boxes according to your needs.
Information
associated with
selected item
IMPORTANT
Except for comments, all the information that you set for a
measurement will be automatically applied to other measurements
associated with the same fiber.
The modifications will only be effective if you save them (see Saving
Results Files on page 63). If you want to discard the changes, simply
answer “No” when the application will prompt you to save the file.
Polarization Mode Dispersion Analyzer 61
Page 70

Managing Results
Defining a Template for Test Information
Defining a Template for Test Information
It is possible to define a template that will be used to fill the general
information boxes of all new tests. This way, you can simply make a few
changes instead of having to fill in each box manually.
To define a template for test information:
1. From the main window, click the Parameters tab.
2. Click Notepad to access the documentation window.
Te mp l a te
mode
indicator
3. Fill in the boxes to build your template to your needs. When you are
done, click Exit Notepad.
The information you have just entered will be automatically transferred
into the corresponding boxes of all the new tests you will perform.
62 FTB-5500B
Page 71

Managing Results
Saving Results Files
Saving Results Files
Results files can be saved automatically after each measurement (see
Setting Acquisition Parameters on page 24) or manually when the need
arises (current file or all open files).
Note: Full customization of file names is only possible when saving files
manually, one file at a time.
Note: If former results have not been saved yet, the application prompts you to
save them before starting a new test.
To save files:
From the button bar, click Quick Save to save all open files at the same
time (no file name will be requested).
OR
From the button bar, click Storage, and click:
³ Save As to save only the current file (you will be prompted to provide a
file name).
³ Save All to save all open files at the same time (no file name will be
requested).
Polarization Mode Dispersion Analyzer 63
Page 72

Managing Results
Exporting Results and Graphs
Exporting Results and Graphs
The FTB-5500B Polarization Mode Dispersion Analyzer offers you the
possibility of quickly building your own reports by copying results and
graphs to the clipboard. Afterwards, the content of the clipboard can be
pasted onto a word-processor document of your choice. Graphs are
exported exactly as you see them on the screen (zoom factor and display
are kept) except for background.
If you prefer to work with raw data to build your own tables and graphs see
Exporting PMD Files with the File Converter on page 73.
Since information is stored to clipboard, you cannot export both
results and graph simultaneously. You must copy them one at a
time.
IMPORTANT
64 FTB-5500B
Page 73

To export results to clipboard:
1. From the main window Results tab, use the measurement selector to
Measurement
selector
Managing Results
Exporting Results and Graphs
specify which measurement must be displayed.
2. Click Copy Results.
3. Paste the content of the clipboard onto a word processor document,
for example.
Polarization Mode Dispersion Analyzer 65
Page 74

Managing Results
Exporting Results and Graphs
To export graphs to clipboard:
1. From the main window Results tab, use the measurement selector to
specify which measurement must be displayed.
Measurement
selector
2. Adjust graph display to your needs. For more information, see
Customizing Graph View on page 43.
3. Click Copy Graph.
4. Paste the content of the clipboard onto a word processor document,
for example.
66 FTB-5500B
Page 75

Managing Results
Customizing Reports
Customizing Reports
The FTB-5500B Polarization Mode Dispersion Analyzer provides many
report types that are used for printing. For each type of report, you can
specify which information must be included in your document.
To set up report parameters:
1. From the button bar, click Print.
Polarization Mode Dispersion Analyzer 67
Page 76

Managing Results
Customizing Reports
2. From the Setup tab, customize the report to suit your needs.
³ You can customize the title by entering it in the Report Title box.
³ You can also add a logo by using the Browse button.
³ Select the boxes corresponding to the information you want to see
in your report and clear those you do not want to see.
3. When you are done, from the button bar, click Exit Print. The report
parameters are automatically saved for future use.
68 FTB-5500B
Page 77

Managing Results
Printing Data
The FTB-5500B Polarization Mode Dispersion Analyzer allows you to
preview and to print reports containing the test results or statistics from
Microsoft Internet Explorer. For information on how to modify report
templates, see Customizing Reports on page 67.
To preview or print a report:
1. From the button bar, click Print.
Printing Data
Polarization Mode Dispersion Analyzer 69
Page 78

Managing Results
Printing Data
2. From the Print tab, select the desired report type.
Note: If you do not customize the graph appearance, it will be presented with the
default settings (no zoom factor).
Note: Graphs only appear in reports if you select the Measurements Report
option.
Select which items must be included. The table below gives you more
information on possible selections.
If you have selected... Specify...
Measurements Which measurements must be included in
the report by selecting the corresponding
boxes.
You can also click Select All or Deselect All
to quickly select or clear all boxes at the
same time.
70 FTB-5500B
Page 79

Managing Results
Printing Data
If you have selected... Specify...
Fibers Which fibers must be included in the report
by selecting the corresponding boxes.
You can also click Select All or Deselect All
to quickly select or clear all boxes at the
same time.
Statistics No fiber or measurement selection can be
made from the current window. You can
select the fibers you want to include, but not
the individual measurements.
Link No fiber or measurement selection can be
made from the current window. You can
select the fibers you want to include, but not
the individual measurements.
3. When you are done, click Print to open the preview. If you want to
send the document to a printer, use the Print function of Microsoft
Internet Explorer.
4. From the button bar, click Exit Print to return to the main window.
Polarization Mode Dispersion Analyzer 71
Page 80

Managing Results
Closing Result Files
Closing Result Files
For easier result management, you may want to close the result files
manually.
Note: You do not need to close files manually before exiting the Polarization
Mode Dispersion Analyzer application. You will be prompted if some result
files have not been saved.
To c l os e f i le s :
1. From the button bar, click Storage, and click:
³ Close to close only the current file.
³ Close All to close all open files at the same time.
2. When you are done, from the button bar, click Exit Storage to return to
the main window.
72 FTB-5500B
Page 81

7 Exporting PMD Files with the
File Converter
The File Converter tool has been designed to export PMD files to specific
formats:
³ From PMD-5500 files to PMD-5500B files (allows to load files created
with former PMD Analyzer)
³ From PMD-5500 files to ASCII files
³ From PMD-5500B files to ASCII files
You can also fully customize the contents of the generated files by
exporting only the information you need.
Polarization Mode Dispersion Analyzer 73
Page 82

Exporting PMD Files with the File Converter
Starting and Exiting the File Converter
Starting and Exiting the File Converter
To start the converter:
³ From ToolBox, click the Applications tab. Click PMD File
ImportExport.
OR
³ From the FTB-5500B Polarization Mode Dispersion Analyzer
application, click the Storage button. Click Converter.
74 FTB-5500B
Page 83

Files to be
exported
Information
about the
export
process
Exporting PMD Files with the File Converter
Starting and Exiting the File Converter
The File Converter main window is displayed.
Function
tabs
To exit the converter:
³ Click (in the top right corner of the main window).
³ Click the Exit button located at the bottom of the function bar.
Polarization Mode Dispersion Analyzer 75
Page 84

Exporting PMD Files with the File Converter
Setting Export Parameters
Setting Export Parameters
Before exporting data from one format to another, you must define:
³ Which information must be exported: You can export general test
information (fiber ID, thresholds, PMD value, etc.) as well as points
from the acquired traces. This is particularly useful if you intend to
build your own graphs using Microsoft Excel, for instance.
³ The conversion type (from PMD-5500 to PMD-5500B, from PMD-5500 to
ASCII or from PMD-5500B to ASCII).
³ Where to export files.
The parameters you set will remain unchanged until you choose to modify
them. They will still be available after the computer has shut down.
To set export parameters:
1. Open the File Converter tool (see Starting and Exiting the File
Converter on page 74).
2. Select the desired conversion type.
76 FTB-5500B
Page 85

Exporting PMD Files with the File Converter
Setting Export Parameters
3. If you selected a conversion to the ASCII format, from the Settings
function tab, select all the boxes corresponding to the information you
want to export.
Note: If you select Interferometric Envelope, all points acquired during the test
will be exported.
4. From the Export Folder panel, click the Browse button to specify in
which folder the exported files will be stored.
Polarization Mode Dispersion Analyzer 77
Page 86

Exporting PMD Files with the File Converter
Exporting PMD Files
Exporting PMD Files
Once the export parameters are set, you are now ready to start exporting
PMD files. Files that cannot be exported (for example, corrupt files) will be
skipped and their export status will change to “Fa ile d”.
IMPORTANT
To avoid errors during file export, ensure that all the files you intend
to use are closed. A file that is selected in the Results tab of the
Polarization Mode Dispersion Analyzer main window is considered
open.
To e x p o rt P MD fi l es :
1. If necessary, close the files that you want to export (see Closing Result
Files on page 72).
2. If necessary, start the converter (see Starting and Exiting the File
Converter on page 74).
3. If necessary, set up the export parameters (see Setting Export
Parameters on page 76).
4. Click the Converter function tab of the File Converter.
78 FTB-5500B
Page 87

Exporting PMD Files with the File Converter
Exporting PMD Files
5. Select the files.
5a. From the Files to Export panel, click Add.
A standard Open dialog box is displayed, allowing you to choose
the desired file(s).
Note: You can speed up file selection by selecting several files at the same time.
5b. When you are done, click Open to transfer the files to the list.
You can remove a specific file by selecting it and clicking Remove. If
you want to quickly empty the list, click Remove All.
6. From the Export Control panel, click the Export File(s) button to start
the export process.
Successful export
Unsuccessful
export
Polarization Mode Dispersion Analyzer 79
Page 88

Page 89

8 Maintenance
To help ensure long, trouble-free operation:
³ Always inspect fiber-optic connectors before using them and clean
them if necessary.
³ Keep the unit free of dust.
³ Clean the unit casing and front panel with a cloth slightly dampened
with water.
³ Store unit at room temperature in a clean and dry area. Keep the unit
out of direct sunlight.
³ Avoid high humidity or significant temperature fluctuations.
³ Avoid unnecessary shocks and vibrations.
³ If any liquids are spilled on or into the unit, turn off the power
immediately and let the unit dry completely.
Use of controls, adjustments, and procedures for operation and
maintenance other than those specified herein may result in
hazardous radiation exposure.
WARNING
Polarization Mode Dispersion Analyzer 81
Page 90

Maintenance
Cleaning Fixed Connectors
Cleaning Fixed Connectors
Regular cleaning of connectors will help maintain optimum performance.
Do not try to disassemble the unit. Doing so would break the connector.
To clean fixed connectors:
1. Fold a lint-free wiping cloth in four to form a square.
2. Moisten the center of the lint-free wiping cloth with only one drop of
isopropyl alcohol.
Alcohol may leave traces if used abundantly. Avoid contact between
the tip of the bottle and the wiping cloth, and do not use bottles
that distribute too much alcohol at a time.
3. Gently wipe the connector threads three times with the folded and
moistened section of the wiping cloth.
IMPORTANT
IMPORTANT
Isopropyl alcohol takes approximately ten seconds to evaporate.
Since isopropyl alcohol is not absolutely pure, evaporation will
leave microscopic residue. Make sure you dry the surfaces before
evaporation occurs.
4. With a dry lint-free wiping cloth, gently wipe the same surfaces three
times with a rotating movement.
5. Throw out the wiping cloths after one use.
82 FTB-5500B
Page 91

Maintenance
Cleaning Fixed Connectors
6. Moisten a cleaning tip (2.5 mm tip) with only one drop of isopropyl
alcohol.
IMPORTANT
Alcohol may leave traces if used abundantly. Avoid contact between
the tip of the bottle and the cleaning tip, and do not use bottles
that distribute too much alcohol at a time.
7. Slowly insert the cleaning tip into the connector until it reaches the
ferrule inside (a slow clockwise rotating movement may help).
7
8
9
8. Gently turn the cleaning tip one full turn.
9. Continue to turn as you withdraw the cleaning tip.
10. Repeat steps 7 to 9, but this time with a dry cleaning tip (2.5 mm tip
provided by EXFO).
Note: Make sure you don’t touch the soft end of the cleaning tip and verify the
cleanliness of the cotton tip.
11. Throw out the cleaning tips after one use.
Polarization Mode Dispersion Analyzer 83
Page 92

Maintenance
Cleaning EUI Connectors
Cleaning EUI Connectors
Regular cleaning of EUI connectors will help maintain optimum
performance. There is no need to disassemble the unit.
If any damage occurs to internal connectors, the module casing will
have to be opened and a new calibration will be required.
To clean EUI connectors:
1. Remove the EUI from the instrument to expose the connector
baseplate and ferrule.
IMPORTANT
Turn
Push
2. Moisten a 2.5 mm cleaning tip with one drop of isopropyl alcohol
(alcohol may leave traces if used abundantly).
3. Slowly insert the cleaning tip into the EUI adapter until it comes out on
the other side (a slow clockwise rotating movement may help).
Pull
3
4
5
4. Gently turn the cleaning tip one full turn, then continue to turn as you
withdraw it.
84 FTB-5500B
Page 93

Cleaning EUI Connectors
5. Repeat steps 3 to 4 with a dry cleaning tip.
Note: Make sure you don’t touch the soft end of the cleaning tip.
6. Clean the ferrule in the connector port as follows:
6a. Deposit one drop of isopropyl alcohol on a lint-free wiping cloth.
IMPORTANT
Isopropyl alcohol may leave residues if used abundantly or left to
evaporate (about 10 seconds).
Avoid contact between the tip of the bottle and the wiping cloth,
and dry the surface quickly.
6b. Gently wipe the connector and ferrule.
6c. With a dry lint-free wiping cloth, gently wipe the same surfaces to
ensure that the connector and ferrule are perfectly dry.
6d. Verify connector surface with a portable fiber-optic
microscope(for example, EXFO’s FOMS) or fiber inspection
probe(for example, EXFO’s FIP).
Maintenance
WARNING
Verifying the surface of the connector WHILE THE UNIT IS ACTIVE
WILL result in permanent eye damage.
7. Put the EUI back onto the instrument (push and turn clockwise).
8. Throw out cleaning tips and wiping cloths after one use.
Polarization Mode Dispersion Analyzer 85
Page 94

Maintenance
Recalibrating the Unit
Recalibrating the Unit
Manufacturing and service center calibrations are based on the
ISO/IEC 17025 Standard, which states that calibration documents must not
contain a recommended calibration interval, unless this has been
previously agreed upon with the customer.
Validity of specifications depends on operating conditions. For example,
the calibration validity period can be longer or shorter depending on the
intensity of use, environmental conditions and unit maintenance. You
should determine the adequate calibration interval for your unit according
to your accuracy requirements.
Under normal use, EXFO recommends calibrating your unit every year.
86 FTB-5500B
Page 95

Maintenance
Recycling and Disposal (Applies to European Union Only)
Recycling and Disposal
(Applies to European Union Only)
Recycle or dispose of your product (including electric and
electronic accessories) properly, in accordance with local
regulations. Do not dispose of it in ordinary garbage receptacles.
This equipment was sold after August 13, 2005 (as identified by
the black rectangle).
³ Unless otherwise noted in a separate agreement between EXFO and a
customer, distributor, or commercial partner, EXFO will cover costs
related to the collection, treatment, recovery, and disposal of
end-of-lifecycle waste generated by electronic equipment introduced
after August 13, 2005 to an European Union member state with
legislation regarding Directive 2002/96/EC.
³ Except for reasons of safety or environmental benefit, equipment
manufactured by EXFO, under its brand name, is generally designed to
facilitate dismantling and reclamation.
For complete recycling/disposal procedures and contact information, visit
the EXFO Web site at www.exfo.com/recycle.
Polarization Mode Dispersion Analyzer 87
Page 96

Page 97

9 Troubleshooting
Solving Common Problems
Before calling EXFO’s technical support, you may want to consider the
following solutions to problems that could occur.
Message Possible cause Solution
Detected signal is out of
user selected band.
Strong signal detected out of
the selected band.
Measurement may be
erroneous.
Narrowband optical source
detected. Measurement
may be erroneous.
The frequency range of
signal is out of measuring
range. The acquisition
operation was canceled.
No signal detected in the
selected band. However,
another signal has been
detected outside the
specified band. The
application will try to take a
measurement using the
specified band.
Signal detected in the
selected band. However,
another strong signal has
been detected elsewhere
on the whole measurement
band. Measurement
accuracy can be affected.
The source being used has a
very narrow bandwidth that
prevents an accurate PMD
measurement.
The frequency range of
signal is out of measuring
range (160 THz to 250 THz).
³ Ensure the source is on.
³ Ensure the source
wavelength matches the
selected band for the
Polarization M o d e
Dispersion Analyzer.
Turn off the sources emitting
at wavelengths that do not
match the selected band for
the Polarization Mode
Dispersion Analyzer.
³ Use a LED or SLED
source.
³ Ensure no narrow
source is used for the
selected band.
³ Use a source with a
wavelength matching
the Polarization Mode
Dispersion Analyzer
bands.
³ Ensure that the source
power is sufficient.
Polarization Mode Dispersion Analyzer 89
Page 98

Troubleshooting
Solving Common Problems
Message Possible cause Solution
Low signal-to-noise ratio. Power too-low in the
selected band.
Possible coupling mode
selection error.
The selected coupling mode
(Telecom or
Polarization-Maintaining)
does not match the coupling
mode the Polarization Mode
Dispersion Analyzer detects.
Calculation will be
performed using the
selected coupling mode.
The signal is too low to
compute a PMD value. The
acquisition operation was
canceled.
³ Power too-low in the
selected band.
³ The source being used
is modulated.
³ Use a source with a
higher output power.
³ Clean connectors
carefully.
³ Ensure connections are
made properly.
³ Ensure the source
wavelength matches the
selected band for the
Polarization M o d e
Dispersion Analyzer.
Ensure that the selected
coupling mode is
appropriate.
³ Ensure the input power
is sufficient.
³ Use a LED or SLED
source.
The signal is saturated.
Unable to compute PMD
Power is too high. Reduce the source output
power.
value. The acquisition
operation was canceled.
90 FTB-5500B
Page 99

Troubleshooting
Solving Common Problems
Message Possible cause Solution
Specifications not
guaranteed, retesting
recommended.
The PMD value might no be
within the unit’s
specification:
³ You r PMD A naly z e r
measures low PMD
values from a weak
coupling device (for
example, PMF) and
analyzer input
polarization state is not
appropriate.
³ External parasitic signal
during measurement
(for example, live fiber).
³ Move fiber or device
slightly to change
polarization state and
retest.
³ Remove parasitic signal
and retest.
Polarization Mode Dispersion Analyzer 91
Page 100

Troubleshooting
Viewing Online Documentation
Viewing Online Documentation
An online version of the FTB-5500B Polarization Mode Dispersion Analyzer
user guide is available at all times from the application.
To access the online user guide:
Click Help in the function bar.
92 FTB-5500B
 Loading...