

Page 1
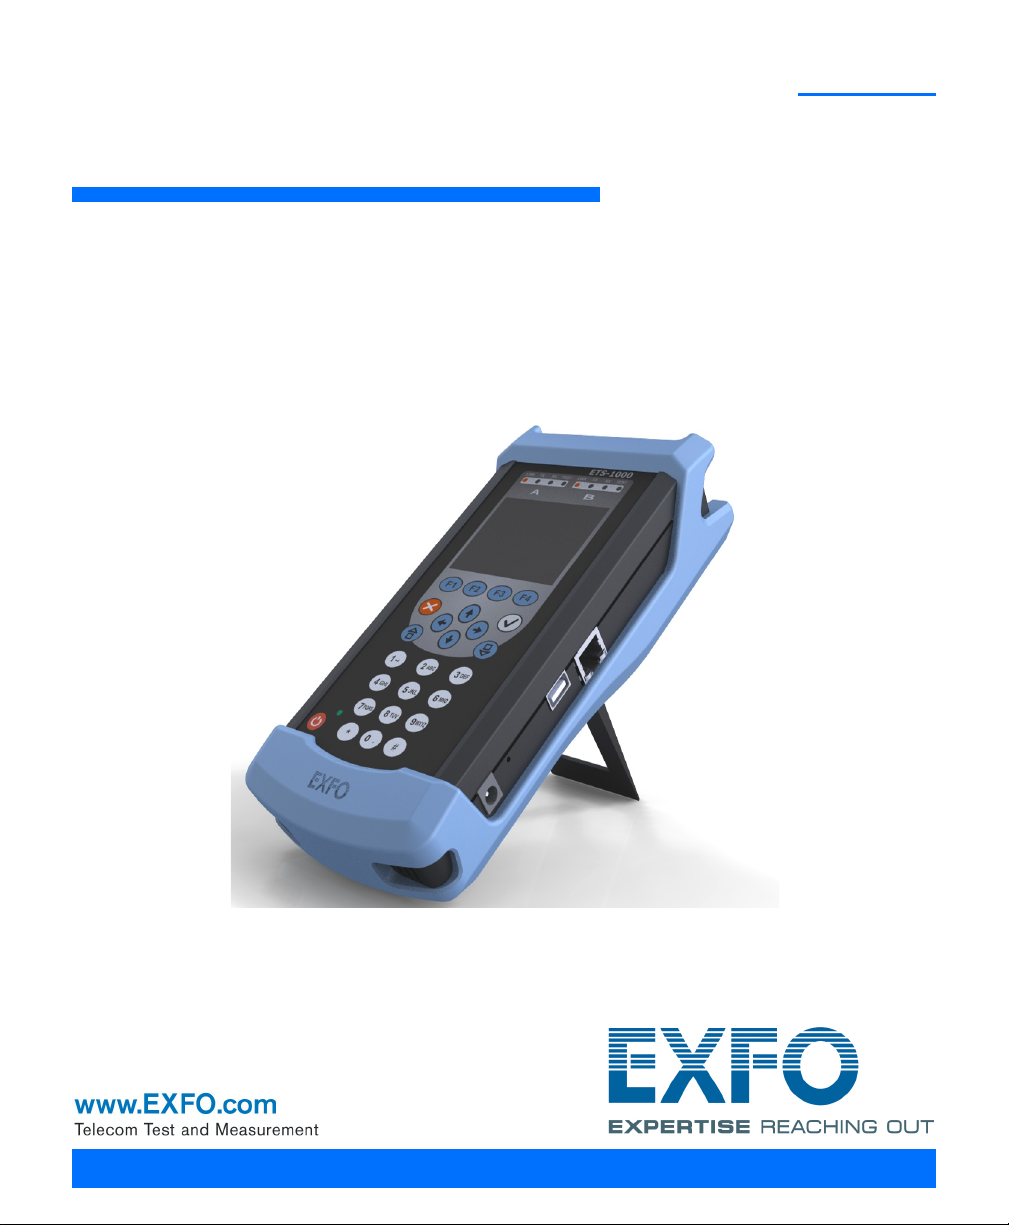
ETS-1000
Ethernet Tester Analyzer
User Guide
Page 2

Copyright © 2010–2014 EXFO Inc. All rights reserved. No part of this
publication may be reproduced, stored in a retrieval system or transmitted
in any form, be it electronically, mechanically, or by any other means such
as photocopying, recording or otherwise, without the prior written
permission of EXFO Inc. (EXFO).
Information provided by EXFO is believed to be accurate and reliable.
However, no responsibility is assumed by EXFO for its use nor for any
infringements of patents or other rights of third parties that may result from
its use. No license is granted by implication or otherwise under any patent
rights of EXFO.
EXFO’s Commerce And Government Entities (CAGE) code under the North
Atlantic Treaty Organization (NATO) is 0L8C3.
The information contained in this publication is subject to change without
notice.
Trademarks
EXFO’s trademarks have been identified as such. However, the presence
or absence of such identification does not affect the legal status of any
trademark.
Units of Measurement
Units of measurement in this publication conform to SI standards and
practices.
April 10, 2014
Version number: 2.0.0
ii ETS-1000
Page 3

Certification Information
Certification Information
Federal Communications Commission (FCC) and
Industry Canada (IC) Information
Electronic test and measurement equipment is exempt from FCC Part 15
compliance in the United States and from IC ICES 003 compliance in
Canada. However, EXFO Electro-Optical Engineering Inc. (EXFO) makes
reasonable efforts to ensure compliance to the applicable standards.
The limits set by these standards are designed to provide reasonable
protection against harmful interference when the equipment is operated in
a commercial environment. This equipment generates, uses, and can
radiate radio frequency energy and, if not installed and used in accordance
with the user guide, may cause harmful interference to radio
communications. Operation of this equipment in a residential area is likely
to cause harmful interference in which case the user will be required to
correct the interference at his own expense.
European Union (CE) Information
Electronic test and measurement equipment is subject to the EMC
Directive in the European Union. The EN61326 standard prescribes both
emission and immunity requirements for laboratory, measurement, and
control equipment. This unit has been tested and found to comply with the
limits for a Class A digital device. See CE Declaration of Conformity on
page iv.
Note: If the equipment described herein bears the CE symbol, the said equipment
complies with the applicable European Union Directive and Standards
mentioned in the Declaration of Conformity.
Ethernet Tester Analyzer iii
Page 4
Certification Information
Application of Council Directives: 2006/95/EC - The Low Voltage Directive
2004/108/EC - The EMC Directive
2006/66/EC - The Battery Directive
93/68/EEC - CE Marking
And their amendments
Manufacturer’s Name: EXFO Inc.
Manufacturer’s Address: 400 Godin Avenue
Quebec, Quebec
Canada, G1M 2K2
Equipment Type: Information Technology Equipment (ITE)
Trade Name/Model No.: Ethernet Analyzer / ETS-1000
Standard(s) to which Conformity is Declared:
EN 55022: 2006 Information technology equipment Radio disturbance
characteristics Limits and methods of measurement
EN 55024 :1998 + A1: 2001 +
A2: 2003
Information Technology Equipment - Immunity
Characteristics - Limits and Methods of Measurements
EN 61010-1:2001 Edition 2.0 Safety Requirements for Electrical Equipment for Measurement,
Control, and Laboratory Use Part 1: General Requirements.
EN 60825-1:2007 Edition 2.0 Safety of laser products Part 1: Equipment classification and
requirements
EN 61000-3-2:2006 Electromagnetic compatibility (EMC).
Limits for harmonic current emissions (equipment input current
< 16 A per phase)
EN 61000-3-3:1995 + A1: 2001
+ A2: 2005
Electromagnetic compatibility (EMC).
Limits. Limitation of voltage changes, voltage fluctuations and
flicker in public low-voltage supply systems, for equipment with
rated current 16 A per phase and not subject to conditional
connection
I, the undersigned, hereby declare that the equipment specified above conforms to the above Directives and Standards.
Manufacturer
Signature:
Full Name: Stephen Bull, E. Eng
Position: Vice-President Research and
Development
Address: 400 Godin Avenue, Quebec (Quebec),
Canada, G1M 2K2
Date: February 08, 2010
DECLARATION OF CONFORMIT
Y
CE Declaration of Conformity
iv ETS-1000
Page 5

Contents
Contents
Certification Information ....................................................................................................... iii
1 Introducing the ETS-1000 ............................................................................ 1
Signal Connectors and LEDs ...................................................................................................2
LEDs Description ....................................................................................................................3
Status bar Description ...................................................................................................... 4
Keyboard Description ....................................................................................................... 6
External Connectors ................................................................................................................8
Optical Transceivers ..............................................................................................................10
Conventions ..........................................................................................................................11
2 Safety Information ..................................................................................... 13
Laser Safety Warnings ...........................................................................................................13
Installation Instructions Warnings ........................................................................................14
3 Getting Started .......................................................................................... 15
4 Setting up your Unit .................................................................................. 17
Network setup ......................................................................................................................17
Interface setup ......................................................................................................................19
Unit Setup ............................................................................................................................23
5 Typical Tasks and Solutions ....................................................................... 33
Typical Tasks ..........................................................................................................................33
RFC 2544 Methodology ........................................................................................................33
6 Connecting Unit ......................................................................................... 39
Unit Connection Schemes .....................................................................................................39
Ethernet Tester Analyzer v
Page 6

Contents
7 Configuring and Starting a Test .................................................................43
RFC 2544 General Settings ...................................................................................................43
RFC 2544 Test Parameters Setup ...........................................................................................50
RFC 2544. Performing Analysis .............................................................................................57
Asymmetric Test ....................................................................................................................63
Complex Traffic .....................................................................................................................64
Loopback ..............................................................................................................................70
OAM .....................................................................................................................................77
ET Discovery ..........................................................................................................................80
Testing TCP/IP ........................................................................................................................82
Pass Through ........................................................................................................................89
Cable Diagnostics .................................................................................................................90
BERT .....................................................................................................................................94
Packet Jitter ........................................................................................................................103
Test Traffic ...........................................................................................................................106
Statistics .............................................................................................................................110
8 Saving Test Results ...................................................................................115
9 Remote Control .........................................................................................117
Management in the Terminal Mode ....................................................................................117
Remote Control via TELNET .................................................................................................120
Remote Control via WWW-interface ...................................................................................121
Screen Shot ........................................................................................................................123
10 Maintenance ..............................................................................................125
Recycling and Disposal (Applies to European Union Only) ..................................................126
11 Troubleshooting ........................................................................................127
Solving Common Problems .................................................................................................127
Contacting the Technical Support Group ............................................................................128
Transportation ....................................................................................................................129
12 Warranty ....................................................................................................131
General Information ...........................................................................................................131
Liability ...............................................................................................................................132
Exclusions ...........................................................................................................................133
Certification ........................................................................................................................133
Service and Repairs .............................................................................................................134
EXFO Service Centers Worldwide ........................................................................................135
vi ETS-1000
Page 7

Contents
A Specifications ........................................................................................... 137
B Ethernet Frame Structure ........................................................................ 139
C Remote Control Commands .................................................................... 141
D Bibliography ............................................................................................. 159
Index .............................................................................................................. 161
Ethernet Tester Analyzer vii
Page 8

Page 9

1 Introducing the ETS-1000
Ethernet/Gigabit ETS-1000 (referred to as unit or analyzer) is intended for
performing analysis and diagnostic tests according to the RFC 2544 [5]
methodology, checking the state of a cable, and checking link connectivity.
In addition, the analyzer supports operations in the loopback mode, and
statistics collection for received and transmitted traffic.
ETS-1000 analyzer provides the following options:
Generating and analyzing traffic at the data link (MAC) and network
(IP) layers.
Collecting and displaying statistics for traffic received and transmitted
at the physical, data link, and network layer.
RFC-2544 measurements: Throughput, Latency, Frame Loss, and
Back-to-Back.
Diagnosing the copper cable faults.
Ethernet loopback for physical, data link, and network layers of the OSI
model.
Loopback control via OAM protocol.
Bit Error Rate Testing (BERT).
Packet jitter measurements.
IP testing (ping, trace route, telnet/http requests).
Ethernet Tester Analyzer 1
Page 10
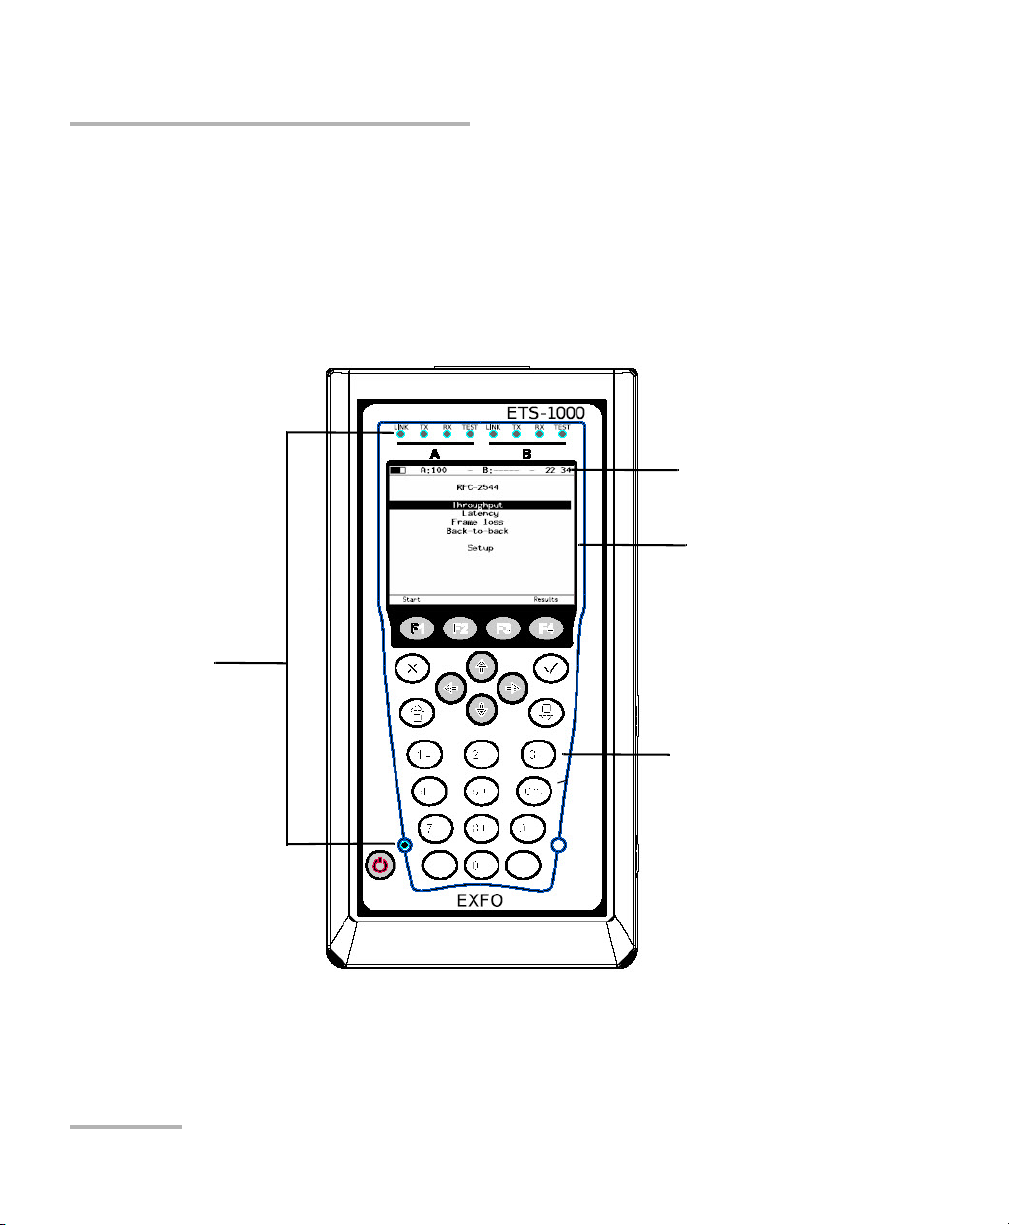
Introducing the ETS-1000
LEDs
Status bar
Screen
Keyboard
Signal Connectors and LEDs
Signal Connectors and LEDs
This section describes all connectors (ports), controls, and LEDs available
on the ETS-1000 Analyzer.
Front Panel
2 ETS-1000
Page 11

Introducing the ETS-1000
LEDs Description
LEDs Description
The LED panel located on the front of your ETS-1000 provides you with
the status of your unit.
LED Status Color Description
LINK On Green Connection to DUT is successfully
established.
Off Red No connection.
Tx Blinking
Green Data is transmitted.
or
Constant
Light
Off Off No data is transmitted.
Rx Blinking
Green Data packets are received.
or
Constant
Light
Off Off No data is received.
Test On Green Test is running.
Blinking Green Loopback mode is running.
LEDs in the bottom part of the front panel light up when the power
supply unit is connected:
Green: Indicates the battery is charged.
Green (blinking): Indicates the battery is charging.
Green (twinkling): Indicates the analyzer software is getting
updated.
Ethernet Tester Analyzer 3
Page 12

Introducing the ETS-1000
Status bar Description
Status bar Description
Displays information about the following parameters (left to right)
Battery charge state
Transmission rate for the port A
Note: If you connect SFP-module, white color of this inscription will be changed to
yellow.
Currently running test on port A
Transmission rate for the port B
Note: If you connect SFP-module, white color of this inscription will be changed to
yellow.
Currently running test on port B
current time
4 ETS-1000
Page 13

Introducing the ETS-1000
Status bar Description
The type of test running via port A(B) is marked in the status bar with the
following abbreviations:
THR Throughput Analysis
LAT Latency Analysis
BTB Back-to-Back Test
FRL Frame Loss Test
LB1 Loopback at the Physical Layer (Layer 1).
LB2 Loopback at the Data Layer (Layer 2).
LB3 Loopback at the Network Layer (Layer 3).
LB4 Loopback at the Transport Layer (Layer 4).
BER Bit Error Rate Test
PJ Packet Jitter Analysis
GEN Test Flow Generation
J+G Packet Jitter Analysis and Test Flow Generation on the
Same Port
PTH Pass Through Mode
Ethernet Tester Analyzer 5
Page 14
Introducing the ETS-1000
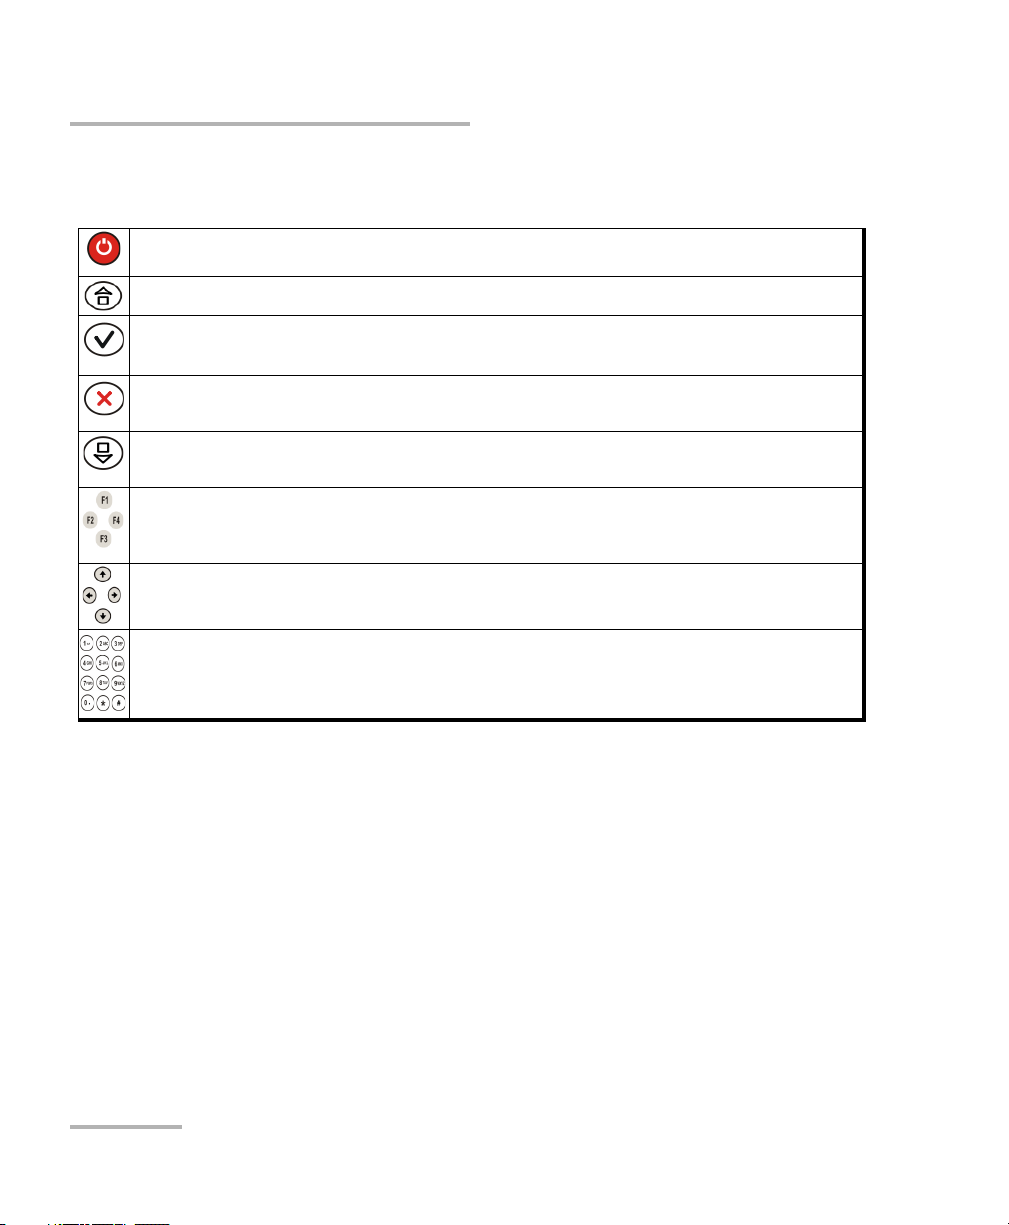
Keyboard Description
Keyboard Description
Power button: Switches unit on/off. Press and hold the button for 1 to 2 seconds.
Main Menu: Returns to the main menu.
Enter: Opens the corresponding menu and displays the corresponding
screen.
Cancel/Escape: Returns to the previous screen or menu. In edition mode, it
cancels the data-entry.
Infobar: Displays the LEDs captions (background color corresponds to the LED’s
color).
Function Keys: Located under the screen, the three function keys F1, F2, F3 are
used to select the tabs on the screen positioned directly above each key (for
example, F1 is used to select the left-most tab).
Function Arrows: Indicates the cursor moving buttons.
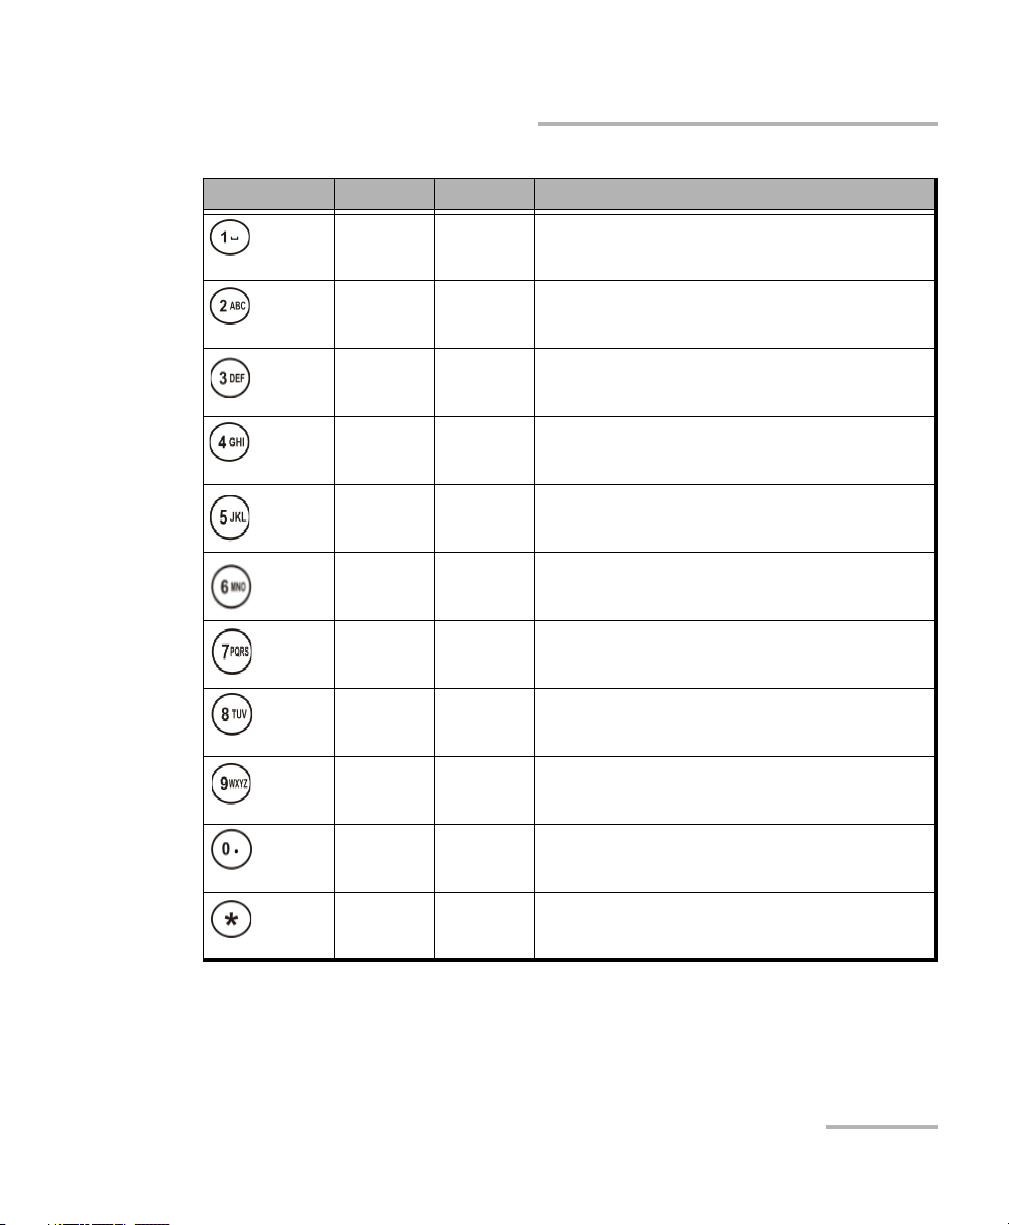
Digits, letters, and symbols input buttons: Indicates digits from 1 to 10, letters
from a to z, and symbols input buttons shown in the table below.
6 ETS-1000
Page 15
Introducing the ETS-1000
Buttons Digits Letters Symbols
1 - - - - - -
2a b c- - -
3d e f- - -
4g h i- - -
5j k l- - -
6m n o- - -
7 p q r s - - -
Keyboard Description
8t u v- - -
9 w x y z - - -
0 - - - . , : ;
- - - - - - *
Ethernet Tester Analyzer 7
Page 16
Introducing the ETS-1000
External Connectors
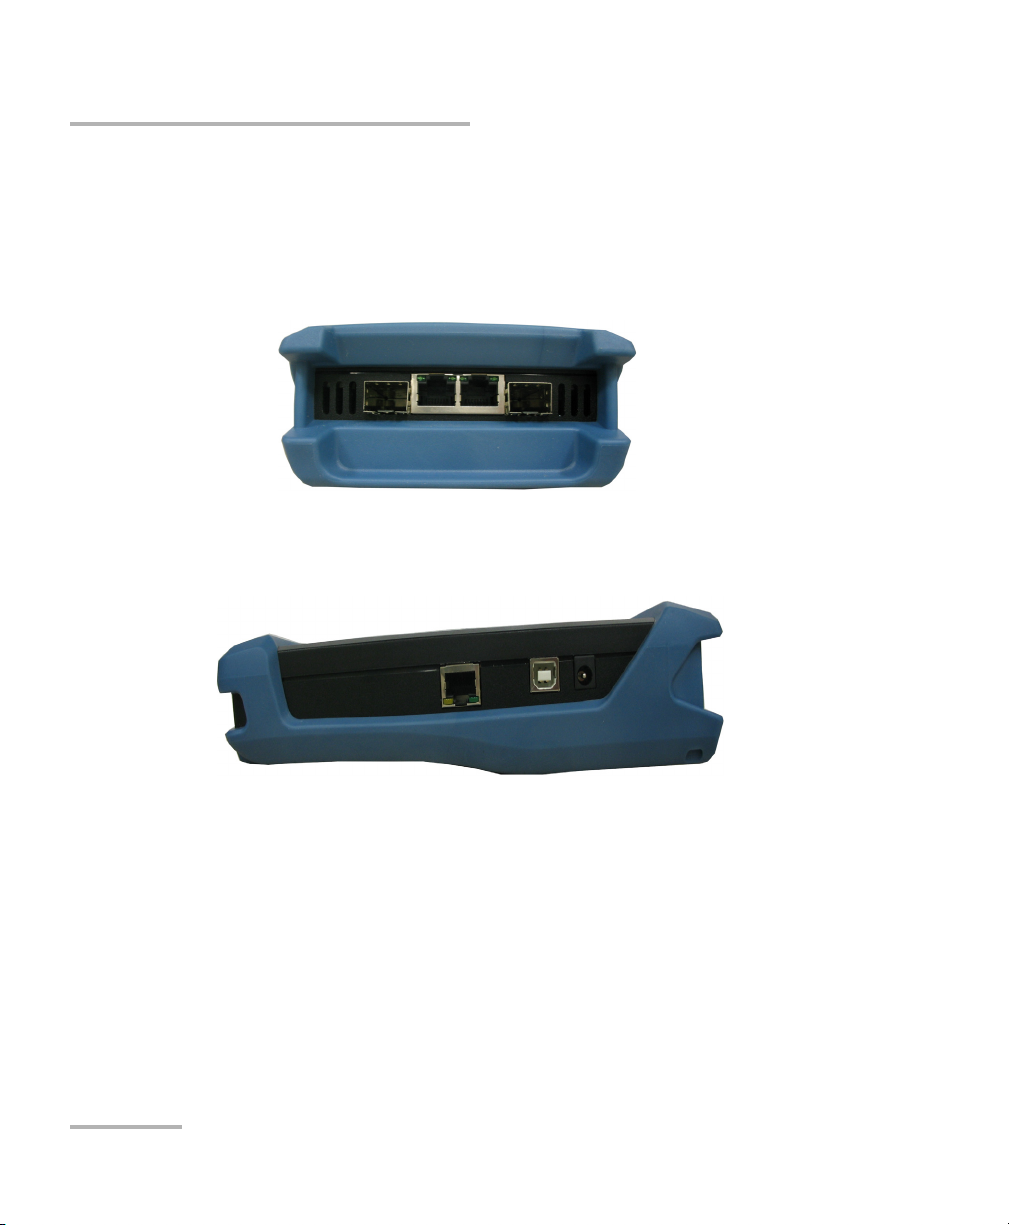
External Connectors
Your unit is equipped with the communication ports shown below:
Top panel
Side panel
8 ETS-1000
Page 17

Introducing the ETS-1000
External Connectors
Tester connectors and equipments to be connected are described in the
table below:
Designation Description Connected Equipment
A,B RJ-45 connectors to
connect to
the tested network
or equipment
(supported rates
10/100/1000 Mbps)
SFP-module
connectors
LAN Remote control
connector
(supported rates
10/100 Mbps)
USB Connect to PC via
USB-interface
12 V External power unit
connector
Ethernet cable
SFP-module
Ethernet cable
USB cable
Power s u pp ly un it
Ethernet Tester Analyzer 9
Page 18
Introducing the ETS-1000
Optical Transceivers
Optical Transceivers
The following table lists the compatible SFPs that can be ordered through
EXFO.
EXFO part
Number
FTB-8592 1000Base-ZX, 1550 nm, 80 Km
FTB-8591 1000Base-LX, 1310 nm, 10 Km
FTB-8590 1000Base-SX, 850 nm, 550 m
FTB-8597 1000Base-BX10-U, Bi-directional 1310 nm TX, 1490 nm RX,
10 Km
FTB-8596 1000Base-BX10-D, Bi-directional 1490 nm TX, 1310 nm RX,
10 Km
Description
10 ETS-1000
Page 19
Introducing the ETS-1000
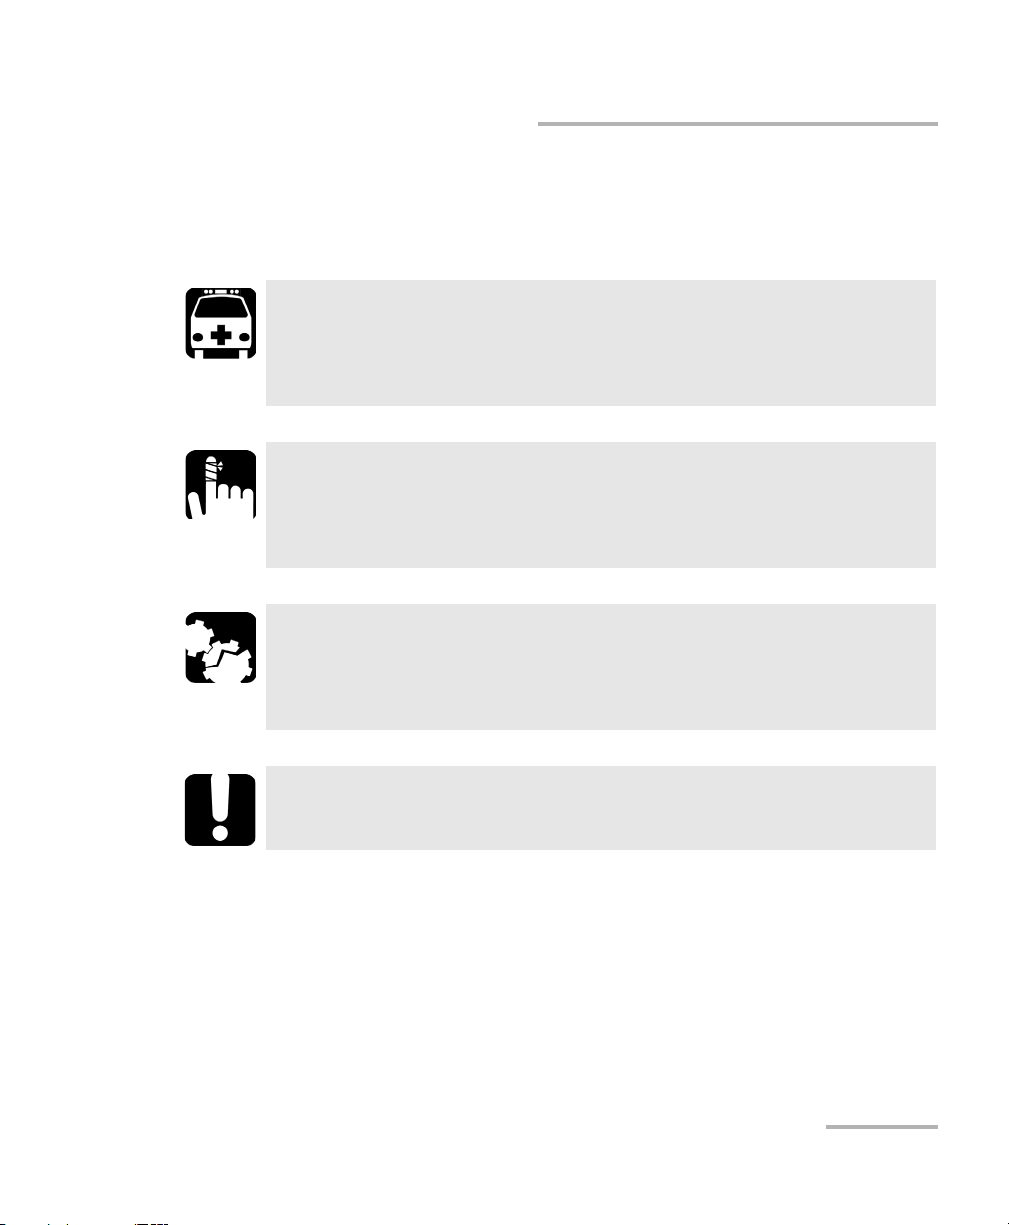
Conventions
Before using the product described in this guide, you should understand
the following conventions:
WARNING
Indicates a potentially hazardous situation which, if not avoided,
could result in death or serious injury. Do not proceed unless you
understand and meet the required conditions.
CAUTION
Indicates a potentially hazardous situation which, if not avoided,
may result in minor or moderate injury. Do not proceed unless you
understand and meet the required conditions.
CAUTION
Indicates a potentially hazardous situation which, if not avoided,
may result in component damage. Do not proceed unless you
understand and meet the required conditions.
Conventions
IMPORTANT
Refers to information about this product you should not overlook.
Ethernet Tester Analyzer 11
Page 20

Page 21
2 Safety Information
Laser Safety Warnings
WARNING
Do not install or terminate fibers while a laser source is active.
Never look directly into a live fiber, and ensure that your eyes are
protected at all times.
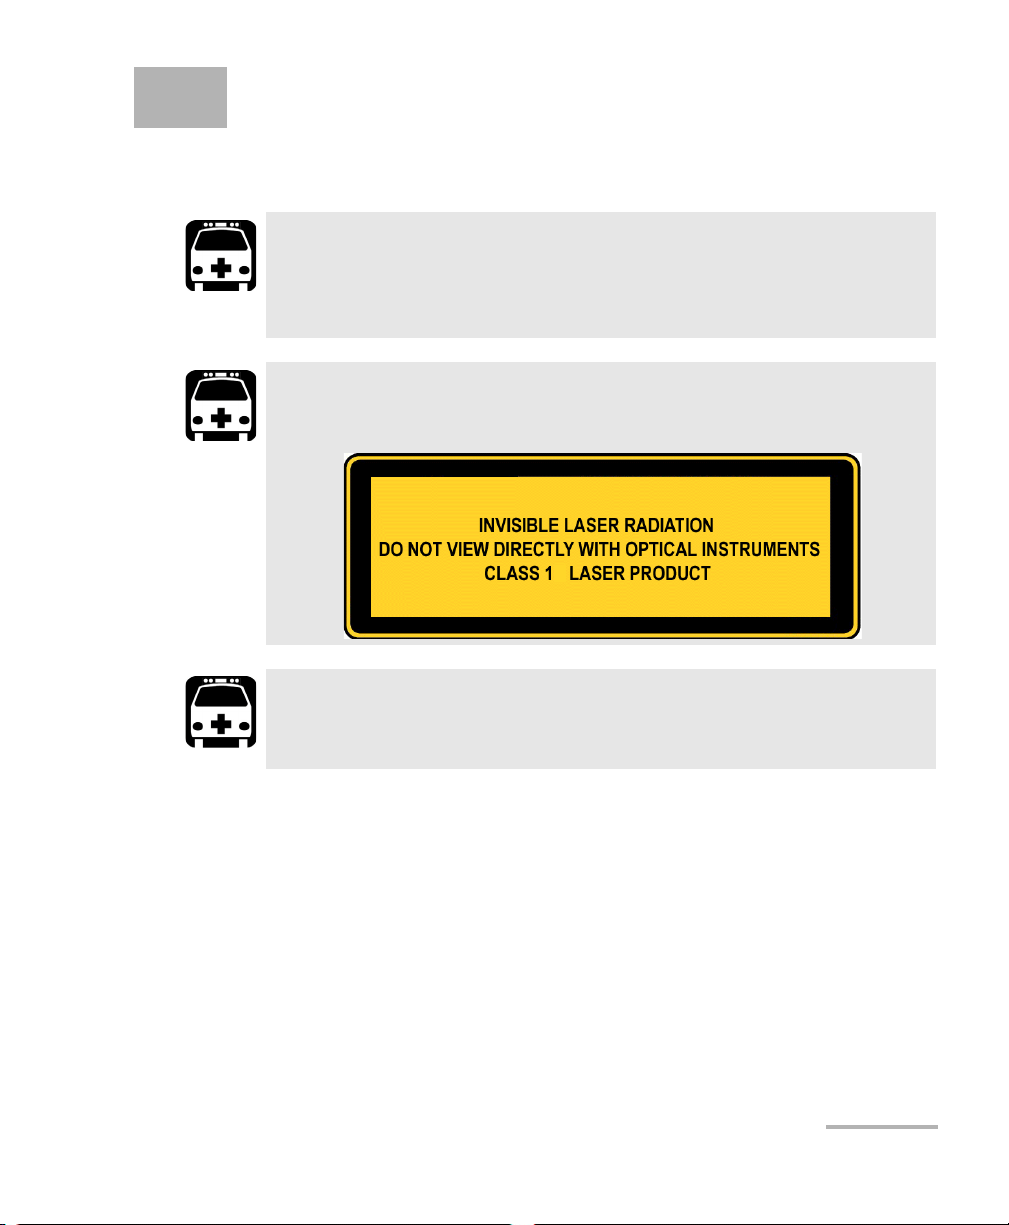
WARNING
This product may employ pluggable SFP lasers.
WARNING
When the LASER LED is on, the ETS-1000 is receiving/emitting an
optical signal.
Ethernet Tester Analyzer 13
Page 22

Safety Information
Installation Instructions Warnings
Installation Instructions Warnings
No user serviceable parts are contained inside. Contact the
manufacturer regarding service of this equipment.
All wiring and installation must be in accordance with local building
and electrical codes acceptable to the authorities in the countries
where the equipment is installed and used.
Electrostatic Discharge (ESD) Sensitive Equipment:
To minimize the risk of damage, dissipate static electricity by
touching a grounded unpainted metal object
CAUTION
IMPORTANT
CAUTION
before connecting or disconnecting cables to/from the module.
before inserting or removing SFPs to/from the analyzer.
IMPORTANT
Unauthorized modifications to this equipment shall void the user’s
authority to operate this equipment.
14 ETS-1000
Page 23

3 Getting Started
Before setting up the procedures and performing tests on your ETS-1000
analyzer, turn the unit on.
To turn the unit on:
1. Get the tester from the box and make the external examination.
2. Keep the tester in normal environmental conditions for at least 2 hours
(if the tester has been previously kept in conditions distinct from
normal).
3. Connect the power supply unit to the electric network (if you use
mains voltage 110–240V with the 50/60Hz frequency).
4. Turn the unit on.
Ethernet Tester Analyzer 15
Page 24

Page 25
4 Setting up your Unit
You can configure the network, test interface, and other unit settings for
your ETS-1000 analyzer before testing.
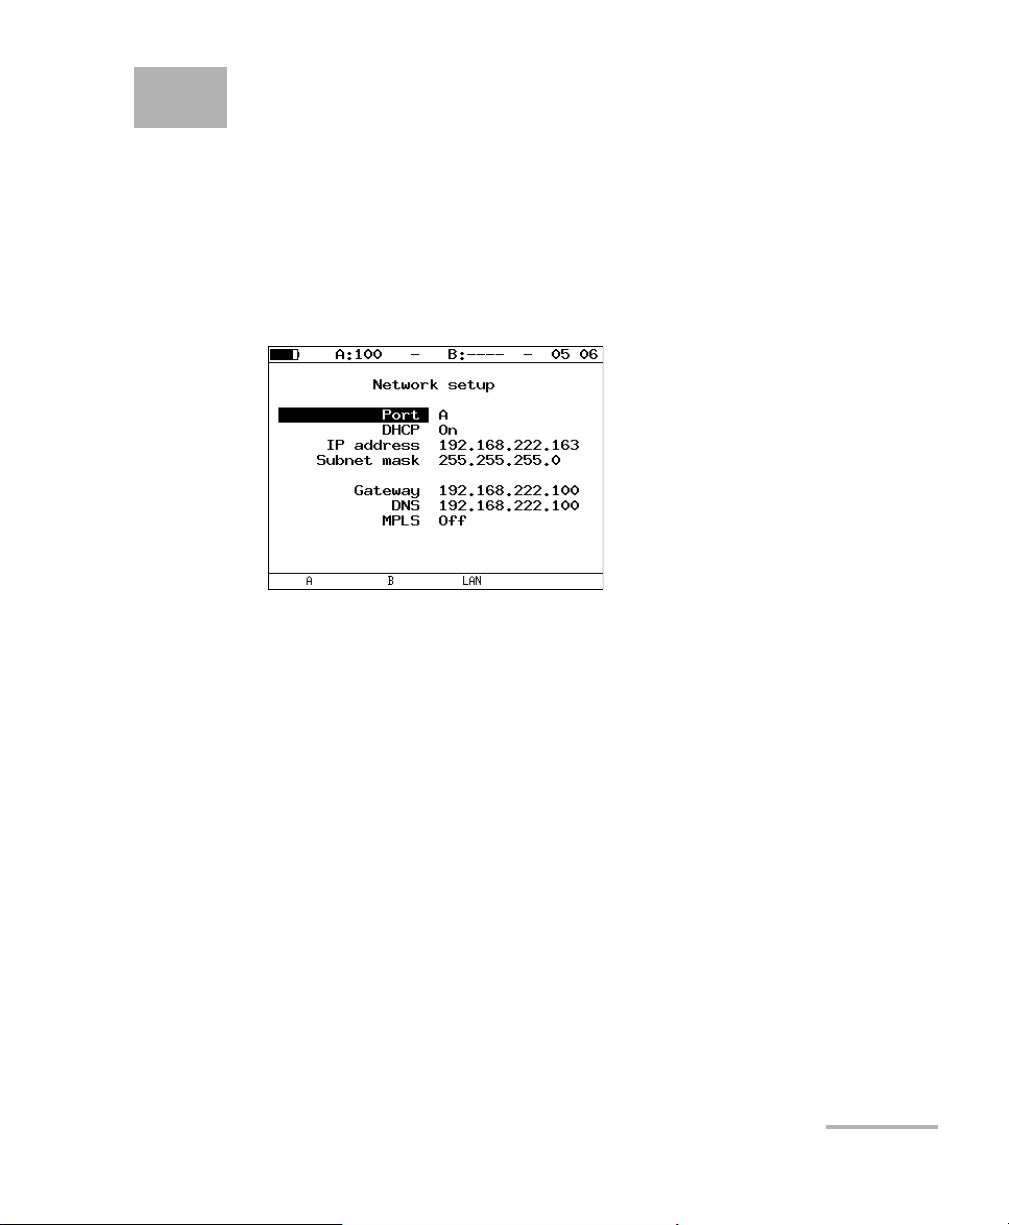
Network setup
Configure the Network parameters from the Network setup menu as
explained below.
Port A :
Port: select port (A, B, or LAN).
DHCP: if enabled, all parameters (IP address, subnet mask, gateway IP
address, and the DNS server IP address) are provided automatically by
the DHCP server.
IP address: port IP address.
Subnet Mask: specifies which part of the IP address is the network
address and which part is the host address.
Gateway: gateway IP address.
Ethernet Tester Analyzer 17
Page 26

Setting up your Unit
Network setup
DNS—IP: address of the DNS-server.
MPLS: on/off frames with label transmitting for port A (B) (for LANport
MPLS does not supported). If a value of the MPLS field will be set to Off
MPLS field (Interface setup menu) will become inaccessible for
editing.
Note: Note: gateway IP address and IP address of the DNS-server are established
independently for each port.
18 ETS-1000
Page 27
Setting up your Unit
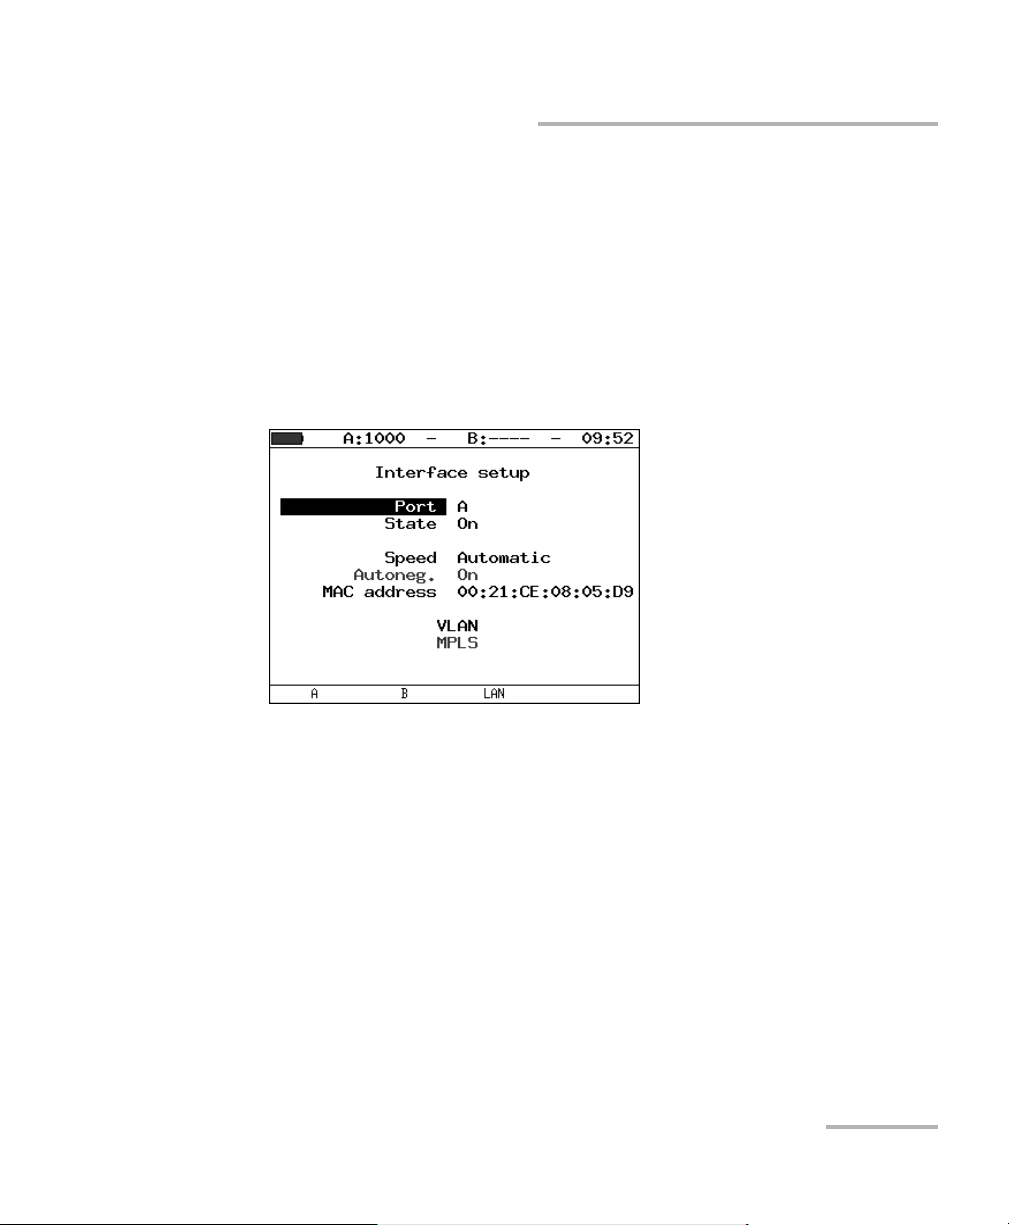
Interface setup
Interface setup
The Interface setup is used to configure the local test interface. The
required parameters correspond to the physical, data link, and network
layers. The parameters are globally configured and applied to all the tests
and tools. Ensure that these parameters are set before running any tests or
tools.
Configure the interface parameters from the Interface setup menu as
explained below.
Port: Select the Port to customize.
State: switch on/off the port. You can switch off unused port to save the
power.
Speed: select transmission rate. If you selected Automatic, then
transmission rate will be determined automatically (any of the
10/100/1000 Mbit/s values can be used). Also, in this case a value of the
Autoneg. Field will be set to On and become inaccessible.
Ethernet Tester Analyzer 19
Page 28
Setting up your Unit
Interface setup
Autoneg: enabling the auto-negotiation mode. If enabled, you need to
select the preferable rate (or set Automatic, any of the
10/100/1000Mbit/s values that can be used) and set the
Auto-negotiation parameter to On. The connection will be established
only if the auto-negotiation mode is enabled also on remote end, and
at least one of the parameters is set to the same value.
MAC address: MAC address of the port (A, B, or LAN), which can be
specified.
VLAN: Enabling/Disabling VLAN parameters setup.
ID: 12-bit VLAN identifier (integer in the range 0–4095).
Priority: traffic priority.
MPLS: switch to the MPLS. Interface A menu (MPLS. Interface B).
Note: if you use SFP-modules, then the Speed should be always set to the 1Gb/s
value.
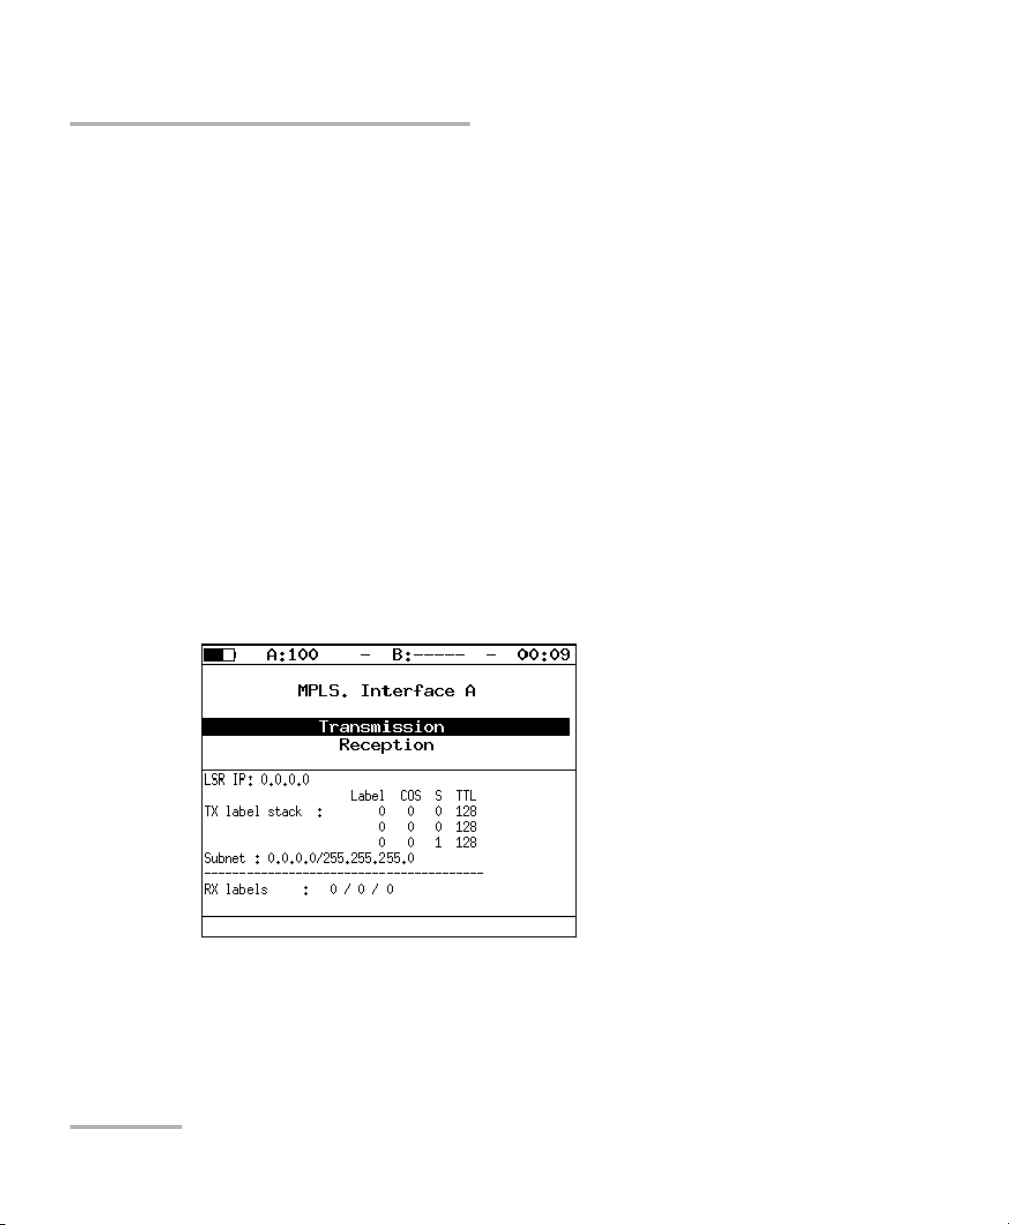
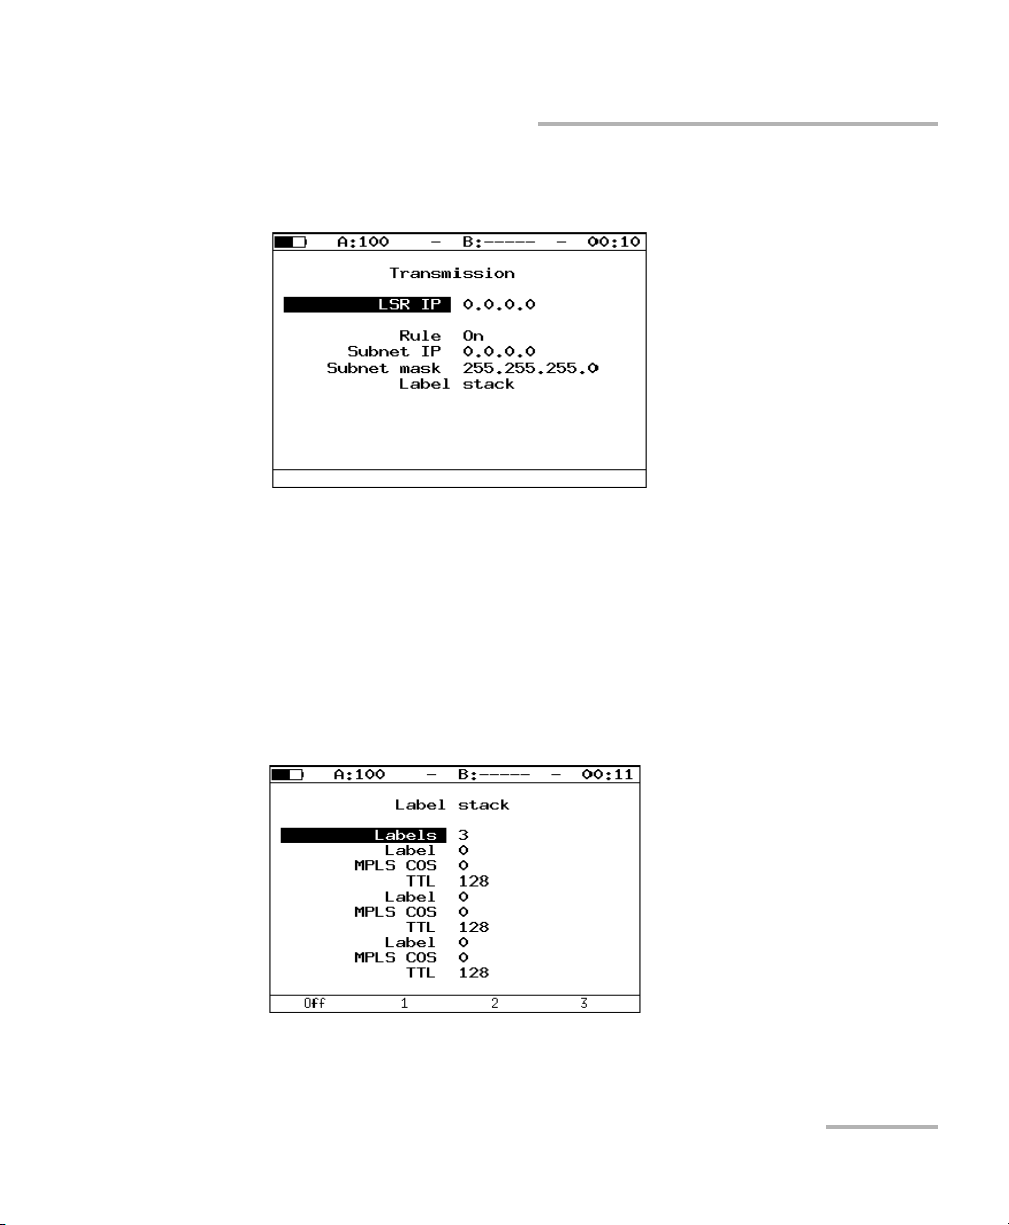
Transmission: switch to the Label stack menu.
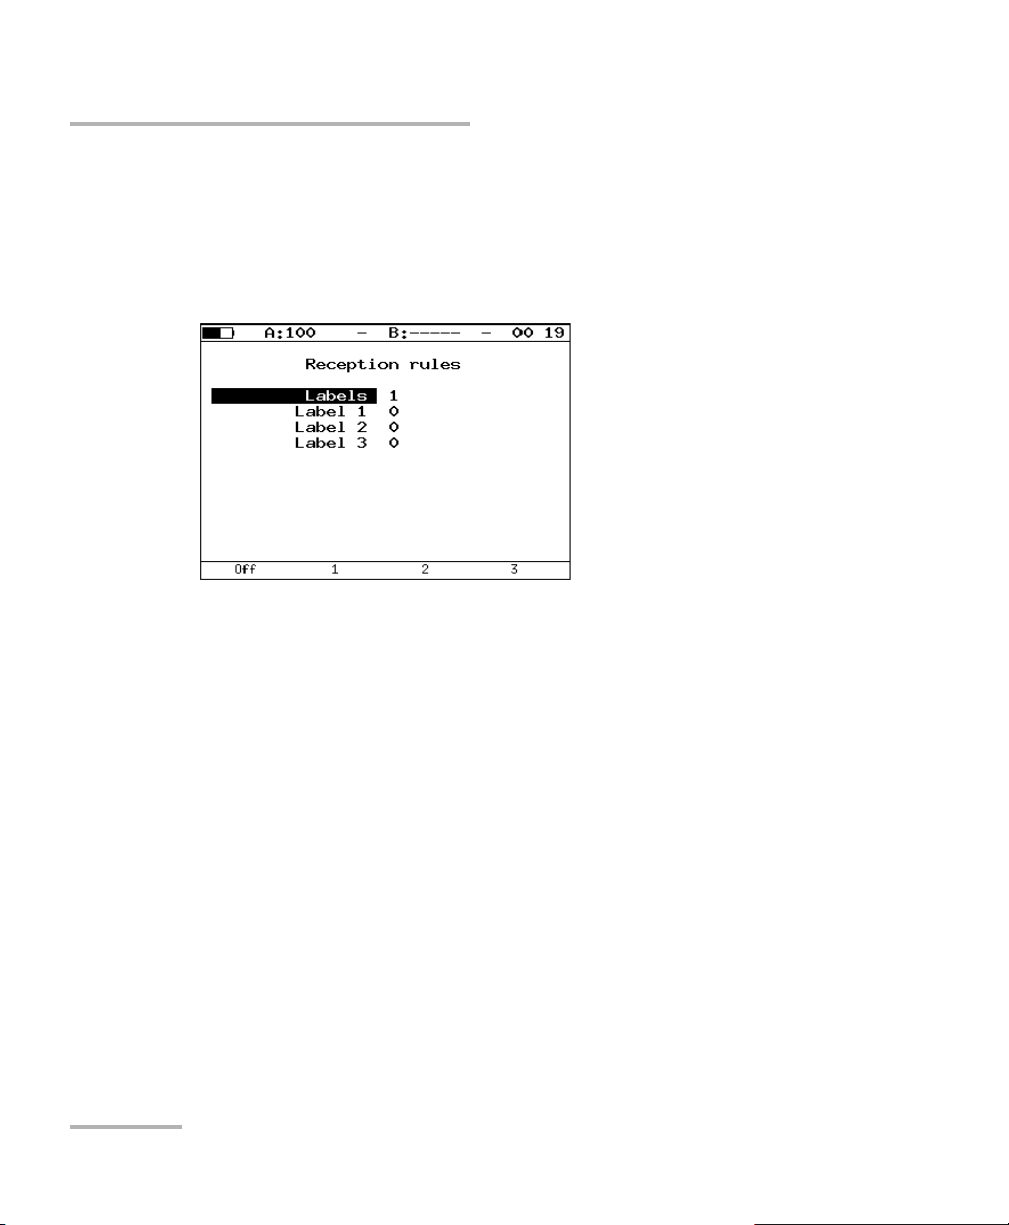
Reception: switch to the Reception rules menu.
20 ETS-1000
Page 29
Setting up your Unit
Interface setup
Values specified in the Transmission and Reception rules menu are also
displayed on the screen.
LSR IP: IP address of router interface to which the ETS-1000 is
connected. LSR realize label switching.
Rule: on/off the rule for sending packets in the subnet parameters of
which defines below.
Subnet IP: subnet IP address
Subnet mask: subnet mask.
Label stack: switch to the label stack menu.
Labels: number of labels (1–3).
Ethernet Tester Analyzer 21
Page 30
Setting up your Unit
Interface setup
Label: Table value.
MPLS cos: class of service for datagram.
TTL: time to live for datagram.
Labels: number of labels (1–3).
Label 1, Label 2, Label 3: label value.
22 ETS-1000
Page 31

Setting up your Unit
Unit Setup
Configure the unit parameters from the Unit setup menu as explained in
the below unit.
Display Settings
To fit your work environment, you may adjust the LED, LCD display settings,
keyboard beeping etc.
Configure the display parameters from the LCD, LED and Keyboard menu
as explained below.
Unit Setup
LEDs bright: Select LEDs bright. to customize the LED brightness.
Backlight: Select Backlight to customize the screen backlight
brightness.
Chromaticity: Select Chromaticity to customize display chromaticity.
Contrast: Select Contrast to customize display contrast.
Keyboard beep: Enable (On) or Disable (Off) the keyboard beeping.
Ethernet Tester Analyzer 23
Page 32

Setting up your Unit
Unit Setup
LCD auto off: Select LCD auto off for switching off the display
automatically. The available options are:
Off
20 sec
40 sec
60 sec
To increase the autonomous action period, select the minimum value.
Auto power off: Select Auto power off for switching off the tester
automatically. The available options are:
Off
1 minute
5 minutes
10 minutes
24 ETS-1000
Page 33

Setting up your Unit
Unit Setup
Basic Settings
Configure the language, date and time from the Basic Settings menu as
explained below.
Language: Set the interface language.
Date: Enter or select the current date.
Time: Enter or select the current time.
Information
Displays the software versions, serial number, and MAC addresses of the
unit ports.
Ethernet Tester Analyzer 25
Page 34

Setting up your Unit
Unit Setup
SFP Information
The optical interface on the module is made available via a Small Form
Factor Pluggable Module (SFP). For a list of supported SFPs, refer to Optical
Transceivers on page 10- The SFP Information displays the following
information about the SFP-module:
Vendor name
Part number: SFP model
Mode: supported data transfer mode
To select the port, press for port A or for port B.
26 ETS-1000
Page 35

Battery
Setting up your Unit
Unit Setup
Displays the following data about the current condition of the internal
battery: temperature (
C), voltage (mV), current (mA), current/maximum
capacity (mAh), and the charging time (period of time passed after the
charging start) in seconds.
Ethernet Tester Analyzer 27
Page 36

Setting up your Unit
Unit Setup
Profiles
ETS-1000 allows to create up to 10 profiles with tools and tests settings.
User can create profile with settings of:
RFC-2544, BERT, Packet jitter, Complex traffic, Test traffic;
network interfaces;
IP utilities: PING, Traceroute, TCP client.
To create the profile it is necessary to execute needed settings, switch to
the menu Profiles and press (Save). Remote control commands are
described in the appendix C
28 ETS-1000
Page 37

Setting up your Unit
Unit Setup
Event Log
Event log provides events messages display in the ETS-1000. Setup Log
menu and also in console terminal by connection to the device via
USB-interface and by remote control via TELNET protocol.
Logged events are listed below:
start/stop of the test;
Loopback mode is switched on/off;
change of connection state;
remote test is running;
device is switched on/off;
low battery.
If one of these events occurred, the following message will be displayed in
the console terminal/Log menu.
<date> <time> <sender> <message>
For example, if you switch on Loopback mode at the 2nd layer on port B,
the following message will be displayed:
By default the function of messages displaying via USB interface and via
TELNET protocol is switched off. To switch on/off use log on/off remote
control command.
Ethernet Tester Analyzer 29
Page 38

Setting up your Unit
Unit Setup
To clear the buffer press F1 (Clear ). To save messages about occurred
events switch to the results menu (press F4 (Results)).
If you save results of any test, the messages are also saved.
30 ETS-1000
Page 39

Setting up your Unit
Unit Setup
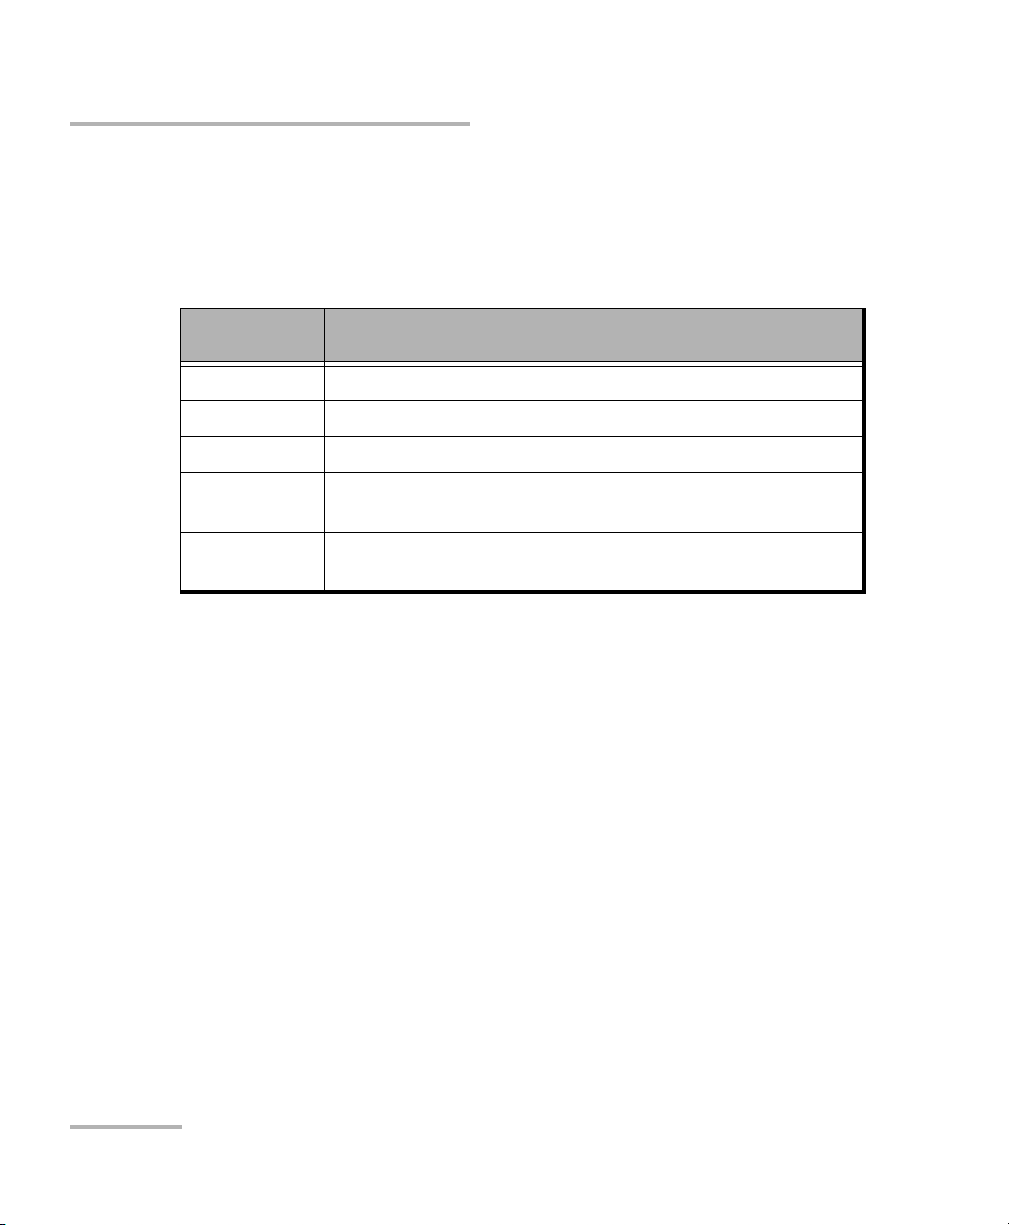
Managing Options
Option is an additional functionality of the ETS-1000 analyzer that is not
bundled in the basic shipment.
To activate an option, you need to get an activation key, which is generated
for the particular serial number of a unit. Enter the key in the Options
menu or via remote control using the ats command (see Remote Control
Commands on page 141 for details).
Option Description
ETIP TCP/IP network diagnostics (routing, nodes
availability, DNS).
ETWEB HTTP-connections testing (requires ETIP
option enabled).
ETJT Packet jitter measurements.
ETRC Remote control for the ETS-1000 via TELNET
protocol and WWW-interface.
ETMM Complex traffic generating
ETMPLS MPLS support
ETAT Asymmetric test support
Ethernet Tester Analyzer 31
Page 40

Page 41

5 Typical Tasks and Solutions
Typical Tasks
The main task for Ethernet-network testing is the compliance validation of
service level agreements (SLAs) between operators and subscribers.
Quality of Service (QoS) must be verified. This can be accomplished by
performing the RFC2544 test which provides throughput, frame loss rate,
latency, and back-to-back measurements. When multiple services/QoS
levels are provided, the performance is best verified via a multiple stream
test. Other utility tools such as Ping and Trace Route provide basic network
connectivity information. Finally in order to perform end-to-end tests, the
Loopback mode allows re-directing traffic at the physical, data link,
network and transport OSI layers.
RFC 2544 Methodology
The RFC 2544 methodology defines a specific set of tests to measure and
report the performance characteristics of network unit. According to the
RFC 2544, for Ethernet-network test the following frame sizes are
recommended to be used: 64, 128, 256, 512, 1024, 1280, and 1518 bytes.
Taking into consideration the tests defined by the methodology
(throughput, latency, frame loss rate, and back-to-back), this methodology
is the de-facto standard for analyzing the Ethernet-network performance.
ETS-1000 analyzer supports four standard tests defined by the RFC 2544
methodology.
Ethernet Tester Analyzer 33
Page 42

Typical Tasks and Solutions
RFC 2544 Methodology
Throughput
This test allows to determine the maximum possible rate for the
Ethernet-networks equipment.
Throughput: the fastest rate at which the number of test frames transmitted
by the DUT is equal to the number of test frames sent to it by the test
equipment.
When measuring the throughput, specific number of frames with
minimum interframe gap is sent to DUT. Then, the analyzer counts the
frames that are transmitted by the DUT. If the fewer frames are received
than transmitted, the interframe gap is increased and the test reruns.
Note: The relation between interframe gap and load is inverse, thus, the bigger
the gap value is the lesser the load is.
34 ETS-1000
Page 43

Typical Tasks and Solutions
RFC 2544 Methodology
Latency
This test allows to analyze the time it takes for a frame to be transmitted
from the source to destination and then back to the source. The latency is
one of the major parameters for real-time applications running over
Ethernet networks.
When analyzing the latency, the throughput for DUT at each of the listed
frame sizes is determined first. Then, a stream of frames at a particular
frame size is sent through the DUT at the determined throughput rate to a
specific destination. The minimum duration of the stream transmission is
set as 120 seconds (user can specify alternative value in the range of 1–
2886 seconds). In a specific time, an identifying tag is included into one
frame with the type of tag being implementation dependent. The time at
which this frame is fully transmitted is recorded as a tag time stamp value.
The receiver port of the analyzer then recognizes the tag information in the
frame stream and records the time at which the tagged frame was
received (Tb value).
The latency value is the difference between time stamp Tb and time stamp
Ta va l ues.
The test is repeated at least 20 times (user can specify alternative value
from 1 to 30).
Ethernet Tester Analyzer 35
Page 44

Typical Tasks and Solutions
RFC 2544 Methodology
Frame Loss Rate
This test allows to estimate network’s ability to support real-time operating
applications because the big loss percentage will result in service quality
degrading.
Frame loss test allows to count the percentage of frames that have not
been transmitted by DUT due to lack of hardware resources.
To test the frame loss rate, a specific number of frames (input count) is
sent at a specific rate through the DUT to be tested and then the analyzer
counts the frames that are transmitted by the DUT (output count). The
frame loss rate at each point is calculated using the following equation:
100 × (input count - output count) / (input count)
The first trial should be run for the frame rate that corresponds to 100% of
the maximum rate for the frame size on the input media. Repeat the
procedure for the rate that corresponds to 90% of the maximum rate used
and then for 80% of this rate. The trials are continued with 10% reducing
intervals (a finer granularity is supported) until there are two successive
trials in which no frames are lost.
36 ETS-1000
Page 45

Typical Tasks and Solutions
RFC 2544 Methodology
Back-to-back
The test allows estimating the time during which the DUT is capable to
manage the maximum load.
The analyzer sends a burst of frames with minimum interframe gap to the
DUT and then counts the number of frames forwarded by the DUT. If the
count of transmitted frames is equal to the number of frames forwarded,
the time of transmission is being increased and the test is being rerun until
there are two trials succeeded with no frame lost. If the number of
forwarded frames is less than the number of transmitted ones, the time of
transmission is being reduced and the test is being rerun.
Ethernet Tester Analyzer 37
Page 46

Page 47

6 Connecting Unit
The ETS-1000 Analyzer units unit can be connected using different
connection schemes as described in this chapter.
Unit Connection Schemes
The units can be connected in four different ways
Unit Connection Scheme 1
Unit Connection Scheme 2
Ethernet Tester Analyzer 39
Page 48

Connecting Unit
Unit Connection Schemes
Unit Connection Scheme 3
Unit Connection Scheme 4
The scheme 1 shows the connection of the analyzer (using one
analyzer’s port) to the network with equipment operating on the Data
Link layer (for example, network switch). In this case, generated test
traffic should be rerouted back to the analyzer via the loopback. At the
DUT, source and destination MAC addresses are swapped in the
incoming packets, and the test stream is retransmitted back to the
source port on the analyzer.
40 ETS-1000
Page 49

Connecting Unit
Unit Connection Schemes
All the connection schemes use the following notation:
MAC s — source MAC address
MAC d — destination MAC address
MAC R — gateway MAC address
IP s — source IP address
IP d — destination IP address
The figure above shows analyzer connection to a network with
equipment operating on both the Data Link and Network layers (for
example, switches and routers). Unlike the first case, with this
connection scheme both source and destination MAC and IP
addresses are swapped and the traffic is returned to the source port.
In the case of testing networks/equipment with capability of IP-traffic
routing, two unit ports are used. Packets are rerouted from one port to
another via a router. In addition, ETS-1000 can be connected to a
network switch.
Ethernet Tester Analyzer 41
Page 50

Page 51

7 Configuring and Starting a
Test
The ETS-1000 analyzer allows performance testing as per RFC 2544,
including the following subtests:
Throughput
Latency
Frame loss
Back-to-back
Before performing the above tests, the test parameters are required to be
configured. You can also view the test results from your ETS-1000 analyzer.
RFC 2544 General Settings
Configure the following RFC 2544 general settings in your ETS-1000
analyzer.
Setting Up the Header
Configure the following parameters from the Header menu as explained
below.
Src MAC: Enter the MAC address of a source interface.
Ethernet Tester Analyzer 43
Page 52

Configuring and Starting a Test
RFC 2544 General Settings
Dst MAC: Enter the destination MAC address.
If a transmitter and receiver are connected directly, without using
any router, enter the MAC address of the receiver interface.
If there is at least one router between the sender and the receiver,
enter the MAC address of the router that is nearest to the receiver.
Src IP: Enter the source IP address.
Dst IP: Enter the destination IP address.
Note: ETS-1000 can also setup the MAC and IP addresses automatically.
To substitute the current MAC address value with the A (B) port MAC
address specified in the Information menu, press ( ).
To substitute the current IP address value with the A (B) port IP address
specified in the Network setup menu, press ( ).
Upon pressing button (with Dst MAC selected), the ARP-request
will be performed. As a result of the request, instead of the destination
MAC address, the MAC address corresponding to the destination IP
address will be used.
Values specified in the Header (adv) menu are also displayed.
Setting Up the Header (advanced)
44 ETS-1000
Page 53

Configuring and Starting a Test
RFC 2544 General Settings
ID: Enter the VLAN ID. The accepted range is 0 to 4095. The 12-bit
VLAN identifier is a number, that explicitly defines VLAN to which the
packet belongs.
The null VLAN ID indicates that the tag header contains only user
priority information and no VLAN identifier is present in the frame.
If the VLAN ID is set to 1, then while transmitting through the router’s
port, the VLAN ID will be automatically set equal to the VLAN ID of this
port.
Priority: Select the VLAN Priority. Eight values of priority ([1]) are
supported.
Correspondence between priority and traffic type are as follows:
Value Description
1 Background
0 (Default) Best Effort
2 Excellent Effort
3 Critical Applications
4Video
5Voice
6 Internetwork Control
7 Network Control
Priority 0 is reserved for the best transmission and is assigned if none
other class has been specified. Priority values 1 to 3 are intended for
use with different tasks from the streaming applications to the FTP
traffic that can cope with possible data loss. Priority values 4 and 5 can
be used for latency sensitive traffic such as video or speech.
Priority values 6 and 7 (Internetwork Control and Network Control
traffic types) are intended for network management messages.
Ethernet Tester Analyzer 45
Page 54

Configuring and Starting a Test
RFC 2544 General Settings
Precedence: Frame priority field. In accordance with RFC 791 [2], eight
priority values are available. Sender can specify any priority value from
the table shown below.
Value Description
0Routine
1Priority
2Immediate
3Flash
4Flash Override
5CRITIC/ECP
6 Internetwork Control
7 Network Control
46 ETS-1000
Page 55

Configuring and Starting a Test
RFC 2544 General Settings
ToS (Type of Service): the field determines type of service for
datagram. The source can set any value from the table below in
accordance with RFC 1349 [4] methodology.
Value Description Notes
1000 Minimize delay Use the value if a
period of packet
delivery from the
source to destination
(latency period) is the
main priority and must
be minimum.
0100 Maximize throughput Use the value to
specify that the packet
must be routed
through the link with
the maximum
throughput.
010 Maximize reliability Use the value to
ensure the packet is
delivered without
retransmission
001 Minimize monetary
cost
Use the value to
minimize the
monetary cost of the
data delivery
000 All normal In this case packet
routing is left at the
discretion of a
provider.
UDP src: Enter the source UDP port.
UDP dst: Enter the destination UDP port.
Ethernet Tester Analyzer 47
Page 56

Configuring and Starting a Test
RFC 2544 General Settings
RFC 2544 MPLS Settings
The Label stack for networks testing can be specified in the Label stack
menu. Configure the following parameters from the Label Stack menu as
explained below.
Press Te sts , select RFC 2544, Setup, Header, Advanced, and MPLS.
Labels: Enter the number of labels. Choices are from 1 to 3.
Label: Enter the Label value.
MPLS COS: Select the Class of Service (COS) for datagram.
TTL: Enter the Time to Live (TTL) value for datagram.
48 ETS-1000
Page 57

Configuring and Starting a Test
RFC 2544 General Settings
Test Topol ogy
Use the Topo lo gy menu to specify receiving and transmitting ports. The
same port can be used for both data transmission and receiving (for
example, with the Loopback feature). If you use asymmetric test function
you must select Remote as receiving/transmitting port.
Selecting Frame Size
Configure the frame sizes as explained below.
To perform tests, user can do any one of the following.
Select standard sizes of transmitted frames in accordance to the RFC
2544 methodology by pressing . The standard default frame sizes
are 64, 128, 256, 512, 1024, 1280, 1518 bytes.
Enter any frame size from the acceptable range of 64 to 9600 bytes.
Ethernet Tester Analyzer 49
Page 58

Configuring and Starting a Test
RFC 2544 Test Parameters Setup
RFC 2544 Test Parameters Setup
Configure the test parameters for the Throughput, Latency, Frame loss and
Back-to-back tests.
Throughput Test Settings
The objective of this test is to find the throughput of the unit under test for
which there is no frame loss. Starting at the specified maximum rate
(Maximum Rate), the rate converges towards the highest throughput
without frame loss with the test having a predefined duration (Test Time).
The throughput measurement is performed for each defined frame size.
Enabled: Enable (Yes) or Disable (No) the throughput analysis.
Rate,%: indicates the load value, specified in the percentage of the test
flow rate. The accepted range is 1 to 100 %.
Trial, s: indicates the period of time during which the test is performed
for each of the specified frame sizes. The accepted range is 1 to
2886 seconds.
50 ETS-1000
Page 59

Configuring and Starting a Test
RFC 2544 Test Parameters Setup
Resolution, %: throughput analysis resolution value. Possible values:
10 ( F1), 1 (F2 ), 0.1 (F3 ), 0.01 (F4 ). Lesser resolution value is, the
bigger throughput analysis accuracy is.
Threshold, %: throughput analysis threshold of loss value in percent of
current load. Possible values: 0 - 10 %. Trial is successful if loss doesn’t
exceed the threshold. This feature allows to determine through-put of
channel with invariable loss. As per rfc2544 trial is successful if loss is 0.
Ethernet Tester Analyzer 51
Page 60

Configuring and Starting a Test
RFC 2544 Test Parameters Setup
Latency Test Settings
The objective of this test is to find the time required for the sent frame to go
through the unit under test and return to the ETS-1000 analyzer. Starting by
sending a stream of frames for the predefined duration and rate at a
particular frame size, an identifying dependent tag is included in one
frame. The time at which this frame is transmitted is recorded (timestamp
A). When the tagged frame comes back, the time is recorded again
(timestamp B) and the Latency result is: timestamp B - timestamp A. The
test is repeated for the defined number of times and the average result is
calculated.
The Latency test is performed for each defined frame size.
Enabled: Enable (Yes) or Disable (No) the latency analysis.
Trial qty: indicates the number of test trials performed for each
specified frame size.
Trial, s: indicates the period of time during which the test is performed
for each of the specified frame sizes. The accepted range is 1 to
2886 seconds.
Rates (L1): switched to Rates (L1) menu.
52 ETS-1000
Page 61

Configuring and Starting a Test
RFC 2544 Test Parameters Setup
Rate source: if you press button (F1) (Throughput), Latency test will
be performed with rates values that are a result of Throughput test. If
you press button (F2) (Manually), Latency test will be performed with
physical (L1) rates value defined by user in percent (F1), in kbps (F2)
or in Mbps (F3).
Ethernet Tester Analyzer 53
Page 62

Configuring and Starting a Test
RFC 2544 Test Parameters Setup
Frame Loss Test Setting
The objective of this test is to find the percentage of frames that are lost
due to lack of resources. The test is performed for a specific frame size and
for the specified duration.
The Frame loss test is performed for each defined frame size.
Enabled: Enable (Yes) or Disable (No) the Frame loss analysis.
Trial, s: indicates the period of time during which the test is performed
for each of the specified frame sizes. The accepted range is 1 to
2886 seconds.
Steps, %: indicates the number of rate changing steps in percentage.
The accepted range is from 1 to 10 %.
Start rate, %: indicates the range of physical rates value at which the
test starts for each of the specified frame sizes.
Stop rate, %: indicates the range of physical rates value at which the
test stops for each of the specified frame sizes.
54 ETS-1000
Page 63

Configuring and Starting a Test
RFC 2544 Test Parameters Setup
Back-to-back Test Settings
The objective of this test is to find the maximum number of frames at
maximum rate that can be sent without frame loss. A number of frames are
sent with minimum inter-frame gaps to the unit under test and the number
of forwarded frames are counted. If the count of transmitted frames is
equal to the number of forwarded frames, the length of the time is
increased and the test is rerun. If the number of forwarded frames is less
than the number of transmitted frames, the duration is reduced and the
test is rerun. The back-to-back value is the number of frames in the longest
time that the device under test (DUT) can handle without any frames loss.
The test performs the number of defined trials.
The back-to-back test is performed for each defined frame size.
Enabled: Enable (Yes) or Disable (No) the Back-to-back analysis.
Trial qty: indicates the number of test trials performed for each
specified frame size.
Trial, s: indicates the period of time during which the test is performed
for each of the specified frame sizes. The accepted range is 1 to
2886 seconds.
Rates (L1): switched to Rates (L1) menu.
Ethernet Tester Analyzer 55
Page 64

Configuring and Starting a Test
RFC 2544 Test Parameters Setup
Advanced
Configure the advanced menu as explained below.
Wait time, ms: Specify the period between the end of test traffic
generation and the end of trial.
Note: In accordance with RFC 2544 methodology, the wait time is 7000 ms and
learn time is 2000 ms.
Learn time, ms: Specify the period between learning frame sending
and trial start.
Note: User can specify arbitrary values of wait time within 100–7000 ms range.
Learn time must be within 100–2000 ms range.
56 ETS-1000
Page 65

Configuring and Starting a Test
RFC 2544. Performing Analysis
RFC 2544. Performing Analysis
Throughput Test Results
Tab le
Test results are displayed as a table that contains the following values:
frame size (bytes), throughput value (percents), measured value for the
throughput (select unit measure by pressing (F3): Frm/s, Mb/s L2, Mb/s L3,
Mb/s L4).
Graph
Ethernet Tester Analyzer 57
Page 66

Configuring and Starting a Test
RFC 2544. Performing Analysis
The diagram shows throughput values for each specified frame size. The
measured throughput value in Frm/s and in percentage (relatively to the
specified rate) is displayed on the diagram vertical bars.
The results may be displayed in two ways (press button):
1. The maximum value marked on the Y axis is the maximum
transmission rate value. The X axis shows frame size value. Empty bars
display maximum theoretical rate value. Completed bars display
measured rate value.
2. The maximum value marked on the Y axis is the maximum measured
rate value. The X axis shows frame size value.
58 ETS-1000
Page 67

Configuring and Starting a Test
RFC 2544. Performing Analysis
Latency - Test Results
Tab le
The table shows mean value for the latency (ms) for each of the specified
frame sizes, and the corresponding value of the throughput (percent)
measured as a result of the Throughput test.
Graph
On the diagram, for each of the frame sizes a vertical bar shows the mean
value of the latency (ms).
Ethernet Tester Analyzer 59
Page 68

Configuring and Starting a Test
RFC 2544. Performing Analysis
Frame Loss - Test Results
Tab le
The table shows the frame loss value (percent) for each of the specified
frame sizes (in bytes) and the rate value (percent, Mb/s L2, Mb/s L3, Mb/s
L4).
Graph
On the diagram, for each of the specified frame sizes the relation between
frame loss (percent) and the rate (percent) is shown.
60 ETS-1000
Page 69

Configuring and Starting a Test
RFC 2544. Performing Analysis
Back-to-back - Test Results
Tab le .
For each of the specified frame sizes, the table shows period of time during
which the tested equipment is coping with peak load.
If this time is not detected, the error messages are shown in the test stage
column and dashes appear in the Time, s column.
If you press (F3) button (Frames), the Count column will be shown instead
Time, s column.
Ethernet Tester Analyzer 61
Page 70

Configuring and Starting a Test
RFC 2544. Performing Analysis
Graph
On the diagram, for each of the specified frame sizes a vertical bar shows
measured value of the time during which the tested equipment was coping
with peak load. The count of frames that are transmitted during the test is
displayed on the diagram vertical bars.
62 ETS-1000
Page 71

Configuring and Starting a Test
Asymmetric Test
Asymmetric Test
Asymmetric test function 4 is used to check operability of communication
link that has different transmitting and receiving rates.
For asymmetric test, two ETS-1000 unit should be used: local and remote.
On the local unit the test parameters are set. The remote unit is on the
other end of asymmetric channel. Test traffic generation can be performed
in two ways:
From local unit to remote: In this case the port A(B) is set as a source
port. Port Remote is selected as a destination one.
From remote unit to local: In this case the port Remote is set as a
source port. Port A(B) is selected as a destination one.
Tests for which the function is available are listed below:
RFC 2544: throughput, frame loss, back-to-back.
BERT (L2, L3, L4).
Complex traffic.
Ethernet Tester Analyzer 63
Page 72

Configuring and Starting a Test
Complex Traffic
Complex Traffic
Function of complex traffic generation allows to generate up to 10 data
streams with different settings. Using this function you can emulate various
types of rates, check priority accuracy in the tested equipment.
Tests: Switch to the summary menu of Complex traffic (test start,
results display).
To start test, press button (Start).
After the end of testing, the following parameters will be displayed:
specified frame size (in Bytes).
specified rate (in %).
frame loss (in %).
bandwidth (in Mbps).
64 ETS-1000
Page 73

Configuring and Starting a Test
Complex Traffic
To switch to the screen that contains graphical representation of test
results, press button (Plot).
On the diagram, for each stream a vertical bar shows measured loss value.
To switch to the Results menu, press button (Results). To switch to
the Complex traffic: latency screen, press button.
All the latency values for complex traffic use the following notation:
Curr, ms: Current value of latency (in ms)
Min, ms: Minimum value of latency (in ms)
Avg, ms: Average value of latency (in ms)
Max, ms: Maximal value of latency (in ms)
Ethernet Tester Analyzer 65
Page 74

Configuring and Starting a Test
Complex Traffic
To switch to the screen that contains information about number of
transmitted and received frames, press button.
For each of the streams information about number of transmitted (Tx) and
received (Rx) frames is displayed on the screen.
Setup: switch to the Setup menu.
Streams: number of data streams (1–10).
Duration: time of data streams generation (1–2886 s).
Top ol og y: switch to the Topology menu.
66 ETS-1000
Page 75

Configuring and Starting a Test
Complex Traffic
Use the Topo lo gy menu to specify receiving and transmitting ports.The
same port can be used for both data transmission and receiving (for
example, with the Loopback feature). If you use asymmetric test function
you must select Remote as receiving/transmitting port.
Header: Switches to the Header menu. To select stream number,
press or buttons.
Ethernet Tester Analyzer 67
Page 76

Configuring and Starting a Test
Complex Traffic
Frames: Switches to the Frames menu. Frame size for every stream
ranges from 64 to 9600 bytes.
Rates (L2): Switches to the Rates menu. Framed rate value are
specified in percent ( ), in kbps ( ) or in Mbps ( ).
68 ETS-1000
Page 77

Configuring and Starting a Test
Complex Traffic
Complex Traffic - MPLS Settings
The Label traffic for networks testing can be specified in the Label traffic
menu. Configure the following parameters from the Label traffic menu as
explained below.
Press Te sts , select Complex traffic, Setup, Header, Advanced, and MPLS.
Labels: Enter the number of labels. Choices are from 1 to 3.
Label: Enter the Label value.
MPLS COS: Select the Class of Service (COS) for datagram.
TTL: Enter the Time to Live (TTL) value for datagram.
Ethernet Tester Analyzer 69
Page 78

Configuring and Starting a Test
Loopback
Loopback
The Loopback function is necessary for networks testing in compliance
with the RFC 2544, as well as for a number of other tasks. This function
allows to test the network without changing its settings. Network testing
with the Loopback function can be performed at the following OSI layers.
At the Physical layer (L1) all the incoming traffic is re-transmitted
backward without change; statistics are gathered for the incoming
traffic.
At the Data link layer (L2), all the incoming frames are re-transmitted
backward with swapping destination and source MAC addresses or
without swapping MAC addresses. ETS-1000 supports substitution of
destination and/or source MAC address with user-defined MAC
address. Both incoming and outgoing traffic statistics are gathered.
Note: For the loopback at the L2 or L3 layers, packets with identical destination
and source MAC addresses as well as OAM protocol data units (OAMPDU)
and ARP-requests, are not re-transmitted.
At the Network layer (L3) all incoming packets are re-transmitted
backward with source and destination IP addresses swapping.
ETS-1000 supports substitution of destination and/or source IP address
with user-defined IP address. Both incoming and outgoing traffic
statistics are gathered.
Note: if the incoming packet contains the label, it will be retransmitted without
changing it’s value
At the Transport layer (L4) all incoming packets are being
retransmitted backward (without error packets) with source and
destination IP addresses and source and destination TCP/UDP port
numbers swapping.
Note: if the incoming packet contains the label, it will be retransmitted without
changing it’s value.
70 ETS-1000
Page 79

Configuring and Starting a Test
Port: Select the Port (A or B) to enable the Loopback function.
Typ e: Select the layer at which the traffic will be retransmitted.
Physical Layer
Data Link Layer (MAC)
Network Layer (IP)
Transport (TCP/UDP)
Loopback
OAM: Switches to OAM menu.
Ethernet Tester Analyzer 71
Page 80

Configuring and Starting a Test
Loopback
Configuring L2 Loopback
Swap MAC: Enable (On) or Disable (Off) the substitution of destination
and source MAC addresses in the incoming packets.
Replace MAC: Select MAC address substitution mode.
Off: MAC address substitution is disabled
Source: Substitute Source MAC Address value
72 ETS-1000
Page 81

Configuring and Starting a Test
Loopback
Destination: Substitute Destination MAC Address value.
Src+Dst: Substitute both Source MAC Address and Destination
MAC Address values.
Source: Specify a MAC address that will substitute the Source MAC
Address of an Ethernet frame.
Destination: Specify a MAC address that will substitute the Destination
MAC Address of an Ethernet frame.
Replace VLAN: Select VLAN-tags substitution mode:
Off: VLAN-tags substitution is disabled
ID: Substitute VLAN ID values
Priority: Substitute VLAN priority values
ID+Pr: Substitute both VLAN ID and VLAN priority values
ID: Specify the value that will substitute VLAN ID of an Ethernet frame.
Priority: Specify the value that will substitute VLAN priority of an
Ethernet frame.
Ethernet Tester Analyzer 73
Page 82

Configuring and Starting a Test
Loopback
Configuring L3 Loopback
Replace IP: Select the mode of IP addresses substitution.
Off: IP address substitution is disabled
Source: Substitute Source IP address
74 ETS-1000
Page 83

Configuring and Starting a Test
Loopback
Destination: Substitute Destination IP address.
Src+Dst: Substitute both Source IP address and Destination IP
address.
Source: Specify IP address that will substitute the Source IP Address of
an Ethernet frame.
Destination: Specify IP address that will substitute the Destination IP
Address of an Ethernet frame.
Replace: Select the mode of ToS substitution.
Off: Substitution of Type of Service and Precedence values is
disabled
ToS : Substitute Type of Service values
Precedence: Substitute Precedence values
ToS +P re c: Substitute both Type of Service and Precedence values
Ethernet Tester Analyzer 75
Page 84

Configuring and Starting a Test
Loopback
ToS : Specify the value that will substitute Type of Service of an Ethernet
frame.
Precedence: Specify the value that will substitute Precedence of an
Ethernet frame.
76 ETS-1000
Page 85

Configuring and Starting a Test
OAM
An important task for service providers is to provide high quality of
administrating and maintenance for Ethernet-networks. To regulate these
tasks the IEEE 802.3ah [8] standard (also known as Ethernet in the First
Mile (EFM) OAM) was worked out.
OAM (Operations, Administration, and Maintenance) is a protocol of
monitoring the link state. The protocol operates at the Data Link Layer of
OSI model. To transmit data between two Ethernet-units, OAM protocol
data units (OAMPDU) are used. Both unit should support the IEEE 802.3ah
standard and should be connected directly.
An important feature of the OAM protocol is providing the ability to use
Loopback mode for the remote end.
OAM
Port: Select a Port for OAM configuring.
Ethernet Tester Analyzer 77
Page 86

Configuring and Starting a Test
OAM
Mode: Select Mode for OAM configuring. The available OAM states are:
Active: In active mode, the selected port can send commands to
locate remote unit, to enable the Loopback mode on the remote
unit, and to respond to the Ethernet OAM commands from the
remote unit.
Passive: In passive mode, the port can only respond to the
Ethernet OAM commands from the remote unit, but cannot initiate
the Loopback mode.
Off: OAM disabled.
Discovery: Select the state of locating the remote unit. Available states
are:
Fault
Send local
Passive wait
Send loc/rem
Send loc/rem ok
Send any
Remote unit: Press to switch to the Remote unit screen.
MAC address: MAC-address of a remote unit
78 ETS-1000
Page 87

Configuring and Starting a Test
Vend or OUI: Organization unique identifier used to generate the
MAC-address
Mode: OAM state of the remote unit
Unidirectional: Unidirectional connection support
Rem. loopback: Support of the Loopback mode for the remote
unit
Link events: Connection errors notification support
Var. retrieval: Support of reading variables that are used for
estimation of data link quality
LB status: Loopback mode state at the remote unit.
To switch on/off the Loopback mode on a remote unit, press .
OAM
Ethernet Tester Analyzer 79
Page 88

Configuring and Starting a Test
ET Discovery
ET Discovery
ET discovery function allows to switch loopback mode on at the data link,
network or transport layer on remote unit ETS-1000 or ETS-1000L.
In accordance with connection diagram it is possible to switch loopback
mode on for several units ETS-1000 and/or ETS-1000L in series. The units
may be in the same or in the different subnets.
80 ETS-1000
Page 89

Configuring and Starting a Test
ET Discovery
To receive data about remote unit and to switch loopback on:
Connect the unit to a network.
In IP field, enter IP address of remote unit.
Press (Discovery) button.
If discovery is successfully completed, IP address, host name and MAC
address will be represented on the screen. Loopback menu item will
become accessible for editing.
Buttons for loopback level selection are described below:
: switch off loopback mode.
: switch on loopback at the data link layer.
: switch on loopback at the network layer.
: switch on loopback at the transport layer.
Note: To transmit data UDP protocol is used. Number of server UDP port is
0×8018. Number of client UDP port is 0×8019.
Ethernet Tester Analyzer 81
Page 90

Configuring and Starting a Test
Test i n g T CP/IP
Testing TCP/IP
All the tests described in the current section are required for testing
through routable networks. Using these tests, you can detect network
configuration problems, check server availability, check operability and
estimate load of data link.
Ping
Ping test allows to check availability of specified address inside or outside
of a subnet. This feature is not available in the basic configuration and
should be ordered additionally. Ping utility sends requests to the specified
network host and registers incoming responses. This procedure is based
on the IP and ICMP protocols of datagram transmission, and allows to
check the operability and measure load level of data links and
intermediate units.
Port: Select a port to send requests from. If Automatic is set, the port
will be selected automatically.
IP address: Enter the IP address of a network host to be tested for
availability.
Packet size: Enter the size of a transmitted frame, in bytes.
Count: Enter the number of packets to be sent. The accepted range is 0
to 9999. If zero is selected, the ping test will be performed until
button (Stop) is pressed.
82 ETS-1000
Page 91

Configuring and Starting a Test
Testing T C P / IP
Timeout: Enter the duration of time to wait for response for a ping
request (ms).
Pause: Enter the duration to pause between two successive requests
(ms).
Ping Results
Ping Statistics
Collected statistics show information about the following parameters:
Minimum, maximum, and average time between sending requests and
receiving responses.
Number of sent, received, lost, and repeated (with the same sequential
number) packets.
Ethernet Tester Analyzer 83
Page 92

Configuring and Starting a Test
Test i n g T CP/IP
Traceroute
Traceroute utility is used to determine data transmission routes in TCP/IP
networks. This feature is not available in the basic configuration and
should be ordered additionally. The utility sends sequence of datagramms
to a specified network host, and registers data about all intermediate
routers that sent datagramms passed through during transmission. Thus,
Traceroute utility allows the diagnostics of all intermediate network
equipment on a data transmission path.
Port: Select a port to send requests from. If Automatic is set, the port
will be selected automatically.
IP address: Enter the IP address of the tested host.
Max hops: Enter the maximum number of routers from which the
packets can be transmitted through.
Packet size: Enter the frame size in bytes.
Timeout: Enter the duration of time to wait for response.
84 ETS-1000
Page 93

Traceroute Results
Configuring and Starting a Test
Testing T C P / IP
Hop N
IP address: IP address of a transitional host.
time, ms: Response waiting time.
o
: Number of a transitional node.
Ethernet Tester Analyzer 85
Page 94

Configuring and Starting a Test
Test i n g T CP/IP
DNS (DNS lookup)
DNS (Domain Name System) — distributed database that is able to
determine an IP address of a network host upon a request with the host’s
domain name. DNS lookup feature allows to detect errors in NS-servers
operation. This feature is not available in the basic configuration and
should be ordered additionally.
DNS lookup test is performed for specified domain name. If requested IP
address cannot be retrieved, all bits in IP address will be set to null.
Host: Enter the name of the host of which the IP address is to be
determined.
IP: Display the IP address of the host.
86 ETS-1000
Page 95

Configuring and Starting a Test
Testing T C P / IP
ARP Monitor
ARP monitor utility allows to observe ARP replies that are transmitted in the
network and to get the IP and MAC addresses they contain.
If any of entries presented in the table is not updated within one minute, it
will be deleted from the table.
To se le ct po rt, press button.
Ethernet Tester Analyzer 87
Page 96

Configuring and Starting a Test
Test i n g T CP/IP
TCP-client
TCP-client option allows to check whether tested server responses to
HTTP-requests. This feature is not available in the basic configuration and
should be ordered additionally. Content of the specified resource can be
retrieved using HTTPGET method.
Host: Enter the domain name or IP address of a host.
Port: Enter the receiving port number.
File: Enter the name of a file with content that will be displayed in the
results window if the request is successful.
88 ETS-1000
Page 97

Configuring and Starting a Test
Pass Through
Pass Through
In the Pass through mode, the tester joins in line between two tested units.
All the traffic incoming to port A(B) is retransmitted to the port B(A). A
connection example is shown below.
During traffic retransmission from one port to another, the tester gathers
statistics on transmitted traffic. Statistics results are shown in the Statistics
menu.
When counting statistics data, damaged packets are not taken into
consideration.
Ethernet Tester Analyzer 89
Page 98

Configuring and Starting a Test
Cable Diagnostics
Cable Diagnostics
ETS-1000 allows to perform diagnostics of twisted-pair cable by basic
operating characteristic measuring and by analyzing its state and type.
To perform the test, it is necessary to execute the following actions:
Switch to the Cable test screen.
Connect cable to ETS-1000 using RJ-45 connector.
By pressing (A) and (B) buttons, select port the cable is
connected to.
Press (Start) button.
To determine cable type, it is necessary to execute the following actions:
Switch to the Cable test screen.
One end of the cable connect to the port A(B) of ETS-1000, another one
to the port B(A).
By pressing (A) and (B) buttons, select port one end of the
cable is connected to.
Compare testing results displayed in the menu item Crossover for port
A and port B with values presented in the tables below.
90 ETS-1000
Page 99

Configuring and Starting a Test
Cable Diagnostics
Status: Displays the current state of the cable.
The possible states of the remote module are as follows:
Att., dB: Indicates the signal attenuation value.
State Description
test test is running
norm normal state
open lack of continuity between the pins at each end of the
twisted-pair cable
short two or more conductors are short-circuited together
fail test failed.
5Voice
6 Internetwork Control
7 Network Control
Dist.,m: Indicates the distance to the defect.
Polarity: Indicates the polarity of twisted pairs.
The possible states of the polarity of twisted pair are as follows:
State Description
<+> positive polarity (normal state)
<-> negative polarity (two conductors in a twisted-pair are
connected with reverse polarity)
Crossover: Indicates the cross-connection of twisted-pairs
(MDI/MDI-X). These values allow to define the cable type.
Ethernet Tester Analyzer 91
Page 100

Configuring and Starting a Test
Cable Diagnostics
In the table below, speed (Mbit/s) for the port A and port B can be specified
in the Interface setup menu.
Speed, Mbit/s Pair
10/100 1-2
3-6
4-5
7-8
1-2
3-6
4-5
7-8
1-2
3-6
4-5
7-8
1-2
3-6
4-5
7-8
Value in
menu item
Crossover
for the port
A
Val ue in
menu item
Crossover
for the port
B
Cable type
MDI MDI crossover
MDI-X
MDI-X
—
—
MDI-X
MDI-X
—
—
MDI
MDI
—
—
MDI-X
MDI-X
—
—
MDI
MDI
—
—
MDI-X
MDI-X
—
—
crossover
straightthrough
straightthrough
92 ETS-1000
 Loading...