


Copyright © 2005 by Elenco® Electronics, Inc. All rights reserved. No part of this book shall be reproduced by any means; electronic, photocopying, or otherwise without written permission from the publisher.
REV-B Revised 2005 |
753293 |

CI-73 - READ THIS FIRST
The CI-73 is a set of 73 Snap Circuits with special software that allows you to “see” the electrical signals in the circuits, just like electronics engineers do using oscilloscopes and spectrum analyzers.
Requirements for your computer:
1.Windows® 95 or later.
2.A working microphone input port.
INSTRUCTIONS:
1.Insert the CI-73 CD into your computer. The Snap Circuits menu comes up automatically, with an electronic copy of this manual. Select Run Winscope Now. Connect the plug end of the probe to the microphone input on the back of your personal computer.
If the Snap Circuits menu does not appear automatically: Click <Start> - <Run> - <Browse>, then select CI-73 in your CD drive, then select AutorunPro and click <OK>.
If Windows asks you how to open the file (or if you have Acrobat® ReaderTM 3.0 or older), then you need to install Acrobat® ReaderTM: Click <Start> - <Run> - <Browse>, then select CI-73 in your CD drive, then select Acrobat® Installer and click <OK>. Follow the instructions to install, and then reinsert the CI-73 CD into your computer.
2.Change the default settings for Winscope by selecting <Options>. Then select <Timing> and change Sampling to 44100 and press <OK>. Then select <Options> again, then <Colors> - <Y1 Trace> and pick a bright color like pink. Then select <Options>, then <Save Setup> to save these settings as your default.
3.Follow the instructions through project PC3 before moving on to any other circuits, since the main features of the software are demonstrated.
If you have any questions contact:
Elenco® Electronics, Inc.
150 Carpenter Avenue
Wheeling, IL 60090 (847) 541-3800
Website: www.elenco.com • e-mail: elenco@elenco.com
WARNING: !
SHOCK HAZARD - NEVER connect the probe to AC power or a wall electricity outlet for any reason since serious injury or damage may result.
-1-

Looking at Electronic Signals using the WINSCOPE Software
Electronic engineers use specialized test equipment to “see” electronic signals and make performance measurements. They use an oscilloscope to look at the shape of the signal and use a spectrum analyzer to look at its frequency content. This equipment is specialized and usually very expensive.
The Winscope software simulates this equipment using your personal computer. The
PC-interface cable can be connected across any 2 points in your circuit to look at the signal.
WARNING:
SHOCK HAZARD - NEVER connect the probe to AC power or a wall electricity outlet for any reason since serious injury or damage may result.
It is usually connected to the output of a circuit, as in the circuits shown for the CI-73. Connect the plug end of the probe to the microphone input (pink plug) on the back of your personal computer. Run the Winscope application (from the CI-73 menu).
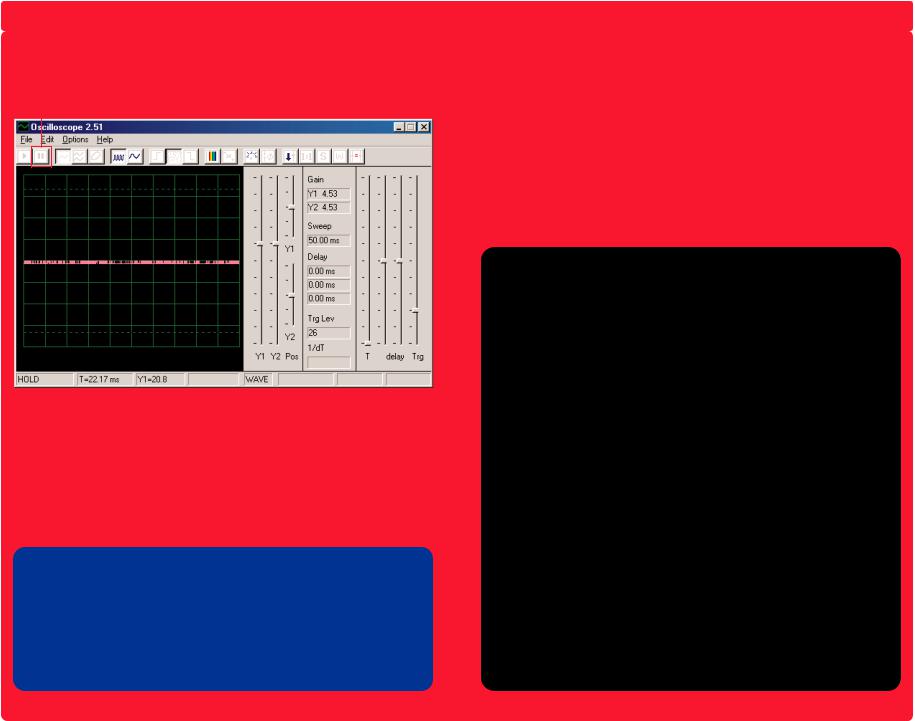
It will come up in Hold mode looking like this:
Click on the On-Line button to turn it on. You should now get one of the following 2 pictures, depending on whether your microphone input is properly turned on:
On-Line
button
Example
A
Example
B
If you get the picture shown in Example B, then your microphone input is not properly turned on. Go to the “Turning On Your Microphone Input” section to turn it on. There may also be other sound card controls on your computer that you need to set. When your input is properly configured, you will get a picture like Example A above. Touch the red and black “alligator” clips on the PC-interface cable to each other and you should see the random pattern on the Winscope screen change as you do so. You are now ready to proceed with the first CI-73 experiment or you may investigate the Winscope software on your own.
-2-
Looking at Electronic Signals using the WINSCOPE Software (continued)
You may freeze a waveform on the screen by clicking on the Hold mode button (just to the right of the On-Line button).
Hold mode button
WARNING: Do not “save setup” in Winscope. Many of the buttons on Winscope control features that this manual will not be using. If you accidentally place the Winscope software into an unknown mode, you may always close and re-start Winscope. Doing so will reset all settings to those described in this booklet unless you have done a “save setup”.
PROJECTS PC1-PC3 SHOW HOW TO USE THE MAIN FUNCTIONS OF WINSCOPE SO DO THEM FIRST!
NOTES:
1.It is recommended that you disable or turn down the volume to the speakers on your computer. CI-73’s use of the microphone input port will also channel the same signal to the speakers, and the result can be distracting.
2.It is recommended that you become familiar with the Snap Circuits parts and assembly methods before building any of the circuits in this manual.
Turning On Your Microphone
(For Windows® 98 or XP, other Windows® versions may be slightly different.)
If you don’t get any signal from the PC-interface cable then your microphone may be disabled on your computer. To turn it on, follow these instructions which begin by pressing the <Start> button on the lower-left corner:
1.Select <Start> - <Programs> - <Accessories> - <Entertainment> (or <Multimedia>) - <Volume Control>.
2.Select <Options>.
3.Select <Properties>.
4.Select <Recording> in the “Adjust Volume For” box.
5.In the “Show the Following Controls” box, check <Microphone>.
6.Select <OK>.
7.In the “Microphone - Volume” box, check <Select> and set volume to about 40% of max.
Your microphone should now be turned on.
-3-

Looking at Electronic Signals using the WINSCOPE Software (continued)
IMPORTANT NOTE: The designs for the microphone input port vary throughout the computer industry. Hence you may get waveforms different from those shown in your manual even though the circuit is actually performing the same way. Here are some types of differences:
A.The gain of your microphone input may be significantly different from that indicated on pages 8-10 (and similarly for the other circuits). Page 4 describes how to turn on the microphone input and adjust its volume to about 40% of max, you may want to adjust this volume higher or lower so that your results better match those shown. Note that having the volume set too high may “clip off” the top or bottom portion of a waveform.
B.The oscilloscope waveforms shown on your display may appear upside down (“inverted”) from those shown throughout this document. For example the waveform shown on the top of page 10 would look like this:
C.The shape of waveforms may appear distorted for some circuits, due to protection circuitry that acts as a filter. For example:
|
|
|
. . .This waveform |
|
might look like this. |
|
|
|
|
|
|
And this waveform . . . |
might look like this. |
If this is the case then swap the connections of the red and black clips of the Winscope probe in all circuits.
And this waveform . . . |
might look like this. |
Contact Elenco® Electronics if you have any questions about this.
-4-

Limitations of WINSCOPE and Its Interface
By using the microphone audio input and the flexible processing power of the personal computer, we have created an inexpensive and easy-to-use way of looking at electronic signals. However, no electronic oscilloscope or spectrum analyzer ever made works on all electronic signals, and similarly Winscope has limitations. The projects in this booklet were written to minimize those limitations.
Winscope can only measure changing signals (AC voltages, >20 Hz frequency) and cannot measure fixed voltages (DC voltages, such as a battery), due to the design of the microphone input. Fixed voltages are not very exciting to look at anyway. Slowchanging or transient signals (such as when you first turn on power to a circuit) will be displayed in a distorted form.
Winscope works best on signals up to about 5kHz, since its sampling rate is limited to 44kHz. If you attempt to measure higher frequency signals, then you will get wrong results due to undersampling. This is a narrow range but it covers human voice and most (but not all) music. AM and FM radio frequencies cannot be measured. Every measurement you make will have some amount of random “chatter” superimposed on the signal of interest. This chatter is due to the limited sampling rate and from the PC-interface cable picking up energy from other electronic instruments in the vicinity (including room lights and your computer), hence it cannot be avoided.
Using WINSCOPE’s Full Capabilities
Winscope has 2 input channels that can be displayed at the same time. This is commonly done by electronic engineers using an oscilloscope, to show the relationship of one (or more) signals to another. However, use of this requires a second microphone input, which most computers do not have. If the sound card in
your computer has this then you may use all of Winscope features for 2 channels, which include X-Y and correlate modes. Use of these Winscope capabilities is beyond the introductory level of this product, use the Help menu in Winscope for information about using these features.
WARNING:
SHOCK HAZARD - NEVER connect the probe to AC power |
! |
or a wall electricity outlet for any reason since serious injury |
or damage may result.
Exporting Graphs from WINSCOPE
To make a copy of the Winscope display screen, hold down the Alt button and press the PrtScn button on your computer when Winscope is the active window. You can then paste it into word processing programs such as Microsoft Word.
-5-

Project Listings
Project # |
Description |
Page # |
PC1 |
Pitch PC |
7 |
PC2 |
Screaming Fan PC |
11 |
PC3 |
Hissing Foghorn PC |
14 |
PC4 |
Light and Sounds PC |
16 |
PC5 |
Light and Sounds PC (II) |
18 |
PC6 |
Light and Sounds PC (III) |
18 |
PC7 |
Light and Sounds PC (IV) |
18 |
PC8 |
Light and Sounds PC (V) |
18 |
PC9 |
Light and Sounds PC (VI) |
19 |
PC10 |
Modulation |
19 |
PC11 |
Filtering |
21 |
PC12 |
AM Radio PC |
22 |
PC13 |
Space War PC |
24 |
PC14 |
Microphone |
25 |
PC15 |
Speaker Microphone |
27 |
PC16 |
Symphony of Sounds PC |
28 |
PC17 |
Doorbell PC |
29 |
PC18 |
Periodic Sounds PC |
30 |
PC19 |
Lasting Doorbell PC |
31 |
PC20 |
Space War Flicker PC |
33 |
PC21 |
Buzzing in the Dark PC |
34 |
PC22 |
Trombone PC |
35 |
PC23 |
Sound Pulse Oscillator PC |
37 |
PC24 |
High Pitch Bell PC |
38 |
PC25 |
Tone Generator PC |
39 |
PC26 |
Tone Generator PC (II) |
39 |
PC27 |
Tone Generator PC (III) |
39 |
PC28 |
Old-Style Typewriter PC |
40 |
PC29 |
Transistor Fading Siren PC |
41 |
PC30 |
Fading Doorbell PC |
41 |
PC31 |
Police Siren Amplifier PC |
42 |
PC32 |
Music Amplifier PC |
42 |
PC33 |
Space War Amplifier PC |
43 |
PC34 |
Adjustable Tone Generator PC |
43 |
PC35 |
Adjustable Tone Generator PC (II) |
44 |
PC36 |
Adjustable Tone Generator PC (III) |
44 |
PC37 |
Adjustable Tone Generator PC (IV) |
44 |
Project # Description |
Page # |
PC38 Adjustable FM Radio PC
 44 PC39 Transistor AM Radio PC (II)
 45 PC40 Playback & Record PC
 45 PC41 Power Amplifier Playing Music PC
 46 PC42 Music Meter PC
 47 PC43 Oscillation Sounds PC
 48 PC44 Oscillation Sounds PC (II)
 48 PC45 Oscillation Sounds PC (III)
 48 PC46 Oscillation Sounds PC (IV)
 48 PC47 Oscillator Sounds PC
 49 PC48 Oscillator Sounds PC (II)
 49 PC49 Whistle Chip Sounds PC
 49 PC50 Whistle Chip Sounds PC (II)
 50 PC51 Whistle Chip Sounds PC (III)
 50 PC52 Whistle Chip Sounds PC (IV)
 50 PC53 Bird Sounds PC
 50 PC54 Bird Sounds PC (II)
 51 PC55 Electronic Cat PC
 51 PC56 Electronic Cat PC (II)
 51 PC57 Electronic Cat PC (III)
 51 PC58 Electronic Cat PC (IV)
 51 PC59 Variable Oscillator PC
 52 PC60 Variable Oscillator PC (II)
 52 PC61 Variable Oscillator PC (III)
 52 PC62 Variable Oscillator PC (IV)
 52 PC63 Electronic Sound PC
 53 PC64 Electronic Sound PC (II)
 53 PC65 Siren PC
 54 PC66 Drawing Resistors PC
 55 PC67 Electronic Noisemaker PC
 55 PC68 Electronic Noisemaker PC (II)
 56 PC69 Bee PC
 56 PC70 Bee PC (II)
 57 PC71 Space War Alarm Combo PC
 57 PC72 Space War Music Combo PC
 58 PC73 Sound Mixer PC
 58
58
-6-
Project #PC1 Pitch PC
OBJECTIVE: To look at the output signal from a transistor oscillator while changing the pitch of the sound.
You will now be introduced to the Winscope features, and thereby become familiar with oscilloscopes and spectrum analyzers, and see some of the most important concepts in electronics. It is recommended that you already be familiar with the Snap Circuits parts and assembly methods from the other manuals.
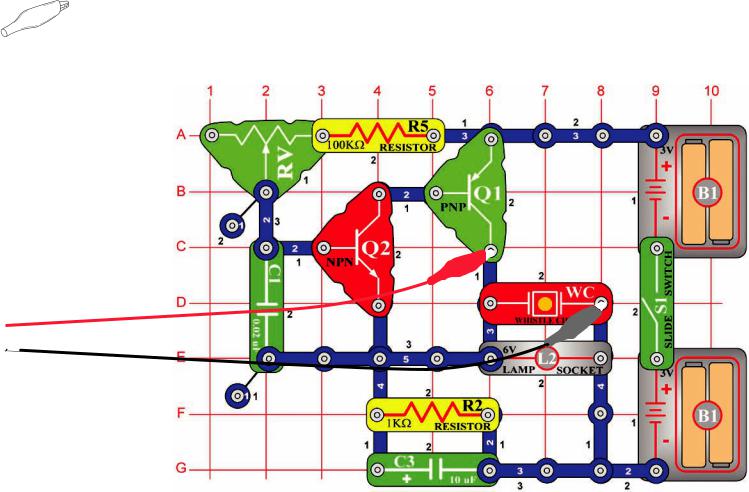
Build the circuit shown and connect the PC-interface cable to the microphone input on your computer. Turn on the slide switch (S1) and vary the adjustable resistor (RV). The frequency or pitch of the sound is changed. Run the Winscope software and be sure your microphone input is configured properly, as described earlier.
-7-

Click on the On-Line button if Winscope is currently in Hold mode and you should get a picture similar to this one:
On-Line
button
The waveform peak is off the top of the screen because the scope gain (amplification) is set too high. You may adjust this gain by moving the Y1 gain control around (try it).
Similarly, you may adjust the position of the waveform on the screen by moving the Y1 position control around (try it).
Now click on the 1:1 button to set the gain to x1 and disable the Y1 controls. You should now have a picture similar to this one:
1:1 button
Y1 position control
Y1 gain control
Note that your picture may not exactly match this picture due to variances in the microphone input gain between computers, which is beyond software control. You may want to adjust the volume control of your microphone input to compensate, see note A on page 4 for more details. You may also disable 1:1 mode by clicking on its button again and then adjust the gain using the Y1 control.
The gain and position control features just described enable electronic engineers and technicians to “see” the amplitude (voltage level) of a signal. By adjusting the settings on an oscilloscope, they can look at both very large and very small voltage waveforms.
Move the adjustable resistor control (snap part RV) and watch how it changes the waveform on the computer screen. Now click on the 0.5ms/div button to change the time scale on the display. (The button to the left of it is for 5ms/div, the default.) Move the adjustable resistor control around again. You may click on the Hold button to freeze the waveform on the screen, then click on On-Line to re-start.
Hold |
0.5ms/div button |
button |
With the time scale at 0.5ms/div and the adjustable resistor set for middle position, you should now have a picture similar to this one.
Your picture may appear different due to variations in the microphone input designs between computers. Although this is beyond software control, in some cases you may be able to compensate externally. See notes B and C on page 4 for details.
-8-

Notice that the waveform seems to be randomly dancing across the screen, making it hard to study. We can fix this. Click on the
“trigger positive level” button and make sure the trigger bar is in the position shown here. Notice that a small “-” appears on the left of the display as you do so.
“Trigger positive level button
“-” 
Trigger bar
The small slash “-” represents the trigger voltage, when the signal reaches this voltage level it activates the display. This makes it easy to observe a stream of pulses like you have now, and also to record a single (non-repeating) pulse.
Move the adjustable resistor control (snap part RV) and watch how it changes the waveform on the computer screen. Now you can see how changing the adjustable resistor changes the time between the pulses, which changes the tone of the sound you hear.
The waveform you see here is the voltage across the speaker, the peaks of the pulses occur when the transistors turn on and provide current to the speaker. Changing the amplitude of the peaks changes the loudness of the sound, changing their separation changes the tone or “pitch” of the sound. The time scale and trigger control features just described enable electronic engineers and technicians to see the relationship between parts of a waveform on their oscilloscope.
Now its time to look at your electronic signal in a different way. The oscilloscope features you have been using show you voltage (amplitude) vs. time, now you will see voltage vs. frequency. Engineers use expensive instruments called spectrum analyzers to do this, but Winscope uses a mathematical transformation called an FFT to do this. Set the Y1 gain control back to its default position for now. Click on the 5ms/div button to display a wider range, then click on the FFT button. Your display should be similar to this:
5ms/div button |
FFT button |
||||||
|
|
|
|
|
|
|
|
|
|
|
|
|
|
|
|
Y1 gain control default position
You are seeing the frequency spectrum of your signal, up to 22kHz. Notice that most of the energy is at the low frequencies (below 7kHz), and there is very little as you go higher.
-9-
The 1:1 gain mode does not apply to the FFT screen, so move the Y1 gain control down to here so you can see the peak energy at the low frequencies.
Y1 gain control level
Move the adjustable resistor control (snap part RV) and watch how it changes the frequencies on the display.
Set the adjustable resistor control (snap part RV) to mid-range. In addition to the 5ms/div and 0.5ms/div settings for the horizontal scale, there is also a variable setting. See if you can set it so that all the signal peaks line up with the grid lines, as shown.
Now you can see that the tone you hear is actually a range of related frequencies combined together. The first peak is considered to be the main signal (and it is usually but not always the highest), the energy at all the other peaks determine the waveform of the signal you see on an oscilloscope.
Now modify your circuit by placing the 0.1mF capacitor (C2) on top of the 0.02mF capacitor (C1). By increasing circuit capacitance, you lower the oscillation frequency and your display should now look something like this:
Variable
setting
 Frequency
As you can see, all the peaks are equally spaced in frequency. Move your computer mouse directly over the first peak, the software displays the frequency you are pointing at. Move the mouse to the other peaks and you see they are multiples of the first frequency.
-10-

Now adjust the horizontal scale so the peaks line up with the gridlines as they did before.
Horizontal scale
Notice that all the peaks went down in frequency by a corresponding amount and many changed in amplitude, that is why your ears hear a different sound. Notice also that in this case the left-most frequency peak no longer is the highest in voltage (your results may vary).
Now you can click on the FFT box to return to oscilloscope mode and look at the waveform with the 0.1mF capacitor in the circuit. You can observe it with the same settings as before for comparison, but these settings usually work best:
Project #PC2 |
Screaming Fan PC |
OBJECTIVE: To demonstrate storage mode.
WARNING: Moving parts. Do not touch the fan or ! motor during operation.
! WARNING: Do not lean over the motor.
-11-

Build the circuit shown. If continuing from the previous experiment then close the Winscope program and run it again, to reset the settings. Click on the On-Line button to activate, and turn on the switch (snap part S1). Set Winscope to the settings shown below, and move the lever on the adjustable resistor (snap part RV) around to change the waveform and the sound. A sample waveform is shown here, but the pattern and shape of the pulses depends on the adjustable resistor setting.
On-Line |
|
|
Waveform |
|
|||||||
button |
|
|
|
|
|
|
|
||||
|
|
|
|
|
|
|
|
|
|
|
|
|
|
|
|
|
|
|
|
|
|
|
|
|
|
|
|
|
|
|
|
|
|
|
|
|
|
|
|
|
|
|
|
|
|
|
|
Winscope has a mode that can display multiple scans at the same time, called Storage mode. Set the adjustable resistor lever to a low-middle position, place Winscope in this mode, and watch the results.
Without Storage Mode
Storage
mode
With Storage Mode
-12-

What you see here is the effect of timing variations on the trigger used for synchronization. Turn off the trigger and you will see how much variation there is without using the trigger:
Trigger
You can use Storage mode on any of the other circuit waveforms if desired.
Now turn off storage mode and turn on FFT mode to look at the frequency spectrum, try the settings shown here.
 Settings
You can also use storage mode when in FFT mode, so turn it on now.
Storage mode
In this way you can show the peak energy achieved at each frequency. But this is only useful on a stable waveform, so if you move the adjustable resistor lever now the signal will fill the screen as the peaks move across the display.
Most oscilloscopes and spectrum analyzers have a storage mode like this of some form.
Moving the adjustable resistor lever will change the spectrum shown.
-13-
Project #PC3 |
Hissing Foghorn PC |
OBJECTIVE: To demonstrate wait mode with multiple colors.
Build the circuit shown. If continuing from the previous experiment then close the Winscope program and run it again, to reset the settings. Click on the On-Line button to activate, and turn on the switch (snap part S1). Set Winscope to the settings shown on the right, and move the lever on the adjustable resistor (snap part RV) around to change the waveform and the sound. At some positions there may be no sound. A sample waveform is shown here, but the pattern and shape of the pulses depends on the adjustable resistor setting.
On-Line |
Settings |
button |
|
-14-

Place Winscope in Wait mode by clicking on the button for it, then slowly press the On-Line button several times. Now turn off the slide switch (snap part S1) and press On-Line again. Then turn the switch back on. You see that in Wait mode Winscope scans (“waits”) until it sees a waveform that exceeds the trigger level you set, then stops. With a strong signal it will make one scan and then stop, whereas if no signal is present it keeps scanning until it finds one. You could use this to sense when someone has turned on the circuit.
On-Line |
|
|
Wait |
||||||
button |
|
|
mode |
||||||
|
|
|
|
|
|
|
|
|
|
|
|
|
|
|
|
|
|
|
|
|
|
|
|
|
|
|
|
|
|
|
|
|
|
|
|
|
|
|
|
You can change the color of the waveform: select <Options>, then select <Colors>, then select <Y1 Trace>. Now select the color you like and click <OK>.
Now we will combine the wait and storage modes to display several waveforms that this circuit can create. You should have the circuit on with the adjustable resistor at mid-range and Winscope in Wait mode. Now turn on Storage mode. Now change the color of the Y1 trace. Move the adjustable resistor control lever a little, then press On-Line once to record another waveform. Now change the color of Y1 again. Move the resistance control again and press OnLine once. Change the Y1 color, adjust the resistance and press On-Line. Change the Y1 color, adjust the resistance and press OnLine. Do this several more times if you like. Note that at some resistance settings there may be no waveform to trigger on, move the resistance control until it does.
Now your display should look something like this:
Storage mode
Now you see the range of waveforms this circuit can create, all at the same time. Engineers often do this to compare signals during analysis.
You can use Wait mode and different colors like this on the other circuits if you like.
Now turn off storage mode and turn on FFT mode to look at the frequency spectrum, try the settings shown here. Wait mode does not apply in FFT mode, so it has no effect here. Moving the adjustable resistor lever will change the spectrum shown.
 Settings
-15-
Project #PC4 Light & Sounds PC
OBJECTIVE: To look at the output signal from a circuit that makes alarm sounds.
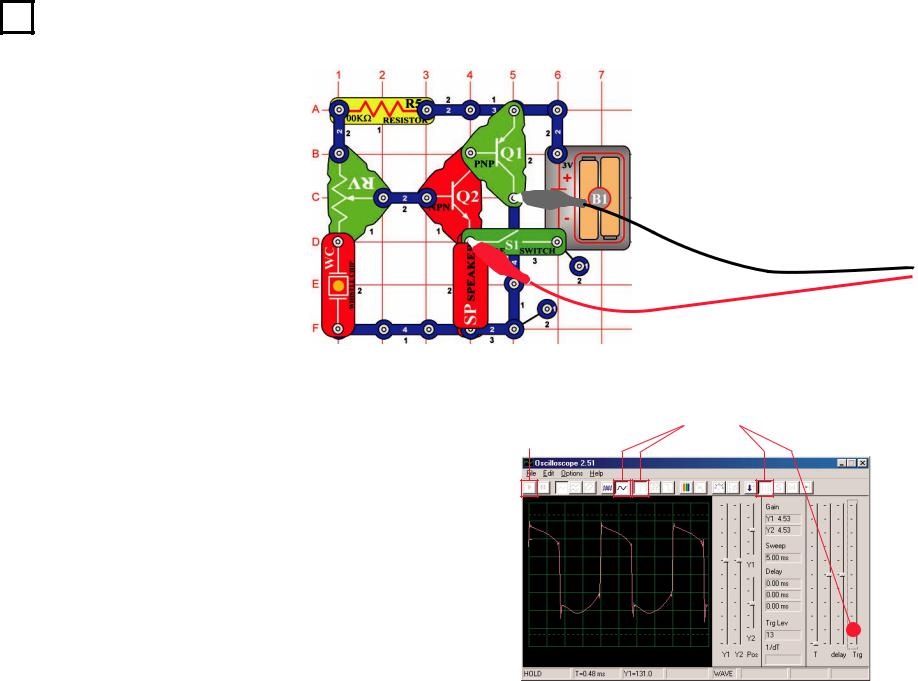
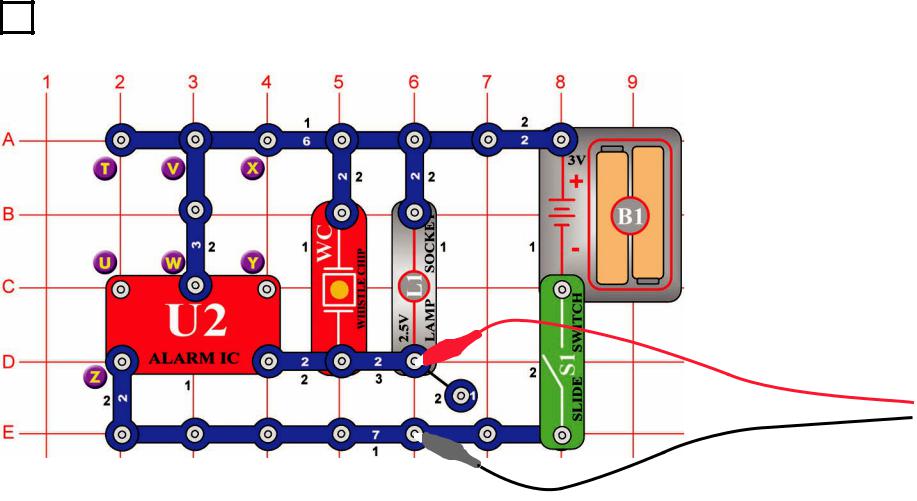
Build the circuit and connect the Winscope PC-interface cable as shown, the cable should still be connected to the microphone input on your computer.
-16-

If continuing from the previous experiment then close the Winscope program and run it again, to reset the settings. Then use the mouse to set it up as shown here, and turn on the switch (snap part S1). Click on the On-Line button to activate.
On-Line |
|
|
|
|
Set up |
|
||||||
button |
|
|
|
|
|
|
|
|
|
|||
|
|
|
|
|
|
|
|
|
||||
|
|
|
|
|
|
|
|
|
|
|
|
|
|
|
|
|
|
|
|
|
|
|
|
|
|
|
|
|
|
|
|
|
|
|
|
|
|
|
|
|
|
|
|
|
|
|
|
|
|
|
|
You should see a waveform similar to that shown here, but it will be constantly changing. This is because the siren sound you hear is not a continuous tone but instead is constantly changing. Note the differences in the waveshape for this circuit compared to the circuit in Project PC1.
Your picture may appear different due to variations in the microphone input designs between computers. See the notes on page 4 for details.
Click on the FFT button to look at the frequency spectrum.
Also set the amplitude and time scales (really amplitude and frequency scales in FFT mode) to be as shown here.
Time scales
Amplitude |
FFT button |
|
||||||||
|
|
|
|
|
|
|
|
|
|
|
|
|
|
|
|
|
|
|
|
|
|
|
|
|
|
|
|
|
|
|
|
|
|
|
|
|
|
|
|
|
|
|
|
|
|
|
|
|
|
|
|
|
|
|
|
|
|
|
|
|
|
|
|
|
|
You should see a fuzzy spectrum similar to that shown here, but it will be constantly changing. This is because the siren sound you hear is not a continuous tone but instead is constantly changing frequency, and it spends more time at some frequencies than at others. Note the differences in the spectrum for this circuit compared to the circuit in Project PC1.
-17-
 Loading...