

Page 1

CXDI Image Processing Software
MLT (F)
User’s Manual
Before using the instrument, be sure to read this manual thoroughly.
Also, read the manuals of other instruments in this system.
Keep the manual where it is easily accessible.
Page 2

Please Note
1. In no event will Canon be liable for direct or indirect consequential damage arising out of the use of this
product. Canon will not be liable for loss of image data due to any reason.
2. Please have this product installed by Canon representative or distributor.
3. Canon reserves the right to change the specifications of the product without prior notice.
© CANON INC. 2008
All rights reserved.
Under copyright laws, this manual may not be copied, in whole or in part, without the written consent of
Canon.
Page 3

Contents
1. Overview ......................................................................................1
1.1 About MLT (F) .......................................................................................1
1.2 Available Functions of MLT (F) .............................................................2
2. Edit Exposure Mode Settings ......................................................3
2.1 Procedures to Edit Exposure Mode .......................................................3
2.2 Setting DWT ENHANCE. Tab ...............................................................7
2.3 Setting DWT DEP Tab ........................................................................10
2.3.1 Setting DWT DEP for High-Density Field .........................................................10
2.3.2 Setting DWT DEP for Low-Density Field .........................................................11
2.4 Setting DWT NOISE R. Tab ................................................................13
3. QA Mode Settings ......................................................................14
3.1 Procedures to Change Parameters .....................................................14
3.2 Changing DWT ENHANCE. Tab .........................................................17
3.3 Changing DWT DEP Tab ....................................................................22
3.3.1 Changing DWT DEP for High-Density Field ....................................................22
3.3.2 Changing DWT DEP for Low-Density Field .....................................................24
3.4 Changing DWT Noise R. Tab ..............................................................26
4. QA Parameters ..........................................................................27
Page 4

Page 5

Notation Conventions
Notation 1
In this manual, the name of button is enclosed with a pair of brackets [ ], and the buttons that are selected in succession
are connected with > to indicate the order.
Example: On the Exposure screen, touch the followings:
[SYSTEM] > [SETUP MENU]
Operation: Touch the SYSTEM button on the first screen, and then touch the SETUP MENU button on
the second screen.
Touch the SYSTEM button (left), and then touch the SETUP MENU button (right)
Notation 2
If any detailed explanation for the operation or setting is available on other page in this manual, the page to refer is indicated with (→ page number).
Example: For details of the EFFECT parameter, refer to the step 2 in 2.2 Setting DWT ENHANCE. Tab
(→ P.7)
Content: On page 7, detailed description of the EFFECT feature is provided.
Notation 3
When description of the procedure or setting continues from an odd-numbered page (right page) to the subsequent evennumbered page (left page), a small note, [Continued on the following page »] appears at the bottom-right of the oddnumbered page to draw your attention.
Page 6

Page 7

1. Overview
1.1 About MLT (F)
NOTE: MLT (F) is supported by CXDI System Software Version 4.3 or later.
The CXDI Image Processing Software MLT (F) (called “MLT (F)” in this manual) is
designed to extend the image processing functions provided with the CXDI series of Canon digital radiography system (called “CXDI” in this manual).
By installing MLT (F) on the Control PC, the advanced image processing features of MLT (F)
are brought into full scope both in the Edit Exposure Mode and QA Mode.
The following examples show the QA Mode screens of CXDI System Software version 6.3.
Standard QA Mode Screen (DEP Tab)
QA Mode Screen Extended by MLT (F) (DWT DEP Tab)
– 1 –
Page 8

1.Overview
1.2 Available Functions of MLT (F)
This manual describes the operating procedures of the following three image processing functions that are available with MLT (F). For details and information on other image processing
functions, please refer to Operation Manual and Setup Guide.
DWT*1 Edge Enhancement (→ P.7)
The DWT ENHANCE. tab provides the function to accentuate edge details of the exposure image by specifying the three parameters; the degree of enhancement (EFFECT),
type of enhancement (FREQUENCY BASE), and type of density dependent of the
image (DENSITY BASE).
DWT DEP*2 (→ P.10)
The DWT DEP tab provides the function to compress the dynamic range of the exposure
image by specifying the six parameters; the density to start compression (STARTING
DENSITY), compression ratio (DEP WEIGHT), and intensity of com pression (DEP
EFFECT) for both the High-Density Field (HIGH-DENS.) and Low-Density Fi eld
(LOW-DENS.).
The imaging area on film or monitor is widened by decreasing the pixel value range in
the second region of interest, without changing the minute structures in the first region of
interest.
DWT Noise Reduction (→ P.13)
The DWT NOISE R. tab provides the function to reduce the noise components of the
exposure image, and improve it’s granularity by specifying the two parameters; the
degree of enhancement (EFFECT) and upper limit of density (PROCESSING UPPER
LIMIT).
NOTE: The effects resulting from chang es to the parameters may be difficult to check
in the exposure image of the QA mode screen.
In these cases, check by touching [MAG.] or [QA-MAG.] to display the
enlarged screen.
Display of the Tabs
At the time of installation, the service person can specify the fixed parameters, and set
MLT (F) not to display the tabs for the individual settings of the DWT Edge
Enhancement, DWT DEP and DWT Noise Reduction.
*1 This is an abbreviation for Discrete Wavelet Transform. This method of image
processing is also called Multi-Frequency Processing.
*2 This is an abbreviation for Display Enhancement Processing. This method of
image processing is also called Dynamic Range Compression Processing.
– 2 –
Page 9

2. Edit Exposure Mode Settings
The examples used in this chapter are the screens of CXDI System Software version 6.3.
2.1 Procedures to Edit Exposure Mode
Display the Edit Exposure Mode screen
1
On the Exposure screen, touch the followings:
[SYSTEM] > [EDIT EXPOSURE MODE].
Button
Sensor Unit
Button
Category Tab
Button
Edit Exposure Mode Screen
Select the Sensor Unit
2
If two or more sensor units are being used in the system, touch the Sensor Unit button,
then select the Sensor Unit.
Select the Category tab
Exposure Mode
3
If eight or more categories are registered in the system, touch the or button to display the Category tabs that are not currently visible.
– 3 –
Continued on the following page >>
Page 10

2.Edit Exposure Mode Settings
Select the Exposure Mode
4
Make sure that [EDIT PARA.] at the top-left is highlighted, and select the desired Expo-
sure Mode.
The EDIT PARA. screen appears.
EDIT PARA. Screen (first page)
Display the next page
5
Touch [NEXT PAGE].
Availability of Frequency Processing Mode
If your CXDI System Software is the version 5.0 or before, there is no need to select
the frequency processing mode as described in the nex t st ep (step 6). Skip the step 6
and proceed to the step 7.
EDIT PARA. Screen (second page)
– 4 –
Page 11
2.Edit Exposure Mode Settings
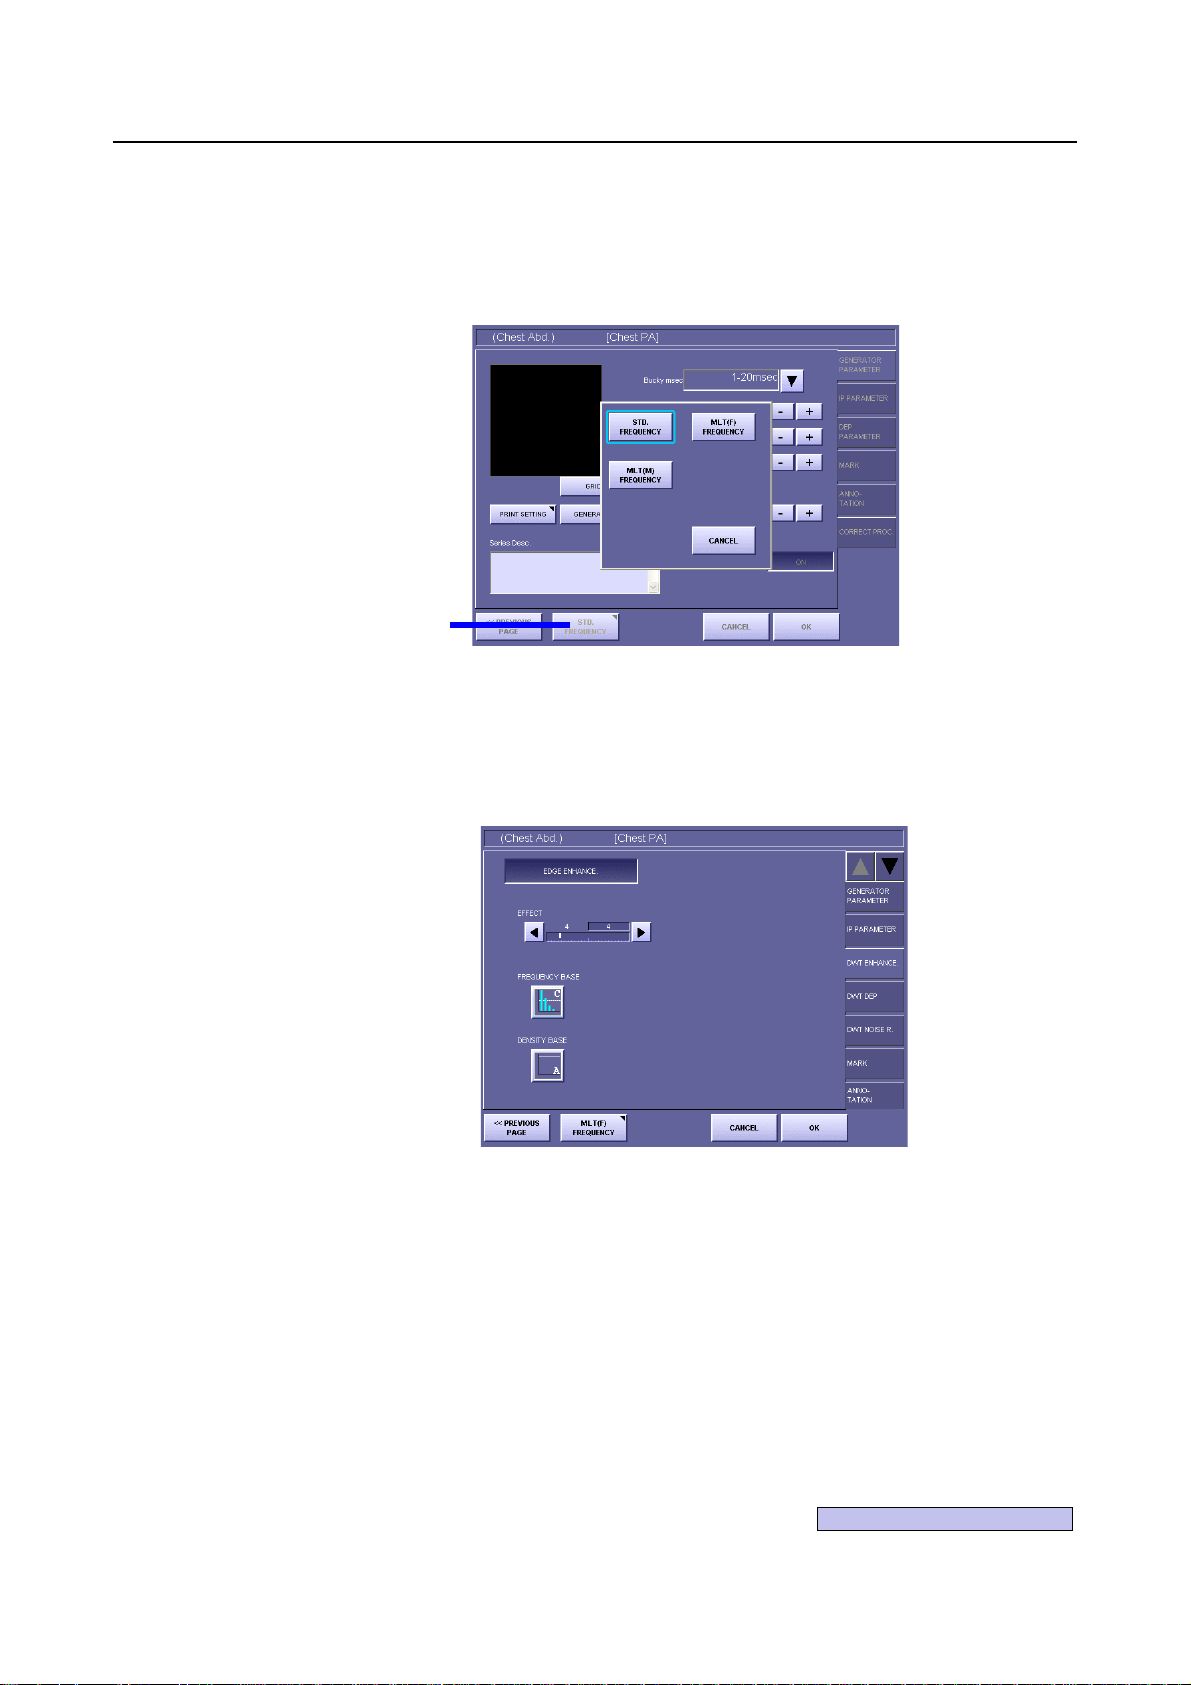
Select MLT (F) FREQUENCY
6
If MLT (F) FREQUENCY is not currently selected (in this case, the DWT ENHANCE.,
DWT DEP, and DWT NOISE R. tabs are not displayed), touch the Frequency Processing Mode button to open the window, then touch [MLT (F) FREQUECY].
Frequency
Processing
Mode
Button
Frequency Processing Mode Window
Select the tab
7
Touch the desired tab from among three tabs: DWT ENHANCE., DWT DEP, DWT
NOISE R.
DWT ENHANCE. Screen
Set the parameters
8
Set the parameters provided with the selected tab, referring to the corresponding descriptions; 2.2 Setting DWT ENHANCE. Tab (→ P.7), 2.3 Setting DWT DEP Tab (→
P.10), 2.4 Setting DWT NOISE R. Tab (→ P.13).
– 5 –
Continued on the following page >>
Page 12

2.Edit Exposure Mode Settings
Save the parameters
9
Touch [OK]. The window displaying the following message appears:
Save the changed parameter.
Then, touch [OK].
When Password is required
If the password is specified, a different message is displayed in the window as follows:
Administrator’s authority is needed. Enter system password.
In this case, touch anywhere within the frame to display On-Screen-Keyboard, and
type your password, then touch [OK].
– 6 –
Page 13

2.2 Setting DWT ENHANCE. Tab
Set the DWT Edge Enhancement effective
1
Touch [EDGE ENHANCE.] to display the parameters. The appearance of the button
switches over between the highlight (in white outline characters against a colored background) and normal display each time you touch the button. The parameters are available
when the button is highlighted.
FREQUENCY
BASE Button
DENSITY
BASE Button
2.Edit Exposure Mode Settings
DWT ENHANCE. Screen with Parameters
Set the EFFECT parameter
2
Touch the or button, and set the value within the range between 1 to 20.
The value on the left is the setting saved previously, and the value on the right is the current setting.
The value indicates the degree of edge enhancement.
Select a larger value for higher degree of enhancement, and select a smaller value for
lower degree of enhancement.
NOTE: If the EFFECT parameter is set to an excessive value, artifacts may occur in
the image, or the effective data of the exposure image may be damaged.
Check the output of exposure image, and if the results of enhancement
appear to be too strong, either set the paramete r to a smaller value, or set the
DWT Edge Enhancement not effective.
– 7 –
Continued on the following page >>
Page 14

2.Edit Exposure Mode Settings
Display the FREQUENCY BASE window
3
T ouch the FREQUENCY BASE button to open the window.
The types of Frequency Bases are classified into two kinds, and are indicated with the
buttons in different colors respectively as follows:
FREQUENCY BASE Window
Display of Button Remarks
Enhances the signals smoothly ranging from the low frequency
Blue Bar Graph
Green Bar Graph
The bar graph in the each button shows the range of frequencies that enhancement
applies to.
To enhance the mass structure, such as soft tissues, select the Frequency Base that
applies enhancement to the lower frequency. The range increases by including the lower
frequency in ascending order from A or a. T o enhance the minute structure, such as bone
tissues, select the Frequency Base that limits enhancement to the lower frequency and
covers only the higher frequency. The range decreases by excluding the lower frequency
in descending order to A or a.
Set the FREQUENCY BASE parameter
4
T ouch the desired Frequency Base button.
The parameter is set for the Frequency Base selected, and the FREQUENCY BASE window is closed.
area to the high frequency area.
The results of enhancement appear natural with smooth frequent
response characteristics.
Enhances the structures in the specific frequency band stronger
than the structure in other frequency bands.
– 8 –
Page 15

2.Edit Exposure Mode Settings
Display the DENSITY BASE window
5
T ouch the DENSITY BASE button to open the window.
DENSITY BASE Window
If granularity is too coarse on the Low-Density Field as the result of the enhancement,
the quality can be improved by selecting the Density Base that applies weaker density
enhancement to the area where the degradation of quality is obvious.
Set the DENSITY BASE parameter
6
T ouch the desired Density Base button.
The parameter is set for the Density Base selected, and the DENSITY BASE window is
closed.
– 9 –
Page 16

2.Edit Exposure Mode Settings
2.3 Setting DWT DEP Tab
2.3.1 Setting DWT DEP for High-Density Field
Set the DWT DEP for the High-Density Field effective
1
Touch [HIGH DENS.] to display the parameters. The appearance of the button switches
over between the highlight (in white outline characters against a colored background)
and normal display each time you touch the button. The parameters are available when
the button is highlighted.
DWT DEP Screen with Parameters of HIGH DENS.
Set the STARTING DENSITY parameter of the High-Density Field
2
Touch the or button, and set the value within the range between 0 to 30.
If the parameters of the Low-Density Field are effective, this value cannot be set lower
than the value of STARTING DENSITY of the Low-Density Field (→ P.12).
The value on the left is the setting saved previously, and the value on the right is the current setting.
The value indicates the lower limit of density to start compression as shown in the following table:
Setting Values for Starting Density of High-Density Field
Setting value 01234567891011121314
Starting density (D) 0.2 0.3 0.4 0.5 0.6 0.7 0.8 0.9 1.0 1.1 1.2 1.3 1.4 1.5 1.6
Setting value 15161718192021222324252627282930
Starting density (D) 1.7 1.8 1.9 2.0 2.1 2.2 2.3 2.4 2.5 2.6 2.7 2.8 2.9 3.0 3.1 3.2
Set the DEP WEIGHT parameter of the High-Density Field
3
Touch the or button, and set the value within the range between 0 to 20.
The value on the left is the setting saved previously, and the value on the right is the current setting.
The value indicates the compression ratio in the density area that is larger than the value
of STARTING DENSITY.
Select a larger value for higher degree of compression, and select a smaller value for
lower degree of compression.
– 10 –
Page 17

Set the DEP EFFECT parameter of the High-Density Field
4
Touch the or button, and set the value within the range between 0 to 10.
The value on the left is the setting saved previously, and the value on the right is the current setting.
The value indicates the intensity of restoration in high frequency component that reflects
the starting density and compression ratio of the High-Density Field.
Select a larger value for higher degree of intensity, and select a smaller value for lower
degree of intensity.
NOTE: If the DEP EFFECT parameter is set to an excessive value, artifacts may
occur in the image, or the effective data of the exposure image may be damaged.
Check the exposure image, and if the result s of compression appear to be too
strong, either set the parameter to a smaller value, or set the DWT DEP not
effective.
2.3.2 Setting DWT DEP for Low-Density Field
Set the DWT DEP for the Low-Density Field effective
1
Touch [LOW DENS.] to display the parameters. The appearance of the button switches
over between the highlight (in white outline characters against a colored background)
and normal display each time you touch the button. The parameters are available when
the button is displayed in highlight.
2.Edit Exposure Mode Settings
DWT DEP Screen with Parameters of HIGH and LOW DENS.
Continued on the following page >>
– 11 –
Page 18

2.Edit Exposure Mode Settings
Set the STARTING DENSITY parameter of the Low-Density Field
2
Touch the or button, and set the value within the range between 0 to 30.
If the parameters of the High-Density Field are effective, this value cannot be set lower
than the value of STARTING DENSITY of the High-Density Field (→ P.10).
The value on the left is the setting saved previously, and the value on the right is the current setting.
The value indicates the upper limit of density to start compression as shown in the following table:
Starting density (D) 0.2 0.3 0.4 0.5 0.6 0.7 0.8 0.9 1.0 1.1 1.2 1.3 1.4 1.5 1.6
Starting density (D) 1.7 1.8 1.9 2.0 2.1 2.2 2.3 2.4 2.5 2.6 2.7 2.8 2.9 3.0 3.1 3.2
Set the DEP WEIGHT parameters of the Low-Density Field
3
Touch the or button, and set the value within the range between 0 to 20.
The value on the left is the setting saved previously, and the value on the right is the current setting.
The value indicates the compression ratio in the density area that is smaller than the
value of STARTING DENSITY.
Select a larger value for higher degree of compression, and select a smaller value for
lower degree of compression.
Setting Values for Starting Density of Low-Density Field
Setting value 01234567891011121314
Setting value 15161718192021222324252627282930
Set the DEP EFFECT parameter of the Low-Density Field
4
Touch the or button, and set the value within the range between 0 to 10.
The value on the left is the setting saved previously, and the value on the right is the current setting.
The value indicates the intensity of restoration in high frequency component that reflects
the starting density and compression ratio of the Low-Density Field.
Select a larger value for higher degree of intensity, and select a smaller value for lower
degree of intensity.
NOTE: If the DEP EFFECT parameter is set to an excessive value, artifacts may
occur in the image, or the effective data of the exposure image may be damaged.
Check the exposure image, and if the result s of compression appear to be too
strong, either set the parameter to a smaller value, or set the DWT DEP not
effective.
– 12 –
Page 19

2.4 Setting DWT NOISE R. Tab
Set the DWT Noise Reduction effective
1
Touch [NOISE REDUCTION] to display the parameters. The appearance of the button
switches over between the highlight (in white outline characters against a colored background) and normal display each time you touch the button. The parameters are available
when the button is displayed in highlight.
2.Edit Exposure Mode Settings
DWT NOISE R. Screen with Parameters
Set the EFFECT parameter
2
Touch the or button, and set the value within the range between 1 to 10.
The value on the left is the setting saved previously, and the value on the right is the current setting.
Select a larger value for higher degree of noise reduction, and select a smaller value for
lower degree of noise reduction.
NOTE: If the EFFECT parameter is set to an excessive value, artifacts may occur in
the image, or the effective data of the exposure image may be damaged.
Check the output of exposure image, and if the results of noise reduction
appear to be too strong, either set the paramete r to a smaller value, or set the
DWT Noise Reduction not effective.
Set the PROCESSING UPPER LIMIT parameter
3
Touch the or button, and set the value within the range between 0.2 to 3.2.
The value on the left is the setting saved previously, and the value on the right is the current setting.
The value indicates the upper limit of density to reduce the noises.
– 13 –
Page 20

3. QA Mode Settings
The examples used in this chapter are the screens of CXDI System Software version 6.3.
3.1 Procedures to Change Parameters
Image processing of the exposure images with CXDI is called QA (Quality Assurance) Processing, and can be performed by adjusting the parameters on the QA Mode screen to optimize the
exposure image.
Display the QA Mode screen
1
Display the QA Mode screen by one of the following methods:
QA Mode Screen
To display the QA Mode screen automatically right after x-ray exposure
On the Exposure screen, touch the followings to display the DISPLAYING PARAMETER CHANGE/QA SCREEN DURING EXPOSURE screen:
[SYSTEM] > [SETUP MENU] > [SYSTEM SETUP] > [DISPLAYING PARAMETER CHANGE/QA SCREEN DURING EXPOSURE]
Then set the QA Mode screen effective
To perform QA Processing right after x-ray exposure
Touch [QA] on the Preview screen.
To perform QA Processing after examination
Select the exposure image from the Study List, and display the selected image, then
touch [QA].
Availability of Frequency Processing Mode
If your CXDI System Software is the version 5.0 or before, there is no need to select
the frequency processing mode as described in the nex t st ep (step 2). Skip the step 2
and proceed to the step 3.
– 14 –
Page 21

3.QA Mode Settings
Select MLT (F) FREQUENCY
2
If MLT (F) FREQUENCY is not currently selected (in this case, the DWT ENHANCE.,
DWT DEP, and DWT NOISE R. tabs are not displayed), touch the Frequency Processing Mode button to open the window, then touch [MLT (F) FREQUECY].
Frequency
Processing
Mode
BUTTON
Frequency Processing Mode Window
When the Frequency Processing Mode button is not visi ble
If the Frequency Processing Mode button is not displayed on the screen, touch the
button at the bottom part of the screen (CXDI System Software V ersion 5.1 or later
only).
Select the tab
3
Touch the desired tab from among three tabs: DWT ENHANCE., DWT DEP, DWT
NOISE R.
Change the parameters
4
Set the parameters provided with the selected tab, referring to the corresponding descriptions; 3.2 Changing DWT ENHANCE. Tab (→ P. 17), 3.3 Changing DWT DEP T ab
(→ P.22), 3.4 Changing DWT Noise R. Tab (→ P.26).
Continued on the following page >>
– 15 –
Page 22

3.QA Mode Settings
Save the new parameters
5
To save new parameters as the default values of the Exposure Mode (except opening
from Study List), touch [SAVE PARAM]. The window displaying the following message
appears:
Are you sure you want to change the default generator parameters?
Then, touch [YES].
When Password is required
If the password is specified, a different message is displayed as follows:
Administrator’s authority is needed. Enter system password.
In this case, touch within the frame to display On-Screen-Keyboard, and type your
password, then touch [OK].
Close the QA Mode screen
6
Touch [OK].
When [OK] is not visible on the scree n
If [OK] is not displayed on the screen, touch the button at the bottom part of the
screen (CXDI System Software Version 5.1 or later only).
– 16 –
Page 23

3.2 Changing DWT ENHANCE. Tab
Set the DWT Edge Enhancement effective
1
Touch [DWT EDGE ENHANCE.] to display the parameters. The appearance of the button switches over between the highlight (in white outline characters against a colored
background) and normal display each time you touch the button. The parameters are
available when the button is displayed in highlight.
3.QA Mode Settings
DWT ENHANCE. Screen with Parameters
Set the EFFECT parameter
2
Touch the or button, and set the value within the range between 1 to 20.
The value on the left is the setting saved previously, and the value on the right is the current setting.
For details of the EFFECT parameter, refer to the step 2 in 2.2 Setting DWT
ENHANCE. Tab (→ P.7).
NOTE: If the EFFECT parameter is set to an excessive value, artifacts may occur in
the image, or the effective data of the exposure image may be damaged.
Check the output of exposure image, and if the results of enhancement
appear to be too strong, either set the paramete r to a smaller value, or set the
DWT Edge Enhancement not effective.
– 17 –
Continued on the following page >>
Page 24

3.QA Mode Settings
Display the MORE window
3
Touch [MORE] to open the window.
MORE Window
Display the FREQUENCY BASE window
4
T ouch the FREQUENCY BASE button to open the window.
For details of the FREQUENCY BASE parameter, refer to the step 3 in 2.2 Setting
DWT ENHANCE. Tab (→ P.8).
FREQUENCY
BASE Button
DENSITY BASE
Button
FREQUENCY BASE Window
Select the FREQUENCY BASE parameter
5
T ouch the desired Frequency Base button.
The parameter is selected for the Frequency Base, and the FREQUENCY BASE window
is closed.
Touch the or button to display the buttons that are not currently visible.
– 18 –
Page 25

3.QA Mode Settings
Representation of the enhancement degree on a bar graph
After the Frequency Base is set, a bar graph is displayed at the top-right of the screen
to illustrate the comparisons with the frequency bands and degree of enhancement.
The horizontal axis labeled with Lv represents the frequency band, indicating the
lower frequency with a larger value. The vertical axis represents the degree of
enhancement, indicating the stronger degree of enhancement with a larger value.
Strong
Degree
Weak
Bar Graph of Enhancement (Frequency Base)
1.0
0.5
0.0
Lv1
Lv2 Lv3 Lv4 Lv5
Frequency
High Low
Display the DENSITY BASE window
6
T ouch the DENSITY BASE button to open the window.
For details of the DENSITY BASE parameter, refer to the step 5 in 2.2 Setting DWT
ENHANCE. Tab (→ P.9).
DENSITY BASE Window
– 19 –
Continued on the following page >>
Page 26

3.QA Mode Settings
Select the DENSITY BASE parameter
7
T ouch the desired Density Base button.
The parameter is selected for the Density Base, and the DENSITY BASE window is
closed.
Representation of the enhancement degree on a line graph
After the Density Base is set, a line graph is displayed at the top-right of the screen to
illustrate the comparisons with density and the degree of enhancement.
The horizontal axis represents density, and the vertical axis represents the degree of
enhancement in each density, indicating the stronger degree of enhancement with a
larger value.
Strong
Degree
Weak
Line Graph of Enhancement (Density Base)
1.0
0.0
-0.5
0.2
0.8 3.2
Density
Set the settings valid, and close the MORE window
8
Touch [OK].
– 20 –
Page 27

3.QA Mode Settings
Switching the display of the graph
Touch the graph area to switch over the Freque ncy Base Graph (bar grap h) and Density
Base graph (line graph).
.
Actual processing shall not be performed unless the DWT Edge Enhancement is
effective, although the graph is displayed on the screen.
Frequency Base Graph (Bar Graph)
Density Base Graph (Line Graph)
– 21 –
Page 28

3.QA Mode Settings
3.3 Changing DWT DEP Tab
3.3.1 Changing DWT DEP for High-Density Field
Set the DWT DEP for the High-Density Field effective
1
Touch [HIGH DENS.] to display the parameters. The appearance of the button switches
over between the highlight (in white outline characters against a colored background)
and normal display each time you touch the button. The parameters are available when
the button is displayed in highlight.
DWT DEP Screen with Parameters of HIGH DENS.
Representation of DWT DEP on a graph
A blue curve is always displayed on a graph, and when HIGH-DENS. or LOWDENS. is effective, a white curve is added.
The blue curve represents the tone curve selected on the LUT tab, and the white curve
represents the tone curve combining the blue and the DWT DEP tone curves.
In other words, when either of HIGH-DENS. or LOW-DENS. is effective, the
original tone curve compensation and the DWT DEP tone curve compensation are
performed at the same time.
Set the STARTING DENSITY parameter of the High-Density Field
2
Touch the or button, and set the value within the range between 0 to 30.
The value on the left is the setting saved previously, and the value on the right is the current setting.
For details of the parameter, refer to the step 2 in 2.3.1 Setting DWT DEP for High-
Density Field (→ P.10) .
– 22 –
Page 29

3.QA Mode Settings
Display the MORE window
3
Touch [MORE] to open the window.
MORE Window
Set the HIGH WEIGHT parameter
4
Touch the or button, and set the value within the range between 0 to 20.
The value on the left is the setting saved previously, and the value on the right is the current setting.
For details of the parameter, refer to the step 3 in 2.3.1 Setting DWT DEP for High-
Density Field (→ P.10) .
Set the HIGH EFFECT parameter
5
Touch the or button, and set the value within the range between 0 to 10.
The value on the left is the setting saved previously, and the value on the right is the current setting.
For details of the parameter, refer to the step 4 in 2.3.1 Setting DWT DEP for High-
Density Field (→ P.11).
NOTE: If the HIGH EFFECT parameter is set to an excessive value, artifacts may
occur, and the effective data of the exposure image may be damaged.
Check the exposure image, and if the result s of compression appear to be too
strong, either set the parameter to a smaller value, or set the DWT DEP not
effective.
Set the settings valid, and close the MORE window
6
Touch [OK].
– 23 –
Page 30

3.QA Mode Settings
3.3.2 Changing DWT DEP for Low-Density Field
Set the DWT DEP for the Low-Density Field effective
1
Touch [LOW DENS.] to display the parameters. The appearance of the button switches
over between the highlight (in white outline characters against a colored background)
and normal display each time you touch the button. The parameters are available when
the button is displayed in highlight.
DWT DEP Screen with Parameters of HIGH and LOW DENS.
Representation of DWT DEP on a graph
A blue curve is always displayed on the graph, and when HIGH-DENS. or LOWDENS. is effective, a white curve is added.
The blue curve represents the tone curve selected on the LUT tab, and the white curve
represents the tone curve combining the blue and the DWT DEP tone curves.
In other words, when either of HIGH-DENS. or LOW-DENS. is effective, the
original tone curve compensation and the DWT DEP torn curve compensation are
performed at the same time.
Set the STARTING DENSITY parameter of the Low-Density Field
2
Touch the or button, and set the value within the range between 0 to 30 range.
The value on the left is the setting saved previously, and the value on the right is the current setting.
For details of the parameter, refer to the step 2 in 2.3.2 Setting DWT DEP for Low-
Density Field (→ P.12).
– 24 –
Page 31

3.QA Mode Settings
Display the MORE window
3
Touch [MORE] to open the window.
MORE Window
Set the LOW WEIGHT parameter
4
Touch the or button, and set the value within the range between 0 to 20.
The value on the left is the setting saved previously, and the value on the right is the current setting.
For details of the parameter, refer to the step 3 in 2.3.2 Setting DWT DEP for LowDensity Field (→ P.12) .
Set the LOW EFFECT parameter
5
Touch the or button, and set the value within the range between 0 to 10.
The value on the left is the setting saved previously, and the value on the right is the current setting.
For details of the parameter, refer to the step 4 in 2.3.2 Setting DWT DEP for Low-
Density Field (→ P.12) .
NOTE: If the LOW EFFECT parameter is set to an excessive value, artifacts may
occur, and the effective data of the exposure image may be damaged.
Check the exposure image, and if the result s of compression appear to be too
strong, either set the parameter to a smaller value, or set the DWT DEP not
effective.
Set the settings valid, and close the MORE window
6
Touch [OK].
– 25 –
Page 32

3.QA Mode Settings
3.4 Changing DWT Noise R. Tab
Set the DWT Noise Reduction effective
1
Touch [NOISE REDUCTION] to display the parameters. The appearance of the button
switches over between the highlight (in white outline characters against a colored background) and normal display each time you touch the button. The parameters are available
when the button is displayed in highlight.
DWT NOISE R. Screen with Parameters
Set the EFFECT parameter
2
Touch the or button, and set the value within the range between 1 to 10.
The value on the left is the setting saved previously, and the value on the right is the current setting.
For details of the parameter, refer to the step 2 in 2.4 Setting DWT NOISE R. T ab (→
P.13).
NOTE: If the EFFECT parameter is set to an excessive value, artifacts may occur,
and the effective data of the exposure image may be damaged.
Check the output of exposure image, and if the results of noise reduction
appear to be too strong, either set the paramete r to a smaller value, or set the
DWT Noise Reduction not effective.
Set the PROCESSING UPPER LIMIT parameter
3
Touch the or button, and set the value within the range between 0.2 to 3.2.
The value on the left is the setting saved previously, and the value on the right is the current setting.
For details of the parameter, refer to the step 3 in 2.4 Setting DWT NOISE R. T ab (→
P.13).
– 26 –
Page 33

4. QA Parameters
When MLT(F) frequency processing is selected, the QA parameters (%IP_PARAM%) in Annotation are displayed in the format below.
REX680 Q1 E5dA D25,10,10,10,10,10 N5,5 GCS16,10 R RT+90 Z0 C0 M2,1,2
123 4 5 6 7891011
n stands for the numeric value, character or symbol displayed on Annotation.
1 REX
The parameter is displayed as follows:
REXn
If LUT is set to REX ADJUST for x-ray exposure, F-REX is displayed.
2 Frequency Processing Mode
If MLT (F) FREQUENCY is selected as the Frequency Processing Mode, Q1 is
displayed. Q0 is displayed for STD. FREQUENCY , and Q2 displayed for MLT (M)
FREQUENCY. For other QA parameters displayed when the mode other than ML T
(F) Frequency Processing is selected, please refer to the respective manuals.
3 DWT Edge Enhancement
The parameters are displayed as follows:
En (EFFECT) n (FREQUENCY BASE, represented with the alphabet on the
button) n (DENSITY BASE, represented with the alphabet on the button)
If the DWT Edge Enhancement is not effective, nothing is displayed.
The display values correspond to the actual values as shown in the following table:
Effect
Display Value 1.................................... .... ... ... ... .................................20
Effect Low.....................................................................................High
4 DWT DEP
The parameters are displayed as follows:
Dn (STARTING DENSITY of High-Density Field), n (DEP WEIGHT of HighDensity Field), n (DEP EFFECT of High-Density Field), n (STARTING
DENSITY of Low-Density Field), n (DEP WEIGHT of Low-Density Field), n
(DEP EFFECT of Low-Density Field)
If the DWT DEP is not effective, nothing is displayed.
If only the High-Density Field is not effective, * is displayed instead of the
parameters (D*, 10, 10, 10), and if only the Low-Density Field is not ef fective, * is
displayed instead of the parameters (D25, 10, 10, *).
The display values correspond to the actual values as shown in the following tables
(the values for DEP EFFECT are omitted):
Continued on the following page >>
– 27 –
Page 34

4.QA Parameters
STARING DENSITY (High-Density and Low-Density Fields)
Display Value 0123456789
Density 0.2 0.3 0.4 0.5 0.6 0.7 0.8 0.9 1.0 1.1
Display Value 10111213141516171819
Density 1.21.31.41.51.61.71.81.92.02.1
Display Value 2021222324252627282930
Density 2.2 2.3 2.4 2.5 2.6 2.7 2.8 2.9 3.0 3.1 3.2
DEP WEIGHT (High-Density and Low-Density Fields)
Display Value 0123456789
Degree 1.00 0.95 0.90 0.85 0.80 0.75 0.70 0.65 0.60 0.55
Display Value 1011121314151617181920
Degree 0.50 0.45 0.40 0.35 0.30 0.25 0.20 0.15 0.10 0.05 0.00
5 DWT Noise Reduction
The parameters are displayed as follows:
Nn (EFFECT), n (PROCESSING UPPER LIMIT)
If the DWT Noise Reduction is not effective, nothing is displayed.
6 LUT Parameters
The parameters are displayed as follows:
Gn (CURVE SHAPE) n (BRIGHTNESS), n (CONTRAST)
The Curve Shapes are represented by the following symbols respectively:
CS: CHEST, SS: STAN. CONTRAST, LI: LINEAR, IL: INV. LINEAR,
BS: BONE #1, GS: BONE #2
The display values correspond to the actual values as shown in the following table
(the values for CONTRAST are omitted):
BRIGHTNESS
Display Value 1 2 3 4 5 6 7 8 9 10
Density 0.3 0.4 0.5 0.6 0.7 0.8 0.9 1.0 1.1 1.2
Display Value 11121314151617181920
Density 1.3 1.4 1.5 1.6 1.7 1.8 1.9 2.0 2.1 2.2
Display Value 21 2223242526272829
Density 2.3 2.4 2.5 2.6 2.7 2.8 2.9 3.0 3.1
7Flip
Either or both of the following parameters is/are displayed:
R (Flip Horizontal), U (Flip Vertical)
If image is not flipped, nothing is displayed.
8 Rotate
The parameter is displayed as follows:
RTn (Rotate Angle)
The degree of rotation is available from +90, -90, +180.
If image is not rotated, nothing is displayed.
– 28 –
Page 35

4.QA Parameters
9 Suppress Grid Processing
One of the following parameters is displayed:
Z0 (No grid stripe is detected), Z1 (Grid stripes are suppressed), Z* (Processing is
not determined yet)
If the Grid Reduction Processing is not effective, nothing is displayed.
10 High-Density Clipping Processing (HIGH IN. CLIPPING)
One of the following parameters is displayed:
C0 (Clipping is not performed), C1 (Clipping is performed), C* (Processing is not
determined yet)
If the High-Density Clipping Processing is not effective, nothing is displayed.
11 Dose-Depend Processing (D. DEPEND MTF IMP)
One of the following parameters is displayed:
M0 (Processing is not performed), M1 (Processing is performed in the fix mode),
M2,n,n (Processing is performed in the dose dependent mode)
The parameters for M2 are displayed as follows:
M2, n (FILTER TYPE Index), n (INTENSITY Index)
The display values correspond to the parts of the body as shown in the following
table (the values for INTENSITY are omitted):
FILTER TYPE
Display Value1234567
Body Part Chest
Abdo-
men
Skull
Cervical
vertebrae
Thoracic
vertebra
Lumbar Limbs
– 29 –
Page 36

Page 37

Page 38

Page 39

Page 40

CANON INC. Medical Equipment Group
30-2, Shimomaruko 3-chome, Ohta-ku, Tokyo, Japan
Telephone: (81)-3-3758-2111
CANON U.S.A., INC.
CANON MEDICAL SYSTEMS
15955 Alton Parkway, Irvine, CA 92618-3616, U.S.A.
Telephone: (1)-949-753-4160
CANON EUROPA N.V. Medical Products Division
Bovenkerkerweg 59-61, 1185 XB Amstelveen, The Netherlands
Telephone: (31)-20-545-8926
PUB. L-IE-4081F
 Loading...