

Anritsu MS2090A-0732, MS2090A-0754, MS2090A-0743, MS2090A-0726, MS2090A-0720 User Manual
...Page 1

User Guide
Field Master Pro™ MS2090A
Spectrum Analyzer
MS2090A-0709 9 kHz to 9 GHz (Option 709)
MS2090A-0714 9 kHz to 14 GHz (Option 714)
MS2090A-0720 9 kHz to 20 GHz (Option 720)
MS2090A-0726 9 kHz to 26.5 GHz (Option 726)
MS2090A-0732 9 kHz to 32 GHz (Option 732)
MS2090A-0743 9 kHz to 43.5 GHz (Option 743)
MS2090A-0754 9 kHz to 54 GHz (Option 754)
Anritsu Company
490 Jarvis Drive
Morgan Hill, CA 95037-2809
USA
Part Number: 10580-00444
Copyright 2020 Anritsu Company
Published: May 2020
Revision: F
Page 2

Unauthorized Use or Disclosure
Anritsu Company has prepared the product user documentation for use by Anritsu Company personnel and
customers as a guide for the proper installation, operation, and maintenance of Anritsu Company equipment and
software programs. The drawings, specifications, and information contained therein are the property of Anritsu
Company, and any unauthorized use of these drawings, specifications, and information is prohibited; they shall not be
reproduced, copied, or used in whole or in part as the basis for manufacture or sale of the equipment or software
programs without the prior written consent of Anritsu Company.
Export Management
The Anritsu products identified herein and their respective manuals may require an Export License or approval by
the government of the product country of origin for re-export from your country. Before you export these products or
any of their manuals, please contact Anritsu Company to confirm whether or not these items are export-controlled.
When disposing of export-controlled items, the products and manuals must be broken or shredded to such a degree
that they cannot be unlawfully used for military purposes.
Front-2 PN: 10580-00444 Rev. F MS2090A UG
Page 3

Table of Contents
Chapter 1—General Information
1-1 Introduction . . . . . . . . . . . . . . . . . . . . . . . . . . . . . . . . . . . . . . . . . . . . . . . . . . . . . . . . . . . . . . . . 1-1
Before You Begin . . . . . . . . . . . . . . . . . . . . . . . . . . . . . . . . . . . . . . . . . . . . . . . . . . . . . . . . 1-1
Additional Documentation . . . . . . . . . . . . . . . . . . . . . . . . . . . . . . . . . . . . . . . . . . . . . . . . . . 1-1
Document Conventions . . . . . . . . . . . . . . . . . . . . . . . . . . . . . . . . . . . . . . . . . . . . . . . . . . . . 1-2
1-2 Instrument Description . . . . . . . . . . . . . . . . . . . . . . . . . . . . . . . . . . . . . . . . . . . . . . . . . . . . . . . 1-2
Available Models . . . . . . . . . . . . . . . . . . . . . . . . . . . . . . . . . . . . . . . . . . . . . . . . . . . . . . . . . 1-2
Available Options. . . . . . . . . . . . . . . . . . . . . . . . . . . . . . . . . . . . . . . . . . . . . . . . . . . . . . . . . 1-3
1-3 Instrument Care and Preventive Maintenance . . . . . . . . . . . . . . . . . . . . . . . . . . . . . . . . . . . . . 1-4
Ventilation and Cooling . . . . . . . . . . . . . . . . . . . . . . . . . . . . . . . . . . . . . . . . . . . . . . . . . . . . 1-4
Connector Care . . . . . . . . . . . . . . . . . . . . . . . . . . . . . . . . . . . . . . . . . . . . . . . . . . . . . . . . . . 1-4
ESD Caution . . . . . . . . . . . . . . . . . . . . . . . . . . . . . . . . . . . . . . . . . . . . . . . . . . . . . . . . . . . . 1-6
1-4 Calibration and Verification. . . . . . . . . . . . . . . . . . . . . . . . . . . . . . . . . . . . . . . . . . . . . . . . . . . . 1-6
1-5 Contacting Anritsu for Sales and Service . . . . . . . . . . . . . . . . . . . . . . . . . . . . . . . . . . . . . . . . . 1-6
Chapter 2—Instrument Overview
2-1 Introduction . . . . . . . . . . . . . . . . . . . . . . . . . . . . . . . . . . . . . . . . . . . . . . . . . . . . . . . . . . . . . . . . 2-1
2-2 Instrument Front Panel . . . . . . . . . . . . . . . . . . . . . . . . . . . . . . . . . . . . . . . . . . . . . . . . . . . . . . . 2-2
2-3 Connector Panels . . . . . . . . . . . . . . . . . . . . . . . . . . . . . . . . . . . . . . . . . . . . . . . . . . . . . . . . . . . 2-3
Top Connector Panel. . . . . . . . . . . . . . . . . . . . . . . . . . . . . . . . . . . . . . . . . . . . . . . . . . . . . . 2-3
Side Connector Panel . . . . . . . . . . . . . . . . . . . . . . . . . . . . . . . . . . . . . . . . . . . . . . . . . . . . . 2-5
2-4 Tilt Bail Stand . . . . . . . . . . . . . . . . . . . . . . . . . . . . . . . . . . . . . . . . . . . . . . . . . . . . . . . . . . . . . . 2-7
2-5 Battery Information . . . . . . . . . . . . . . . . . . . . . . . . . . . . . . . . . . . . . . . . . . . . . . . . . . . . . . . . . . 2-8
Replacing the Battery . . . . . . . . . . . . . . . . . . . . . . . . . . . . . . . . . . . . . . . . . . . . . . . . . . . . . 2-9
2-6 Turning On the MS2090A Field Master Pro . . . . . . . . . . . . . . . . . . . . . . . . . . . . . . . . . . . . . . 2-10
Power/Charge LED Indicators . . . . . . . . . . . . . . . . . . . . . . . . . . . . . . . . . . . . . . . . . . . . . . 2-10
Shutting Down and Restarting. . . . . . . . . . . . . . . . . . . . . . . . . . . . . . . . . . . . . . . . . . . . . . 2-10
2-7 GUI Overview . . . . . . . . . . . . . . . . . . . . . . . . . . . . . . . . . . . . . . . . . . . . . . . . . . . . . . . . . . . . . 2-11
Operating the Touch Screen . . . . . . . . . . . . . . . . . . . . . . . . . . . . . . . . . . . . . . . . . . . . . . . 2-12
Common GUI Controls . . . . . . . . . . . . . . . . . . . . . . . . . . . . . . . . . . . . . . . . . . . . . . . . . . . 2-13
Data Entry . . . . . . . . . . . . . . . . . . . . . . . . . . . . . . . . . . . . . . . . . . . . . . . . . . . . . . . . . . . . . 2-14
Scroll Indication . . . . . . . . . . . . . . . . . . . . . . . . . . . . . . . . . . . . . . . . . . . . . . . . . . . . . . . . . 2-16
2-8 Title Bar . . . . . . . . . . . . . . . . . . . . . . . . . . . . . . . . . . . . . . . . . . . . . . . . . . . . . . . . . . . . . . . . . 2-19
2-9 Selecting the Analyzer . . . . . . . . . . . . . . . . . . . . . . . . . . . . . . . . . . . . . . . . . . . . . . . . . . . . . . 2-20
2-10 System Menu . . . . . . . . . . . . . . . . . . . . . . . . . . . . . . . . . . . . . . . . . . . . . . . . . . . . . . . . . . . . . 2-21
System Information . . . . . . . . . . . . . . . . . . . . . . . . . . . . . . . . . . . . . . . . . . . . . . . . . . . . . . 2-21
Notifications . . . . . . . . . . . . . . . . . . . . . . . . . . . . . . . . . . . . . . . . . . . . . . . . . . . . . . . . . . . . 2-22
MS2090A UG PN: 10580-00444 Rev. F Contents-1
Page 4

Table of Contents (Continued)
2-11 Settings Menu. . . . . . . . . . . . . . . . . . . . . . . . . . . . . . . . . . . . . . . . . . . . . . . . . . . . . . . . . . . . . 2-23
Display Settings . . . . . . . . . . . . . . . . . . . . . . . . . . . . . . . . . . . . . . . . . . . . . . . . . . . . . . . . . 2-23
Sound Settings . . . . . . . . . . . . . . . . . . . . . . . . . . . . . . . . . . . . . . . . . . . . . . . . . . . . . . . . . 2-24
Network Settings . . . . . . . . . . . . . . . . . . . . . . . . . . . . . . . . . . . . . . . . . . . . . . . . . . . . . . . . 2-25
Ethernet Settings . . . . . . . . . . . . . . . . . . . . . . . . . . . . . . . . . . . . . . . . . . . . . . . . . . . . . . . . 2-27
Wi-Fi Settings . . . . . . . . . . . . . . . . . . . . . . . . . . . . . . . . . . . . . . . . . . . . . . . . . . . . . . . . . . 2-28
GPS/GNSS Settings (Option 31) . . . . . . . . . . . . . . . . . . . . . . . . . . . . . . . . . . . . . . . . . . . . 2-29
Screenshot Setup . . . . . . . . . . . . . . . . . . . . . . . . . . . . . . . . . . . . . . . . . . . . . . . . . . . . . . . 2-30
Date Time Settings . . . . . . . . . . . . . . . . . . . . . . . . . . . . . . . . . . . . . . . . . . . . . . . . . . . . . . 2-31
Port Setup . . . . . . . . . . . . . . . . . . . . . . . . . . . . . . . . . . . . . . . . . . . . . . . . . . . . . . . . . . . . . 2-32
Reference and Trigger. . . . . . . . . . . . . . . . . . . . . . . . . . . . . . . . . . . . . . . . . . . . . . . . . . . . 2-33
Options Settings . . . . . . . . . . . . . . . . . . . . . . . . . . . . . . . . . . . . . . . . . . . . . . . . . . . . . . . . 2-34
Reset Settings . . . . . . . . . . . . . . . . . . . . . . . . . . . . . . . . . . . . . . . . . . . . . . . . . . . . . . . . . . 2-35
2-12 File Management . . . . . . . . . . . . . . . . . . . . . . . . . . . . . . . . . . . . . . . . . . . . . . . . . . . . . . . . . . 2-36
File Locations. . . . . . . . . . . . . . . . . . . . . . . . . . . . . . . . . . . . . . . . . . . . . . . . . . . . . . . . . . . 2-36
File Management Operations . . . . . . . . . . . . . . . . . . . . . . . . . . . . . . . . . . . . . . . . . . . . . . 2-36
Previewing Screenshots . . . . . . . . . . . . . . . . . . . . . . . . . . . . . . . . . . . . . . . . . . . . . . . . . . 2-37
2-13 Saving and Recalling Measurements . . . . . . . . . . . . . . . . . . . . . . . . . . . . . . . . . . . . . . . . . . . 2-38
Saving a Measurement . . . . . . . . . . . . . . . . . . . . . . . . . . . . . . . . . . . . . . . . . . . . . . . . . . . 2-38
Recalling a Measurement . . . . . . . . . . . . . . . . . . . . . . . . . . . . . . . . . . . . . . . . . . . . . . . . . 2-38
FILE Menu . . . . . . . . . . . . . . . . . . . . . . . . . . . . . . . . . . . . . . . . . . . . . . . . . . . . . . . . . . . . . 2-39
SAVE ON EVENT Menu . . . . . . . . . . . . . . . . . . . . . . . . . . . . . . . . . . . . . . . . . . . . . . . . . . 2-40
2-14 Presetting the Analyzer. . . . . . . . . . . . . . . . . . . . . . . . . . . . . . . . . . . . . . . . . . . . . . . . . . . . . . 2-40
PRESET Menu . . . . . . . . . . . . . . . . . . . . . . . . . . . . . . . . . . . . . . . . . . . . . . . . . . . . . . . . . 2-40
2-15 Diagnostics . . . . . . . . . . . . . . . . . . . . . . . . . . . . . . . . . . . . . . . . . . . . . . . . . . . . . . . . . . . . . . . 2-41
Battery Information . . . . . . . . . . . . . . . . . . . . . . . . . . . . . . . . . . . . . . . . . . . . . . . . . . . . . . 2-41
Event Log. . . . . . . . . . . . . . . . . . . . . . . . . . . . . . . . . . . . . . . . . . . . . . . . . . . . . . . . . . . . . . 2-41
Self Test. . . . . . . . . . . . . . . . . . . . . . . . . . . . . . . . . . . . . . . . . . . . . . . . . . . . . . . . . . . . . . . 2-42
Service Mode. . . . . . . . . . . . . . . . . . . . . . . . . . . . . . . . . . . . . . . . . . . . . . . . . . . . . . . . . . . 2-42
2-16 Tools Menu . . . . . . . . . . . . . . . . . . . . . . . . . . . . . . . . . . . . . . . . . . . . . . . . . . . . . . . . . . . . . . . 2-43
IQ Streaming Tools . . . . . . . . . . . . . . . . . . . . . . . . . . . . . . . . . . . . . . . . . . . . . . . . . . . . . . 2-43
2-17 Software Update . . . . . . . . . . . . . . . . . . . . . . . . . . . . . . . . . . . . . . . . . . . . . . . . . . . . . . . . . . . 2-44
Installing the Software . . . . . . . . . . . . . . . . . . . . . . . . . . . . . . . . . . . . . . . . . . . . . . . . . . . . 2-44
Chapter 3—Spectrum Analyzer Measurements
3-1 Introduction . . . . . . . . . . . . . . . . . . . . . . . . . . . . . . . . . . . . . . . . . . . . . . . . . . . . . . . . . . . . . . . . 3-1
3-2 Selecting the Analyzer . . . . . . . . . . . . . . . . . . . . . . . . . . . . . . . . . . . . . . . . . . . . . . . . . . . . . . . 3-1
3-3 Spectrum Analyzer GUI Overview . . . . . . . . . . . . . . . . . . . . . . . . . . . . . . . . . . . . . . . . . . . . . . 3-2
Normal Spectrum View . . . . . . . . . . . . . . . . . . . . . . . . . . . . . . . . . . . . . . . . . . . . . . . . . . . . 3-2
Spectrogram View . . . . . . . . . . . . . . . . . . . . . . . . . . . . . . . . . . . . . . . . . . . . . . . . . . . . . . . . 3-4
3-4 Main Menu . . . . . . . . . . . . . . . . . . . . . . . . . . . . . . . . . . . . . . . . . . . . . . . . . . . . . . . . . . . . . . . . 3-5
Using Menus . . . . . . . . . . . . . . . . . . . . . . . . . . . . . . . . . . . . . . . . . . . . . . . . . . . . . . . . . . . . 3-5
3-5 Status Panel . . . . . . . . . . . . . . . . . . . . . . . . . . . . . . . . . . . . . . . . . . . . . . . . . . . . . . . . . . . . . . . 3-7
3-6 Making Spectrum Analyzer Measurements . . . . . . . . . . . . . . . . . . . . . . . . . . . . . . . . . . . . . . . 3-8
Initial Setup . . . . . . . . . . . . . . . . . . . . . . . . . . . . . . . . . . . . . . . . . . . . . . . . . . . . . . . . . . . . . 3-8
Contents-2 PN: 10580-00444 Rev. F MS2090A UG
Page 5

Table of Contents (Continued)
3-7 Setting Frequency Parameters . . . . . . . . . . . . . . . . . . . . . . . . . . . . . . . . . . . . . . . . . . . . . . . . . 3-9
Entering Start and Stop Frequencies . . . . . . . . . . . . . . . . . . . . . . . . . . . . . . . . . . . . . . . . . 3-9
Entering a Center Frequency . . . . . . . . . . . . . . . . . . . . . . . . . . . . . . . . . . . . . . . . . . . . . . . 3-9
Using Offset Frequency. . . . . . . . . . . . . . . . . . . . . . . . . . . . . . . . . . . . . . . . . . . . . . . . . . . 3-10
Setting the Span . . . . . . . . . . . . . . . . . . . . . . . . . . . . . . . . . . . . . . . . . . . . . . . . . . . . . . . . 3-10
Zero Span IF Output (Option 89) . . . . . . . . . . . . . . . . . . . . . . . . . . . . . . . . . . . . . . . . . . . . 3-10
FREQ / SPAN Menu . . . . . . . . . . . . . . . . . . . . . . . . . . . . . . . . . . . . . . . . . . . . . . . . . . . . . 3-12
FREQ / SPAN Zero Span Menu . . . . . . . . . . . . . . . . . . . . . . . . . . . . . . . . . . . . . . . . . . . . 3-13
IF OUTPUT Menu . . . . . . . . . . . . . . . . . . . . . . . . . . . . . . . . . . . . . . . . . . . . . . . . . . . . . . . 3-13
GESTURES Menu. . . . . . . . . . . . . . . . . . . . . . . . . . . . . . . . . . . . . . . . . . . . . . . . . . . . . . . 3-14
3-8 Setting Amplitude Parameters . . . . . . . . . . . . . . . . . . . . . . . . . . . . . . . . . . . . . . . . . . . . . . . . 3-15
Setting Amplitude Reference Level . . . . . . . . . . . . . . . . . . . . . . . . . . . . . . . . . . . . . . . . . . 3-15
Setting Amplitude Range and Scale . . . . . . . . . . . . . . . . . . . . . . . . . . . . . . . . . . . . . . . . . 3-15
Reference Level Offset for External Loss or External Gain. . . . . . . . . . . . . . . . . . . . . . . . 3-15
Attenuator Functions . . . . . . . . . . . . . . . . . . . . . . . . . . . . . . . . . . . . . . . . . . . . . . . . . . . . . 3-15
Preamplifier . . . . . . . . . . . . . . . . . . . . . . . . . . . . . . . . . . . . . . . . . . . . . . . . . . . . . . . . . . . . 3-16
Indications of Excessive Signal Level . . . . . . . . . . . . . . . . . . . . . . . . . . . . . . . . . . . . . . . . 3-16
AMPLITUDE Menu . . . . . . . . . . . . . . . . . . . . . . . . . . . . . . . . . . . . . . . . . . . . . . . . . . . . . . 3-17
3-9 Setting Bandwidth Parameters . . . . . . . . . . . . . . . . . . . . . . . . . . . . . . . . . . . . . . . . . . . . . . . . 3-18
Resolution Bandwidth . . . . . . . . . . . . . . . . . . . . . . . . . . . . . . . . . . . . . . . . . . . . . . . . . . . . 3-18
Video Bandwidth . . . . . . . . . . . . . . . . . . . . . . . . . . . . . . . . . . . . . . . . . . . . . . . . . . . . . . . . 3-18
Setting Frequency Bandwidth . . . . . . . . . . . . . . . . . . . . . . . . . . . . . . . . . . . . . . . . . . . . . . 3-19
Setting Bandwidth Auto Coupling . . . . . . . . . . . . . . . . . . . . . . . . . . . . . . . . . . . . . . . . . . . 3-19
BANDWIDTH Menu. . . . . . . . . . . . . . . . . . . . . . . . . . . . . . . . . . . . . . . . . . . . . . . . . . . . . . 3-20
3-10 Setting Trace and Cursor Parameters . . . . . . . . . . . . . . . . . . . . . . . . . . . . . . . . . . . . . . . . . . 3-21
Traces in Spectrum View. . . . . . . . . . . . . . . . . . . . . . . . . . . . . . . . . . . . . . . . . . . . . . . . . . 3-21
TRACE Menu (Spectrum View). . . . . . . . . . . . . . . . . . . . . . . . . . . . . . . . . . . . . . . . . . . . . 3-22
Trace Detector Types . . . . . . . . . . . . . . . . . . . . . . . . . . . . . . . . . . . . . . . . . . . . . . . . . . . . 3-24
Cursors in Spectrogram View . . . . . . . . . . . . . . . . . . . . . . . . . . . . . . . . . . . . . . . . . . . . . . 3-25
TRACE Menu (Spectrogram View) . . . . . . . . . . . . . . . . . . . . . . . . . . . . . . . . . . . . . . . . . . 3-26
TRACE CURSOR Menu . . . . . . . . . . . . . . . . . . . . . . . . . . . . . . . . . . . . . . . . . . . . . . . . . . 3-27
3-11 Setting Sweep Parameters . . . . . . . . . . . . . . . . . . . . . . . . . . . . . . . . . . . . . . . . . . . . . . . . . . . 3-28
Single/Continuous . . . . . . . . . . . . . . . . . . . . . . . . . . . . . . . . . . . . . . . . . . . . . . . . . . . . . . . 3-28
Trace Points . . . . . . . . . . . . . . . . . . . . . . . . . . . . . . . . . . . . . . . . . . . . . . . . . . . . . . . . . . . 3-28
Sweep Limitations . . . . . . . . . . . . . . . . . . . . . . . . . . . . . . . . . . . . . . . . . . . . . . . . . . . . . . . 3-28
SWEEP Menu . . . . . . . . . . . . . . . . . . . . . . . . . . . . . . . . . . . . . . . . . . . . . . . . . . . . . . . . . . 3-29
Gated Sweep (Option 90) . . . . . . . . . . . . . . . . . . . . . . . . . . . . . . . . . . . . . . . . . . . . . . . . . 3-30
GATED SWEEP Menu . . . . . . . . . . . . . . . . . . . . . . . . . . . . . . . . . . . . . . . . . . . . . . . . . . . 3-31
POWER VS TIME Display. . . . . . . . . . . . . . . . . . . . . . . . . . . . . . . . . . . . . . . . . . . . . . . . . 3-32
MS2090A UG PN: 10580-00444 Rev. F Contents-3
Page 6

Table of Contents (Continued)
3-12 Setting Up Markers . . . . . . . . . . . . . . . . . . . . . . . . . . . . . . . . . . . . . . . . . . . . . . . . . . . . . . . . . 3-33
Placing a Normal Marker . . . . . . . . . . . . . . . . . . . . . . . . . . . . . . . . . . . . . . . . . . . . . . . . . . 3-34
Placing a Fixed Marker . . . . . . . . . . . . . . . . . . . . . . . . . . . . . . . . . . . . . . . . . . . . . . . . . . . 3-34
Placing a Delta Marker . . . . . . . . . . . . . . . . . . . . . . . . . . . . . . . . . . . . . . . . . . . . . . . . . . . 3-34
MARKER Menu . . . . . . . . . . . . . . . . . . . . . . . . . . . . . . . . . . . . . . . . . . . . . . . . . . . . . . . . . 3-35
MARKER PEAK SEARCH Menu. . . . . . . . . . . . . . . . . . . . . . . . . . . . . . . . . . . . . . . . . . . . 3-36
Marker Functions . . . . . . . . . . . . . . . . . . . . . . . . . . . . . . . . . . . . . . . . . . . . . . . . . . . . . . . . 3-37
Spectrogram with Cursors and Markers . . . . . . . . . . . . . . . . . . . . . . . . . . . . . . . . . . . . . . 3-38
Marker Table . . . . . . . . . . . . . . . . . . . . . . . . . . . . . . . . . . . . . . . . . . . . . . . . . . . . . . . . . . . 3-39
3-13 Setting Up Limit Lines. . . . . . . . . . . . . . . . . . . . . . . . . . . . . . . . . . . . . . . . . . . . . . . . . . . . . . . 3-40
Simple Limit Line . . . . . . . . . . . . . . . . . . . . . . . . . . . . . . . . . . . . . . . . . . . . . . . . . . . . . . . . 3-40
Limit Line Envelope . . . . . . . . . . . . . . . . . . . . . . . . . . . . . . . . . . . . . . . . . . . . . . . . . . . . . . 3-41
LIMIT Menu . . . . . . . . . . . . . . . . . . . . . . . . . . . . . . . . . . . . . . . . . . . . . . . . . . . . . . . . . . . . 3-42
LIMIT EDIT Menu . . . . . . . . . . . . . . . . . . . . . . . . . . . . . . . . . . . . . . . . . . . . . . . . . . . . . . . 3-43
LIMIT MOVE Menu . . . . . . . . . . . . . . . . . . . . . . . . . . . . . . . . . . . . . . . . . . . . . . . . . . . . . . 3-44
LIMIT ENVELOPE Menu . . . . . . . . . . . . . . . . . . . . . . . . . . . . . . . . . . . . . . . . . . . . . . . . . . 3-45
3-14 Setting Up Triggering . . . . . . . . . . . . . . . . . . . . . . . . . . . . . . . . . . . . . . . . . . . . . . . . . . . . . . . 3-46
TRIGGER Menu in Zero Span. . . . . . . . . . . . . . . . . . . . . . . . . . . . . . . . . . . . . . . . . . . . . . 3-46
3-15 Measurement Setup . . . . . . . . . . . . . . . . . . . . . . . . . . . . . . . . . . . . . . . . . . . . . . . . . . . . . . . . 3-48
SETUP Menu (Spectrum View) . . . . . . . . . . . . . . . . . . . . . . . . . . . . . . . . . . . . . . . . . . . . . 3-48
SETUP Menu (Spectrogram View) . . . . . . . . . . . . . . . . . . . . . . . . . . . . . . . . . . . . . . . . . . 3-48
3-16 Setting Up Advanced Measurements . . . . . . . . . . . . . . . . . . . . . . . . . . . . . . . . . . . . . . . . . . . 3-49
MEASURE Menu (Spectrum) . . . . . . . . . . . . . . . . . . . . . . . . . . . . . . . . . . . . . . . . . . . . . . 3-49
3-17 Channel Power . . . . . . . . . . . . . . . . . . . . . . . . . . . . . . . . . . . . . . . . . . . . . . . . . . . . . . . . . . . . 3-50
SETUP Menu (Channel Power). . . . . . . . . . . . . . . . . . . . . . . . . . . . . . . . . . . . . . . . . . . . . 3-51
3-18 Occupied Bandwidth . . . . . . . . . . . . . . . . . . . . . . . . . . . . . . . . . . . . . . . . . . . . . . . . . . . . . . . . 3-52
SETUP Menu (Occupied BW) . . . . . . . . . . . . . . . . . . . . . . . . . . . . . . . . . . . . . . . . . . . . . . 3-53
3-19 Adjacent Channel Power . . . . . . . . . . . . . . . . . . . . . . . . . . . . . . . . . . . . . . . . . . . . . . . . . . . . 3-54
SETUP Menu (ACP) . . . . . . . . . . . . . . . . . . . . . . . . . . . . . . . . . . . . . . . . . . . . . . . . . . . . . 3-55
3-20 Spectrum Emission Mask . . . . . . . . . . . . . . . . . . . . . . . . . . . . . . . . . . . . . . . . . . . . . . . . . . . . 3-56
Spectrum Emission Mask Measurement Basic Setup . . . . . . . . . . . . . . . . . . . . . . . . . . . . 3-57
SETUP Menu (SEM) . . . . . . . . . . . . . . . . . . . . . . . . . . . . . . . . . . . . . . . . . . . . . . . . . . . . . 3-57
Example Custom Signal Emission Mask . . . . . . . . . . . . . . . . . . . . . . . . . . . . . . . . . . . . . . 3-57
3-21 Interference Finder . . . . . . . . . . . . . . . . . . . . . . . . . . . . . . . . . . . . . . . . . . . . . . . . . . . . . . . . . 3-59
SETUP Menu (Interference Finder) . . . . . . . . . . . . . . . . . . . . . . . . . . . . . . . . . . . . . . . . . . 3-60
3-22 Field Strength . . . . . . . . . . . . . . . . . . . . . . . . . . . . . . . . . . . . . . . . . . . . . . . . . . . . . . . . . . . . . 3-61
AMPLITUDE FIELD STRENGTH Menu . . . . . . . . . . . . . . . . . . . . . . . . . . . . . . . . . . . . . . 3-62
Example User Antenna Data . . . . . . . . . . . . . . . . . . . . . . . . . . . . . . . . . . . . . . . . . . . . . . . 3-62
Antenna Calculations. . . . . . . . . . . . . . . . . . . . . . . . . . . . . . . . . . . . . . . . . . . . . . . . . . . . . 3-64
3-23 Electromagnetic Field (EMF) Measurements (Option 444). . . . . . . . . . . . . . . . . . . . . . . . . . . 3-65
Connecting the Antenna . . . . . . . . . . . . . . . . . . . . . . . . . . . . . . . . . . . . . . . . . . . . . . . . . . 3-65
SETUP Menu (EMF Measurement) . . . . . . . . . . . . . . . . . . . . . . . . . . . . . . . . . . . . . . . . . . 3-67
3-24 Presetting the Analyzer. . . . . . . . . . . . . . . . . . . . . . . . . . . . . . . . . . . . . . . . . . . . . . . . . . . . . . 3-68
PRESET Menu . . . . . . . . . . . . . . . . . . . . . . . . . . . . . . . . . . . . . . . . . . . . . . . . . . . . . . . . . 3-68
Contents-4 PN: 10580-00444 Rev. F MS2090A UG
Page 7

Table of Contents (Continued)
3-25 Saving and Recalling Measurements . . . . . . . . . . . . . . . . . . . . . . . . . . . . . . . . . . . . . . . . . . . 3-69
Saving a Measurement . . . . . . . . . . . . . . . . . . . . . . . . . . . . . . . . . . . . . . . . . . . . . . . . . . . 3-69
Recalling a Measurement . . . . . . . . . . . . . . . . . . . . . . . . . . . . . . . . . . . . . . . . . . . . . . . . . 3-70
FILE Menu . . . . . . . . . . . . . . . . . . . . . . . . . . . . . . . . . . . . . . . . . . . . . . . . . . . . . . . . . . . . . 3-71
SAVE ON EVENT Menu . . . . . . . . . . . . . . . . . . . . . . . . . . . . . . . . . . . . . . . . . . . . . . . . . . 3-71
Chapter 4—Real-Time Spectrum Analyzer Measurements
4-1 Introduction . . . . . . . . . . . . . . . . . . . . . . . . . . . . . . . . . . . . . . . . . . . . . . . . . . . . . . . . . . . . . . . . 4-1
4-2 Selecting the Analyzer . . . . . . . . . . . . . . . . . . . . . . . . . . . . . . . . . . . . . . . . . . . . . . . . . . . . . . . 4-1
4-3 RTSA GUI Overview. . . . . . . . . . . . . . . . . . . . . . . . . . . . . . . . . . . . . . . . . . . . . . . . . . . . . . . . . 4-2
Normal RTSA View . . . . . . . . . . . . . . . . . . . . . . . . . . . . . . . . . . . . . . . . . . . . . . . . . . . . . . . 4-2
Spectrogram View . . . . . . . . . . . . . . . . . . . . . . . . . . . . . . . . . . . . . . . . . . . . . . . . . . . . . . . . 4-4
4-4 Main Menu . . . . . . . . . . . . . . . . . . . . . . . . . . . . . . . . . . . . . . . . . . . . . . . . . . . . . . . . . . . . . . . . 4-5
Using Menus . . . . . . . . . . . . . . . . . . . . . . . . . . . . . . . . . . . . . . . . . . . . . . . . . . . . . . . . . . . . 4-5
4-5 Status Panel . . . . . . . . . . . . . . . . . . . . . . . . . . . . . . . . . . . . . . . . . . . . . . . . . . . . . . . . . . . . . . . 4-7
4-6 Making RTSA Measurements. . . . . . . . . . . . . . . . . . . . . . . . . . . . . . . . . . . . . . . . . . . . . . . . . . 4-8
Initial Setup . . . . . . . . . . . . . . . . . . . . . . . . . . . . . . . . . . . . . . . . . . . . . . . . . . . . . . . . . . . . . 4-8
4-7 Setting Frequency Parameters . . . . . . . . . . . . . . . . . . . . . . . . . . . . . . . . . . . . . . . . . . . . . . . . . 4-9
Entering Start and Stop Frequencies . . . . . . . . . . . . . . . . . . . . . . . . . . . . . . . . . . . . . . . . . 4-9
Entering a Center Frequency . . . . . . . . . . . . . . . . . . . . . . . . . . . . . . . . . . . . . . . . . . . . . . . 4-9
Using Offset Frequency. . . . . . . . . . . . . . . . . . . . . . . . . . . . . . . . . . . . . . . . . . . . . . . . . . . 4-10
Setting the Span . . . . . . . . . . . . . . . . . . . . . . . . . . . . . . . . . . . . . . . . . . . . . . . . . . . . . . . . 4-10
FREQ / SPAN Menu . . . . . . . . . . . . . . . . . . . . . . . . . . . . . . . . . . . . . . . . . . . . . . . . . . . . . 4-11
GESTURES Menu. . . . . . . . . . . . . . . . . . . . . . . . . . . . . . . . . . . . . . . . . . . . . . . . . . . . . . . 4-12
4-8 Setting Amplitude Parameters . . . . . . . . . . . . . . . . . . . . . . . . . . . . . . . . . . . . . . . . . . . . . . . . 4-13
Setting Amplitude Reference Level . . . . . . . . . . . . . . . . . . . . . . . . . . . . . . . . . . . . . . . . . . 4-13
Setting Amplitude Range and Scale . . . . . . . . . . . . . . . . . . . . . . . . . . . . . . . . . . . . . . . . . 4-13
Reference Level Offset for External Loss or External Gain. . . . . . . . . . . . . . . . . . . . . . . . 4-13
Attenuator Functions . . . . . . . . . . . . . . . . . . . . . . . . . . . . . . . . . . . . . . . . . . . . . . . . . . . . . 4-13
Preamplifier . . . . . . . . . . . . . . . . . . . . . . . . . . . . . . . . . . . . . . . . . . . . . . . . . . . . . . . . . . . . 4-14
Indications of Excessive Signal Level . . . . . . . . . . . . . . . . . . . . . . . . . . . . . . . . . . . . . . . . 4-14
AMPLITUDE Menu . . . . . . . . . . . . . . . . . . . . . . . . . . . . . . . . . . . . . . . . . . . . . . . . . . . . . . 4-15
4-9 Setting Bandwidth Parameters . . . . . . . . . . . . . . . . . . . . . . . . . . . . . . . . . . . . . . . . . . . . . . . . 4-16
Resolution Bandwidth . . . . . . . . . . . . . . . . . . . . . . . . . . . . . . . . . . . . . . . . . . . . . . . . . . . . 4-16
Setting Frequency Bandwidth . . . . . . . . . . . . . . . . . . . . . . . . . . . . . . . . . . . . . . . . . . . . . . 4-17
Setting Bandwidth Auto Coupling . . . . . . . . . . . . . . . . . . . . . . . . . . . . . . . . . . . . . . . . . . . 4-17
BANDWIDTH Menu. . . . . . . . . . . . . . . . . . . . . . . . . . . . . . . . . . . . . . . . . . . . . . . . . . . . . . 4-18
4-10 Setting Trace and Cursor Parameters . . . . . . . . . . . . . . . . . . . . . . . . . . . . . . . . . . . . . . . . . . 4-19
Traces in Normal View . . . . . . . . . . . . . . . . . . . . . . . . . . . . . . . . . . . . . . . . . . . . . . . . . . . 4-19
TRACE Menu (Normal View). . . . . . . . . . . . . . . . . . . . . . . . . . . . . . . . . . . . . . . . . . . . . . . 4-20
Trace Detector Types . . . . . . . . . . . . . . . . . . . . . . . . . . . . . . . . . . . . . . . . . . . . . . . . . . . . 4-22
Cursors in Spectrogram View . . . . . . . . . . . . . . . . . . . . . . . . . . . . . . . . . . . . . . . . . . . . . . 4-23
TRACE Menu (Spectrogram View) . . . . . . . . . . . . . . . . . . . . . . . . . . . . . . . . . . . . . . . . . . 4-24
TRACE CURSOR Menu . . . . . . . . . . . . . . . . . . . . . . . . . . . . . . . . . . . . . . . . . . . . . . . . . . 4-25
MS2090A UG PN: 10580-00444 Rev. F Contents-5
Page 8

Table of Contents (Continued)
4-11 Setting Sweep Parameters . . . . . . . . . . . . . . . . . . . . . . . . . . . . . . . . . . . . . . . . . . . . . . . . . . . 4-26
Single/Continuous . . . . . . . . . . . . . . . . . . . . . . . . . . . . . . . . . . . . . . . . . . . . . . . . . . . . . . . 4-26
SWEEP Menu . . . . . . . . . . . . . . . . . . . . . . . . . . . . . . . . . . . . . . . . . . . . . . . . . . . . . . . . . . 4-26
4-12 Setting Up Markers . . . . . . . . . . . . . . . . . . . . . . . . . . . . . . . . . . . . . . . . . . . . . . . . . . . . . . . . . 4-27
Placing a Normal Marker . . . . . . . . . . . . . . . . . . . . . . . . . . . . . . . . . . . . . . . . . . . . . . . . . . 4-28
Placing a Fixed Marker . . . . . . . . . . . . . . . . . . . . . . . . . . . . . . . . . . . . . . . . . . . . . . . . . . . 4-28
Placing a Delta Marker . . . . . . . . . . . . . . . . . . . . . . . . . . . . . . . . . . . . . . . . . . . . . . . . . . . 4-28
MARKER Menu . . . . . . . . . . . . . . . . . . . . . . . . . . . . . . . . . . . . . . . . . . . . . . . . . . . . . . . . . 4-29
MARKER PEAK SEARCH Menu. . . . . . . . . . . . . . . . . . . . . . . . . . . . . . . . . . . . . . . . . . . . 4-30
Marker Functions . . . . . . . . . . . . . . . . . . . . . . . . . . . . . . . . . . . . . . . . . . . . . . . . . . . . . . . . 4-31
Spectrogram with Cursors and Markers . . . . . . . . . . . . . . . . . . . . . . . . . . . . . . . . . . . . . . 4-32
Marker Table . . . . . . . . . . . . . . . . . . . . . . . . . . . . . . . . . . . . . . . . . . . . . . . . . . . . . . . . . . . 4-33
4-13 Setting Up Limit Lines. . . . . . . . . . . . . . . . . . . . . . . . . . . . . . . . . . . . . . . . . . . . . . . . . . . . . . . 4-34
Simple Limit Line . . . . . . . . . . . . . . . . . . . . . . . . . . . . . . . . . . . . . . . . . . . . . . . . . . . . . . . . 4-34
Limit Line Envelope . . . . . . . . . . . . . . . . . . . . . . . . . . . . . . . . . . . . . . . . . . . . . . . . . . . . . . 4-35
LIMIT Menu . . . . . . . . . . . . . . . . . . . . . . . . . . . . . . . . . . . . . . . . . . . . . . . . . . . . . . . . . . . . 4-36
LIMIT EDIT Menu . . . . . . . . . . . . . . . . . . . . . . . . . . . . . . . . . . . . . . . . . . . . . . . . . . . . . . . 4-37
LIMIT MOVE Menu . . . . . . . . . . . . . . . . . . . . . . . . . . . . . . . . . . . . . . . . . . . . . . . . . . . . . . 4-38
LIMIT ENVELOPE Menu . . . . . . . . . . . . . . . . . . . . . . . . . . . . . . . . . . . . . . . . . . . . . . . . . . 4-39
4-14 Setting Up Triggering . . . . . . . . . . . . . . . . . . . . . . . . . . . . . . . . . . . . . . . . . . . . . . . . . . . . . . . 4-40
TRIGGER Menu . . . . . . . . . . . . . . . . . . . . . . . . . . . . . . . . . . . . . . . . . . . . . . . . . . . . . . . . 4-40
4-15 Measurement Setup . . . . . . . . . . . . . . . . . . . . . . . . . . . . . . . . . . . . . . . . . . . . . . . . . . . . . . . . 4-41
SETUP Menu. . . . . . . . . . . . . . . . . . . . . . . . . . . . . . . . . . . . . . . . . . . . . . . . . . . . . . . . . . . 4-41
4-16 Setting Up Advanced Measurements . . . . . . . . . . . . . . . . . . . . . . . . . . . . . . . . . . . . . . . . . . . 4-42
MEASURE Menu (Spectrum) . . . . . . . . . . . . . . . . . . . . . . . . . . . . . . . . . . . . . . . . . . . . . . 4-42
4-17 Presetting the Analyzer. . . . . . . . . . . . . . . . . . . . . . . . . . . . . . . . . . . . . . . . . . . . . . . . . . . . . . 4-43
PRESET Menu . . . . . . . . . . . . . . . . . . . . . . . . . . . . . . . . . . . . . . . . . . . . . . . . . . . . . . . . . 4-43
4-18 Saving and Recalling Measurements . . . . . . . . . . . . . . . . . . . . . . . . . . . . . . . . . . . . . . . . . . . 4-44
Saving a Measurement . . . . . . . . . . . . . . . . . . . . . . . . . . . . . . . . . . . . . . . . . . . . . . . . . . . 4-44
Recalling a Measurement . . . . . . . . . . . . . . . . . . . . . . . . . . . . . . . . . . . . . . . . . . . . . . . . . 4-45
FILE Menu . . . . . . . . . . . . . . . . . . . . . . . . . . . . . . . . . . . . . . . . . . . . . . . . . . . . . . . . . . . . . 4-46
Chapter 5—LTE Signal Analyzer
5-1 Introduction . . . . . . . . . . . . . . . . . . . . . . . . . . . . . . . . . . . . . . . . . . . . . . . . . . . . . . . . . . . . . . . . 5-1
RF Measurements . . . . . . . . . . . . . . . . . . . . . . . . . . . . . . . . . . . . . . . . . . . . . . . . . . . . . . . . 5-1
Modulation Measurements . . . . . . . . . . . . . . . . . . . . . . . . . . . . . . . . . . . . . . . . . . . . . . . . . 5-1
5-2 Selecting the Analyzer . . . . . . . . . . . . . . . . . . . . . . . . . . . . . . . . . . . . . . . . . . . . . . . . . . . . . . . 5-2
5-3 Main Menu . . . . . . . . . . . . . . . . . . . . . . . . . . . . . . . . . . . . . . . . . . . . . . . . . . . . . . . . . . . . . . . . 5-3
Using Menus . . . . . . . . . . . . . . . . . . . . . . . . . . . . . . . . . . . . . . . . . . . . . . . . . . . . . . . . . . . . 5-3
5-4 Setting Frequency and Bandwidth Parameters . . . . . . . . . . . . . . . . . . . . . . . . . . . . . . . . . . . . 5-4
Configuring the Band . . . . . . . . . . . . . . . . . . . . . . . . . . . . . . . . . . . . . . . . . . . . . . . . . . . . . . 5-4
FREQUENCY Menu . . . . . . . . . . . . . . . . . . . . . . . . . . . . . . . . . . . . . . . . . . . . . . . . . . . . . . 5-4
SIGNAL STANDARDS Dialog . . . . . . . . . . . . . . . . . . . . . . . . . . . . . . . . . . . . . . . . . . . . . . . 5-5
GESTURES Menu . . . . . . . . . . . . . . . . . . . . . . . . . . . . . . . . . . . . . . . . . . . . . . . . . . . . . . . . 5-5
Contents-6 PN: 10580-00444 Rev. F MS2090A UG
Page 9

Table of Contents (Continued)
5-5 Setting Amplitude . . . . . . . . . . . . . . . . . . . . . . . . . . . . . . . . . . . . . . . . . . . . . . . . . . . . . . . . . . . 5-6
Setting Amplitude Parameters. . . . . . . . . . . . . . . . . . . . . . . . . . . . . . . . . . . . . . . . . . . . . . . 5-6
Reference Level Offset for External Loss or External Gain. . . . . . . . . . . . . . . . . . . . . . . . . 5-6
Attenuator Functions . . . . . . . . . . . . . . . . . . . . . . . . . . . . . . . . . . . . . . . . . . . . . . . . . . . . . . 5-6
Indications of Excessive Signal Level . . . . . . . . . . . . . . . . . . . . . . . . . . . . . . . . . . . . . . . . . 5-7
AMPLITUDE Menu . . . . . . . . . . . . . . . . . . . . . . . . . . . . . . . . . . . . . . . . . . . . . . . . . . . . . . . 5-8
5-6 Setting Bandwidth Parameters . . . . . . . . . . . . . . . . . . . . . . . . . . . . . . . . . . . . . . . . . . . . . . . . . 5-9
BANDWIDTH Menu. . . . . . . . . . . . . . . . . . . . . . . . . . . . . . . . . . . . . . . . . . . . . . . . . . . . . . . 5-9
5-7 Setting Trace Parameters. . . . . . . . . . . . . . . . . . . . . . . . . . . . . . . . . . . . . . . . . . . . . . . . . . . . 5-10
TRACE Menu . . . . . . . . . . . . . . . . . . . . . . . . . . . . . . . . . . . . . . . . . . . . . . . . . . . . . . . . . . 5-10
5-8 Setting Sweep Parameters . . . . . . . . . . . . . . . . . . . . . . . . . . . . . . . . . . . . . . . . . . . . . . . . . . . 5-12
SWEEP Menu – LTE Demod Summary Measurements . . . . . . . . . . . . . . . . . . . . . . . . . . 5-12
SWEEP Menu – LTE RF Measurements . . . . . . . . . . . . . . . . . . . . . . . . . . . . . . . . . . . . . 5-12
Gated Sweep (Option 90) . . . . . . . . . . . . . . . . . . . . . . . . . . . . . . . . . . . . . . . . . . . . . . . . . 5-13
GATED SWEEP Menu . . . . . . . . . . . . . . . . . . . . . . . . . . . . . . . . . . . . . . . . . . . . . . . . . . . 5-14
POWER VS TIME Display. . . . . . . . . . . . . . . . . . . . . . . . . . . . . . . . . . . . . . . . . . . . . . . . . 5-15
5-9 Setting Up Markers . . . . . . . . . . . . . . . . . . . . . . . . . . . . . . . . . . . . . . . . . . . . . . . . . . . . . . . . . 5-16
Placing a Normal Marker . . . . . . . . . . . . . . . . . . . . . . . . . . . . . . . . . . . . . . . . . . . . . . . . . . 5-16
Placing a Fixed Marker . . . . . . . . . . . . . . . . . . . . . . . . . . . . . . . . . . . . . . . . . . . . . . . . . . . 5-17
Placing a Delta Marker . . . . . . . . . . . . . . . . . . . . . . . . . . . . . . . . . . . . . . . . . . . . . . . . . . . 5-17
MARKER Menu . . . . . . . . . . . . . . . . . . . . . . . . . . . . . . . . . . . . . . . . . . . . . . . . . . . . . . . . . 5-18
MARKER PEAK SEARCH Menu. . . . . . . . . . . . . . . . . . . . . . . . . . . . . . . . . . . . . . . . . . . . 5-19
Marker Functions. . . . . . . . . . . . . . . . . . . . . . . . . . . . . . . . . . . . . . . . . . . . . . . . . . . . . . . . 5-20
Marker Table . . . . . . . . . . . . . . . . . . . . . . . . . . . . . . . . . . . . . . . . . . . . . . . . . . . . . . . . . . . 5-20
5-10 LTE Measurement Setup . . . . . . . . . . . . . . . . . . . . . . . . . . . . . . . . . . . . . . . . . . . . . . . . . . . . 5-21
MEASURE Menu (LTE). . . . . . . . . . . . . . . . . . . . . . . . . . . . . . . . . . . . . . . . . . . . . . . . . . . 5-22
5-11 LTE Demod Summary . . . . . . . . . . . . . . . . . . . . . . . . . . . . . . . . . . . . . . . . . . . . . . . . . . . . . . 5-23
LTE Demod Summary View . . . . . . . . . . . . . . . . . . . . . . . . . . . . . . . . . . . . . . . . . . . . . . . 5-23
LTE Time Alignment Error (TAE) View . . . . . . . . . . . . . . . . . . . . . . . . . . . . . . . . . . . . . . . 5-25
LTE Resource Block View . . . . . . . . . . . . . . . . . . . . . . . . . . . . . . . . . . . . . . . . . . . . . . . . . 5-26
SETUP Menu (LTE Demod Summary) . . . . . . . . . . . . . . . . . . . . . . . . . . . . . . . . . . . . . . . 5-27
Status Panel (LTE Demod Summary) . . . . . . . . . . . . . . . . . . . . . . . . . . . . . . . . . . . . . . . . 5-27
5-12 LTE Channel Power . . . . . . . . . . . . . . . . . . . . . . . . . . . . . . . . . . . . . . . . . . . . . . . . . . . . . . . . 5-28
SETUP Menu (LTE Channel Power) . . . . . . . . . . . . . . . . . . . . . . . . . . . . . . . . . . . . . . . . . 5-29
Status Panel (LTE Channel Power). . . . . . . . . . . . . . . . . . . . . . . . . . . . . . . . . . . . . . . . . . 5-30
5-13 LTE Channel Spectrum . . . . . . . . . . . . . . . . . . . . . . . . . . . . . . . . . . . . . . . . . . . . . . . . . . . . . 5-31
SETUP Menu (LTE Channel Spectrum) . . . . . . . . . . . . . . . . . . . . . . . . . . . . . . . . . . . . . . 5-32
Status Panel (LTE Channel Spectrum) . . . . . . . . . . . . . . . . . . . . . . . . . . . . . . . . . . . . . . . 5-33
5-14 LTE Carrier Aggregation. . . . . . . . . . . . . . . . . . . . . . . . . . . . . . . . . . . . . . . . . . . . . . . . . . . . . 5-34
LTE Carrier Aggregation View. . . . . . . . . . . . . . . . . . . . . . . . . . . . . . . . . . . . . . . . . . . . . . 5-34
SETUP Menu (LTE Carrier Aggregation) . . . . . . . . . . . . . . . . . . . . . . . . . . . . . . . . . . . . . 5-35
Status Panel (LTE Carrier Aggregation) . . . . . . . . . . . . . . . . . . . . . . . . . . . . . . . . . . . . . . 5-36
5-15 Presetting the Analyzer. . . . . . . . . . . . . . . . . . . . . . . . . . . . . . . . . . . . . . . . . . . . . . . . . . . . . . 5-37
PRESET Menu . . . . . . . . . . . . . . . . . . . . . . . . . . . . . . . . . . . . . . . . . . . . . . . . . . . . . . . . . 5-37
MS2090A UG PN: 10580-00444 Rev. F Contents-7
Page 10

5-16 Saving and Recalling Measurements . . . . . . . . . . . . . . . . . . . . . . . . . . . . . . . . . . . . . . . . . . . 5-38
Saving a Measurement . . . . . . . . . . . . . . . . . . . . . . . . . . . . . . . . . . . . . . . . . . . . . . . . . . . 5-38
Recalling a Measurement . . . . . . . . . . . . . . . . . . . . . . . . . . . . . . . . . . . . . . . . . . . . . . . . . 5-39
FILE Menu . . . . . . . . . . . . . . . . . . . . . . . . . . . . . . . . . . . . . . . . . . . . . . . . . . . . . . . . . . . . . 5-40
Chapter 6—5G Measurements
6-1 Introduction . . . . . . . . . . . . . . . . . . . . . . . . . . . . . . . . . . . . . . . . . . . . . . . . . . . . . . . . . . . . . . . . 6-1
6-2 Selecting the Analyzer . . . . . . . . . . . . . . . . . . . . . . . . . . . . . . . . . . . . . . . . . . . . . . . . . . . . . . . 6-1
6-3 Main Menu . . . . . . . . . . . . . . . . . . . . . . . . . . . . . . . . . . . . . . . . . . . . . . . . . . . . . . . . . . . . . . . . 6-2
Using Menus . . . . . . . . . . . . . . . . . . . . . . . . . . . . . . . . . . . . . . . . . . . . . . . . . . . . . . . . . . . . 6-2
6-4 Setting Frequency and Band Parameters. . . . . . . . . . . . . . . . . . . . . . . . . . . . . . . . . . . . . . . . . 6-3
Configuring the Band . . . . . . . . . . . . . . . . . . . . . . . . . . . . . . . . . . . . . . . . . . . . . . . . . . . . . . 6-3
FREQUENCY Menu . . . . . . . . . . . . . . . . . . . . . . . . . . . . . . . . . . . . . . . . . . . . . . . . . . . . . . 6-4
BAND CONFIG Menu . . . . . . . . . . . . . . . . . . . . . . . . . . . . . . . . . . . . . . . . . . . . . . . . . . . . . 6-5
GESTURES Menu . . . . . . . . . . . . . . . . . . . . . . . . . . . . . . . . . . . . . . . . . . . . . . . . . . . . . . . . 6-5
6-5 Setting Amplitude . . . . . . . . . . . . . . . . . . . . . . . . . . . . . . . . . . . . . . . . . . . . . . . . . . . . . . . . . . . 6-6
Setting Amplitude Parameters . . . . . . . . . . . . . . . . . . . . . . . . . . . . . . . . . . . . . . . . . . . . . . . 6-6
Reference Level Offset for External Loss or External Gain . . . . . . . . . . . . . . . . . . . . . . . . . 6-6
Attenuator Functions . . . . . . . . . . . . . . . . . . . . . . . . . . . . . . . . . . . . . . . . . . . . . . . . . . . . . . 6-6
Indications of Excessive Signal Level . . . . . . . . . . . . . . . . . . . . . . . . . . . . . . . . . . . . . . . . . 6-7
AMPLITUDE Menu . . . . . . . . . . . . . . . . . . . . . . . . . . . . . . . . . . . . . . . . . . . . . . . . . . . . . . . 6-8
6-6 Setting Bandwidth Parameters . . . . . . . . . . . . . . . . . . . . . . . . . . . . . . . . . . . . . . . . . . . . . . . . . 6-9
BANDWIDTH Menu . . . . . . . . . . . . . . . . . . . . . . . . . . . . . . . . . . . . . . . . . . . . . . . . . . . . . . . 6-9
6-7 Setting Trace Parameters. . . . . . . . . . . . . . . . . . . . . . . . . . . . . . . . . . . . . . . . . . . . . . . . . . . . 6-10
TRACE Menu. . . . . . . . . . . . . . . . . . . . . . . . . . . . . . . . . . . . . . . . . . . . . . . . . . . . . . . . . . . 6-10
6-8 Setting Sweep Parameters . . . . . . . . . . . . . . . . . . . . . . . . . . . . . . . . . . . . . . . . . . . . . . . . . . . 6-12
SWEEP Menu – Summary Measurements . . . . . . . . . . . . . . . . . . . . . . . . . . . . . . . . . . . . 6-12
SWEEP Menu – RF Measurements . . . . . . . . . . . . . . . . . . . . . . . . . . . . . . . . . . . . . . . . . 6-12
Gated Sweep (Option 90) . . . . . . . . . . . . . . . . . . . . . . . . . . . . . . . . . . . . . . . . . . . . . . . . . 6-13
GATED SWEEP Menu . . . . . . . . . . . . . . . . . . . . . . . . . . . . . . . . . . . . . . . . . . . . . . . . . . . 6-14
POWER VS TIME Display . . . . . . . . . . . . . . . . . . . . . . . . . . . . . . . . . . . . . . . . . . . . . . . . . 6-15
6-9 Setting Up Markers . . . . . . . . . . . . . . . . . . . . . . . . . . . . . . . . . . . . . . . . . . . . . . . . . . . . . . . . . 6-16
Placing a Normal Marker . . . . . . . . . . . . . . . . . . . . . . . . . . . . . . . . . . . . . . . . . . . . . . . . . . 6-16
Placing a Fixed Marker . . . . . . . . . . . . . . . . . . . . . . . . . . . . . . . . . . . . . . . . . . . . . . . . . . . 6-17
Placing a Delta Marker . . . . . . . . . . . . . . . . . . . . . . . . . . . . . . . . . . . . . . . . . . . . . . . . . . . 6-17
MARKER Menu . . . . . . . . . . . . . . . . . . . . . . . . . . . . . . . . . . . . . . . . . . . . . . . . . . . . . . . . . 6-18
MARKER PEAK SEARCH Menu. . . . . . . . . . . . . . . . . . . . . . . . . . . . . . . . . . . . . . . . . . . . 6-19
Marker Functions . . . . . . . . . . . . . . . . . . . . . . . . . . . . . . . . . . . . . . . . . . . . . . . . . . . . . . . . 6-20
Marker Table . . . . . . . . . . . . . . . . . . . . . . . . . . . . . . . . . . . . . . . . . . . . . . . . . . . . . . . . . . . 6-20
6-10 5G Measurement Setup . . . . . . . . . . . . . . . . . . . . . . . . . . . . . . . . . . . . . . . . . . . . . . . . . . . . . 6-21
MEASURE Menu (5G). . . . . . . . . . . . . . . . . . . . . . . . . . . . . . . . . . . . . . . . . . . . . . . . . . . . 6-22
Contents-8 PN: 10580-00444 Rev. F MS2090A UG
Page 11

6-11 5GNR Summary . . . . . . . . . . . . . . . . . . . . . . . . . . . . . . . . . . . . . . . . . . . . . . . . . . . . . . . . . . . 6-23
5GNR Summary Multi Beam View . . . . . . . . . . . . . . . . . . . . . . . . . . . . . . . . . . . . . . . . . . 6-23
5GNR Summary Single Beam View . . . . . . . . . . . . . . . . . . . . . . . . . . . . . . . . . . . . . . . . . 6-25
5GNR Multi PCI Scanner View . . . . . . . . . . . . . . . . . . . . . . . . . . . . . . . . . . . . . . . . . . . . . 6-27
5GNR Multi PCI Table View . . . . . . . . . . . . . . . . . . . . . . . . . . . . . . . . . . . . . . . . . . . . . . . 6-28
SETUP Menu (5GNR Summary and Multi PCI) . . . . . . . . . . . . . . . . . . . . . . . . . . . . . . . . 6-29
Status Panel (5GNR Summary/Multi PCI). . . . . . . . . . . . . . . . . . . . . . . . . . . . . . . . . . . . . 6-29
6-12 5G Channel Power . . . . . . . . . . . . . . . . . . . . . . . . . . . . . . . . . . . . . . . . . . . . . . . . . . . . . . . . . 6-30
SETUP Menu (5G Channel Power). . . . . . . . . . . . . . . . . . . . . . . . . . . . . . . . . . . . . . . . . . 6-31
Status Panel (5G Channel Power) . . . . . . . . . . . . . . . . . . . . . . . . . . . . . . . . . . . . . . . . . . 6-32
6-13 5G Occupied Bandwidth . . . . . . . . . . . . . . . . . . . . . . . . . . . . . . . . . . . . . . . . . . . . . . . . . . . . . 6-33
SETUP Menu (5G OBW). . . . . . . . . . . . . . . . . . . . . . . . . . . . . . . . . . . . . . . . . . . . . . . . . . 6-34
Status Panel (5G OBW) . . . . . . . . . . . . . . . . . . . . . . . . . . . . . . . . . . . . . . . . . . . . . . . . . . 6-35
6-14 5G EIRP . . . . . . . . . . . . . . . . . . . . . . . . . . . . . . . . . . . . . . . . . . . . . . . . . . . . . . . . . . . . . . . . . 6-36
SETUP Menu (5G EIRP) . . . . . . . . . . . . . . . . . . . . . . . . . . . . . . . . . . . . . . . . . . . . . . . . . . 6-39
Status Panel (5G EIRP). . . . . . . . . . . . . . . . . . . . . . . . . . . . . . . . . . . . . . . . . . . . . . . . . . . 6-40
6-15 5GNR Carrier Aggregation . . . . . . . . . . . . . . . . . . . . . . . . . . . . . . . . . . . . . . . . . . . . . . . . . . . 6-41
5GNR Carrier Aggregation View . . . . . . . . . . . . . . . . . . . . . . . . . . . . . . . . . . . . . . . . . . . . 6-41
SETUP Menu (5GNR Carrier Aggregation). . . . . . . . . . . . . . . . . . . . . . . . . . . . . . . . . . . . 6-42
Status Panel (5GNR Carrier Aggregation) . . . . . . . . . . . . . . . . . . . . . . . . . . . . . . . . . . . . 6-43
6-16 Presetting the Analyzer. . . . . . . . . . . . . . . . . . . . . . . . . . . . . . . . . . . . . . . . . . . . . . . . . . . . . . 6-44
PRESET Menu . . . . . . . . . . . . . . . . . . . . . . . . . . . . . . . . . . . . . . . . . . . . . . . . . . . . . . . . . 6-44
6-17 Saving and Recalling Measurements . . . . . . . . . . . . . . . . . . . . . . . . . . . . . . . . . . . . . . . . . . . 6-45
Saving a Measurement . . . . . . . . . . . . . . . . . . . . . . . . . . . . . . . . . . . . . . . . . . . . . . . . . . . 6-45
Recalling a Measurement . . . . . . . . . . . . . . . . . . . . . . . . . . . . . . . . . . . . . . . . . . . . . . . . . 6-46
FILE Menu . . . . . . . . . . . . . . . . . . . . . . . . . . . . . . . . . . . . . . . . . . . . . . . . . . . . . . . . . . . . . 6-47
Chapter 7—IQ Capture/Streaming (Option 124/126 and 125/127)
7-1 Introduction . . . . . . . . . . . . . . . . . . . . . . . . . . . . . . . . . . . . . . . . . . . . . . . . . . . . . . . . . . . . . . . . 7-1
7-2 IQ Capture Block Mode . . . . . . . . . . . . . . . . . . . . . . . . . . . . . . . . . . . . . . . . . . . . . . . . . . . . . . 7-1
7-3 IQ Data Format . . . . . . . . . . . . . . . . . . . . . . . . . . . . . . . . . . . . . . . . . . . . . . . . . . . . . . . . . . . . . 7-1
IQ Frame Structure . . . . . . . . . . . . . . . . . . . . . . . . . . . . . . . . . . . . . . . . . . . . . . . . . . . . . . . 7-2
IQ Extended Frame . . . . . . . . . . . . . . . . . . . . . . . . . . . . . . . . . . . . . . . . . . . . . . . . . . . . . . . 7-2
IQ Timestamps . . . . . . . . . . . . . . . . . . . . . . . . . . . . . . . . . . . . . . . . . . . . . . . . . . . . . . . . . . 7-3
7-4 IQ Streaming. . . . . . . . . . . . . . . . . . . . . . . . . . . . . . . . . . . . . . . . . . . . . . . . . . . . . . . . . . . . . . . 7-6
Data Transmission to Remote User . . . . . . . . . . . . . . . . . . . . . . . . . . . . . . . . . . . . . . . . . . 7-6
7-5 IQ Capture/Streaming Measurement . . . . . . . . . . . . . . . . . . . . . . . . . . . . . . . . . . . . . . . . . . . . 7-7
IQ CAPTURE Menu. . . . . . . . . . . . . . . . . . . . . . . . . . . . . . . . . . . . . . . . . . . . . . . . . . . . . . . 7-8
IQ STREAMING Menu . . . . . . . . . . . . . . . . . . . . . . . . . . . . . . . . . . . . . . . . . . . . . . . . . . . . 7-9
IQ TRIGGER Menu . . . . . . . . . . . . . . . . . . . . . . . . . . . . . . . . . . . . . . . . . . . . . . . . . . . . . . 7-10
IQ Streaming Tools . . . . . . . . . . . . . . . . . . . . . . . . . . . . . . . . . . . . . . . . . . . . . . . . . . . . . . 7-11
7-6 Setting Up the Data Out Port and MA25424A . . . . . . . . . . . . . . . . . . . . . . . . . . . . . . . . . . . . 7-12
Chapter 8—EMF Meter Measurements (Option 445)
8-1 Introduction . . . . . . . . . . . . . . . . . . . . . . . . . . . . . . . . . . . . . . . . . . . . . . . . . . . . . . . . . . . . . . . . 8-1
8-2 Selecting the Analyzer . . . . . . . . . . . . . . . . . . . . . . . . . . . . . . . . . . . . . . . . . . . . . . . . . . . . . . . 8-1
MS2090A UG PN: 10580-00444 Rev. F Contents-9
Page 12

8-3 Connecting the Probe . . . . . . . . . . . . . . . . . . . . . . . . . . . . . . . . . . . . . . . . . . . . . . . . . . . . . . . . 8-2
8-4 EMF Meter Overview . . . . . . . . . . . . . . . . . . . . . . . . . . . . . . . . . . . . . . . . . . . . . . . . . . . . . . . . 8-3
EMF Meter Measurement . . . . . . . . . . . . . . . . . . . . . . . . . . . . . . . . . . . . . . . . . . . . . . . . . . 8-3
LIMIT Menu (EMF Meter) . . . . . . . . . . . . . . . . . . . . . . . . . . . . . . . . . . . . . . . . . . . . . . . . . . 8-4
MEASURE Menu (EMF Meter) . . . . . . . . . . . . . . . . . . . . . . . . . . . . . . . . . . . . . . . . . . . . . . 8-4
SETUP Menu (EMF Meter) . . . . . . . . . . . . . . . . . . . . . . . . . . . . . . . . . . . . . . . . . . . . . . . . . 8-5
8-5 Presetting the Meter . . . . . . . . . . . . . . . . . . . . . . . . . . . . . . . . . . . . . . . . . . . . . . . . . . . . . . . . . 8-5
PRESET Menu . . . . . . . . . . . . . . . . . . . . . . . . . . . . . . . . . . . . . . . . . . . . . . . . . . . . . . . . . . 8-5
8-6 Saving and Recalling Measurements . . . . . . . . . . . . . . . . . . . . . . . . . . . . . . . . . . . . . . . . . . . . 8-6
Saving a Measurement . . . . . . . . . . . . . . . . . . . . . . . . . . . . . . . . . . . . . . . . . . . . . . . . . . . . 8-6
Recalling a Measurement . . . . . . . . . . . . . . . . . . . . . . . . . . . . . . . . . . . . . . . . . . . . . . . . . . 8-7
FILE Menu . . . . . . . . . . . . . . . . . . . . . . . . . . . . . . . . . . . . . . . . . . . . . . . . . . . . . . . . . . . . . . 8-8
Appendix A—Instrument Messages and Troubleshooting
A-1 Introduction . . . . . . . . . . . . . . . . . . . . . . . . . . . . . . . . . . . . . . . . . . . . . . . . . . . . . . . . . . . . . . . . A-1
A-2 Self-Test Messages . . . . . . . . . . . . . . . . . . . . . . . . . . . . . . . . . . . . . . . . . . . . . . . . . . . . . . . . . A-2
A-3 File Management Messages. . . . . . . . . . . . . . . . . . . . . . . . . . . . . . . . . . . . . . . . . . . . . . . . . . . A-5
A-4 Informational Messages . . . . . . . . . . . . . . . . . . . . . . . . . . . . . . . . . . . . . . . . . . . . . . . . . . . . . . A-6
A-5 Warning Messages . . . . . . . . . . . . . . . . . . . . . . . . . . . . . . . . . . . . . . . . . . . . . . . . . . . . . . . . . . A-9
A-6 Error Messages. . . . . . . . . . . . . . . . . . . . . . . . . . . . . . . . . . . . . . . . . . . . . . . . . . . . . . . . . . . . A-10
A-7 System Recovery . . . . . . . . . . . . . . . . . . . . . . . . . . . . . . . . . . . . . . . . . . . . . . . . . . . . . . . . . . A-12
Introduction . . . . . . . . . . . . . . . . . . . . . . . . . . . . . . . . . . . . . . . . . . . . . . . . . . . . . . . . . . . . A-12
Reset . . . . . . . . . . . . . . . . . . . . . . . . . . . . . . . . . . . . . . . . . . . . . . . . . . . . . . . . . . . . . . . . . A-14
Boot Order . . . . . . . . . . . . . . . . . . . . . . . . . . . . . . . . . . . . . . . . . . . . . . . . . . . . . . . . . . . . . A-14
Install SW to SLOT X . . . . . . . . . . . . . . . . . . . . . . . . . . . . . . . . . . . . . . . . . . . . . . . . . . . . . A-15
Appendix B—Software Option Upgrades
B-1 Introduction . . . . . . . . . . . . . . . . . . . . . . . . . . . . . . . . . . . . . . . . . . . . . . . . . . . . . . . . . . . . . . . . B-1
B-2 Exporting a Software Configuration File . . . . . . . . . . . . . . . . . . . . . . . . . . . . . . . . . . . . . . . . . . B-1
B-3 Importing Software License . . . . . . . . . . . . . . . . . . . . . . . . . . . . . . . . . . . . . . . . . . . . . . . . . . . B-1
Contents-10 PN: 10580-00444 Rev. F MS2090A UG
Page 13

Chapter 1 — General Information
1-1 Introduction
The MS2090A Field Master Pro User Guide is part of a set of manuals that cover all of the instrument
functions and their use. This manual covers the instrument overview, system functions, and other common
features, along with a brief guide to basic measurement concepts and setups. Most instrument operations are
covered in specific chapters of this manual as listed below. Remote programming is covered in the
programming manual.
Before You Begin
• Read the Field Master Pro MS2090A Information, Compliance, and Safety Guide (PN: 10100-00069) for
important safety, legal, and regulatory notices before operating the equipment.
• Charge the instrument battery using the supplied battery charger until fully charged.
Note The instrument may reboot when the battery charge level is low and external power is removed.
• Review Section 1-2 “Instrument Description” on page 1-2 and Section 1-3 “Instrument Care and
Preventive Maintenance” on page 1-4.
• Chapter 2, “Instrument Overview” provides information about the physical instrument, connectors, and
other hardware interfaces.
• Chapter 3, “Spectrum Analyzer Measurements” provides information on the software user interface,
such as instrument settings, measurement features, and menu overviews, for the spectrum analyzer.
• Chapter 4, “Real-Time Spectrum Analyzer Measurements” provides information on the software user
interface, such as instrument settings, measurement features, and menu overviews, for the real-time
spectrum analyzer.
• Chapter 5, “LTE Signal Analyzer” provides information on the software user interface, such as
instrument settings, measurement features, and menu overviews, for the LTE analyzer.
• Chapter 6, “5G Measurements” provides information on the software user interface, such as instrument
settings, measurement features, and menu overviews, for the 5G analyzer.
• Chapter 7, “IQ Capture/Streaming (Option 124/126 and 125/127)” provides information on the software
user interface, such as instrument settings, measurement features, and menu overviews, for the 5G
analyzer.
• Chapter 8, “EMF Meter Measurements (Option 445)” provides information on the software user
interface, such as instrument settings, measurement features, and menu overviews, for the 5G analyzer.
Additional Documentation
Table 1-1. Related Manuals
Document Part Number Description
10100-00069 Important Product Information, Compliance, and Safety Notices
11410-01000 MS2090A Field Master Pro Technical Data Sheet
10580-00445 Programming Manual
For additional information and literature covering your product, visit the product page of your instrument and
select the Library tab:
http://www.anritsu.com/en-US/test-measurement/products/ms2090a
MS2090A UG PN: 10580-00444 Rev. F 1-1
Page 14

1-2 Instrument Description General Information
Document Conventions
The following conventions are used throughout the MS2090A documentation set.
Instrument Identification
When identifying a frequency option for the MS2090A, that option number is appended after the model
number; example: MS2090A-0709.
User Interface
The MS2090A user interface consists of menus, buttons, toolbars, and dialog boxes.
User Interface Navigation
Elements in navigation paths are separated as follows: MARKER > PEAK SEARCH > NEXT PEAK.
1-2 Instrument Description
The MS2090A Field Master Pro is a synthesizer-based handheld signal analyzer that provides quick and
accurate measurement results. The instrument is designed for monitoring, measuring, and analyzing signal
environments. Measurements can easily be made by using the main instrument functions: frequency, span,
amplitude, and bandwidth. A 10.1" capacitive touchscreen enables fast, easy data entry.
Typical measurements include in-band interference and transmit spectrum analysis, plus cell site and
802.11a/b/g interference testing. Options are available for RF, advanced demodulation, and over-the-air (OTA)
measurement. A full range of marker capabilities (such as peak, center, and delta functions) are provided for
faster, more comprehensive analysis of displayed signals. Upper and lower multi-segmented limit lines are
available to create quick, simple pass/fail measurements.
Time and date stamping of measurement data is automatic. The internal memory provides for the storage and
recall of up to 1000 measurement setups and up to 1000 traces. Measurements and setups can be stored
internally on the instrument or on a USB flash drive for later recall.
Note
Not all after-market USB drives are compatible with Field Master Pro. The USB drive must contain a
single partition using FAT32 format.
Available Models
Table 1-2 lists the frequency options available with the MS2090A Field Master Pro.
Tab le 1-2. Field Master Pro Frequency Options
Model Frequency Range
MS2090A-0709 Signal Analyzer, 9 kHz to 9 GHz
MS2090A-0714 Signal Analyzer, 9 kHz to 14 GHz
MS2090A-0720 Signal Analyzer, 9 kHz to 20 GHz
MS2090A-0726 Signal Analyzer, 9 kHz to 26.5 GHz
MS2090A-0732 Signal Analyzer, 9 kHz to 32 GHz
MS2090A-0743 Signal Analyzer, 9 kHz to 43.5 GHz
MS2090A-0754 Signal Analyzer, 9 kHz to 54 GHz
1-2 PN: 10580-00444 Rev. F MS2090A UG
Page 15

General Information 1-2 Instrument Description
Available Options
Available options for the Field Master Pro are listed in Table 1-3.
Table 1-3. Available Options
Option
MS2090A-0024 Interference Finder
MS2090A-0031 GPS Receiver (requires external GPS antenna)
MS2090A-0089 Zero Span IF Output
MS2090A-0090 Gated Sweep
MS2090A-0103 50 MHz Analysis Bandwidth
MS2090A-0104 100 MHz Analysis Bandwidth
MS2090A-0124 IQ Waveform Capture
MS2090A-0125 IQ Waveform Streaming (requires Option 124)
MS2090A-0126 IQ Waveform Capture (non export control)
MS2090A-0127 IQ Waveform Streaming (non export control, requires Option 126)
MS2090A-0444 EMF Measurement (requires a compatible Anritsu isotropic antenna)
MS2090A-0445 EMF Meter Enabled (requires 2000-1985-R isotropic EMF probe)
MS2090A-0199 Real-Time Spectrum Analyzer
MS2090A-0888 5G NR Downlink Measurements (requires GPS option MS2090A-0031)
MS2090A-xxxx-0097 Accredited Calibration to ISO17025 and ANSI/NCSL Z540-1.
MS2090A-xxxx-0098 Standard Calibration to ISO17025 and ANSI/NCSL Z540-1.
MS2090A-xxxx-0099 Premium Calibration to ISO17025 and ANSI/NCSL Z540-1.
a
Description
Includes calibration certificate, test report, and uncertainty data.
Includes calibration certificate.
Includes calibration certificate, test report, and uncertainty data.
a. xxxx is the frequency option number of the instrument.
MS2090A UG PN: 10580-00444 Rev. F 1-3
Page 16

1-3 Instrument Care and Preventive Maintenance General Information
1-3 Instrument Care and Preventive Maintenance
Instrument care and preventive maintenance consist of proper operation in a suitable environment, occasional
cleaning of the instrument, and inspecting and cleaning the RF connectors and all accessories before use.
Clean the instrument with a soft, lint-free cloth dampened with water or water and a mild cleaning solution.
Caution To avoid damaging the display or case, do not use solvents or abrasive cleaners.
Ventilation and Cooling
The Field Master Pro provides active cooling of the internal components to prevent damage from overheating.
The airflow vents on the edges and bottom of the instrument must be kept clear and unobstructed while the
instrument is powered on. When using the Field Master Pro on a desktop or bench, the tilt bail can be used or
the instrument can be placed flat on its back to facilitate increased airflow.
Caution
Do not operate or store the Field Master Pro in extreme environments. Refer to the instrument
Technical Data Sheet for the specified operating and storage conditions.
Connector Care
Clean the RF connectors and center pins with a cotton swab dampened with denatured alcohol. Visually
inspect the connectors. The fingers of the N(f) connectors and the pins of the N(m) connectors should be
unbroken and uniform in appearance. If you are unsure whether the connectors are undamaged, gauge the
connectors to confirm that the dimensions are correct. Visually inspect the test port cable(s). The test port
cable should be uniform in appearance and not stretched, kinked, dented, or broken.
To prevent damage to your instrument, do not use pliers or a plain wrench to tighten the Type-N connectors.
The recommended torque is 12 lbf · in to 15 lbf· in (1.36 N·m to 1.70 N · m). Inadequate torque settings can
affect measurement accuracy. Over-tightening connectors can damage the cable, the connector, the
instrument, or all of these items.
Visually inspect connectors for general wear, cleanliness, and for damage such as bent pins or connector rings.
Repair or replace damaged connectors immediately. Dirty connectors can limit the accuracy of your
measurements. Damaged connectors can harm the instrument. Connection of cables carrying an electrostatic
potential, excess power, or excess voltage can damage the connector, the instrument, or both.
1-4 PN: 10580-00444 Rev. F MS2090A UG
Page 17

General Information 1-3 Instrument Care and Preventive Maintenance
Connecting Procedure
1. Carefully align the connectors. The male connector center pin must slip concentrically into the contact
fingers of the female connector.
2. Align and push connectors straight together. Do not twist or screw them together. A slight resistance can
usually be felt as the center conductors mate.
3. To tighten, turn the connector nut, not the connector body. Major damage can occur to the center
conductor and to the outer conductor if the connector body is twisted.
4. If you use a torque wrench, initially tighten by hand so that approximately 1/8 turn or 45 degrees of
rotation remains for the final tightening with the torque wrench.
Relieve any side pressure on the connection (such as from long or heavy cables) in order to assure
consistent torque. Use an open-end wrench to keep the connector body from turning while tightening
with the torque wrench.
Do not over-torque the connector.
Disconnecting Procedure
1. If a wrench is needed, use an open-end wrench to keep the connector body from turning while loosening
with a second wrench.
2. Complete the disconnection by hand, turning only the connector nut.
3. Pull the connectors straight apart without twisting or bending.
MS2090A UG PN: 10580-00444 Rev. F 1-5
Page 18

1-4 Calibration and Verification General Information
ESD Caution
The Field Master Pro, like other high performance instruments, is susceptible to electrostatic discharge (ESD)
damage. Coaxial cables and antennas often build up a static charge, which (if allowed to discharge by
connecting directly to the instrument without discharging the static charge) may damage the Field Master Pro
input circuitry. Instrument operators must be aware of the potential for ESD damage and take all necessary
precautions.
Operators should exercise practices outlined within industry standards such as JEDEC-625 (EIA-625),
MIL-HDBK-263, and MIL-STD-1686, which pertain to ESD and ESDS devices, equipment, and practices.
Because these apply to the Field Master Pro, it is recommended that any static charges that may be present be
dissipated before connecting coaxial cables or antennas to the instrument. This may be as simple as
temporarily attaching a short or load device to the cable or antenna prior to attaching to the Field Master Pro.
It is important to remember that the operator may also carry a static charge that can cause damage. Following
the practices outlined in the above standards will ensure a safe environment for both personnel and
equipment.
1-4 Calibration and Verification
The Field Master Pro comes fully calibrated from the factory and there are no field-adjustable components.
Anritsu recommends annual calibration and performance verification by local Anritsu service centers.
Accredited calibration to ISO17025 and ANSI/NCSL Z540-1 are available and can include a calibration
certificate, test report, and uncertainty data. Contact Anritsu sales and service centers for more information.
1-5 Contacting Anritsu for Sales and Service
To contact Anritsu, visit the following URL and select the services in your region:
http://www.anritsu.com/contact-us
1-6 PN: 10580-00444 Rev. F MS2090A UG
Page 19

Chapter 2 — Instrument Overview
2-1 Introduction
This chapter provides an overview of the Anritsu MS2090A Field Master Pro. It describes the instrument
hardware features, touch screen display, general system settings and instrument configurations, and the
connector panels. For detailed information on the instrument’s user interface and functions, refer to the
relevant chapter for your measurement:
• Chapter 3, “Spectrum Analyzer Measurements”
• Chapter 4, “Real-Time Spectrum Analyzer Measurements”
• Chapter 5, “LTE Signal Analyzer”
• Chapter 6, “5G Measurements”
• Chapter 7, “IQ Capture/Streaming (Option 124/126 and 125/127)”
• Chapter 8, “EMF Meter Measurements (Option 445)”
MS2090A UG PN: 10580-00444 Rev. F 2-1
Page 20
2-2 Instrument Front Panel Instrument Overview
1
4
4
3
3
3
2
5
6
7
8
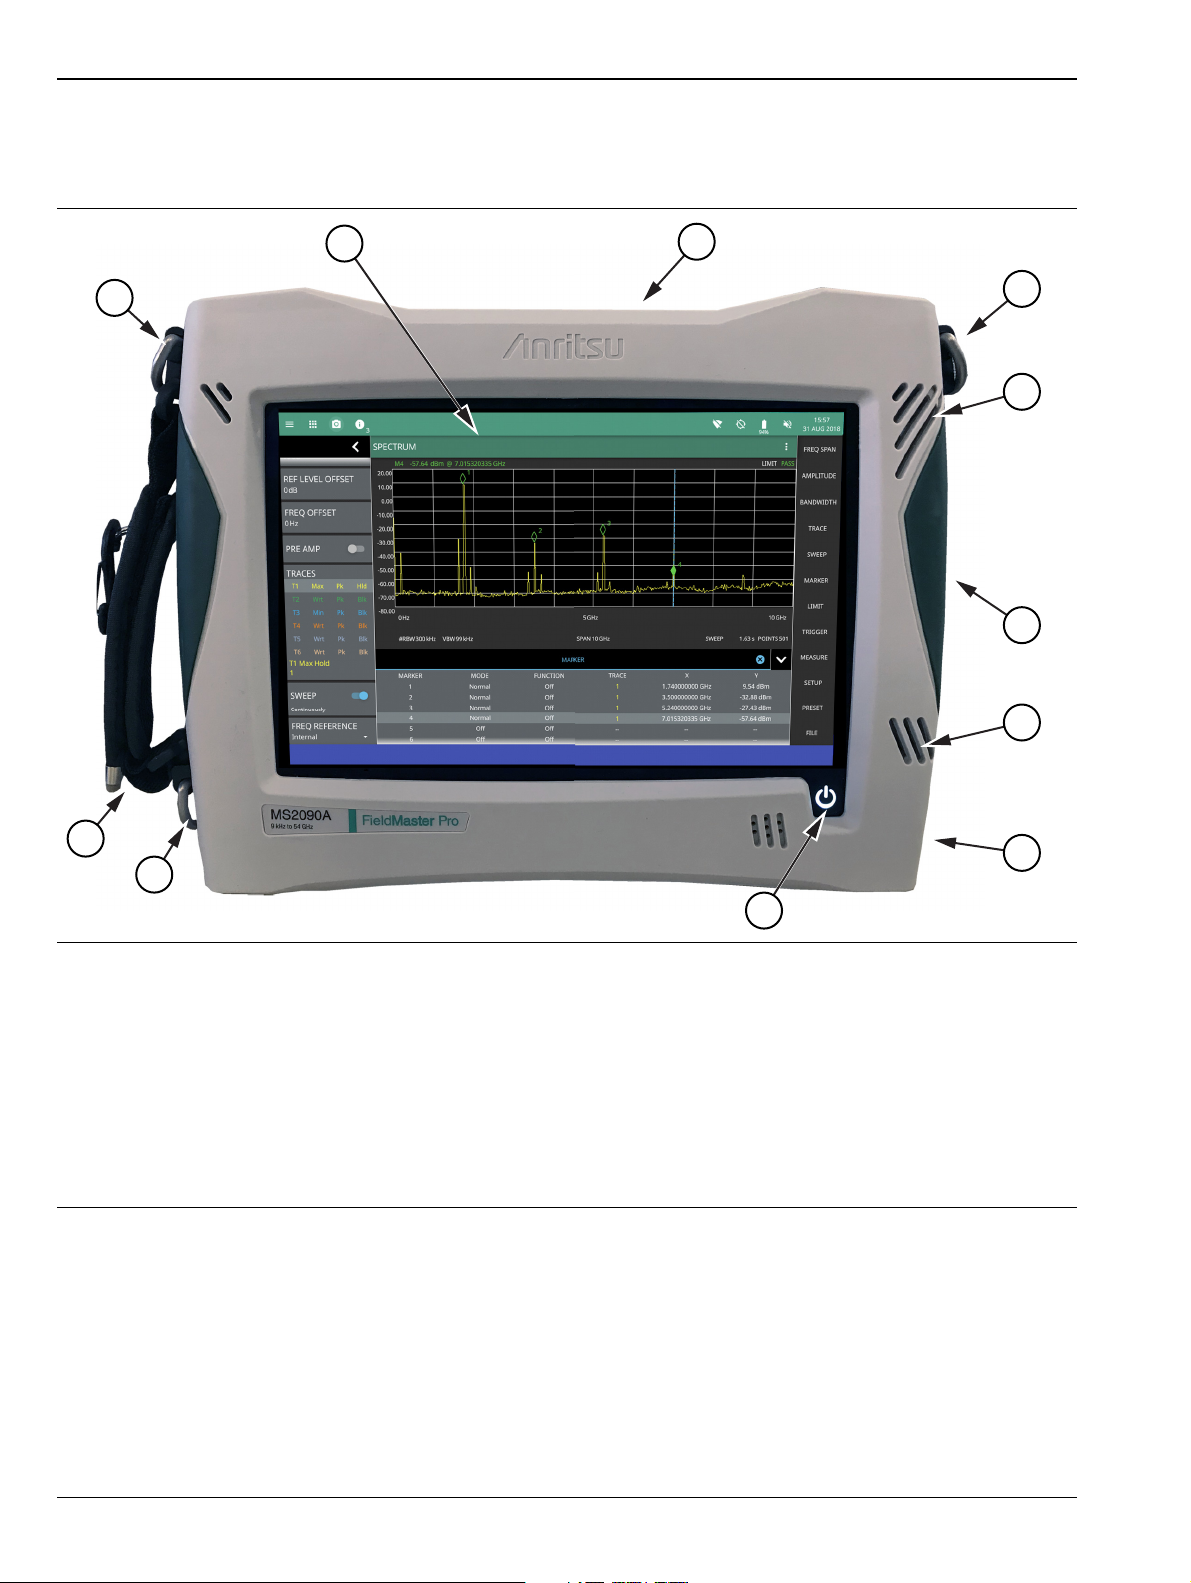
2-2 Instrument Front Panel
The Field Master Pro uses a touch screen for data input. The menus can vary depending on the current
measurement configuration, installed options, and selected instrument function.
1. Touch Screen Display
2. “Top Connector Panel” on page 2-3
3. Shoulder Strap D-Ring Mount
4. Fan Ventilation Ports
5. “Side Connector Panel” on page 2-5
6. Battery Cover (see “Replacing the Battery” on page 2-9)
7. Power LED/Button and Battery Charge LED (see Section 2-6 “Turning On the MS2090A Field Master Pro”)
8. Handle and Stylus
Figure 2-1. Front Panel Overview
2-2 PN: 10580-00444 Rev. F MS2090A UG
Page 21
Instrument Overview 2-3 Connector Panels
1
345678
2
2-3 Connector Panels
The MS2090A Field Master Pro uses two connector panels to provide for all physical IO. These panels use a
variety of connector types intended for their purpose.
RF Connectors
The main RF input connector can be Type N, Type K, or Type V, depending on the frequency option that is
installed. These are ruggedized 50 Ω connectors. Type N connectors are female and Type K and V are male.
Additional IO is provided with the SMA and SMB style connectors. The SMA connectors are 50 Ω female and
the SMB connectors are 50 Ω jack slip-on connectors.
To prevent damage to your instrument, do not use pliers or a plain wrench to tighten the connectors.
Caution
Top Connector Panel
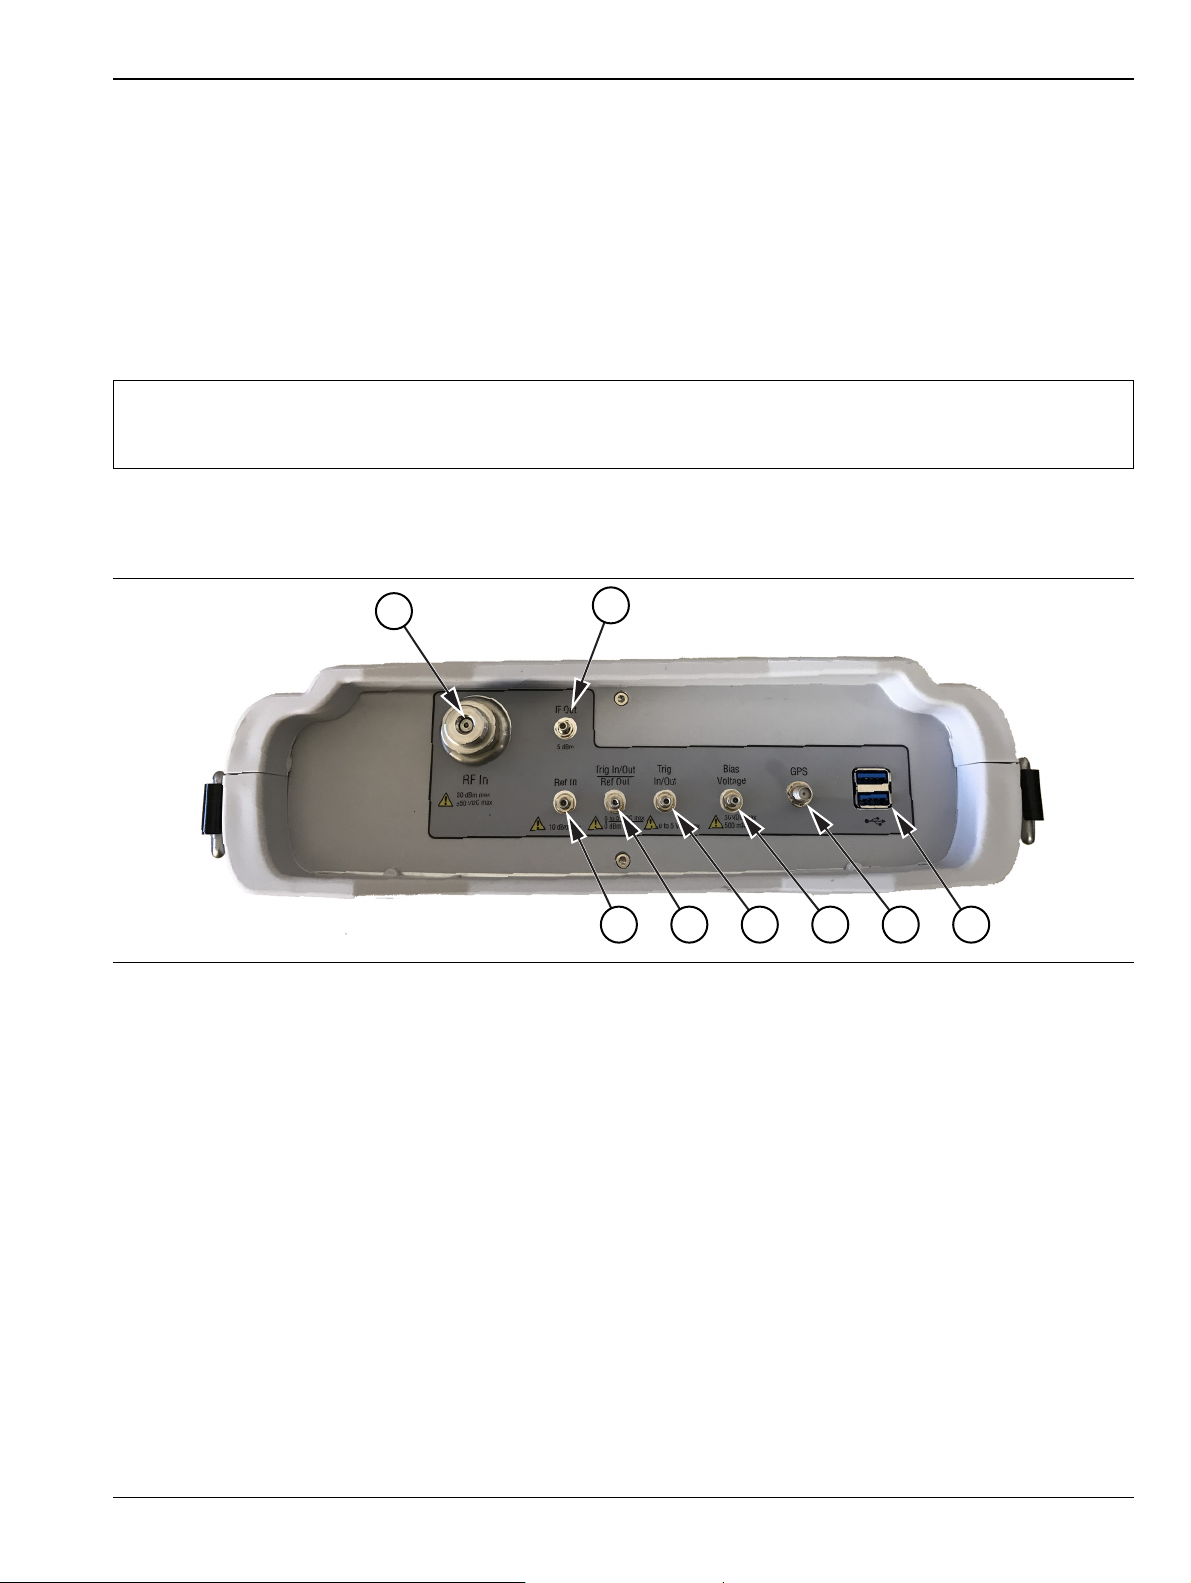
Figure 2-2 shows the top connector panel on the MS2090A.
Do not overtighten the connector. The recommended torque for Type K and V is 8 lbf·in (0.9 N·m or
90 N·cm). The recommended torque for Type N is 12 lbf·in (1.35 N·m or 135 N·cm).
Figure 2-2. Test Panel Connectors
1. RF In Port
This is a 50 Ω ruggedized connector of the following:
• Type N female with options 709, 714, and 720
• Type K male with options 26, 32, and 43
• Type V male with option 754
To prevent damage to your instrument, do not try to mate incorrect connector types or use pliers or a plain
wrench to tighten the connector. Do not overtighten the connector. The recommended torque for Type K and V
is 8 lbf·in (0.9 N·m or 90 N·cm). The recommended torque for Type N is 12 lbf·in (1.35 N·m or 135 N·cm).
2. IF Out
This 50 Ω SMB jack connector provides internal IF output. The nominal frequency range is 325 MHz with
FFT capture bandwidth ≤ 32 MHz and 300 MHz with FFT capture bandwidth = 100 MHz. The nominal
RF output level is –4 dBm with a 10 MHz, –20 dBm input, and with 0 dB input attenuation and preamp off.
The spectrum can be inverted in certain RF input bands. Refer to “Zero Span IF Output (Option 89)”
on page 3-10. This is a slip-on connector that should seat with a click.
MS2090A UG PN: 10580-00444 Rev. F 2-3
Page 22

2-3 Connector Panels Instrument Overview
3. USB Interface – Type A
The Field Master Pro has three Type A USB connectors that accept USB storage devices for saving
measurements, setup data, and screen images. Two connectors are located on the top panel and one is located
on the side panel. To ensure the device or it’s data does not become corrupted, press the eject icon to eject
(unmount) the USB device before it is unplugged from the USB port (see Section 2-8 “Title Bar” on page 2-19).
4. GPS Antenna Connector
The GPS antenna connection on the Field Master Pro is type SMA female. This connector also provides
5.0/3.3 VDC for an active GPS antenna. To prevent damage to your instrument, do not use pliers or a wrench to
tighten the connector.
5. Bias Voltage
The power supply is set up to provide 1 V to 34 V with a resolution of 0.1 V. The maximum current is 1 A, but
with at total maximum power of 15 W.
6. Trigger In/Out
A TTL signal that is applied to the external trigger 50 Ω SMB jack input connector causes a single sweep to
occur. In spectrum analysis, triggering is generally used in zero span, and triggering occurs on the rising edge
of the signal. After the sweep is complete, the resultant trace is displayed until the next trigger signal arrives.
This is a slip-on connector that should seat with a click.
7. Trigger In/Out / Ref Out (10 MHz)
This port can be configured as a trigger in/out as above or as a reference output. The reference output port is a
50 Ω SMB male connector that provides 10 MHz at approximately –7 dBm to 0 dBm. This is a slip-on connector
that should seat with a click.
8. Ref In
The external reference input port is a 50 Ω SMB jack connector that provides for input of an external frequency
reference. Refer to your Technical Data Sheet for valid frequencies. This is a slip-on connector that should seat
with a click. The instrument automatically selects the frequency reference in the following order of priority:
external, GPS, then the internal time base.
2-4 PN: 10580-00444 Rev. F MS2090A UG
Page 23
Instrument Overview 2-3 Connector Panels
1
2
3
4
5
6
7
Data Out
Side Connector Panel
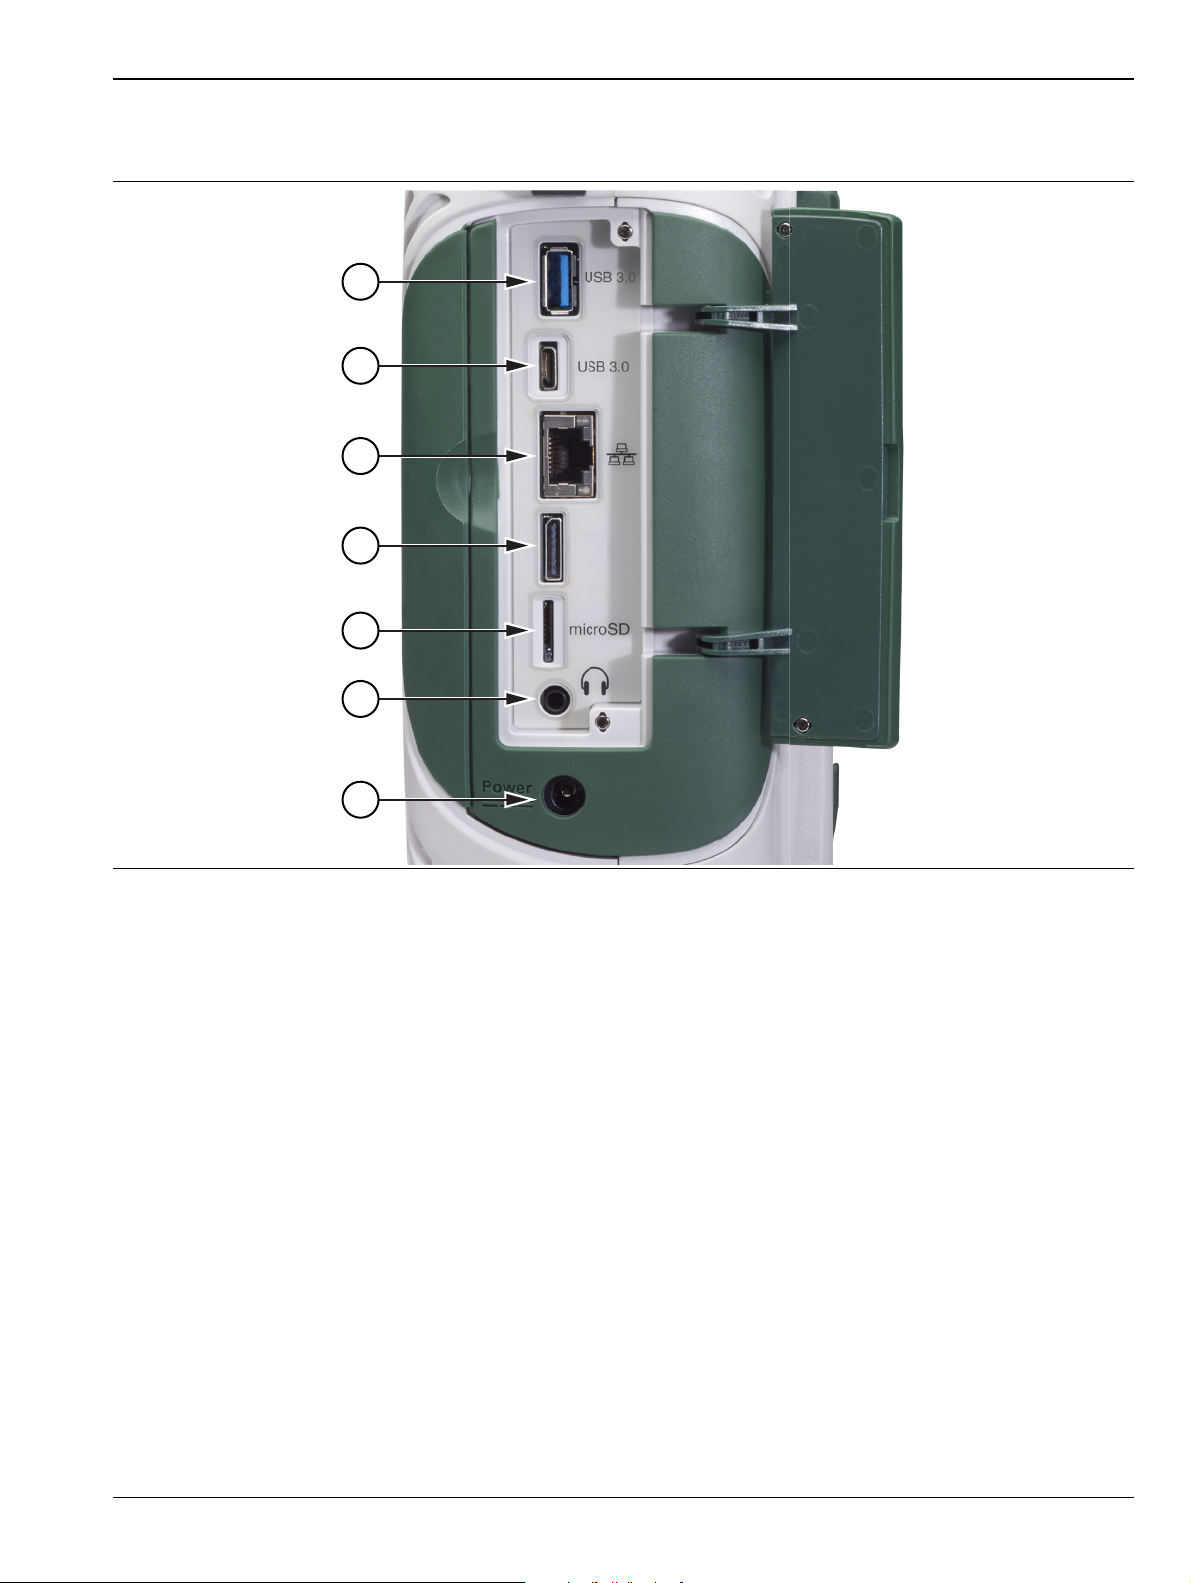
Figure 2-3 shows the MS2090A side connector panel.
Figure 2-3. Side Panel Connectors
1. USB Interface – Type A
The Field Master Pro has three Type A USB connectors that accept USB storage devices for saving
measurements, setup data, and screen images. Two connectors are located on the top panel and one more is
located on the side panel. To ensure the device or it’s data does not become corrupted, press the eject icon to
eject (unmount) the USB device before it is unplugged from the USB port (see Section 2-8 “Title Bar”
on page 2-19).
2. USB Interface – Type C
The USB Type-C interface is not yet enabled. The interface will be used to connect the Field Master Pro
directly to a PC.
3. LAN Connection
The RJ-45 connector is used to connect the Field Master Pro to a local area network or directly to a PC with an
Ethernet crossover cable. See “Ethernet Connection” on page 2-26 for more details.
4. Data Out Port
The Data Out port is used for IQ Streaming. Refer to Chapter 7, “IQ Capture/Streaming (Option 124/126 and
125/127)”. This is a multi-purpose, hot pluggable input/output (I/O) interface. These connectors are designed to
fit all popular mechanical architectures and support Generation 1 PCIe data rates at 2.5 Gbps through
Generation 2 data rates at 5.0 Gbps.
MS2090A UG PN: 10580-00444 Rev. F 2-5
Page 24
2-3 Connector Panels Instrument Overview
5. MicroSD
The Micro Secure Digital slot is a small expansion slot located on the side panel. The slot accepts industry
standard MicroSD storage cards and can be used for storing measurements, setup data, and screen images
similar to USB storage devices.
Note
The MicroSD slot is not currently active. Functionality will be added via an upcoming software
update.
6. Headset Jack
Note The headset jack is not yet enabled. Functionality will be added via an upcoming software update.
The 3-wire headset jack provides audio output from the built-in sounds generated by the instrument. The jack
accepts a 3.5 mm 3-wire miniature phone plug such as those commonly used with cellular telephones.
7. External Power
This is a 2.5 mm by 5.5 mm barrel connector, 15 VDC, 5 A, center positive. The external power connector is
used to power the unit and for battery charging. An orange blinking LED power button indicates that the
instrument battery is being charged by the external charging unit. The indicator is a steady green when the
battery is fully charged.
When using the AC-DC Adapter, always use a three-wire power cable that is connected to a
Warning
three-wire power line outlet. If power is supplied without grounding the equipment in this manner, the
user is at risk of receiving a severe or fatal electric shock.
Refer to “Turning On the MS2090A Field Master Pro” on page 2-10.
2-6 PN: 10580-00444 Rev. F MS2090A UG
Page 25

Instrument Overview 2-4 Tilt Bail Stand
2-4 Tilt Bail Stand
The attached tilt bail can be used for desktop operation. The tilt bail provides a backward tilt for improved
stability and air flow. To deploy the tilt bail, pull the bottom of the tilt bail away from the back of the
instrument. To store the tilt bail, push the bottom of the bail towards the back of the instrument and snap the
bail into the clips on the back of the instrument.
Figure 2-4. Tilt Bail Stand
MS2090A UG PN: 10580-00444 Rev. F 2-7
Page 26

2-5 Battery Information Instrument Overview
2-5 Battery Information
The batteries that are supplied with the Field Master Pro may need charging before use. They can be charged
using either the provided AC-DC adapter or the DC adapter. Refer to “Battery Status” for a description of the
battery status and information panel. The batteries can be charged in the instrument or removed for charging
in an optional battery charger. The batteries are installed at the factory and can be replaced by the user. Refer
to the next section for information on removing the batteries. Battery status is shown in “Battery Information”
on page 2-41.
Use only Anritsu-approved batteries, adapters, and chargers with this instrument. The batteries will
charge at a faster rate when the instrument is turned off. To prolong the useful battery life, the
Note
Caution
Note Anritsu Company recommends removing the battery for long-term storage of the instrument.
internal charging circuit monitors the battery temperature. Normal charging occurs when the battery
temperature is between 0 °C and 45 °C. Charging is paused if the internal battery temperature is
outside this range.
When using the automotive cigarette lighter adapter, always verify that the supply is rated for a
minimum of 75 Watts @ 15 VDC, and that the socket is clear of any dirt or debris. If the adapter plug
becomes hot to the touch during operation, discontinue use immediately.
2-8 PN: 10580-00444 Rev. F MS2090A UG
Page 27
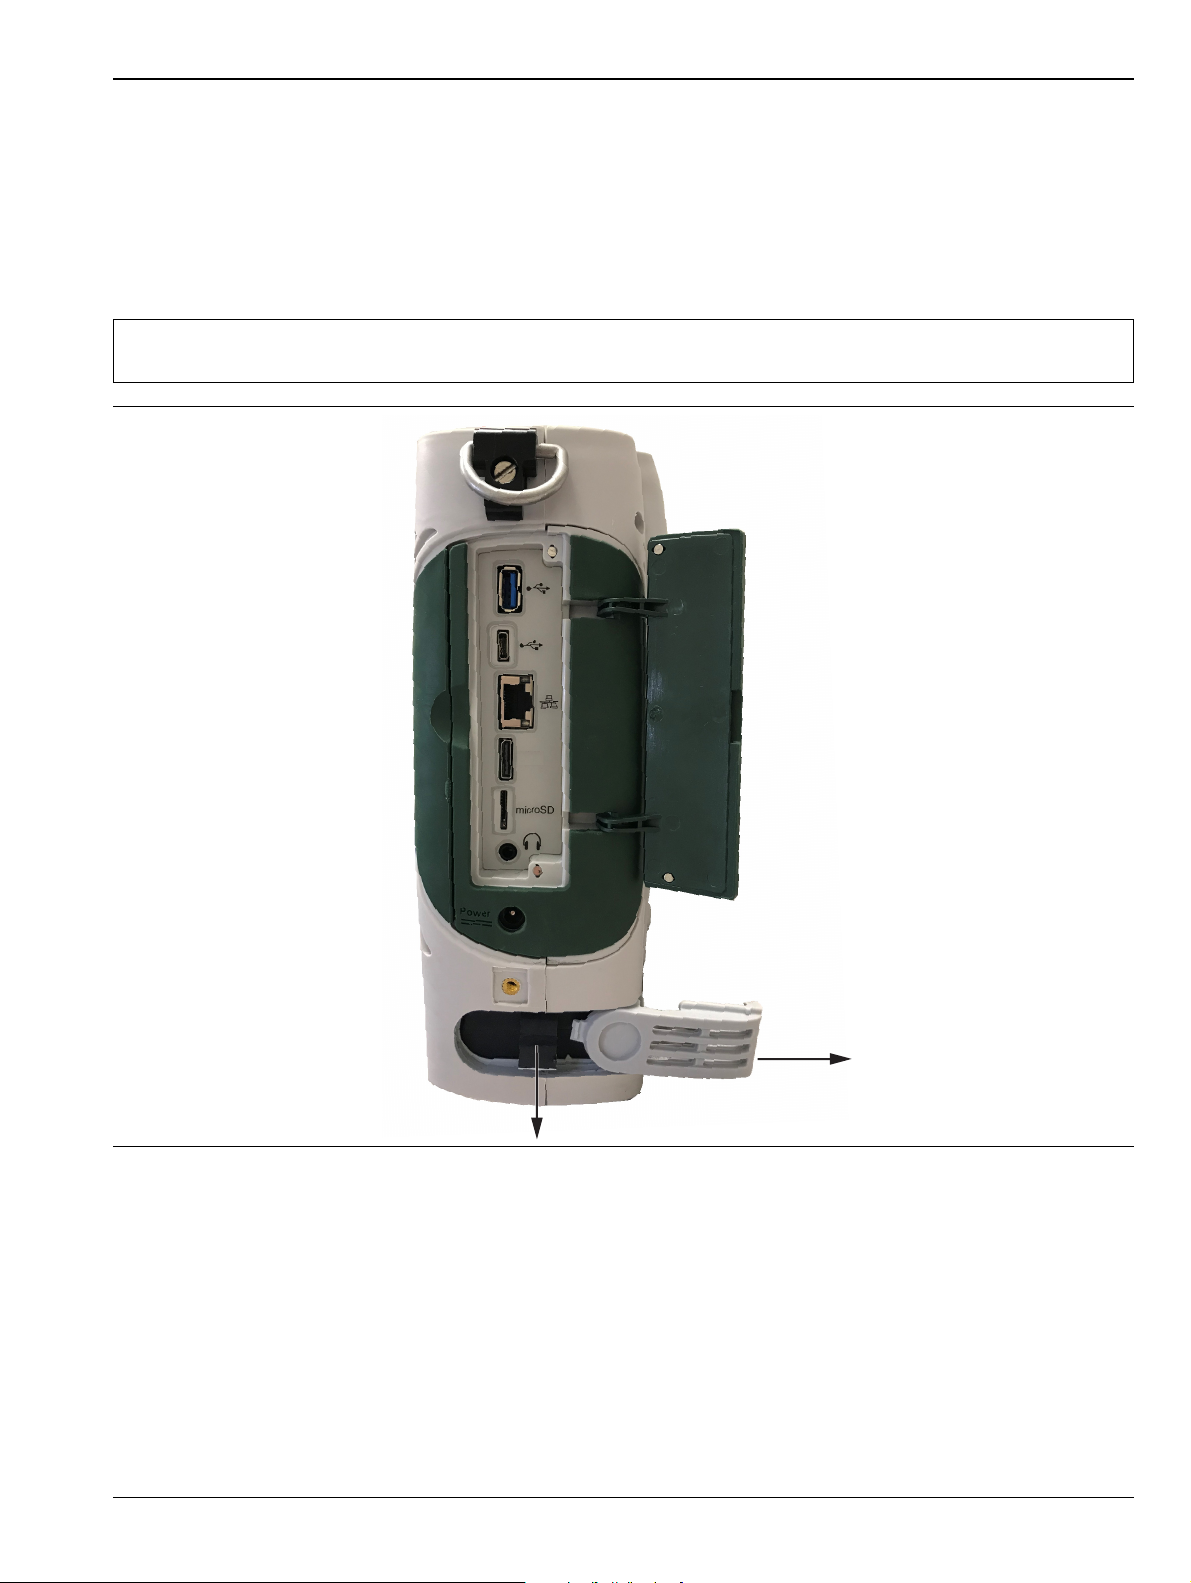
Instrument Overview 2-5 Battery Information
Data Out
Replacing the Battery
The battery can be replaced without the use of tools. The battery compartment door is located on the lower
right side of the instrument (when you are facing the measurement display). To remove the battery:
1. Push in and slide the battery door tab to disengage it.
2. Remove the battery door.
3. Pull straight out on the lanyard to remove the battery pack from the instrument.
Note
When inserting the battery, the battery contacts should face up and slide in first. If the battery door
does not close tightly, the battery may be inserted incorrectly.
Figure 2-5. Battery Removal
MS2090A UG PN: 10580-00444 Rev. F 2-9
Page 28

2-6 Turning On the MS2090A Field Master Pro Instrument Overview
2-6 Turning On the MS2090A Field Master Pro
The Anritsu MS2090A Field Master Pro is capable of approximately two hours of continuous operation from a
fully charged, field-replaceable battery (refer to “Battery Information” on page 2-8). The instrument can also be
operated from a 15 VDC source (which will simultaneously charge the battery). This can be achieved with
either the Anritsu AC-DC adapter or the automotive power adapter, which can be purchased as an optional
accessory. Refer to the instrument Technical Data Sheet for more options and accessories.
When using the Automotive Power Adapter, always verify that the supply is rated for a minimum of
Caution
To turn on the Field Master Pro, briefly press the power button on the lower right of the touchscreen (see
Figure 2-1 on page 2-2).
The Field Master Pro takes approximately 60 seconds to complete power-up and to load the instrument
software. At the completion of this process, the instrument is ready for use.
75 Watts @ 15 VDC, and that the socket is clear of any dirt or debris. If the adapter plug becomes
hot to the touch during operation, discontinue use immediately.
Note
Keep the fan inlet and exhaust ports clear of obstructions at all times for proper ventilation and
cooling of the instrument.
Power/Charge LED Indicators
The power/charge LED is integrated with the power button. The LED has the following indicators:
• Solid white when the instrument is on or booting up.
• Slowly blinks orange when the instrument is off and connected to an external power source, and the
battery is charging.
• Solid green when the instrument is off and connected to an external power source, and the battery is
fully charged.
• Solid red when the instrument is off and connected to an external power source, and the battery is NOT
installed or has a fault.
Shutting Down and Restarting
To shut down or restart the instrument, briefly press the power button (a shutdown dialog will be displayed),
then select RESTART INSTRUMENT or POWER OFF. The current setup is saved when the instrument is
shut down or is restarted. Once the instrument shuts down, it will either power off completely (if running on
batteries) or it will go into a low power state (if running on external power).
2-10 PN: 10580-00444 Rev. F MS2090A UG
Page 29

Instrument Overview 2-7 GUI Overview
1
3 4
2
5
2-7 GUI Overview
The MS2090A Field Master Pro software controls all instrument functions. The software runs locally on the
instrument and primary operation is through the touch screen display. The figure below identifies the main
display areas, which are each described in more detail later in this chapter.
1. The title bar provides quick access to the system settings and informational dialogs.
2. The status and trace panel is used to show common settings and controls, and to provide trace and cursor
information. The information displayed on this panel depends on the current measurement and view settings.
Refer to the appropriate chapter in this guide for information about this panel.
3. Menus are used to configure measurement settings such as frequency, amplitude, and bandwidth, and to
enable measurement modes and views such as Spectrogram view, OBW, ACP, and SEM measurements.
4. The main menu provides access to setting menus and other instrument controls.
5. The upper area typically displays graphical data such as spectrum trace and spectrogram plots. The lower area
typically displays tabular measurement data such as marker data, demodulation results, or other measurement
data depending on the selected measurement.
Figure 2-6. GUI Overview (sample display elements)
MS2090A UG PN: 10580-00444 Rev. F 2-11
Page 30

2-7 GUI Overview Instrument Overview
Operating the Touch Screen
Field Master Pro uses common touch gestures to achieve a variety of operations. These include interactions on
hot areas by pressing, double pressing (or tapping), dragging, and pinching.
Single Press: Most controls require a single press or
tap. Touch the screen briefly and then release.
Double Press: Some controls require a double press or
tap. This action is similar to a double mouse click. If a
second press is not detected in a certain time period, the
action is dismissed or considered a single press.
Figure 2-7. Touch Screen Gestures
Press and Drag: Some items can be dragged to a new
location. This action is accomplished by pressing and
holding the item lightly while dragging it to a new
location, then releasing. You can drag items such as
markers, limit line nodes, and the center frequency by
dragging the trace to the left or right.
Pinch: Some items can be reduced or expanded. This
action is accomplished by simultaneously pressing the
item with two fingers and holding the item lightly when
dragging the fingers in closer together or out farther
apart, and then releasing. You can pinch items in or out,
such as the frequency span by touching and holding the
trace in two positions, and then dragging your fingers
closer together to narrow the span or dragging your
fingers farther apart to widen the span.
2-12 PN: 10580-00444 Rev. F MS2090A UG
Page 31
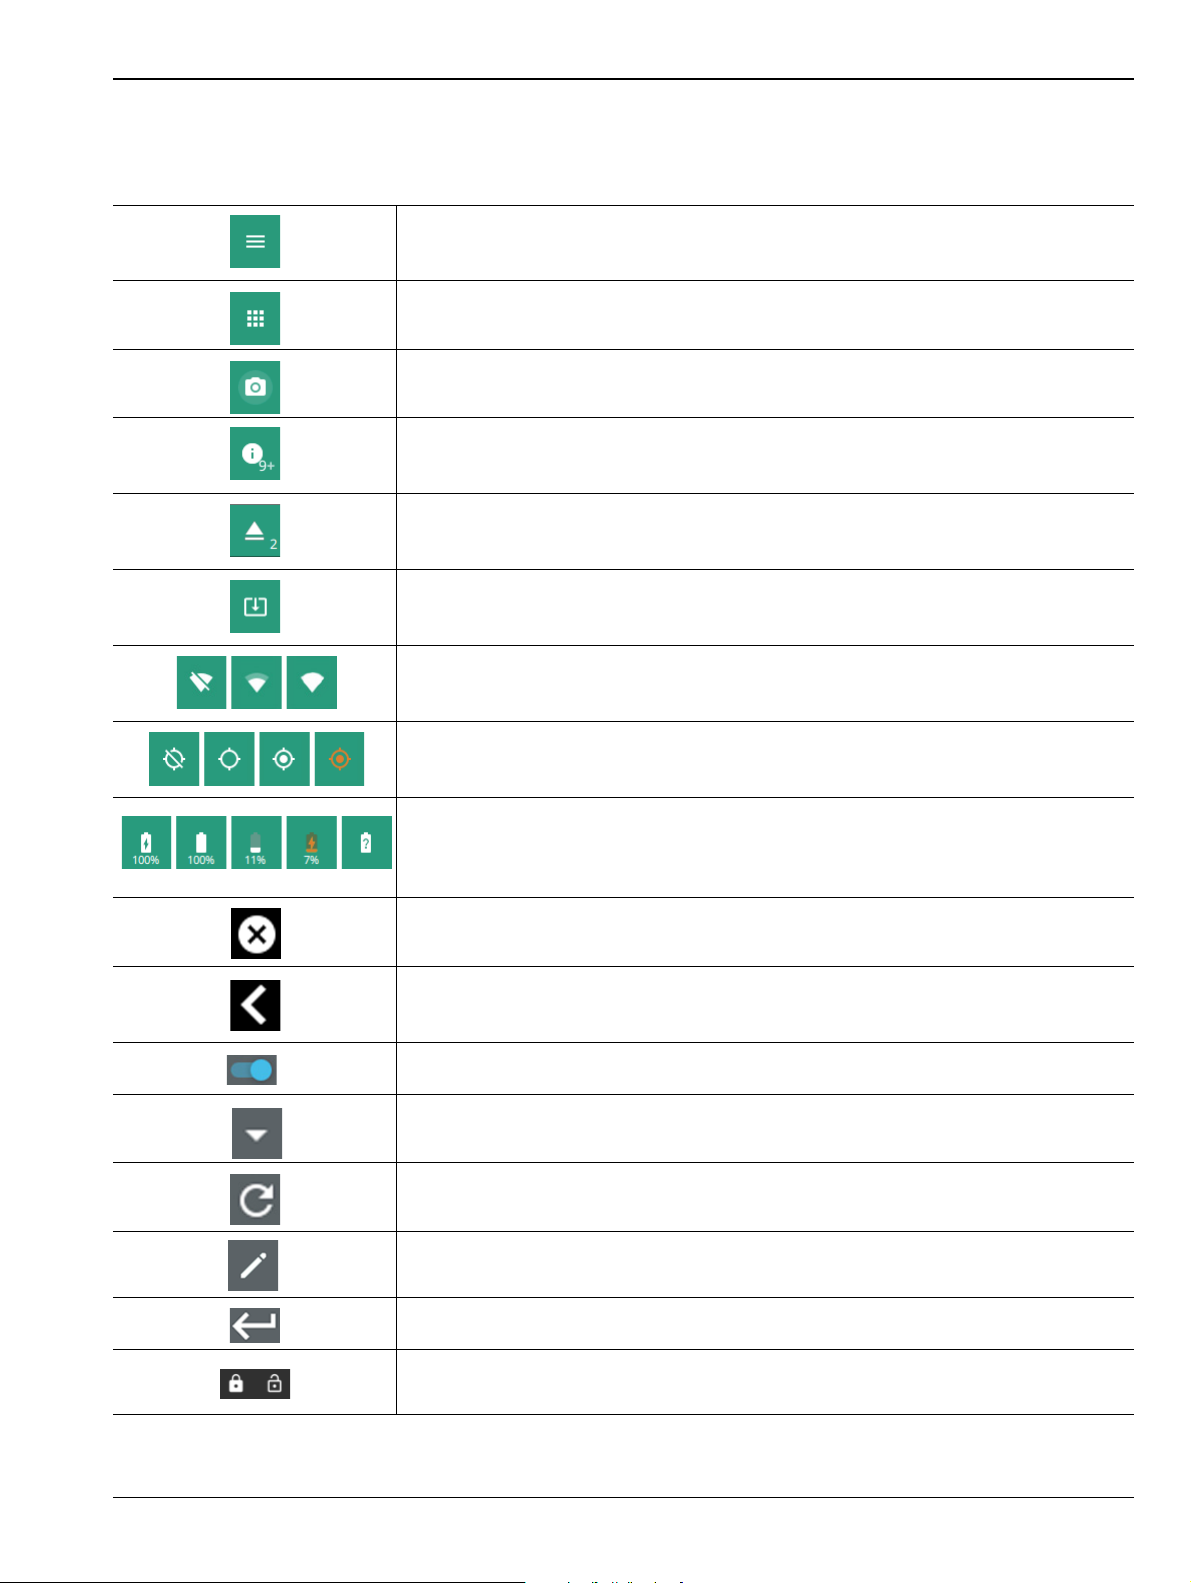
Instrument Overview 2-7 GUI Overview
Common GUI Controls
In addition to the touch gestures described in the previous section, the following lists the most common
controls that you will encounter when working with the Field Master Pro.
The 3-line icon provides quick access to system information, settings, file
management, and built-in diagnostic tools. Refer to Section2-10“System Menu”
on page 2-21.
The 9-dot icon provides access for selecting the analyzers. Refer to
Section 2-9 “Selecting the Analyzer” on page 2-20.
The camera icon will capture a screen image and save it to a file. Refer to
“Screenshot Setup” on page 2-30.
The notification icon provides access to informational and error messages. If
displayed, the number indicates the number of notifications. Refer to “Notifications”
on page 2-22 and Appendix A, “Instrument Messages and Troubleshooting”.
The USB eject icon is displayed when the instrument detects one or more USB
devices. Pressing this icon ejects the USB device, or presents a dialog to select
which USB device to eject when more than one device is detected.
The software update icon is displayed when the instrument detects a valid software
package. Pressing this icon opens an updated dialog to select the software to
install. Refer to Section 2-17 “Software Update” on page 2-44.
The wireless networking icon shows connection status (no connection, weak
connection, strong connection) and relative signal strength. Pressing the icon
opens the Wi-Fi settings menu. Refer to “Wi-Fi Settings” on page 2-28.
The GPS icon shows connection status (no connection, no fix, good fix, using last
good fix). Pressing the icon opens the GPS/GNSS settings menu. Refer to
“GPS/GNSS Settings (Option 31)” on page 2-29.
The battery icon shows the current battery charge state and indicates that the
battery is charging with a lightning bolt. A question mark (?) indicates that the
battery is not installed or has a malfunction. Touching the icon opens the battery
information dialog. Refer to “Battery Information” on page 2-41.
The close icon is used to close menus and other dialogs.
The chevron will expand and collapse the status and table displays. A similar
chevron on the virtual keyboard may be for capital letters or to scroll through key
sets.
Toggle icon will enable and disable the feature. When highlighted in blue, the item
is enabled.
The drop-down icon exposes a list of items from which to choose.
The refresh icon will restart a process, such as a sweep or averaging count.
The edit icon allows editing of a feature or label.
The enter icon accepts an entry. A similar icon is found on menu buttons to indicate
an additional menu.
Gesture lock and unlock icons indicate when the drag and pinch gestures have
been toggled on or off. Refer to “GESTURES Menu” on page 3-14.
Figure 2-8. Common GUI Controls
MS2090A UG PN: 10580-00444 Rev. F 2-13
Page 32

2-7 GUI Overview Instrument Overview
Data Entry
User input can be in the form of numeric values for instrument or measurement settings, selected values from
a preset list, or alphanumeric text when entering file names, for example. To view or change a parameter
value, access the appropriate menu or control, then enter data using the data entry control or attached
physical keyboard. Some items can be accessed directly on the annotated display by touching their value.
Invalid Entries
When setting parameters or entering other types of data, if an entry is out of range or is otherwise invalid,
Field Master Pro will shade the background display and may provide a message indicating a valid range. In
this case, clear or cancel the entry and enter a valid value or change the units by using either the drop-down
selection next to the data entry window, or with the unit terminators to the left of the keypad.
Numeric Values
To modify a numeric parameter setting that is displayed on a menu or annotated field, press the item to make
it active and to display the numeric keypad data entry control. Use the touch screen to enter or change the
value.
The keypad typically provides controls to:
• Enter new values directly, such as frequency entries in Hz, kHz, MHz, or
GHz. There are two places on the keypad to enter unit terminators when
applicable, on left side pop-out that occurs as frequency keypad entries are
selected, or on the top right corner drop-down of the entry field.
• Drag a parameter value within its settable range using a sliding control.
• Increment the parameter value up or down. At each end of the slider are plus
(+) and minus (–) controls that increment the parameter value. Most
parameters have a fixed increment, such as bandwidth that follows a 1:3:10
sequence and span that follows a 1:2:5:10 sequence. In the case of
frequency, you can set a custom frequency step increment value. Once the
entry is complete, press the desired unit or press ACCEPT to complete the
entry.
• Set the parameter to the maximum or minimum possible value.
• CLEAR the entire entry.
• Left arrow to backspace and delete the entry
• CANCEL to terminate any entries made for that particular setting. Note that
pressing the "X" to close the keypad is the same as pressing cancel.
Pressing CANCEL will restore settings back to the state they were in before
the keypad opened, even if changes from the +/- controls are already
reflected in the data display.
• ACCEPT to operate with the settings displayed on the keypad.
Figure 2-9. Touchscreen Keypads
A physical keyboard connected via USB can also be used to enter values in a similar manner and the keyboard
ENTER key used to accept the new value.
2-14 PN: 10580-00444 Rev. F MS2090A UG
Page 33

Instrument Overview 2-7 GUI Overview
Selection Lists
Some parameters and instrument functions are selectable from a list. These list boxes display the available
selections and value limits as applicable. Use the touch screen to scroll through the list and select the desired
entry.
Figure 2-10. Touch Screen Keypads
To cancel the selection, touch somewhere else on the display or close the menu.
MS2090A UG PN: 10580-00444 Rev. F 2-15
Page 34

2-7 GUI Overview Instrument Overview
1
2
Scroll Indication
In some cases, menus, status panels, or other lists contain more information than can be displayed in the
available area. In these cases, the top or bottom of the panel will have a fade-to-white appearance as shown
below. You can scroll the control to move it up or down and expose the hidden information.
1. The fade-to-white at the bottom of the status panel and marker table here indicates that there is more
information below the display area. The panel can be scrolled by dragging it upward to expose more information.
2. The fade-to-white at the top of the menu here indicates that there is more information above the display area.
The menu can be scrolled by dragging it downward to expose the information.
Figure 2-11. Scroll Indication
Note
If the display is set to another color theme, the fade effect remains the same but the color may fade
to a dark shade.
2-16 PN: 10580-00444 Rev. F MS2090A UG
Page 35

Instrument Overview 2-7 GUI Overview
Text Entry and EZ Keyboard
When an instrument function requires you to enter text, such as entering an Ethernet hostname, a touch
screen alphabetic keyboard is displayed. See Figure 2-12. Press the “?123” key to switch to the digits and
symbols keyboard. Use the left arrow key (backspace) to delete the character to the left of the insertion point.
The insertion point can be moved to a touched position in the data entry field. You can enable caps lock by
double tapping the shift key.
Figure 2-12. Touch Screen Keyboard
The EZ key switches to a configurable EZ keyboard, illustrated below.
Figure 2-13. Touch Screen EZ Keyboard
Use the EZ keyboard to enter frequently used text strings with a single screen tap. The EZ keyboard is initially
populated with default values. Each key enters the entire string as shown on the key. For convenience, you can
set an automatic Separator character to be placed between each EZ key string.
MS2090A UG PN: 10580-00444 Rev. F 2-17
Page 36

2-7 GUI Overview Instrument Overview
To change a key’s value:
1. Press the pencil (edit) key. The EZ keys will become highlighted.
Figure 2-14. Touch Screen EZ Keyboard
2. Press the key to be edited. This will display the standard keyboard for entering a new EZ key value.
Figure 2-15. Touch Screen EZ Keyboard
3. Enter the new value, then press ACCEPT to assign the new value to the EZ key, or press CANCEL.
2-18 PN: 10580-00444 Rev. F MS2090A UG
Page 37

Instrument Overview 2-8 Title Bar
1 2 3 4 5 6 7 8 9 10
2-8 Title Bar
The title bar is located at the top of the interface screen. It displays icons that provide access to information
and user actions as described below. All of the icons are active and will open the appropriate menu or item
when touched.
1. Press the 3-line icon to display the System Menu. The instrument model with frequency option and its serial
number are also displayed.
2. The 9-dots icon is used for Selecting the Analyzer.
3. Press the camera icon to capture a screen shot of the current display. The image file is saved in PNG format
with the following naming scheme: screenshot_yymmdd_hhmmss.png (year, month, day, hour, minute, second).
Using the Screenshot Setup, you can set the screen capture region, color theme, annotations, and destination
directory.
4. Notifications are generated when an error is detected or an activity such as a screen shot has taken place. The
number of unread notifications appears next to the icon. Press the icon to display the Notifications list.
5. Displayed when a USB device is attached. To ensure the device or it’s data does not become corrupted, press
this icon to eject (unmount) the USB device before it is unplugged from the USB port. A similar icon can be
accessed via Section 2-12 “File Management” on page 2-36.
6. Displayed when a USB device contains an installable software package. Pressing the icon launches the
“Software Update” on page 2-44.
7. Press the wireless networking icon to display the Wi-Fi Settings.
8. Press the GPS icon to view the GPS/GNSS Settings (Option 31).
9. Press the battery icon to open the Battery Information and view battery charge state and capacity.
10.The right side of the instrument title bar displays the system date and time. Pressing this field opens the Date
Time Settings.
Figure 2-16. Title Bar
MS2090A UG PN: 10580-00444 Rev. F 2-19
Page 38
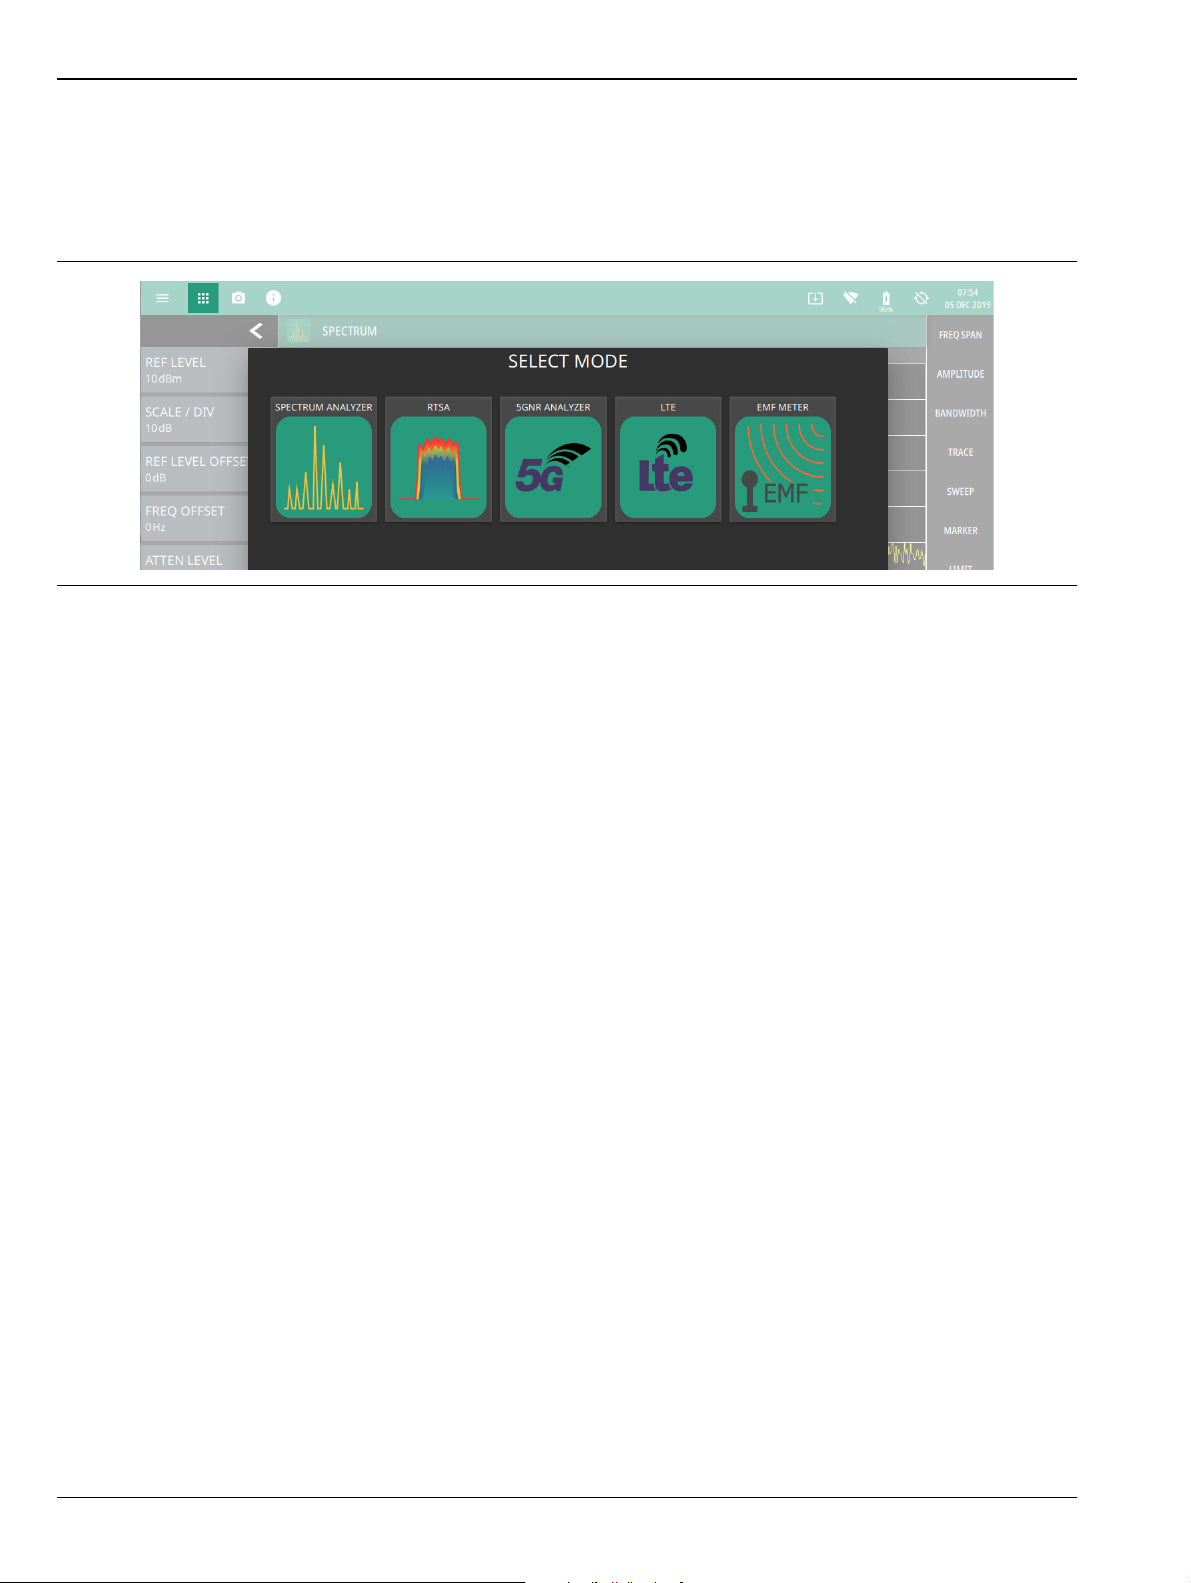
2-9 Selecting the Analyzer Instrument Overview
2-9 Selecting the Analyzer
The instrument analyzers are selected from the 9-dot icon. To select an analyzer, press the 9-dot icon in the
title bar to display the available analyzers, illustrated in Figure 2-17. Simply touch the desired icon to load the
new analyzer. The analyzers available for selection depend on the options that are installed and activated on
your instrument. Some measurements and views are accessed via other measurement setup menus.
Figure 2-17. Example Analyzers
2-20 PN: 10580-00444 Rev. F MS2090A UG
Page 39

Instrument Overview 2-10 System Menu
2-10 System Menu
-
Figure 2-18. System Menu
System Information
The System Information panel shows all information about the instrument hardware, software, and
connectivity. From here, you can also toggle software update checking when connected to the Internet and
start a software update when one is available. If web updates are toggled on, the instrument will automatically
check for updates once every 24 hours or when the user presses the "CHECK" button.
The System menu identifies the instrument model and serial number.
SYSTEM INFORMATION: Opens the System Information panel showing instrument,
software, and network connection details.
SETTINGS: Opens the “Settings Menu” on page 2-23, providing access to all system
level settings and controls.
FILES: Opens “File Management” on page 2-36. Note that the file management menus
are different from the right-side FILE menu. Use file management to organize, copy, and
rename files. Use the right side FILE menu to save and recall measurement data,
instrument setup files, or to save a screenshot.
DIAGNOSTICS: Opens “Diagnostics” on page 2-41.
TOOLS: Opens “Tools Menu” on page 2-43.
SYSTEM POWER: Opens a dialog to RESTART or POWER OFF the instrument.
Figure 2-19. System Information
MS2090A UG PN: 10580-00444 Rev. F 2-21
Page 40

2-10 System Menu Instrument Overview
Notifications
The notification area is where all dynamic notifications are presented. These notifications are generally
information messages to the user and not hardware failure messages. Refer to “Self Test” on page 2-42 and
Appendix A, “Instrument Messages and Troubleshooting” for more diagnostic information.
Figure 2-20. Notifications
2-22 PN: 10580-00444 Rev. F MS2090A UG
Page 41

Instrument Overview 2-11 Settings Menu
2-11 Settings Menu
The system settings menu provides access to all instrument system-level settings such as network, GPS/GNSS,
date and time, and display.
-
DISPLAY: Opens the Display Settings.
SOUND: Opens the Sound Settings.
ETHERNET: Opens the Network Settings.
WIFI: Opens the Wi-Fi Settings.
GPS: Opens the GPS/GNSS Settings (Option 31).
SCREENSHOT: Opens the Screenshot Setup.
DATE TIME: Opens the Date Time Settings.
PORT SETUP: Opens Port Setup.
OPTIONS: Opens the Options Settings.
RESET: Opens the Reset Settings.
Figure 2-21. Settings Menu
Display Settings
The DISPLAY settings allow you to adjust the display brightness and to set the amount of idle time before the
screen automatically dims to conserve battery life. The DIM DISPLAY AFTER button provides up to 15 minute
idle time settings. Or you can select Never so the display will remain illuminated for as long as the instrument
remains powered on.
You can also set the display to a Default or Light color scheme, the latter of which may be more suitable for
viewing in bright ambient conditions.
Figure 2-22. Display Settings
MS2090A UG PN: 10580-00444 Rev. F 2-23
Page 42
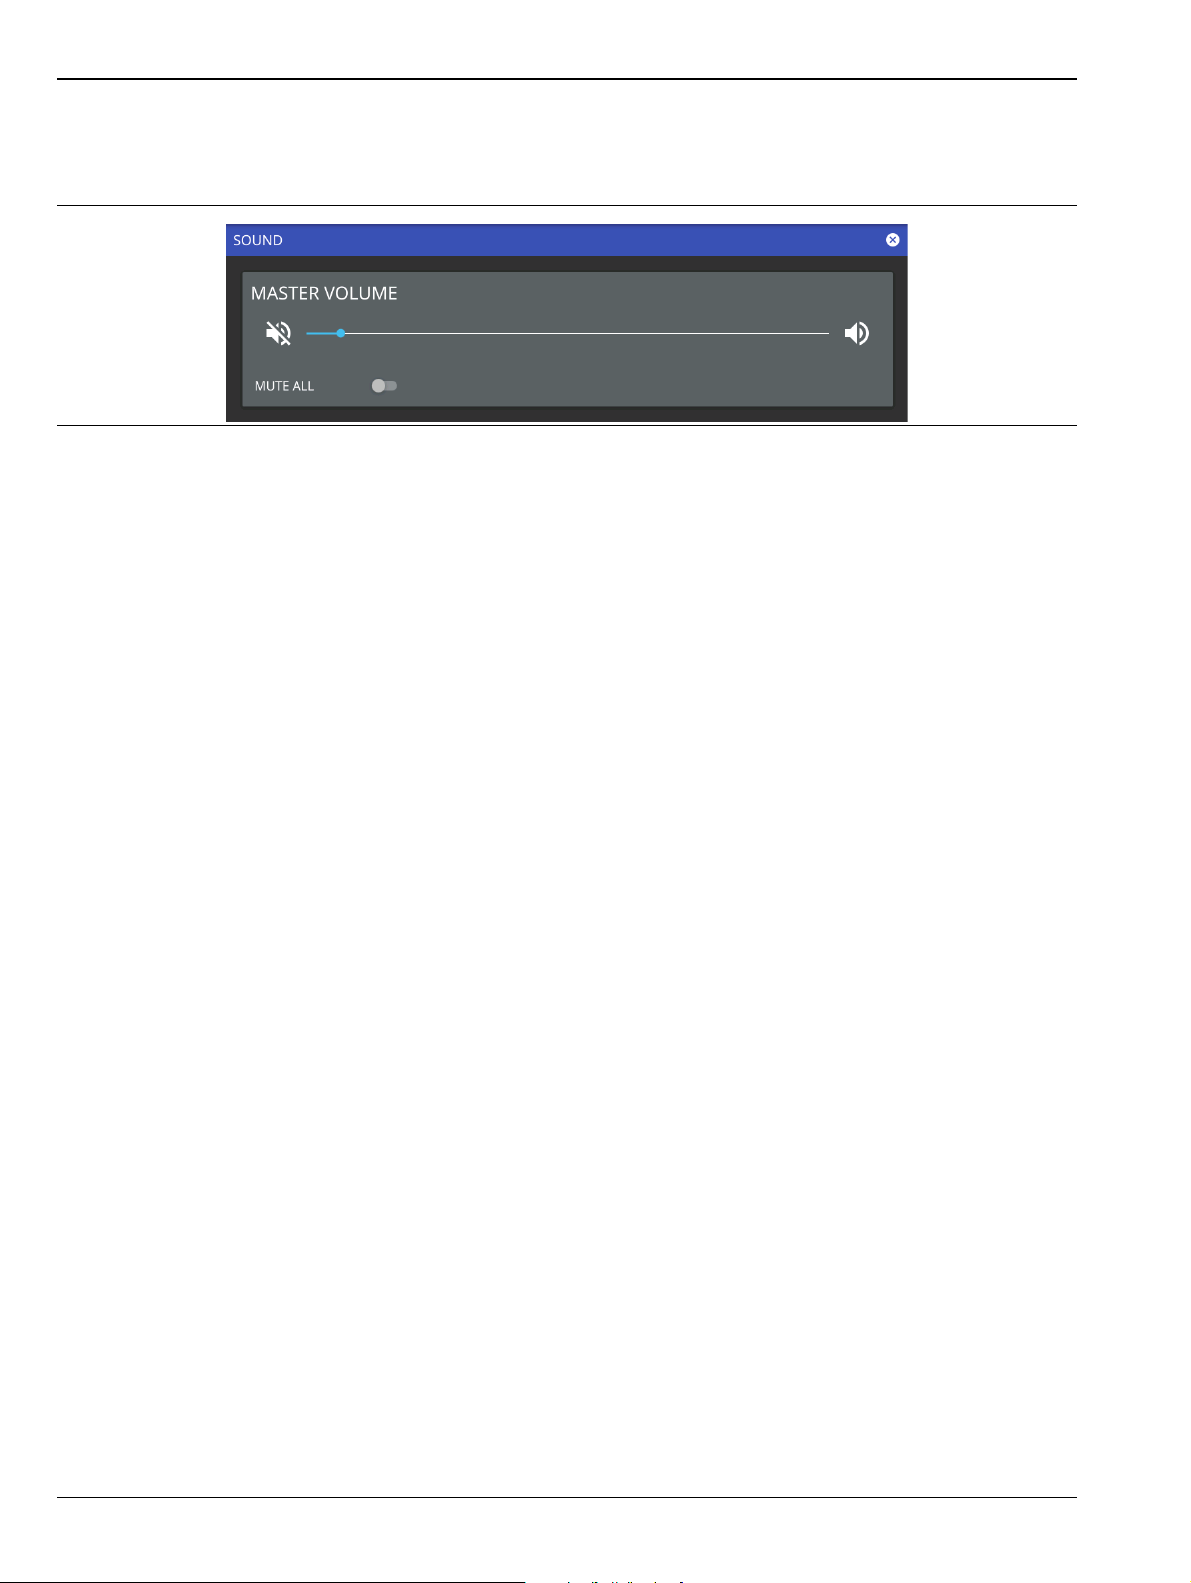
2-11 Settings Menu Instrument Overview
Sound Settings
The SOUND settings allow you to adjust the MASTER VOLUME or MUTE ALL of the instrument sounds. The
master volume may affect other volume settings found in various setup menus.
Figure 2-23. Sound Settings
2-24 PN: 10580-00444 Rev. F MS2090A UG
Page 43

Instrument Overview 2-11 Settings Menu
Network Settings
The MS2090A uses Ethernet or WLAN (Wi-Fi) to communicate remotely with a controller. Most instrument
functions (except power on/off) can be controlled via a network connection to a PC connected directly (with an
Ethernet cross-over cable or Wi-Fi peer-to-peer) or through a network. The instrument software supports the
TCP/IP raw socket network protocol.
Ethernet networking uses a bus or star topology in which all of the interfacing devices are connected to a
central cable called the bus, or are connected to a hub. Ethernet uses Carrier Sense Multiple Access/Collision
Detection (CSMA/CD) access method to handle simultaneous transmissions over the bus. This standard
enables network devices to detect simultaneous data channel usage, called a collision, and provides for a
contention protocol. When a network device detects a collision, the CSMA/CD standard dictates that the data is
retransmitted after waiting a random amount of time. If a second collision is detected, the data is again
retransmitted after waiting twice as long. This is known as exponential back off.
Wi-Fi uses a similar star topology in which all of the interfacing devices are connected to an access point. Wi-Fi
uses Carrier Sense Multiple Access/Collision Avoidance (CSMA/CA) access method to handle simultaneous
transmissions. CSMA/CA doesn’t detect collisions but rather avoids them through the use of a control message.
If the control message collides with another control message from another node, it means that the medium is
not available for transmission and the back-off algorithm is applied before attempting another transmission.
The TCP/IP setup requires the following:
• IP Address: Every computer and electronic device in a TCP/IP network requires an IP address. An IPv4
address has four numbers (each between 0 and 255) separated by periods. For example: 128.111.122.42
is a valid IP address.
• Subnet Mask: The subnet mask distinguishes the portion of the IP address that is the network ID from
the portion that is the station ID. The subnet mask 255.255.0.0, when applied to the IP address given
above, would identify the network ID as 128.111 and the station ID as 122.42. All stations in the same
local area network should have the same network ID, but different station IDs.
• Default Gateway: A TCP/IP network can have a gateway to communicate beyond the LAN identified by
the network ID. A gateway is a computer or electronic device that is connected to two different networks
and can move TCP/IP data from one network to the other. A single LAN that is not connected to another
LAN requires a default gateway setting of 0.0.0.0. If you have a gateway, then the default gateway would
be set to the appropriate value of your gateway.
• Ethernet Address: An Ethernet address, or Media Access Control (MAC) address, is a unique 48-bit
value that identifies a network interface card to the rest of the network. Every network card has a
unique Ethernet address permanently stored in its memory.
• Remote programming and operation between the instrument and remote program is accomplished via a
TCP/IP raw socket connection to port 9001. The remote program must establish a TCP/IP raw socket
connection at port 9001 to the MS2090A.
• The remote program may connect to the instrument IP address or to its HOSTNAME (Ethernet only). If
using DHCP instead of a static IP, using the HOSTNAME may be more reliable for finding an instrument
on a network.
• You may need to contact your network administrator to ensure network security policies, anti-virus, and
firewall settings do not block access to the controlling computer and its ports.
The MS2090A can be configured for
automates the process of setting IP addresses for devices that use TCP/IP, and is the most common method of
configuring a device for network use.
To determine if a network is set up for DHCP, connect the instrument to the network and select DHCP
protocol. Power cycle the instrument. If the network is set up for DHCP, the assigned IP address should be
displayed in the network settings.
Dynamic Host Configuration Protocol (DHCP), an Internet protocol that
MS2090A UG PN: 10580-00444 Rev. F 2-25
Page 44

2-11 Settings Menu Instrument Overview
8 7 6 5 4 3 2 1
Ethernet Connection
Interface between the instrument and other devices on the network is via a category five (CAT-5) interface
cable connected to a network. This cable uses four twisted pairs of insulated copper wires terminated into an
RJ45 connector. CAT-5 cabling is capable of supporting frequencies up to 100 MHz and data transfer speeds up
to 1 Gbps, which accommodates 1000Base-T, 100Base-T, and 10Base-T networks. CAT-5 cables are based on
the EIA/TIA 568 Commercial Building Telecommunications Wiring Standard developed by the Electronics
Industries Association. A pinout diagram is shown in Table 2-1.
Tab le 2-1. 8-pin Ethernet RJ45 Connector Pinout Diagram
Pin Name Description Wire Color
1 TX+ Transmit data (> +3 volts) White/Orange
2 TX– Transmit data (< –3 volts) Orange
3 RX+ Receive data (> +3 volts) White/Green
4 – Not used (common termination) Blue
5 – Not used (common termination) White/Blue
6 RX– Receive data (< –3 volts) Green
7 – Not used (common termination) White/Brown
8 – Not used (common termination) Brown
Integrated into the RJ45 connector are two LEDs that illuminate as follows:
• LED 1 Off: 10 Mbit/s LAN connection
• LED 1 Orange: 100 Mbit/s LAN connection
• LED 1 Green: 1000 Mbit/s LAN connection
• LED 2 Amber/Yellow: On or blinking indicates LAN traffic
The instrument IP address and its HOSTNAME are set via the System menu (upper left corner) and accessing
the ETHERNET or WIFI settings menu.
Note
Wi-Fi does not support connections using HOSTNAME; use IP addressing to establish a wireless
network connection.
TCP/IP connectivity requires setting up the parameters described at the beginning of this section. The
following is a brief overview of how to set up a general LAN connection on the MS2090A.
Note
You may need to consult your network documentation or network administrator for assistance in
configuring your network setup.
2-26 PN: 10580-00444 Rev. F MS2090A UG
Page 45

Instrument Overview 2-11 Settings Menu
Ethernet Settings
Refer to “Network Settings” on page 2-25 for general network setup and information.
1. Access the System menu (3-line icon in the upper left corner).
2. Press SETTINGS to access the instrument settings menu, then select ETHERNET to view the current
network settings (IP address, HOSTNAME, etc.).
Figure 2-24. Ethernet Settings
The instrument IP address can be set automatically using DHCP or manually by entering the desired
IP address, gateway address, and subnet mask.
If an active Ethernet cable is connected to the instrument while it is turned on, a reboot may be
Note
required to establish a DHCP connection. If the port becomes inactive, verify that an active Ethernet
cable is attached to the instrument, then cycle the instrument power off and on.
MS2090A UG PN: 10580-00444 Rev. F 2-27
Page 46

2-11 Settings Menu Instrument Overview
Wi-Fi Settings
Refer to “Network Settings” on page 2-25 for general network setup and information.
1. Access the System menu (3-line icon in the upper left corner).
2. Press SETTINGS to access the instrument settings menu, then select WIFI to display the current
network settings (IP address, HOSTNAME, etc.).
Figure 2-25. Wi-Fi Settings
The instrument IP, subnet mask, and gateway address are managed by the access point or wireless router.
An active Wi-Fi connection to an access point must be established in order to enable DHCP.
Note
3. Enable the Wi-Fi radio by toggling it on from the right-side panel, then select an access point from the
list.
4. When an access point is selected, the keyboard will display for you to enter the access point key (or
password).
5. The access point will display below the toggle as the active connection.
If Wi-Fi becomes inactive, cycle the instrument power off and on, then verify that the Wi-Fi device is
connected to an access point.
Field Master Pro is not able to connect to networks that require sign-in through web servers.
2-28 PN: 10580-00444 Rev. F MS2090A UG
Page 47

Instrument Overview 2-11 Settings Menu
GPS/GNSS Settings (Option 31)
The MS2090A Field Master Pro is available with a built-in global positioning receiver feature (Option 31) that
can provide latitude, longitude, altitude, and UTC timing information. This option also enhances frequency
reference oscillator accuracy. When the global positioning receiver is actively locked to satellites, this
information is saved with all saved measurements.
The MS2090A Field Master Pro Data Sheet provides a list of the options and measurements that
Note
The MS2090A supports the following global positioning satellite systems:
• GPS: The United States Global Positioning System (GPS). GPS is currently the world's most utilized
satellite navigation system.
• GNSS: Global Navigation Satellite System, a term used worldwide. This term includes GPS, GLONASS,
Galileo, and Beidou. Accessing multiple satellites provides increased accuracy, redundancy, and
availability at all times.
Activating the GPS Feature
Attach the GPS antenna to the GPS connector on the top of the instrument.
1. Access the System menu (3-line icon in the upper left corner).
2. Press SETTINGS to access the instrument settings menu, then select GPS to open the GPS settings and
info window.
require GPS (Option 31). In addition to having Option 31 installed, a GPS antenna is required. Refer
to the instrument Technical Data Sheet for compatible GPS antennas.
Figure 2-26. GPS Settings
3. Activate the GPS by sliding the GPS/GNSS toggle switch to on.
4. Set ANTENNA VOLTAGE to 3.3 or 5.0V.
5. When the GPS receiver has established a “good fix”, the GPS icon is displayed with a center dot and the
following information is kept updated:
• Fix status
• Tracked satellites
• Latitude
• Longitude
• Altitude
• UTC timing information
MS2090A UG PN: 10580-00444 Rev. F 2-29
Page 48

2-11 Settings Menu Instrument Overview
After GPS location fix is attained, the internal reference oscillator begins to correct its frequency to match the
GPS standard. After the internal frequency is adjusted to match the GPS standard, the status is indicated by
“GPS High Accuracy” showing in the Status menu, which is displayed on the left side of the measurement
display. When the GPS feature is not enabled, the reference source displays either “Internal Standard
Accuracy” or a user-selected external reference frequency in the Status menu.
Within three minutes of satellite acquisition, the reference oscillator will have an accuracy of better than
25 ppb (parts per billion). The OCXO internal standard accuracy is ±0.3 PPM. The correction factor applied to
the internal OCXO allows the instrument to maintain GPS frequency accuracy for three days at better than
50 ppb, even when the instrument is obstructed from receiving signals from the GPS satellites.
In order to acquire data from the GPS satellites, you must have line-of-sight to the satellites, or the antenna
must be placed outside with no obstructions.
If no GPS is connected for at least three days, the Frequency Reference annotation reads Int Std Accy.
Screenshot Setup
1. Access the System menu (3-line icon in the upper left corner).
2. Press SETTINGS to access the instrument settings menu, then select SCREENSHOT to open the
screenshot setup menu.
Figure 2-27. Screenshot Setup
Screenshot setup lets you configure the following:
• Capture region: entire window or graph area only
• Color: standard or printer-friendly
• Annotations: may be placed at top (header) or bottom (footer) of captured image
• Directory: directory path to destination folder where the file is to be saved
Note Screenshots can be previewed on the instrument display from “File Management” on page 2-36.
2-30 PN: 10580-00444 Rev. F MS2090A UG
Page 49
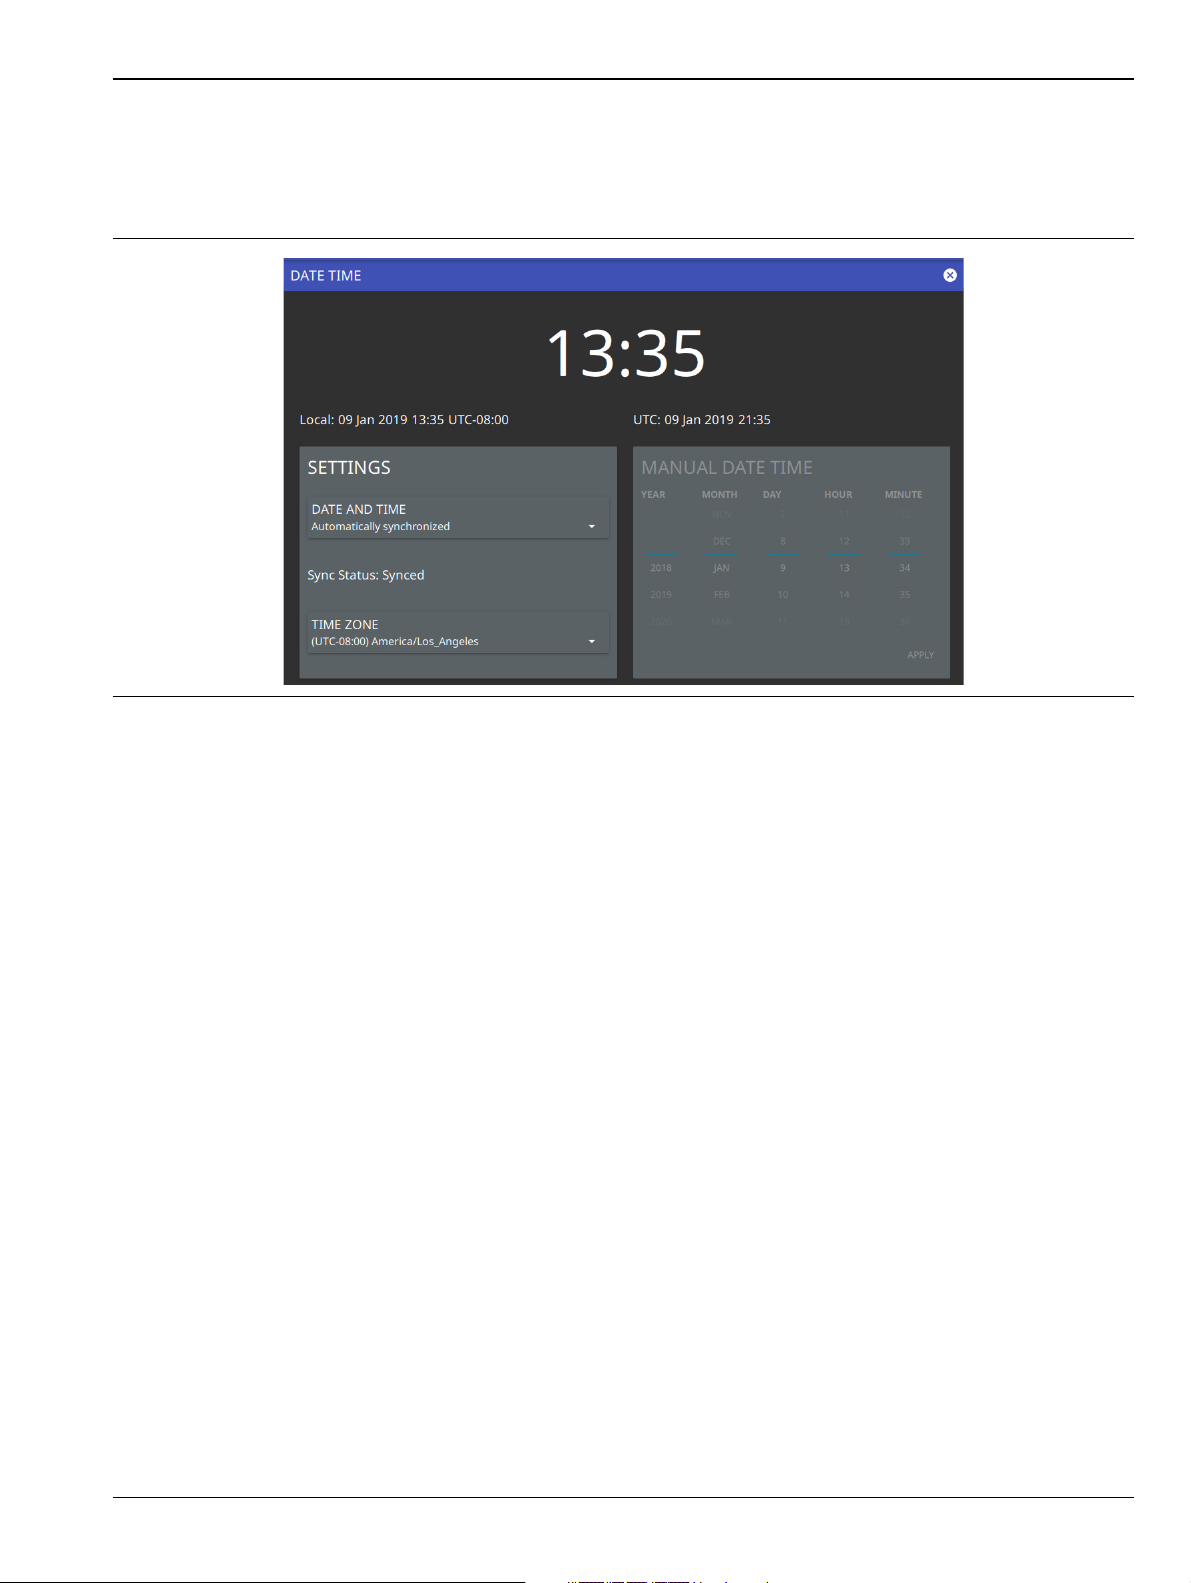
Instrument Overview 2-11 Settings Menu
Date Time Settings
1. Access the System menu (3-line icon in the upper left corner).
2. Press SETTINGS to access the instrument settings menu, then select DATE TIME to display the current
date and time settings.
Figure 2-28. Date Time Settings
The Date Time setup lets you set the current date and time and the time zone.
• Date and Time: Manually set or automatically synchronized. When synchronized (Sync Status: Synced),
the system uses the network time; if the instrument also has a GPS location fix, the system will
determine and use the more accurate of the two, between network and GPS time. Select Manually set to
activate the MANUAL DATE TIME window. Here you can scroll to a selectable year, month, day, hour,
and minute.
• Time Zone: Lists the selectable time zones.
MS2090A UG PN: 10580-00444 Rev. F 2-31
Page 50

2-11 Settings Menu Instrument Overview
Port Setup
The Port Setup menu allows you to configure the external ports.
Bias Voltage
Bias Voltage setup provides controls to set the voltage level and to monitor the precise voltage and current, and
trip state.
1. Access the System menu (3-line icon in the upper left corner).
2. Press SETTINGS to access the instrument settings menu, then select PORT SETUP to display the top
panel bias voltage output settings.
Figure 2-29. Bias Voltage Port Settings
3. Manually set the voltage in the range of 0 V to 34 V.
4. Toggle the bias voltage on or off.
2-32 PN: 10580-00444 Rev. F MS2090A UG
Page 51
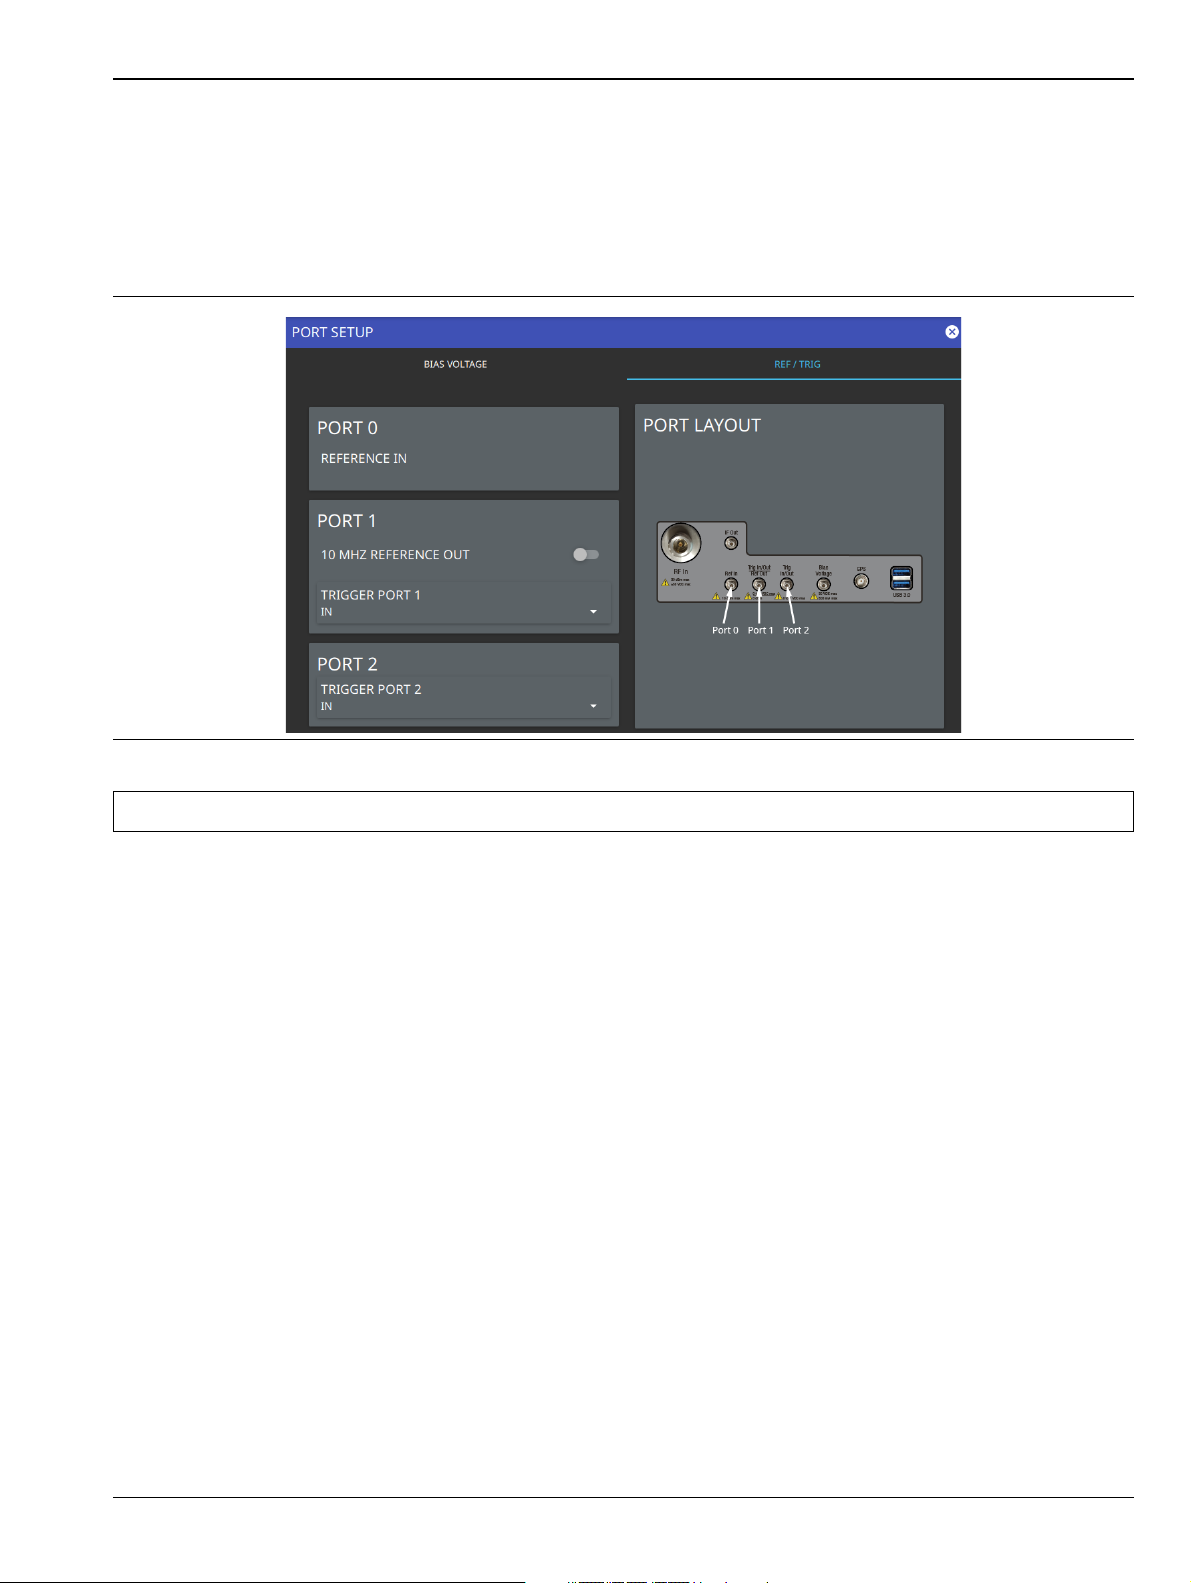
Instrument Overview 2-11 Settings Menu
Reference and Trigger
The reference and trigger setup provides controls to set the functionality of the configurable top panel
reference and trigger ports.
1. Access the System menu (3-line icon in the upper left corner).
2. Press SETTINGS to access the instrument settings menu, then select PORT SETUP > REF / TRIG to
display the top panel reference and trigger port settings.
Figure 2-30. Reference/Trigger Port Settings
Note PORT 0 is always a reference in port.
3. To set PORT 1 as a reference output, toggle 10 MHz REFERENCE OUT on. Otherwise, PORT 1 can be
selected as a trigger input or trigger output by using the drop-down selection.
4. Use the drop-down selections to select PORT 2 as a trigger input or trigger output.
MS2090A UG PN: 10580-00444 Rev. F 2-33
Page 52

2-11 Settings Menu Instrument Overview
Options Settings
1. Access the System menu (3-line icon in the upper left corner).
2. Press SETTINGS to access the instrument settings menu.
3. Select OPTIONS to display the lists of currently installed software options on the left pane and those
that are available for installation on the right pane.
Figure 2-31. Options Settings
Some options can be installed using only a software file. Others may require additional hardware. Contact your
local sales or service representative for information on installing new options.
2-34 PN: 10580-00444 Rev. F MS2090A UG
Page 53

Instrument Overview 2-11 Settings Menu
Reset Settings
1. Access the System menu (3-line icon in the upper left corner).
2. Press SETTINGS to access the instrument settings menu.
3. Select RESET to open the Reset menu.
Figure 2-32. Reset Settings
The following reset options are available:
SETTINGS RESET
• FACTORY RESET: Restores the instrument to the factory default settings for all measurement modes
and system settings, including language and the display and audio settings. Ethernet settings and user
files are not affected. The instrument will automatically restart.
FILE RESET
• DELETE USER FILES: Deletes all user files from the instrument’s internal memory, including
measurement, setup, and screenshot files. System files are not affected.
• DELETE SYSTEM FILES: Deletes all user system files from the instrument’s internal memory,
including keyboard EZ names, cable and antenna lists, and log files. Other user files are not affected.
MASTER RESET
• MASTER RESET: Performs a Factory Reset as described above and deletes all user files and system files
from the instrument’s internal memory. The instrument will automatically restart.
MS2090A UG PN: 10580-00444 Rev. F 2-35
Page 54
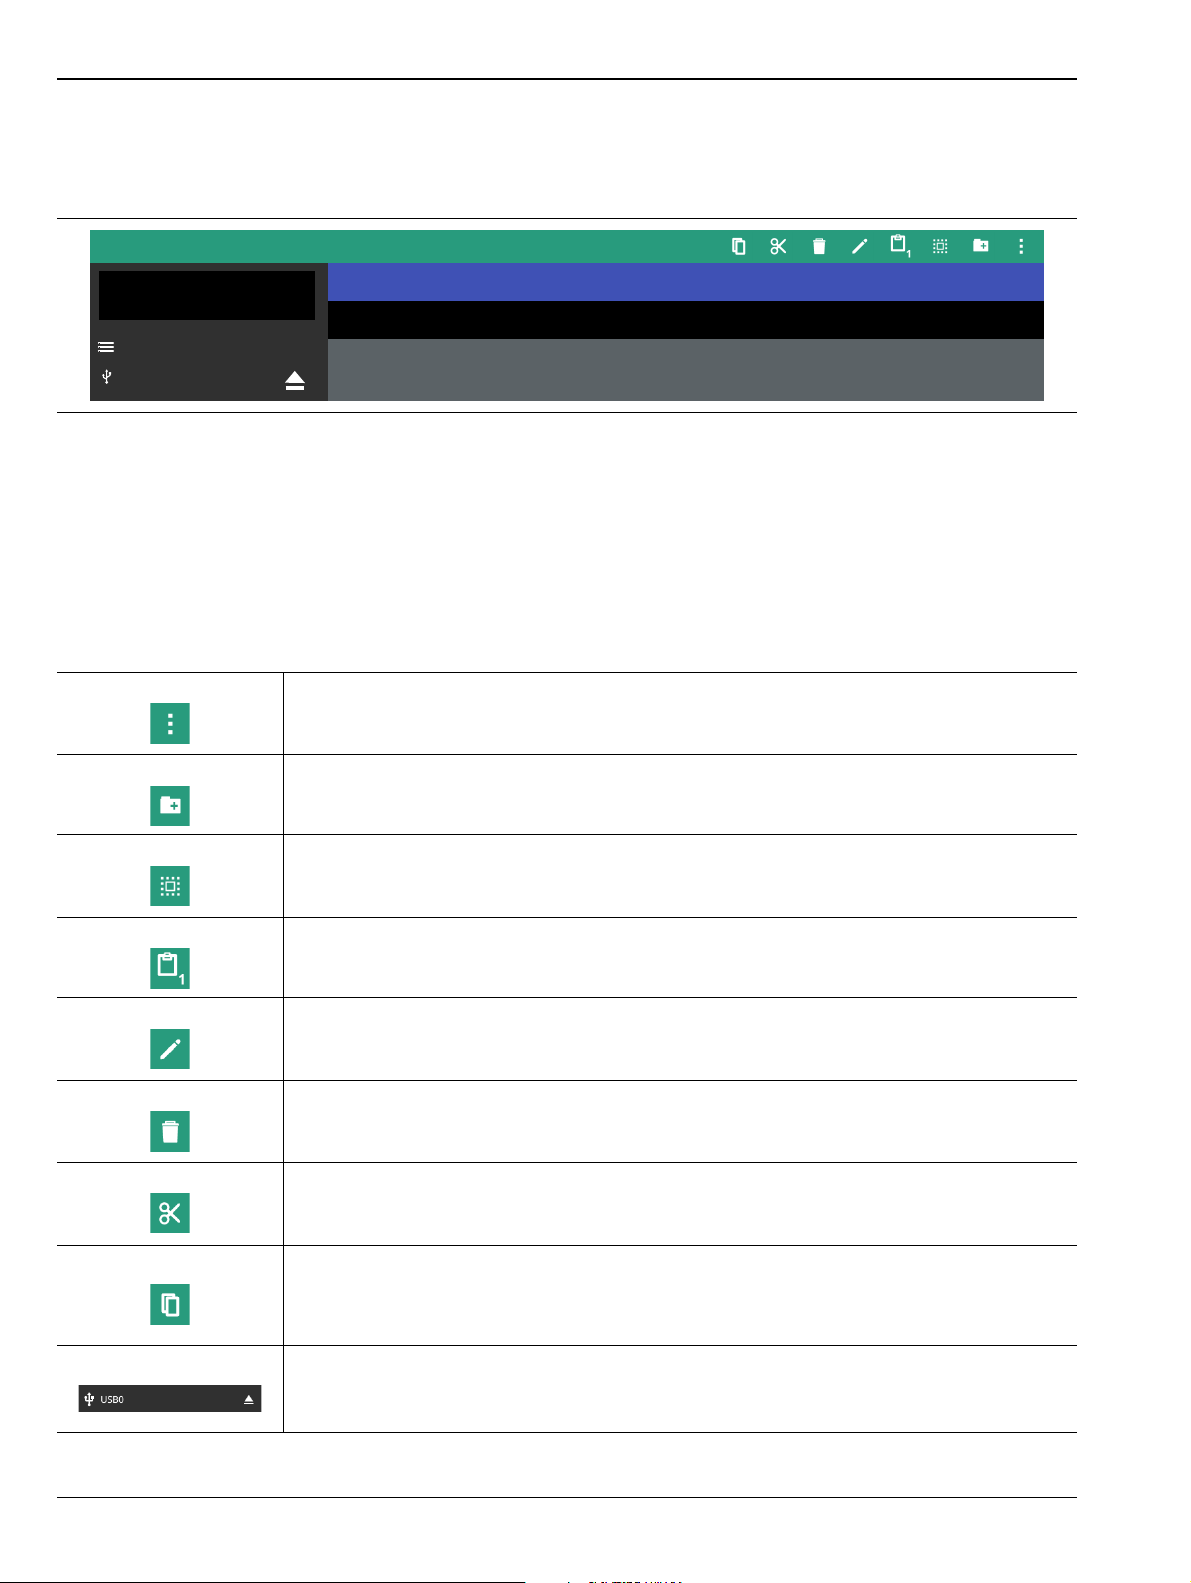
2-12 File Management Instrument Overview
LOCATIONS
FILE MANAGEMENT
< Locaiton: INTERNAL
INTERNAL
USB1
FILE NAME ^
201901010101 224 items Jan 1 1:01:01 2019
201901010101 224 items Jan 1 1:01:01 2019
SIZE DATE
2-12 File Management
1. Access the System menu (3-line icon in the upper left corner).
2. Press FILES to access the instrument file management menu.
Figure 2-33. File Management Menu
File Locations
Displays the available memory locations. Touch the location that you want to access and the available files will
be displayed on the right side. You can touch the column headers to change the sort order.
File Management Operations
All file operations are selected via the following icons:
3-Dots
Use the 3-dots menu to refresh the displayed folder contents or to close the file
management menus.
New Folder
Use the New Folder icon to create a new directory in the current memory location. When
pressed, the virtual keyboard is displayed, allowing you to enter a new directory name.
Select
The Select icon enables checkboxes next to your folder and file names. You can then
select multiple files to move, copy, or delete.
Clipboard
The Clipboard icon displays the number of items that you have selected and copied to the
clipboard. Use this icon to paste the copied items to the destination folder.
Edit
Use the Edit icon to change file or folder names. Select the item you wish to edit, then
press Edit to display the virtual keyboard and edit the item’s name.
Delete
Use the Delete icon to remove files or folders from memory. Select the item you wish to
delete, then press Delete to remove the item.
Caution: The item will be permanently deleted and cannot be recovered.
Cut
Use the Cut icon to move files or folders. Select the items you wish to move, then press
Cut to store the items on the clipboard. Navigate to the new location and press the
Clipboard icon to paste the items. The moved items are deleted from the source location.
Copy
Use the Copy icon to select files and folders to copy to a new location. Select the items
you wish to copy, then press Copy to store the items on the clipboard. Navigate to the
new location and press the Clipboard icon to paste the items. Copies of the items remain
in the source location.
USB Eject
Use the USB Eject icon to properly dismount the USB memory device before removing it
from the instrument port. Failing to properly eject the device could cause data corruption.
Figure 2-34. File Management Icons
2-36 PN: 10580-00444 Rev. F MS2090A UG
Page 55

Instrument Overview 2-12 File Management
Previewing Screenshots
While in File Manager, you can preview screenshots on the instrument display simply by touching the
screenshot file name. While the preview is displayed, you can use the controls to:
• Cycle forward and backward through each screenshot in the directory.
• Rename the file by selecting RENAME, then use the keypad to enter a new filename.
• Delete the file by selecting DELETE and then confirming your choice.
• Copy the file, then close the preview dialog and navigate to the desired location, then touch the Paste
icon at the top of the File Manager.
Figure 2-35. Screenshot Preview
MS2090A UG PN: 10580-00444 Rev. F 2-37
Page 56

2-13 Saving and Recalling Measurements Instrument Overview
2-13 Saving and Recalling Measurements
The Field Master Pro can save measurement setups, native trace and CSV trace data, limit line setups, and
screenshots. You can recall setup, native trace, and limit line files. Refer to Section 2-12 “File Management”
on page 2-36 for other file operations such as copy, move, and directory management.
Saving a Measurement
To save a measurement or setup:
1. Press FILE > SAVE AS...
2. If desired, press the save location to change the destination.
3. Enter the desired file name using the touchscreen keyboard.
4. Select the type of file to save from the selection list.
5. Press SAVE to save the file.
Once a file has been saved, the QUICK SAVE feature can be used to quickly save the same type of file with an
incrementing number appended to the end of the original file name.
Recalling a Measurement
You can recall a saved setup, native trace measurement, and a limit line. When recalling a setup, the
instrument setup and operating state will be restored as it was when the setup was saved. When recalling a
trace measurement, the instrument setup and on-screen measurement data will be restored as it was when the
trace data was saved.
To recall a measurement or setup:
1. Press FILE > RECALL...
2. Select the file location.
3. Select the desired file from the displayed list. You can use the file type filter to shorten the list if needed.
4. Press OPEN to recall the file.
When a trace measurement is recalled, the trace or sweep state will be set to hold. To restore active
measurements:
• For RF-based measurement, set TRACE > MODE > Active
• For a 5GNR summary measurement, disable SWEEP > HOLD
2-38 PN: 10580-00444 Rev. F MS2090A UG
Page 57

Instrument Overview 2-13 Saving and Recalling Measurements
FILE Menu
The file menu here shows all possible selections. The available selections vary depending on the selected
measurement and view.
QUICK SAVE: saves a setup file immediately with the name shown in the button. The
number in the name is incremented automatically so that the new name is ready for the
next setup file to be saved.
SAVE AS: Opens the Save dialog to manually enter a file location, enter a file name, and
to set the file type to be saved. You can save the following:
• Setup: Saves the current instrument setup (stp file type).
• Trace: Saves the measurement point (trace) data and the current instrument setup
(fmspa or fm5gnr file types).
• Trace CSV: Saves the visible trace point data in comma separated value format
(csv file type). This format is useful for further analysis using other software tools.
• Limit: Saves the current limit line point data (lim file type).
• Screenshot: Saves a screenshot of the current measurement (png file type).
RECALL: Opens the Recall File dialog to retrieve a file from a desired location. Only
supported files will be displayed depending on the currently set measurement. When
trace data is recalled, the instrument will change the settings to match the settings of the
saved trace. The data will be recalled to the appropriate trace. That trace will be in a Hold
mode. To exit the recalled data, simply change the trace mode back to Active.
Figure 2-36. FILE Menu
SAVE ON EVENT: Opens the “SAVE ON EVENT Menu” on page 2-40. This feature is not
available in the 5G/LTE analyzer.
5G CAPTURE: This feature is available only in the 5G or LTE analyzer. Initiates a
digitized 40 ms capture of the waveform. IQ captures are saved to the internal storage
space in the captures folder (bin file type) as a raw IQ stream and can be used for
diagnostics. A future software update will allow the files to be used by post processing
software to help identify SSB location and subframe configurations.
BROWSE FILES: Opens “File Management” on page 2-36.
MS2090A UG PN: 10580-00444 Rev. F 2-39
Page 58
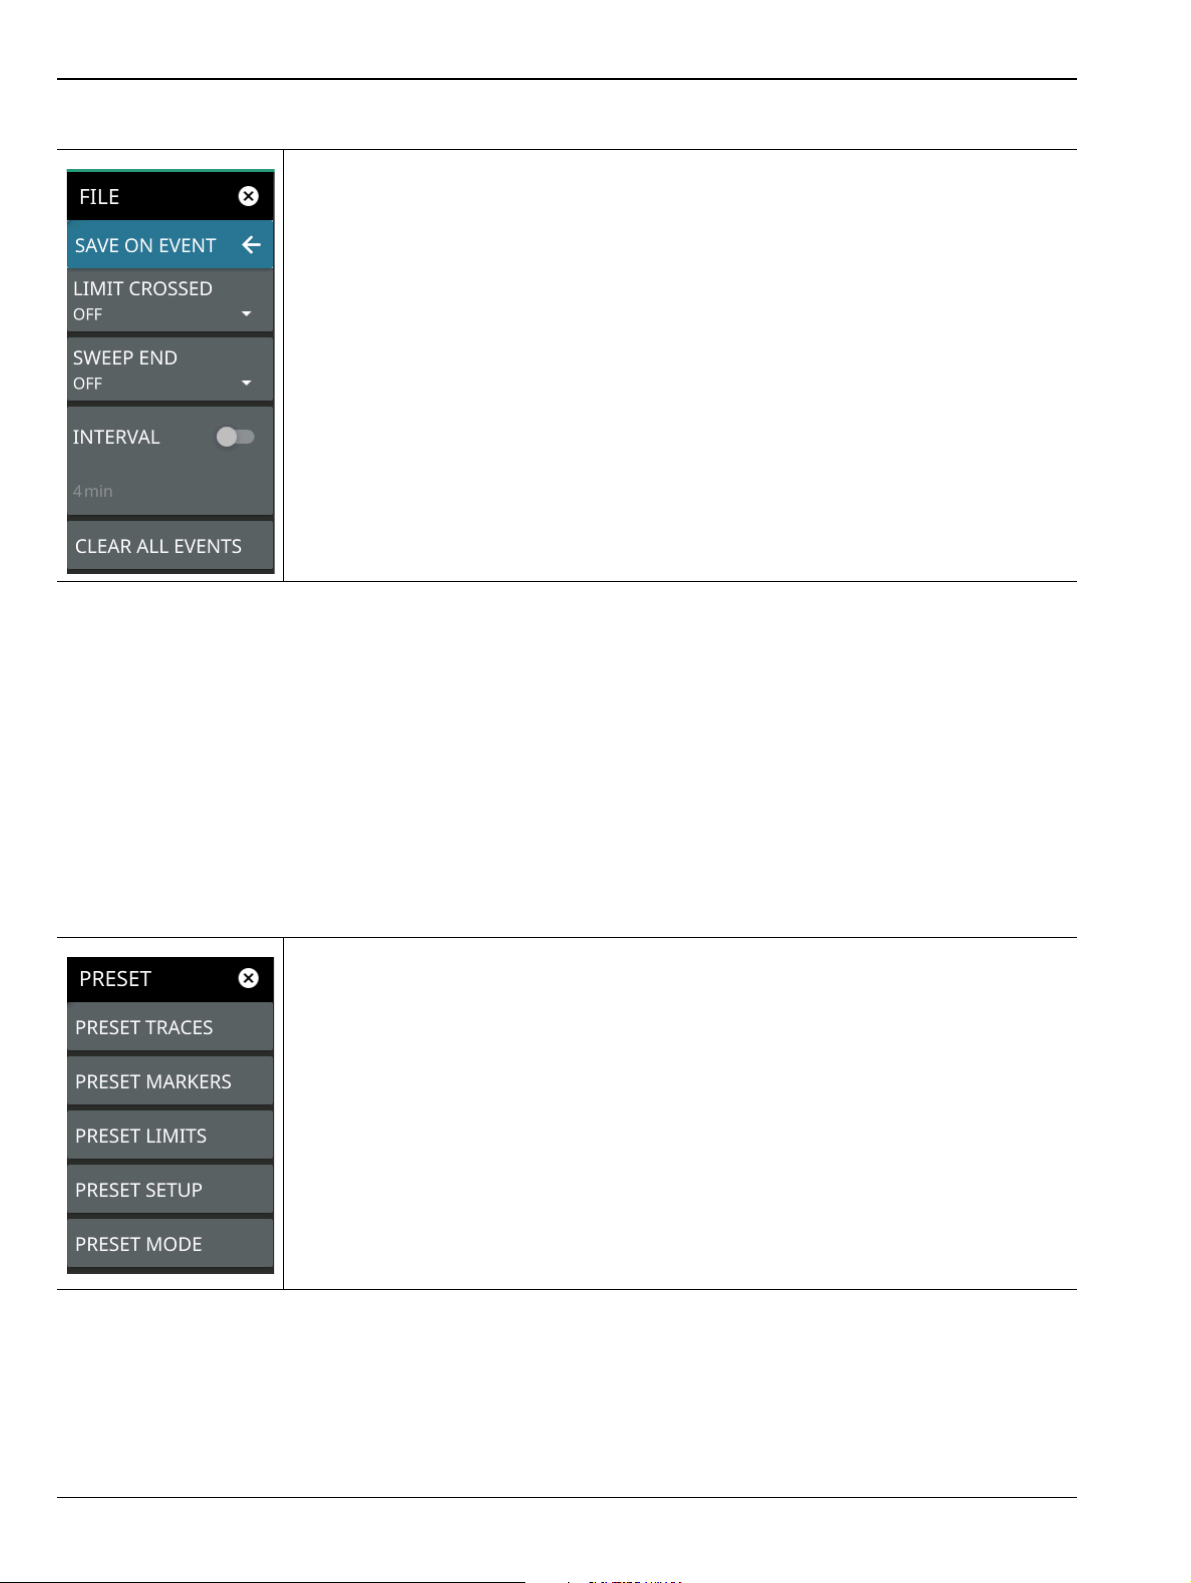
2-14 Presetting the Analyzer Instrument Overview
SAVE ON EVENT Menu
Save on event saves the current trace data to a folder named with the current date and
time (yyyymmddhhmmss).
LIMIT CROSSED: When enabled, measurement trace data is automatically saved when
the trace crosses a limit line that has been specified in the Limit menu. If SINGLE is
selected, the first event will be saved and the event will be set to OFF. If CONTINUOUS is
selected, each event will continue to be saved.
SWEEP END: When enabled, measurement trace data is automatically saved after the
current sweep is completed. If SINGLE is selected, the first sweep will be saved and the
event will be set to OFF. If CONTINUOUS is selected, each sweep will continue to be
saved.
INTERVAL: A save will occur periodically. Set the desired period by entering the time.
CLEAR ALL EVENTS: Press this button to turn off all save events at once.
Figure 2-37. SAVE ON EVENT Menu
2-14 Presetting the Analyzer
The preset menu sets certain settings to the default state. Preset only affects the current analyzer settings,
such as those for the spectrum analyzer or the 5G analyzer. Preset does not affect user files or system settings
such as networking settings. For other reset options, such as a complete factory reset of the instrument, refer
to
PRESET Menu
The PRESET menu restores settings to their default values. User data is not affected by the preset function.
PRESET TRACES: Presets all values on the TRACES menu to default values. Not
shown in the 5GNR Summary measurement.
PRESET MARKERS: Presets all values on the MARKER menu to default values. All
markers will be disabled. Not shown in the 5GNR Summary measurement.
PRESET LIMITS: Presets all values on the LIMITS menu to default values. All limit lines
will be disabled. Not shown in the 5GNR Summary measurement.
PRESET SETUP: Presets all values on the SETUP menu to default values.
PRESET MODE: Presets all of the current analyzer settings to default values.
Figure 2-38. PRESET Menu
2-40 PN: 10580-00444 Rev. F MS2090A UG
Page 59
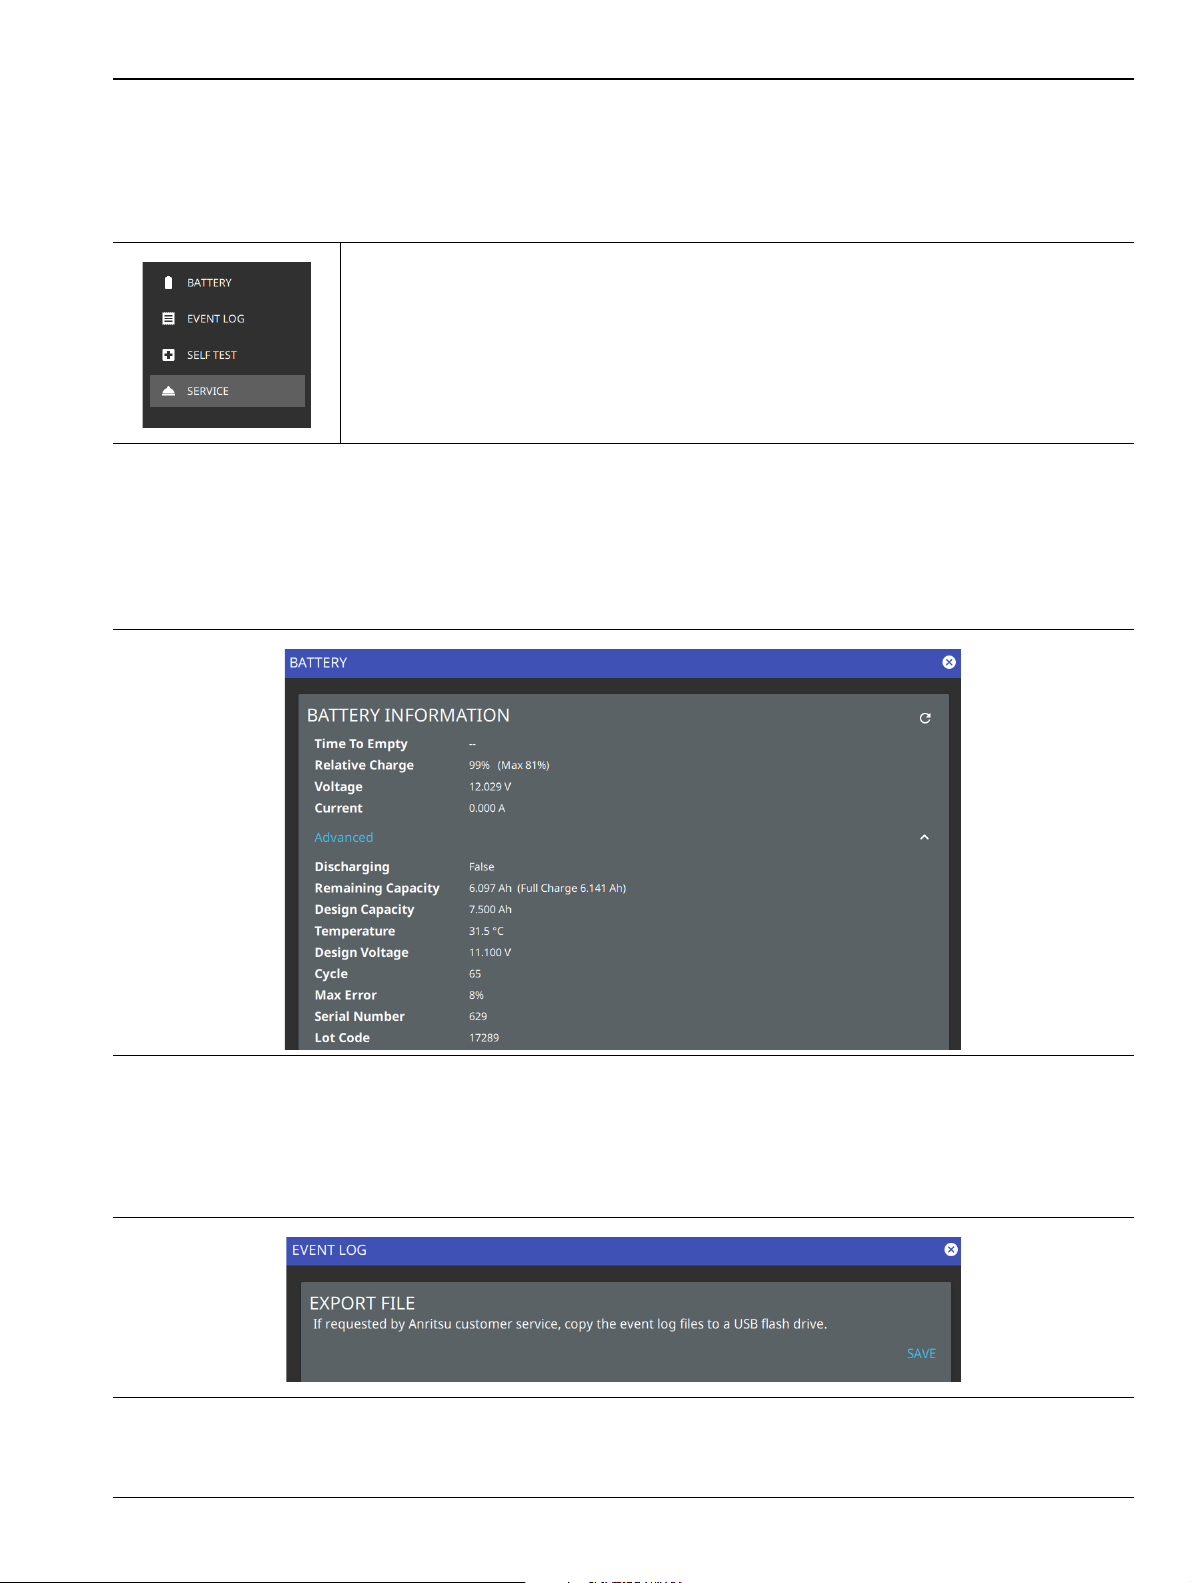
Instrument Overview 2-15 Diagnostics
2-15 Diagnostics
1. Access the System menu (3-line icon in the upper left corner).
2. Press DIAGNOSTICS to access the instrument diagnostics menu, then select the diagnostic menu that
you wish to open.
-
Battery: Opens Battery Information.
Event Log: Opens the Event Log.
Self Test: Opens the Self Test.
Service: Opens the Service Mode.
Figure 2-39. Diagnostics Menu
Battery Information
The battery information menu shows the available battery information. The relative charge indicates the
charge level that the battery is capable of storing. The maximum charge shows the relative capacity of the
battery compared to the design capacity. Advanced information can be expanded by touching Advanced.
Figure 2-40. Battery Information
Event Log
The event log allows you to save the event log as a file. This log file is a binary file that may be used by
customer service.
Figure 2-41. Event Log
MS2090A UG PN: 10580-00444 Rev. F 2-41
Page 60

2-15 Diagnostics Instrument Overview
Self Test
Self test is run when the self test feature is accessed. Basic system results are shown initially. The individual
test result can be displayed with test data and a pass/fail status by touching the desired system or application.
The self test results can be saved to a file for future reference. Refer to Appendix A, “Instrument Messages and
Troubleshooting” for more information.
Figure 2-42. Self Test
Service Mode
The service mode is for Anritsu customer service use only.
Figure 2-43. Service Mode
2-42 PN: 10580-00444 Rev. F MS2090A UG
Page 61

Instrument Overview 2-16 Tools Menu
2-16 Tools Menu
1. Access the System menu (3-line icon in the upper left corner).
2. Select TOOLS to access the instrument tools menu, then select the tool menu that you wish to open.
-
IQ STREAMING: Opens IQ Streaming Tools.
Figure 2-44. Tools Menu
IQ Streaming Tools
The IQ STREAMING menu allows you to concatenate an existing IQ metadata file with a new IQ stream.
Touch IQ METADATA FILE and then select the file that you wish to concatenate with a new IQ stream.
Figure 2-45. IQ Streaming
MS2090A UG PN: 10580-00444 Rev. F 2-43
Page 62
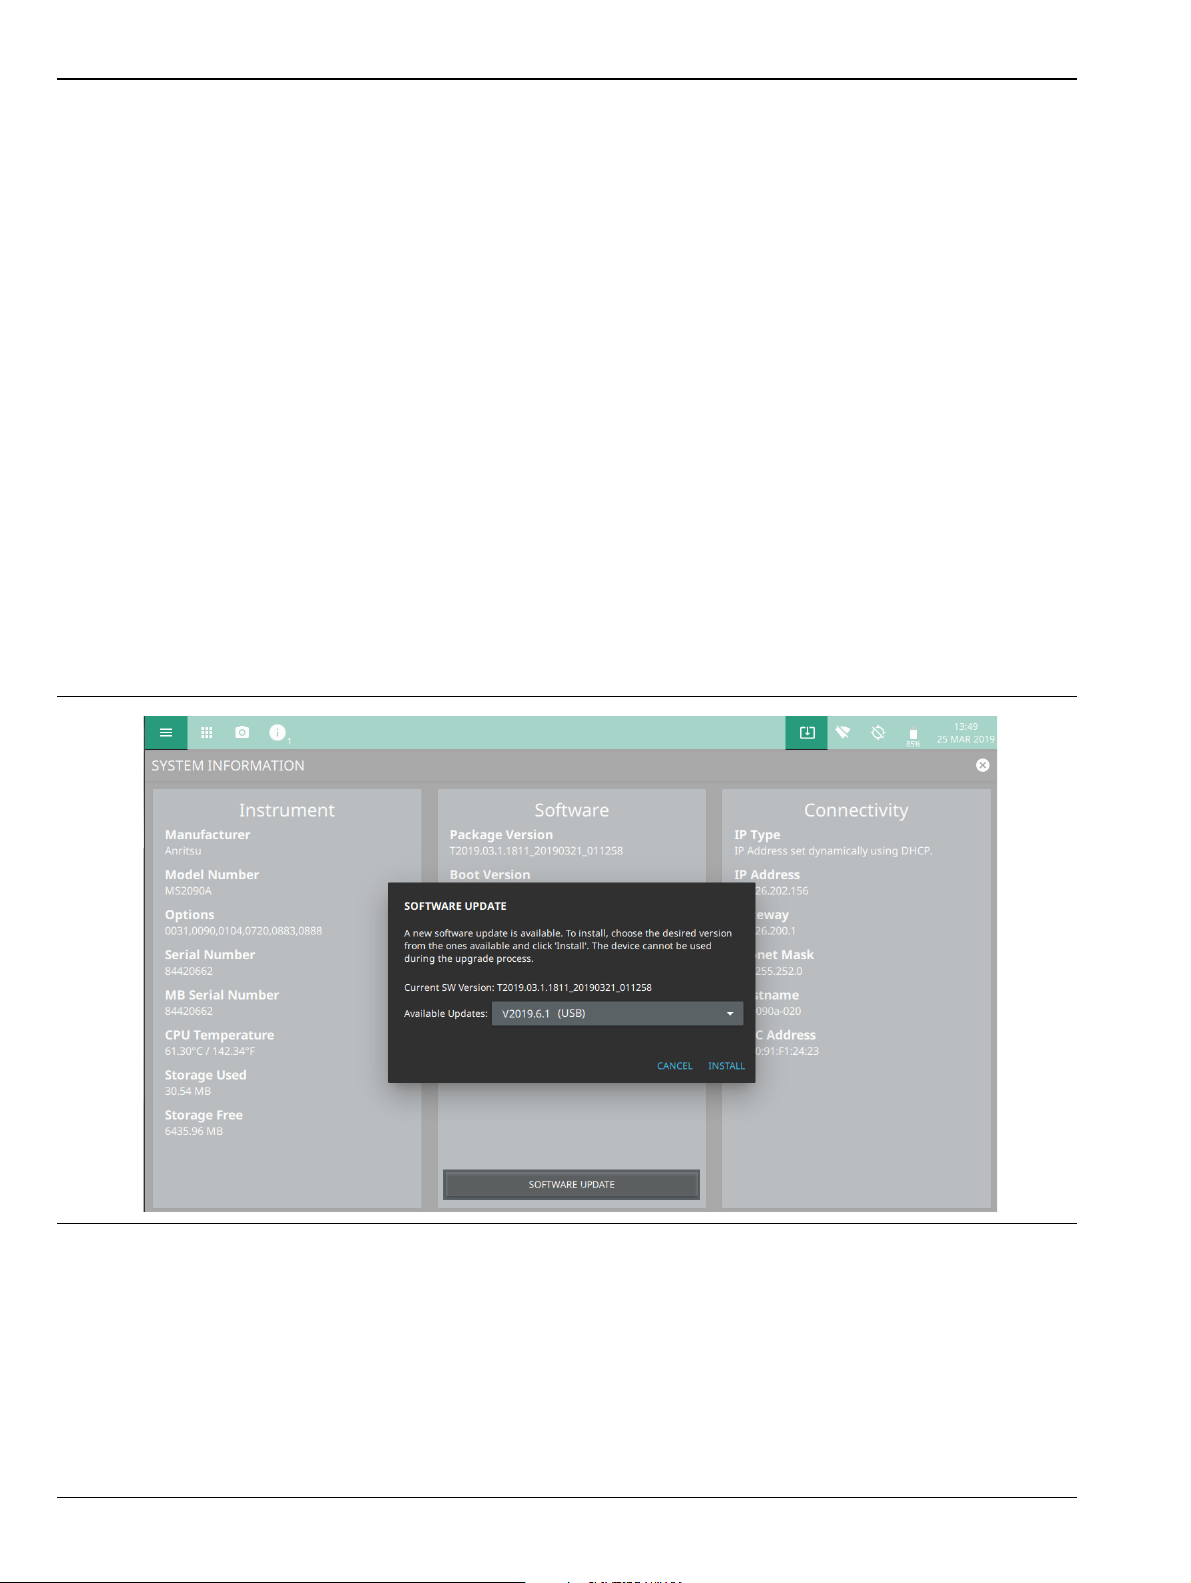
2-17 Software Update Instrument Overview
2-17 Software Update
To update your Anritsu instrument software, use a high quality USB memory device with at least 1 GB of free
space and FAT32 file system format.
1. Insert the USB memory device into your PC or laptop.
2. From a browser, go to the following Anritsu products page:
http://www.anritsu.com/en-US/test-measurement/products/ms2090a
3. On the product page, click Downloads and select Drivers/Firmware/Software.
4. Select the software update for your product and download it to the USB memory device.
5. Insert the USB memory device into the one of the MS2090A USB ports.
Installing the Software
1. Start the software update via one of the two ways below (see Figure 2-46):
• Access the upper left System Menu (3-line icon), then press SYSTEM INFORMATION >
SOFTWARE UPDATE.
• Press the software update icon from the Title Bar.
2. Select the latest available update from the drop-down selections and press Install.
• A dialog will appear stating Software Update in Progress.
3. When the installation is complete, see “Verify the Software Update”.
Figure 2-46. Updating the Software
Verify the Software Update
1. Once the software update is complete, power off the MS2090A.
2. Power on the MS2090A
3. Press the System menu icon (3-line icon) from the MS2090A to display the System Menu.
4. Select the System Information menu (see Figure 2-47).
2-44 PN: 10580-00444 Rev. F MS2090A UG
Page 63
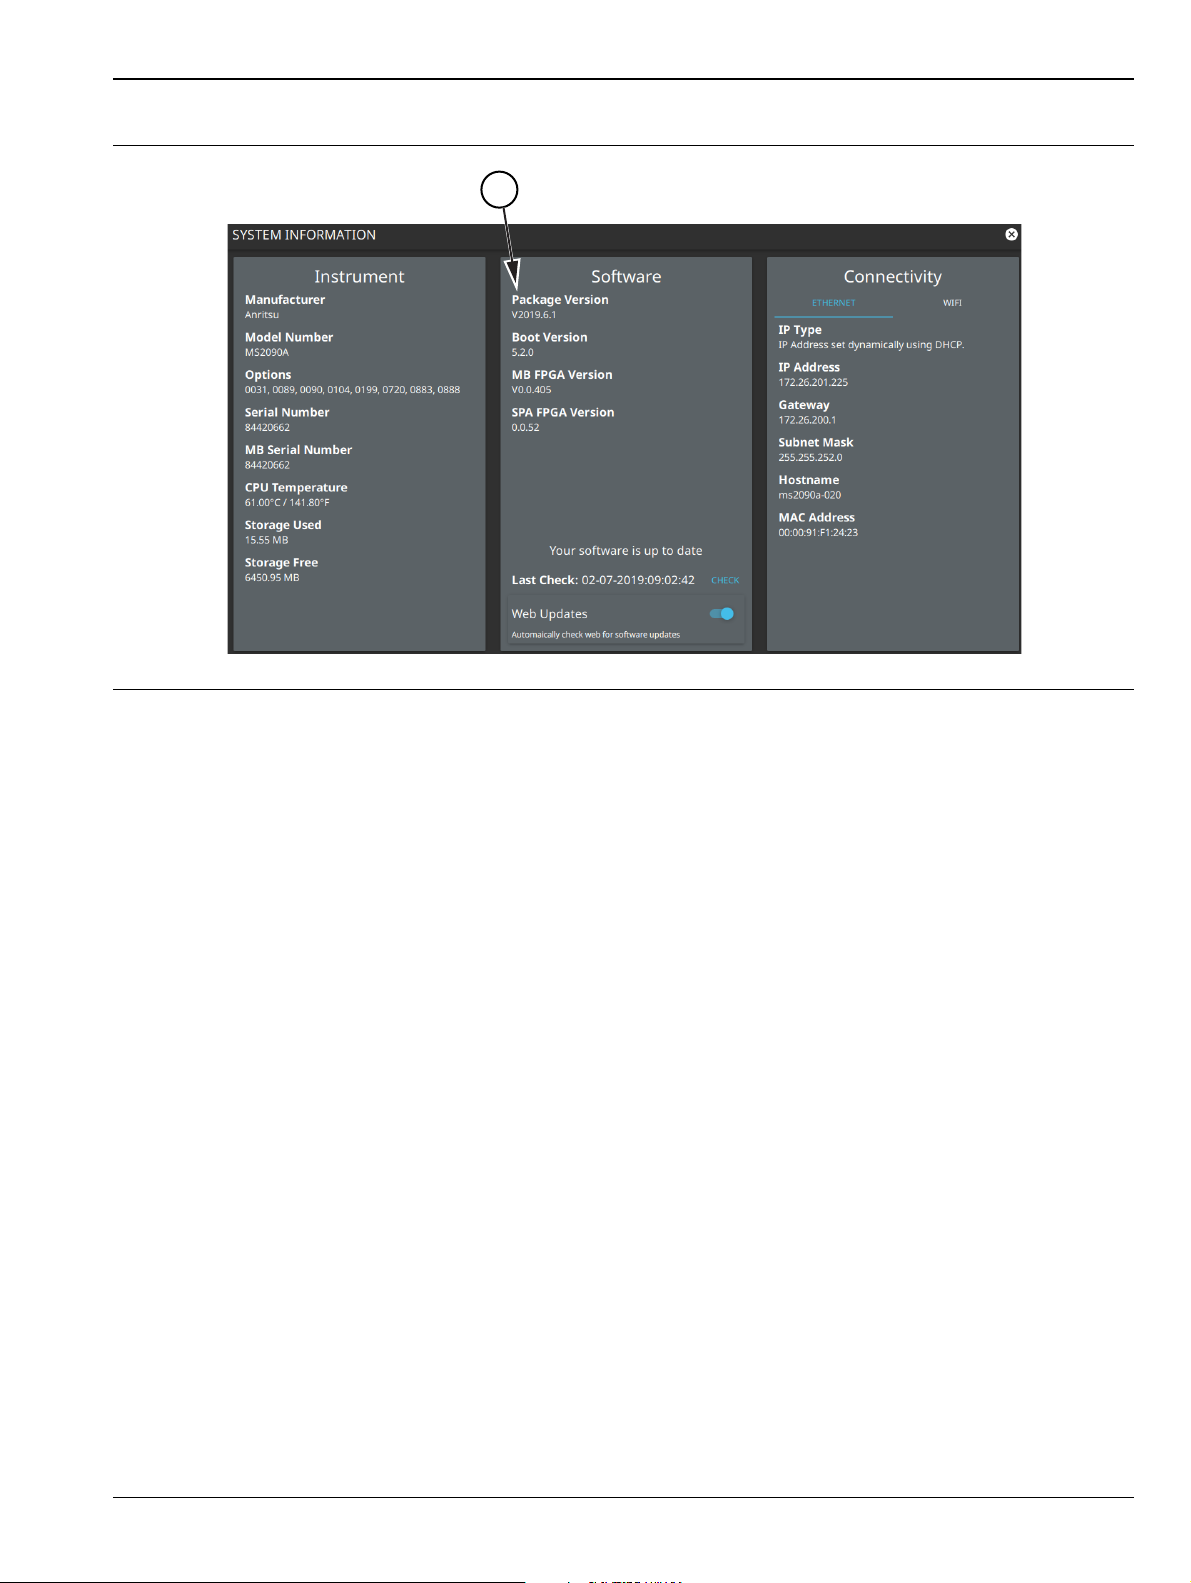
Instrument Overview 2-17 Software Update
5
5. Verify the Software Package Version displayed is the most current version installed.
Figure 2-47. System Information
MS2090A UG PN: 10580-00444 Rev. F 2-45
Page 64

2-17 Software Update Instrument Overview
2-46 PN: 10580-00444 Rev. F MS2090A UG
Page 65

Chapter 3 — Spectrum Analyzer Measurements
3-1 Introduction
This chapter gives a brief overview of the Anritsu Field Master Pro spectrum analyzer and is intended to assist
you in your first use of the instrument. The purpose of this chapter is to provide a starting point for making
basic measurement setups. This chapter describes general instrument setup, including selecting the analyzer
and setting up frequency, bandwidth, amplitude, span, limit lines, and markers. After measurements are
taken, refer to Section 2-12 “File Management” and Section 3-25 “Saving and Recalling Measurements” for a
description of saving, recalling, and managing measurement files. For detailed information about other specific
measurements, refer to the appropriate chapter in this guide.
This spectrum analyzer measurements chapter includes sections that describe resolution bandwidth, video
bandwidth, sweep, and attenuator functions. For example, in the Field Master Pro, resolution bandwidth is
determined by the intermediate frequency (IF) filter bandwidth. The spectrum analyzer traces the shape of the
IF filter as it tunes past a signal. If more than one IF filter is used in a spectrum analyzer, then the narrowest
one dominates and is considered the resolution bandwidth.
Spectrum analyzer measurements include the use of additional functions beyond frequency, span, amplitude,
and marker functions. Section 3-16 through Section 3-20 cover field measurements including brief examples
demonstrating channel power, occupied bandwidth, adjacent channel power, and spectral emissions mask
testing.
3-2 Selecting the Analyzer
The instrument analyzers are selected from the 9-dot icon or the current measurement icon. To select an
analyzer, press the 9-dot icon in the title bar or the current measurement icon to display the available
analyzers, illustrated in Figure 3-1. Simply touch the desired icon to load the new analyzer. The analyzers
available for selection depend on the options that are installed and activated on your instrument. Some
measurements and views are accessed via other measurement setup menus.
Figure 3-1. Example Analyzers
MS2090A UG PN: 10580-00444 Rev. F 3-1
Page 66

3-3 Spectrum Analyzer GUI Overview Spectrum Analyzer Measurements
5
1
4
32
3-3 Spectrum Analyzer GUI Overview
This section illustrates the main graphical displays and menus presented for the spectrum analyzer.
Normal Spectrum View
Normal Spectrum view is the default view and is suitable for viewing signals in the frequency domain where
signal amplitude, bandwidth, and harmonic qualities can be studied. Select spectrum view from MEASURE >
VIEW > Normal. The sample display below is set up with a single trace enabled and with a marker and the
upper limit line envelope set.
Figure 3-2. Normal Spectrum View (1 of 2)
3-2 PN: 10580-00444 Rev. F MS2090A UG
Page 67

Spectrum Analyzer Measurements 3-3 Spectrum Analyzer GUI Overview
1. Status Panel: Each measurement features a unique status panel that displays settings and information relevant
to the current measurement and view settings.
2. Markers: Markers are displayed as green diamonds on the trace to which they are assigned. The active marker
is shown as a solid green diamond with a dashed vertical line. The marker amplitude and frequency will be
displayed in green text on the top left edge of the display. In this example, a marker is shown at the signal peak
with the marker table enabled. Double tap the marker to open a quick access peak search menu.
3. Limit Lines: Limit lines are shown as red (failing) or green (passing) lines with gray circles for each limit line
point. Limit lines can be set up point-by-point or by using the envelope feature to quickly set a sloped or square
envelope. The currently selected limit line point is shaded in gray. When limit lines are enabled, a pass/fail status
is shown in the upper right of the window. If the trace crosses the limit, the trace color will turn red and the limit
will indicate a failure. The limit is only applied to the active trace (see Section 3-10 “Setting Trace and Cursor
Parameters”), which is indicated next to the pass/fail.
4. Measurement Settings: The x-axis shows the start, center, and stop frequencies. The y-axis displays the
amplitude of the graticule lines. RBW/VBW, span, sweep time, and number of trace point settings are shown
along the bottom of the spectrum display. If either resolution bandwidth or video bandwidth is set to manual, the
“#” symbol will precede its label. If an offset frequency is entered, the offset value is displayed in the left side
status panel. Pressing any of the editable parameters opens the keypad to edit the value directly.
Information-only displays cannot be changed.
5. Multiple Trace Display: Each trace has a unique color and each can be set to Clear/Write, Average, Min or
Max Hold, Rolling Average, or Rolling Min or Max Hold. Each trace can have Peak, RMS/Average, or Negative
detectors. Traces can be set to Active, Hold/View, or Blank.
Figure 3-2. Normal Spectrum View (2 of 2)
MS2090A UG PN: 10580-00444 Rev. F 3-3
Page 68

3-3 Spectrum Analyzer GUI Overview Spectrum Analyzer Measurements
1
4
2
3
5
Spectrogram View
Spectrogram view is useful for identifying intermittent signals and for providing historical signal data in a
comprehensive view. It provides a multi-dimensional “waterfall” display representing frequency, time, and
amplitude. Frequency and time are shown on a typical two-dimensional scale while amplitude is displayed in
the color dimension. The color is set by adjusting the color range of the color bar.
Select Spectrogram view from MEASURE > VIEW > Spectrogram. Once Spectrogram view is selected, the
color bar can be configured from the SETUP menu. Refer to Section 3-15 “Measurement Setup” on page 3-48
for more information on setting up the Spectrogram view.
1. Color Bar: The color bar is used to adjust the colors displayed at different amplitude levels. The color bar shown
here represents the range of colors that will be displayed. This bar can be dragged up or down to adjust the
coverage area. If signals or noise is outside of the color bar range, then black is displayed. The color bar top and
bottom setting, and the overall hue to the color range is set via the “SETUP Menu (Spectrogram View)”
on page 3-48, which can be opened by pressing the color bar.
2. Spectrum Window: The upper display area shows spectrum trace data in the frequency domain. Up to six
traces can display data from different times depending on how the corresponding cursors are set in the
spectrogram display below. Note that the spectrum display shows trace amplitude (vertical axis) data in the time
(horizontal axis) domain.
3. Spectrogram Window: The lower display area shows spectrogram trace data in the time (vertical axis),
frequency (horizontal axis), and amplitude (color) domains. The bottom of the spectrogram displays the current
sweep at the current time (0 ms) or position 0. When a sweep completes, the entire display is shifted up and the
new trace is added to the bottom of the spectrogram. The spectrogram holds 142 sweeps (cursor positions) and
the stop time reflects the time taken to complete all of the sweeps.
4. Cursors (C1 to C6): Cursor information for the currently set cursor type (time or position) is shown in the status
panel. Cursors are shown on the spectrogram as white lines at the currently set cursor time or position. Refer to
“Cursors in Spectrogram View” on page 3-25.
5. Markers: Marker and marker data are shown in a variety of locations. Markers can be placed on different
cursors to help you compare measurements at different points in time as well as frequency. Refer to
“Spectrogram with Cursors and Markers” on page 3-38.
Figure 3-3. Spectrogram View
3-4 PN: 10580-00444 Rev. F MS2090A UG
Page 69

Spectrum Analyzer Measurements 3-4 Main Menu
3-4 Main Menu
The main menu is the primary access point for all instrument controls and measurement selections. The main
function for each main menu button is described below.
-
FREQ SPAN: Contains all frequency control settings such as center frequency, start and
stop frequency, span, frequency offset, and frequency step. Refer to Section 3-7 “Setting
Frequency Parameters”.
AMPLITUDE: Provides access to all amplitude-related settings including reference level,
graticule scale, and attenuator/preamp settings. Refer to Section 3-8 “Setting Amplitude
Parameters”.
BANDWIDTH: Provides access to resolution and video bandwidth settings and Auto
ratios, and sets the bandwidth filter types. Refer to Section 3-9 “Setting Bandwidth
Parameters”.
TRACE: Provides trace- and detection-related controls to set trace behaviors, presets,
and access to the trace/detector settings table. When in Spectrogram view, also provides
spectrogram cursor controls. Refer to Section 3-10 “Setting Trace and Cursor
Parameters”.
SWEEP: Provides controls for sweep behaviors, number of measurement points, and
gated sweep settings (with Option 90). Refer to Section 3-11 “Setting Sweep
Parameters”.
MARKER: Used to enable and set all marker-related parameters and provides access to
the marker table. Refer to Section 3-12 “Setting Up Markers”.
Figure 3-4. Main Menu
Using Menus
LIMIT: Provides controls for setting up limit lines and limit alarms. Refer to
Section 3-13 “Setting Up Limit Lines”.
TRIGGER: Controls the trigger source, delay and holdoff, and trigger slope settings.
Refer to Section 3-14 “Setting Up Triggering”.
MEASURE: Used to select measurements such as spectrum, channel power, occupied
bandwidth, adjacent channel power, spectral emissions mask, and opens the
spectrogram. Refer to Section 3-15 “Measurement Setup”.
SETUP: Measurement controls for setting up advanced measurements. This menu
always displays setting options for the current active measurement (refer to
Section 3-16 “Setting Up Advanced Measurements”). When in Spectrogram view,
provides access to the spectrogram color SETUP menu (refer to “SETUP Menu
(Spectrogram View)” on page 3-48).
PRESET: Opens the PRESET menu with selective trace, marker, limits, and
measurement preset commands, or an all inclusive analyzer preset command. Refer to
Section 3-24 “Presetting the Analyzer”.
FILE: Used to save and recall instrument setups and measurements, limit lines, and
screen images. Also provides access to save on event controls. Refer to “FILE Menu”
on page 3-71 and Section 2-12 “File Management”.
Instrument setup, control, and measurement functions are performed through the use of menus. Menu
behaviors are summarized below:
• Pressing a main menu button opens an associated menu.
• The name of the button pressed in the main menu is reflected in the title bar of the resulting menu.
• Menu buttons can change for various measurement settings, instrument setup parameters, and
measurement views.
MS2090A UG PN: 10580-00444 Rev. F 3-5
Page 70

3-4 Main Menu Spectrum Analyzer Measurements
• Pressing the corresponding main menu button for a menu closes the menu.
• Touching status data, a parameter field, or label in the display area opens the corresponding menu and
the associated keypad for editing that parameter setting.
• Pressing Accept, Cancel, or the X in the upper right corner closes the menu or keypad.
3-6 PN: 10580-00444 Rev. F MS2090A UG
Page 71

Spectrum Analyzer Measurements 3-5 Status Panel
3-5 Status Panel
The status panels and features illustrated in this section are unique to the spectrum analyzer and to the
particular measurement and view that is selected. Below is the spectrum analyzer status panel that covers
basic spectrum, spectrogram, channel power, occupied bandwidth, adjacent channel power, and spectral
emissions mask measurements (selected via MEASURE > MEASUREMENTS menu).
-
Pressing any of these parameters opens the associated menu with a keypad that allows
you to conveniently change the parameter value. These are the same settings found in
the right side menus.
AUTO MAX PWR: Displays in SEM measurements only. Enabling this automatically
calculates the reference channel power.
MANUAL MAX PWR: Displays in SEM measurements only. Used to manually enter the
reference channel power.
Refer to Section 3-20 “Spectrum Emission Mask” on page 3-56.
REF LEVEL: Sets the reference level of the top graticule line. If the reference level offset
is not zero, OFFSET REF LEVEL is displayed at this location.
SCALE/DIV: Sets the graticule scale/division.
REF LEVEL OFFSET: Compensates for the presence of external input attenuation or
gain.
Refer to Section 3-8 “Setting Amplitude Parameters” on page 3-15.
FREQ OFFSET: Accounts for frequency conversions outside of the analyzer. Refer to
Section 3-7 “Setting Frequency Parameters” on page 3-9.
ATTEN LEVEL: When auto attenuation is off, sets input attenuation.
PRE AMP: Toggles the low-noise front-end preamplifier on or off. Refer to
Section 3-8 “Setting Amplitude Parameters” on page 3-15.
TRACES/CURSORS: Displays the current status of up to six traces or cursors in a
quick-view summary. When the measurement view is set to Normal (Spectrum), trace
information is displayed in this area. When the measurement view is set to Spectrogram,
cursor information is displayed in this area. Cursors are only available in the Spectrum
measurement with the Spectrogram view selected.
The summary information includes the trace or cursor number, type, mode, and detector
type. The active trace will show a highlighted background with the mode and detector
type restated under the table. In Spectrogram, a reference trace (T0) will show you the
settings of the trace used to fill the spectrogram. The reference trace settings are applied
to all traces and cursors while in Spectrogram view. Pressing a trace or cursor in the
summary panel activates the pressed trace or cursor and opens the TRACE menu. It
allows you to select and set up an individual trace or cursor as desired. Refer to
Section 3-10 “Setting Trace and Cursor Parameters” on page 3-21.
SWEEP: Toggles the current sweep setting between continuously or sweep once. Refer
to Section 3-11 “Setting Sweep Parameters” on page 3-28.
FREQ REFERENCE: Indicates the current frequency reference source of Internal High
Accuracy (used after GPS has lost sync, but while the internal clock still has good GPS
reference), Internal Standard Accuracy, External, or GPS Hi Accuracy (requires GPS).
The instrument automatically selects the frequency reference in the following order of
priority: external, GPS, then the internal time base.
Figure 3-5. Spectrum Analyzer Status Panel
MS2090A UG PN: 10580-00444 Rev. F 3-7
Page 72

3-6 Making Spectrum Analyzer Measurements Spectrum Analyzer Measurements
3-6 Making Spectrum Analyzer Measurements
Initial Setup
• Connect a signal source to the RF port of the instrument. For over-the-air measurements, connect an
antenna that is appropriate for the frequency range to be measured.
• Select the spectrum analyzer. Refer to “Selecting the Analyzer” on page 3-1.
• Connect the input signal or antenna to the RF In test port. For connector descriptions, refer to
“Connector Panels” on page 2-3.
Figure 3-6. Field Master Pro Setup
3-8 PN: 10580-00444 Rev. F MS2090A UG
Page 73

Spectrum Analyzer Measurements 3-7 Setting Frequency Parameters
3-7 Setting Frequency Parameters
Frequency-related parameters are set using the “FREQ / SPAN Menu” on page 3-12. The tuning frequency
range can be entered in several different ways depending upon what makes the most sense, either for the user
or for the measurement. The center frequency and span can be specified, the start and stop frequencies can be
entered.
Entering Start and Stop Frequencies
The frequency settings are displayed along the bottom of the spectrum or spectrogram graph. These
parameters can be accessed directly or via the FREQ SPAN menu.
1. Press FREQ SPAN on the main menu.
2. Press START FREQUENCY to open the start frequency parameter entry keypad.
3. Enter the desired start frequency. When entering a frequency with the keypad, available frequency units
(GHz, MHz, kHz, and Hz) will be displayed along the left edge of the menu.
4. Press the appropriate frequency unit to terminate the entry or press ACCEPT to terminate the entry
with the current frequency unit.
5. Press STOP FREQUENCY to open the stop frequency parameter entry keypad.
6. Enter the desired stop frequency. When entering a frequency with the keypad, available frequency units
(GHz, MHz, kHz, and Hz) will be displayed along the left edge of the menu.
7. Press the appropriate frequency unit to terminate the entry or press ACCEPT to terminate the entry
with the current frequency unit.
To quickly move the start or stop frequency value up or down, press the + or – slider controls to
Note
The center frequency will be set to exactly the middle of the start and stop frequencies. The current settings
are shown along the bottom of the spectrum or spectrogram graph (see Figure 2-6 on page 2-11).
increment the frequency by the set FREQUENCY STEP. You can also drag the frequency using the
slider.
Entering a Center Frequency
1. Press FREQ SPAN on the main menu.
2. Press CENTER FREQUENCY to open the center frequency parameter entry keypad.
3. Enter the desired center frequency. When entering a frequency with the keypad, available frequency
units (GHz, MHz, kHz, and Hz) will be displayed along the left edge of the menu.
4. Press the appropriate frequency unit to terminate the entry or press ACCEPT to terminate the entry
with the current frequency unit.
To quickly move the center frequency value up or down, press the + or - slider controls to increment
Note
The current settings are shown along the bottom of the spectrum or spectrogram graph (see Figure 2-6
on page 2-11).
the center frequency by the set FREQUENCY STEP. You can also drag the center frequency using
the slider or by dragging the trace directly.
MS2090A UG PN: 10580-00444 Rev. F 3-9
Page 74

3-7 Setting Frequency Parameters Spectrum Analyzer Measurements
Using Offset Frequency
A user-defined frequency offset can be entered to adjust the frequency that is displayed on the instrument from
the actual swept frequency. For example, if the DUT is an antenna system receiving signals in the 10 GHz
range and offsetting the signals to the 1 GHz range, you can set a frequency offset in the spectrum analyzer in
order to display the actual received antenna frequency in the sweep window.
Both positive and negative offset values are allowed. Negative offsets can be useful for seeing differences from
expected values. Enter a negative offset of the expected value, and the received antenna frequency should
display in the 0 Hz range.
When enabled, the offset value is displayed at the left of the screen in the status panel (see Section 3-5 “Status
Panel”). To remove a frequency offset, open the FREQ SPAN menu and set FREQUENCY OFFSET to 0Hz.
You can also access this parameter directly from the left side status panel.
Note Offset frequency apply to start, stop, center, and marker frequencies.
Setting the Span
1. Press FREQ SPAN on the main menu.
2. Press SPAN to open the span frequency parameter entry keypad.
3. Enter the desired span frequency. When entering a frequency with the keypad, available frequency units
(GHz, MHz, kHz, and Hz) will be displayed along the left edge of the menu.
4. Press the appropriate frequency unit to terminate the entry or press ACCEPT to terminate the entry
with the current frequency unit.
5. To select full span, press the FULL SPAN. Selecting full span overrides any previously set start and stop
frequencies.
Note
To quickly move the span value up or down, press the + or - slider controls to increment the span in
a 1:2:5 sequence. You can also drag the span using the slider or by pinching the trace in or out.
Zero Span IF Output (Option 89)
Zero Span IF output effectively allows the spectrum analyzer to be used as a receiver front-end, converting the
input signal at the spectrum analyzer RF In connector to a signal centered at the IF output frequency. You can
then process the IF signal in a way that meets your needs. That may mean using an A-to-D converter or some
other signal processing method.
Zero Span IF Output provides an IF signal of 325 MHz with FFT capture bandwidth ≤ 32 MHz and 300 MHz
with FFT capture bandwidth = 100 MHz. The nominal RF output level is –4 dBm with a 10 MHz, –20 dBm
input, and with 0 dB input attenuation and preamp off. The spectrum can be inverted in certain RF input
bands. The IF output signal is present only when the spectrum analyzer span is set to ZERO SPAN and the
IF OUTPUT is toggled on (see “FREQ / SPAN Zero Span Menu” on page 3-13). You can select the IF output
bandwidth of 750 kHz, 7.5 MHz, 14 MHz, 30 MHz, or 100 MHz using the “IF OUTPUT Menu” on page 3-13.
Note The selectable bandwidth values may differ among instrument models and options.
Tab le 3-1.
Selected IF Filter Bandwidth IF Output Frequency
100 MHz 300 MHz
30 MHz 325 MHz
14 MHz 325 MHz
7.5 MHz 325 MHz
750 kHz 325 MHz
3-10 PN: 10580-00444 Rev. F MS2090A UG
Page 75

Spectrum Analyzer Measurements 3-7 Setting Frequency Parameters
The normal IF BW uses analog bandpass filters in the normal RBW chain. By changing the RBW, different
filter bandwidths are selected. While the IF bandwidth is influenced by the selection of RBW filters, the digital
RBW filters themselves are not employed.
The spectrum analyzer has several mixer bands. Depending on the operating frequency, the local oscillator
may be above or below the input frequency. When the local oscillator frequency is below the input frequency,
an increase in the input frequency results in an increase in the IF output frequency. When the local oscillator
is above the input frequency, an increase in the input frequency moves it closer to the local oscillator frequency
and the IF output frequency consequently decreases. The following table shows the bands and indicates where
the LO frequency is, in relation to the RF frequency.
Table 3-2. IF Inversion Bands
RF Band Start Frequency (MHz) Stop Frequency (MHz) Spectrum Inversion
1 0 5350 Y
2 5350 7200 Y
3 7200 9200 Y
4 9200 11100 N
5 11100 13000 N
6 13000 16500 N
7 16500 20400 Y
8 20400 26950 Y
9 26950 33810 Y
10 33810 39900 Y
11 39900 47000 N
12 47000 54000 N
“Inverted” means that the IF is spectrally inverted from the input (as the input frequency goes higher, the IF goes lower).
“Not Inverted” means that the IF is not spectrally inverted (as the input frequency goes higher, the IF goes higher).
You need to take frequency inversion into account when processing the IF signal. Assuming that the IF has
been processed to yield I and Q data, inversion is easily done by swapping I and Q.
A residual frequency offset of the IF may exist compared to the RF due to the resolution of the first and second
local oscillators. This offset is usually on the order of several kHz, but may be up to 10 kHz or so. To determine
the residual offset, you need a second spectrum analyzer or a frequency counter.
1. Attach a signal source (or antenna) to the spectrum analyzer and set the center frequency to the center of
the signal being received.
2. Set Zero Span from the FREQ/SPAN menu, and then press IF OUTPUT and enable the IF output.
3. Attach a second spectrum analyzer to the IF Out port and set the center frequency to 300 (or 325) MHz.
4. Set the span of the second spectrum analyzer to 100 kHz with the resolution needed to be able to
measure an offset that may be 25 kHz or less.
5. Measure the frequency of the IF signal to see how far the signal is offset from 300 (or 325) MHz.
MS2090A UG PN: 10580-00444 Rev. F 3-11
Page 76

3-7 Setting Frequency Parameters Spectrum Analyzer Measurements
FREQ / SPAN Menu
-
CENTER FREQUENCY: Sets the center frequency of the sweep range. The current
span setting will remain constant or will be adjusted to accommodate the start and stop
frequency range of the instrument. The center frequency can also be dragged on the
display when gestures are not toggled off.
SPAN: Sets the sweep frequency range. The current center frequency will remain
constant and the start and stop frequencies will be adjusted to accommodate the new
range. Pressing the plus (+) or minus (–) control increments the span value in a 1:2:5
sequence. The span can also be changed by pinching the trace in or out when gestures
are not toggled off.
FULL SPAN: Pressing this button sets the span to cover the entire tunable spectrum of
the instrument.
LAST SPAN: Pressing this button returns the span to the previously set span value.
ZERO SPAN: Sets the analyzer to zero span and enables the “FREQ / SPAN Zero Span
Menu” on page 3-13.
START FREQUENCY: Sets the start frequency of the sweep range. The center
frequency and span will be adjusted to accommodate the new start and current stop
frequencies. Pressing the plus (+) or minus (–) control moves the start frequency in steps
defined by the FREQUENCY STEP value.
STOP FREQUENCY: Sets the stop frequency of the sweep range. The center frequency
and span will be adjusted to accommodate the current start and new stop frequencies.
Pressing the plus (+) or minus (–) control moves the start frequency in steps defined by
the FREQUENCY STEP value (set lower in this menu).
FREQUENCY STEP: Sets the frequency step value used for the plus (+) or minus (–)
control.
FREQUENCY OFFSET: The frequency offset value accounts for frequency conversions
outside of the analyzer. The offset frequency value is added to the start, stop, center,
fixed marker, and normal marker frequencies. Pressing the plus (+) or minus (–) control
moves the offset frequency in steps defined by the FREQUENCY STEP value.
GESTURES: Opens the “GESTURES Menu” on page 3-14.
Figure 3-7. FREQ / SPAN Menu
3-12 PN: 10580-00444 Rev. F MS2090A UG
Page 77
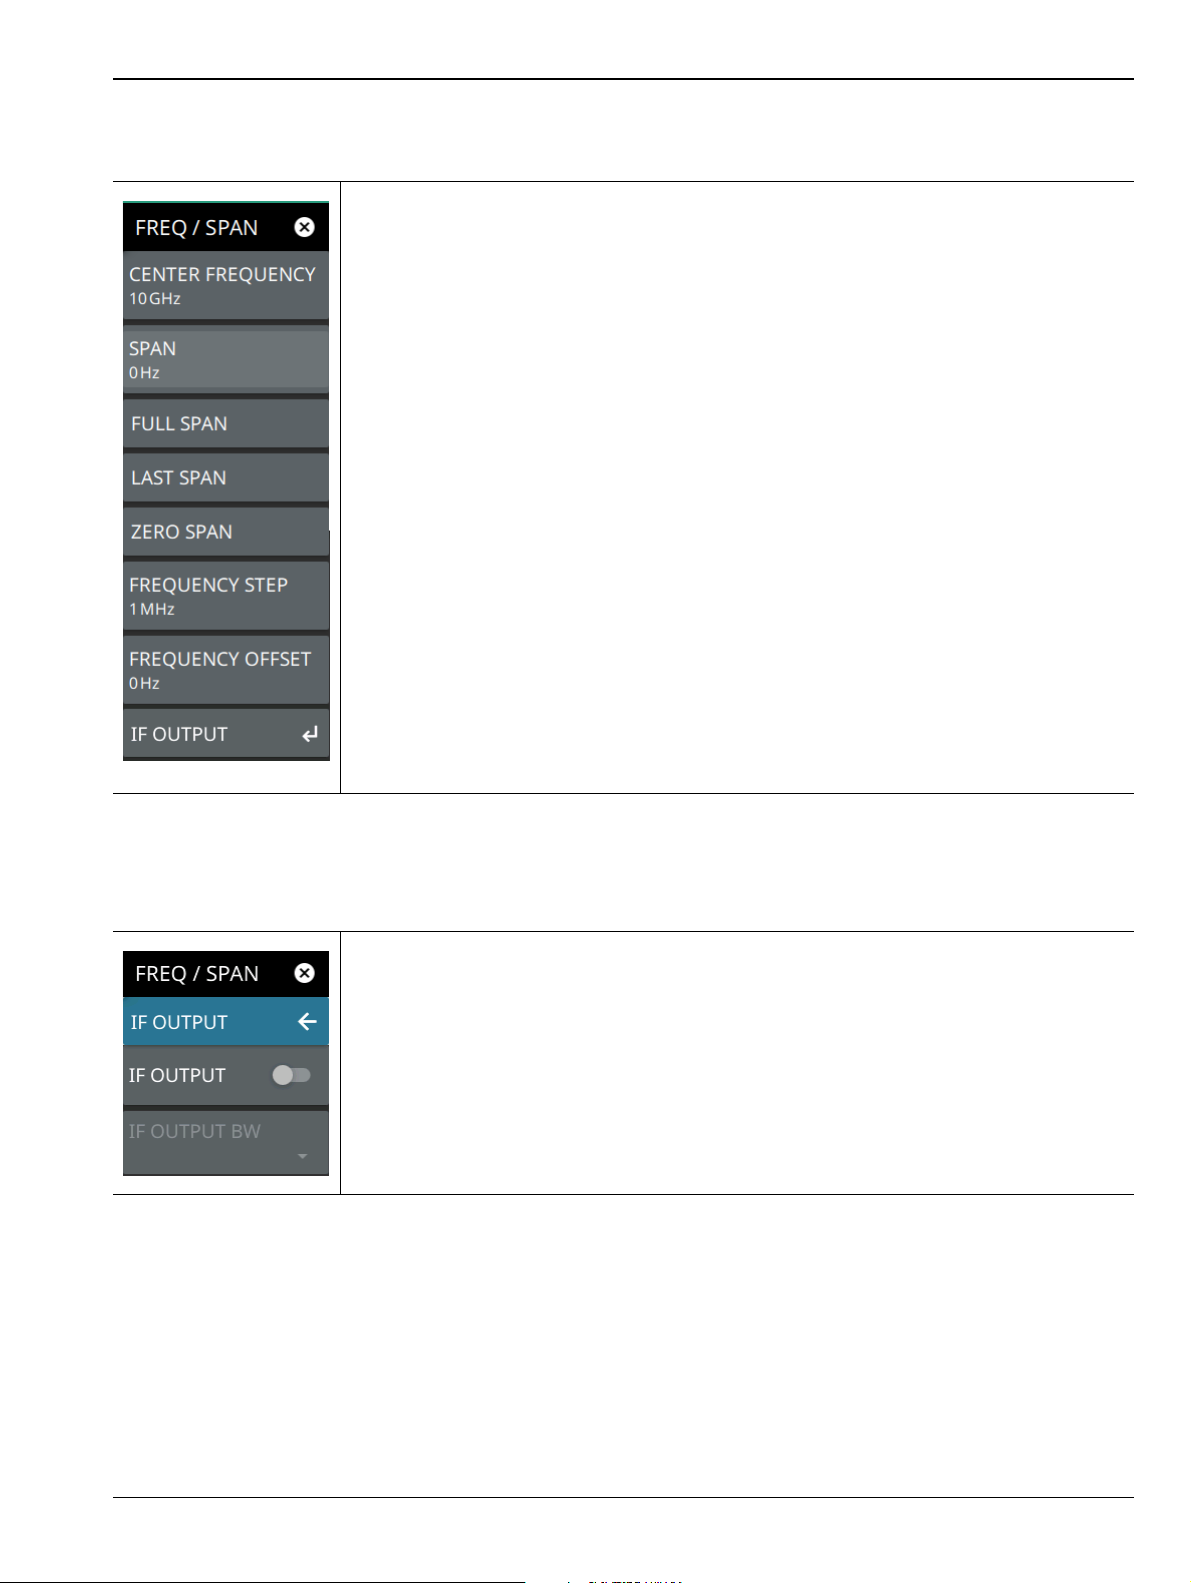
Spectrum Analyzer Measurements 3-7 Setting Frequency Parameters
FREQ / SPAN Zero Span Menu
-
CENTER FREQUENCY: Sets the center frequency of the sweep range. The current
span setting will remain constant or will be adjusted to accommodate the start and stop
frequency range of the instrument. The center frequency can also be dragged on the
display when gestures are not toggled off.
SPAN: Sets the sweep frequency range. The current center frequency will remain
constant and the start and stop frequencies will be adjusted to accommodate the new
range. Pressing the plus (+) or minus (–) control increments the span value in a 1:2:5
sequence. The span can also be changed by pinching the trace in or out when gestures
are not toggled off.
FULL SPAN: Pressing this button sets the span to cover the entire tunable spectrum of
the instrument.
LAST SPAN: Pressing this button returns the span to the previously set span value.
ZERO SPAN: Sets the analyzer to zero span and enables the “FREQ / SPAN Zero Span
Menu” on page 3-13.
FREQUENCY STEP: Sets the frequency step value used for the plus (+) or minus (–)
control.
FREQUENCY OFFSET: The frequency offset value accounts for frequency conversions
outside of the analyzer. The offset frequency value is added to the start, stop, center,
fixed marker, and normal marker frequencies. Pressing the plus (+) or minus (–) control
moves the offset frequency in steps defined by the FREQUENCY STEP value.
IF OUTPUT: Opens the “IF OUTPUT Menu” on page 3-13. Requires Option 89.
Figure 3-8. FREQ / SPAN Menu
IF OUTPUT Menu
-
IF OUTPUT: Toggles the top panel IF output on or off. When IF output is on, the IF
OUTPUT BW button becomes active.
IF OUTPUT BW: When IF output is on, this button provides a list of IF output bandwidth
settings.
Figure 3-9. IF OUTPUT Menu
MS2090A UG PN: 10580-00444 Rev. F 3-13
Page 78
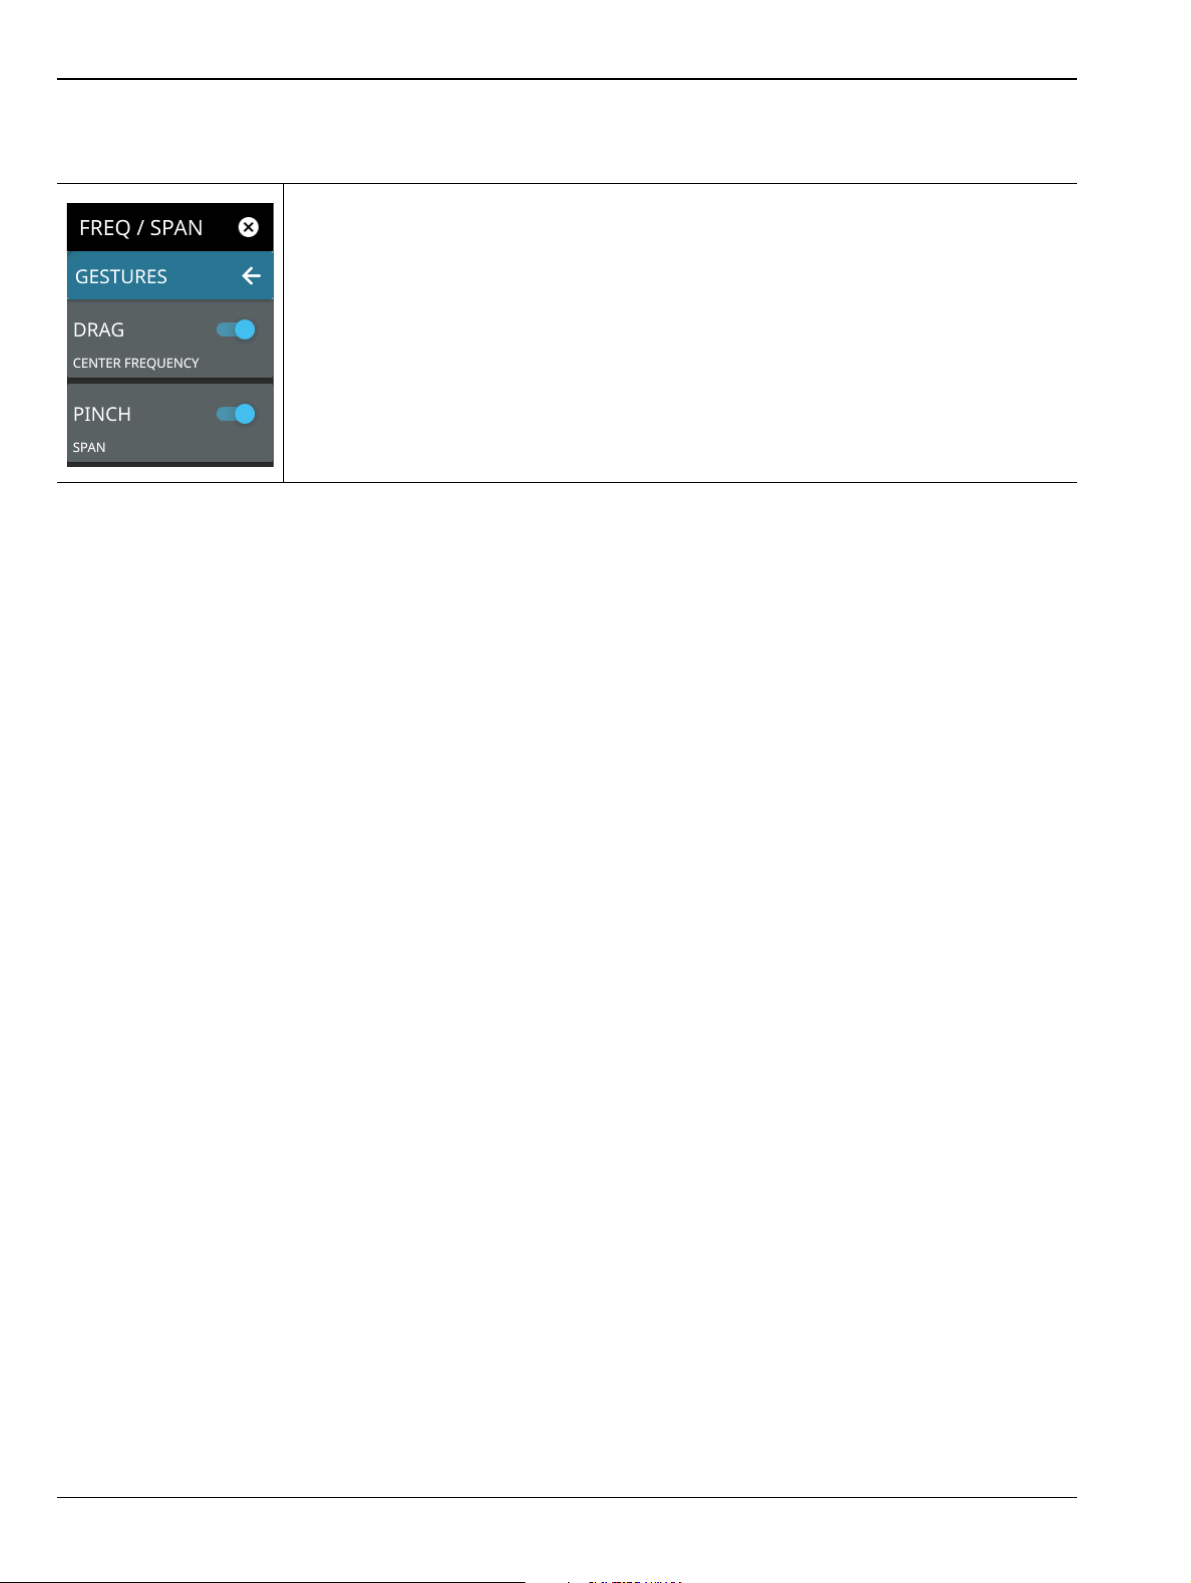
3-7 Setting Frequency Parameters Spectrum Analyzer Measurements
GESTURES Menu
-
DRAG: Toggles the touchscreen drag feature on or off. When toggled off, the center
frequency will not change when dragging the spectrum display. This can be useful when
dragging markers.
PINCH: Toggles the touchscreen pinch feature on or off. When toggled off, the span
frequency will not change when pinching the spectrum display. This can be useful when
dragging markers.
Note that the Drag and Pinch features can also be toggled on/off by touching the locks
under the display.
Figure 3-10. GESTURES Menu
3-14 PN: 10580-00444 Rev. F MS2090A UG
Page 79

Spectrum Analyzer Measurements 3-8 Setting Amplitude Parameters
3-8 Setting Amplitude Parameters
Amplitude-related parameters are set using the “AMPLITUDE Menu” on page 3-17.
Setting Amplitude Reference Level
The amplitude reference level is typically an absolute reference level set at the top of the graticule for the
power level being measured. Signal levels above this set value will be outside of the display range and may
overdrive and saturate the input circuit (refer to “Indications of Excessive Signal Level” on page 3-16). To set
the current amplitude reference level:
1. To automatically set an optimum reference level, press AMPLITUDE > AUTO REF LEVEL.
2. To manually set the reference level, press AMPLITUDE > REF LEVEL, then enter the desired reference
level in dBm.
Note
Select AUTO ATTEN coupling of the attenuator setting and AUTO REF LEVEL to help ensure that
harmonics and spurs are not introduced into the measurements.
Setting Amplitude Range and Scale
This setting applies to most analyzer modes of instrument operation and allows you to set the y-axis graticule
scale.
1. Press AMPLITUDE > SCALE/DIV and enter the desired number of units per division (dB/division).
2. Set the desired y-axis amplitude units. Currently, dBm is the only available selection.
Reference Level Offset for External Loss or External Gain
To obtain accurate measurements, you can compensate for any external attenuation or gain by using a
reference level offset. The compensation factor is in dB. External attenuation can be created by using an
external cable or an external high power attenuator. External gain is typically from an amplifier.
To adjust the reference or amplitude level for either gain or loss:
1. Press AMPLITUDE > REF LEVEL OFFSET.
2. Enter a positive dB value to account for gain or enter a negative dB value to account for loss.
3. The new reference level offset value will be displayed on the instrument and the y-axis and trace
amplitude is adjusted accordingly.
Attenuator Functions
The spectrum analyzer includes a step attenuator at the RF input. This attenuator is used to reduce large
signals to levels that make best use of the analyzer’s dynamic range. By default, the auto attenuation
automatically adjusts the attenuator as a function of the reference level. In the AMPLITUDE menu, the
ATTEN LEVEL allows manual adjustment of the input attenuation. When auto attenuation is selected, both
the reference level and the attenuation are increased. The following actions, listed in decreasing order of
effectiveness, can facilitate the detection of low-level CW signals:
• Decrease the reference level and attenuation. Refer to “AMPLITUDE Menu” on page 3-17.
• Turn on the preamplifier.
• Reduce RBW and or VBW (RBW/VBW = 10 is often optimal for this purpose). Refer to “Setting
Bandwidth Parameters” on page 3-18.
• Use trace averaging if VBW is already set to 1 Hz. Refer to “Setting Trace and Cursor Parameters”
on page 3-21
MS2090A UG PN: 10580-00444 Rev. F 3-15
Page 80

3-8 Setting Amplitude Parameters Spectrum Analyzer Measurements
2
1
Preamplifier
The preamplifier can be turned on and off by toggling PRE AMP via the status panel or the AMPLITUDE
menu. Figure 3-11 shows the noise floor with the preamplifier off (1) and on (2). Note that when the
preamplifier is turned on, the noise floor drops significantly and a low-level signal is exposed. In order to use
the preamplifier, the attenuation must be lower than 20 dB. If the preamplifier is turned on when the
attenuation is greater than or equal to 20 dB, the attenuation will automatically drop to 10 dB. When AUTO
ATTEN is toggled on, the REF LEVEL must be set to –40 dBm or lower to enable the preamplifier.
Figure 3-11. 1. Preamplifier Off
2. Preamplifier On
Indications of Excessive Signal Level
The Field Master Pro has built-in features to help prevent input overload. These include auto attenuation and
reference level. The instrument will also indicate when a received signal is too high for the current setup by
displaying an “ADC Overrange” notification in the title bar (Figure 3-12). Before proceeding with the
measurements, adjust the reference level, the attenuation level, and disable the preamplifier if necessary.
Adjusting the resolution bandwidth and frequency range may also help when measuring small signals that are
near large signals.
Figure 3-12. ADC Overrange
3-16 PN: 10580-00444 Rev. F MS2090A UG
Page 81

Spectrum Analyzer Measurements 3-8 Setting Amplitude Parameters
AMPLITUDE Menu
REF LEVEL: The reference level is the top graticule line on the measurement display. If
the reference level offset is not zero, the offset reference level is displayed at this
location. Pressing the plus (+) or minus (–) control increments the value by 10. The
plus/minus (+/-) button on the keypad toggles between positive and negative values.
AUTO REF LEVEL: Auto reference level automatically adjusts the reference level to
place the highest signal amplitude at about two graticule lines from the top based on the
position of the trace at the time the button is pressed.
SCALE/DIV: The scale can be set from 1 dB per division to 15 dB per division. The
default setting is 10 dB. Pressing the plus (+) or minus (–) control changes the value by 1.
Y AXIS UNIT: Selects the y-axis amplitude units of dBm or dBW.
REF LEVEL OFFSET: Reference level offset compensates for the presence of external
input attenuation or gain. The offset is applied to all amplitude related parameters and to
measurements such as the y-axis scale and marker measurements. The default offset
value is 0 dB. Pressing the plus (+) or minus (–) control increments the value by 10. The
plus/minus (+/-) button on the keypad toggles between positive and negative values.
Refer to “Reference Level Offset for External Loss or External Gain” on page 3-15.
PRE AMP: Turns the low-noise front-end preamplifier on or off. To ensure accurate
measurement results, the largest signal into the instrument input when the preamplifier is
turned on should be less than –40 dBm. The preamplifier cannot be turned on if auto
attenuation is on and the reference level is above –40 dBm. Refer to “Preamplifier”
on page 3-16.
AUTO ATTEN: Input attenuation can be either tied to the reference level (on) or
manually selected (off). When input attenuation is tied to the reference level, attenuation
is increased as higher reference levels are selected to make sure the instrument input
circuits are not saturated by large signals that are likely to be present when high
reference levels are required.
ATTEN LEVEL: When auto attenuation is off, the attenuation value can be set manually
to a resolution of 5 dB. Pressing the plus (+) or minus (–) control increments the value by
10.
FIELD STRENGTH: Opens the “AMPLITUDE FIELD STRENGTH Menu” on page 3-62.
Refer to Section 3-22 “Field Strength” on page 3-61 for a description of the measurement.
Figure 3-13. AMPLITUDE Menu
MS2090A UG PN: 10580-00444 Rev. F 3-17
Page 82

3-9 Setting Bandwidth Parameters Spectrum Analyzer Measurements
3-9 Setting Bandwidth Parameters
Bandwidth parameters are set using the “BANDWIDTH Menu” on page 3-20.
Resolution Bandwidth
Resolution Bandwidth (RBW) determines frequency selectivity. The spectrum analyzer traces the shape of the
RBW filter as it tunes past a signal. The choice of resolution bandwidth depends on several factors. Filters take
time to settle. The output of the filter will take some time to settle to the correct value so that it can be
measured. The narrower the filter bandwidth (resolution bandwidth), the longer the settling time needs to be,
and therefore, the slower the sweep speed.
The choice of resolution bandwidth will depend upon the signal being measured. If two closely-spaced signals
are to be measured individually, then a narrow bandwidth is required. If a wider bandwidth is used, then the
energy of both signals will be included in the measurement. Thus, the wider bandwidth does not have the
ability to look at frequencies selectively, but instead simultaneously measures all signals falling within the
resolution bandwidth. Therefore, a broadband measurement would include all signals and noise within the
measurement bandwidth into a single measurement.
On the other hand, a narrow-band measurement will separate the frequency components, resulting in a
measurement that includes separate peaks for each signal. There are advantages to each. The ultimate
decision will depend upon the type of measurement required.
There is always some amount of noise present in a measurement. Noise is often broadband in nature; that is, it
exists at a broad range of frequencies. If the noise is included in the measurement, the measured value could be
in error (too large) depending upon the noise level. With a wide bandwidth, more noise is included in the
measurement. With a narrow bandwidth, less noise enters the resolution bandwidth filter, and the
measurement is more accurate. If the resolution bandwidth is narrower, the noise floor will drop on the
spectrum analyzer display. As the measured noise level drops, smaller signals that were previously obscured
by the noise might now be measurable.
Video Bandwidth
Spectrum analyzers typically use another type of filtering after the detector that is called video filtering. This
filter also affects the noise on the display, but in a different manner than the resolution bandwidth. In video
filtering, the average level of the noise remains the same, but the variation in the noise is reduced. Therefore,
the effect of video filtering is a “smoothing” of the signal noise. The resultant effect on the analyzer’s display is
that the noise floor compresses into a thinner trace, while the average position of the trace remains the same.
Changing the video bandwidth (VBW) does not improve sensitivity, but it does improve discernibility and
repeatability when making low-level measurements. As a general rule, most field spectrum analyzer
measurements are made at a video bandwidth that is a factor of 10 to 100 less than the resolution bandwidth.
Using this ratio, with a resolution bandwidth of 30 kHz, typically, the video bandwidth is set between 300 Hz
and 3 kHz, although it can be set anywhere from 1 Hz to 10 MHz.
3-18 PN: 10580-00444 Rev. F MS2090A UG
Page 83

Spectrum Analyzer Measurements 3-9 Setting Bandwidth Parameters
Setting Frequency Bandwidth
1. Press BANDWIDTH on the main menu.
2. Toggle AUTO RBW or AUTO VBW (or both) off to manually change values. If using Auto, refer to the
following sections.
3. Set the RBW and VBW to achieve the desired resolution and sweep characteristics. Lower values
increase resolution and reduce noise, but at the expense of measurement (sweep) speed.
4. Set the VBW TYPE to Logarithmic (geometric mean) or Linear (arithmetic mean).
Setting Bandwidth Auto Coupling
Both resolution bandwidth and video bandwidth can be coupled to the frequency span automatically, or set
manually. When set to Auto RBW, the instrument automatically adjusts the RBW in proportion to the
frequency span. The default ratio of the span width to the resolution bandwidth is 100:1 and can be changed as
follows:
1. Press BANDWIDTH on the main menu.
2. Press SPAN:RBW and change the coupling value, and then press ACCEPT to enter the value.
When auto-coupling between the span and RBW is selected (AUTO RBW is toggled on), the bandwidth
parameter is displayed normally at the bottom of the graph. If manual RBW is selected (AUTO RBW is toggled
off), the bandwidth label at the bottom of the graph is prefixed with the ‘#’ symbol, and resolution bandwidth is
set independently of the span.
Auto coupling VBW links the video bandwidth to the resolution bandwidth so that VBW varies in proportion to
RBW. If manual VBW coupling is selected, the VBW label at the bottom of the graph is prefixed with the “#”
symbol and video bandwidth is set independently of resolution bandwidth.
By default, the RBW/VBW ratio is set to 3 and can be changed as follows:
1. Press BANDWIDTH on the main menu.
2. Press RBW/VBW and enter the desired value.
The RBW range varies with instrument features. Refer to “BANDWIDTH Menu” on page 3-20 and check your
technical data sheet for the bandwidth range of your instrument.
MS2090A UG PN: 10580-00444 Rev. F 3-19
Page 84

3-9 Setting Bandwidth Parameters Spectrum Analyzer Measurements
BANDWIDTH Menu
AUTO RBW: When toggled on, the instrument selects the resolution bandwidth based
on the current span width. The ratio of span width to RBW can be specified using the
SPAN:RBW button. When toggled off (manual), the RBW label at the left edge of the
x-axis will be preceded by the “#” symbol.
RBW: The current resolution bandwidth is displayed under the RBW button. Once auto
RBW is toggled off, the RBW can be changed using the keypad or the slider controls.
Bandwidth values increment in a 1:3:10 sequence, from 1 Hz to 3 Hz to 10 Hz or from
10 Hz to 30 Hz to 100 Hz, for example. Refer to your instrument technical data sheet for
the resolution bandwidth range.
AUTO VBW: When toggled on, the instrument selects the video bandwidth based on the
resolution bandwidth. The ratio of video bandwidth to resolution bandwidth can be set
using the RBW:VBW button. When toggled off (manual), the VBW label at the left edge of
the X-axis will be preceded by the “#” symbol.
VBW: The current video bandwidth is displayed under the VBW button. Once auto VBW
is toggled off, the VBW can be changed using the keypad or slider controls. Bandwidth
values increment in a 1:3:10 sequence, from 1 Hz to 3 Hz to 10 Hz or from 10 Hz to
30 Hz to 100 Hz, for example. Refer to your instrument technical data sheet for the video
bandwidth range.
VBW TYPE: Toggles between linear averaging (arithmetic mean) and logarithmic
averaging (geometric mean).
RBW:VBW: This parameter displays the ratio between resolution bandwidth and video
bandwidth. To change the ratio, press this button and use the keypad or the slider
controls.
SPAN:RBW: Displays the ratio between the span and the resolution bandwidth. The
default value is 100, meaning that the span will be 100 times the resolution bandwidth. To
change the ratio, press this button and use the keypad or slider controls.
Figure 3-14. BANDWIDTH Menu
3-20 PN: 10580-00444 Rev. F MS2090A UG
Page 85

Spectrum Analyzer Measurements 3-10 Setting Trace and Cursor Parameters
2 3 4 5 6
1
3-10 Setting Trace and Cursor Parameters
Field Master Pro can display up to 6 traces simultaneously. Traces can be enabled from the TRACE menu by
selecting the trace from the available selections, or you can select a trace in the Status panel to make it active.
Each trace can have a separate trace type, mode, and detector. When working with traces in normal spectrum
view, refer to “TRACE Menu (Spectrum View)” on page 3-22. When working with traces and cursors in
Spectrogram view, refer to “TRACE Menu (Spectrogram View)” on page 3-26 and “TRACE CURSOR Menu”
on page 3-27.
Traces in Spectrum View
The screenshot below shows the MS2090A with all six traces enabled on a signal, each with a different trace or
detector type setting. The left side status panel shows a trace setup summary table. Touching one of the trace
rows in the table will enable the trace and open the TRACE menu.
1. Clear/Write and Peak Detection: This is the default trace setting. The trace is cleared during each sweep and the
largest measurement point is used for each display point.
2. Max Hold and Peak Detection: Each trace point retains its maximum value and the largest measurement point is
used for each display point.
3. Min Hold and Negative Detection: Each trace point retains its minimum value and the smallest measurement
point is used for each display point.
4. Clear/Write and Negative Detection: Trace points are cleared during each sweep and the smallest measurement
point is used for each display point.
5. Average and RMS/Average Detection: The trace points are an average of the previous N sweeps, where N is
the AVERAGES setting. RMS/Average detection depends on the video bandwidth type setting (BANDWIDTH >
VBW TYPE): When VBW/AVERAGE type is set to Linear, this method detects the average power of
measurement points that go into the display point. When VBW/AVERAGE type is set to Logarithmic, the
traditional average of log (power) is displayed.
6. Rolling Average: The rolling average of the last N traces, where N is the AVERAGES setting.
Figure 3-15. Traces in Spectrum View
MS2090A UG PN: 10580-00444 Rev. F 3-21
Page 86

3-10 Setting Trace and Cursor Parameters Spectrum Analyzer Measurements
TRACE Menu (Spectrum View)
SELECT: Selects traces 1 through 6. Selecting a trace that is off turns the trace on. The
trace type will be Clear/Write, the trace mode will be Active, and the detector type will be
Peak. Selecting a trace will draw the trace on top of all other traces. This feature is not
available in the spectrogram measurement view because all spectrogram data is created
from a single trace.
TYPE: Selects one of the following types of traces:
• Clear/Write: Clears the trace after each sweep is complete and writes a new trace.
•Average: The average of all N traces, where N is the AVERAGES number set
below. The number of sweeps is displayed in the status panel TRACES table.
•Max Hold: Represents the maximum value since sweeping began. The number of
sweeps is displayed in the status panel TRACES table.
• Min Hold: Represents the minimum value since sweeping began. The number of
sweeps is displayed in the status panel TRACES table.
• Rolling Average: Is the rolling average of the last N traces, where N is the
AVERAGES number set below. The number of sweeps is displayed in the status
panel TRACES table.
• Rolling Max Hold: Is the maximum rolling average value of the last N traces,
where N is the AVERAGES number set below. The number of sweeps is displayed
in the status panel TRACES table.
• Rolling Min Hold: Is the minimum value of the last N traces, where N is the
AVERAGES number set below. The number of sweeps is displayed in the status
panel TRACES table.
TRACE MODE: Selects one of the following trace modes:
• Active: Displays the selected trace as it is updating.
• Hold/View: Displays the trace and it is not updating. It displays the last sweep from
when the trace mode was set to hold/view. If the frequency or bandwidth settings
are changed while a trace is in hold/view mode, the data will be blanked from the
screen. In order to see data again, set the trace mode to active.
•Blank: Does not display the trace and is not updating. It is the same as if the trace
was off.
Figure 3-16. TRACE Menu (1 of 2)
3-22 PN: 10580-00444 Rev. F MS2090A UG
Page 87

Spectrum Analyzer Measurements 3-10 Setting Trace and Cursor Parameters
DETECTOR TYPE: Selects one of the available detector types. Several detection
methods tailor the function of the instrument to meet specific measurement requirements.
There are often more measurement points across the screen than display points. The
various detection methods are different ways of showing each display point (see “Trace
Detector Types” on page 3-24).
• Peak: Shows the maximum amplitude of sampled data for each display point,
assuring that a narrow peak is not missed.
•RMS/Avg: In the default case, when the VBW/AVERAGE type is set to Linear, this
method shows the linear average amplitude of sampled data for each display point,
before converting to display units. When VBW/AVERAGE type is set to Log, this
method shows the traditional average of log (power), such as dBm, for each
display point, before converting to display units. Not available in ZERO SPAN.
• Negative: Shows the minimum amplitude of sampled data for each display point.
This method is also useful when measuring modulated signals to see if some
frequencies are not being used.
CLEAR: Clears the currently active trace data.
AVERAGES: Sets the number of trace sweeps (N) to average. Available when the trace
type is set to one of the averaging modes.
PRESET DETECTORS: Sets all trace detectors to Peak.
PRESET TRACES: Presets cursor and trace setup to Clear/Write, Active, with Peak
Detector.
Figure 3-16. TRACE Menu (2 of 2)
MS2090A UG PN: 10580-00444 Rev. F 3-23
Page 88
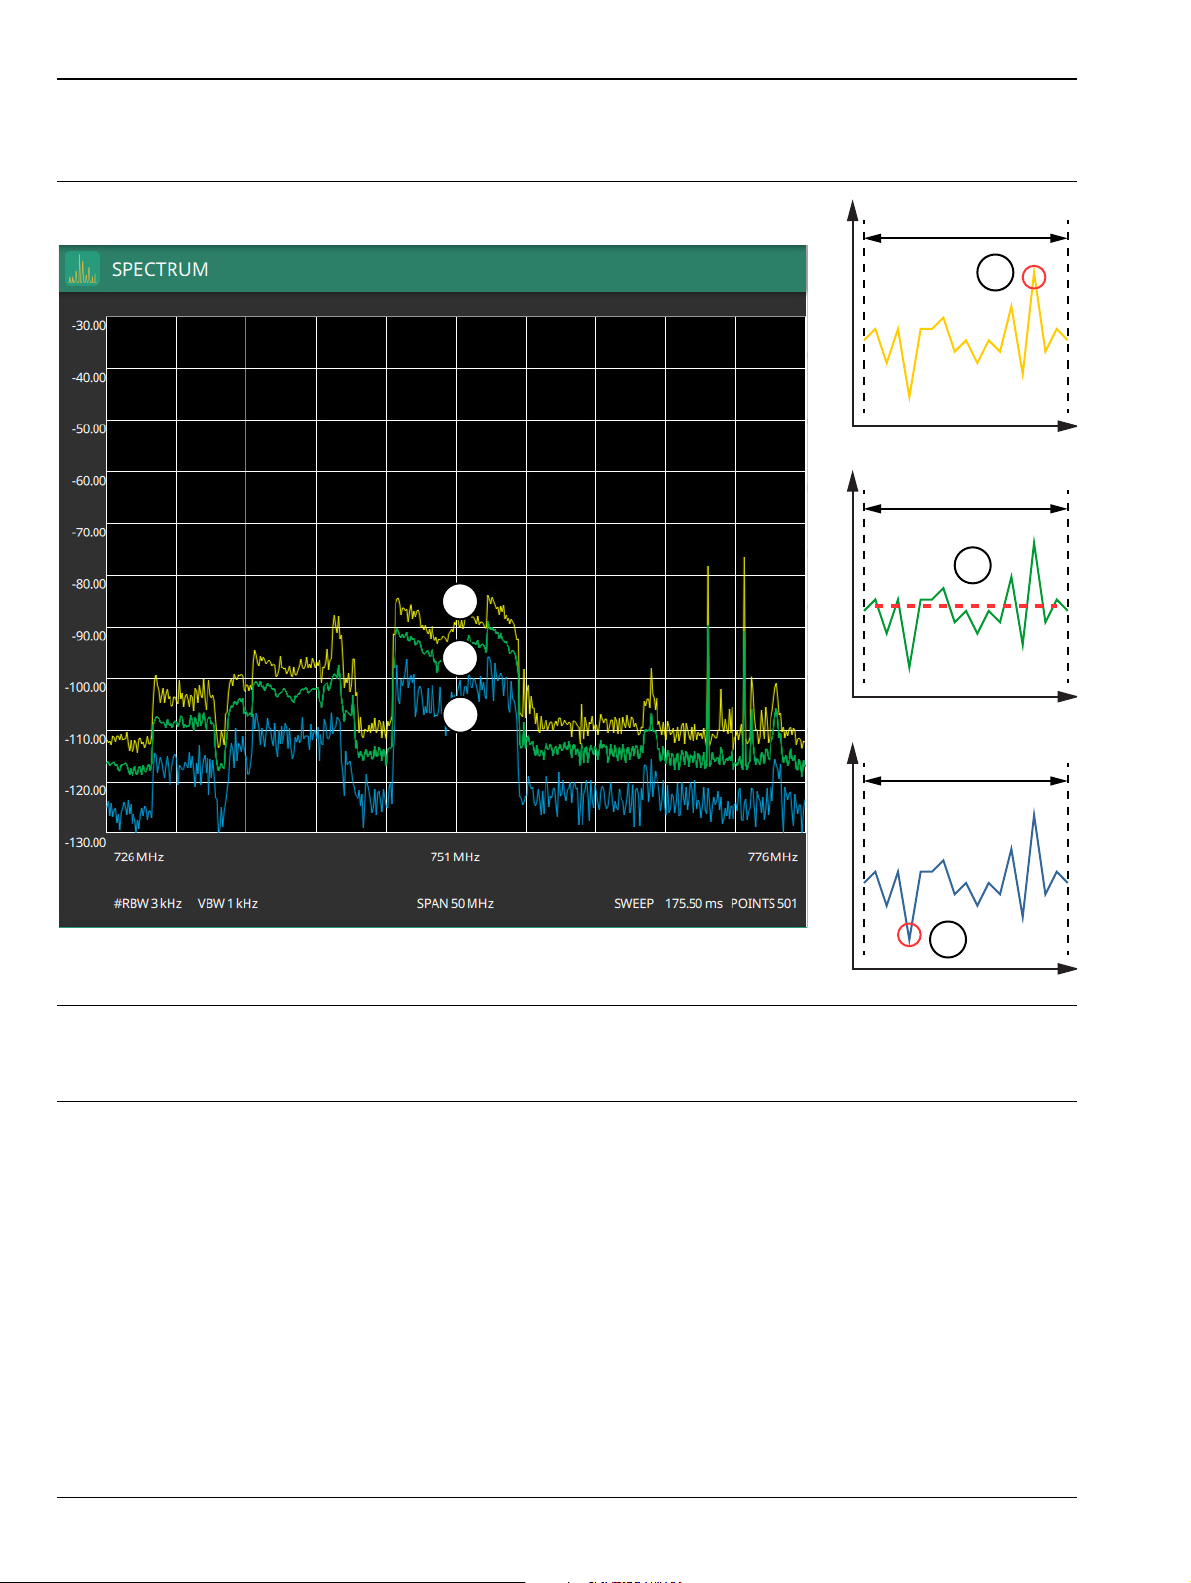
3-10 Setting Trace and Cursor Parameters Spectrum Analyzer Measurements
1
3
2
1
3
2
Time
Sampled Frequency Point Data
Amplitude
Time
Sampled Frequency Point Data
Amplitude
Time
Sampled Frequency Point Data
Amplitude
Trace Detector Types
The figure below shows the available detector types:
1. Yellow trace set to Peak detection.
2. Green trace set to RMS/Ave detection.
3. Blue trace set to Negative detection.
Figure 3-17. Trace Detector Types
3-24 PN: 10580-00444 Rev. F MS2090A UG
Page 89

Spectrum Analyzer Measurements 3-10 Setting Trace and Cursor Parameters
2 3
4
1
Cursors in Spectrogram View
The screenshot below shows the MS2090A with all six cursors enabled on a signal. Cursors are shown on the
spectrogram as white lines. The active cursor is a solid white line and other cursors show as dashed white
lines. Cursors can be directly selected and dragged to position on the display or set via the TRACE > CURSOR
menu. Cursors and their settings can also be accessed via the left side status panel by touching a cursor in the
CURSORS table. The START time is the most recently completed sweep and the beginning of the spectrogram
display. The STOP time is the total time length of the spectrogram, essentially the amount of time it takes for
all completed sweeps to progress from the bottom to the top of the spectrogram window. The stop time will vary
depending on the sweep speed, which can be faster or slower depending on settings such as span and RBW.
1. Color Bar settings are used to adjust the colors displayed at different amplitude levels. The color bar shown here
represents the range of colors that will be displayed. This bar can be dragged up or down to adjust the coverage
area. If signals or noise is outside of the color bar range, then black is displayed. The color bar top and bottom
setting, and the overall hue to the color range is set via the “SETUP Menu (Spectrogram View)” on page 3-48.
2. The traces shown in Spectrogram view are updated when the data in the spectrogram lands on the associated
cursor. The traces show sweep data from that respective point in time. The bandwidth and amplitude settings in
the example above were changed. Traces 1 through 3 reflect the changed settings while traces 4 through 6 are
showing sweep data from earlier points in time. To freeze the spectrogram, stop the instrument from sweeping
by toggling off Sweep Continuously.
3. The transition in the spectrogram here shows when the amplitude and bandwidth settings were changed.
4. The spectrogram START and STOP times shown here represent the full duration of all 142 sweeps shown in the
spectrogram window. Cursors 1 through 6 are positioned throughout the spectrogram and can be dragged or set
to a new time or position using the “TRACE CURSOR Menu” on page 3-27. Cursors can also be selected via the
left side status menu CURSORS table. The bottom of the table shows the reference trace (T0) and its settings.
The reference trace setting applies to all traces shown in the spectrum display.
Figure 3-18. Spectrogram View
MS2090A UG PN: 10580-00444 Rev. F 3-25
Page 90
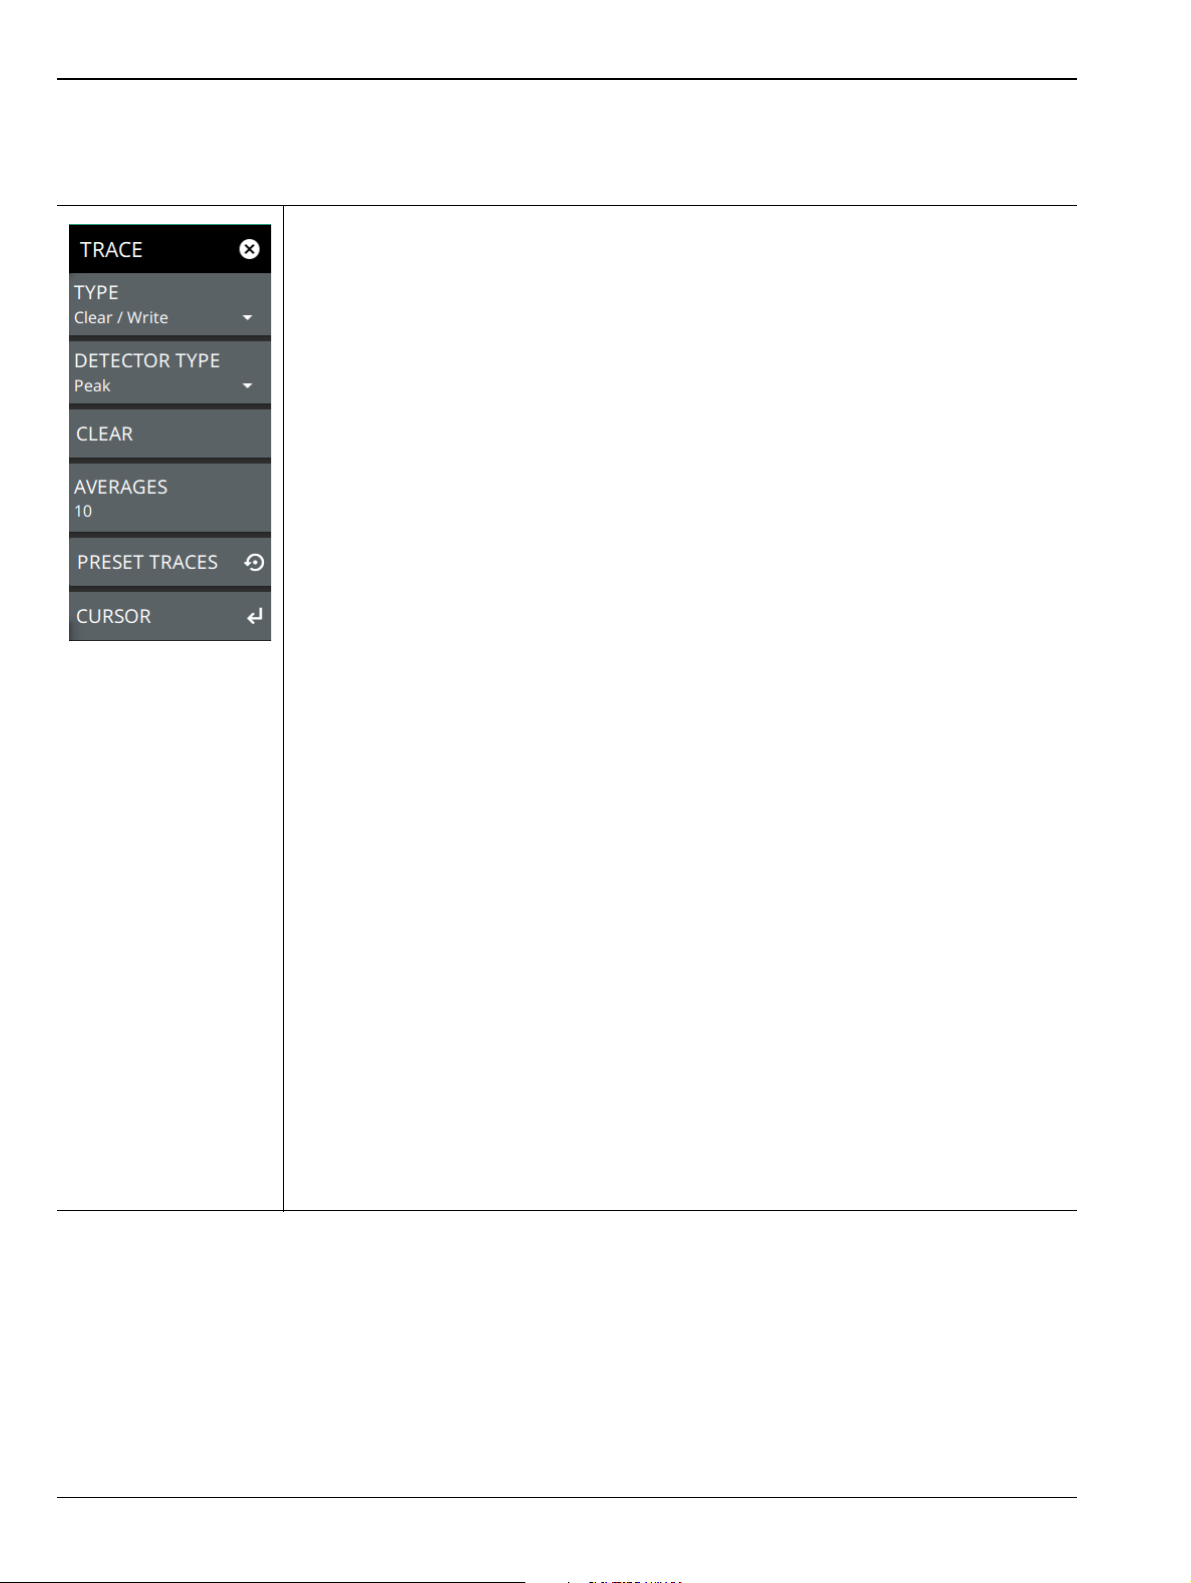
3-10 Setting Trace and Cursor Parameters Spectrum Analyzer Measurements
TRACE Menu (Spectrogram View)
When the combined Spectrogram view is selected (MEASURE > VIEW > Combined), the TRACE and SETUP
menus are updated with spectrogram and cursor setup controls.
TYPE: Selects one of the following types of traces:
• Clear/Write: Clears the trace after each sweep is complete and writes a new trace.
•Average: The average of all N traces, where N is the AVERAGES number set
below. The number of sweeps is displayed in the status panel TRACES table.
•Max Hold: Represents the maximum value since sweeping began. The number of
sweeps is displayed in the status panel TRACES table.
• Min Hold: Represents the minimum value since sweeping began. The number of
sweeps is displayed in the status panel TRACES table.
• Rolling Average: Is the rolling average of the last N traces, where N is the
AVERAGES number set below. The number of sweeps is displayed in the status
panel TRACES table.
• Rolling Max Hold: Is the maximum rolling average value of the last N traces,
where N is the AVERAGES number set below. The number of sweeps is displayed
in the status panel TRACES table.
• Rolling Min Hold: Is the minimum value of the last N traces, where N is the
AVERAGES number set below. The number of sweeps is displayed in the status
panel TRACES table.
DETECTOR TYPE: Selects one of the available detector types. Several detection
methods tailor the function of the instrument to meet specific measurement requirements.
There are often more measurement points across the screen than display points. The
various detection methods are different ways of showing each display point (see “Trace
Detector Types” on page 3-24).
• Peak: Shows the maximum amplitude of sampled data for each display point,
assuring that a narrow peak is not missed.
•RMS/Avg: In the default case, when the VBW/AVERAGE type is set to Linear, this
method shows the average amplitude of sampled data for each display point.
When VBW/AVERAGE type is set to Log, this method shows the traditional
average of log (power), such as dBm, for each display point.
• Negative: Shows the minimum amplitude of sampled data for each display point.
This method is also useful when measuring modulated signals to see if some
frequencies are not being used.
CLEAR: Clears the currently active trace data.
AVERAGES: Sets the number of trace sweeps (N) to average. Available when the trace
type is set to one of the averaging modes.
PRESET TRACES: Presets cursor and trace setup to Clear/Write, Active, with Peak
Detector.
CURSOR: Opens the “TRACE CURSOR Menu” on page 3-27.
Figure 3-19. TRACE Menu (Spectrogram View)
3-26 PN: 10580-00444 Rev. F MS2090A UG
Page 91

Spectrum Analyzer Measurements 3-10 Setting Trace and Cursor Parameters
TRACE CURSOR Menu
MODE: Every trace captured in the spectrogram has a time and a position index. Set the
location of the spectrogram cursor based on either the time index or the position index.
When position is selected, you can change the position index of the cursor from the
POSITION button. If Time is selected, you can set the time index of the cursor from the
TIME button. See the descriptions of POSITION and TIME below.
SELECT: Used to add additional cursors or to set the active cursor on the spectrogram.
The active cursor also displays the associated trace on top of other traces in the
spectrum display. For more information, refer to “Spectrogram with Cursors and Markers”
on page 3-38.
STATE: Selects one of the following cursor states:
• Active: Displays the selected trace as it is updating.
•Blank: Does not display the trace and is not updating. It is the same as if the trace
was off.
POSITION: Available when a position cursor is selected. You can change the sweep
position index of the selected spectrogram cursor in relation to the number of total
sweeps in the spectrogram. The number of sweeps in the spectrogram is based on the
size of the spectrogram window, so the sweep index changes when changing the
spectrogram cursor position index. The spectrum view also displays the currently
selected trace on top of any other traces. A position of 0 (zero) represents the most
recent (or live) trace. Entry into this field is disabled when the spectrogram cursor mode is
set to Time.
TIME: Available when a time cursor is selected. You can change the time index of the
selected spectrogram cursor in relation to the start and stop time displayed in the
spectrogram. The time in the spectrogram is based on the size of the spectrogram
window, so the time changes when changing the spectrogram cursor time index. The
spectrum view also displays the currently selected trace on top of other traces. A time of
0 (zero) represents the most recent (or live) trace. Entry into this field is disabled when
the spectrogram cursor mode is set to Position.
Figure 3-20. TRACE / CURSOR Menu (Spectrogram View)
MS2090A UG PN: 10580-00444 Rev. F 3-27
Page 92

3-11 Setting Sweep Parameters Spectrum Analyzer Measurements
3-11 Setting Sweep Parameters
Sweep parameters are set using the “SWEEP Menu” on page 3-29.
Single/Continuous
When the Continuous toggle is pressed, the instrument toggles between single sweep and continuous sweep. In
single sweep setting, the instrument waits until SWEEP ONCE is pressed or another setting is selected.
Trace Points
The number of points sets the number of display points in the trace that are generated from the measurement
data.
Sweep Limitations
With some spectrum analyzers, the user has control over sweep time (the elapsed time of each sweep, also
referred to as scan time). An analyzer cannot be swept arbitrarily fast while maintaining its specified accuracy,
but will have a sweep rate limitation depending upon the resolution bandwidth, video bandwidth, and
frequency range selected. The sweep rate is not usually chosen by the user, but is determined by the frequency
range swept divided by the sweep time. The limitation on sweep rate comes from the settling or response time
of the resolution and video bandwidth filters. If an analyzer is swept too quickly, the filters do not have time to
respond, and the measurement is inaccurate. Under such conditions, the analyzer display tends to have a
“smeared” look to it, with the spectral lines being wider than normal and shifted to the right and at a lower
amplitude than is correct.
Anritsu Field Master Pro is designed to relieve the user from having to calculate the sweep speed or
experiment to discover a sweep speed that yields accurate results. When changing the RBW and VBW, the
sweep speed automatically changes to the fastest sweep speed that will yield accurate results. The sweep speed
will be faster for a wide RBW or VBW and slower for a narrow RBW or VBW. Regardless of the minimum
sweep time, the instrument will never sweep faster than the RBW and VBW settings will allow. The
instrument is designed to ensure that no uncalibrated measurement conditions will occur.
3-28 PN: 10580-00444 Rev. F MS2090A UG
Page 93
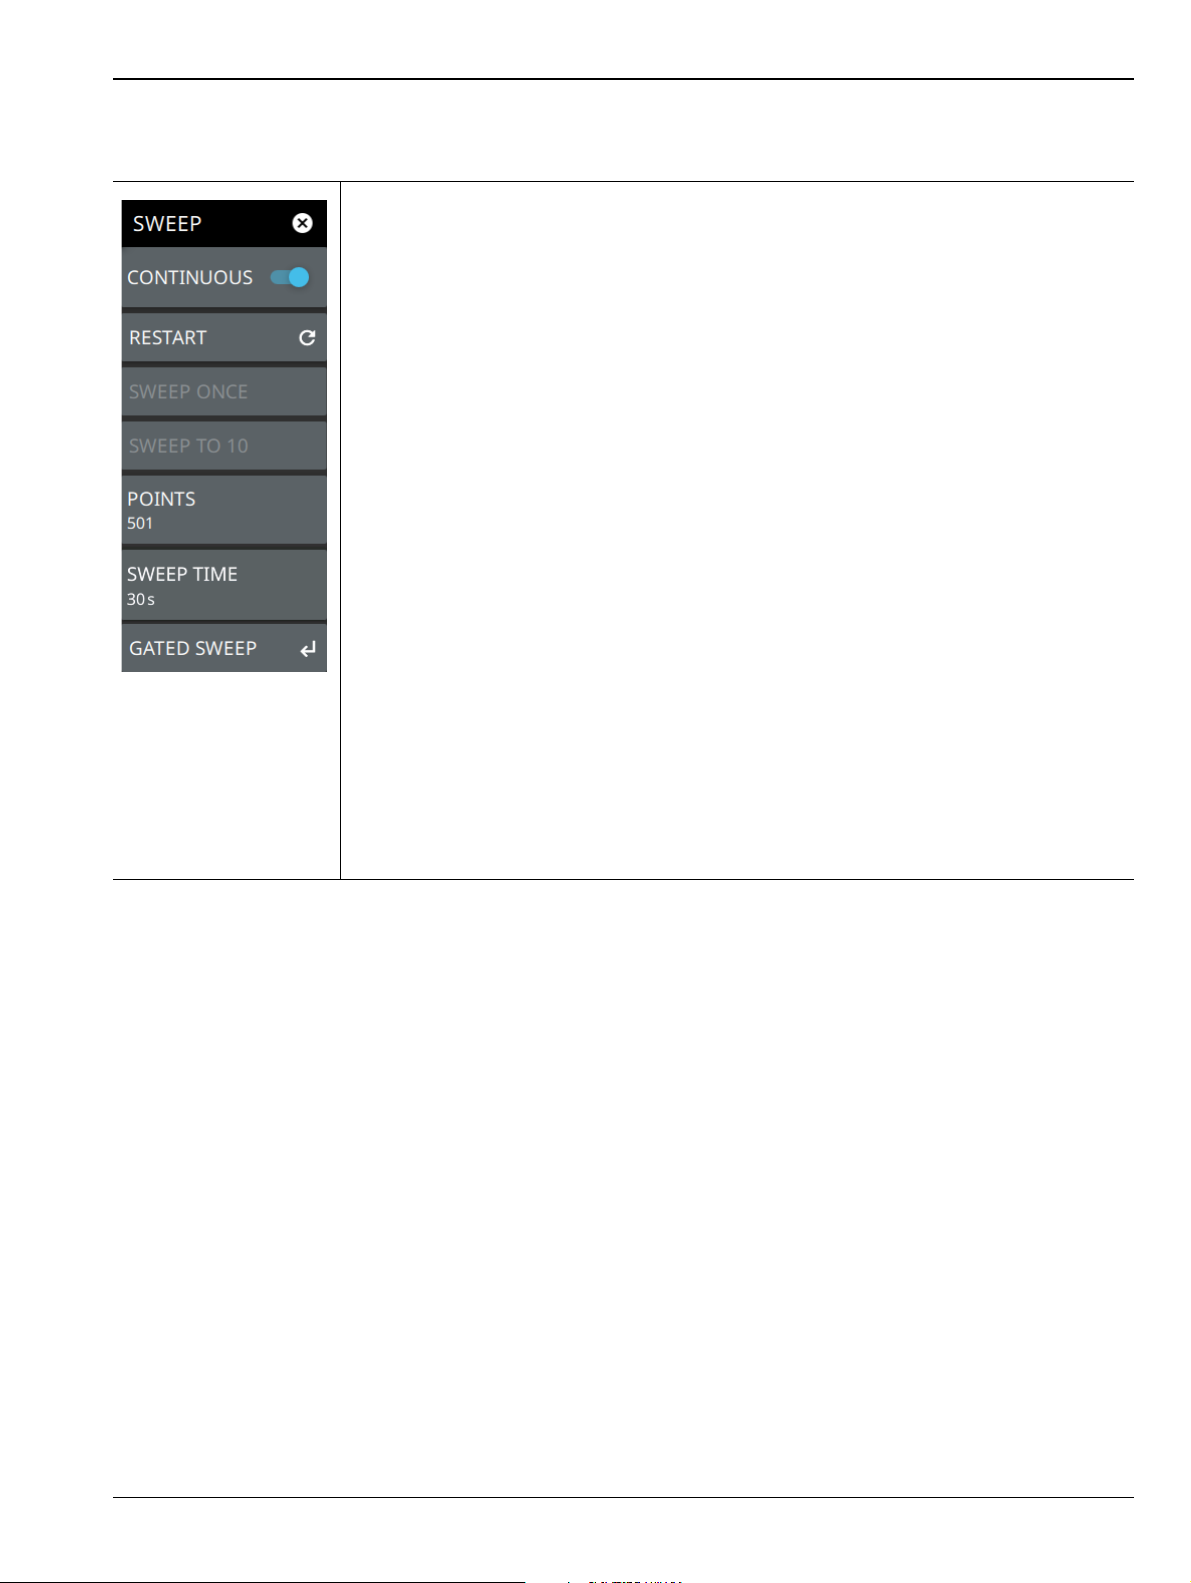
Spectrum Analyzer Measurements 3-11 Setting Sweep Parameters
SWEEP Menu
CONTINUOUS: Toggles between continuous sweep and single sweep. When the toggle
is off, the instrument is in single sweep. In single sweep, the results of a sweep are
displayed on the screen while the instrument awaits a trigger event to start a new sweep.
The current state of the instrument is displayed in the status panel. With average/hold
number (in TRACE menu) set to 1, or averaging is off, or no trace in trace average or
hold, a single sweep is equivalent to a single measurement. A single sweep is taken after
the trigger condition is met and the analyzer stops sweeping once that sweep has
completed. To take one more sweep without resetting the average count, press the
SWEEP ONCE button. This sweep control is also available in the status panel.
RESTART: The restart function restarts the current sweep or measurement from the start
frequency.
SWEEP ONCE: When sweep is set to single sweep, SWEEP ONCE triggers a single
measurement sweep.
SWEEP TO N: When sweep is set to single sweep and trace type is set to average,
rolling average, rolling max hold, or rolling min hold, SWEEP TO N triggers
N consecutive measurement sweeps, where N is the number of averages set in the
TRACE menu. Each time the button is pressed, it will restart the average count, then
sweep N times. This button has no function when the instrument is in continuous sweep.
POINTS: Sets the number of data points per sweep and displayed in each trace. The
current value of points is displayed parenthetically, next to the sweep time in the
lower-right corner of the display. Using more points provides greater resolution. Using
fewer points compacts the data and decreases the time required to access a trace.
SWEEP TIME: This button is available when the span is set to ZERO SPAN. Sets the
sweep time.
GATED SWEEP: Opens the “GATED SWEEP Menu” on page 3-31.
Figure 3-21. SWEEP Menu
MS2090A UG PN: 10580-00444 Rev. F 3-29
Page 94
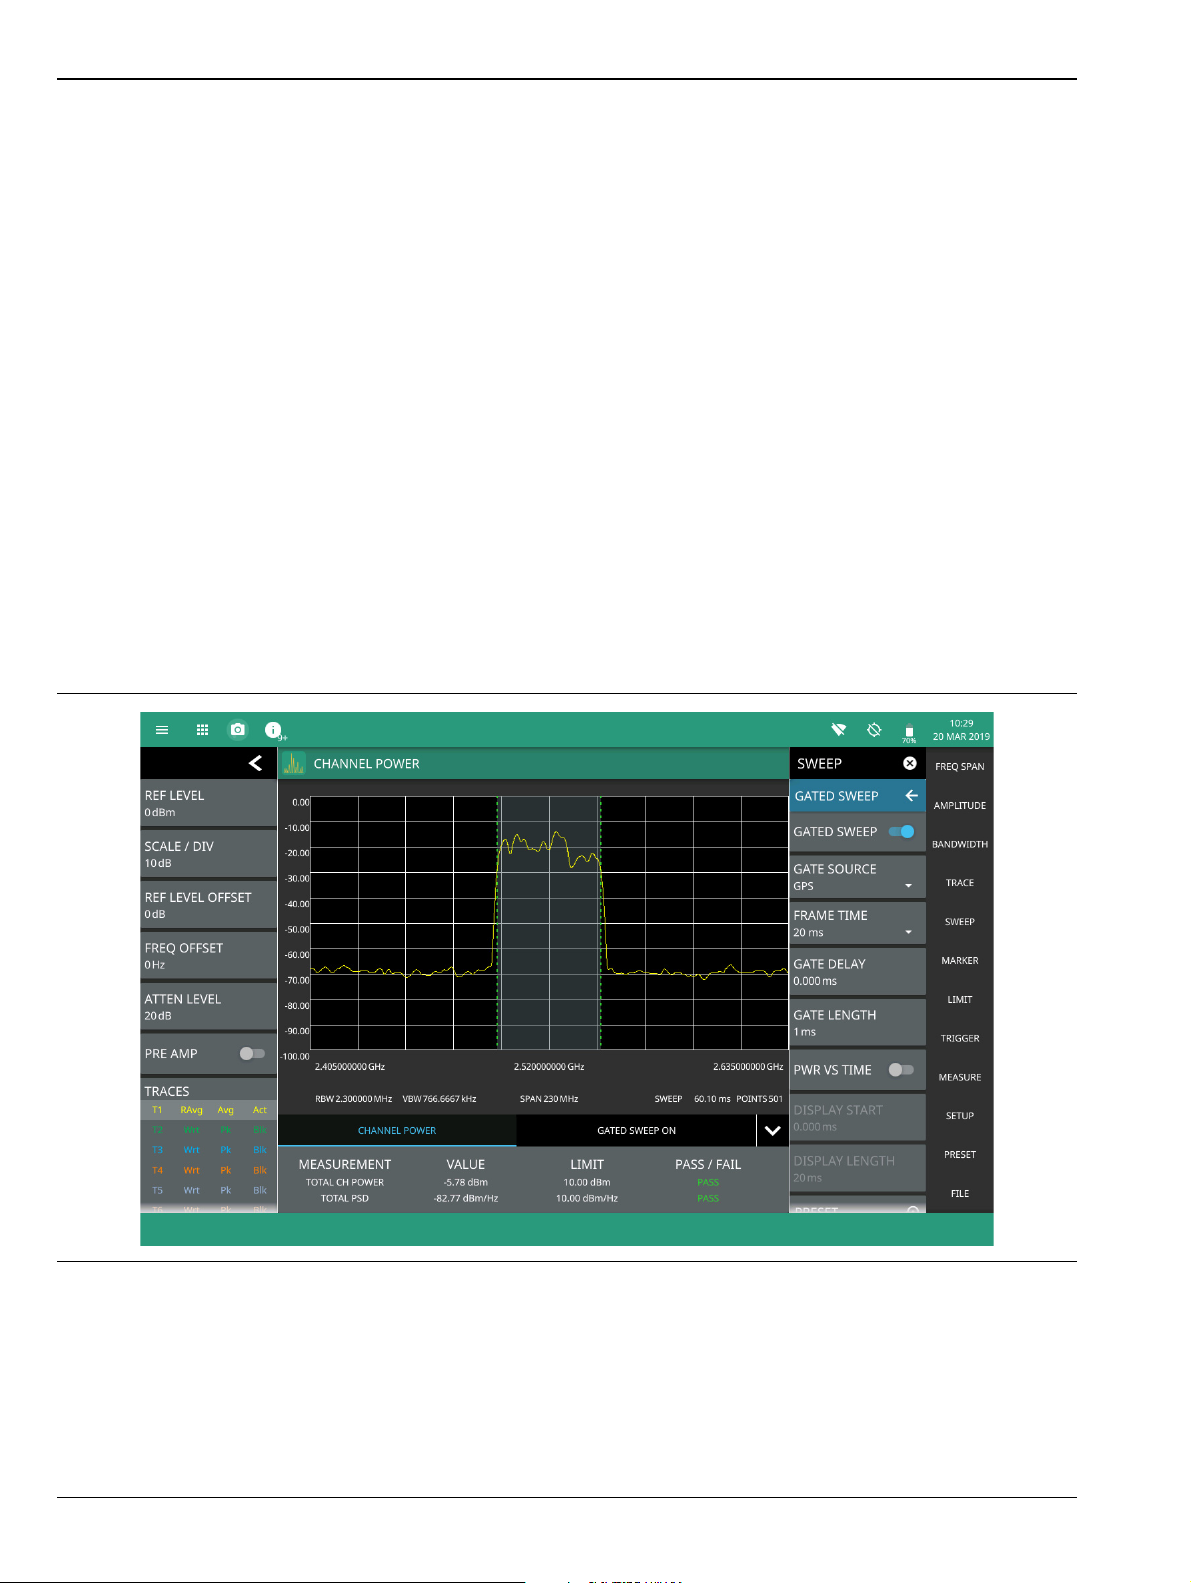
3-11 Setting Sweep Parameters Spectrum Analyzer Measurements
Gated Sweep (Option 90)
Gated sweep is only available on instruments with Option 90 installed. Gated sweep allows you to synchronize
your sweep with an event so that the analyzer collects data at the appropriate time. This is useful for
measuring signals in the time domain such as pulsed RF, time multiplexed, or burst modulated signals.
Field Master Pro can use the GPS timing signal as the gating trigger event. This will allow you to synchronize
measurements with GPS synchronized communication signals. Set up gated sweep from the “GATED SWEEP
Menu” on page 3-31.
To set up the instrument for gated sweep measurements:
1. Press SWEEP > GATED SWEEP.
2. Select the GATE SOURCE. The gate source selected determines the trigger source from which the gate
is controlled. Not all instrument models and options support all triggering selections, so your choices
may vary. Field Master Pro supports a GPS and external trigger gate source.
3. Select one of the available FRAME TIME durations. The frame time sets the total measurement cycle
time.
4. Set the GATE DELAY time. The gate delay sets the time from the triggering event to when the
instrument starts sweeping and collecting data.
5. Set the GATE LENGTH time. The gate length sets the time for data capture and analysis.
6. If desired, enable PWR VS TIME (refer to “POWER VS TIME Display” on page 3-32.)
Below is an example of a gated sweep applied to a channel power measurement. The signal level shown varies
cyclically with time and would not be measurable without gated sweep.
Figure 3-22. Gated Sweep Measurement
The channel power and gated sweep display panels at the bottom can be tapped to directly open either the
Channel Power SETUP menu or the GATED SWEEP menu.
3-30 PN: 10580-00444 Rev. F MS2090A UG
Page 95
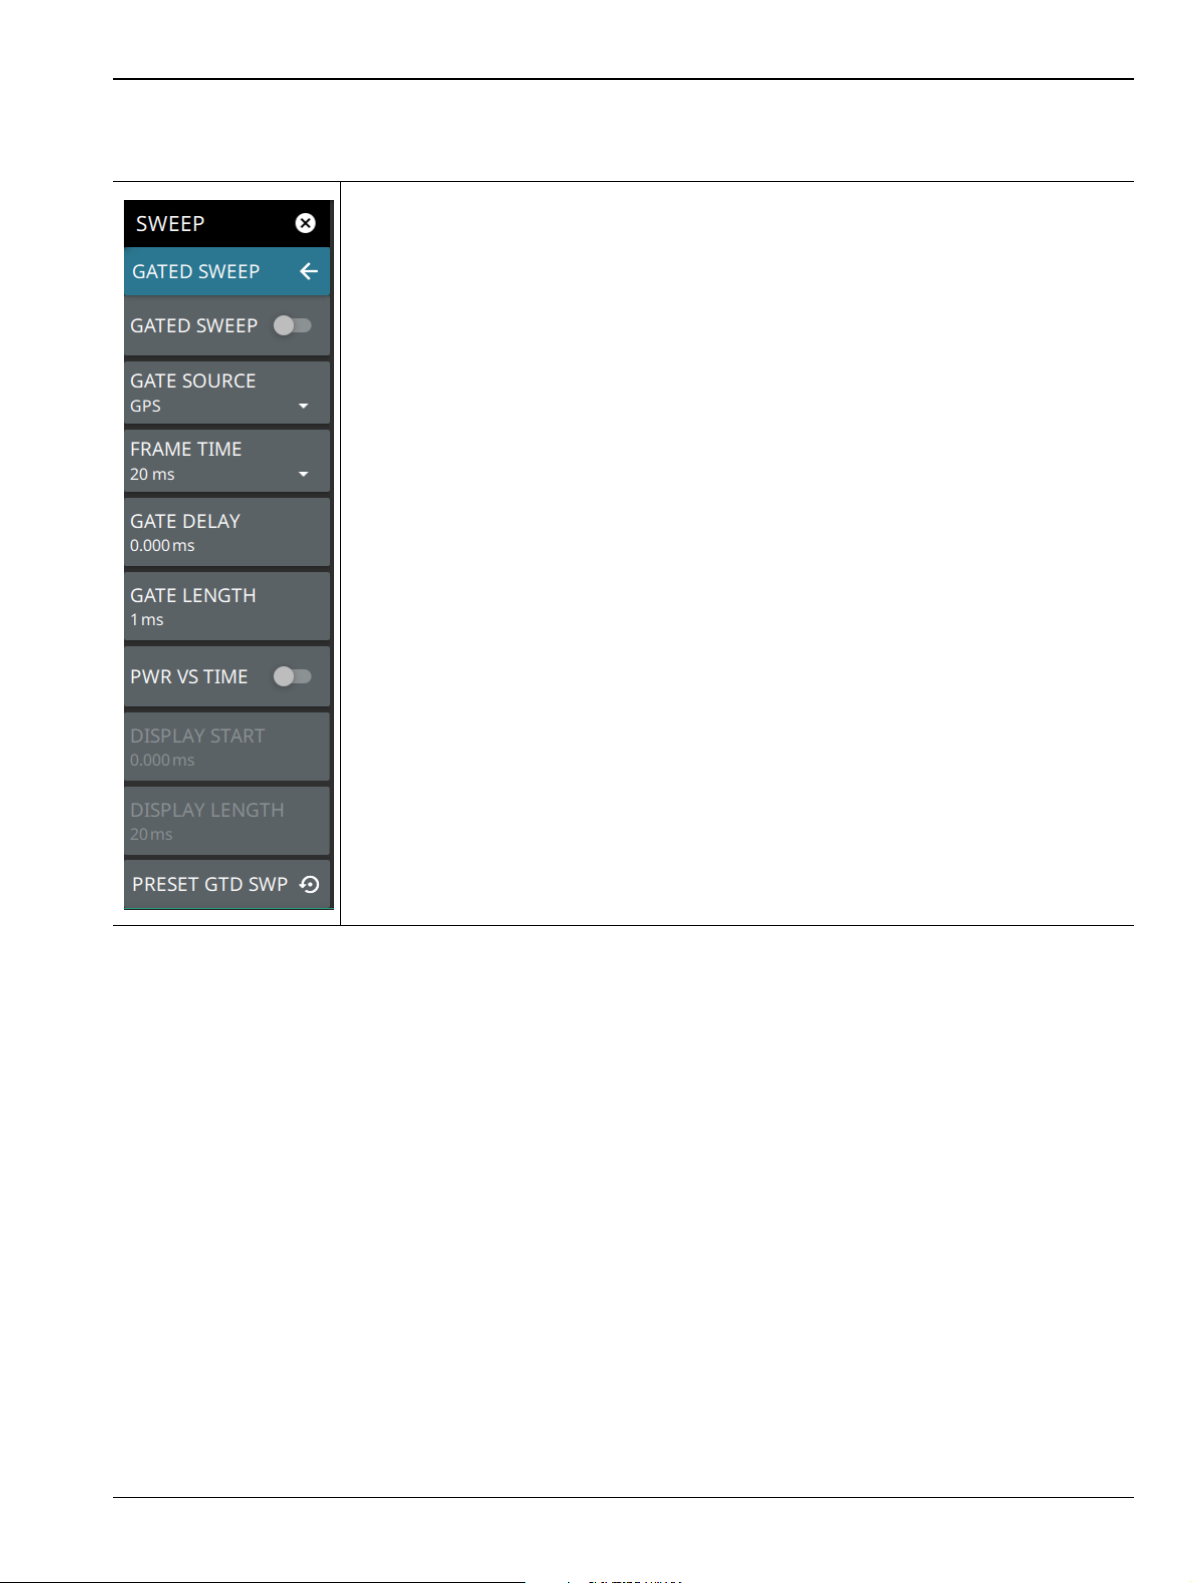
Spectrum Analyzer Measurements 3-11 Setting Sweep Parameters
GATED SWEEP Menu
GATED SWEEP: Toggles gated sweep on or off.
GATED SOURCE: Selects the trigger source for the gated sweep.
•External: This setting designates the trigger source as an external signal that is
input via the instrument’s Ext Trigger In connector.
• GPS: The GPS trigger source is valid only on instrument models with 20 MHz IF
Bandwidth available.
FRAME TIME: Selects the frame time duration of 10 ms, 20 ms, or 1 s.
GATE DELAY: Sets the start of the gated sweep. When “POWER VS TIME Display” is
enabled, the gate delay is indicated by the blue left border of the power vs time display.
You can also drag the entire gate to set the desired gate delay.
GATE LENGTH: Sets the length of the gated sweep. When “POWER VS TIME Display”
is enabled, the gate length is indicated by the width between the blue borders of the
power vs time display. You can also drag the right blue border to set the desired gate
length.
PWR VS TIME: Enables the “POWER VS TIME Display” on page 3-32.
DISPLAY START: When POWER VS TIME is enabled, sets the start of the graticule
display.
DISPLAY LENGTH: When POWER VS TIME is enabled, sets the time length of the
graticule display.
PRESET GTD SWP: Presets gated sweep settings to default values.
Figure 3-23. GATED SWEEP Menu
MS2090A UG PN: 10580-00444 Rev. F 3-31
Page 96

3-11 Setting Sweep Parameters Spectrum Analyzer Measurements
1
1
2
2
POWER VS TIME Display
When power vs time is enabled, a time-domain graph is presented. This graph is a useful visual aid when
setting up the GATE DELAY (1) and GATE LENGTH (2) times as you can simultaneously view the signal level
within the set frame and relative to your gate delay and length. The display is enabled using the
PWR VS TIME toggle setting and should be disabled after setting up the gate delay and length parameters.
The gate delay and length are represented by the width of the displayed shaded area flanked with blue lines
(see Figure 3-24).
1. Set the gate delay by dragging the left blue setting line or entering a value directly. The full time scale is shown
along the bottom and the gate delay time will be displayed at the top center of the graticule when it is being
adjusted.
2. Set the gate length by dragging the right blue setting line or entering a value directly. The full time scale is shown
along the bottom and the gate length will be displayed at the top center of the graticule when it is being adjusted.
Figure 3-24. Power vs. Time Display
If the blue gate delay and length setting lines are set outside of the displayed graticule scale, you will see
“< Gate Start” and “Gate Stop >” messages at the edge of the display indicating where the blue setting lines
are located.
Once the gate has been set up, you can apply gating to the spectrum by toggling GATED SWEEP on. Gating
will continue to be applied when you access other measurements and functions of the spectrum analyzer until
gated sweep is toggled off or an unsupported instrument configuration is selected.
3-32 PN: 10580-00444 Rev. F MS2090A UG
Page 97

Spectrum Analyzer Measurements 3-12 Setting Up Markers
3
2
3
1
3-12 Setting Up Markers
Marker parameters are set using the “MARKER Menu” on page 3-35. Refer to the figure below when working
with this section.
1. Normal spectrum view marker information display.
2. Marker located on trace. The active marker is indicated with solid green fill, other markers will show with a
hollow fill, fixed markers show as a green X. The dashed vertical line is attached to the active marker and
facilitates touch operations. Either the marker or the line can be dragged into position, and either can be double
tapped to open a number of peak search options.
3. Selected marker in the MARKER menu and in the MARKER table. The marker table shows all of the marker
parameters and measurement values. You can edit marker parameters from the marker table as well as from the
MARKER menu.
Figure 3-25. Marker Table and Marker Settings Panels
MS2090A UG PN: 10580-00444 Rev. F 3-33
Page 98

3-12 Setting Up Markers Spectrum Analyzer Measurements
Placing a Normal Marker
1. Press MARKER to display markers. If markers were off, Marker 1 will automatically be made active at
the current center frequency.
2. Select another marker using MARKER > SELECT, then select one of 12 available markers. If the
marker was off, the marker will be made active and placed at the center frequency. If the marker was on,
it will be made the active marker. You can enable all 12 markers and place them separately on traces,
cursors, or set them as a fixed marker at a static frequency and amplitude.
3. Place a marker by first selecting it as the active marker, then do one of the following:
a. Enter a new FREQUENCY value from the MARKER menu. The frequency can be entered
manually or adjusted by using the slider or the + and – buttons to move the marker to the left and
right.
b. Drag the marker on the trace (note that anywhere on the vertical dashed blue line can be touched
to drag a marker’s position).
c. Use the PEAK SEARCH menu and the desired peak search function to automatically find signal
peaks (refer to “MARKER PEAK SEARCH Menu” on page 3-36). Some peak search functions can
be accessed by double tapping the marker or the blue marker line.
Placing a Fixed Marker
Fixed markers are set up the same as normal markers above, but are set to Fixed using the MODE button. In
addition to setting a fixed frequency, you can set a fixed amplitude. Fixed markers are typically used as a
reference marker when measuring amplitude differences relative to an absolute value.
Placing a Delta Marker
When a delta marker is on, its position data is relative to its reference marker. For example, if marker 2 is set
as a delta marker, the delta reference is set to Marker 3. To set a delta marker and its reference:
1. Activate a marker and place it in a reference location as described previously.
2. Select another marker using MARKER > SELECT.
3. Place a marker by first selecting it as the active marker, then do one of the following:
a. Enter a new FREQUENCY value from the MARKER menu. The frequency can be entered
manually or adjusted by using the slider or the + and – buttons to move the marker to the left and
right.
b. Drag the marker on the trace (note that anywhere on the vertical dashed blue line can be touched
to drag a marker’s position).
c. Use the PEAK SEARCH menu and the desired peak search function to automatically find signal
peaks (“MARKER PEAK SEARCH Menu” on page 3-36). Some peak search functions can be
accessed by double-tapping the marker or the blue marker line.
4. Place the active delta marker by:
a. Entering a new FREQUENCY value.
b. Dragging the marker on the trace (note that anywhere on the vertical dashed blue line can be
touched to drag a marker’s position.
c. Use the PEAK SEARCH menu and the desired peak search function to automatically find signal
peaks (refer to “MARKER PEAK SEARCH Menu” on page 3-36).
A delta marker is labeled with a green delta symbol between the each marker number. For example, delta
Marker 2 relative to Marker 1 is displayed as “2∆1”.
3-34 PN: 10580-00444 Rev. F MS2090A UG
Page 99

Spectrum Analyzer Measurements 3-12 Setting Up Markers
MARKER Menu
PEAK SEARCH: Opens the “MARKER PEAK SEARCH Menu” on page 3-36.
SELECT: Turns on the selected marker if it is off or makes it the active marker if it is
already turned on. Pressing the MARKER menu button for the first time will turn on
Marker 1 as a normal marker at the center frequency, and open the MARKER menu.
Pressing the MARKER menu button thereafter opens the MARKER menu to the current
active marker, which is displayed in the upper left-hand corner of the screen. When a
marker is turned on, it is a normal marker positioned at the center frequency of the
selected trace.
ENABLED: Enables the selected marker. When the toggle is off, the marker is disabled
and not shown on the screen.
FREQUENCY: Displays the marker frequency. For delta markers, the frequency is
relative to the reference marker. Change the marker frequency by dragging it to the
desired location. You can also change the marker frequency by pressing the
FREQUENCY button and changing it manually using the keypad controls.
AMPLITUDE: Displays the current marker amplitude. When the marker mode is set to
Normal or Delta, the amplitude is set by the trace. In that case, the amplitude is not
settable by the user. The button is grayed out, but the value is still updating with every
sweep. If the marker is a Fixed marker, the amplitude value can be changed by dragging
the marker to the desired location or by directly entering the amplitude using the keypad
control.
MODE: Select marker preference:
• Normal: A Normal marker is also known as a tracking marker. The frequency is
fixed but the amplitude value varies from sweep to sweep.
•Delta (∆): A Delta (∆) marker displays the delta frequency and amplitude between
itself and a reference marker. If Marker 1 is selected to be a Delta marker, then
Marker 2 is turned on as a reference marker for Marker 1 and it becomes a Normal
marker at the same location. The reference marker can then be switched to a Fixed
marker if desired.
• Fixed: A Fixed marker has a fixed amplitude and fixed frequency, which are
defined by the user and not related to the trace or sweep data.
FUNCTION: Sets the function of the currently selected marker to None, Noise, or
Frequency Counter. For more information about using marker functions, refer to “Marker
Functions” on page 3-37.
DELTA REFERENCE: Selects the Reference marker for a Delta marker. A Delta marker
cannot be its own reference. Only Fixed and Normal markers may be used as a reference
for Delta markers.
TRACE: Selects the trace number to which the marker is currently attached.
MARKER TABLE: Toggle on or off the marker table displayed below the screen. Refer to
“Marker Table” on page 3-39.
CENTER ON MARKER: Sets the center frequency to the currently active marker’s
frequency value.
REF LVL TO MARKER: Sets the reference level to the currently active marker’s
amplitude value.
ALL MARKERS OFF: Turns all markers off, but markers will retain their last frequency
position once re-enabled.
PRESET MARKERS: Presets marker selections to default values.
Figure 3-26. MARKER Menu
MS2090A UG PN: 10580-00444 Rev. F 3-35
Page 100

3-12 Setting Up Markers Spectrum Analyzer Measurements
MARKER PEAK SEARCH Menu
Note Double tapping a marker opens a quick peak search menu with some of the below features.
PEAK SEARCH: Returns to the main MARKER menu.
SELECT: If the selected marker is off, it will be turned on and the selected marker
positioned at the peak of Trace 1. If the selected marker is on, then it will become the
active marker and any subsequent actions in the PEAK SEARCH menu will apply to the
selected marker. If no markers are on, pressing the PEAK SEARCH button on the control
panel will turn on Marker 1 at the peak of Trace 1.
PEAK SEARCH: Moves the selected marker to the highest peak.
NEXT PEAK: Moves the selected marker to the next highest peak regardless of location.
NEXT PEAK LEFT: Moves the selected marker to the next peak left of its current
position.
NEXT PEAK RIGHT: Moves the selected marker to the next peak right of its current
position.
NEXT POINT LEFT: Moves the selected marker one display point to the left of its current
position. Useful for fine tuning the position of a marker.
NEXT POINT RIGHT: Moves the selected marker one display point to the right of its
current position. Useful for fine tuning the position of a marker.
THRESHOLD: If turned on, sets the threshold that a peak has to achieve to be
considered a peak.
EXCURSION: If turned on, sets the excursion value that a peak amplitude must rise and
fall over the peak threshold to qualify as peak.
Figure 3-27. PEAK SEARCH Menu
3-36 PN: 10580-00444 Rev. F MS2090A UG
 Loading...