

Page 1
Technical Data Sheet
™
VNA Master
Handheld Vector Network Analyzer + Spectrum Analyzer
MS2026C MS2036C MS2028C MS2038C
5 kHz to 6 GHz 5 kHz to 6 GHz 5 kHz to 20 GHz 5 kHz to 20 GHz
The Ultimate Handheld Vector Network + Spectrum Analyzer
for Cable, Antenna and Signal Analysis Anytime, Anywhere
Introduction
High Performance Handheld S-Parameters
Anritsu introduces the MS202x/3xC VNA Master + Spectrum Analyzer, the industry’s broadest frequency handheld solution
to address cable, antenna, component and signal analysis needs in the field: with frequency coverage from 5 kHz to 6/20 GHz.
Equally impressive, this broadband measurement tool offers the industry’s first 12-term error correction algorithm in a truly
handheld, battery-operated, rugged multi-function instrument. And now the MS2036/38C models include a powerful spectrum
analyzer which multiplies user convenience by combining spectrum analysis with the VNA into a single measurement powerhouse
for the harsh RF and physical environments of field test. Whether it is for spectrum monitoring, broadcast proofing, interference
analysis, RF and microwave measurements, regulatory compliance, or 3G/4G and wireless data network measurements, this
VNA/Spectrum Analyzer marriage is the ideal instrument to making fast and reliable measurements in the field.
9 kHz to 9 GHz 9 kHz to 20 GHz
Vector Network Analyzer
+ Spectrum Analyzer
Page 2

Performance and Functional Highlights
VNA Master
• Broadband coverage of 5 kHz to 6/20 GHz
• True 2-port Vector Network Analyzer (VNA)
• Ultimate accuracy with 12-term error correction
• User-defined quad display for viewing all 4 S-Parameters
• Arbitrary data points up to 4001
• IF Bandwidth selections of 10 Hz to 100 kHz
• 85 dB dynamic range to 20 GHz
• Supports waveguide measurements
• 350 µs/data point sweep speed
• USB/Ethernet for PC data transfer and control
• Automate repetitive tasks via Ethernet & USB
• Field upgradable firmware
• Store more than 4000 traces and setups in memory
• Portable: 10.5 lbs (4.8 kg)
VNA Master + Spectrum Analyzer
All of the above VNA features PLUS:
• Measure: Occupied Bandwidth, Channel Power, ACPR, C/I
• Dynamic Range: > 104 dB in 1 Hz RBW
• DANL: –160 dBm in 1 Hz RBW
• Phase Noise: –100 dBc/Hz @ 10 kHz offset at 1 GHz
• Frequency Accuracy: < ± 25 ppb with GPS On
• 1 Hz to 10 MHz Resolution Bandwidth (RBW)
• Traces: Normal, Max Hold, Min Hold, Average,
# of Averages
• Detectors: Peak, Negative, Sample, Quasi-peak, and true RMS
• Markers: 6, each with a Delta Marker, or 1 Reference with
6 Deltas
• Limit Lines: up to 40 segments with one-button envelope
creation
• Full Speed USB Memory support
• High resolution daylight viewable TFT color display
• Time Domain option for Distance-to-Fault diagnostics
• Internal Bias Tee option
• Vector Voltmeter option
• High Accuracy Power Meter option
• Differential option (S
d1d
1
, S
c1c
1
, S
d1c
, and S
1
c1d
)
1
• Secure Data Operation option
• GPS Receiver option
• Power Monitor option
• Polar Format Impedance Display
• 4, 6, 8, 18, 26 GHz USB Power Sensors
• 8.4 in. Display
• Trace Save-on-Event: crossing limit line or sweep complete
• Option to automatically optimize sweep-RBW-VBW tradeoff
for best possible display
• Interference Analyzer Option: Spectrogram,
Signal Strength, RSSI
• Channel Scanner Option
• Zero-span IF Output
• Gated Sweep
• GPS tagging of stored traces
• Internal Preamplifier standard
• High Accuracy Power Meter Option
• AM/FM/SSB Demodulation (audio only)
2
Page 3
VNA Master Functional Specifications
DUT
Port 1 Port 2
Source
Receiver
Port 1
Receiver
Port 2
Reference
Receiver
Switch
Bridge/
Coupler
Bridge/
Coupler
S
11
S
12
S
21
S
22
Definitions
• All specifications and characteristics apply under the following conditions, unless otherwise stated:
• After 30 minutes of warm-up time, where the instrument is in VNA Mode and left in the ON state.
• Temperature range is 23 ºC ± 5 ºC.
• All specifications apply when using internal reference.
• All specifications subject to change without notice. Please visit www.us.anritsu.com for most current data sheet.
• Typical performance is the measured performance of an average unit.
• Recommended calibration cycle is 12 months.
Frequency
VNA Master Frequency Range: MS2026/36C: 5 kHz to 6 GHz
MS2028/38C: 5 kHz to 20 GHz
Frequency Accuracy: 1.5 ppm
Frequency Resolution: 1 Hz to 375 MHz, 10 Hz to 6 GHz, and 100 Hz to 20 GHz
Typical Test Port Power
VNA Master supports selection of either High (default) or
Low test port power. Changing power after calibration can
degrade the calibrated performance. Typical power by bands
is shown in the following table.
Frequency Range
5 kHz to ≤ 3 GHz +3 –25
3 GHz to ≤ 6 GHz –3 –25
6 GHz to ≤ 20 GHz –3 –15
High Port Power
(dB)
Low Por t Power
(dBm)
Transmission Dynamic Range
The transmission dynamic range (the difference between
test port power and noise floor) using 10 Hz IF Bandwidth
and High Port Power is shown in the following table.
Frequency Range
5 kHz to ≤ 2 MHz 85
2 MHz to ≤ 3 GHz 100
3 GHz to ≤ 6 GHz 90
6 GHz to ≤ 20 GHz 85
Dynamic Range
(dB)
Typical Sweep Speed
The typical sweep speed for IF Bandwidth of 100 kHz, 1001
data points, and single display is shown in the following
table. The three receiver architecture will simultaneously
collect S21 and S11 (or S12 and S22 ) in a single sweep.
Block Diagram
As shown in the following block diagram, the VNA Master
has a 2-port, 2-path architecture that automatically measures
four S-parameters with a single connection.
The above illustration is a simplified block diagram of VNA Master’s 2-port, 2-path
architecture.
Frequency Range
5 kHz to 6 GHz 350
6 GHz to 20 GHz 650
Typical Sweep Speed
(µs/point)
3
Page 4
Uncertainty Curves for Round-Trip Cable Loss Measurements (1-Port)
VNA Master (MS20xxC), 5 kHz - 6 GHz
One Port Cable Loss (Log Mag / 2) Uncertainty vs. DUT Match
0.1
1
10
0 1 2 3 4 5 6 7 8 9 10
Cable Loss, Log Mag / 2 (dB)
Uncertainty (dB)
-20 dB
-25 dB
-30 dB
VNA Master (MS20xxC), 6 - 20 GHz
One Port Cable Loss (Log Mag / 2) Uncertainty vs. DUT Match
0.1
1
10
0 1 2 3 4 5 6 7 8 9 10
Cable Loss, Lo
g Mag / 2 (dB)
Uncertainty (dB)
-20 dB
-25 dB
-30 dB
Round-trip cable loss measurements are convenient for field personnel testing installed cable or waveguide runs. This one-port
technique provides one-way data after twice traversing the cable. The following two sets of uncertainty curves, less than 6 GHz
on the left and greater than 6 GHz on the right, present worst-case uncertainty by DUT Match (i.e., Log Mag) when using
VNA Master for one-port cable loss measurements. As a practical tip, consider using a two-port transmission measurement
technique to improve upon these one-port cable loss uncertainties.
These uncertainty curves show how frequency range, DUT Match, and cable loss impact worst-case uncertainty of round-trip cable loss measurements. The uncertainty curves,
separated by frequency range, are shown for DUT Match conditions of 20, 25, and 30 dB. For DUT Match of 30 dB and cable loss of 4-5 dB (reflection measurement of 8-10 dB)
the worst-case uncertainties are approximately ±1 dB.
4
Page 5
High Port Power
0.1
1
10
100
S11 Magnitude
S11 Phase
S21 Magnitude
S21 Phase
0.1
1
10
-40 -35 -30 -25 -20 -15 -10 -5 0
1
10
100
-40 -35 -30 -25 -20 -15 -10 -5 0
-80 -70 -60 -50 -40 -30 -20 -10 0
0.01
0.1
1
10
-80 -70 -60 -50 -40 -30 -20 -10 0
Uncertainty 0.5 MHz to 20 MHz
Uncertainty 20 MHz to 3 GHz
Uncertainty 3 GHz to 6 GHz
Uncertainty 6 GHz to 20 GHz
Uncertainty 0.5 MHz to 20 MHz
Uncertainty 20 MHz to 3 GHz
Uncertainty 3 GHz to 6 GHz
Uncertainty 6 GHz to 20 GHz
Uncertainty 0.5 MHz to 20 MHz
Uncertainty 20 MHz to 3 GHz
Uncertainty 3 GHz to 6 GHz
Uncertainty 6 GHz to 20 GHz
Uncertainty 0.5 MHz to 20 MHz
Uncertainty 20 MHz to 3 GHz
Uncertainty 3 GHz to 6 GHz
Uncertainty 6 GHz to 20 GHz
OSLxx50 Calibration Components (N-Connectors)
Corrected System Performance and Uncertainties:
MS202x/3xC Model with 12-term SOLT calibration including
isolation using either OSLN50 & OSLNF50 or OSLK50 &
OSLKF50 Calibration Kits
Precision calibration standards come in a convenient
configuration for field work.
Frequency Range (GHz) Directivity (dB)
≤ 5 > 42
≤ 15 > 36
≤ 20* > 32
Frequency Range (GHz) Typical High Port Power (dBm)
≤ 3 +3
≤ 6 –3
≤ 20 –3
* N Connector guaranteed to 18 GHz, typical > 18 GHz
Measurement Uncertainties
The following graphs provide measurement uncertainty at 23 ºC ± 5 ºC for the above indicated connector type and calibration.
Errors are worse-case contributions of residual directivity, source match, frequency response, network analyzer dynamic range,
and connector repeatability. For two-port measurements, transmission tracking, crosstalk, and physical load match termination
were added. Isolation calibration and an IF Bandwidth of 10 Hz is used.
5
Page 6
Low Port Power
0.1
1
10
100
S11 Magnitude
S11 Phase
S21 Magnitude
S21 Phase
0.1
1
10
-40 -35 -30 -25 -20 -15 -10 -5 0
1
10
100
-40 -35 -30 -25 -20 -15 -10 -5 0
-80 -70 -60 -50 -40 -30 -20 -10 0
0.01
0.1
1
1
10
-80 -70 -60 -50 -40 -30 -20 -10 0
Uncertainty 0.5 MHz to 20 MHz
Uncertainty 20 MHz to 3 GHz
Uncertainty 3 GHz to 6 GHz
Uncertainty 6 GHz to 20 GHz
Uncertainty 0.5 MHz to 20 MHz
Uncertainty 20 MHz to 3 GHz
Uncertainty 3 GHz to 6 GHz
Uncertainty 6 GHz to 20 GHz
Uncertainty 0.5 MHz to 20 MHz
Uncertainty 20 MHz to 3 GHz
Uncertainty 3 GHz to 6 GHz
Uncertainty 6 GHz to 20 GHz
Uncertainty 0.5 MHz to 20 MHz
Uncertainty 20 MHz to 3 GHz
Uncertainty 3 GHz to 6 GHz
Uncertainty 6 GHz to 20 GHz
OSLxx50 Calibration Components
Corrected System Performance and Uncertainties:
MS202x/3xC Model with 12-term SOLT calibration including
isolation using either OSLN50 & OSLNF50 or OSLK50 &
OSLKF50 Calibration Kits
Frequency Range (GHz) Directivity (dB)
≤ 5 > 42
≤ 15 > 36
≤ 20* > 32
Frequency Range (GHz) Typical High Port Power (dBm)
≤ 3 –25
≤ 6 –25
≤ 20 –15
* N Connector guaranteed to 18 GHz, typical > 18 GHz
Measurement Uncertainties
The following graphs provide measurement uncertainty at 23 ºC ± 5 ºC for the above indicated connector type and calibration.
Errors are worse-case contributions of residual directivity, source match, frequency response, network analyzer dynamic range,
and connector repeatability. For two-port measurements, transmission tracking, crosstalk, and physical load match termination
were added. Isolation calibration and an IF Bandwidth of 10 Hz is used.
6
Page 7
High Port Power
0.1
1
1
10
100
S11 Magnitude
S11 Phase
S21 Magnitude
S21 Phase
0.1
1
10
-40 -35 -30 -25 -20 -15 -10 -5 0
0.1
10
100
-40 -35 -30 -25 -20 -15 -10 -5 0
-80 -70 -60 -50 -40 -30 -20 -10 0
0.01
0.1
1
10
-80 -70 -60 -50 -40 -30 -20 -10 0
Uncertainty 0.5 MHz to 20 MHz
Uncertainty 20 MHz to 3 GHz
Uncertainty 3 GHz to 6 GHz
Uncertainty 6 GHz to 20 GHz
Uncertainty 0.5 MHz to 20 MHz
Uncertainty 20 MHz to 3 GHz
Uncertainty 3 GHz to 6 GHz
Uncertainty 6 GHz to 20 GHz
Uncertainty 0.5 MHz to 20 MHz
Uncertainty 20 MHz to 3 GHz
Uncertainty 3 GHz to 6 GHz
Uncertainty 6 GHz to 20 GHz
Uncertainty 0.5 MHz to 20 MHz
Uncertainty 20 MHz to 3 GHz
Uncertainty 3 GHz to 6 GHz
Uncertainty 6 GHz to 20 GHz
3652A Calibration Kit (K-Connector)
Corrected System Performance and Uncertainties:
MS202x/3xC Model with 12-term SOLT calibration including
isolation using 3652A Calibration Kit
Frequency Range (GHz) Directivity (dB)
≤ 5 > 42
≤ 15 > 36
≤ 20* > 32
Frequency Range (GHz) Typical High Port Power (dBm)
≤ 3 +3
≤ 6 –3
≤ 20 –3
* N Connector guaranteed to 18 GHz, typical > 18 GHz
Measurement Uncertainties
The following graphs provide measurement uncertainty at 23 ºC ± 5 ºC for the above indicated connector type and calibration.
Errors are worse-case contributions of residual directivity, source match, frequency response, network analyzer dynamic range,
and connector repeatability. For two-port measurements, transmission tracking, crosstalk, and physical load match termination
were added. Isolation calibration and an IF Bandwidth of 10 Hz is used.
7
Page 8
Low Port Power
0.1
1
10
100
S11 Magnitude
S11 Phase
S21 Magnitude
S21 Phase
0.1
1
10
-40 -35 -30 -25 -20 -15 -10 -5 0
0.1
10
100
-40 -35 -30 -25 -20 -15 -10 -5 0
-80 -70 -60 -50 -40 -30 -20 -10 0
0.01
0.1
1
1
10
-80 -70 -60 -50 -40 -30 -20 -10 0
Uncertainty 0.5 MHz to 20 MHz
Uncertainty 20 MHz to 3 GHz
Uncertainty 3 GHz to 6 GHz
Uncertainty 6 GHz to 20 GHz
Uncertainty 0.5 MHz to 20 MHz
Uncertainty 20 MHz to 3 GHz
Uncertainty 3 GHz to 6 GHz
Uncertainty 6 GHz to 20 GHz
Uncertainty 0.5 MHz to 20 MHz
Uncertainty 20 MHz to 3 GHz
Uncertainty 3 GHz to 6 GHz
Uncertainty 6 GHz to 20 GHz
Uncertainty 0.5 MHz to 20 MHz
Uncertainty 20 MHz to 3 GHz
Uncertainty 3 GHz to 6 GHz
Uncertainty 6 GHz to 20 GHz
3652A Calibration Kit (K-Connector)
Corrected System Performance and Uncertainties:
MS202x/3xC Model with 12-term SOLT calibration including
isolation using 3652A Calibration Kit
Frequency Range (GHz) Directivity (dB)
≤ 5 > 42
≤ 15 > 36
≤ 20* > 32
Frequency Range (GHz) Typical Low Port Power (dBm)
≤ 3 –25
≤ 6 –25
≤ 20 –25
* N Connector guaranteed to 18 GHz, typical > 18 GHz
Measurement Uncertainties
The following graphs provide measurement uncertainty at 23 ºC ± 5 ºC for the above indicated connector type and calibration.
Errors are worse-case contributions of residual directivity, source match, frequency response, network analyzer dynamic range,
and connector repeatability. For two-port measurements, transmission tracking, crosstalk, and physical load match termination
were added. Isolation calibration and an IF Bandwidth of 10 Hz is used.
8
Page 9

+ Spectrum Analyzer Functional Specifications (Models MS2036/38C only)
Frequency
Frequency Range 9 kHz to 20 GHz (usable to 0 Hz), Preamp 100 kHz to 20 GHz
Tuning Resolution 1 Hz
Frequency Reference
External Reference Frequencies 1, 1.2288, 1.54 4, 2.048, 2.4576, 4.8, 4.9152, 5, 9.8304, 10, 13, 19.6608 MHz
Frequency Span 10 Hz to 20 GHz including zero span
Sweep Time 10 μs to 600 seconds in zero span
Sweep Time Accuracy ± 2% in zero span
Bandwidth
Resolution Bandwidth (RBW) 1 Hz to 10 MHz in 1–3 sequence ± 10% (–3 dB bandwidth)
Video Bandwidth (VBW) 1 Hz to 10 MHz in 1–3 sequence (–3 dB bandwidth)
RBW with Quasi-Peak Detection 200 Hz, 9 KHz, 120 kHz (– 6 dB bandwidth)
VBW with Quasi-Peak Detection Auto VBW is On, RBW/VBW = 1
Spect ral Purity
SSB Phase Noise at 1 GHz
Amplitude Ranges
Dynamic Range > 104 dB @ 2.4 GHz, 2/3 (TOI -DANL) in 1 Hz RBW
Measurement Range DANL to +30 dBm
Display Range 1 to 15 dB/div in 1 dB steps, ten divisions displayed
Reference Level Range –120 dBm to +30 dBm
Attenuator Resolution 0 to 65 dB, 5 dB steps
Amplitude Units Log Scale Modes: dBm, dBV, dBmv, dBμVLinear Scale Modes: nV, μV, mV, V, kV, nW, μW, mW, W, kW
Maximum Continuous Input
Amplitude Accuracy (single sine wave input < Ref level, and > DANL, auto attenuation)
20 °C to 30 °C after 30 minute warm-up
–10 °C to 50 °C after 60 minute warm-up Add ± 1.0 dB, 100 kHz to 20 GHz
Displayed Average Noise Level (DANL) (RMS detection, VBW/Avg type = Log., Ref Level = –20 dBm for preamp Of f and –50 dBm for preamp On)
(DANL in 1 Hz RBW, 0 dB attenuation) Preamp O ff
10 MHz to 4 GHz –141 dBm
> 4 GHz to 9 GHz –134 dBm
> 9 GHz to 13 GHz –129 dBm
> 13 GHz to 20 GHz –123 dBm (MS2038C only)
10 MHz to 4 GHz –160 dBm
> 4 GHz to 9 GHz –156 dBm
> 9 GHz to 13 GHz –152 dBm
> 13 GHz to 20 GHz –145 dBm
Aging: ± 1.0 ppm/10 years
Accuracy: ± 0.3 ppm (25 °C ± 25 °C) + aging
–100 dBc/ Hz @ 10 kHz offset from carrier (–104 dBc /Hz t ypical)
–102 dBc/Hz @ 100 kHz of fset from carrier (–107 dBc/Hz typical)
–107 dBc/Hz @ 1 MHz offset from car rier (–114 dBc/Hz typical)
–120 dBc/Hz @ 10 MHz offset from carrier (–129 dBc/Hz typical)
+30 dBm Peak, ± 50 VDC (≥ 10 dB Attn)
+23 dBm Peak, ± 50 VDC (< 10 dB Attn)
+13 dBm Peak, ± 50 VDC (Preamp On)
Typical: ± 0.5 dB, 100 kHz to 20 GHz
Maximum: ± 1.3 dB, 100 kHz to 13 GHz
Add ± 1.0 dB, 13 GHz to 20 GHz
Preamp On
9
Page 10

+ Spectrum Analyzer Functional Specifications (Models MS2036/38C only) (continued)
Spurs
Preamp O ff (RF input terminated, 0 dB input attenuation)
Residual Spurious
Input-Related Spurious
Third-Order Intercept (TOI) (–20 dBm tones 100 kHz apart, –20 dBm Ref level, 0 dB input attenuation, preamp Off )
2.4 GHz +15 dBm
50 MHz to 20 GHz +20 dBm typical
P1dB
< 4 GHz +5 dBm typical
4 GHz to 20 GHz +12 dBm typical
Second Harmonic Distortion
50 MHz –54 dBc
< 4 GHz –60 dBc typical
> 4 GHz –75 dBc typical
VSWR
> 10 dB input attenuation
< 20 GHz
–90 dBm 9 kHz to 13 GHz –85 dBm 13 GHz to 20 GHz
Preamp On (RF input terminated, 0 dB input attenuation)
–100 dBm 1 MHz to 20 GHz
(0 dB attenuation, –30 dBm input, span < 1.7 GHz)
–60 dBc, –70 dBc typical
1:5:1 typical
10
Page 11

VNA Performance Capabilities (MS202x/3xC)
Measurement Parameters
Number of Traces
Trace Format
Graph Types
Domains
Frequency
Distance
Time
Frequency Sweep Type: Linear
Data Points
Limit Lines
Test Limits
Data Averaging
Smoothing
IF Bandwidth
Reference Plane
Auto Reference Plane Ex tension
Frequency Range
Group Delay Aper ture
Group Delay Range
Trace Memory
Trace Mat h
Number of Markers
Marker Types
Marker Readout St yles
Marker Search
Correction Models
Calibration Methods
Calibration Standards’ Coef ficients
Cal Cor rect ion Toggle
Dispersion Compensation
Impedance Conversion
Units
Bias Tee Settings
Timebase Reference
File Storage Types
Ethernet Configuration
Languages
S11, S21, S22, S12, S
, S
, S
d1d
1
, S
c1c
d1c
c1d
1
1
1
Four: TR1, TR2, TR3, TR4
Single, Dual, Tri, Quad. When used with Number of Traces, overlays are possible including a Single Format with Four trace overlays.
Log Magnitude
SWR
Phase
Real
Imaginary
Group Delay
Smith Chart
Log Mag / 2 (1-Port Cable Loss)
Linear Polar
Log Polar
Real Impedance
Imaginary Impedance
Frequency Domain, Time Domain, Distance Domain
Start Frequency, Stop Frequency, Center Frequency, Span
Start Distance, Stop Distance
Start Time, Stop Time
Single Sweep, Continuous
2 to 4001 (arbitrary setting); data points can be reduced without recalibration.
Upper, Lower, 10 segmented Upper, 10 segmented Lower
Pass/Fail for Upper, Pass/Fail for Lower, Limit Audible Alarm
Sweep-by-sweep
0 to 20%
10, 30, 100, 300, 1k, 3k, 10k, 30k, 100k (Hz)
The reference planes of a calibration (or other normalization) can be changed by entering a line length. Assumes no loss, f lat magnitude,
linear phase, and constant impedance.
Instead of manually entering a line length, this feature automatically adjusts phase shift from the current c alibration (or other normalization) to
compensate for external cables (or test f ixtures). Assumes no loss, f lat magnitude, linear phase, and constant impedance.
Frequency range of the measurement can be narrowed within the calibration range without recalibration.
Defined as the frequency span over which the phase change is computed at a given frequency point. The aperture can be changed without
recalibration. The minimum aperture is the frequency range divided by the number of points in calibration and can be increased to 20% of the
frequency range.
< 180º of phase change within the aperture
A separate memory for each trace can be used to store measurement data for later display. The trace data can be saved and recalled.
Complex trace math operations of subtraction, addition, multiplication, or division are provided.
Eight, arbitrary assignments to any trace
Reference, Delta
Log Mag, Cable Loss (Log Mag / 2), Log Mag and Phase, Phase, Real and Imaginary, SWR, Impedance, Admittance, Normalized Impedance,
Normalized Admittance, Polar Impedance, and Group Delay, Linear Mag, Linear Mag and Phase
Peak Search, Valley Search, Find Marker Value
Full 2-Port, Full S11, Full S22, Full S11 & S22, Response S21, Response S12, Response S21 & S12, Response S11, Response S22,
Response S11 & S22, One-Path Two-Port (S11,S21), One- Path Two- Port (S22,S12)
Short-Open-Load-Through (SOLT), Offset-Short (SSLT), and Triple -Offset-Short (SSST)
Coax: N-Connector, K-Connector, 7/16, TNC, SMA, and four User Defined
Waveguide: WG11A, WG12, WG13, WG14, WG15, WG16, WG17, WG18, WG20, and four User Defined
On/Of f
Waveguide correction that improves accuracy of distance-to-fault data by compensating for different wavelengths propagating at different speeds.
Suppor t for 50 Ω and 75 Ω are provided.
Meters, Feet
Internal, External, Off
Internal, External (10 MHz)
Measurement, Setup (with CAL), Setup (without CAL), S2P (Real/Imag), S2P (Lin Mag/Phase), S2P (Log Mag/Phase), JPEG
DHCP or Manual (Static); IP, Gateway, Subnet entries
English, French, German, Spanish, Chinese, Japanese, Korean, Italian, plus two User Defined
11
Page 12

+ Spectrum Analyzer Performance Capabilities
Measurements
Field Strength (uses antenna calibration tables to measure dBm/m2 or dBmV/m)
Occupied Bandwidth (measures 99% to 1% power channel of a signal)
Smart Measurements
Setup Parameters
Frequency Center/Start /Stop, Span, Frequency Step, Signal Standard, Channel #
Amplitude Reference Level (RL), Scale, Attenuation Auto/Level, RL Of fset, Pre-Amp On/Off, Detection
Span Span, Span Up/Down (1-2-5), Full Span, Zero Span, Last Span
Bandwidth RBW, Auto RBW, VBW, Auto VBW, RBW/ VBW, Span/RBW
File Save, Recall, Delete, Director y Management
Save/Rec all Setups, Measurements, Limit Lines, Screen Shots Jpeg (save only), Save-on-Event
Save-on-Event Crossing Limit Line, Sweep Complete, Save-then-Stop, Clear All
Delete Selected File, All Measurements, All Mode Files, All Content
Directory Management Sor t Method (Name/Type/Date), Ascend/Descend, Internal/USB, Copy
Applic ation Options Impedance (50 Ω, 75 Ω, Other)
Sweep Functions
Sweep Single/Continuous, Manual Trigger, Reset, Detection, Minimum Sweep Time, Trigger Type
Sweep Mode Fast, Performance, No FFT
Detection Peak, RMS/Avg, Negative, Sample, Quasi-peak
Triggers Free Run, External, Video, Delay, Level, Slope, Hysteresis, Holdof f, Force Trigger Once
Trace Functions
Traces Up to three Traces (A , B, C), View/Blank, Write/Hold, Trace A/ B/C Operations
Trace A Operations Nor mal, Max Hold, Min Hold, Average, # of Averages, (always the live trace)
Trace B Operations
Trace C Operations
Marker Functions
Markers
Marker Types Style (Fixed/Tracking), Noise Marker, Frequency Counter Marker
Marker Auto-Position
Marker Table 1-6 markers frequency and amplitude plus delta markers frequency offset and amplitude
Limit Line Functions
Limit Lines Upper/Lower, On/Of f, Edit, Move, Envelope, Advanced, Limit Alar m, Default Limit
Limit Line Edit Frequency, Amplitude, Add Point, Add Ver tical, Delete Point, Next Point Left/ Right
Limit Line Move To Current Center Frequency, By dB or Hz, To Marker 1, Offset from Marker 1
Limit Line Envelope Create Envelope, Update A mplitude, Number of Points (41), Offset, Shape Square/Slope
Limit Line Advanced Type (Absolute/Relative), Mirror, Save/Recall
Channel Power (measures the total power in a specified bandwidth)
ACPR (adjacent channel power ratio)
C/I (carrier-to -interference ratio)
Emission Mask (recall limit lines as emission mask)
A→B, B↔ C, Max Hold, Min Hold
A→C, B↔ C, Max Hold, Min Hold, A – B→C, B – A→C, Relative Referenc e (dB), Scale
Markers 1-6 each with a Delta Marker, or Marker 1 Reference with Six Delta Markers,
Marker Table (On/Off/Large), All Markers Off
Peak Search, Next Peak (Right /Left), Peak Threshold %, Set Marker to Channel,
Marker Frequency to Center, Delta Marker to Span, Mar ker to Reference Level
12
Page 13

Measurement Options Specifications
Time Domain (Option 0002) (includes Distance Domain Option 0501)
The VNA Master can also display the S-parameter measurements in the time or distance domain using lowpass or bandpass
processing analysis modes. The broadband frequency coverage coupled with 4001 data points means you can measure
discontinuities both near and far with unprecedented clarity for a handheld tool. With this option, you can simultaneously view
S-parameters in frequency, time, and distance domain to quickly identify faults in the field. Advanced features available with
this option include step response, phasor impulse, gating, and frequency gated in time. The option includes computational
routines that further enhance the Distance Domain results by compensating for cable loss, relative velocity of propagation,
and dispersion compensation in waveguide.
Round-Trip (reflection) Fault Resolution (meter s): (0.5 x c x Vp) / ∆F; (c is speed of light = 3E8 m/s, ∆F is F2 – F1 in Hz)
Distance Domain
One-Way (transmission) Fault Resolution (meters): (c x Vp) / ∆F; (c is speed of light = 3E8 m/s, ∆F is F2 – F1 in Hz)
Horizontal Range (meters): 0 to (data points – 1) x Fault Resolution to a maximum of 3000 m (98 43 ft.)
Windowing Rectangular, Nominal Side Lobe (NSL), Low Side Lobe (LSL), and Minimum Side Lobe (MSL)
Power Monitor (Option 0005) Requires external detector
Transmitter measurements in the field are possible when
using this VNA Master software mode with a separately
purchased Anritsu 560 series detector. A variety of detectors
are available to 50 GHz, but the popular 560-7N50B covers
10 MHz to 20 GHz with a measurement range of –50 to
+20 dBm with better than 0.5 dB flatness to 18 GHz. After
zeroing the detector to ensure accuracy at low power levels,
the software offers intuitive operation for absolute and
relative readouts in dBm or Watts.
Display Range
Measurement Range
Offset Range
Resolution
Accuracy
–80 to +80 dBm (10 pW to 100 kW )
–50 to +20 dBm (10 nW to 40 mW)
0 to +60 dB
0.1 dB, 0.1 xW (x = n, μ, m based on detector power)
±1 dB maximum for >– 40 dBm using
560-7N50B detector
Power Monitor Detectors* (Ordered separately):
Part Numbers
Frequency Range
Impedance
Power Range
Return Loss
Input Connector
Frequency Response
*See www.us.anritsu.com for additional detectors
560-7N50B 560-7S50B
0.01 to 20 GHz 0.01 to 20 GHz
50 Ω 50 Ω
–55 dBm to +16 dBm –55 dBm to +16 dBm
15 dB, < 0.04 GHz
22 dB, < 8 GHz
17 dB, < 18 GHz
14 dB, < 20 GHz
N(m) WSMA(m)
±0.5 dB, < 18 GHz
±1.25 dB, < 20 GHz
15 dB, < 0.04 GHz
22 dB, < 8 GHz
17 dB, < 18 GHz
14 dB, < 20 GHz
±0.5 dB, < 18 GHz
±1.25 dB, < 20 GHz
Secure Data Operation (Option 0007)
For highly secure data handling requirements, this software option prevents the storing of measurement setup or data
information onto any internal file storage location. Instead, setup and measurement information is stored ONLY to the
external USB memory location. A simple factory preset prepares the VNA Master for transportation while the USB memory
remains behind in the secure environment. The VNA Master cannot be switched between secure and non-secure operation by
the user once configured for secure data operation. As an additional security measure, with this option enabled the user can
choose to blank the frequency values displayed on the screen.
13
Page 14

Bias Tee (Option 0010)
Port 1
Port 2
Internal
Bias Tee
Internal
Bias Tee
Internal Bias
+12 to +32 V
450 mA Max
RF Test
Source
Switch
Switch
External Bias Input
(±50 V, 500 mA Max)
For tower mounted amplifier tests, the MS20x/3xC series
with optional internal bias tees can supply both DC and RF
signals on the center conductor of the cable during
measurements. For frequency sweeps in excess of 2 MHz,
the VNA Master can supply internal voltage control from
+12 to +32 V in 0.1 V steps up to 450 mA. To extend
battery life, an external power supply can substitute for the
internal supply by using the external bias inputs instead.
Both test ports can be configured to supply voltage via this
integrated bias tees option. Bias can be directed to VNA
Port 1 or Port 2.
Frequency Range
Internal Voltage/Current
Internal Resolut ion
External Voltage/Current
Bias Tee Selections
2 MHz to 6 GHz (MS20x6C)
2 MHz to 20 GHz (MS20x8C)
+12V to +32V at 450 ma. Steady rate
0.1V
±50 V at 500 mA steady rate
Internal, External, Off
Vector Voltmeter (Option 0015)
A phased array system relies on phase matched cables for
nominal performance. For this class of application, the VNA
Master offers this special software mode to simplify phase
matching cables at a single frequency. The similarity between
the popular vector voltmeter and this software mode ensures
minimal training is required to phase match cables. Operation
is as simple as configuring the display for absolute or relative
measurements. The easy-to-read large fonts show either
reflection or transmission measurements using impedance,
magnitude, or VSWR readouts. For instrument landing system
(ILS) or VHF Omni-directional Range (VOR) applications,
a table view improves operator efficiency when phase
matching up to twelve cables. The MS202x/3xC solution is
superior because the signal source is included internally,
precluding the need for an external signal generator.
CW Frequency Range
Measurement Display
Measurement Types
Measurement Format
5 kHz to 20 GHz
CW, Table (Twelve Entries, Plus Reference)
Return Loss, Insertion
dB/VSWR/Impedance
The VNA Master offers optional integrated bias tee for supplying DC plus RF to the
DUT as shown in this simplified block diagram. Connectivity is also provided for
external supply (instead of internal) to preserve battery consumption.
14
Page 15
High Accuracy Power Meter (Option 0019) Requires external USB power sensor.
Conduct precise measurements of CW and digitally modulated transmitters in the field using this VNA Master software mode with a
separately purchased Anritsu USB power sensor. After specifying the center frequency and zeroing the sensor to ensure accuracy at
low power levels, the software offers intuitive operation for absolute and relative readouts in dBm or Watts. Option 0019 supports
the USB Power Sensors in the following table.
USB Power Sensors (Ordered separately):
PSN50 MA 24104A MA24106A MA24108A MA24118A
Frequency Range
Description
Connector
Dynamic Range
VBW
Measurement
Measurement Uncertainty
Datasheet for Additional
Specifications
Notes:
1) Total RSS measurement uncertainty (0 ºC to 50 ºC) for power measurements of a CW signal greater than –20 dBm with zero mismatch errors
2) Expanded uncertainty with K=2 for power measurements of a CW signal greater than +20 dBm with a matched load. Measurement results referenced to the input side of the sensor.
3) Expanded uncertainty with K=2 for power measurements of a CW signal greater than –20 dBm with zero mismatch errors
50 MHz to 6 GHz 6 00 MHz to 4 GHz 50 MHz to 6 GHz 10 MHz to 8 GHz 10 MHz to 18 GHz
High Accuracy
RF Power Sensor
Type N, male, 50 Ω Type N, female, Ω Type N, male, 50 Ω Type N, male, 50 Ω Type N, male, 50 Ω
–30 dBm to +20 dBm
(0.001 mW to 100 mW )
100 Hz 100 Hz 100 Hz 50 kHz 50 kHz
True-RM S True-RM S True-RM S
1
±0.16 dB
11410-0 0414 11410-0 0483 11410-00424 11410-0050 4 11410-0050 4
Inline
High Power Sensor
+3 dBm to +51.76 dBm
(2 mW to 150 W)
2
±0.17 dB
High Accuracy
RF Power Sensor
–40 dBm to +23 dBm
(0.1 μW to 200 mW)
1
±0.16 dB
Microwave
USB Power Sensor
–40 dBm to +20 dBm
(0.1 μW to 100 mW )
True-RM S. Slot Power,
Burst Average Power
3
±0.18 dB
Microwave
USB Power Sensor
–40 dBm to +20 dBm
(0.1 μW to 100 mW )
True-RM S, Slot power,
Burst Average power
3
±0.18 dB
Interference Analyzer (Option 0025) (Models MS2036/38C only) (Recommend GPS)
Spectr um
Field Strength
Occupied Bandwidth
Channel Power
Adjacent Channel Power (ACPR)
A M/FM /SSB Demodulation (Wide/Nar row FM, Upper/Lower SSB), (audio out only)
Carrier-to-Interference ratio (C/I)
Spectrogram (Collect data up to one week)
Measurements
Application Options
Signal Strength (Gives visual and aural indication of signal strength)
Received Signal Strength Indicator (RSSI) (collect data up to one week)
Gives visual and aural indication of signal strength
Signal ID (up to 12 signals)
Center Frequency
Bandwidth
Signal Type (FM, GSM, W- CDMA, CDMA, Wi-Fi)
Closest Channel Number
Number of Carriers
Signal-to-Nose Ratio (SNR) > 10 dB
Bias-Tee (On/Off), Impedance (50 Ω, 75 Ω, Other)
Channel Scanner (Option 0027) (Models MS2036/38C only)
Number of Channels
Measurements
Scanner
Amplitude
Custom Scan
Frequency Range
Frequency Accuracy
Measurement Range
Application Options
)
1 to 20 Channels (Power Levels)
Graph/Table, Max Hold (On/5 sec/Off ), Frequency/Channel, Current /Maximum, Dual Color
Scan Channels, Scan Frequencies, Scan Customer List, Scan Script Master™
Reference Level, Scale
Signal Standard, Channel, # of Channels, Channel Step Size, Custom Scan
150 kHz to 13 GHz
± 10 Hz + Time base error
–110 dBm to +30 dBm
Bias-Tee (On/Off), Impedance (50 Ω, 75 Ω, Other)
15
Page 16

GPS (Option 0031), (Models MS2036/38C only) Requires external GPS antenna
Built-in GPS provides location information (latitude, longitude, altitude) and Universal Time (UT) information for storage
along with trace data so you can later verify that measurements were taken at the right location. The GPS option requires a
separately ordered magnet mount GPS antenna (2000-1528-R), which is configured with a 15 foot (~5 m) cable to mount
outside on a metallic surface. Frequency accuracy is enhanced for the Spectrum Analyzer when Options 0025 Interference
Analyzer and 0027 Channel Scanner are engaged.
Setup
GPS Time/Location Indicator
High Frequency Accuracy
GPS Lock – af ter antenna is disconnected
Connector
On/Of f, Antenna Voltage 3.3/5.0 V, GPS Info
Time, Latitude, Longitude and Altitude on display
Time, Latitude, Longitude and Altitude with trace storage
Spectr um Analyzer, Interference Analyzer, CW Signal Generator when GPS Antenna is connected < ± 50 ppb with GPS On, 3 minutes after
satellite lock in selected mode
< ± 50 ppb for 3 days, 0 °C to 50 °C ambient temperature
SMA, female
Balanced/Differential S-Parameters, 1-port (Option 0077)
As an alternative to a sampling oscilloscope, verifying the performance and identifying discontinuities in high-data-rate
differential cables is now possible with the VNA Master. After a full two-port calibration, connect your differential cable
directly to the two test ports and reveal the S
differential S-Parameters, S
c1c
1
, S
d1c
, or S
1
performance, which is essentially differential return loss, or any of the other
d1d
1
. With optional time domain, you can convert frequency sweeps to distance. This
c1d
1
capability is especially valuable for applications in high data rate cables where balanced data formats are used to isolate noise
and interference.
Distance Domain (Option 0501) (included in Time Domain Option 0002)
Distance Domain Analysis is a powerful field test tool to analyze cables for faults, including minor discontinuities that may
occur due to a loose connection, corrosion, or other aging effects. By using Frequency Domain Reflectometry (FDR), the
VNA Master exploits a user-specified band of full power operational frequencies (instead of DC pulses from TDR approaches) to
more precisely identify cable discontinuities. The VNA Master converts S-parameters from frequency domain into distance
domain on the horizontal display axis, using a mathematical computation called Inverse Fourier Transform. Connect a
reflection at the opposite end of the cable and the discontinuities appear versus distance to reveal any potential maintenance
issues. When access to both ends of the cable is convenient, a similar distance domain analysis is available on transmission
measurements.
Option 0501 Distance Domain will improve your productivity with displays of the cable in terms of discontinuities versus
distance. This readout can then be compared against previous measurements (from stored data) to determine whether any
degradations have occurred since installation (or the last maintenance activity). More importantly, you will know precisely
where to go to fix the problem and so minimize or prevent downtime of the system.
16
Page 17

VNA Master General Specifications (MS202x/3xC)
Setup Parameters
System
System Options
File
Save/Recall
Delete
Directory
Management
Internal Trace/Setup
Memor y
External Trace/Setup
Memor y
Mode Switching
Connectors
Maximum Input
(Damag e Level)
into Vector Network
Analyzer
Maximum Input
(Damag e Level) into
Spect rum A nalyzer
VNA Connectors
Spect rum A nalyzer
Connectors
GPS
External Power
LAN Connection
USB Interface (2)
USB Interface
Headset Jack
External Trigger
10 MHz Out
Display
Size
Resolution
Status (Temperature, Battery Info, S/N, Firmware Ver, IP
Address, Options Installed)
Self Test, Applic ation Self Test
GPS (see Option 0031)
Name, Date and Time, Ethernet Configuration, Brightness, Volume
Language (English, French, German, Spanish, Chinese,
Japanese, Korean, Italian, User defined)
Reset (Factory Defaults, Master Reset, Update Firmware)
Save, Recall, Delete, Director y Management
Setups, Measurements, Screen Shots Jpeg (save only)
Selected File, All Measurements, All Mode Files, All Content
Sort Method (Name/Type/Date), Ascend/Descend, Internal/
USB, Copy
> 13,000 traces
Limited by size of USB Flash drive
Auto-Stores/Recalls most recently used Setup Parameters in
the Mode
+23 dBm, ±50 VDC (MS202x/3xC)
+30 dBm, ±50 VDC (MS203xC)
Type N female (or K female with opt 0011, MS20x8C only) VNA
port (x2)
Type BNC female Bias Tee por t (enabled with opt 0 010) (x2)
Type BNC female External Reference In por t
Type N, female (or K female with opt 0011) (MS203xC)
SMA female (Available with opt 0031 GPS)
5.5 mm barrel connector, 12 to 15 VDC, < 5.0 Amps
RJ48C, 10/100 Mbps, Connect to PC or LAN for Remote Access
(Available with opt 0411 Ethernet)
Type A, Connect Flash Drive and Power Sensor
5-pin mini-B, Connect to PC for data transfer
2.5 mm barrel connector
BNC, female, 50 Ω, Maximum Input ± 5 VDC
SMA, female, 50 Ω
8.4 in, daylight viewable color LCD
800 x 600
Size and Weight
Height 211 mm (8.3 in)
Dimensions
Weight , Including Battery
Width 315 mm (12.4 in)
Depth
4.5 kg (9.9 lbs) (MS202xC)
4.8 kg (10.5 lbs) (MS203xC)
78 mm (3.1 in) (MS202xC)
97 mm (3.8 in) (MS203xC)
Safety
Safety Class
Product Safety
EN 61010-1 Class 1
IEC 60950-1 when used with Anritsu supplied Power Supply
Environmental
MIL-PRF-28800F, Class 2
Environmental Conditions
Temperature, operating (º C)
(3.8.2.1 & 4.5.5.14)
Temperature, not operating (ºC)
(3.8.2.2 & 4.5.5.1)
Relative humidity
(3.8.2.3 & 4.5.5.1)
Altitude, not operating
(3.8.3 & 4.5.5. 2)
Altitude, operating
(3.8.3 & 4.5.5. 2)
Vibration limits
(3.8.4.1 & 4.5.5.3.1)
Shock, functional
(3.8.5.1 & 4.5.5.4.1)
Transit Drop
(3.8.5. 2 & 4.5.5.4.2)
Bench handling
(3.8.5.3 & 4.5.5.4.3)
Shock, high impact
(3.8.5.4 & 4.5.5.4.4)
Salt exposure structural parts
(3.8.8. 2 & 4.5.6.2. 2)
* Qualified by similarity (tested on a similar product)
** Not defined in standard; must be invoked and defined by purchase description
*** Not required for Class 2 equipment
MS202x/3xC
Passed, –10 ºC to 5 5 ºC, Humidity 85%
Passed, –51 ºC to 71 ºC
Passed
Passed*, 4600 m
Passed*, 4600 m
Passed
Passed
Passed
Passed
Not Required**
Not Required***
Electromagnetic Compatibility
European Union
Australia and
New Zealand
Inter ference
Emissions
Immunity
CE Mark, EMC Directive 89/336/EEC, 92/31/EEC, 93/68/EEC
and Low Voltage Directive 73/23/EEC, 93/68/EEC
C-tick N274
EN 61326-1
EN 55011
EN 61000 -4 -2/- 4-3/-4-4/-4- 5/-4-6/-4 -11
Power
Field replaceable Li- Ion Battery
(633-44: 6600 mAh, 4.5 Amps)
DC power from Universal
110/220V AC/DC Adapter
Life time charging cycles
(Li-I on Batter y, 633-44)
Battery O peration
40 Watts on bat tery power only
55 Watts running off AC/DC adaptor
while charging battery
>300
(80% of initial capacity)
2.5 hours, typical
17
Page 18
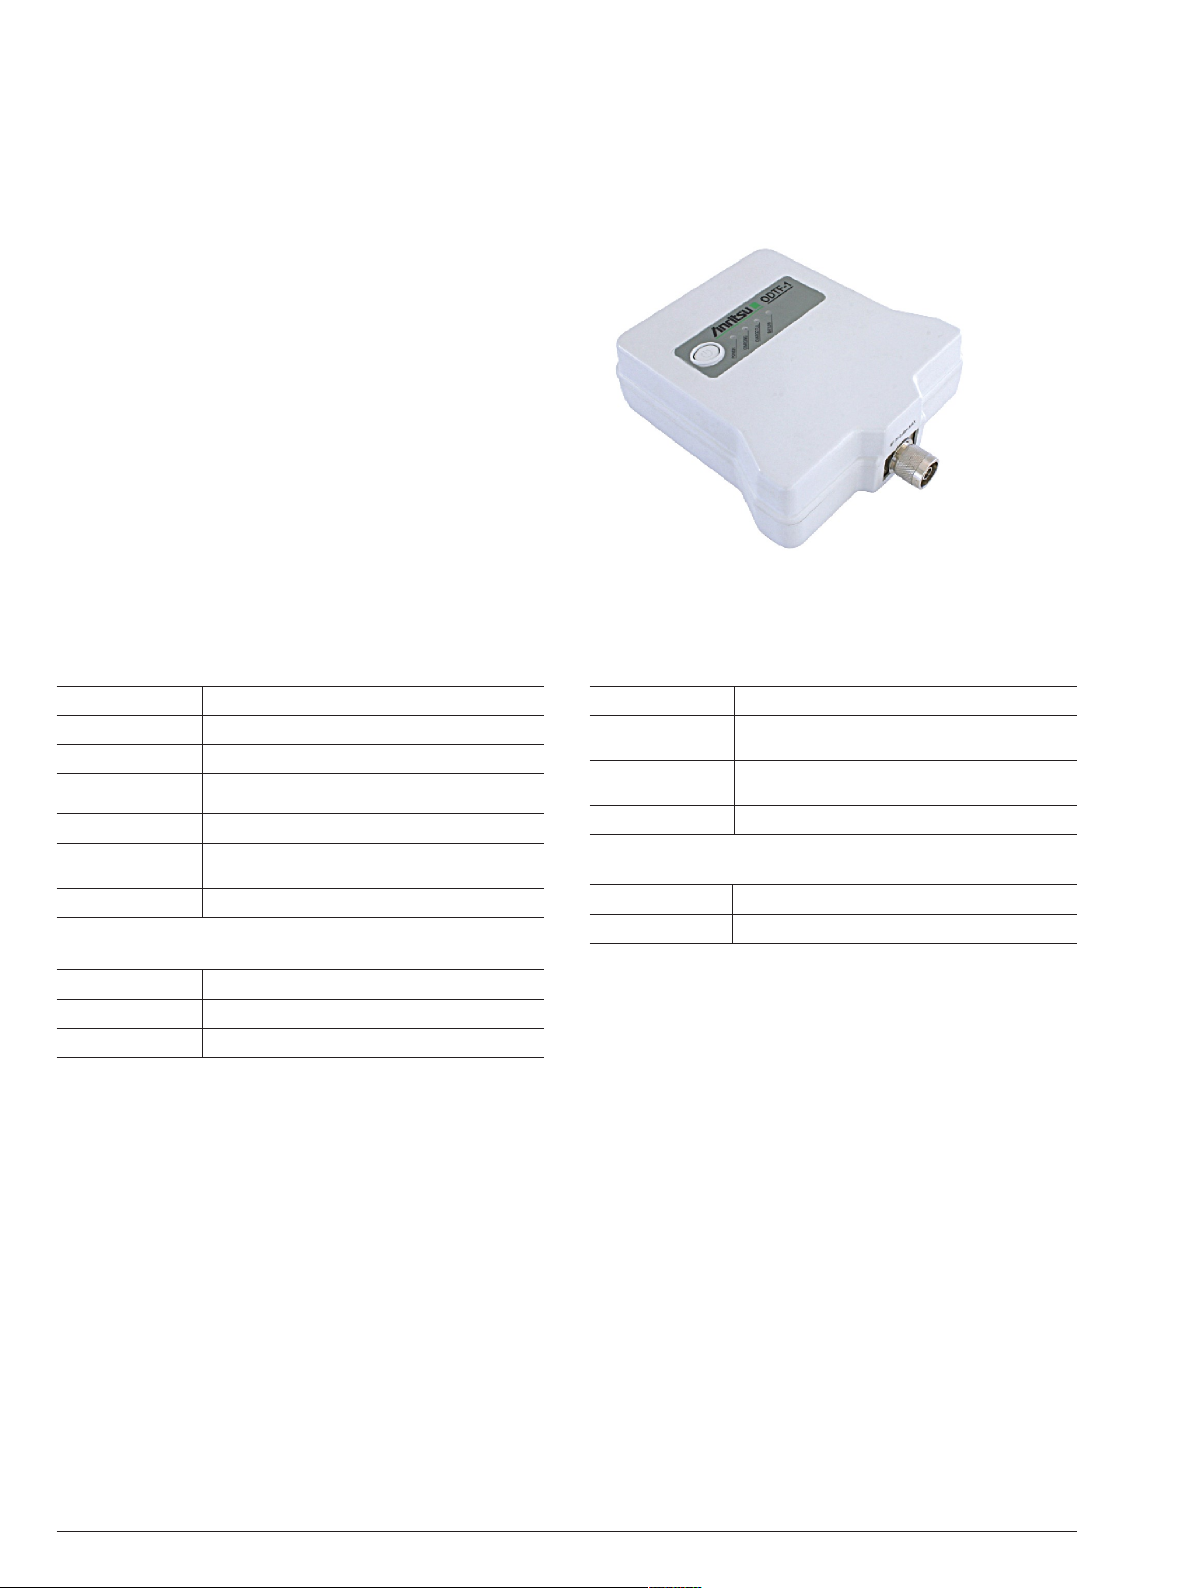
Ancillary Module extends Optical Fiber Testing to Distance-to-Fault
The ODTF-1 module is primarily intended for field use by technicians and engineers responsible for the deployment and
maintenance of remote radio heads (RRH), and nicely complements the field diagnostic power of the VNA Master. The ODTF-1
module is fully compatible with the MS202x/3xC VNA Masters which are equipped with the Time Domain Option 0002 or
Distance Domain Option 0501. Field operation of the ODTF-1 module with the VNA Master requires the normal DTF (RF/
microwave) mode along with simple modification of some of the setup parameters such as Vp, cable loss, and frequency.
VNA Master users need only to connect a short cable between
the RF output of the VNA and the ODTF-1 module and
perform a 1-port calibration at the end of the cable. Essentially
the ODTF-1 module is simply a wavelength translator, RF test
signals in, RF signals returning. The same physics that apply to
the traditional DTF measurements apply to ODTF-1 meaning
highly accurate measurements can be made with event
resolution as good as 10 cm. The same trade-offs carry over as
well so better event resolution translates to shorter maximum
distance, and vice-versa. Max distance is specified at 1020
meters (3345 ft).
The battery life of the ODTF-1 module matches the battery life
of the VNA Master. It can be charged with the same 40-168-R
power supply so there is no need to maintain different power
supplies.
Using a VNA Master equipped with Option 0002 or 0501, this ODTF-1 optical module
translates the optical signals to the RF domain of the VNA, to display fault locations in
standard optical fibers.
Specifications
Wavelength
Frequency Range
Fiber Type
Event Resolution
Horizontal Range
Optical Dynamic
Range
Optical Output Power
1550 nm t ypical
1 GHz to GHz
Single Mode Fiber (SM F)
10.2 cm (0.335 ft) maximum, or 150/(n*∆F), ∆F in MHz, n
is IOR
1020 meter (3345 ft) maximum, or (#dp-1)*Event Resolution
30 dB
3 dBm typical
Input and Output Ports
RF Connector
Max RF Inpu t Power
Optical Connector
N(m)
+ 5 dBm
FC/APC
General Specifications
External DC Input
Elect romagnetic
Compatibility
Temperature
Operating
Non- operating
+12.5 to +15 VDC, 3A maximum
Meets European Community requirements for CE marking
0 to 50 ºC
0 to 70 º C recommended
Size and Weight
Size
Weight
15.7*5.37*18.6 cm (6.18*2.11*7.3 in.)
< 1 kg (2.2 lbs)
18
Page 19

Master Software Tools and Remote Programming
Each VNA Master ships with a versatile test assistant: a copy of Anritsu’s Master Software Tools for Windows® 2000/XP/Vista/7.
This allows an operator to add the processing capabilities of a PC and this software utility to the VNA Master to form a
powerful and flexible measurement solution for network analysis. For automation, the VNA Master also supports remote
programming via the Ethernet or USB interface.
Connect VNA Master to a PC for archiving and additional post-processing.
A standard tilt-bail provides convenient use on a bench.
Feature Benefit
Powerful data management tool for storing and sifting through measurement results
Connect to a PC using USB2.0 (full-speed), Ethernet LAN,
or Direct Ethernet
Store an unlimited number of setups, traces, and J PEGs
(limited only by PC memory)
Manipulate traces and further optimize displays Versatility to further analyze results without re-taking measurements
Update with the latest firmware
Remote programming via Ethernet or USB
MST simplifies transfers, printing, and archival of displays
and setups
Unleash power ful MST capabilities by using variety of popular remote interfaces
Develop libraries of frequently used setups and typical results
Easily download and upgrade to newest features from
www.us.anritsu.com
Increase throughput by automating repetitive or operator
intensive tasks
19
Page 20

Ordering Information
MS2026C
1
VNA Master,
2-port, VNA
5 kHz to 6 GHz
MS2028C
VNA Master,
2-port, VNA
5 kHz to 20 GHz
1
MS2036C
VNA Master
+ Spectrum Analyzer, S/A
9 kHz to 9 GHz
1
MS2038C
1
VNA Master
+ Spectrum Analyzer, S/A
9 kHz to 20 GHz
Options Description
MS2026C-0002 MS2028C-0002 MS2036C-0002 MS2038C-0002 Time Domain (includes DTF capability)
MS2026C-0005 MS2028C-0005 – – Power Monitor (requires external detector)
MS2026C-0007 MS2028C-0007 MS2036C-0007 MS2038C-0007 Secure Data Operation
MS2026C-0010 MS2028C-0010 MS2036C-0010 MS2038C-0010 Built-in Bias-Tee
– MS2028C-0011 – MS2028C-0011 K(f) Test Port Connectors
MS2026C-0015 MS2028C-0015 MS2046C-0015 MS2038C-0015 Vector Voltmeter
MS2026C-0019 MS2028C-0019 MS2036C-0019 MS2038C-0019 High Accuracy Power Meter
(requires external USB sensor)
– – MS2036C-0025 MS2038C-0025 Interference Analysis, 9 kHz to 9/20 GHz
– – MS2036C-0027 MS2038C-0027 Channel Scanner, 9 kHz to 9/20 GHz
2
MS2026C-0031 MS2028C-0031 MS2036C-0031 MS2038C-0031 GPS Receiver (requires GPS antenna,
2000-1528-R)
MS2026C-0077 MS2028C-0077 MS2036C-0077 MS2038C-0077 Balanced/Differential S-Parameters, 1-port
MS2026C-0098 MS2028C-0098 MS2036C-0098 MS2038C-0098 Z-540 Calibration
MS2026C-0099 MS2028C-0099 MS2036C-0099 MS2038C-0099 Premium Calibration
MS2026C-0501 MS2028C-0501 MS2036C-0501 MS2038C-0501 Distance Domain (included in Option 0002)
Notes:
1) Includes standard one-year warranty and Certificate of Calibration and Conformance.
2) Requires external antenna (2000-xxxx or 61532 Antenna Kit), Recommend Option 0031 GPS
2
MS202x/3xC Standard Accessories
10580-00220 VNA Master User’s Guide
65729 Soft Carrying Case
2300-498 Master Software Tools CD ROM
633-44 Rechargeable Battery, Li-Ion, 6.6 Ah
40-168-R AC-DC Adapter
806-141-R Automotive Cigarette Lighter 12 V DC adapter
3-2000-1498 USB A-type to Mini USB B-type cable, 3.05 m (10 ft.)
2000-1371-R Ethernet cable, 2.13 m (7 ft.)
3-806-152 Ethernet Crossover Cable, 2.13 m (7 ft.)
2000-1520-R USB Flash Drive
Ancillary Equipment
ODTF-1 Optical Time Domain Module
15NNF50-1.5C Armored Test Port Cable, 1.5 meter, N(m) to N(f)
OSLN50-1 Precision Open/Short/Load, DC to 6 GHz,
42 dB Return Loss
20
Page 21

Ordering Information (continued)
Optional Accessories
High Accuracy Power Sensor
PSN50 High Accuracy Power Sensor, 50 MHz to 6 GHz
MA24104A Inline High Power Sensor, 600 MHz to 4 GHz,
True RMS
MA24106A High Accuracy Power Sensor, 50 MHz to 6 GHz,
True RMS
MA24108A High Accuracy Power Sensor, 10 MHz to 8 GHz,
True RMS
MA24118A High Accuracy Power Sensor, 10 MHz to 18 GHz,
True RMS
MA24126A High Accuracy Power Sensor, 10 MHz to 26 GHz,
True RMS
Power Monitor Detectors
560-7N50B RF Detector, 0.01 to 20 GHz, Type-N(m)
560-7S50B RF Detector, 0.01 to 20 GHz, W-SMA(m)
Detector Extender Cables
800-109 Detector Extender Cable, 7.6m (25 ft)
800-111 Detector Extender Cable, 30.5m (100 ft.)
K Connector Components
OSLK50 Precision integrated Open/Short/Load K(m),
DC to 20 GHz, 50 Ω
OSLKF50 Precision integrated Open/Short/Load K(f),
DC to 20 GHz, 50 Ω
22K50 Precision K(m) Short/Open, 40 GHz
22KF50 Precision K(f) Short/Open, 40 GHz
28K50 Precision Termination, DC to 40 GHz, 50 Ω, K(m)
28KF50 Precision Termination, DC to 40 GHz, 50 Ω, K(f)
3652A K Calibration Kit, DC to 40 GHz
N-Type Connectors
OSLN50 Precision Integrated Open/Short/Load N(m),
DC to 18 GHz, 50 Ω
OSLNF50 Precision Integrated Open/Short/Load N(f),
DCto 18 GHz, 50 Ω
22N50 Precision N(m) Short/Open, 18 GHz
22NF50 Precision N(f) Short/Open, 18 GHz
28N50-2 Precision Termination, DC to 18 GHz, 50 Ω, N(m)
28NF50-2 Precision Termination, DC to 18 GHz, 50 Ω, N(f)
OSLN50-1 Precision N(m) Open/Short/Load, 42 dB, 6 GHz
OSLNF50-1 Precision N(f) Open/Short/Load, 42 dB, 6 GHz
SM/PL-1 Precision N(m) Load, 42 dB, 6 GHz
SM/PLNF-1 Precision N(f) Load, 42 dB, 6 GHz
TNC Connector Components
1091-53-R Precision TNC(m) Open, 18 GHz, 50 Ω
1091-54-R Precision TNC(m) Short, 18 GHz, 50 Ω
1015-55-R Precision TNC(m) Load, 18 GHz, 50 Ω
1091-55-R Precision TNC(f) Open, 18 GHz, 50 Ω
1091-56-R Precision TNC(f) Short, 18 GHz, 50 Ω
1015-54-R Precision TNC(f) Load, 18 GHz, 50 Ω
7/16 Connector Components
2000-1618-R Precision Open/Short/Load, 7/16(m), 6.0 GHz
2000-1619-R Precision Open/Short/Load, 7/16(f), 6.0 GHz
Directional Antennas
2000-1411-R 824 MHz to 896 MHz, N(f), 10 dBd, Yagi
2000-1412-R 885 MHz to 975 MHz, N(f), 10 dBd, Yagi
2000-1413-R 1710 MHz to 1880 MHz, N(f), 10 dBd. Yagi
2000-1414-R 1850 MHz to 1990 MHz, N(f), 9.3 dBd, Yagi
2000-1415-R 2400 MHz to 2500 MHz, N(f), 10 dBd, Yagi
2000-1416-R 1920 MHz to 2170 MHz, N(f), 10 dBd, Yagi
2000-1519-R 500 MHz to 3000 MHz, log periodic
2000-1617 600 MHz to 21000 MHz, N(f), 5-8 dBi to 12 GHz,
0-6 dBi to 21 GHz, log periodic
Portable Antennas
2000-1200 806 MHz to 866 MHz, SMA(m), 50 Ω
2000-1473 870 MHz to 960 MHz, SMA(m), 50 Ω
2000-1035 896 MHz to 941 MHz, SMA (m), 50 Ω (1/4 wave)
2000-1030 1710 MHz to 1880 MHz, SMA(m), 50 Ω (1/2 wave)
2000-1474 1710 MHz to 1880 MHz with knuckle elbow
(1/2 wave)
2000-1031 1850 MHz to 1990 MHz, SMA(m), 50 Ω (1/2 wave)
2000-1475 1920 MHz to 1980 MHz and 2110-2170 MHz,
SMA(m), 50 Ω
2000-1032 2400 MHz to 2500 MHz, SMA(m), 50 Ω (1/2 wave)
2000-1361 2400 MHz to 2500, 5000 to 6000 MHz,
SMA(m), 50 Ω
2000-1616 20 MHz to 21000 MHz, N(f), 50 Ω
61532 Antenna Kit (Consists of: 2000-1030, 2000-1031,
2000-1032-R, 2000-1200, 2000-1035, 2000-1361,
and carrying pouch)
Bandpass Filters
1030-114-R 806 MHz to 869 MHz, N(m) to SMA(f), 50 Ω
1030-109-R 824 MHz to 849 MHz, N(m) to SMA (f), 50 Ω
1030-110-R 880 MHz to 915 MHz, N(m) to SMA (f), 50 Ω
1030-105-R 890 MHz to 915 MHz Band, 0.41 dB loss, N(m) to
SMA(f), 50 Ω
1030-111-R 1850 MHz to 1910 MHz, N(m) to SMA (f), 50 Ω
1030-106-R 1710 MHz to 1790 MHz Band, 0.34 dB loss,
N(m) to SMA(f), 50 Ω
1030-107-R 1910 MHz to 1990 MHz Band, 0.41 dB loss,
N(m) to SMA(f), 50 Ω
1030-112-R 2400 MHz to 2484 MHz, N(m) to SMA (f), 50 Ω
1030-155-R 2500 MHz to 2700 MHz, N(m) to N(f), 50 Ω
Attenuators
3-1010-122 20 dB, 5 W, DC to 12.4 GHz, N(m) to N(f)
42N50-20 20 dB, 5 W, DC to 18 GHz, N(m) to N(f)
42N50A-30 30 dB, 5 W, DC to 18 GHz, N(m) to N(f)
3-1010-123 30 dB, 50 W, DC to 8.5 GHz, N(m) to N(f)
1010-127-R 30 dB, 150 W, DC to 3 GHz, N(m) to N(f)
3-1010-124 40 dB, 100 W, DC to 8.5 GHz, N(m) to N(f),
Uni-directional
1010-121 40 dB, 100 W, DC to 18 GHz, N(m) to N(f),
Uni-directional
1010-128-R 40 dB, 150 W, DC to 3 GHz, N(m) to N(f)
Technical Data Sheet
10580-00548 VNA Master + Spectrum Analyzer Brochure
21
Page 22

Ordering Information (continued)
Manuals
10580-00305 VNA Master User’s Guide
10580-00306 VNA Master Programming Manual
10580-00289 VNA Measurement Guide
10580-00244 Spectrum Analyzer Measurement Guide
10580-00240 Power Meter Measurement Guide
10580-00215 ODTF-1 Optical Distance-to-Fault Module –
Quick Start Guide
Related Literature, Application Notes
11410-00206 Time Domain for Vector Network Analyzers
11410-00214 Reflectometer Measurements – Revisited
11410-00270 What is Your Measurement Accuracy?
11410-00373 Distance-to-Fault
11410-00387 Primer on Vector Network Analysis
11410-00414 High Accuracy Power Meter, PSN50
11410-00424 USB Power Sensor MA24106A
11410-00483 Inline High Power Sensor MA24104A
11410-00504 Microwave USB Power Sensor MA241x8A
11410-00531 Practical Tips on Making “Vector Voltmeter (VVM)”
Phase Measurements using VNA Master (Opt. 15)
11410-00472 Measuring Interference
Waveguide Calibration Components and WG/
Coaxial Adapters
Recommended waveguide calibration procedure requires
two offset shorts and a precise load. The waveguide/coax
adapter, shown attached to test port #2, adapts the VNA
Master test ports to the waveguide under test.
Part Number
1/8 Offset
Short
23UM70 24UM70 26UM70 35UM70N 5.85 to 8.20 GHz WR137, WG14 CAR70, PAR70, UAR 70, PDR70
23UM8 4 24UM84 26UM84 35UM84N 7.05 to 10.00 GHz WR112, WG15 CBR84, UBR84, PBR8 4, PDR84
23UM100 24UM100 26UM100 35UM100N 8.20 to 12.40 GHz WR90, WG16 CBR100, UBR100, PBR100, PDR100
23UM120 24UM120 26UM120 35UM120N 10.00 to 15.00 GHz WR75, WG17 CBR120, UBR120, PBR120, PDR120
23UA187 24UA187 26UA187 35UA187N 3.95 to 5.85 GHz WR187, WG12
23UA137 24UA137 26UA137 35UA137N 5.85 to 8.20 GHz WR137, WG14
23UA112 24UA112 26UA112 35UA112N 7.05 to 10.00 GHz WR112, WG15
23UA90 24UA90 26UA90 35UA90N 8.20 to 12.40 GHz WR90, WG16
23UA62 24UA62 26UA62 35UA62N 12.40 to 18.00 GHz WR62, WG18
23UA42 24UA42 26UA42 35UA42K 17.00 to 26.50 GHz WR42, WG20
[1] For Coaxial/Waveguide Adapter part numbers, N designates Type N and K designates K-Connector
3/8 Of fset
Short
Precision
Load
Coaxial to Universal
Waveguide
[1]
Adapter
Frequency
Range
Waveguide
Type
Compatible Flanges
CPR187F, CPR187G, UG-1352/U,
UG-1353/U, UG-1728/U, UG-1729/U,
UG-148/U, UG-149A/U
CPR137F, CPR137G, UG-1356/U
UG-1357/U, UG -1732/U, UG -1733/U,
UG-3 43B/U, UG-344/U, UG -4 40B/U,
UG-441/U
CPR112F, CPR112G, UG-1358/ U,
UG-1359/U, UG-1734/U, UG-1735/U,
UG-52B/U, UG-51/U, UG-137B/U, UG-138/U
CPR90F, CPR90G, UG-1360/ U,
UG-1361/U, UG -1736/U, UG -1737/U,
UG-40B/U, UG-39/U, UG-135/U,
UG-136B/U
UG-541A/U, UG-419/U, UG-1665/U,
UG1666/U
UG-596A /U, UG -595/U, UG -597/U
UG-598A /U
22
Page 23

23
Page 24

Anritsu Corporation
5-1-1 Onna, Atsugi-shi, Kanagawa, 243-8555 Japan
Phone: +81-46-223-1111
Fax: +81-46-296-1238
• U.S.A.
Anritsu Company
1155 East Collins Boulevard, Suite 100,
Richardson, TX, 75081 U.S.A.
Toll Free: 1-800-ANRITSU (267-4878)
Phone: +1-972-644-1777
Fax: +1-972-671-1877
• Canada
Anritsu Electronics Ltd.
700 Silver Seven Road, Suite 120, Kanata,
Ontario K2V 1C3, Canada
Phone: +1-613-591-2003
Fax: +1-613-591-1006
• Brazil
Anritsu Electrônica Ltda.
Praça Amadeu Amaral, 27 - 1 Andar
01327-010 - Bela Vista - São Paulo - SP - Brasil
Phone: +55-11-3283-2511
Fax: +55-11-3288-6940
• Mexico
Anritsu Company, S.A. de C.V.
Av. Ejército Nacional No. 579 Piso 9, Col. Granada
11520 México, D.F., México
Phone: +52-55-1101-2370
Fax: +52-55-5254-3147
• U.K.
Anritsu EMEA Ltd.
200 Capability Green, Luton, Bedfordshire LU1 3LU, U.K.
Phone: +44-1582-433280
Fax: +44-1582-731303
• France
Anritsu S.A.
12 Avenue du Québec,
Bâtiment Iris 1-Silic 638,
91140 VILLEBON SUR YVETTE, France
Phone: +33-1-60-92-15-50
Fax: +33-1-64-46-10-65
• Germany
Anritsu GmbH
Nemetschek Haus, Konrad-Zuse-Platz 1
81829 München, Germany
Phone: +49 (0) 89 442308-0
Fax: +49 (0) 89 442308-55
• Italy
Anritsu S.p.A.
Via Elio Vittorini, 129, 00144 Roma, Italy
Phone: +39-06-509-9711
Fax: +39-06-502-2425
• Sweden
Anritsu AB
Borgafjordsgatan 13, 164 40 KISTA, Sweden
Phone: +46-8-534-707-00
Fax: +46-8-534-707-30
• Finland
Anritsu AB
Teknobulevardi 3-5, FI-01530 VANTAA, Finland
Phone: +358-20-741-8100
Fax: +358-20-741-8111
• Denmark
Anritsu A/S (for Service Assurance)
Anritsu AB (for Test & Measurement)
Kirkebjerg Allé 90 DK-2605 Brøndby, Denmark
Phone: +45-7211-2200
Fax: +45-7211-2210
• Russia
Anritsu EMEA Ltd.
Representation Office in Russia
Tverskaya str. 16/2, bld. 1, 7th floor.
Russia, 125009, Moscow
Phone: +7-495-363-1694
Fax: +7-495-935-8962
• United Arab Emirates
Anritsu EMEA Ltd.
Dubai Liaison Office
P O Box 500413 - Dubai Internet City
Al Thuraya Building, Tower 1, Suite 701, 7th Floor
Dubai, United Arab Emirates
Phone: +971-4-3670352
Fax: +971-4-3688460
• Singapore
Anritsu Pte. Ltd.
60 Alexandra Terrace, #02-08, The Comtech (Lobby A)
Singapore 118502
Phone: +65-6282-2400
Fax: +65-6282-2533
• India
Anritsu Pte. Ltd.
India Branch Office
3rd Floor, Shri Lakshminarayan Niwas, #2726, 80 ft Road,
HAL 3rd Stage, Bangalore - 560 075, India
Phone: +91-80-4058-1300
Fax: +91-80-4058-1301
• P. R. China (Hong Kong)
Anritsu Company Ltd.
Units 4 & 5, 28th Floor, Greenfield Tower, Concordia Plaza,
No. 1 Science Museum Road, Tsim Sha Tsui East,
Kowloon, Hong Kong, P.R. China
Phone: +852-2301-4980
Fax: +852-2301-3545
• P. R. China (Beijing)
Anritsu Company Ltd.
Beijing Representative Office
Room 2008, Beijing Fortune Building,
No. 5 , Dong-San-Huan Bei Road,
Chao-Yang District, Beijing 100004, P.R. China
Phone: +86-10-6590-9230
Fax: +86-10-6590-9235
• Korea
Anritsu Corporation, Ltd.
8F Hyunjuk Bldg. 832-41, Yeoksam-Dong,
Kangnam-ku, Seoul, 135-080, Korea
Phone: +82-2-553-6603
Fax: +82-2-553-6604
• Australia
Anritsu Pty Ltd.
Unit 21/270 Ferntree Gully Road, Notting Hill
Victoria, 3168, Australia
Phone: +61-3-9558-8177
Fax: +61-3-9558-8255
• Taiwan
Anritsu Company Inc.
7F, No. 316, Sec. 1, Neihu Rd., Taipei 114, Taiwan
Phone: +886-2-8751-1816
Fax: +886-2-8751-1817
® Anritsu All trademarks are registered trademarks of
their respective companies. Data subject to change
without notice. For the most recent specifications visit:
www.anritsu.com
11410-00548, Rev. B Printed in United States 2010-09
©2010 Anritsu Company. All Rights Reserved
 Loading...