

Page 1

Supplemental Operator’s Guide
for the Agilent 35670A Dynamic Signal Analyzer
By: David Forrest
Seattle Sound and Vibration, inc.
Print Date: December, 2000
ãSeattle Sound and Vibration, inc. 1996, 2000.
All rights reserved.
Agilent Part number 35670-90059
Special Permission Amoco Corporation and Agilent Technologies, Inc are granted
full editing, duplication and distribution privileges.
Page 2

AGILENT 35670A
Supplemental Operator’s Guide
SECTION 1 : TURNING ON THE AGILENT 35670A .......................................................................................... 1
SECTION 2 : MEASUREMENT STATE AFTER TURN-ON............................................................................... 2
SECTION 3 : MEASURING WITH TRANSDUCERS ...........................................................................................3
U
SING ICP-TYPE TRANSDUCERS WITH THE AGILENT 35670A .............................................................................. 3
U
SING TRANSDUCERS WITH EXTERNAL PREAMPLIFIERS .......................................................................................... 3
S
PECIFYING TRANSDUCER SENSITIVITY AND UNITS ................................................................................................. 4
SECTION 4 : MEASURING A SINGLE CHANNEL POWER SPECTRUM - DISPLACEMENT................... 5
S
ELECTING SINGLE CHANNEL OPERATION ............................................................................................................... 5
ETTING UP TRANSDUCER UNITS FOR DISPLACEMENT............................................................................................. 5
S
S
ELECTING FREQUENCY SPAN .................................................................................................................................. 5
Q
UANTIFYING POWER SPECTRUM RESULTS.............................................................................................................. 7
SECTION 5 : IMPROVING MEASUREMENT RESULTS................................................................................... 8
F
REQUENCY ZOOMING TO INCREASE RESOLUTION................................................................................................... 8
M
AXIMIZING DYNAMIC RANGE ................................................................................................................................8
VERAGING TO REDUCE MEASUREMENT VARIANCE................................................................................................ 9
A
SECTION 6 : MEASURING A SINGLE CHANNEL TIME WAVEFORM ...................................................... 11
S
ELECTING SINGLE CHANNEL OPERATION ............................................................................................................. 11
S
ELECTING TIME RECORD LENGTH......................................................................................................................... 12
D
ISPLAYING TIME WAVEFORMS ............................................................................................................................. 12
U
SING MANUAL ARM TO CAPTURE A SINGLE TIME WAVEFORM............................................................................ 12
VENT TRIGGERING................................................................................................................................................ 13
E
Q
UANTIFYING TIME TRACE RESULTS ..................................................................................................................... 14
SECTION 7 : MEASURING DUAL CHANNEL SPECTRA ............................................................................... 15
P
RESETTING THE ANALYZER................................................................................................................................... 15
S
ELECTING DUAL CHANNEL OPERATION................................................................................................................ 15
ELECTING FREQUENCY SPAN ................................................................................................................................15
S
D
ISPLAYING DUAL-CHANNEL POWER SPECTRUM MEASUREMENTS....................................................................... 15
U
SING MARKERS WITH DUAL CHANNEL MEASUREMENTS ..................................................................................... 16
C
OUPLED MARKERS ............................................................................................................................................... 17
C
OUPLED MARKERS WITH PEAK TRACKING ........................................................................................................... 17
SECTION 8 : IMPROVING DUAL CHANNEL MEASUREMENT RESULTS................................................ 18
M
AXIMIZING DYNAMIC RANGE .............................................................................................................................. 18
D
UAL CHANNEL AVERAGING ................................................................................................................................. 18
SECTION 9 : MEASURING DUAL CHANNEL TIME WAVEFORMS............................................................ 20
S
ELECTING DUAL CHANNEL OPERATION................................................................................................................ 20
S
ELECTING TIME RECORD LENGTH......................................................................................................................... 20
D
ISPLAYING DUAL TIME WAVEFORMS ................................................................................................................... 20
RMING DUAL CHANNEL TIME MEASUREMENTS ................................................................................................... 21
A
T
RIGGER ING A DUAL-CHANNEL TIME MEASUREMENT........................................................................................... 21
T
RIGGER DELAY ..................................................................................................................................................... 22
U
SING MARKERS WITH DUAL CHANNEL TIME MEASUREMENTS ............................................................................ 23
SECTION 10 : MEASURING DUAL CHANNEL SPECTRA AND TIME WAVEFORMS.......................... 23
Page 3

AGILENT 35670A
Supplemental Operator’s Guide
SECTION 11 : MODAL TESTING USING A HAMMER AND ACCELEROMETER ................................. 25
S
ETTING UP THE TRANSDUCER PARAMETERS ......................................................................................................... 25
ETTING UP INPUT RANGE ...................................................................................................................................... 26
S
C
HOOSING A PRELIMINARY FREQUENCY SPAN....................................................................................................... 26
S
PECIFYING TRIGGER PARAMETERS ....................................................................................................................... 26
S
ETTING UP TIME DISPLAYS ................................................................................................................................... 27
U
SING FORCE/RESPONSE WINDOWS ....................................................................................................................... 28
D
ISPLAYING HAMMER TEST RESULTS .................................................................................................................... 29
VERAGING ............................................................................................................................................................ 29
A
C
HANGING FREQUENCY SPAN ................................................................................................................................31
SECTION 12 : HAMMER TEST SETUP WITHOUT A FORCE TRANSDUCER........................................ 32
S
ETTING UP THE HAMMER TEST WITHOUT A FORCE TRANSDUCER ....................................................................... 32
SECTION 13 : ORDER DOMAIN RESULTS IN LIST MODE........................................................................ 33
SECTION 14 : COMPARING TWO-CHANNEL REAL-TIME SPECTRA WITH RECALLED DATA.... 35
S
ELECTING MEASUREMENT PARAMETERS .............................................................................................................. 35
D
ISPLAYING DUAL-CHANNEL SPECTRA COMPARED WITH RECALLED DATA ......................................................... 35
R
ECALLING THE SPECTRA FROM DISK .................................................................................................................... 36
R
ECALLING THE SPECTRA FROM NON-VOLATILE RAM ......................................................................................... 36
S
CALING THE DISPLAYS .......................................................................................................................................... 37
U
SING MARKERS TO COMPARE............................................................................................................................... 38
SECTION 15 : WATERFALL SPECTRA AT TIME INTERVALS ................................................................ 39
S
ELECTING SINGLE CHANNEL OPERATION ............................................................................................................. 39
S
ELECTING MEASUREMENT PARAMETERS .............................................................................................................. 39
S
ETTING UP THE WATERFALL DISPLAY.................................................................................................................. 39
S
ETTING UP TIME STEP ARM .................................................................................................................................. 40
SING SLICE MARKERS WITH WATERFALL DATA .................................................................................................. 40
U
C
OLLECTING A SPECIFIED NUMBER OF SPECTRA DURING A TIME INTERVAL ......................................................... 41
SECTION 16 : WATERFALL SPECTRA AT RPM INTERVALS .................................................................. 42
S
ETTING UP THE TACHOMETER .............................................................................................................................. 42
S
PECIFYING THE START RPM ................................................................................................................................. 42
C
OLLECTING A SPECIFIED NUMBER OF SPECTRA DURING AN RPM INTERVAL....................................................... 42
TARTING AND PAUS ING A MEASUREMENT ............................................................................................................ 43
S
S
CALING THE DISPLAY............................................................................................................................................ 43
SECTION 17 : 2-CHANNEL ABSOLUTE AND DIFFERENTIAL AMPLITUDE MEASUREMENT ....... 45
A
CCELEROMETER POLARITY................................................................................................................................... 45
M
EASURING AMPLITUDES, DIFFERENTIAL AMPLITUDE, AND PHASE...................................................................... 46
U
SING A MATH FUNCTION TO MEASURE DIFFERENTIAL MOTION .......................................................................... 47
SECTION 18 : MEASURING FREQUENCY RESPONSE WITH THE AGILENT 35670A ........................ 50
M
EASURING FREQUENCY RESPONSE USING IMPACT EXCITATION.......................................................................... 50
M
EASURING FREQUENCY RESPONSE USING BROADBAND EXCITATION ................................................................. 50
V
IEWING FREQUENCY RESPONSE RESULTS WITH A NYQUIST DIAGRAM ................................................................ 53
V
IEWING RESULTS USING REAL AND IMAGINARY TRACES .................................................................................... 54
SSESSING MEASUREMENT QUALITY ..................................................................................................................... 55
A
SECTION 19 : TWO SPECTRAL TRACES SHOWING MILS AND IPS WHILE EU IS G........................ 56
SECTION 20 : PEAK HOLD DURING A MACHINE RUN-UP AND COAST-DOWN ................................ 58
Page 4

AGILENT 35670A
Supplemental Operator’s Guide
SECTION 21 : USING AN EXTERNAL TRIGGER FOR TIME AVERAGING ........................................... 60
S
PECIFY USER LEVELS FOR TRIGGERING ................................................................................................................ 60
HARACTERIZING THE EXTERNAL TRIGGER ........................................................................................................... 60
C
S
ETTING UP EXTERNAL TRIGGER ........................................................................................................................... 61
M
EASURING TIME AVERAGED SPECTRUMS WITH EXTERNAL TRIGGERING............................................................. 62
SECTION 22 : SAVING TRACE DATA TO A 3.5” DISK OR NON-VOLATILE RAM .............................. 63
S
AVING TRACE TO 3.5” DISK .................................................................................................................................. 63
C
ONFIRMING CONTENTS OF 3.5” DISK FILE ............................................................................................................ 63
AVING TRACE TO NON-VOLATILE RAM (NV-RAM)........................................................................................... 64
S
C
ONFIRMING CONTENTS OF NV-RAM ................................................................................................................... 64
SECTION 23 : RECALLING TRACE DATA FROM 3.5” DISK OR NON-VOLATILE MEMORY.......... 65
R
ECALL TRACE FROM 3.5” DISK ............................................................................................................................ 65
R
ECALL TRACE DATA FROM NON-VOLATILE RAM (NV-RAM)............................................................................ 65
SECTION 24 : PLOTTING AND PRINTING TRACE DATA ......................................................................... 67
G
ENERATING OUTPUT WITH THE AGILENT 35670A............................................................................................. 67
P
LOTTING THE DISPLAY .......................................................................................................................................... 67
P
RINTING THE DISPLAY........................................................................................................................................... 68
SECTION 25 : IMPORTING PLOTS INTO MICROSOFT WORD................................................................ 69
D
ETERMINING IF MS WORD HAS HP-GL GRAPHICS IMPORT FILTER..................................................................... 69
I
NSTALLING THE MS WORD HP-GL GRAPHICS IMPORT FILTER............................................................................. 69
LOT TO A FILE USING THE AGILENT 35670A ..................................................................................................... 70
P
I
NSERTING PICTURE OF AN HP-GL PLOT FILE INTO A MS WORD DOCUMENT. ...................................................... 70
SECTION 26 : RUNNING A SINGLE CALIBRATION TEST ON COMMAND .......................................... 71
SECTION 27 : RETURNING THE AGILENT 35670A TO A PRESET CONDITION.................................. 71
SECTION 28 : PRECAUTIONS TO PREVENT LOSS OF DATA .................................................................. 71
SECTION 29 : TRANSDUCER UNIT CONVERSION WITH THE AGILENT 35670A............................... 72
M
EASURING ACCELERATION, DISPLAYING DISPLACEMENT................................................................................... 72
M
ATH FUNCTIONS AND XDCR UNIT CONVERT................................................................................................. 73
C
ONVERTING FREQUENCY RESPONSE UNITS TO COMPLIANCE ............................................................................... 73
SECTION 30 : USING THE AGILENT DEMO UNIT WITH THE AGILENT 35670A................................ 75
Page 5
Section 1 : Turning On the AGILENT 35670A
A
The entire turn-on procedure for the AGILENT 35670A takes 40 seconds. In
that time the analyzer completes a hardware self-test, boots its operating system,
completes a front end self-calibration and autoranges all input channels. The
default measurement state of the analyzer is a two-channel FFT measurement
with a span of 51.2 kHz, front ends autoranging, input low floating, and DC
coupled, averaging OFF and with a power spectrum display.
: CH1 Pwr Spec X:0 Hz Y:40.9385 uVrms
10
mVrms
LogMag
decades
nVrms
6
10
0Hz 51.2kHz
AGILENT 35670A
Supplemental Operator’s Guide
FFT
ANALYSIS
OCTAVE
ANALYSIS
ORDER
ANALYSIS
SWEPT
SINE
CORRELATN
ANALYSIS
HISTOGRAM
/ TIME
CHANNELS
1
4
2
REF CHANS
1,3
1
TIME
CAPTURE
Typical Display After Turn-on Sequence
1
Page 6

AGILENT 35670A
Supplemental Operator’s Guide
Section 2 : Measurement State After Turn-on
Inst Mode FFT Channels 2
Meas Data Data A PWR SPEC1 Data B PWR SPEC2
Trac Coord Coord A MAG-LOG Coord B MAG-LOG
Freq Start 0 Hz Stop 51.2 kHz
Window CH1 Type FLATTOP BW 488.88 Hz
Avg Status OFF Type RMS
Trigger Type FREE-RUN Level 0 V
Measurement Source INPUT
Data C TIME1 Data D TIME2
Coord C REAL Coord D REAL
Center 25.6 kHz Span 51.2 kHz
Rec Len 7.8125 ms Resoltn 400
CH2 Type FLATTOP BW 488.88 Hz
CH3 Type FLATTOP BW 488.88 Hz
CH4 Type FLATTOP BW 488.88 Hz
Number 10 Overlap 0 %
Fast Avg OFF Update 5
Rept Avg FREEZE Ovld Rej OFF
Slope POSITIVE
Ext Lvl 1.48 V
Ext Fltr OFF
CH1 Dlay 0 s CH2 Dlay 0 s
CH3 Dlay 0 s CH4 Dlay 0 s
Arm IMMEDIATE Strt RPM 600 rpm
RPM Step 60 rpm Time Stp 500 ms
Wtrfall 15 RPM Dir UP
Source Status OFF
Input CHANNEL 1 CHANNEL 2 CHANNEL 3 CHANNEL 4
Status ON ON OFF OFF
Range 3.9858 mVp 3.9858 mVp 3.9858 mVp 3.9858 mVp
Auto Rng OFF OFF OFF OFF
Coupling DC DC DC DC
InputLow FLOAT FLOAT FLOAT FLOAT
AliasFlt ON ON ON ON
A WtFltr OFF OFF OFF OFF
ICP OFF OFF OFF OFF
EngrUnit OFF OFF OFF OFF
EU Label USER USER USER USER
EU Mult 1 V/EU 1 V/EU 1 V/EU 1 V/EU
--- TACHOMETER ---
Puls/Rev 1
Level 0 V
Range LOW
Slope POSITIVE
Holdoff 0 s
Level 0 Vpk DC Offst 0 V
Type SINUSOID Sine Frq 10.24 kHz
Arb Fltr OFF Arb Reg D1
Arb Rept ON
2
Page 7

Section 3 : Measuring with Transducers
The AGILENT 35670A can be used with a broad range of transducers. Transducers
can use an external preamplifier to convert the raw signal into a voltage that is
compatible with the AGILENT 35670A. Some transducers have internal circuitry
which provides preamplification, however these internal circuits must be powered
externally. The AGILENT 35670A can provide the necessary constant-current
supply for transducers that are of type ICP, Isotron, Piezotron, DelaTron, Low
Impedance, etc.
Using ICP-Type Transducers with the AGILENT 35670A
To set up Channel 1 for an ICP-type transducer:
• Press the [Input] hardkey
• Press [FRONT END CH1 SETUP] softkey (F7).
• Press [ICP SUPLY ON OFF] softkey (F8) until ON is highlighted.
Note that the analyzer automatically switches the front end to AC Coupling in order
to reject the large DC signal that is generated by the constant-current supply.
To set up Channel 2 for an ICP transducer:
• Press the [Input] hardkey
• Press [CHANNEL 1 2 34] softkey (F1) until 2 is highlighted.
• Press [FRONT END CH2 SETUP] softkey (F7).
• Press [ICP SUPLY ON OFF] softkey (F8) until ON is highlighted.
AGILENT 35670A
Supplemental Operator’s Guide
For AGILENT 35670A analyzers with four channels, these same procedures can be
repeated for Channels 3 and 4.
Using Transducers with External Preamplifiers
No special front end setup is required to use transducers with external preamplifiers
except if the preamplifier’s DC component is too high, resulting in a loss of dynamic
range. This can be easily minimized by switching to AC coupling as follows:
• Press the [Input] hardkey
• Press [CHANNEL 1 234] softkey (F1) until 1 is highlighted.
• Press [FRONT END CH1 SETUP] softkey (F7).
• Press [COUPLING AC DC] softkey (F5) until AC is highlighted.
A transducer with an external preamplifier will convert mechanical units (EU) to
volts. Care must be taken to observe gain settings on the external preamplifier,
because these gain settings directly affect the resulting transducer sensitivity.
3
Page 8

AGILENT 35670A
Supplemental Operator’s Guide
For example, if an accelerometer has am internal sensitivity of 25 pC/g, and a charge
amplifier has a gain setting of 10 mV/pC, then the resulting transducer sensitivity is
250 mV/g. However is the gain setting on the charge amplifier is changed to 1
mV/pC, then the resulting sensitivity would then be 25 mV/g.
Specifying Transducer Sensitivity and Units
The AGILENT 35670A provides the ability to convert electrical signals into
Engineering Units. Units can be specified as either conventional units or User units.
Conventional units of motion available are:
acceleration: g, m/s^2, inch/s^2
velocity: m/s, inch/s
displacement: m, inch, mil
force: N, lb., dyne
To set up transducer properties for an accelerometer attached to Channel 2 with a
sensitivity of 9.7 pC/g, follow these steps:
• Press [Input] hardkey.
• Press [CHANNEL 1 2 34] softkey (F1) until 2 is highlighted.
• Press [XDCR UNIT CH2 SETUP] softkey (F8)
• Press the [XDCR SENSITVTY] softkey (F6).
• Enter 9.7, then press the [mV/EU] softkey (F2).
• Toggle the [XDCR UNIT ON OFF] softkey (F4) until ON is highlighted.
• Press the [XDCR UNIT LABEL] softkey (F7).
• Select the [g] softkey (F2).
Likewise if a force transducer is attached to Channel 1 with a sensitivity of 12.2
mV/lb., do the following:
• Press [Input] hardkey.
• Press [CHANNEL 1 234] softkey (F1) until 1 is highlighted.
• Press [XDCR UNIT CH1 SETUP] softkey (F8)
• Press the [XDCR SENSITVTY] softkey (F6).
• Enter 12.2, then press the [mV/EU] softkey (F2).
• Toggle the [XDCR UNIT ON OFF] softkey (F4) until ON is highlighted.
• Press the [XDCR UNIT LABEL] softkey (F7).
• Press the [MORE CHOICES] softkey (F9).
• Select the [lb] softkey (F6).
4
Page 9

AGILENT 35670A
Supplemental Operator’s Guide
Section 4 : Measuring a Single Channel Power Spectrum - Displacement
This section contains procedures for setting up and measuring a single channel
power spectrum of displacement using an AGILENT 35670A Dynamic Signal
Analyzer. Included are steps to select single channel operation, set up transducer
parameters, frequency span, choose input range, select windowing, and turn on
averaging in order to improve measurement accuracy. Instructions will also be
presented to set up trace coordinates and trace scaling.
Selecting Single Channel Operation
Specify the single-channel instrument mode to measure one signal. However it
should be noted that it is acceptable to measure a single channel in the default two-
channel instrument mode and simply ignore the second channel. Nevertheless
instructions will be given here to measure in single channel mode.
To measure a single-channel spectrum, turn on the AGILENT 35670A and then:
• Press the [Inst Mode] hardkey
• Press [CHANNELS 1 24 ] softkey (F7) until 1 is highlighted.
Setting Up Transducer Units for Displacement
To measure power spectrums using a displacement transducer with a sensitivity of
200 mV/mil, follow these steps:
• Press the [Input] hardkey.
• Enter 800 and then press the [Hz] softkey (F2).
Any frequency below 51.2 kHz may of course be entered, however the analyzer will
select the lowest span that contains the desired frequency. For example, if 1200 Hz
is entered, the analyzer is switched to a span of 1600 Hz.
Selecting Frequency Span
The default frequency span after turn-on is 51.2 kHz, which is usually too high for
most transducer measurements. To reduce the span to 800 Hz, perform the following
steps:
• Press the [Freq] hardkey.
• Enter 800 and then press the [Hz] softkey (F2).
5
Page 10

AGILENT 35670A
Supplemental Operator’s Guide
Any frequency below 51.2 kHz may of course be entered, however the analyzer will
select the lowest span that contains the desired frequency. For example, if 1200 Hz
is entered, the analyzer is switched to a span of 1600 Hz.
Frequency Spans Available
for the AGILENT 35670A
102.4 kHz * 100 Hz
51.2 kHz 50 Hz
25.6 kHz 25 Hz
12.8 kHz 12.5 Hz
6.4 kHz 6.25 Hz
3.2 kHz 3.125 Hz
1.6 kHz 1.5625 Hz
800 Hz 0.78125 Hz
400 Hz 0.390625
200 Hz 0.1953125 Hz
* Available in single-channel mode when anti-alias filter is turned off.
To begin data acquisition,
• Press the [Start] hardkey.
To automatically scale the display to fit the data,
• Press the [Scale] hardkey.
• Toggle the [AUTOSCALE ON OFF] softkey (F1) until ON is highlighted.
6
Page 11
AGILENT 35670A
Supplemental Operator’s Guide
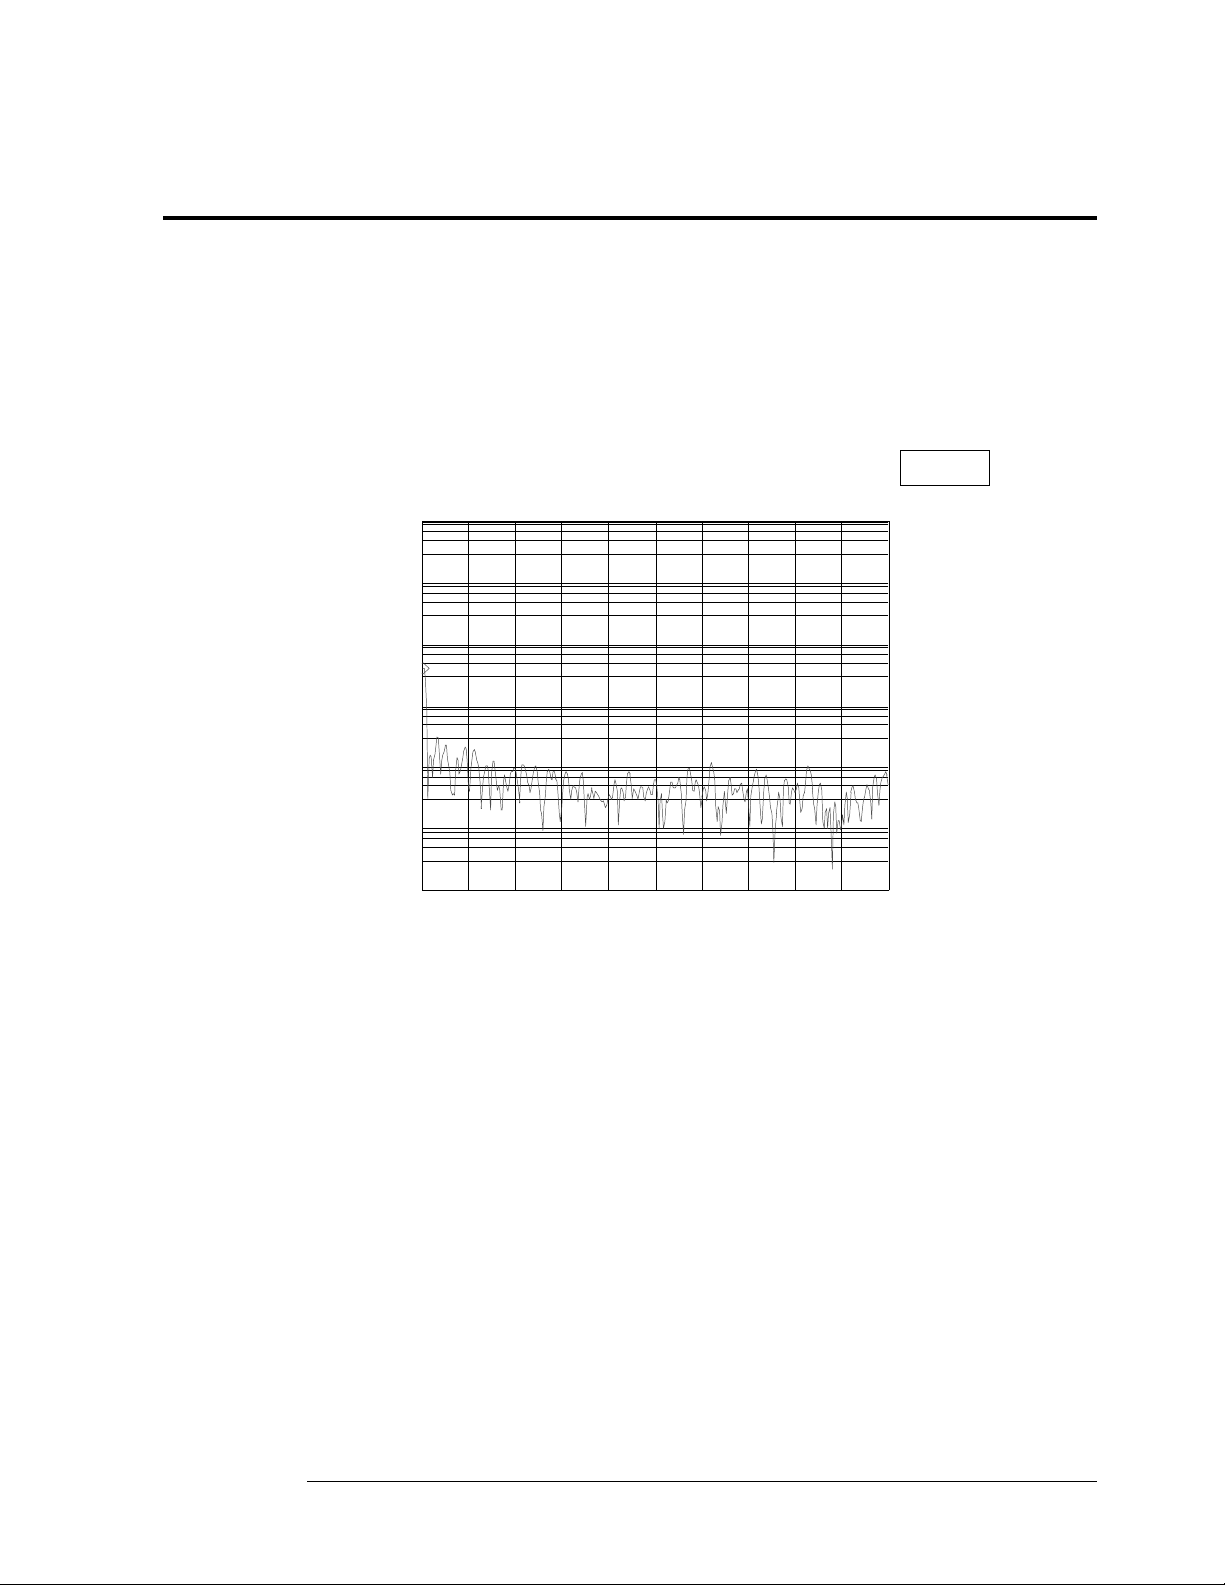
Input CH1 Rng: 501.7819 mVpk CH2 Rng: 631.706 mVpk
Date: 10-02-96 Time: 08:42:00 PM
A: CH1 Pwr Spec X:160 Hz Y:169.558 mVrms
Vrms
LogMag
decades
uVrms
CH3 Rng: 2.5149 Vpk CH4 Rng: 2.5149 Vpk
1
6
1
0Hz 800Hz
Quantifying Power Spectrum Results
Use the marker knob to read the amplitude at any measured frequency. Rotate the
knob on the AGILENT 35670A front panel until the marker indicator (the small
diamond following the spectral trace) is placed at the frequency of interest. The
frequency and amplitude at this bin is presented as X and Y values at the top of the
trace. Units of [Hz] and [Vrms] or [grms] identify the results.
Special marker features such as peak tracking can speed analysis. To always track
the peak amplitude and frequency, follow these steps:
• Press the [Marker] hardkey.
• Press [PEAK TRK ON OFF] softkey (F6) until ON is highlighted.
The frequency and amplitude of the peak bin in every trace will be determined and
displayed.
7
Page 12

AGILENT 35670A
Supplemental Operator’s Guide
Section 5 : Improving Measurement Results
Frequency Zooming to Increase Resolution
The AGILENT 35670A has the ability to zoom in on a signal to show detail with
very fine resolution. After choosing a center frequency, it is possible to decrease the
span and therefore increase the resolution all the way down to 61 µHz. To zoom in
on a signal, move the marker to the desired center frequency, then:
• Press the [Freq] hardkey.
• Press the [CENTER] softkey (F2).
• Press the [Mkr Value] hardkey.
To set a new, lower span,
• Press the [Freq] hardkey.
• Press the [Down Arrow] hardkey
• Press the yellow [Start] hardkey to begin the zoomed measurement.
To return to baseband measurements,
• Press the [Freq] hardkey.
• Press the [ZERO START] softkey (F5).
Maximizing Dynamic Range
The default setting for input range is CH1 AUTO RANGE. For steady-state signals
this works well because the front end will find the input range that just exceeds the
signal level, and therefore maximize the dynamic range of the measurement. When a
front end is set up to autorange and the signal either overloads or becomes too faint
for the current range setting, the analyzer automatically searches for a new range and
then re-starts the measurement. To select CH1 AUTO RANGE:
• Select the [CH1 AUTO RANGE] softkey (F6)
If a signal is not steady, but has periods of high and low levels, then CH1 AUTO
RANGE may not set the front end at the most useful range. Instead, try CH1 AUTO
UP ONLY. This causes the input range to ratchet up when an overload is detected,
however when the signal is quiet, the front end range is not reduced. This prevents
an overload if another high level signal is expected. CH1 AUTO UP ONLY works
well with transient signals such as those expected during impact testing. To set up
this condition:
• Press the [Input] hardkey.
• Select the [CH1 AUTO UP ONLY] softkey (F5).
8
Page 13

AGILENT 35670A
Supplemental Operator’s Guide
If continuous real-time measurements over a long duration are required, and
absolutely no overload conditions are desired, then a fixed input range can be set that
is greater than any signal expected. During periods of low signal level, dynamic
range will not be optimal, however the entire measurement can be completed without
overloads. To set up a fixed range of 1 volt:
• Press the [Input] hardkey.
• Select the [CHANNEL 1 RANGE] softkey (F3), enter 1, then press the
[Vpk] softkey (F1).
If engineering units are turned on ([XDCR UNIT ON OFF]) then the range can be
specified in EU. For example, if an accelerometer is connected to channel 1 with
XDCR UNIT turned on and XDCR UNIT LABEL specified as [g], then the input
range can be specified as 4 “g” as per the following:
• Press the [Input] hardkey.
• Select the [CHANNEL 1 RANGE] softkey (F3)
• Enter 4, then press the [EU] softkey (F8).
Averaging to Reduce Measurement Variance
Spectral measurements of steady signals give results which have a statistical
variation over time. Averaging several results will help reduce this variation. The
AGILENT 35670A has several averaging techniques available. For general
spectrum measurements, RMS or power averaging is commonly used. To average a
series of ten spectrum measurements using RMS averaging, follow these steps:
• Press the [Avg] hardkey.
• Press the [NUMBER AVERAGES] softkey (F2), enter 10, then press the
[ENTER] softkey (F1).
• Press the [AVERAGE TYPE] softkey (F3)
• Press the [RMS] softkey (F1)
• Press the [Avg] hardkey.
• Turn on averaging by pressing the [AVERAGE ON OFF] softkey (F1)
until ON is highlighted.
9
Page 14
AGILENT 35670A
Supplemental Operator’s Guide
•
Systm Util Date: 10-02-96
Time: 08:40 PM
Date: 01-02-04 Time: 12:44:00 PM
A: CH1 Pwr Spec X:160 Hz Y:174.015 mVrms
1
Vrms
LogMag
6
decades
1
uVrms
0Hz 800HzAVG: 5
10
Page 15

Section 6 : Measuring a Single Channel Time Waveform
This section contains procedures for setting up and measuring a single channel time
waveform using an AGILENT 35670A Dynamic Signal Analyzer. Included are
steps to select single channel operation, set up the trace time length, and set up
triggering to capture a transient event. Instructions will also be presented to scale the
time trace.
Selecting Single Channel Operation
To measure a single-channel time waveform, turn on the AGILENT 35670A and
then:
• Press the [Inst Mode] hardkey
• Press [CHANNELS 1 2 4 ] softkey (F7) until 1 is highlighted.
Note: if the AGILENT 35670A was already turned on and in an unknown
state, then preset the analyzer by doing the following:
• Press the green [Preset] hardkey
• Press [DO PRESET] softkey (F1).
AGILENT 35670A
Supplemental Operator’s Guide
Then set the instrument mode to single channel as above.
Time Record Length in Seconds vs. Resolution
Span - Hz 100 lines 200 lines 400 lines 800 lines 1600 lines
51200 Hz
25600 Hz
12800 Hz
6400 Hz
3200 Hz
1600 Hz
800 Hz
400 Hz
200 Hz
100 Hz
50 Hz
25 Hz
12.5 Hz
6.25 Hz
3.125 Hz
1.5625 Hz
0.78125 Hz
0.390625 Hz
0.1953125 Hz
0.001953 s 0.003906 s 0.007813 s 0.015625 s 0.03125 s
0.003906 s 0.007813 s 0.015625 s 0.03125 s 0.0625 s
0.007813 s 0.015625 s 0.03125 s 0.0625 s 0.125 s
0.015625 s 0.03125 s 0.0625 s 0.125 s 0.25 s
0.03125 s 0.0625 s 0.125 s 0.25 s 0.5 s
0.0625 s 0.125 s 0.25 s 0.5 s 1 s
0.125 s 0.25 s 0.5 s 1 s 2 s
0.25 s 0.5 s 1 s 2 s 4 s
0.5 s1 s2 s4 s8 s
1 s2 s4 s8 s16 s
2 s 4 s 8 s 16 s 32 s
4 s 8 s 16 s 32 s 64 s
8 s 16 s 32 s 64 s 128 s
16 s 32 s 64 s 128 s 256 s
32 s 64 s 128 s 256 s 512 s
64 s 128 s 256 s 512 s 1024 s
128 s 256 s 512 s 1024 s 2048 s
256 s 512 s 1024 s 2048 s 4096 s
512 s 1024 s 2048 s 4096 s 8192 s
11
Page 16

AGILENT 35670A
Supplemental Operator’s Guide
Selecting Time Record Length
The default time record length at a frequency span of 51.2 kHz is only 7.8 ms, which
is usually not enough time to capture a mechanical event or observe a transducer’s
time domain signal. To increase the time record length to 0.25 s, perform the
following steps:
• Press the [Freq] hardkey
• Press the [RECORD LENGTH] softkey (F8)
• Enter 0.25 and then press the [S] softkey (F1)
The analyzer selects a new frequency span of 1.6 kHz, which at the default
resolution of 400 lines, takes 0.25 seconds to capture. The following table outlines
the time record lengths for all possible frequency spans and resolutions:
Displaying Time Waveforms
Time waveforms are displayed in a time trace. To set up the analyzer to display a
single time trace of channel 1, follow these steps:
• Press the [Disp Format] hardkey.
• Press the [SINGLE] softkey (F1)
• Press the [Active Trace] hardkey.
• Press the [A] softkey (F1)
• Press the [Meas Data] hardkey.
• Press the [CHANNEL 1 234] softkey (F1) until 1 is highlighted.
• Press the [TIME CHANNEL 1] softkey (F5)
• Press the [Scale] hardkey.
• Toggle the [AUTOSCALE ON OFF] softkey (F1) until ON is highlighted.
Using Manual Arm to Capture a Single Time Waveform
Often it is desirable to observe just one time waveform in detail. To acquire just one
record length at a time, follow these instructions:
• Press the [Trigger] hardkey.
• Select the [ARM SETUP] softkey (F7)
• Select the [MANUAL ARM] softkey (F2)
• Press the yellow [Start] hardkey to begin the measurement.
• Press the [Trigger] hardkey again.
Then to arm a single time record,
• Press the [ARM] softkey (F9)
One time record will be captured and displayed. To capture another time record,
12
Page 17

AGILENT 35670A
Supplemental Operator’s Guide
• Press the [ARM] softkey (F9) again.
Event Triggering
The AGILENT 35670A has the ability to trigger the acquisition of a time waveform
based on the slope and level of the measured signal. To set up triggering properly,
the polarity of the measured pulse must be known in advance: will the event start
with a negative slope or positive slope? Will the event be mostly positive or mostly
negative? Use trial measurements to determine polarity if unknown.
Proper triggering is also affected by the input range. Fortunately the AGILENT
35670A has the ability to set the trigger point to be a percentage of the input range,
so even with CH1 AUTO UP ONLY, successful triggering should be possible
automatically.
To specify trigger parameters for a “positive” event on channel 1 where the trigger
point should have a positive slope, follow these steps:
• Press the [Trigger] hardkey.
• Press the [CHANNEL 1 234] softkey (F3) until 1 is highlighted.
• Press the [TRIGGER SETUP] softkey (F6)
• Press the [CHANNEL LEVEL] softkey (F1)
• Enter 5 then press the [PERCENT (%)] softkey (F4)
• Press the [SLOPE POS NEG] softkey (F5) until POS is highlighted.
Use pre-triggering to acquire some data before the trigger point. To set up a 0.01s
pre-trigger condition, follow these steps:
• Press the [Trigger] hardkey.
• Press the [TRIGGER SETUP] softkey (F6)
• Press the [ALL CHANNELS] softkey (F8)
• Press the [CHANNEL * DELAY] softkey (F9)
• Enter -.01 then press the [S] softkey (F1)
To start the data acquisition,
• Press the yellow [Start] hardkey.
The analyzer should show in highlighted text above the trace:
WAITING FOR CH 1 TRIGGER
13
Page 18
AGILENT 35670A
Supplemental Operator’s Guide
Input CH1 Rng: 1.0012 Vpk CH2 Rng: 631.706 mVpk
Date: 10-02-96 Time: 08:47:00 PM
A: CH1 Time X:38.0859 ms Y:1.06837 V
Real
/div
-2.5
CH3 Rng: 2.5149 Vpk CH4 Rng: 2.5149 Vpk
2.5
V
500
mV
V
-9.7656ms 489.7461ms
Quantifying Time Trace Results
Use the marker knob to read the amplitude at any time during the trace. Rotate the
knob on the AGILENT 35670A front panel until the marker indicator (the small
diamond following the spectral trace) is placed at the desired time. The time and
amplitude at this bin is presented as X and Y values at the top of the trace. Units of
[s] and [Vrms] or [grms] identify the results.
Peak tracking is very useful for determining maximum amplitude of positive peaks
in the time domain:
• Press the [Marker] hardkey.
• Press [PEAK TRK ON OFF] softkey (F6) until ON is highlighted.
Care must be taken with negative peaks, however, because PEAK TRK ON only
looks for the maximum value, and large negative peaks will be ignored.
14
Page 19

Section 7 : Measuring Dual Channel Spectra
This section contains procedures for setting up and measuring a dual channel
spectrum using an AGILENT 35670A Dynamic Signal Analyzer. Procedures are
similar to those in the section “Measuring Single Channel Spectrum,” however
display setup and results are different and will be described here.
To set up the analyzer for a dual channel spectrum measurement, proceed as follows:
Presetting the Analyzer
• Press the green [Preset] hardkey
• Press [DO PRESET] softkey (F1).
• Press the [Pause/Cont] hardkey if desired.
Selecting Dual Channel Operation
Measure two signals with the default two-channel instrument mode. If the analyzer
has been changed to 1 or 4 channel operation, then follow these steps:
• Press the [Inst Mode] hardkey
• Press [CHANNELS 1 2 4 ] softkey (F7) until 2 is highlighted.
AGILENT 35670A
Supplemental Operator’s Guide
Selecting Frequency Span
Reduce the span to 800 Hz as follows:
• Press the [Freq] hardkey
• Enter 800 and then press the [Hz] softkey (F2)
Displaying Dual-Channel Power Spectrum Measurements
To see the results of a dual-channel measurement, the analyzer’s display format must
be changed to display two traces. Proceed as follows:
• Press the [Disp Format] hardkey.
• Press the [UPPER/LOWER] softkey (F3)
• Press the [Active Trace] hardkey.
• Press the [A] softkey (F1).
• Press the [Meas Data] hardkey.
• Press the [CHANNEL 1 234] softkey (F1) until 1 is highlighted.
• Press the [PWR SPEC CHANNEL 1] softkey (F3)
• Press the [Scale] hardkey.
• Toggle the [AUTOSCALE ON OFF] softkey (F1) until ON is highlighted.
• Press the [Active Trace] hardkey again.
• Press the [B] softkey (F2).
15
Page 20
AGILENT 35670A
Supplemental Operator’s Guide
• Press the [Meas Data] hardkey.
• Press the [CHANNEL 1 2 34] softkey (F1) until 2 is highlighted.
• Press the [Scale] hardkey.
• Toggle the [AUTOSCALE ON OFF] softkey (F1) until ON is highlighted.
Note: many of these keystrokes are not necessary if performed in the given order
because the analyzer defaults to many of these settings.
To acquire dual channel spectra,
• Press the yellow [Start] hardkey.
Meas Data
[FFT]
Date: 10-02-96 Time: 08:49:00 PM
A: CH1 Pwr Spec X:60 Hz Y:147.382 mVrms
Vrms
LogMag
decades
uVrms
B: CH2 Pwr Spec
Vrms
LogMag
decades
uVrms
A: CH1 Pwr Spec B: CH2 Pwr Spec
C: CH1 Time D: CH2 Time
1
6
1
0Hz 800Hz
X:60 Hz Y:80.4887 mVrms
1
4
100
0Hz 800Hz
Using Markers with Dual Channel Measurements
Each trace has independent marker control. All functions available for a single
marker are possible with both markers. To set up individual, independent markers
on each channel, follow these steps:
• Press the [Active Trace] hardkey.
• Press the [A] softkey (F1).
• Press the [Marker] hardkey.
• Toggle the [MARKER ON OFF] softkey (F1) until ON is highlighted.
16
Page 21

AGILENT 35670A
Supplemental Operator’s Guide
Use the marker knob to read the amplitude at any measured frequency for Channel 1
in Trace A.
To set up the marker for Channel 2 in Trace B,
• Press the [Active Trace] hardkey.
• Press the [B] softkey (F2).
• Press the [Marker] hardkey.
• Toggle the [MARKER ON OFF] softkey (F1) until ON is highlighted.
The marker knob is now active for Trace B, which is Channel 2. To gain control of
the marker on Trace A again, make it the active trace as follows:
• Press the [Active Trace] hardkey.
• Press the [A] softkey (F1).
Coupled Markers
Markers on multiple traces can be coupled so that one marker will always track the
frequency specified in another trace. This makes comparisons of level differences
across channels simple. To set up coupled markers so that Trace B will follow the
marker frequency specified in Trace A, do the following:
• Press the [Active Trace] hardkey.
• Press the [A] softkey (F1).
• Press the [Marker] hardkey.
• Toggle the [COUPLED ON OFF] softkey (F1) until ON is highlighted.
Move the knob to move the marker in Trace A. Notice that the marker in Trace B
moves to the same frequency.
Coupled Markers with Peak Tracking
Coupled markers can be further used to track a peak frequency in Trace A and
determine the response amplitude at the peak frequency in Trace B. To do this, leave
coupled markers on, as above, then set up peak tracking in Trace A as follows:
• Press the [Active Trace] hardkey.
• Press the [A] softkey (F1).
• Press the [Marker] hardkey.
• Toggle the [PEAK TRK ON OFF] softkey (F1) until ON is highlighted.
• Press the yellow [Start] hardkey.
Notice that the marker in Trace A moves to the peak value, whereas the marker in
Trace B moves to the same frequency as determined in Trace A.
17
Page 22

AGILENT 35670A
Supplemental Operator’s Guide
Section 8 : Improving Dual Channel Measurement Results
Maximizing Dynamic Range
Autoranging to maximize the dynamic range of measurements in the AGILENT
35670A can function on all channels simultaneously. Therefore all capability
previously mentioned for single-channel front-end ranging is available for dualchannel operation.
To set up autorange on all channels, follow these steps:
• Press the [Input] hardkey.
• Press [ALL CHANNELS] softkey (F2).
• Select the [CH* AUTO RANGE] softkey (F6)
For signals that are not steady, use CH* AUTO UP ONLY. CH1 AUTO UP ONLY
can be used for all channels to set up modal impact testing. To set up this condition:
• Press the [Input] hardkey.
• Select the [CH* AUTO UP ONLY] softkey (F5).
To set up the same fixed range on all channels:
• Press the [Input] hardkey.
• Select the [CHANNEL * RANGE] softkey (F3)
• Enter the range, either in units of g or Volts.
Dual Channel Averaging
Averaging to reduce measurement variance applies to all channels being measured.
Dual channel averaging is set up the same as single channel averaging:
• Press the [Avg] hardkey.
• Press the [NUMBER AVERAGES] softkey (F2), enter 10, then press the
[ENTER] softkey (F1).
• Press the [AVERAGE TYPE] softkey (F3)
• Press the [RMS] softkey (F1)
• Press the [Avg] hardkey.
• Turn on averaging by pressing the [AVERAGE ON OFF] softkey (F1)
until ON is highlighted.
18
Page 23
AGILENT 35670A
Supplemental Operator’s Guide
Avg
[FFT]
Date: 10-02-96 Time: 08:51:00 PM
A: CH1 Pwr Spec X:60 Hz Y:112.185 mVrms
Vrms
LogMag
decades
uVrms
B: CH2 Pwr Spec
mVrms
LogMag
decades
uVrms
Type: RMS Number: 10
Update Rt: 5 Overlap: 0 %
1
5
10
0Hz 800HzAVG: 10
X:60 Hz Y:95.0385 mVrms
100
4
10
0Hz 800HzAVG: 10
19
Page 24

AGILENT 35670A
Supplemental Operator’s Guide
Section 9 : Measuring Dual Channel Time Waveforms
This section contains procedures for setting up and measuring a single channel time
waveform using an AGILENT 35670A Dynamic Signal Analyzer. Included are
steps to select single channel operation, set up the trace time length, and set up
triggering to capture a transient event. Instructions will also be presented to scale the
time trace.
Selecting Dual Channel Operation
To measure a single-channel spectrum, turn on the AGILENT 35670A. The default
instrument mode is dual-channel operation.
Note: if the AGILENT 35670A was already turned on and in an unknown
state, then preset the analyzer by doing the following:
• Press the green [Preset] hardkey.
• Press [DO PRESET] softkey (F1).
This always returns the analyzer to dual-channel operation.
Selecting Time Record Length
Time record length can be entered directly or indirectly. It is entered directly under
the [Freq] hardkey as follows (this example sets up a 0.25 second time record):
• Press the [Freq] hardkey
• Press the [RECORD LENGTH] softkey (F8)
• Enter 0.25 and then press the [S] softkey (F1)
Time record length can also be specified indirectly by entering frequency and
resolution in lines. The relationship between time record length (T), lines of
resolution (N), and frequency (F) is:
N
=
T
()
F
1024.
For 400 lines of resolution (default) and 1600 Hz span, the time record length should
be 400/(1.024*1600) ≈ 0.25 seconds. The table showing the relationship between
lines, span, and time record length can be found in the section on Single Channel
Time Waveforms.
Displaying Dual Time Waveforms
Dual time waveforms can be shown in the UPPER/LOWER display format, with
AUTO SCALE turned ON, as follows:
• Press the [Disp Format] hardkey.
• Press the [UPPER/LOWER] softkey (F3).
• Press the [Active Trace] hardkey.
• Press the [A] softkey (F1)
• Press the [Meas Data] hardkey.
20
Page 25

AGILENT 35670A
Supplemental Operator’s Guide
• Press the [CHANNEL 1 234] softkey (F1) until 1 is highlighted.
• Press the [TIME CHANNEL 1] softkey (F5)
• Press the [Scale] hardkey.
• Toggle the [AUTOSCALE ON OFF] softkey (F1) until ON is highlighted..
• Press the [Active Trace] hardkey.
• Press the [B] softkey (F1)
• Press the [Meas Data] hardkey.
• Press the [CHANNEL 1 2 34] softkey (F1) until 2 is highlighted.
• Press the [TIME CHANNEL 2] softkey (F5)
• Press the [Scale] hardkey.
• Toggle the [AUTOSCALE ON OFF] softkey (F1) until ON is highlighted.
Arming Dual Channel Time Measurements
To manually arm a dual channel time measurement, proceed the same as for the
single channel case:
• Press the [Trigger] hardkey.
• Select the [ARM SETUP] softkey (F7)
• Select the [MANUAL ARM] softkey (F2)
• Press the yellow [Start] hardkey to begin the measurement.
• Press the [Trigger] hardkey.
Then to arm a single time record,
• Press the [ARM] softkey (F9)
One time record will be captured and displayed. To capture another time record,
• Press the [ARM] softkey (F9) again.
Triggering a Dual-Channel Time Measurement
Either channel may be monitored to initiate a trigger for a measurement. Setting up
the trigger event is the same as for single channel time waveforms, except that
channel 1 or channel 2 must be selected as the trigger. To specify the trigger
channel, proceed as follows:
• Press the [Trigger] hardkey.
• Press the [CHANNEL 1 234] softkey (F3) until 1 is highlighted.
This sets up the analyzer to trigger off an event on channel 1. To set up channel 2 as
the trigger channel, do the following:
• Press the [Trigger] hardkey.
• Press the [CHANNEL 1 2 34] softkey (F3) until 2 is highlighted.
21
Page 26

AGILENT 35670A
Supplemental Operator’s Guide
Then set up trigger parameters (for a positive event, positive slope) as follows:
• Press the [TRIGGER SETUP] softkey (F6)
• Press the [CHANNEL LEVEL] softkey (F1)
• Enter 5 then press the [PERCENT (%)] softkey (F4)
• Press the [SLOPE POS NEG] softkey (F5) until POS is highlighted.
Trigger Delay
Both channels should acquire data using the same pre-trigger delay. To set up a
0.01s pre-trigger condition, follow these steps:
• Press the [Trigger] hardkey.
• Press the [TRIGGER SETUP] softkey (F6)
• Press the [ALL CHANNELS] softkey (F8)
• Press the [CHANNEL * DELAY] softkey (F9)
• Enter -.01 then press the [S] softkey (F1)
To start the data acquisition,
• Press the yellow [Start] hardkey.
The analyzer should show in highlighted text above the trace:
WAITING FOR CH 1 TRIGGER
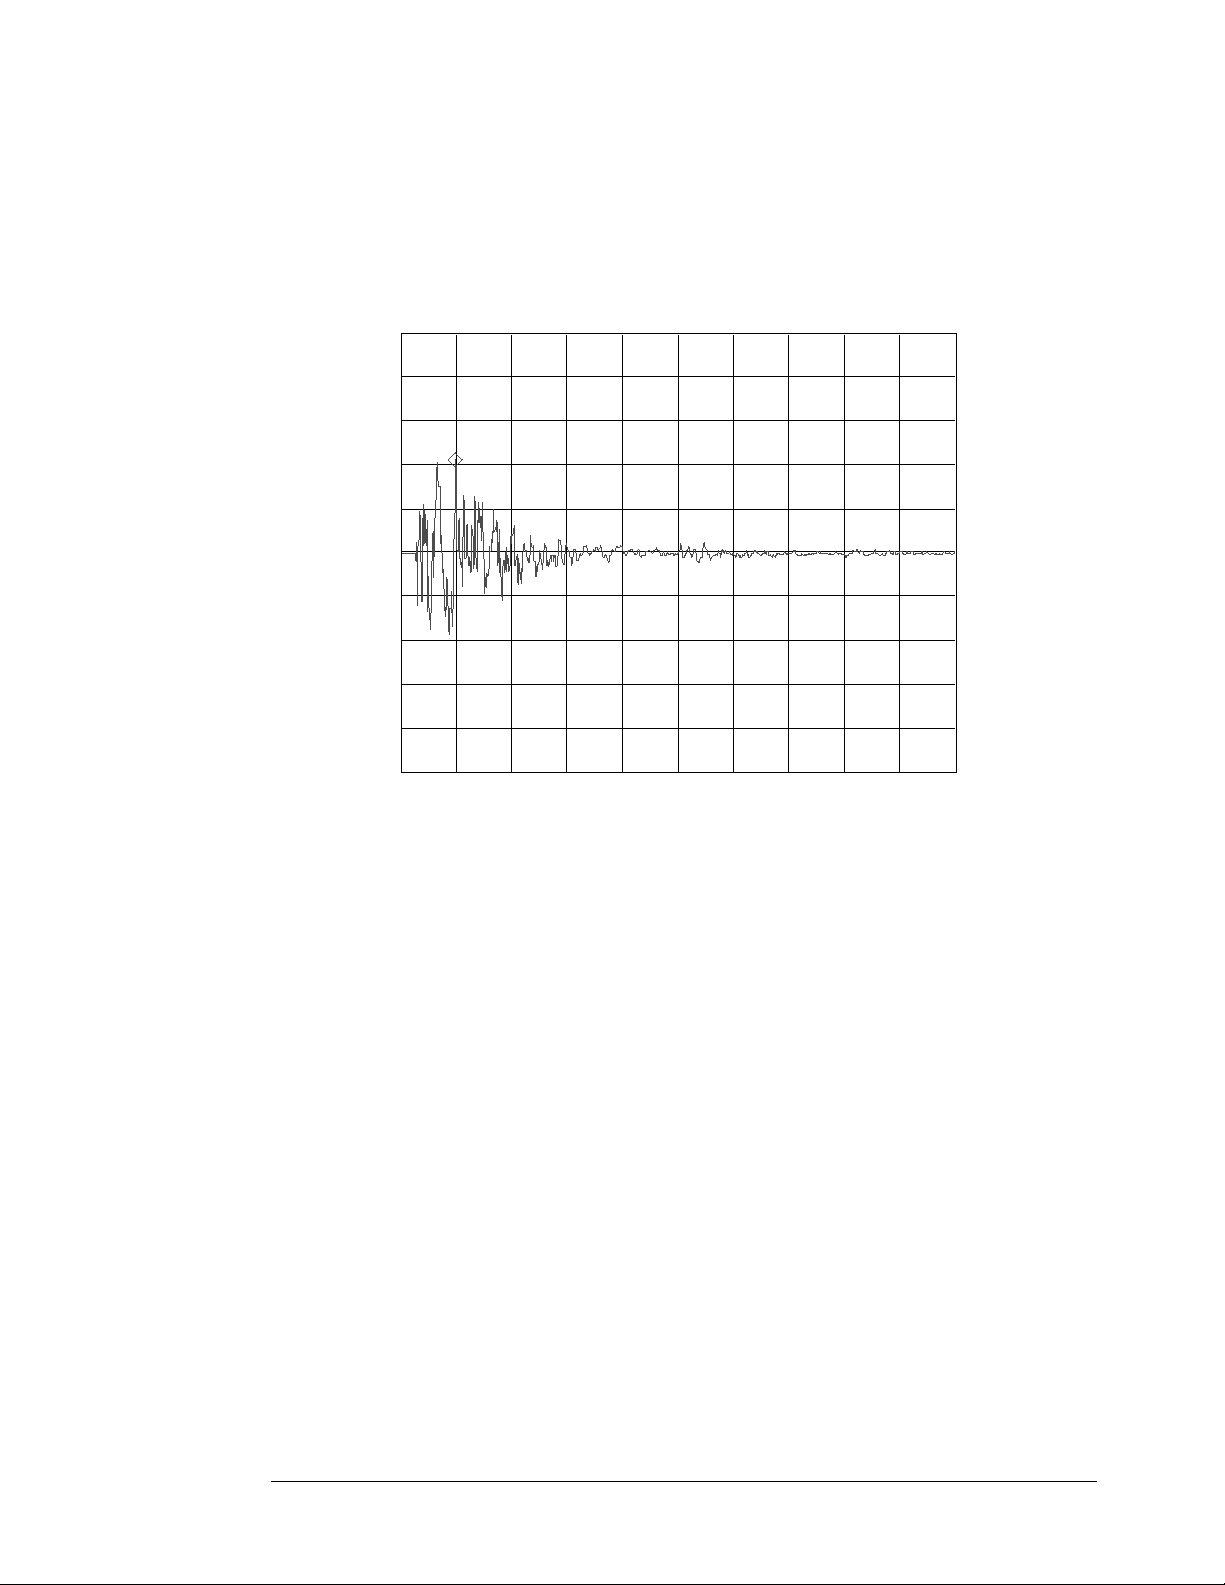
Trigger
[FFT]
Date: 10-03-96 Time: 05:23:00 PM
A: CH1 Time X:472.168 ms Y:371.577 mV
Real
/div
-500
B: CH2 Time
Real
/div
-500
Arm: Automatic Waterfall Steps: 15
Chn Level: 5 % Slope: Positive
500
mV
100
mV
mV
-9.7656ms 489.7461ms
500
100
mV
mV
mV
X:472.168 ms Y:-241.753 mV
-9.7656ms 489.7461ms
22
Page 27

AGILENT 35670A
Supplemental Operator’s Guide
Using Markers with Dual Channel Time Measurements
Compare the time trace of Channel 1 with Channel 2 using two techniques: peak
tracking and coupled markers. With peak tracking active on both channels, it is
possible to measure an event with two channels and easily compare peak amplitudes.
Set set up peak tracking for both channels, do the following:
• Press the [Active Trace] hardkey.
• Press the [A] softkey (F1).
• Press the [Marker] hardkey.
• Toggle the [PEAK TRK ON OFF] softkey (F6) until ON is highlighted.
• Press the [Active Trace] hardkey.
• Press the [B] softkey (F2).
• Press the [Marker] hardkey.
• Toggle the [PEAK TRK ON OFF] softkey (F6) until ON is highlighted.
Coupled markers can provide a quick comparison of relative levels during a transient
event at a specific time. To set up peak tracking on Channel 1 and force the marker
on Channel 2 to the time of Channel 1 peak, do the follow:
• Press the [Active Trace] hardkey.
• Press the [A] softkey (F1).
• Press the [Marker] hardkey.
• Toggle the [PEAK TRK ON OFF] softkey (F6) until ON is highlighted.
• Toggle the [COUPLED ON OFF] softkey (F1) until ON is highlighted.
Peak tracking looks for the maximum positive level in a trace. Therefore do not use
peak tracking to determine the maximum absolute amplitude of negative pulses in a
time trace.
Section 10 : Measuring Dual Channel Spectra and Time Waveforms
Two signals can be measured and examined in the time and frequency domains
simultaneously. To accomplish this, a quad display format must be set up as
follows:
First, preset the analyzer:
• Press the green [Preset] hardkey
• Press [DO PRESET] softkey (F1).
This places the analyzer into the default two channel mode. Set up the transducer
parameters as described previously, if desired. Then, set up the display for four
traces:
• Press the [Disp Format] hardkey.
• Press the [QUAD] softkey (F6).
23
Page 28
AGILENT 35670A
Supplemental Operator’s Guide
• Press the [Active Trace] hardkey.
• Press the [ABCD] softkey (F7).
• Press the [Scale] hardkey.
• Toggle the [AUTOSCALE ON OFF] softkey (F1) until ON is highlighted..
• Press the [Active Trace] hardkey.
• Press the [A] softkey (F1).
The default QUAD display shows Channel 1 power spectrum in Trace A, Channel 2
power spectrum in Trace B, Channel 1 time in Trace C, and Channel 2 time in Trace
D.
Individual markers can be used on each trace, or peak tracking and coupled markers
can be used as described for dual traces.
If averaging is applied to the power spectrum measurements, then the QUAD display
will show the averaged power spectra in Trace A and B, and the previously acquired
time traces in Trace C and D.
Scale Trace: A Ref Lvl: 1
Date: 10-02-96 Time: 08:54:00 PM
A: CH1 Pwr Spec
Vrms
LogMag
uVrms
B: CH2 Pwr Spec
mVrms
LogMag
uVrms
C: CH1 Time
Real
-500
D: CH2 Time
Real
-500
Per Div: 5 Ref Pos: Top
X:60 Hz Y:172.071 mVrms
1
10
0Hz 800HzAVG: 10
X:60 Hz Y:88.5405 mVrms
100
10
0Hz 800HzAVG: 10
X:14.6484 ms Y:427.266 mV
500
mV
mV
0s 499.5117ms
X:14.6484 ms Y:279.515 mV
500
mV
mV
0s 499.5117ms
24
Page 29

Supplemental Operator’s Guide
Section 11 : Modal Testing Using a Hammer and Accelerometer
Hammer testing is often the easiest and quickest technique for measuring frequency
response functions used in modal analysis. Instructions for using a hammer with a
force transducer and an accelerometer to measure frequency response functions are
presented.
Setting Up the Transducer Parameters
Connect the force transducer on the hammer to Channel 1. Mount the response
accelerometer to the desired location on the structure, and connect it (or its
preamplifier) to Channel 2. Preset the analyzer and set up transducer parameters as
follows, assuming an ICP accelerometer with a sensitivity of 11 mV/g and an ICP
force transducer on the hammer with a sensitivity of 5 mV/lb:
• Press the green [Preset] hardkey
• Press [DO PRESET] softkey (F1).
Wait for the analyzer to finish its preset routine.
• Press the [Pause/Cont] hardkey to pause the current measurement.
Set up the force transducer parameters as follows:
• Press the [Input] hardkey
• Press [CHANNEL 1 234] softkey (F1) until 1 is highlighted.
• Press [FRONT END CH1 SETUP] softkey (F7).
• Press [ICP SUPLY ON OFF] softkey (F8) until ON is highlighted.
• Press the [Input] hardkey.
• Press the [XDCR SENSITVTY] softkey (F6).
• Enter 5, then press the [mV/EU] softkey (F2).
• Toggle the [XDCR UNIT ON OFF] softkey (F4) until ON is highlighted.
• Press the [XDCR UNIT LABEL] softkey (F7).
• Press the [MORE CHOICES] softkey (F9).
• Select the [lb] softkey (F6).
• [XDCR UNIT CH1 SETUP] softkey (F8)
Set up the accelerometer parameters as follows:
• Press the [Input] hardkey.
• Press [CHANNEL 1 2 34] softkey (F1) until 2 is highlighted.
• Press [FRONT END CH2 SETUP] softkey (F7).
• Press [ICP SUPLY ON OFF] softkey (F8) until ON is highlighted.
• Press the [Input] hardkey.
• Press [XDCR UNIT CH2 SETUP] softkey (F8)
• Press the [XDCR SENSITVTY] softkey (F6).
• Enter 11, then press the [mV/EU] softkey (F2).
AGILENT 35670A
25
Page 30

AGILENT 35670A
Supplemental Operator’s Guide
• Toggle the [XDCR UNIT ON OFF] softkey (F4) until ON is highlighted.
• Press the [XDCR UNIT LABEL] softkey (F7).
• Select the [g] softkey (F2).
Setting Up Input Range
Use CH* AUTO UP ONLY as the autorange routine as follows:
• Press the [Input] hardkey.
• Press [ALL CHANNELS] softkey (F2).
• Select the [CH* AUTO UP ONLY] softkey (F5).
Then tap the structure with the hammer once. A yellow overload light by the input
BNC connectors will indicate an overload, and the range will increase one step.
Continue tapping on the structure, one tap at a time, allowing time for the input range
to increase, until an overload is no longer indicated. This may take many hammer
strikes. When an overload on either channel is no longer indicated, then the ranges
are set correctly.
Choosing a Preliminary Frequency Span
Setting up a frequency response measurement is an interative process. A span is
selected, a measurement is made, and the results are examined to determine if a
narrower or wider span is required. To start measuring frequency response, you
must select an initial span:
• Press the [Freq] hardkey.
• Enter 1600 and then press the [Hz] softkey (F2).
Note: span should be any frequency that encompasses all modes of interest. If in
doubt, start with a wider span.
Specifying Trigger Parameters
Hammer testing is triggered by the signal from the hammer. Without a force
transducer, the trigger must come from the accelerometer that is attached to the
hammer and connected to Channel 1. To set up a Channel 1 trigger, follow these
steps:
• Press the [Trigger] hardkey.
• Press the [CHANNEL 1 234] softkey (F3) until 1 is highlighted.
• Press the [TRIGGER SETUP] softkey (F6)
• Press the [CHANNEL LEVEL] softkey (F1)
• Enter 5 then press the [PERCENT (%)] softkey (F4)
• Press the [SLOPE POS NEG] softkey (F5) until POS is highlighted.
• Press the [Trigger] hardkey.
26
Page 31

AGILENT 35670A
Supplemental Operator’s Guide
• Press the [TRIGGER SETUP] softkey (F6)
• Press the [ALL CHANNELS] softkey (F8)
• Press the [CHANNEL * DELAY] softkey (F9)
• Enter -.01 then press the [S] softkey (F1)
Now to check that the trigger parameters are correct,
• Press the yellow [Start] hardkey.
The analyzer should show in highlighted text above the trace:
WAITING FOR CH 1 TRIGGER
Tap the hammer on the test structure to see if the measurement will trigger. If it will
not, adjust the trigger level and slope until successful.
Setting Up Time Displays
View both the time trace and the windowed time trace for both channels using the
QUAD display format as follows:
• Press the [Disp Format] hardkey.
• Press the [QUAD] softkey (F6).
• Press the [Active Trace] hardkey.
• Press the [A] softkey (F1)
• Press the [Meas Data] hardkey.
• Press the [CHANNEL 1 234] softkey (F1) until 1 is highlighted.
• Press the [TIME CHANNEL 1] softkey (F5)
• Press the [Active Trace] hardkey.
• Press the [B] softkey (F1)
• Press the [TIME CHANNEL 2] softkey (F5)
• Press the [Active Trace] hardkey.
• Press the [C] softkey (F1)
• Press the [CHANNEL 1 234] softkey (F1) until 1 is highlighted.
• Press the [MORE CHOICES] softkey (F9)
• Press the [WINDOWED TIME CH 1] softkey (F5)
• Press the [Active Trace] hardkey.
• Press the [D] softkey (F1)
• Press the [WINDOWED TIME CH 2] softkey (F5)
• Press the [Active Trace] hardkey.
• Press the [ABCD] softkey (F7).
• Press the [Scale] hardkey.
• Toggle the [AUTOSCALE ON OFF] softkey (F1) until ON is highlighted.
27
Page 32

AGILENT 35670A
Supplemental Operator’s Guide
Window
[FFT]
Date: 10-02-96 Time: 09:02:00 PM
A: CH1 Time
Real
B: CH2 Time
Real
-200
C: CH1 Win Time
Real
D: CH2 Win Time
Real
-250
Type: Force/Expo Width: 15 ms
X:488.281 us Y:67.1154 mV
80
mV
-20
mV
-9.766ms 115.112ms
X:488.281 us Y:-74.925 mV
300
mV
mV
-9.766ms 115.112ms
X:488.281 us Y:48.1237 mV
70
mV
-30
mV
-9.766ms 115.112ms
X:488.281 us Y:-53.234 mV
250
mV
mV
-9.766ms 115.112ms
Decay: 30 ms
Using Force/Response Windows
Hammer measurements for modal analysis typically require special windows, named
Force/Response windows, to maximize measurement quality. The force window
merely zeros out the trace after a fixed time interval, so that noise or bumps from the
hammer after the desired impact do not get interpreted as excitation applied to the
structure. The fixed interval must be long enough to capture the whole pulse, so that
measurement of the impact does not get zeroed out. A typical value for the length of
a force window is T/7, where T is the record duration in seconds. For a 1600 Hz
span and resolution of 400 lines, the record length is 250 ms, so a “conservative”
force window might have a duration of 36 ms. Experience may show that a much
shorter duration may work better.
Response windows prevent leakage by artificially decaying the response so that by
the end of the record the signal is less than 5% of the peak. The artificial decay is
specified by a time constant, with shorter time constants providing higher decay
rates. A time constant that is guaranteed to decay a signal to less than 5% is T/4.
For a span of 1600 Hz and resolution of 400 lines, this translates into a response
28
Page 33

AGILENT 35670A
Supplemental Operator’s Guide
window time constant of 62.5 ms. To set up these Force/Response windows, follow
these steps:
• Press the [Window] hardkey.
• Press the [FORCE EXPO] softkey (F4).
• Press the [FORCE EXPO SETUP] softkey (F6).
• Press the [FORCE WIDTH] softkey (F6).
• Enter 36 and then press the [mS] softkey (F2).
• Press the [EXPO DECAY] softkey (F7).
• Enter 62.5 and then press the [mS] softkey (F2).
To view the effects of theForce/Response window,
• Press the yellow [Start] hardkey.
• Tap the structure with the hammer.
Observe the time trcaes. Compare them to their windowed time records. Determine
if the Force/Response windows met their object. Adjust windows if necessary. If it
appears that no window would be required, then it is possible to test with a
“UNIFORM” (meaning factor of 1) window instead of a force/response window. To
select a UNIFORM window,
• Press the [Window] hardkey.
• Press the [UNIFORM] softkey (F3).
Displaying Hammer Test Results
The results of hammer testing are frequency response functions, and the indicator of
measurement quality is coherence. These traces can be set up as follows:
• Press the [Disp Format] hardkey.
• Press the [UPPER/LOWER] softkey (F3).
• Press the [Active Trace] hardkey.
• Press the [A] softkey (F1)
• Press the [Meas Data] hardkey.
• Press the [FREQ RESP 2 / 1] softkey (F6)
• Press the [Scale] hardkey.
• Toggle the [AUTOSCALE ON OFF] softkey (F1) until ON is highlighted..
• Press the [Active Trace] hardkey.
• Press the [B] softkey (F1)
• Press the [Meas Data] hardkey.
• Press the [COHERENCE 2 / 1] softkey (F7)
Averaging
Averaging is a very effective technique for improving the quality of frequency
response measurements. A minimum of four averages reduces noise and variance
29
Page 34

AGILENT 35670A
Supplemental Operator’s Guide
significantly. Ten averages may take longer, but may be necessary when testing
difficult, non-linear structures. To set up five averages, follow these steps:
• Press the [Avg] hardkey.
• Toggle the [AVERAGE ON OFF] softkey (F1) until ON is highlighted.
• Press the [NUMBER AVERAGES] softkey (F2).
• Enter 5 and press the [ENTER] softkey (F1).
To avoid averaging overloaded data, turn on overload reject as follows:
• Press the [Avg] hardkey.
• Toggle the [OVLD REJ ON OFF] softkey (F1) until ON is highlighted.
To start taking measurements,
• Press the yellow [Start] hardkey.
•
Hammer the structure at one measurement point. After the data is acquired and
displayed, hammer the structure again, and repeat 5 times until the average is
complete.
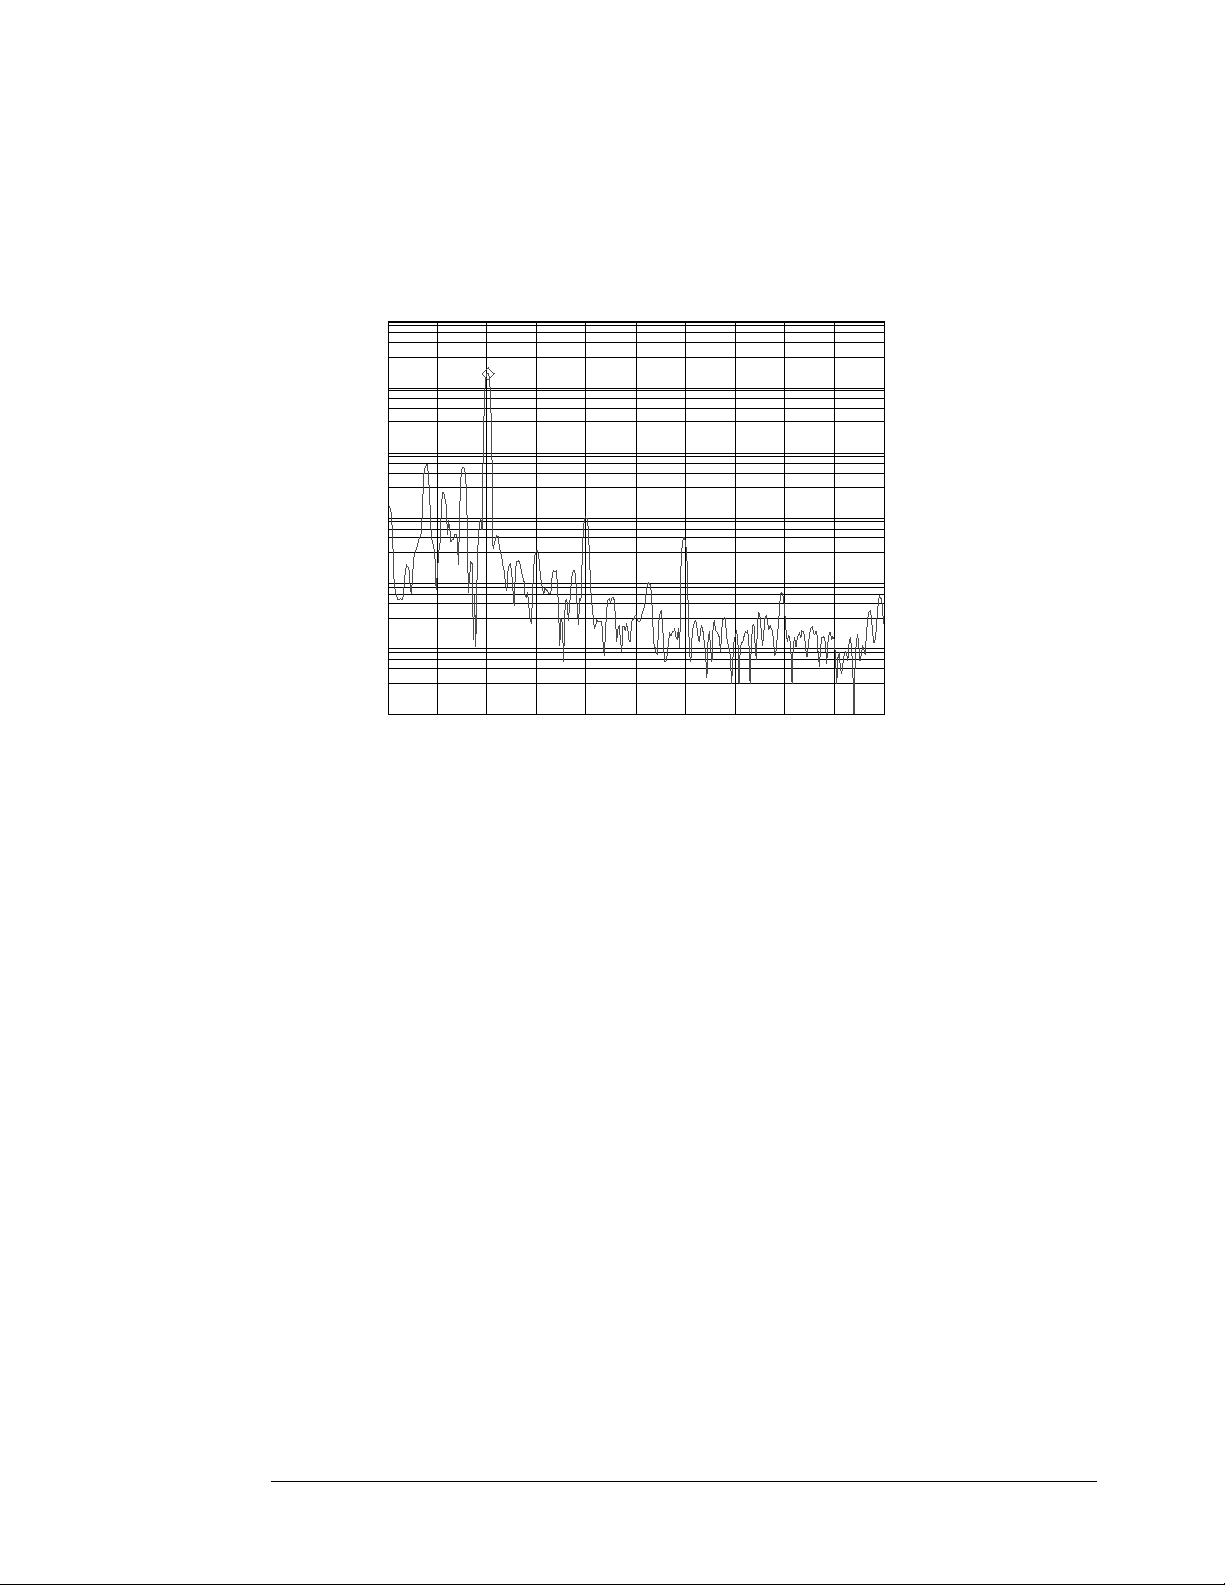
Avg
[FFT]
Date: 10-02-96 Time: 09:06:00 PM
A: Freq Resp2/1 X:2.96 kHz Y:98.678
LogMag
decades
B: Coherence2/1
Real
Type: RMS Number: 5
Update Rt: 5 Overlap: 0 %
100
4
10
e-3
0Hz 3.2kHzAVG: 5
X:2.96 kHz Y:963.738 e-3
0Hz 3.2kHzAVG: 5
/div
100
e-3
1
0
30
Page 35

AGILENT 35670A
Supplemental Operator’s Guide
Changing Frequency Span
Changing frequency span or resolution affects three important parameters in hammer
testing which must be changed to correspond to the new time record length: Trigger
Delay, Force Window Width, and Response Window Decay Time. The following
relationship between the parameters can be used as a guideline:
N
=
T
Where T is the time record length in seconds, N is the resolution in lines, and F is the
frequency span in Hz.
Delay T= 01.( )
()
F
1024.
ForceWidthT=
ExponentialDecayT=
When the frequency span is halved, the Time Record length doubles, as does the
Delay time, Force Width, and Exponential Decay. All three parameters should
change with the inverse of the change in frequency span.
7
4
31
Page 36

AGILENT 35670A
Supplemental Operator’s Guide
Section 12 : Hammer Test Setup Without a Force Transducer
Hammer testing for modal analysis without a force transducer can yield usable
results if an accelerometer is placed on the hammer and used to trigger the
measurement. Although frequency response functions acquired with this technique
will be affected by the dynamic characteristics of the hammer assembly and also its
mass-loading effects, approximate mode frequencies and mode shapes can still be
computed using modal analysis software.
On the other hand, power spectra obtained by measuring the single-channel response
to a non-instrumented hammer strike may also provide information regarding modal
frequencies and shapes, but success is too dependent on the consistency of the
hammer strike, and therefore this technique is not recommended.
Setting Up the Hammer Test Without a Force Transducer
Attach an accelerometer to the hammer using cement or wax, and connect this
transducer to Channel 1. Attach the response accelerometer to the desired location
on the structure, and connect it to Channel 2. Preset the analyzer and set up
transducer parameters as described in the section “Measuring with Transducers.”
Then proceed with the test in accordance with the proceeding section on “Modal
Testing with a Hammer and Accelerometer.”
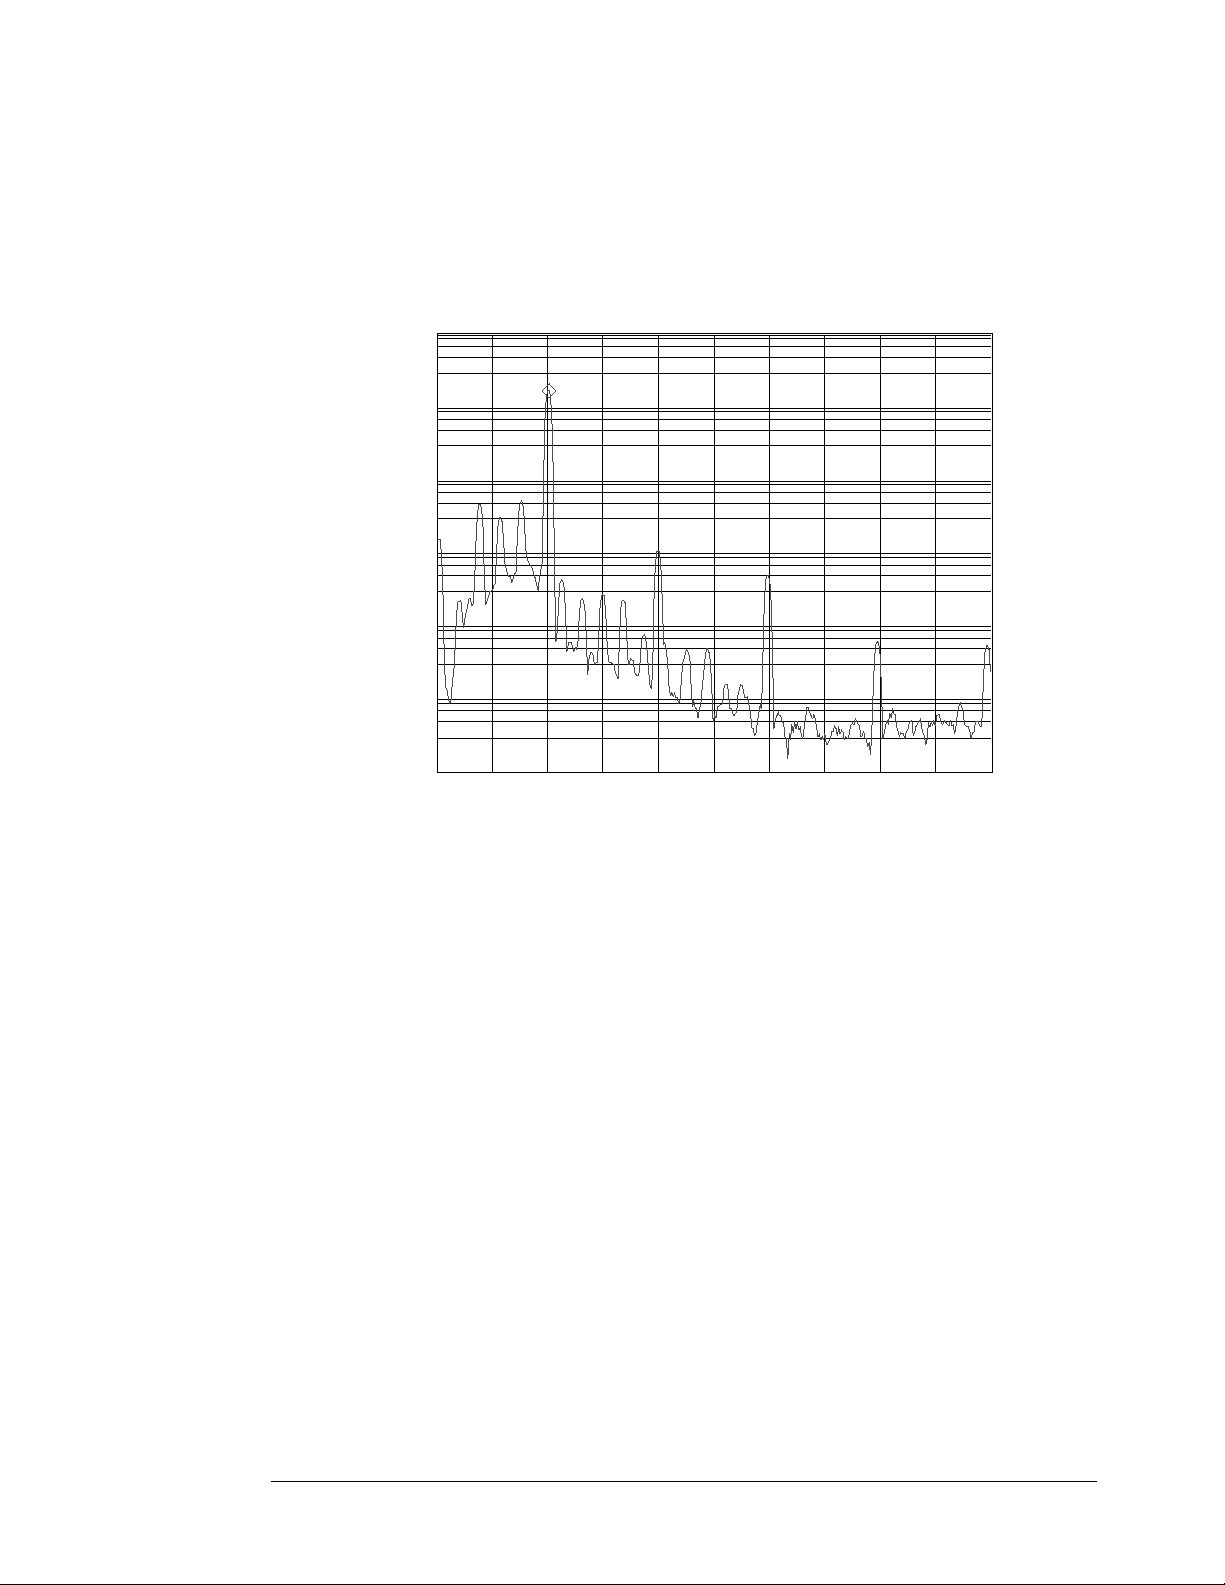
Avg
[FFT]
Date: 10-02-96 Time: 09:24:00 PM
A: Freq Resp2/1 X:656 Hz Y:444.409
LogMag
decades
B: Coherence2/1
Real
Type: RMS Number: 5
Update Rt: 5 Overlap: 0 %
1
e+3
5
10
e-3
0Hz 3.2kHzAVG: 5
X:656 Hz Y:939.573 e-3
0Hz 3.2kHzAVG: 5
/div
100
e-3
1
0
32
Page 37

Section 13 : Order Domain Results in List Mode
Machinery run-ups and run-downs can be analyzed with order analysis, which is
spectral analysis normalized to RPM. Results can be simplified by examining only a
list of amplitude versus order, so that only desired results are examined.
To set up and measure a list of 10 orders for a machinery run-up, follow these steps:
• Press the green [Preset] hardkey
• Press [DO PRESET] softkey (F1).
• Press the [Pause/Cont] hardkey if desired.
• Press the [ORDER ANALYSIS] softkey (F3).
• Press [CHANNELS 1 24 ] softkey (F7) until 1 is highlighted.
• Press the [Input] hardkey
• Press the [CH1 AUTO UP ONLY] software (F5).
Order analysis requires a tachometer signal connected to the TACH BNC at
the back of the analyzer. To set up the AGILENT 35670A for the tachometer
signal, follow these steps:
• Press the [TACHOMETR SETUP] softkey (F9).
• Toggle the [TACH DISP ON OFF] softkey (F6) until ON is highlighted.
• Press the [TACH PULS PER REV] softkey (F1).
• Enter the number of tachometer pulses per shaft revolution
and press the [ENTER] softkey (F1).
• Press the [LEVEL] softkey (F3).
• Enter the tachometer level and press the [ENTER] softkey (F1).
If in doubt about the tachometer level, enter 0.5 V and experiment with
level, slope, and trigger range until a tachometer display is shown.
Prepare the order display as follows:
• Press the [Disp Format] hardkey.
• Press the [UPPER/LOWER] softkey (F3).
• Press the [Active Trace] hardkey.
• Press the [B] softkey (F1)
Prepare the order results list as follows:
• Press the [Analys] hardkey.
• Press the [DATA TABLE] softkey (F5).
• Toggle the [TABLE ON OFF] softkey (F1) until ON is highlighted.
• Press the [INSERT X VALUE] softkey (F4).
• Enter 1 and press the [ORDERS] softkey (F1).
• Enter 2 and press the [ORDERS] softkey (F1).
• Enter 3 and press the [ORDERS] softkey (F1).
AGILENT 35670A
Supplemental Operator’s Guide
33
Page 38

AGILENT 35670A
Supplemental Operator’s Guide
• Enter 4 and press the [ORDERS] softkey (F1).
• Enter 5 and press the [ORDERS] softkey (F1).
• Enter 6 and press the [ORDERS] softkey (F1).
• Enter 7 and press the [ORDERS] softkey (F1).
• Enter 8 and press the [ORDERS] softkey (F1).
• Enter 9 and press the [ORDERS] softkey (F1).
• Enter 10 and press the [ORDERS] softkey (F1).
After the data table is built, it can be saved to disk with the following steps:
• Insert a 3.5” diskette into the AGILENT 35670A
• Press the [Save/Recall] hardkey.
• Press the [SAVE MORE] softkey (F3).
• Press the [SAVE DATA TABL] softkey (F4).
• Press the [ENTER] softkey (F1) to save the data table to the default
filename “DATA1.TBL”
• “DATA1.TBL” can be recalled later to set up the structure of the data
table.
To start taking measurements,
• Press the yellow [Start] hardkey.
Marker Trace: A X Ref: 0
Date: 10-02-96 Time: 09:36:00 PM
A: CH1 Pwr Spec X:2 Order Y:837.946 uVrms
Entry Label Order Vrms
LogMag
1 4.797 u
2 837.946 u
3 21.182 u
4 96.302 u
5 21.047 u
6 59.76 u
7 21.843 u
8 154.291 u
9 58.746 u
10 360.559 u
Y Ref: 100 u
34
Page 39

AGILENT 35670A
Supplemental Operator’s Guide
Section 14 : Comparing Two-Channel Real-Time Spectra with Recalled Data
Compare two channels of real-time data with spectra stored in registers using the
UPPR/LOWR FRNT/BACK display format of the AGILENT 35670A. Note that the
real-time data should be measured with the same frequency and resolution as the
stored data if valid, direct comparisons are desired.
Preset the analyzer as follows:
• Press the green [Preset] hardkey
• Press [DO PRESET] softkey (F1).
• Press the yellow [Pause/Cont] hardkey if desired.
Selecting Measurement Parameters
Refer to the section entitled “Measuring Dual Channel Spectra” to set up span,
ranges, coupling, averaging, and windowing. Transducer parameters set up is
described in the section “Measuring with Transducers.”
Displaying Dual-Channel Spectra Compared with Recalled Data
The results of a dual-channel measurement are compared to recalled spectra in data
registers via the following steps:
• Press the [Disp Format] hardkey.
• Press the [UPPR/LOWR FRNT/BACK] softkey (F5).
• Press the [Active Trace] hardkey.
• Press the [A] softkey (F1).
• Press the [Meas Data] hardkey.
• Press the [CHANNEL 1 234] softkey (F1) until 1 is highlighted.
• Press the [PWR SPEC CHANNEL 1] softkey (F3)
• Press the [Active Trace] hardkey again.
• Press the [B] softkey (F2).
• Press the [Meas Data] hardkey.
• Press the [MORE CHOICES] softkey (F9).
• Press the [DATA REGISTER] softkey (F8).
• Press the [D1] softkey (F1).
• Press the [Active Trace] hardkey.
• Press the [C] softkey (F1).
• Press the [Meas Data] hardkey.
• Press the [CHANNEL 1 2 34] softkey (F1) until 2 is highlighted.
• Press the [PWR SPEC CHANNEL 2] softkey (F3).
• Press the [Active Trace] hardkey again.
• Press the [D] softkey (F2).
• Press the [Meas Data] hardkey.
35
Page 40

AGILENT 35670A
Supplemental Operator’s Guide
• Press the [MORE CHOICES] softkey (F9).
• Press the [DATA REGISTER] softkey (F8).
• Press the [D2] softkey (F2).
Recalling the Spectra from Disk
Use data registers D1 and D2 to contain the spectra used for comparison. D1 is
compared to Channel 1 real-time data, and D2 is compared to Channel 2 real-time
data. Comparison data must either be measured, then stored into data registers D1
and D2, or recalled into registers D1 and D2 from disk or non-volatile RAM. For
instructions on how to store spectra to disk, see the section “Storing Data to a Disk
File.” For instructions on how to store spectra to data registers, see the section
“Storing Data in Data Registers.”
For this section, the comparison data is assumed to be stored in the disk file
“
COMPARE1.DAT” and “COMPARE2.DAT.” To recall these spectra into D1 and
D2, respectively, follow these steps:
• Insert the 3.5” disk containing the files “COMPARE1.DAT” and
“COMPARE2.DAT.”
• Press the [Save/Recall] hardkey.
• Press the [RECALL DATA] softkey (F4).
• Press the [RCL TRACE AND SCALE] softkey (F1).
• Press the [FROM FILE INTO D1] softkey (F1).
• Press the [CLEAR ENTRY] softkey (F9).
• Enter COMPARE1.DAT and press the [ENTER] softkey (F1).
Data from the file “COMPARE1.DAT” now appears in data register D1. Next, recall
COMPARE2.DAT” into dataregister D2 as follows:
“
• Press the [Save/Recall] hardkey.
• Press the [RECALL DATA] softkey (F4).
• Press the [RCL TRACE AND SCALE] softkey (F1).
• Press the [FROM FILE INTO D2] softkey (F2).
• Press the [CLEAR ENTRY] softkey (F9).
• Enter COMPARE2.DAT and press the [ENTER] softkey (F1).
Recalling the Spectra from Non-Volatile RAM
The comparison data files “COMPARE1.DAT” and “COMPARE2.DAT” are stored in
the non-volatile RAM. To recall these spectra into D1 and D2, respectively, follow
these steps:
• Press the [Save/Recall] hardkey.
• Press the [DEFAULT DISK] softkey (F9).
• Press the [NON VOL RAM DISK] softkey (F1).
36
Page 41

AGILENT 35670A
Supplemental Operator’s Guide
• Press the [Save/Recall] hardkey.
• Press the [RECALL DATA] softkey (F4).
• Press the [RCL TRACE AND SCALE] softkey (F1).
• Press the [FROM FILE INTO D1] softkey (F1).
• Press the [CLEAR ENTRY] softkey (F9).
• Enter COMPARE1.DAT and press the [ENTER] softkey (F1).
Data from the file “COMPARE1.DAT” now appears in data register D1. Next, recall
COMPARE2.DAT” into dataregister D2 as follows:
“
• Press the [Save/Recall] hardkey.
• Press the [RECALL DATA] softkey (F4).
• Press the [RCL TRACE AND SCALE] softkey (F1).
• Press the [FROM FILE INTO D2] softkey (F2).
• Press the [CLEAR ENTRY] softkey (F9).
• Enter COMPARE2.DAT and press the [ENTER] softkey (F1).
The data registers now contain the comparison data. To make real-time
measurements, start the measurement as follows:
• Press the yellow [Start] hardkey.
Scaling the Displays
Proper trace scaling of the FRONT/BACK displays provides a quick and clear visual
comparison. Both traces should be set to the same scale, or at least use the same “
Y
PER DIV (DECADES).” This need to be set up for each pair of traces. After
comparison data has been recalled into D1 and D2, and real-time measurements are
complete on Channel 1 and Channel 2, set up scale as follows:
• Press the [Active Trace] hardkey.
• Press the [A B] softkey (F1).
• Press the [Scale] hardkey.
• Toggle the [AUTOSCALE ON OFF] softkey (F1) until ON is highlighted.
• Press the [Y PER DIV (DECADES)] softkey (F6).
• Enter 2 and press the [ENTER] softkey (F1).
Note: Usually one, two, or three decades offers the best scale for comparison. If the
scale is not identical, but the top reference is different, then the traces can be made
identical. Assuming the maximum peak of both traces is about 8 mV, then the top
reference can be set to 10 mV by the following:
• Press the [TOP REFERENCE] softkey (F2).
• Enter 0.01 and press the [ENTER] softkey (F1).
37
Page 42

AGILENT 35670A
Supplemental Operator’s Guide
Scaling for traces A and B are now identical. To accomplish the same trace scaling
for C and D, follow these steps:
• Press the [Active Trace] hardkey.
• Press the [C D] softkey (F1).
• Press the [Scale] hardkey.
• Toggle the [AUTOSCALE ON OFF] softkey (F1) until ON is highlighted.
• Press the [Y PER DIV (DECADES)] softkey (F6).
• Enter 2 and press the [ENTER] softkey (F1).
As with Traces A and B, if the top reference of C and D are not identical, set the top
reference level as shown above.
Using Markers to Compare
Coupled markers can be activated for all traces, but not independently for each pair
of traces. Use coupled markers to compare one set of traces at a time.
38
Page 43

Section 15 : Waterfall Spectra at Time Intervals
Waterfalls on the AGILENT 35670A can be used to examine and compare spectra at
fixed intervals of time. This is especially useful when measuring non-stationary
signals from machinery, such as during run-ups and run-downs. To see a waterfall
display of the vibration signature, follow these steps:
Preset the analyzer as follows:
• Press the green [Preset] hardkey
• Press [DO PRESET] softkey (F1).
• Press the [Pause/Cont] hardkey if desired.
Selecting Single Channel Operation
Specify the single-channel instrument mode to measure one waterfall. Note that it is
possible to measure and display waterfalls for two channels simultaneously. For
single channel operation, however, the display performance will be better with only
one channel active. To measure a single-channel waterfall, turn on the AGILENT
35670A and then:
• Press the [Inst Mode] hardkey
• Press [CHANNELS 1 24 ] softkey (F7) until 1 is highlighted.
AGILENT 35670A
Supplemental Operator’s Guide
Selecting Measurement Parameters
Refer to the section entitled “Measuring Single Channel Spectra” to set up span,
ranges, coupling, averaging, and windowing. Transducer parameters set up is
described in the section “Measuring with Transducers.”
Setting Up the Waterfall Display
The best view of a waterfall includes the current power spectrum above the waterfall
trace. In the AGILENT35670A this is implemented with the UPPER/BIG LOWER
display format as follows:
• Press the [Disp Format] hardkey.
• Select the [UPPER/ BIG LOWER] softkey (F4).
• Press the [Active Trace] hardkey.
• Select the [A] softkey (F2).
• Press the [Meas Data] hardkey.
• Toggle the [CHANNEL 1 234] softkey until 1 is highlighted.
• Press the [PWR SPEC CHANNEL 1] softkey (F3).
Continuing to set up a waterfall display,
• Press the [Active Trace] hardkey.
• Select the [B] softkey (F2).
39
Page 44

AGILENT 35670A
Supplemental Operator’s Guide
• Press the [Disp Format] hardkey.
• Press the [WATERFALL SETUP] softkey (F8).
• Toggle the [WATERFALL ON OFF] softkey (F1) until ON is highlighted.
The default number of waterfall steps is 15, which means only 15 spectra are kept in
memory and as new data is taken, the oldest spectra is discarded. The maximum
number of waterfall steps which can be kept in memory depends on the RAM option
installed in the AGILENT 35670A and the lines of resolution in each spectra. With
standard memory and one channel active, 130 spectra can be stored with 400 lines of
resolution. With maximum optional RAM, over 1000 spectra may be kept in
memory.
The z-axis range describes how many spectra will be displayed in the waterfall
simultaneously. The default number is 15.
Setting Up Time Step Arm
Waterfall spectra can be acquired at constant intervals of time by arming the
measurement using TIME STEP ARM as follows:
• Press the [Trigger] hardkey.
• Select the [ARM SETUP] softkey (F7).
• Select the [TIME STEP ARM] softkey (F4).
• Select the [TIME STEP SIZE] softkey (F8).
• Enter 1.5 and press the [S] softkey (F1).
This sets up a 1.5 second time interval between spectra in the waterfall. Note that if
the time record for a frequency span is too long, data cannot be acquired at the
specified time interval. For example when the frequency span is 200 Hz and the
resolution is 400 lines, the time record length is about 2 seconds. Waterfall spectra
cannot be acquired any faster than a 2 second interval.
On the other hand if the time record length is equal to or shorter than the specified
time interval, the measurement will be armed (and triggered, when FREE RUN
TRIGGER is selected) exactly at the time interval increment.
To acquire a waterfall with 15 spectra at 1.5 second intervals, start the measurement:
• Press the yellow [Start] hardkey.
Using Slice Markers with Waterfall Data
Examine amplitude vs. time for a specified frequency using the AGILENT 35670A’s
waterfall slice marker. Select the frequency using the waterfall marker, then display
the time history at that frequency as follows:
• Press the [Active Trace] hardkey.
• Select the [B] softkey (F2).
40
Page 45

AGILENT 35670A
Supplemental Operator’s Guide
This makes the waterfall trace active.
• Press the [Marker Fctn] hardkey.
• Press the [WATERFALL MARKERS] softkey (F5).
The SLICE SELECT softkey will be active. Use the marker knob to move the cursor
to the frequency of interest.
• Press the [SAVE AND DISP DATA] softkey (F5).
This one keystroke saves the selected slice into data register D2 and changes the
Meas Data of Trace A to display data register D2. Trace A will show the amplitude
in the selected frequency band vs. time.
Collecting a Specified Number of Spectra During a Time Interval
Acquire a specified number of spectra into a waterfall during a fixed interval using
time step arm. Divide the total measurement interval by the number of spectra
desired during the interval to determine the desired TIME STEP SIZE. For example
to measure 10 spectra during a one minute interval, select a 6 second TIME STEP
SIZE as follows:
• Press the [Trigger] hardkey.
• Select the [ARM SETUP] softkey (F7).
• Select the [TIME STEP ARM] softkey (F4).
• Select the [TIME STEP SIZE] softkey (F8).
• Enter 6 and press the [S] softkey (F1).
Then specify the total number of spectra to be collected (10):
• Press the [Active Trace] hardkey.
• Select the [B] softkey (F2).
• Press the [Disp Format] hardkey.
• Select the [WATERFALL SETUP] softkey (F8).
• Select the [WATERFALL STEPS] softkey (F8).
• Enter 10 and then press the [ENTER] softkey (F1).
When Start is pressed, a new spectra will be acquired every six seconds.
41
Page 46

AGILENT 35670A
Supplemental Operator’s Guide
Section 16 : Waterfall Spectra at RPM Intervals
Spectra can be acquired at fixed RPM intervals with RPM STEP ARM. This feature
allows spectra to be taken at uniform RPM intervals even during erratic run-ups.
Setting Up the Tachometer
Connect the tachometer signal to the TACH BNC connector on the back of the
AGILENT 35670A. Set up tachometer parameters as follows, assuming that the
tachometer is a 1 V peak signal with 2 pulses per revolution:
• Press the [Trigger] hardkey.
• Press the [TACHOMTER SETUP] softkey (F8).
• Press the [TACH PULS PER REV] softkey (F8).
• Enter 2 then press the [ENTER] softkey (F1).
• Toggle the [TACH DISP ON OFF] softkey (F6) until ON is highlighted.
Specifying the Start RPM
To set up RPM interval triggering, refer to the preceding section regarding Time
Step Arm, then follow these instructions:
• Press the [Trigger] hardkey.
• Press the [ARM SETUP] softkey (F7).
• Select the [RPM STEP ARM] softkey (F3).
• Press the [START RPM] softkey (F6).
• Press 1000 then the [RPM] softkey (F1).
This starts the measurement when 1000 RPM.
• Press the [RPM STEP SIZE] softkey (F7).
• Press 25 then the [RPM] softkey (F1).
This arms the measurement every 25 RPM.
Collecting a Specified Number of Spectra During an RPM Interval
Acquire a specified number of spectra into a waterfall during an RPM run-up using
RPM step arm. Divide the total RPM interval by the number of spectra desired
during the interval to determine the desired RPM STEP SIZE. For example to
measure 15 spectra during an RPM run-up from 1000 RPM to 1750 RPM, select an
RPM STEP SIZE of 50 as follows:
• Press the [Trigger] hardkey.
• Select the [ARM SETUP] softkey (F7).
• Select the [RPM STEP ARM] softkey (F4).
• Press the [START RPM] softkey (F6).
• Press 1000 then the [RPM] softkey (F1).
• Press the [RPM STEP SIZE] softkey (F7).
42
Page 47

AGILENT 35670A
Supplemental Operator’s Guide
• Press 50 then the [RPM] softkey (F1).
Then specify the total number of spectra to be collected (15):
• Press the [Active Trace] hardkey.
• Select the [B] softkey (F2).
• Press the [Disp Format] hardkey.
• Select the [WATERFALL SETUP] softkey (F8).
• Select the [WATERFALL STEPS] softkey (F8).
• Enter 15 and then press the [ENTER] softkey (F1).
When Start is pressed, spectra will be acquired as soon as the tachometer reaches
1000 RPM, and every 50 RPM thereafter until 15 spectra have been measured.
Starting and Pausing a Measurement
To start a waterfall measurement, press the yellow [Start] hardkey. To pause
waterfall at any moment, press the yellow
can be continued by pressing the yellow
[Pause/Cont] hardkey. A measurement
[Pause/Cont] hardkey again. The ability to
pause a machinery run-up measurement allows the user to capture and observe
critical data, such as a vibration resonance build-up over a certain rpm range.
Scaling the Display
Because a waterfall contains so much spectral information, it is often desirable to
eliminate unwanted data from view, such as the noise floor, so that the critical data
can be examined and compared. This is readily accomplished with display scaling.
To scale the waterfall data acquired from Track 31 of the AGILENT Dynamic
Signals II CD:
• Press the [Active Trace] hardkey.
• Press the [B] softkey (F2).
• Press the [Scale] hardkey.
• Press the [TOP REFERENCE] softkey (F1).
• Press 5 then [ENTER].
• Press the [Y PER DIV (DECADES)] softkey (F6).
• Press 4 then [ENTER].
Mechanical resonances at around 4170 RPM should become clearly visible with
these scaling parameters.
43
Page 48

AGILENT 35670A
Supplemental Operator’s Guide
Marker Fcn
[Watrfall]
Date: 07-24-96 Time: 11:31:00 PM
A: D2 Pwr Spec
Vrms
LogMag
decades
100 u
B: CH1 Pwr Spec
Vrms
LogMag
uVrms
4.883
kRPM
3.383
kRPM
Trace: B Save Reg: D2
Base Supr: 0 % Height: 57 %
1
4
0Hz 800Hz
Slice:122 Hz Trace:4.311 kRPM
1
100
0Hz 800Hz
A Properly Scaled, RPM Triggered Waterfall Display
44
Page 49

AGILENT 35670A
Supplemental Operator’s Guide
Section 17 : Two-Channel Absolute and Differential Amplitude Measurement
Measuring the relative motion between points on a machine can provide information
regarding clearances and forces. These measurements may also demonstrate a
susceptibility of a machine to a particular mode of vibration.
Absolute motion can be measured as a power spectrum, with units of peak-to-peak
displacement in mils. Relative motion is measured as the vector difference between
two channels. It also can be displayed with units of peak-to-peak displacement in
mils.
When acquiring these measurements, it is very important to know the relative
polarity of each transducer. If their polarity is opposite, then the signals must be
added, not subtracted, to obtain differential motion.
The best technique is to use two identical accelerometers. If the transducers are not
the same model, then it is best to determine their relative polarity.
Accelerometer Polarity
To determine the polarity of two accelerometers, follow these steps:
• Press the green [Preset] hardkey
• Press [DO PRESET] softkey (F1).
• Press the [Pause/Cont] hardkey if desired.
• Press the [Freq] hardkey
• Enter 3200 and then press the [Hz] softkey (F2).
• Press the [Input] hardkey.
• Press the [ALL CHANNELS] softkey (F2).
• Select the [CH* AUTO UP ONLY] softkey (F5).
Set up transducer parameters as described in the section “Measuring with
Transducers.” Then follow these steps to display a time trace of the two
accelerometers:
• Press the [Disp Format] hardkey.
• Press the [UPPER/LOWER] softkey (F3).
• Press the [Active Trace] hardkey.
• Press the [A] softkey (F1)
• Press the [Meas Data] hardkey.
• Press the [CHANNEL 1 234] softkey (F1) until 1 is highlighted.
• Press the [TIME CHANNEL 1] softkey (F5)
• Press the [Scale] hardkey.
45
Page 50

AGILENT 35670A
Supplemental Operator’s Guide
• Toggle the [AUTOSCALE ON OFF] softkey (F1) until ON is highlighted..
• Press the [Active Trace] hardkey.
• Press the [B] softkey (F1)
• Press the [Meas Data] hardkey.
• Press the [CHANNEL 1 2 34] softkey (F1) until 2 is highlighted.
• Press the [TIME CHANNEL 2] softkey (F5)
• Press the [Scale] hardkey.
• Toggle the [AUTOSCALE ON OFF] softkey (F1) until ON is highlighted.
Set up triggering on Channel 1 to 5% of range:
• Press the [Trigger] hardkey.
• Press the [CHANNEL 1 234] softkey (F3) until 1 is highlighted.
• Press the [TRIGGER SETUP] softkey (F6)
• Press the [CHANNEL LEVEL] softkey (F1)
• Enter 5 then press the [PERCENT (%)] softkey (F4).
• Press the [ALL CHANNELS] softkey (F8).
• Press the [CHANNEL * DELAY] softkey (F9).
• Enter -0.01 then press the [S] softkey (F1).
Mount the accelerometers on top of each other or very close together on a light test
structure, then:
• Press the yellow [Start] hardkey.
• Tap the structure in the area around the two accelerometers to trigger a
measurement.
• If the measurement overloaded, then tap again after the range has
increased. Tap again until a trace is not overloaded.
• Press the [Marker] hardkey.
• Toggle the [COUPLED ON OFF] softkey (F2) until ON is highlighted.
• Examine the two time traces with the coupled markers to determine if the
accelerometers are in phase or out of phase.
Note whether the accelerometers are in phase or out of phase. The function to
determine differential amplitude depends on this relationship.
Measuring Amplitudes, Differential Amplitude, and Phase
For machinery motion measurements, one display setup can show:
• displacement of Channel 1 in mils peak-to-peak
• displacement of Channel 2 in mils peak-to-peak
46
Page 51

AGILENT 35670A
Supplemental Operator’s Guide
• difference in motion between Channel 1 and Channel 2 in mils peak-topeak
• phase angle between the two channels.
Set up the AGILENT 35670A
• Press the green [Preset] hardkey
• Press [DO PRESET] softkey (F1).
• Press the [Pause/Cont] hardkey if desired.
• Press the [Freq] hardkey
• Enter 800 and then press the [Hz] softkey (F2).
• Press the [Input] hardkey.
• Press the [ALL CHANNELS] softkey (F2).
• Select the [CH* AUTO UP ONLY] softkey (F5).
Set up transducer parameters on Channel 1 and Channel 2 as per the section
“Measuring with Transducers.” Mount the accelerometers to the machinery and
connect them to Channel 1 and Channel 2. The following procedures assume that
Using a Math Function to Measure Differential Motion
For accelerometers with the same polarity
• Press the [Analys] hardkey.
• Press the [DEFINE FUNCTION] softkey (F1).
• Press the [DEFINE F1] softkey (F1).
• Press the [MEAS DATA] softkey (F1).
• Press the [LIN SPEC CHANNEL 1] softkey (F3).
• Press the [ - ] softkey (F2).
• Press the [MEAS DATA] softkey (F1).
• Toggle the [CHANNEL 1 2 34] softkey (F1) until 2 is highlighted.
• Press the [LIN SPEC CHANNEL 2] softkey (F3).
• Press the [ENTER] softkey (F7).
For accelerometers with opposite polarity
• Press the [Analys] hardkey.
• Press the [DEFINE FUNCTION] softkey (F1).
• Press the [DEFINE F1] softkey (F1).
• Press the [MEAS DATA] softkey (F1).
• Press the [LIN SPEC CHANNEL 1] softkey (F3).
• Press the [ + ] softkey (F1).
• Press the [MEAS DATA] softkey (F1).
47
Page 52

AGILENT 35670A
Supplemental Operator’s Guide
• Toggle the [CHANNEL 1 2 34] softkey (F1) until 2 is highlighted.
• Press the [LIN SPEC CHANNEL 2] softkey (F3).
• Press the [ENTER] softkey (F7).
Set up display
• Press the [Disp Format] hardkey.
• Press the [QUAD] softkey (F6).
After a instrument preset the QUAD display format normally places PWR SPEC
CHANNEL 1 in Trcae A and PWR SPEC CHANNEL 2 in Trace B. If this is not the
case, then follow these steps:
• Press the [Active Trace] hardkey.
• Press the [A] softkey (F1).
• Press the [Meas Data] hardkey.
• Press the [CHANNEL 1 234] softkey (F1) until 1 is highlighted.
• Press the [PWR SPEC CHANNEL 1] softkey (F3)
• Press the [Active Trace] hardkey again.
• Press the [B] softkey (F2).
• Press the [CHANNEL 1 2 34] softkey (F1) until 2 is highlighted.
• Press the [PWR SPEC CHANNEL 2] softkey (F3).
Put the math function of the differential motion in Trace c:
• Press the [Active Trace] hardkey.
• Press the [C] softkey (F1).
• Press the [MORE CHOICES] softkey (F9).
• Press the [MATH FUNCTION] softkey (F7).
• Press the [F1] softkey (F1).
• Press the [Active Trace] hardkey again.
• Press the [D] softkey (F2).
• Press the [Meas Data] hardkey.
• Press the [FREQ RESP 2 / 1]] softkey (F6).
Set up trace coordinates as peak-to-peak mil
• Press the [Active Trace] hardkey.
• Press the [ABCD] softkey (F7).
• Press the [Trace Coord] hardkey.
• Press the [Y UNITS] softkey (F8).
• Toggle the [AMPLITUDE PK PP RMS] softkey (F1) until PP is
highlighted.
• Press the [XDCR UNIT CONVERT] softkey (F4).
• Press the [mil (DISP)] softkey (F8).
48
Page 53

AGILENT 35670A
Supplemental Operator’s Guide
• Press the [Active Trace] hardkey again.
• Press the [D] softkey (F2).
• Press the [Trace Coord] hardkey.
• Press the [PHASE] softkey (F4).
Start measurement
• Press the yellow [Start] hardkey.
The AGILENT 35670A will now measure motion of Channel 1 and 2 and show the
results in Traces A and B. The difference in motion between Channel 1 and Channel
2 is shown in Trace C. The phase angle between channels is shown in Trace D.
Disp Frmat
Date: 01-01-04 Time: 08:35:00 AM
A: CH1 MOTION
100
milpp
LogMag
10
umilpp
0Hz 1.6kHzAVG: 10
B: CH2 MOTION
1
milpp
LogMag
10
umilpp
0Hz 1.6kHzAVG: 10
C: DIFFERENCE
100
milpp
LogMag
10
umilpp
0Hz 1.6kHz
D: PHASE DIFF
180
deg
Phase
-180
deg
0Hz 1.6kHzAVG: 10
X:468 Hz Y:39.2406 mmilpp
X:468 Hz Y:15.8415 mmilpp
X:468 Hz Y:24.6051 mmilpp
X:468 Hz Y:-170.713 deg
49
Page 54

AGILENT 35670A
Supplemental Operator’s Guide
Section 18 : Measuring Frequency Response with the AGILENT 35670A
Frequency response functions characterize the behavior of systems to external
stimuli. For mechanical systems, the stimulus can be a transient force such as an
impact from a hammer, or a broadband stimulus, such as random excitation from an
electrodynamic shaker. The response is usually motion of the system, measured with
and accelerometer, velocity transducer, or displacement probe.
In either case the stimulus and the response measured with two channels of the
AGILENT 35670A. The stimulus is usually measured on Channel 1, and the
response is measured on Channel 2. The resulting frequency response is averaged to
reduce noise and variance, and the result is displayed in a variety of formats that will
be described in this section, including:
• Magnitude and phase
• Real and imaginary components (
• Nyquist Diagrams
The quality of the frequency response measurement is determined by how much of
the response is due to the stimulus instead of being due to noise or other undesirable,
unmeasured forces. Quality is described by coherence, which ranges from zero to
one, where zero means none of the response is due to the stimulus. A coherence of
one means that the response was entirely due to the stimulus
Measuring Frequency Response Using Impact Excitation
Refer to the section “Modal Testing Using a Hammer and Accelerometer” to
measure frequency response using an impact as a stimulus. An impact provides
broadband excitation, however the impact has a high peak to RMS ratio which tends
to reduce measurement quality.
Measuring Frequency Response Using Broadband Excitation
Excite a system using the AGILENT 35670A built-in source to provide broadband
excitation with low peak to RMS ratio and the best measurement quality. Use burstrandom noise to eliminate window distortion and reduce leakage. The following
instructions show how to set up a modal test with these example parameters:
electrodynamic shaker with amplifier
ICP force transducer with sensitivity of 8 mV/lb.
ICP accelerometer with sensitivity of 10.2 mV/G
wire sting to connect shaker to force transducer
burst random excitation, uniform window
frequency span of 800 Hz, 4 averages
results viewed as log magnitude and phase
Set up the shaker
• Attach force transducer to structure
50
Page 55

• Attach one end of stinger to shaker and one end to force transducer
• Connect amplifier output to shaker
• Connect amplifier input to AGILENT 35670A source
Connect the transducers
• Connect force transducer to Channel 1
• Connect accelerometer to Channel 2
Preset the AGILENT 35670A
• Turn on the AGILENT 35670A, or
• Press the green [Preset] hardkey
• Press the yellow [Pause/Cont] hardkey if desired.
Enter Channel 1 input parameters
• Press the [Input] hardkey
• Press [CH1 AUTO UP ONLY] softkey (F5).
• Press [FRONT END CH1 SETUP] softkey (F7).
• Press [ICP SUPLY ON OFF] softkey (F8) until ON is highlighted.
• Press the [Input] hardkey
• Press [XDCR UNIT CH1 SETUP] softkey (F8)
• Press the [XDCR SENSITVTY] softkey (F6).
• Enter 8, then press the [mV/EU] softkey (F2).
• Toggle the [XDCR UNIT ON OFF] softkey (F4) until ON is highlighted.
• Press the [XDCR UNIT LABEL] softkey (F7).
• Press the [MORE CHOICES] softkey (F9).
• Select the [lb] softkey (F6).
Enter Channel 2 input parameters
• Press the [Input] hardkey
• Press [CHANNEL 1 2 34] softkey (F1) until 2 is highlighted.
• Press [CH2 AUTO UP ONLY] softkey (F5).
• Press [FRONT END CH2 SETUP] softkey (F7).
• Press [ICP SUPLY ON OFF] softkey (F8) until ON is highlighted.
• Press the [Input] hardkey
• Press [XDCR UNIT CH2 SETUP] softkey (F8)
• Press the [XDCR SENSITVTY] softkey (F6).
• Enter 10.2, then press the [mV/EU] softkey (F2).
• Toggle the [XDCR UNIT ON OFF] softkey (F4) until ON is highlighted.
• Press the [XDCR UNIT LABEL] softkey (F7).
• Select the [g] softkey (F2).
AGILENT 35670A
Supplemental Operator’s Guide
51
Page 56

AGILENT 35670A
Supplemental Operator’s Guide
Choose measurement parameters
• Press the [Freq] hardkey
• Enter 800 and then press the [Hz] softkey (F2)
• Press the [Avg] hardkey.
• Press the [NUMBER AVERAGES] softkey (F2), enter 4, then press the
[ENTER] softkey (F1).
• Turn on averaging by pressing the [AVERAGE ON OFF] softkey (F1)
until ON is highlighted.
• Press the [Window] hardkey
• Press the [UNIFORM] softkey (F3).
Set up display parameters
• Press the [Disp Format] hardkey.
• Press the [UPPER/LOWER] softkey (F3)
• Press the [Active Trace] hardkey.
• Press the [AB] softkey (F5).
• Press the [Meas Data] hardkey.
• Press the [FREQ RESP 2 / 1 ] softkey (F6)
• Press the [Scale] hardkey.
• Toggle the [AUTOSCALE ON OFF] softkey (F1) until ON is highlighted.
• Press the [Active Trace] hardkey.
• Press the [B] softkey (F2).
• Press the [Trace Coord] hardkey.
• Press the [PHASE] softkey (F4).
Set up the AGILENT 35670A source (if amplifier has level control)
• Check the following connections:
AGILENT 35670A source connected to amplifier input
amplifier plugged in
amplifier output connected to shaker
force transducer connected to Channel 1
• Reduce amplifier level control the lowest setting
• Turn on amplifier
• Press the [Source] hardkey.
• Press the [RANDOM NOISE] softkey (F5)
• Press the [LEVEL] softkey (F2)
• Enter 0.5, then press the [Vpk] softkey (F1).
• Toggle the [SOURCE ON OFF] softkey (F1) until ON is highlighted.
52
Page 57

Supplemental Operator’s Guide
• Turn up the level control on the shaker amplifier until the excitation is
noticeable, but does not buzz or rattle. If buzzing or rattling is heard,
then either the level is too high or the structure is loose and must be
quieted.
• Press the [MORE CHOICES] softkey (F9)
• Press the [BURST RANDOM] softkey (F2)
Set up the trigger
• Press the [Trigger] hardkey.
• Press the [SOURCE TRIGGER] softkey (F4).
To acquire a burst random frequency response of the structure:
• Press the yellow [Start] hardkey.
AGILENT 35670A
Avg
[FFT]
Date: 10-02-96 Time: 09:49:00 PM
A: Freq Resp2/1 X:0 Hz Y:84.6724 e-3
LogMag
decades
B: Freq Resp2/1
Phase
/div
-180
Type: RMS Number: 10
Update Rt: 5 Overlap: 0 %
1
3
1
e-3
0Hz 400HzAVG: 10
X:0 Hz Y:0 deg
180
deg
36
deg
deg
0Hz 400HzAVG: 10
Viewing Frequency Response Results with a Nyquist Diagram
The previous display shows frequency response results with Log Magnitude and
Phase traces. Other trace coordinates are available. To examine results in a Nyquist
Diagram, proceed as follows:
53
Page 58

AGILENT 35670A
Supplemental Operator’s Guide
• Press the [Disp Format] hardkey.
• Press the [SINGLE] softkey (F1)
• Press the [Active Trace] hardkey.
• Press the [A] softkey (F1).
• Press the [Trace Coord] hardkey.
• Press the [MORE CHOICES] softkey (F6).
• Press the [NYQUIST DIAGRAM] softkey (F4).
Trac Coord
[FFT]
Date: 10-02-96 Time: 09:49:00 PM
A: Freq Resp2/1 X:262 Hz R:-117.6 e-3 I:-101.3 e-3
Imag
Nyquist
/div
-300
A: Nyquist B: Phase
C: Real D: Real
200
e-3
50
e-3
e-3
Real-366.456e-3 266.456e-3AVG: 10
+j
+1-1
-j
Viewing Results Using Real and Imaginary Traces
View frequency response measurements using real and imaginary coordinates as
follows:
• Press the [Disp Format] hardkey.
• Press the [UPPER/LOWER] softkey (F3).
• Press the [Active Trace] hardkey.
• Press the [AB] softkey (F5).
• Press the [Meas Data] hardkey.
• Press the [FREQ RESP 2 / 1] softkey (F6).
• Press the [Scale] hardkey.
54
Page 59

AGILENT 35670A
Supplemental Operator’s Guide
• Toggle the [AUTOSCALE ON OFF] softkey (F1) until ON is highlighted.
• Press the [Active Trace] hardkey.
• Press the [A] softkey (F2).
• Press the [Trace Coord] hardkey.
• Press the [MORE CHOICES] softkey (F6).
• Press the [REAL PART] softkey (F2).
• Press the [Active Trace] hardkey.
• Press the [B] softkey (F2).
• Press the [IMAGINARY PART] softkey (F3).
Assessing Measurement Quality
Measurement quality is described by coherence, which varies from 0 to 1. To set up
a coherence display, follow these steps:
• Press the [Meas Data] hardkey.
• Press the [COHERENCE 2 / 1] softkey (F7).
A coherence value of 1 means the response measured by Channel 2 was due to the
excitation of Channel 1. A coherence of 0 means that none of the response of
Channel 2 was due to the input measured by Channel 1.
Burst random excitation usually exhibits excellent coherence unless non-linearities
are excited.
55
Page 60

AGILENT 35670A
Supplemental Operator’s Guide
Section 19 : Two Spectral Traces Showing Mils and Ips while EU is G
Measure an accelerometer signal and display velocity and displacement spectra with
the UPPER/LOWER display format in the AGILENT 35670A as follows:
Preset the AGILENT 35670A
• Turn on the AGILENT 35670A, or
• Press the green [Preset] hardkey
• Press the yellow [Pause/Cont] hardkey if desired.
• Press [CHANNELS 1 24 ] softkey (F7) until 1 is highlighted.
Set up transducer parameters for a 10 mV/g accelerometer:
• Press the [Input] hardkey
• Press [FRONT END CH1 SETUP] softkey (F7).
• Press [ICP SUPLY ON OFF] softkey (F8) until ON is highlighted.
• Press [Input] hardkey.
• Press [XDCR UNIT CH1 SETUP] softkey (F8)
• Press the [XDCR SENSITVTY] softkey (F6).
• Enter 10 (for an accelerometer with 10 mV/g sensitivity), then press the
[mV/EU] softkey (F2).
• Toggle the [XDCR UNIT ON OFF] softkey (F4) until ON is highlighted.
• Press the [XDCR UNIT LABEL] softkey (F7).
• Select the [g] softkey (F2).
Set up display format and Trace A to measure displacement in mil (0-pk):
• Press the [Disp Format] hardkey.
• Press the [UPPER/LOWER] softkey (F3)
• Press the [Active Trace] hardkey.
• Press the [A] softkey (F5).
• Press the [Trace Coord] hardkey.
• Press the [Y UNITS] softkey (F8)
• Toggle the [AMPLITUDE PK PP RMS] softkey (F4) until PK is
highlighted.
• Press the [XDCR UNIT CONVERT] softkey (F4)
• Press the [mil (DISP)] softkey (F8)
• Press the [Scale] hardkey.
• Toggle the [AUTOSCALE ON OFF] softkey (F1) until ON is highlighted.
• Press the yellow [Start] hardkey.
Set up Trace B to measure velocity in inch/s (0-pk):
• Press the [Active Trace] hardkey.
• Press the [B] softkey (F2).
56
Page 61

AGILENT 35670A
Supplemental Operator’s Guide
• Press the [Trace Coord] hardkey.
• Press the [Y UNITS] softkey (F8)
• Toggle the [AMPLITUDE PK PP RMS] softkey (F4) until PK is
highlighted.
• Press the [XDCR UNIT CONVERT] softkey (F4)
• Press the [inch/s (VEL)] softkey (F6)
• Press the [Scale] hardkey.
• Toggle the [AUTOSCALE ON OFF] softkey (F1) until ON is highlighted.
57
Page 62

AGILENT 35670A
Supplemental Operator’s Guide
Section 20 : Peak Hold During a Machine Run-up and Coast-Down
Peak amplitudes experienced during run-ups and coast-downs can be measured
directly with the AGILENT 35670A using peak hold. Although the resulting spectra
will indicate the maximum amplitude measured in each frequency bin during the
course of the run-up and run-down, it is not possible to determine from this
information whether the peak was due to the fundamental frequency or a harmonic.
To measure peak amplitudes, peak hold averaging is selected with enough averages
specified so that peaks can be accumulated during the entire run-up and run-down,
after which the measurement is paused and the results examined.
To set up a single-channel peak hold average for a run-up duration of 1 minute,
proceed as follows:
• Select a frequency span and resolution, for example 800 Hz and 400
lines.
• Determine the time record length for this combination,
T=N/F=400/800=0.5 s
• Determine how many averages are required to last for the measurement
duration. Navg=Duration/T=60/.5=120 averages
• Specify number of averages to be greater than this number.
Preset the AGILENT 35670A
• Turn on the AGILENT 35670A, or
• Press the green [Preset] hardkey
• Press the yellow [Pause/Cont] hardkey if desired.
• Press [CHANNELS 1 24 ] softkey (F7) until 1 is highlighted.
Specify measurement parameters
• Press the [Freq] hardkey
• Enter 800 and then press the [Hz] softkey (F2)
• Press the [Avg] hardkey.
• Press the [NUMBER AVERAGES] softkey (F2), enter 200, then press the
[ENTER] softkey (F1).
• Turn on averaging by pressing the [AVERAGE ON OFF] softkey (F1)
until ON is highlighted.
• Press the [AVERAGE TYPE] softkey (F3).
• Press the [PEAK HOLD] softkey (F5).
Set up display format to measure peak amplitude
• Press the [Disp Format] hardkey.
• Press the [SINGLE] softkey (F1)
58
Page 63

• Press the [Active Trace] hardkey.
• Press the [A] softkey (F5).
• Press the [Scale] hardkey.
• Toggle the [AUTOSCALE ON OFF] softkey (F1) until ON is highlighted.
• Press the yellow [Start] hardkey.
When the run-up and run-down is completed,
• Press the yellow [Pause/Cont] hardkey and examine results.
AGILENT 35670A
Supplemental Operator’s Guide
Avg
[FFT]
Date: 10-02-96 Time: 09:55:00 PM
B: CH1 Pwr Spec X:0 Hz Y:994.858 uVrms
mVrms
LogMag
decades
uVrms
Type: Peak Hold Number: 100
Update Rt: 5 Overlap: 0 %
100
4
10
0Hz 400HzAVG: 25
59
Page 64

AGILENT 35670A
Supplemental Operator’s Guide
Section 21 : Using an External Trigger for Time Averaging
Use external triggering for synchronous averaging of linear spectra. With a reliable,
consistent trigger, the resulting noise floor tends to be eliminated and the signal-tonoise ratio of the measurement can be optimal.
If the trigger is TTL, with little noise and jitter, then trigger setup is accomplished as
follows:
• Press the [Trigger] hardkey.
• Select the [EXTERNAL TRIGGER] softkey (F2).
• Press the [TRIGGER SETUP] softkey (F6)
• Toggle the [EXT LEVEL USER TTL] softkey (F1) until TTL is
highlighted.
Other trigger parameters such as USER EXT LEVEL and EXT RANGE do not need
to be specified when using a TTL trigger.
Specify User Levels for Triggering
When the external trigger is not a TTL signal, the trigger level, slope, and range can
be specified to accommodate a broad range of external triggers. Successful
triggering is easiest to obtain when the external trigger signal is well characterized.
Trigger range, level, and slope must be determined.
Characterizing the External Trigger
External trigger pulses can be noisy and of an unknown shape and amplitude.
Reliable use of an external trigger requires knowledge of trigger characteristics so
that the AGILENT 35670A can be set up properly. This section provides guidance
in capturing and analyzing trigger signals so that reliable external triggering is
attained.
Connect the signal and preset the AGILENT 35670A
• Connect the external trigger signal to Channel 1.
• Turn on the AGILENT 35670A, or
• Press the green [Preset] hardkey
• Press the yellow [Pause/Cont] hardkey if desired.
Select the Histogram/Time measurement mode. This mode turns off the anti-alias
filter so that the actual analog signal can be examined.
• Press the [HISTOGRAM / TIME] softkey (F6).
• Press the [Meas Data] hardkey.
• Press the [UNFILTERD TIME CH 1] softkey (F6).
• Press the [Scale] hardkey.
• Toggle the [AUTOSCALE ON OFF] softkey (F1) until ON is highlighted.
60
Page 65

Acquire and Display the Trigger Signal
• Press the yellow [Start] hardkey.
• Press the [Freq] hardkey.
• Press the [UP ARROW] hardkey until only a few trigger pulses are
visible.
• Press the yellow [Pause/Cont] hardkey to stop the measurement and
characterize the trigger signal with the marker.
Characterize the Trigger Signal
• Use the market knob to determine the highest and lowest level of the
trigger pulse.
• Note if the trigger level exceeds 2V. If it does not, then the external
trigger range can be set to 2 V and the trigger level can be set with good
resolution. If the trigger level exceeds 2 V, then set the trigger range to
10 V.
• Find a good trigger point on the trigger signal. Look for fast transitions or
steep slopes, and locate the trigger point in the middle of or just before
these areas. Note the trigger level in volts and the slope, either positive
or negative, at the best transition point.
• Trigger range, level, and slope have now been determined.
AGILENT 35670A
Supplemental Operator’s Guide
Setting Up External Trigger
Set up a non-TTL trigger as follows:
• Press the [Trigger] hardkey.
• Select the [EXTERNAL TRIGGER] softkey (F2).
• Press the [TRIGGER SETUP] softkey (F6)
• Toggle the [EXT LEVEL USER TTL] softkey (F2) until USER is
highlighted.
• Press the [USER EXT LEVEL] softkey (F3).
• Enter the trigger level in volts as determined above, and then press the
[V] softkey (F1).
• Toggle the [EXT RANGE +/- 10 2] softkey (F4) until 2 is highlighted,
unless the trigger exceeded 2 V, then toggle the softkey to 10 V.
• Toggle the [SLOPE POS NEG] softkey (F5) until the slope at the
selected trigger point is highlighted.
If the trigger appears noisy or erratic, try activating the 100 kHz external trigger
noise filter as follows:
• Toggle the [EXT FILTER ON OFF] softkey (F6) until ON is
highlighted.
61
Page 66

AGILENT 35670A
Supplemental Operator’s Guide
Measuring Time Averaged Spectrums with External Triggering
Now that the external trigger has been set up, the analyzer is ready to measure a
signal with time averaging as follows:
• Connect the external trigger signal to the EXT TRIG port on the back of
the AGILENT 35670A.
• Turn on the AGILENT 35670A, or
• Press the green [Preset] hardkey
• Press the yellow [Pause/Cont] hardkey if desired.
Set up measurement parameters
• Press the [Freq] hardkey
• Enter 800 and then press the [Hz] softkey (F2)
• Press the [Avg] hardkey.
• Press the [AVERAGE TYPE] softkey (F3).
• Press the [TIME] softkey (F3).
• Turn on averaging by pressing the [AVERAGE ON OFF] softkey (F1)
until ON is highlighted.
• Press the yellow [Start] hardkey.
62
Page 67

Supplemental Operator’s Guide
Section 22 : Saving Trace Data to a 3.5” Disk or Non-Volatile RAM
Save trace data into non-volatile RAM or 3.5” disk using the AGILENT 35670A
Save/Recall capabilities. All AGILENT 35670A data is stored as a Standard Data
Format (SDF) file. This data format is compatible across Agilent Technologies’s
line of Dynamic Signal Analyzers. Utilities are available to view and plot SDF files
from a PC and to access the data programmatically.
Saving Trace to 3.5” Disk
To store Trace A data as a file named “T1.DAT” on a 3.5” disk, insert a IBM-PC
formatted disk into the AGILENT 35670A and follow these steps:
• Press the [Active Trace] hardkey.
• Press the [A] softkey (F5).
• Press the [Save/Recall] hardkey.
• Press the [SAVE DATA] softkey (F1).
• Press the [SAVE TRACE] softkey (F1).
• Press the [INTO FILE] softkey (F9).
• Press the [CLEAR ENTRY] softkey (F9).
• Enter T1.DAT and then press the [ENTER] softkey (F1)
Note that the AGILENT 35670A automatically increments a numeric ending to a file
name. To store Trace B data to a file named “T2.DAT”:
• Press the [Active Trace] hardkey.
• Press the [B] softkey (F5).
• Press the [Save/Recall] hardkey.
• Press the [SAVE DATA] softkey (F1).
• Press the [SAVE TRACE] softkey (F1).
• Press the [INTO FILE] softkey (F9).
• T2.DAT will be the default name
• Press the [ENTER] softkey (F1)
AGILENT 35670A
Confirming Contents of 3.5” Disk File
To confirm that data was stored on disk successfully, view the contents of the disk
with the catalog command:
• Press the [Save/Recall] hardkey.
• Toggle the [CATALOG ON OFF] softkey (F8) until ON is highlighted.
The entire contents and file details of the disk are displayed. To return to the trace
view:
• Toggle the [CATALOG ON OFF] softkey (F9) until OFF is highlighted.
63
Page 68

AGILENT 35670A
Supplemental Operator’s Guide
Saving Trace to Non-Volatile RAM (NV-RAM)
To store Trace A data as a file named “N1.DAT” into NV-RAM, follow these steps:
• Press the [Active Trace] hardkey.
• Press the [A] softkey (F5).
• Press the [Save/Recall] hardkey.
• Press the [DEFAULT DISK] softkey (F9).
• Press the [NON-VOL RAM DISK] softkey (F9).
• Press the [Save/Recall] hardkey.
• Press the [SAVE DATA] softkey (F1).
• Press the [SAVE TRACE] softkey (F1).
• Press the [INTO FILE] softkey (F9).
• Press the [CLEAR ENTRY] softkey (F9).
• Enter N1.DAT and then press the [ENTER] softkey (F1)
Confirming Contents of NV-RAM
To examine the contents of NV-RAM, turn on the catalog as follows:
• Press the [Save/Recall] hardkey.
• Toggle the [CATALOG ON OFF] softkey (F8) until ON is highlighted.
To return to the Trace view:
• Toggle the [CATALOG ON OFF] softkey (F8) until OFF is highlighted.
64
Page 69

AGILENT 35670A
Supplemental Operator’s Guide
Section 23 : Recalling Trace Data From 3.5” Disk or Non-Volatile Memory
Recall trace data from a file in non-volatile RAM or 3.5” disk using the AGILENT
35670A Save/Recall capabilities. Recalled data is placed in a data register where it
can be viewed, plotted, printed, analyzed, or used to compare.
Recall Trace From 3.5” Disk
To recall data from a file named “T1.DAT” on a 3.5” disk into data register D1,
follow these steps:
• Insert the 3.5” disk containing the data file into the AGILENT 35670A.
• Press the [Save/Recall] hardkey.
• Press the [DEFAULT DISK] softkey (F9).
• Press the [INTERNAL DISK] softkey (F3).
View the contents of the 3.5” disk by turning on the catalog
• Toggle the [CATALOG ON OFF] softkey (F9) until ON is highlighted.
Return to the Trace view
• Toggle the [CATALOG ON OFF] softkey (F9) until OFF is highlighted.
Set up display format to view data register D1
• Press the [Disp Format] hardkey.
• Press the [SINGLE] softkey (F1).
• Press the [Active Trace] hardkey.
• Press the [A] softkey (F1).
• Press the [Scale] hardkey.
• Toggle the [AUTOSCALE ON OFF] softkey (F1) until ON is highlighted..
• Press the [Meas Data] hardkey.
• Press the [MORE CHOICES] softkey (F9).
• Press the [DATA REGISTER] softkey (F8).
• Press the [D1] softkey (F1).
Recall the Data into data register D1
• Press the [Save/Recall] hardkey.
• Press the [RECALL DATA] softkey (F4).
• Press the [RCL TRACE AND SCALE] softkey (F1).
• Press the [FROM FILE INTO D1] softkey (F1).
• Press the [CLEAR ENTRY] softkey (F9).
• Enter T1.DAT and then press the [ENTER] softkey (F1)
Recall Trace Data from Non-Volatile RAM (NV-RAM)
To recall data from a file stored in NV-RAM named “N1.DAT” into data register
D2, follow these steps:
• Press the [Meas Data] hardkey.
• Press the [MORE CHOICES] softkey (F9).
65
Page 70

AGILENT 35670A
Supplemental Operator’s Guide
• Press the [DATA REGISTER] softkey (F8).
• Press the [D2] softkey (F2).
• Press the [Save/Recall] hardkey.
• Press the [DEFAULT DISK] softkey (F9).
• Press the [NON-VOL RAM DISK] softkey (F9).
• Press the [Save/Recall] hardkey.
• Press the [RECALL DATA] softkey (F4).
• Press the [RCL TRACE AND SCALE] softkey (F1).
• Press the [FROM FILE INTO D2] softkey (F2).
• Press the [CLEAR ENTRY] softkey (F9).
• Enter N1.DAT and then press the [ENTER] softkey (F1)
66
Page 71

Section 24 : Plotting and Printing Trace Data
Use the plotting and printing capability of the AGILENT 35670A to generate
hardcopy documentation of measurement results. Any trace can be documented,
however to plot or print data stored on disk or in NV-RAM, the data must first be
recalled into a Trace. To recall trace data from a file, see the section “Recalling
Trace Data From 3.5" Disk or Non-Volatile Memory.”
Generating Output with the AGILENT 35670A
All traces displayed on the screen are output to the printer, plotter, or file. Therefore
if it is desired to plot one trace at a time, then the SINGLE display format should be
used. Complete control over the plotting and printing parameters is available from
the front panel of the AGILENT 35670A. For plotting, choose pen color for grids,
annotation, each trace, and each marker. Traces can each have their own line type.
Describe the test with two lines of plot titles that will appear at the top of the plot. A
date stamp can be selected to show when the data was acquired.
AGILENT 35670A
Supplemental Operator’s Guide
Enter Trace A Title (if desired). Repeat for traces B, C, and D if displayed.
• Press the [Active Trace] hardkey.
• Press the [A] softkey (F1).
• Press the [Disp Format] hardkey.
• Press the [MORE] softkey (F9).
• Press the [TRACE TITLE] softkey (F7).
• Press the [CLEAR ENTRY] softkey (F9).
• Enter a description of the Trace, for example the accelerometer location,
such as “MACH 1 - Y” and then press the [ENTER] softkey (F1). Note
that trace titles can be up to 13 characters long.
Enter a plot title (if desired)
• Press the [Plot/Print] hardkey.
• Press the [MORE SETUP] softkey (F9).
• Press the [TITLE LINE 1] softkey (F7).
• Enter first line of test description, maximum 44 characters, then press the
[ENTER] softkey (F1)
• Press the [TITLE LINE 2] softkey (F8).
• Enter second line of test description, maximum 44 characters, then press
the [ENTER] softkey (F1)
Plotting the Display
To plot the current display, connect an GPIB plotter, with the plotter address set to 5,
to the AGILENT 35670A. Then follow these steps:
• Press the [Local/GPIB] hardkey.
67
Page 72

AGILENT 35670A
Supplemental Operator’s Guide
• Select the [SYSTEM CONTROLLR] softkey (F2).
Check the Plot/Print Destination
• Press the [Plot/Print] hardkey.
• Press the [PLOT/PRNT DESTINATN] softkey (F4).
• Select the [OUTPUT TO GPIB] softkey (F1).
Plot the Trace
• Place a sheet of paper in the plotter and locate P1 and P2, if not done
automatically.
• Press the [Plot/Print] hardkey.
• Press the [START PLOT] softkey (F1).
Printing the Display
Results may be sent to a printer using the serial or parallel ports. The parallel port
requires no setup. The serial port must be configured to match the parameters of the
printer.
Print over Serial Interface to Raster Device
• Press the [Plot/Print] hardkey.
• Press the [PLOT/PRNT DEVICE] softkey (F3).
• Select the [RASTER PRINTER] softkey (F2).
• Press the [Plot/Print] hardkey.
• Press the [PLOT/PRNT DESTINATN] softkey (F4).
• Select the [OUTPUT TO SERIAL] softkey (F2).
• Press the [Plot/Print] hardkey.
• Press the [MORE SETUP] softkey (F9).
• Press the [SERIAL SETUP] softkey (F9).
• Choose serial setup parameters that match the printer. With luck the
default choices will already match the printer.
Print over Parallel Interface to Raster Device
• Press the [Plot/Print] hardkey.
• Press the [PLOT/PRNT DEVICE] softkey (F3).
• Select the [RASTER PRINTER] softkey (F2).
• Press the [Plot/Print] hardkey.
• Press the [PLOT/PRNT DESTINATN] softkey (F4).
• Select the [OUTPUT TO PARALLEL] softkey (F4).
Print the Trace
• Press the [Plot/Print] hardkey.
• Press the [START PLOT] softkey (F1).
68
Page 73

Section 25 : Importing Plots into Microsoft Word
The plotter output of the AGILENT 35670A conforms to the HP-GL/2 Graphics
Language. When the PLOT/PRINT output device is specified as a 3.5” disk file, not
a printer or plotter, then the resulting graphics files can be imported directly into
Microsoft Word using the Insert Picture command.
Determining if MS Word Has HP-GL Graphics Import Filter
Before importing a plot file, Word must have the HP-GL graphics import filter
installed. To determine if it is, follow these steps:
• On a PC, start Microsoft Word or open a new document.
• Select Insert P
• In the “Insert Picture” dialog box, at the bottom, click on the arrow next to
“Files of Type”.
• Scroll up and down the list, looking for “HP Graphics Language.”
icture
If “HP Graphics Language” is present, then the HP-GL filter is installed. If it is not
listed, then you must use the Word Setup program to install the HP-GL graphics
import filter.
AGILENT 35670A
Supplemental Operator’s Guide
Installing the MS Word HP-GL Graphics Import Filter
Run Word Setup, by running “a:setup” from 3.5” disks, Word or Office CD-ROM,
and proceed as follows:
• After setup has initialized, select “Add/Remove” (components).
• In the Maintenance Dialog Box, click on the “Converters, Filters and Data
Access” option.
• Click on the “Change Option” button.
• Click on “Graphics Filters”
• Click on the “Change Option” button.
• Scroll down to the HP Graphics Language entry. The check box next to
it should be empty.
• Click on the HP Graphics Language check box.
• Click on the “OK” button.
• Click on the “OK” button.
• Click on the “Continue” button.
• Click on the “OK” button.
The HP Graphics Language import filter has now been installed and activated. To
make sure the filter has been installed,
• Return to Word.
• Select Insert P
• In the “Insert Picture” dialog box, at the bottom, click on the arrow next to
“Files of Type”.
• Scroll up and down the list, looking for “HP Graphics Language.”
icture
It should now be an import option.
69
Page 74

AGILENT 35670A
Supplemental Operator’s Guide
Plot to a File Using the AGILENT 35670A
The AGILENT 35670A has the ability to route plotter output to a file. If the file is
named with a “.HGL” file extension, then Word will recognize this file immediately
as an HP Graphics Language file.
Set up plotter output to a file
• Press the [Plot/Print] hardkey.
• Press the [PLOT/PRNT DESTINATN] softkey (F4).
• Select the [OUTPUT TO FILE] softkey (F4).
• Press the [OUTPUT FILENAME] softkey (F5).
• Press the [CLEAR ENTRY] softkey (F9).
• Enter P1.HGL and then press the [ENTER] softkey (F1)
Insert a 3.5” Disk into the AGILENT 35670A and ensure DEFAULT DISK is
INTERNAL DISK:
• Press the [Save/Recall] hardkey.
• Press the [DEFAULT DISK] softkey (F9).
• Press the [INTERNAL DISK] softkey (F3).
Plot to file “P1.HGL”
• Prepare Trace Titles and Plot Titles as described in the section “Plotting
and Printing Trace Data.”
• Press the [Plot/Print] hardkey.
• Press the [START PLOT] softkey (F1).
Inserting Picture of an HP-GL Plot File Into a MS Word document.
To import the plot file into the Word document, follow these steps:
• Insert the 3.5” disk with the plot file “P1.HGL” into a PC.
• Open a Word document
• Select Insert P
• Click on the “Look in” arrow to change directories
• Select A: (3½ Disk)
• Double-Click on file “P1.HGL”
• Word will automatically detect that it is an HP-GL file, because of the
.HGL file extension, and import the graphic directly.
icture
70
Page 75

Supplemental Operator’s Guide
Section 26 : Running a Single Calibration Test on Command
The AGILENT 35670A automatically runs periodic self-calibration tests which
ensure that all measurements will meet published performance specifications. If a
calibration is desired at a specific time, then a single caibration may be performed as
follows:
• Press the [System Utility] hardkey.
• Press the [CALIBRATION] softkey (F2).
• Press the [SINGLE CAL] softkey (F3).
The calibration will start immediately and be completed in less than 15 seconds.
Section 27 : Returning the AGILENT 35670A to a Preset Condition
The AGILENT 35670A can generally return from an unknown state to a preset
condition by using the following command:
• Press the green [Preset] hardkey
• Press [DO PRESET] softkey (F1).
AGILENT 35670A
This does not turn off the analyzer, but it does stop data acquisition and reset most
measurement parameters. If the AGILENT 35670A is locked up due to a software
bug and no response can be generated by the Preset key, then a hard shutdown may
be required.
Section 28 : Precautions to Prevent Loss of Data
The most important aspect of preventing data loss with the AGILENT 35670A is to
avoid interrupting data acquisition. This can happen as easily as by tripping on the
power cord, but can also occur by accidentally re-starting a long measurement,
prematurely triggering an event, overloading the front ends, or unplugging
connectors.
Two situations call for careful planning and precautions: the first is when
frequencies are low and data acquisition times are very long, such as very low
frequency seismic testing. An interruption may waste hours of data acquisition. The
second situation worthy of precaution is when the test involves a one time event, like
the initial run-up of large machine during a plant re-start, or like a crash test, where
the test article is destroyed. In either case the data is valuable and care should be
taken to save it to disk before the data is lost by another measurement.
Manual arming along with a Channel 1 trigger and pre-trigger delay is the preferred
technique of acquiring transient crash tests. The pre-trigger delay ensures that the
entire transient event is captured even if the trigger is a little late. Manual arming
prevents re-triggering and loss of data if the transducer encounters a post-test bounce
or hit. Of course manual arming REQUIRES that the measurement be manually
armed before the test, otherwise the measurement will not be armed and data will be
missed.
71
Page 76

AGILENT 35670A
Supplemental Operator’s Guide
Section 29 : Transducer Unit Conversion with the AGILENT 35670A
Automatic conversion between acceleration, velocity, or displacement units is
available with the Trace Coord capability in the AGILENT 35670A. Transducer
sensitivity and transducer unit label is first specified for the input channel, then the
desired unit is specified using XDCR UNIT CONVERSION.
Measuring Acceleration, Displaying Displacement
To set up and display a measurement of acceleration, proceed as follows:
• Press the green [Preset] hardkey
• Press [DO PRESET] softkey (F1).
• Press the [Input] hardkey
• Press the [FRONT END CH1 SETUP] softkey (F7).
• Press [ICP SUPLY ON OFF] softkey (F8) until ON is highlighted.
• Press the [Input] hardkey
• Press [XDCR UNIT CH1 SETUP] softkey (F8)
• Press the [XDCR SENSITVTY] softkey (F6).
• Enter 10.8, then press the [mV/EU] softkey (F2).
• Toggle the [XDCR UNIT ON OFF] softkey (F4) until ON is highlighted.
• Press the [XDCR UNIT LABEL] softkey (F7).
• Select the [g] softkey (F2).
Specify an averaged measurement
• Press the [Freq] hardkey
• Enter 800 and then press the [Hz] softkey (F2)
• Press the [Avg] hardkey.
• Turn on averaging by pressing the [AVERAGE ON OFF] softkey (F1)
until ON is highlighted.
• Press the yellow [Start] hardkey.
After the measurement is complete, set up the display to show acceleration and peak-
to-peak displacement simultaneously. RMS acceleration is already displayed on
Trace A. Set up Trace B to show peak-to-peak displacement as follows:
• Press the [Active Trace] hardkey again.
• Press the [B] softkey (F2).
• Press the [Meas Data] hardkey.
• Press the [CHANNEL 1 234] softkey (F1) until 1 is highlighted.
• Press the [PWR SPEC CHANNEL 1] softkey (F3)
• Press the [Trace Coord] hardkey.
• Press the [Y UNITS] softkey (F8)
• Toggle the [AMPLITUDE PK PP RMS] softkey (F4) until PP is
highlighted.
72
Page 77

AGILENT 35670A
Supplemental Operator’s Guide
• Press the [XDCR UNIT CONVERT] softkey (F4)
• Press the [inch (DISP)] softkey (F7)
• Press the [Scale] hardkey.
• Toggle the [AUTOSCALE ON OFF] softkey (F1) until ON is highlighted.
This accomplishes the equivalent of multiplying “g” by 386.4 to get “inches per
second squared” (ips^2), and dividing by (jω)^2 to integrate twice in the frequency
domain to get displacement.
Math Functions and XDCR UNIT CONVERT
When you have specified a “provided” transducer label using XDCR UNIT SETUP
that is a “motion” engineering unit such as:
g
inch/s^2
inch/s
inch
mil
m/s^2
m/s
m
then do not try to convert acceleration to displacement using Analysis: Math
Function and divide by (jω). Instead use the above example to convert directly using
XDCR UNIT CONVERT in Trace Coord, Y UNITS. If this is attempted with Math
Functions, the analyzer will sense that a power spectrum of a known unit “label” is
being integrated or differentiated and will do it using trace coordinates anyway. It is
easier to use the provided capability in XDCR UNIT CONVERT.
Converting Frequency Response Units to Compliance
Unlike power spectrum measurements, frequency response measurements cannot be
automatically converted into other units. Howvere, it is often desired to express a
frequency response result as the ratio of displacement to force, which are units of
compliance, instead of acceleration to force, which are units of 1/mass. To convert a
frequency response measured as “g/lb.” into terms of “inch/lb.”, then proceed as
follows:
Converting “g” to “inch/s^2” requires multiplication by 386.4. This must be entered
as a constant. Converting “inch/s^2” to “inch” requires double integration in the
frequency domain by dividing by (jω) two times. These steps may be entered as
follows
• Press the [Analys] hardkey.
73
Page 78

AGILENT 35670A
Supplemental Operator’s Guide
• Press the [DEFINE CONSTANT] softkey (F2).
• Press the [DEFINE K1] softkey (F1).
• Enter 386.4 and press the [ENTER] softkey (F1).
• Press the [Analys] hardkey.
• Press the [DEFINE FUNCTION] softkey (F1).
• Press the [DEFINE F1] softkey (F1).
• Press the [CONSTANT (K1-K5)] softkey (F3).
• Press the [CONSTANT K1] softkey (F1).
• Press the [ * ] softkey (F3).
• Press the [OPERATION] softkey (F5).
• Press the [MORE] softkey (F9).
• Press the [ /jOMEGA( ] softkey (F4).
• Press the [OPERATION] softkey (F5).
• Press the [MORE] softkey (F9).
• Press the [ /jOMEGA( ] softkey (F4).
• Press the [MEAS DATA] softkey (F1).
• Press the [FREQ RESP 2 / 1] softkey (F5).
• Press the [ ) ] softkey (F5).
• Press the [ ) ] softkey (F5).
• Press the [ENTER] softkey (F7).
Now display the function F1 on Trace B
• Press the [Active Trace] hardkey.
• Press the [B] softkey (F2).
• Press the [Meas Data] hardkey.
• Press the [MORE CHOICES] softkey (F9).
• Press the [MATH FUNCTION] softkey (F7).
• Press the [PWR SPEC CHANNEL 1] softkey (F3)
• Press the [F1] softkey (F1).
Trace B will now convert “g/lb.” into “inch/lb.” This same technique could also be
used to convert “g” into velocity terms, or to convert between metric and English
units.
74
Page 79

AGILENT 35670A
Supplemental Operator’s Guide
Section 30 : Using the Agilent Technologies Demostration Unit with the AGILENT
35670A
Several of the sections in this User’s Guide are best explained with live data using
transducers and machines. Because it is usually impractical to bring machinery into
a laboratory for training purposes, the Agilent Technologies Demonstration Unit
with the Dynamic Signals Test Disc #1 (The Red CD) provides a practical
alternative.
This section describes the AGILENT Demonstration Unit and how to use it. The
most important strating point is to MAKE SURE THE DEMONSTRATION UNIT
IS GROUNDED TO THE AGILENT 35670A! This can be done via software by
grounding Channel 1 via the Input, FRONT END CH1 SETUP. Alternatively a
BNC can be connected from the AGILENT 35670A Source output to the Demo
Unit’s notch filter.
To set up the Demonstration Unit, follow these instructions:
1.
Plug in the Discman power supply and insert the power connector in the
receptacle on the back of the Demonstration Unit.
2.
Insert the Dynamic Signals I CD in the Sony Discman, close the cover and press
the play/pause button.
3.
Refer to the summary below to determine, for each section of the User’s Guide,
the recommended track, port to connect the left CD output channel, and port to
connect the right CD output channels.
4.
Select track repeat mode (Play Mode 1) by pressing the PLAY MODE button on
the front of the Discman twice until “1” appears in the Discman’s LCD display
75
Page 80

AGILENT 35670A
Supplemental Operator’s Guide
above the track number.
The following descriptions link the Section in this User’s Guide to the appropriate
CD track. Also described herein is the recommended CD output channel connection
to the AGILENT 35670A. Finally any setup clues will be described to help utilize
the signals on the CD.
76
Page 81

AGILENT 35670A
Supplemental Operator’s Guide
Section 4: Measuring a Single Channel Spectrum
CD Track: 24
CD Track Desc.: 160 kHz Calibration Tone
Left Ch. (A Out): N/A
Right Ch. (B Out): Channel 1 of the AGILENT 35670A
Section 5: Improving Measurement Results
CD Track: 24
CD Track Desc: 160 kHz Calibration Tone
Left Ch. (A Out): N/A
Right Ch. (B Out): Channel 1 of the AGILENT 35670A
Section 6: Measuring a Single Channel Time Waveform
CD Track: 24
CD Track Desc.: 160 kHz Calibration Tone
Left Ch. (A Out): N/A
Right Ch. (B Out): Channel 1 of the AGILENT 35670A
Section 7: Measuring Dual Channel Spectra
CD Track: 41
CD Track Desc.: Current Probe, Tachometer
Left Ch. (A Out): Channel 1 of the AGILENT 35670A
Right Ch. (B Out): Channel 2 of the AGILENT 35670A
Section 8: Improving Dual Channel Measurement Results
CD Track: 41
CD Track Desc.: Current Probe, Tachometer
Left Ch. (A Out): Channel 1 of the AGILENT 35670A
Right Ch. (B Out): Channel 2 of the AGILENT 35670A
Section 9: Measuring Dual Channel Time Waveforms
CD Track: 41
CD Track Desc.: Current Probe, Tachometer
Left Ch. (A Out): Channel 1 of the AGILENT 35670A
Right Ch. (B Out): Channel 2 of the AGILENT 35670A
77
Page 82

AGILENT 35670A
Supplemental Operator’s Guide
Section 10: Measuring Dual Channel Spectra and Time Waveforms
CD Track: 41
CD Track Desc.: Current Probe, Tachometer
Left Ch. (A Out): Channel 1 of the AGILENT 35670A
Right Ch. (B Out): Channel 2 of the AGILENT 35670A
Section 11: Modal Testing Using a Hammer and Accelerometer
CD Track: 44
CD Track Desc.: Hammer Measurements on a Brake Rotor
Left Ch. (A Out): Channel 1 of the AGILENT 35670A
Right Ch. (B Out): Channel 2 of the AGILENT 35670A
Section 13: Order Domain Results in List Mode
CD Track: 28
CD Track Desc.: Car Engine Run-up and Tachometer Signal
Left Ch. (A Out): Channel 1 of the AGILENT 35670A
Right Ch. (B Out): TACH input on the back of the AGILENT 35670A
Setup Hints: Pulses per rev: 2
Tach. Trigger level: 0.15 V
Section 16: Waterfall Spectra at RPM Intervals
CD Track: 28
CD Track Desc.: Car Engine Run-up and Tachometer Signal
Left Ch. (A Out): Channel 1 of the AGILENT 35670A
Right Ch. (B Out): TACH input on the back of the AGILENT 35670A
Setup Hints: Pulses per rev: 2
Tach. Trigger level: 0.15 V
Section 18: Measuring Frequency Response with the AGILENT
35670A
CD Track: 58
CD Track Desc.: Burst Random Frequency Response Measurement
Left Ch. (A Out): Channel 1 of the AGILENT 35670A
Right Ch. (B Out): Channel 2 of the AGILENT 35670A
Section 20: Peak Hold During a Machine Run-up
CD Track: 28
CD Track Desc.: Car Engine Run-up and Tachometer Signal
Left Ch. (A Out): Channel 1 of the AGILENT 35670A
Right Ch. (B Out): TACH input on the back of the AGILENT 35670A
Setup Hints: Pulses per rev: 2
78
 Loading...