

Page 1

6000UPG
Multi-Parameter
Water Quality Monitor
Instruction Manual
YSI Incorporated
1725 Brannum Lane
Yellow Springs, OH 45387
(800) 765-4974 (513) 767-7241
Fax (513) 767-9353
â
Page 2

TABLE OF CONTENTS
Page
SECTION 1 INTRODUCTION
1.1 DESCRIPTION 1-1
1.2 GENERAL SPECIFICATIONS 1-3
1.3 SENSOR SPECIFICATIONS 1-4
1.4 HOW TO USE THIS MANUAL 1-6
SECTION 2 GETTING STARTED
2.1 UNPACKING 2-1
2.2 SYSTEM CONFIGURATION 2-1
2.3 SONDE SETUP 2-5
SENSORS 2-5
BATTERIES 2-12
CABLES 2-14
POWER OPTIONS 2-14
SONDE/COMPUTER INTERFACE 2-15
2.4 SOFTWARE INSTALLATION 2-15
2.5 PC6000 SOFTWARE SETUP 2-16
2.6 SONDE SOFTWARE SETUP 2-19
SECTION 3 BASIC OPERATION
3.1 GETTING READY TO CALIBRATE 3-1
3.2 CALIBRATION PROCEDURES 3-2
CONDUCTIVITY 3-4
DISSOLVED OXYGEN 3-5
DEPTH 3-6
pH 3-6
AMMONIUM 3-7
NITRATE 3-7
TURBIDITY 3-8
3.3 DISCRETE SAMPLING 3-9
3.4 UNATTENDED SAMPLING 3-12
3.5 RETRIEVING DATA 3-14
3.6 ANALYZING DATA 3-16
SECTION 4 SONDE MENU
4.1 RUN 4-1
4.2 CALIBRATE 4-9
4.3 FILE 4-14
4.4 STATUS 4-18
4.5 SYSTEM SETUP 4-19
4.6 REPORT SETUP 4-21
4.7 SENSOR SETUP 4-22
4.8 DIAGNOSTICS 4-24
Page 3

SECTION 5 PC6000 SOFTWARE
5.1 INTRODUCTION 5-1
5.2 INSTALLING THE PC6000 SOFTWARE 5-1
5.3 THE SONDE MENU 5-3
5.4 THE FILE MENU 5-3
5.5 THE SETUP MENU 5-20
5.6 DATA CAPTURE/REAL-TIME SETUP 5-23
5.7 ADVANCED SETUP 5-25
SECTION 6 PRINCIPLES OF OPERATION
6.1 CONDUCTIVITY 6-1
6.2 SALINITY 6-2
6.3 OXIDATION REDUCTION POTENTIAL (ORP) 6-2
6.4 pH 6-4
6.5 DEPTH 6-5
6.6 TEMPERATURE 6-6
6.7 DISSOLVED OXYGEN 6-6
6.8 NITRATE 6-9
6.9 AMMONIUM AND AMMONIA 6-11
6.10 TURBIDITY 6-14
Page
SECTION 7 MAINTENANCE
7.1 SONDE MAINTENANCE 7-1
7.2 PROBE MAINTENANCE 7-4
7.3 GENERAL MAINTENANCE NOTE 7-7
SECTION 8 TROUBLESHOOTING
SONDE COMMUNICATION PROBLEMS 8-2
SENSOR PERFORMANCE PROBLEMS 8-2
SOFTWARE PROBLEMS 8-5
SECTION 9 COMMUNICATION
9.1 OVERVIEW 9-1
9.2 HARDWARE INTERFACE 9-1
9.3 SDI-12 INTERFACE 9-2
9.4 RS-232 INTERFACE 9-7
9.5 FILE TRANSFER PROTOCOLS 9-7
9.6 FILE FORMATS 9-8
9.7 MODEM SETUP 9-9
Page 4

APPENDIX A HEALTH AND SAFETY
APPENDIX B REQUIRED NOTICE
APPENDIX C WARRANTY AND SERVICE INFORMATION
APPENDIX D ACCESSORIES AND REAGENTS
APPENDIX E APPLICATION NOTE
APPENDIX F SOLUBILITY AND PRESSURE/ALTITUDE TABLES
APPENDIX G SENSOR AND SONDE STORAGE RECOMMENDATIONS
APPENDIX H TURBIDITY MEASUREMENTS WITH THE 6820
APPENDIX I SYSTEM ERRORS AND WARNINGS
Page 5

1. INTRODUCTION
1.1 DESCRIPTION
The 6000UPG Environmental Monitoring System is a multiparam eter, w ater quality measurement,
and data logging system . It is intended for use in research, assessment, and regulatory com pliance
applications.
Measurement parameters include:
• Dissolved Oxygen
• Conductiv ity
• Specific Conductance
• Salinity
• Total Dissolv ed S olids
• Resistivity
• Tem perature
• pH
• ORP
• Depth
• Level
• Am monium/Ammonia
• Nitrate
• Turbidity
The 6000
UPG is ideal for profiling and monitoring w ater conditions in lak es, riv ers, w etlands,
estuaries, coastal waters, and monitoring wells. It can be left unattended for week s at a tim e with
measurement parameters sampled at a user-defined setup interval and data securely saved in the
unit's internal memory. The 6000
water, or in as little as a few inches of water. The fast sensor response of the 6000
UPG can be used 500 feet (152 meters) below the surface of the
UPG and its
built-in data logging make it ideal for vertical profiling. Its small size means it can fit dow n 4 inch
(10.2 cm) diameter monitoring wells.
A patented Rapid Pulse Dissolved Oxygen Sensor exhibits low stirring dependence and, therefore
provides accurate results without an expensive and bulky stirrer. Because stirring is not required,
battery life is extended. In addition, because of the nature of the technology, sensor drift caused by
passive fouling is minimiz ed.
The Model 6000
UPG is designed to house 4 field-replaceable probes (6 sensors) and the option to
add a depth sensor module to the sonde body. If necessary, the dissolved oxygen-conductivitytemperature, pH, amm onium, nitrate ORP, and turbidity sensors are quickly replaced in the field.
The 6000
program. Every 6000
UPG communicates with an A SC I I terminal or a computer with a terminal emulation
UPG comes with IBM-compatible PC-based software for sim ple and conv enient
setup and data handling. Reports and plots are automatically generated and their presentation easily
customized. Data is easily exported to any spreadsheet prog ram for more sophisticated data
processing.
1-1
Page 6

The RS-232C and SDI-12 interfaces provide maximu m v ersatility for system networking and real
time data collection. Several 6000
valuable water quality data at a variety of depths. For real time results, the 6000
UPG units are easily installed in a vertical string prov iding
UPG can interface to
radio telemetry system s and satellite, telephone, or cellular phone data collection platforms. In
addition, the unit can be used with our 610-D or 610-DM display /logger for profiling or spot
sampling applications. The 6000
UPG is equipped with sensor and communication circuitry to
eliminate ground loop interference.
When the 6000
UPG is factory configured for internal power, it operates using eig ht C-size alkaline
batteries. These batteries are easily replaced in the field, without disassembly of the unit. The
minimal power requirements of the Rapid Pulse Dissolv ed Oxy g en Sensor combined with
state-of-the-art electronic circuits and software can prov ide up to 90 day s of battery life during
normal use, depending on the activated sensor configuration.
The 6000
UPG comes standard with 256 kilobytes of memory; this is enough to store 150,000
individual parameter readings for a typical deploy ment.
Optional cables are available for interfacing the 6000
UPG with a computer, terminal, or
display/logger. These cables are waterproof at the sonde connection and can be used in the lab or
field.
See Appendix D for a complete list of accessories and calibration reagents.
1-2
Page 7

1.2 GENERAL SPECIFICATIONS
See also Section 1.3 Sensor Specifications.
Operating Environment
Medium: fresh, sea, or polluted water
Temperature: -5 to +45 °C
Depth: 0 to 500 feet (152 meters)
Storage Temperature: -40 to +60 °C
Material: PVC, Stainless Steel
Dimensions
Diameter: 3.5 inches (8.9 centimeters)
Length: 19.5 inches (49.5 centimeters)
Weight: 6.5 pounds (3.0 kilograms) , with batteries
Computer Interface
RS-232C
SDI-12
Software
PC6000
IBM PC compatible com puter, 3 1/2 or 5 1/4 inch, hig h or low density disk driv e.
Minimum RAM requirement: 256 k ilobytes
Optional graphic adapter for plotting
Ecowatch for Windows (optional)
IBM PC compatible com puter with 3 1/2 inch disk driv e and with a 386 processor (or
better) running Windows version 3.1 (or later).
Minimum RAM requirement: 4 megabytes
Internal logging memory size (typical deployment)
256 kilobytes (150,000 individual parameter reading s)
512 kilobytes (300,000 individual parameter reading s)
Power (two options)
12 VDC (8 C-size Alkaline Batteries)
External 12 VDC
Battery Life
120 days without dissolved oxygen and turbidity sensor activ ation
90 days without turbidity sensor activation
45 days with dissolved oxygen and turbidity sensor activ ation
1-3
Page 8

1.3 SENSOR SPECIFICATIONS
The following are typical performance specifications for each sensor.
Depth - Deep
Sensor Type...........Stainless steel strain gauge
Range.....................0 to 500 ft (152 m)
Accuracy................+/- 1 ft (0.3 m)
Resolution..............0.001 ft (0.001 m)
Depth - Medium
Sensor Type...........Stainless steel strain gauge
Range.....................0 to 200 ft (61 m)
Accuracy................+/- 0.4 ft (0.12 m)
Resolution..............0.001 ft (0.001 m)
Depth - Shallow
Sensor Type..............Stainless steel strain gauge
Range........................0-30 ft (9.1 m)
Accuracy ................ +/- 0.06 ft (0.018 m)
Range........................0.001 ft (0.001 m)
Temperature
Sensor Type...........Thermistor
Range.....................-5 to 45 °C
Accuracy................+/- 0.15 °C (optional configuration at +/- 0.05 °C)
Resolution..............0.01 °C
Dissolved Oxygen % saturation
Sensor Type...........Rapid Pulse - Clark-ty pe, polarog raphic
Range.....................0 to 200 % air saturation
Accuracy................+/- 2 % air saturation
Resolution..............0.1 % air saturation
Dissolved Oxygen mg/L (Calculated from % air saturation, temperature and salinity)
Sensor Type............ Rapid Pulse - Clark-ty pe, polarog raphic
Range.....................0 to 20 mg/L
Accuracy................+/- 0.2 mg/L
Resolution..............0.01 mg/L
Conductivity
*
Sensor Type...........4 electrode cell with autoranging
Range.....................0 to 100 mS/cm
Accuracy................+/- 0.5% of reading + 0.001 mS /cm
Resolution..............0.01 mS/cm or 1 uS/cm
* Report outputs of specific conductance (conductivity corrected to 25 C), resistivity, and total dissolved
solids are also provided. These values are automatically calculated from conductivity according to
algorithms found in Standard Methods for the Examination of Water and Wastewater (ed. 1989).
1-4
Page 9

Salinity
Sensor Type............Calculated from conductivity and tem perature
Range......................0 to 70 ppt
Accuracy.................+/- 1.0% of reading or 0.1 ppt, whichever is g reater
Resolution...............0.01 ppt
pH
Sensor Type...........Glass combination electrode
Range.....................2 to 14 units
Accuracy................+/- 0.2 units
Resolution..............0.01 units
pH - Low Ionic Strength
Sensor Type...........Glass combination electrode with open junction and low impedance glass
Range.....................2 to 14 units
Accuracy................+/- 0.2 units
Resolution..............0.01 units
ORP
Sensor type............ Platinum ring
Range.....................-999 to +999 mV
Accuracy................+/-20 mV
Resolution...............0.1 mV
Nitrate-Nitrogen
Sensor Type...........Ion selective electrode
Range.....................0 to 200 mg/L-N
Accuracy................ +/- 10% of reading or 2 m g /L, whichev er is g reater
Resolution..............0.1 mg/L
Ammonium-Nitrogen
Sensor Type...........Ion selective electrode
Range.....................0 to 200 mg/L-N
Accuracy................ +/- 10% of reading or 2 m g /L, whichev er is g reater
Resolution..............0.1 mg/L
Ammonia
Sensor Type...........Calculated from ammonium, pH, and temperature
Range.....................0 to 200 mg/L-N
Accuracy................ +/- 10% of reading or 2 m g /L, whichev er is g reater
Resolution..............0.1 mg/L
Turbidity
Sensor Type...........Optical, 90 degree scatter, mechanical cleaning
Range.....................0 to 1000 NTU
Accuracy................ +/- 5% of reading or 2 NTU, whichever is greater
Resolution..............0.1 NTU
1-5
Page 10

1.4 HOW TO USE THIS MANUAL
The manual is organized to let you quick ly understand and operate the 6000UPG system. However, it
cannot be stressed too strongly that informed and safe operation is m ore than just knowing which
buttons to push. An understanding of the principles of operation, calibration techniques, and
system setup is necessary to obtain accurate and m eaning ful results.
Sections 2 and 3 help you get started, providing initial setup information as well as calibration and
basic operating instructions. Sections 4 and 5 provide detailed information on the Sonde software
structure and YSI PC6000 software, respectively. PC6000 is PC- based software desig ned to help
the user to easily generate reports and plots from the data collected by the sonde. Sections 6-8
address principles of operation, sonde and sensor maintenance, and system troubleshooting .
Section 9 provides more detailed information on com munications protocols. Section 10 provides
service and repair information. The appendices (A-H) prov ide information on safety, warranty,
accessories, options, storage recommendations, and m ore.
NOTE: Because of the many features, configurations and applications of this versatile product,
some sections of this manual may not apply to the specific sy stem you have purchased.
The 6000
probes, cables and accessories can be ordered as options or ordered together as a system.
If you have any questions about this product or its application, please contact our customer service
department or authorized dealer for assistance. See Appendix C for contact information.
UPG can be purchased with or without internal battery power capability. A dditionally , all
1-6
Page 11

2. GETTING STARTED
This section is designed to quickly familiariz e y ou w ith the hardware and softw are components of
the 6000
connections, software installation and finally basic communication with the 6000
Diagrams, menu flow charts and basic written instructions w ill g uide y ou throug h basic hardw are
and software setup. For the first time user, we encourage the use a personal computer with PC6000
software during this initial setup procedure.
By the end of Section 2 you will have...
❏ Installed sensors in your sonde
❏ Installed PC6000 software in your PC
❏ Established communication between the sonde software and PC software
❏ Enabled appropriate sensors
❏ Assigned appropriate report parameters and units
Successful completion of the above list is essential for you to continue on to Section 3 which
focuses on performing calibrations and mak ing m easurements.
2.1 UNPACKING
UPG sonde and its accessories. You will then proceed to sensor installations, cable
UPG Sonde.
Remove the instrument from the shipping container. Be careful not to discard any parts or supplies.
Check off all items on the packing list and inspect all assemblies and components for damag e. If
any parts are damaged or m issing , contact y our representativ e immediately. If y ou do not k now
from which dealer your 6000
NOTE: Reagents for the 6000
UPG was purchased, refer to Appendix C for contact information.
UPG are not packaged in the same carton as the instrument. These
materials must be ordered separately and w ill arriv e in a separate pack ag e.
2.2 SYSTEM CONFIGURATION
There are a number of ways in which you may configure the 6000UPG Sonde with various
computers, terminals, and data collection devices. You should think about your particular
application needs and then make certain that you have all of the components you need to make
your system work. Below is a list of possible configurations that may be of interest to you. Each
is depicted in diagrammatic sketches on the next 3 pages.
❏ 6000
❏ 6000
❏ 6000
❏ 6000
❏ Upload Data from 6000
❏ Upload Data Files from YSI 610 to Lab Computer
UPG Sonde to YSI 610 Display/Logger
UPG Sonde to Portable Computer
UPG Sonde to Data Collection Platform
UPG Sonde to Lab Computer
UPG Sonde to YSI 610-DM
2-1
Page 12
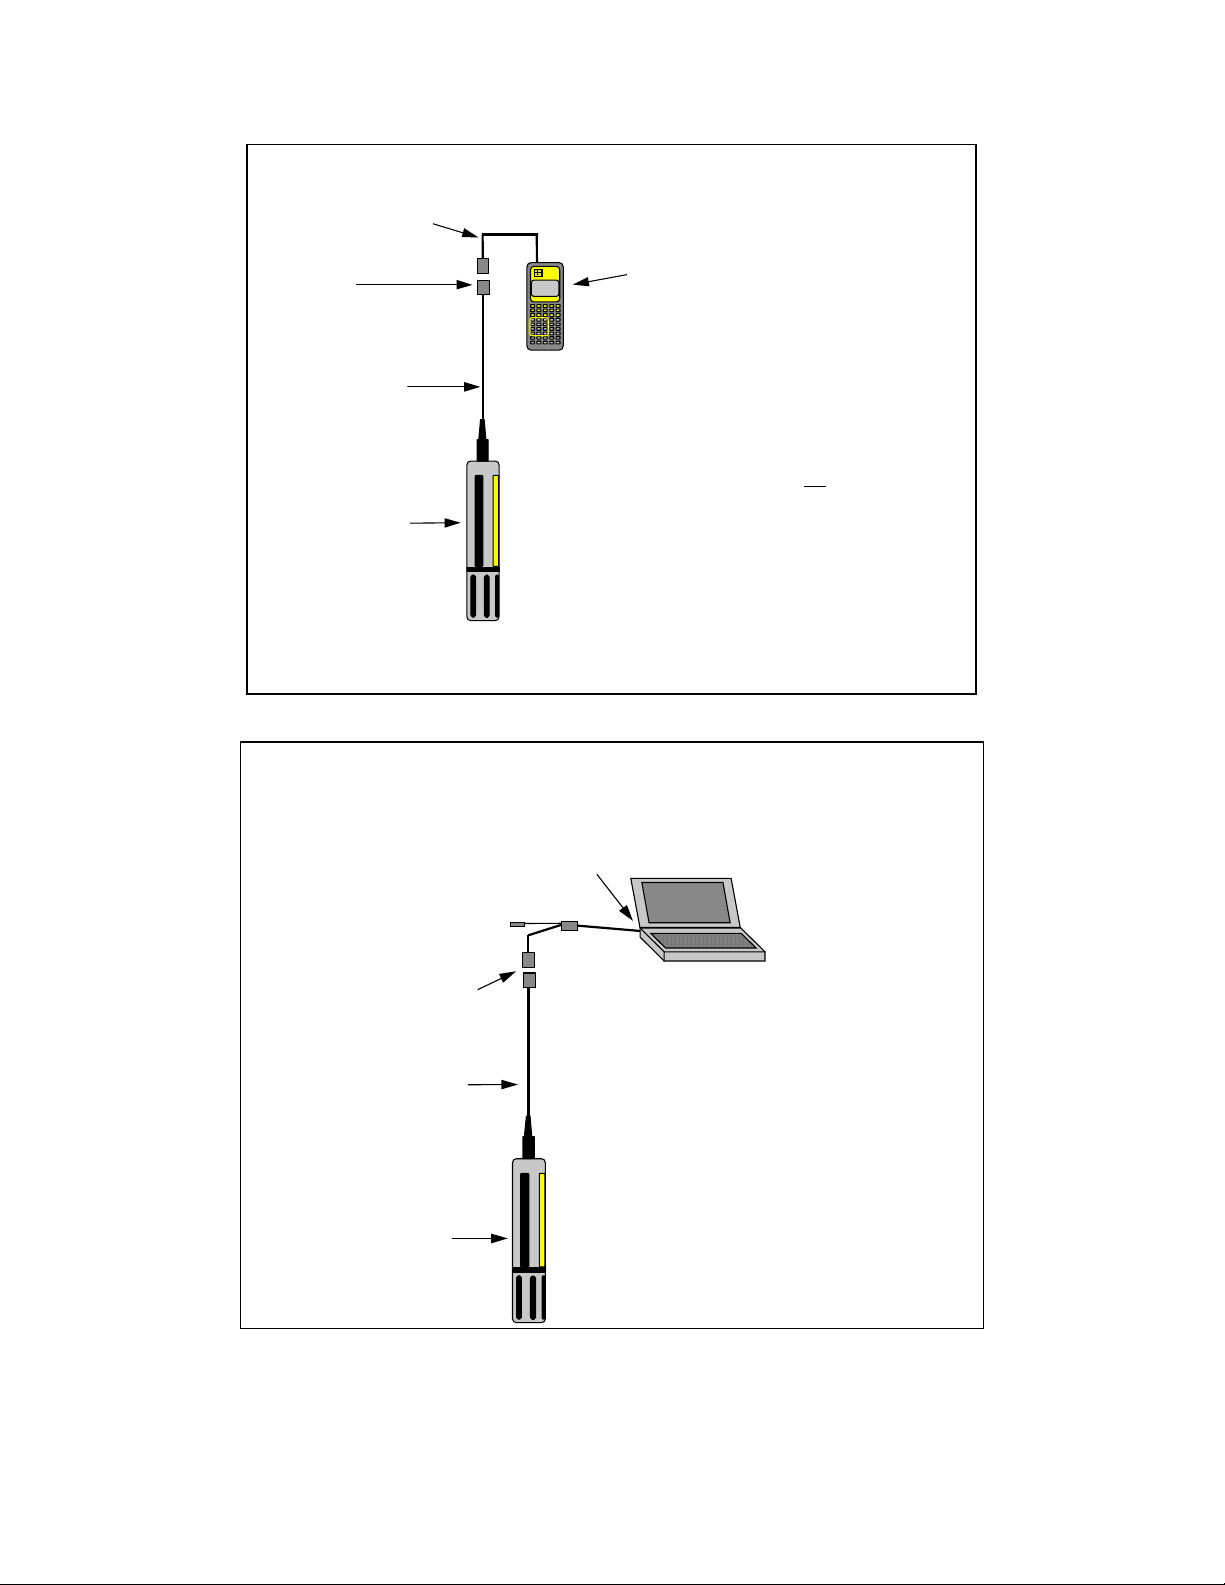
6000UPG Sonde to 610 Display/L ogger
6098 MS-8 Adapter
MS-8
Environmental
Monitoring
YSI
Systems
610-DM
610-D or 610-DM
Cable
You will need...
❑ 6000UPG Sonde
❑ 610-D Display or
6000UPG
6000UPG Sonde
❑ 610-DM Display/Logger
❑ 6098 MS-8 Adapter for 610
YSI 610’s operate on rechargeable batteries.
Each 610 comes with a 110 VAC Wall Socket Charger Unit.
6000UPG Sonde to Portable Computer
DB-9
6095B
Adapter
MS-8
Cable
6000UPG Sonde
You will need...
❑ 6000UPG Sonde
❑ Computer with Com Port
❑ 6095B MS-8/DB-9 Adapter
6000UPG
2-2
Page 13
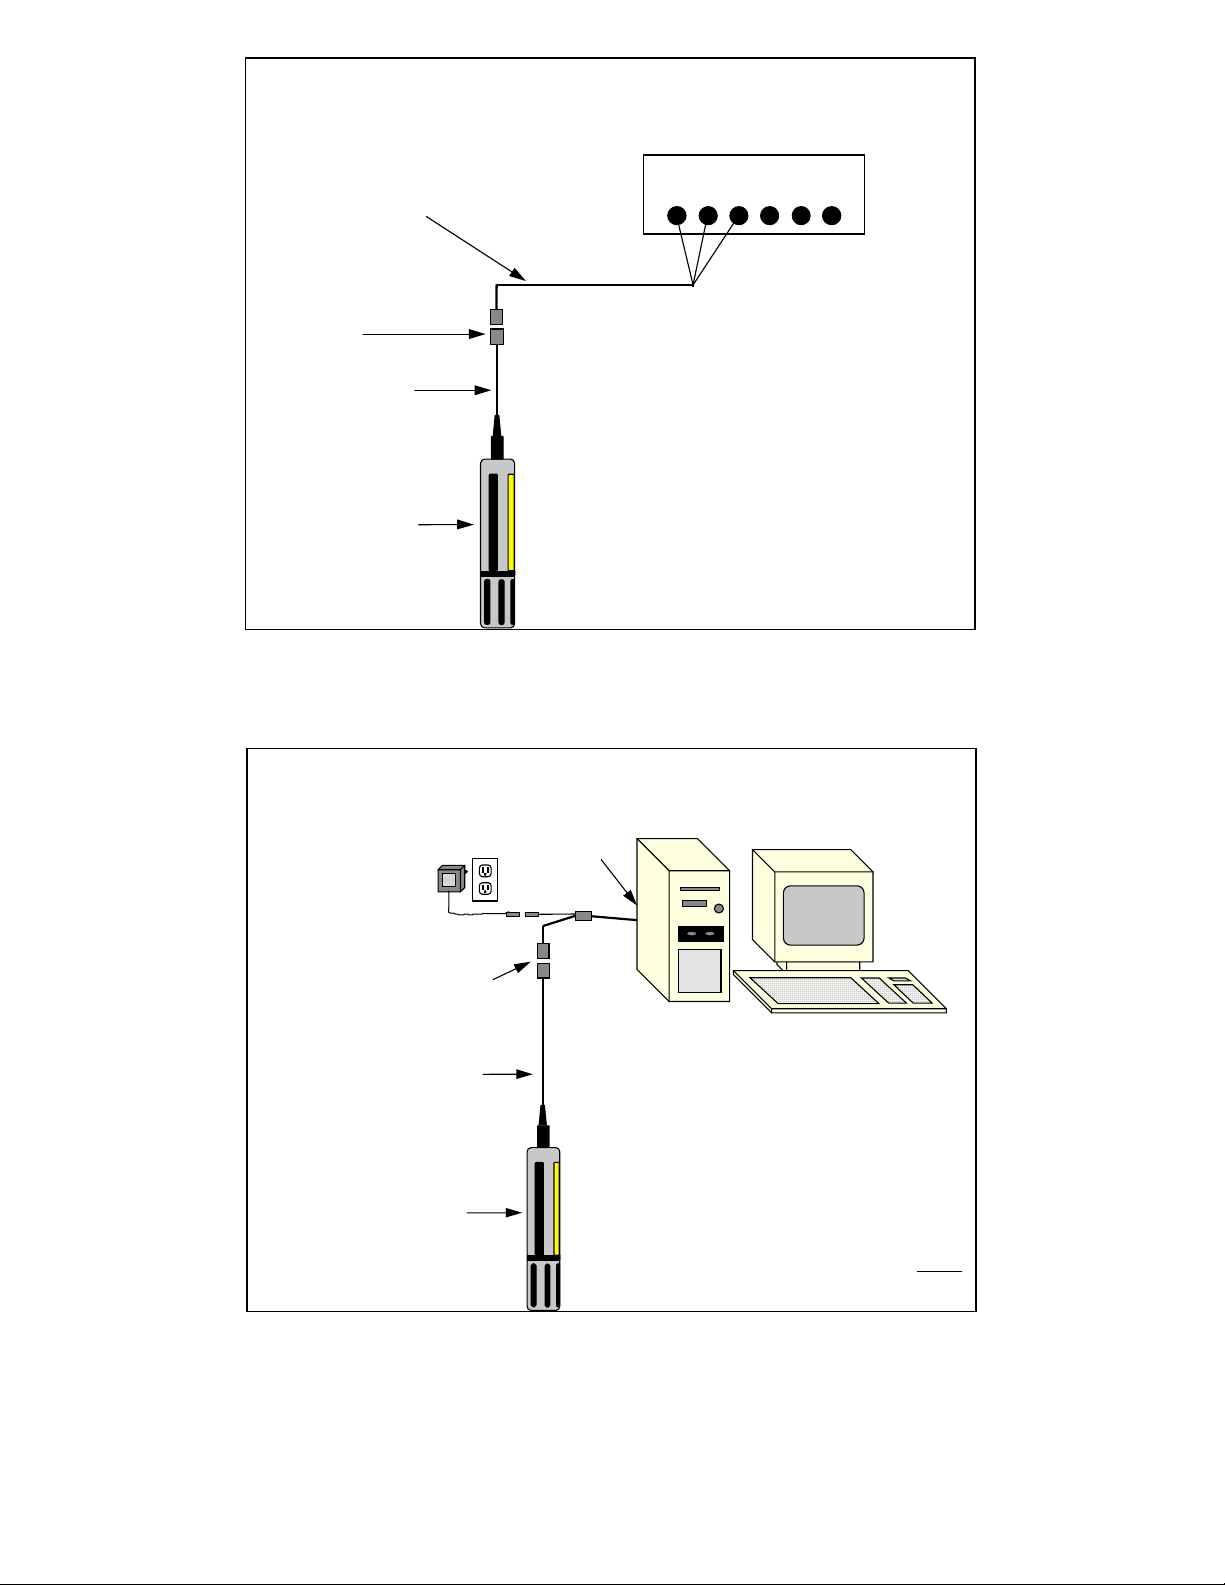
6000UPG Sonde to Data Collection Platform
DCP
6096 MS-8 Adapter with Flying Leads
MS-8
Cable
You will need...
❑ 6000UPG Sonde
6000UPG Sonde
6000UPG Sonde to Lab Computer
Power Supply*
6037: 220 VAC
6038: 110 VAC
MS-8
Cable
6000UPG
❑ 6096 Adapter with Leads
❑ Data Collection Platform
DB-9
6095B
Adapter
You will need...
6000UPG Sonde
Not required if you use
*
sonde battery power.
❑ 6000UPG Sonde
❑ Computer with Com Port
6000UPG
❑ 6095B MS-8/DB-9 Adapter
❑ Power Supply *
❑ DB-9 to DB-25 Adapter may
be needed at Co m Po rt
2-3
Page 14
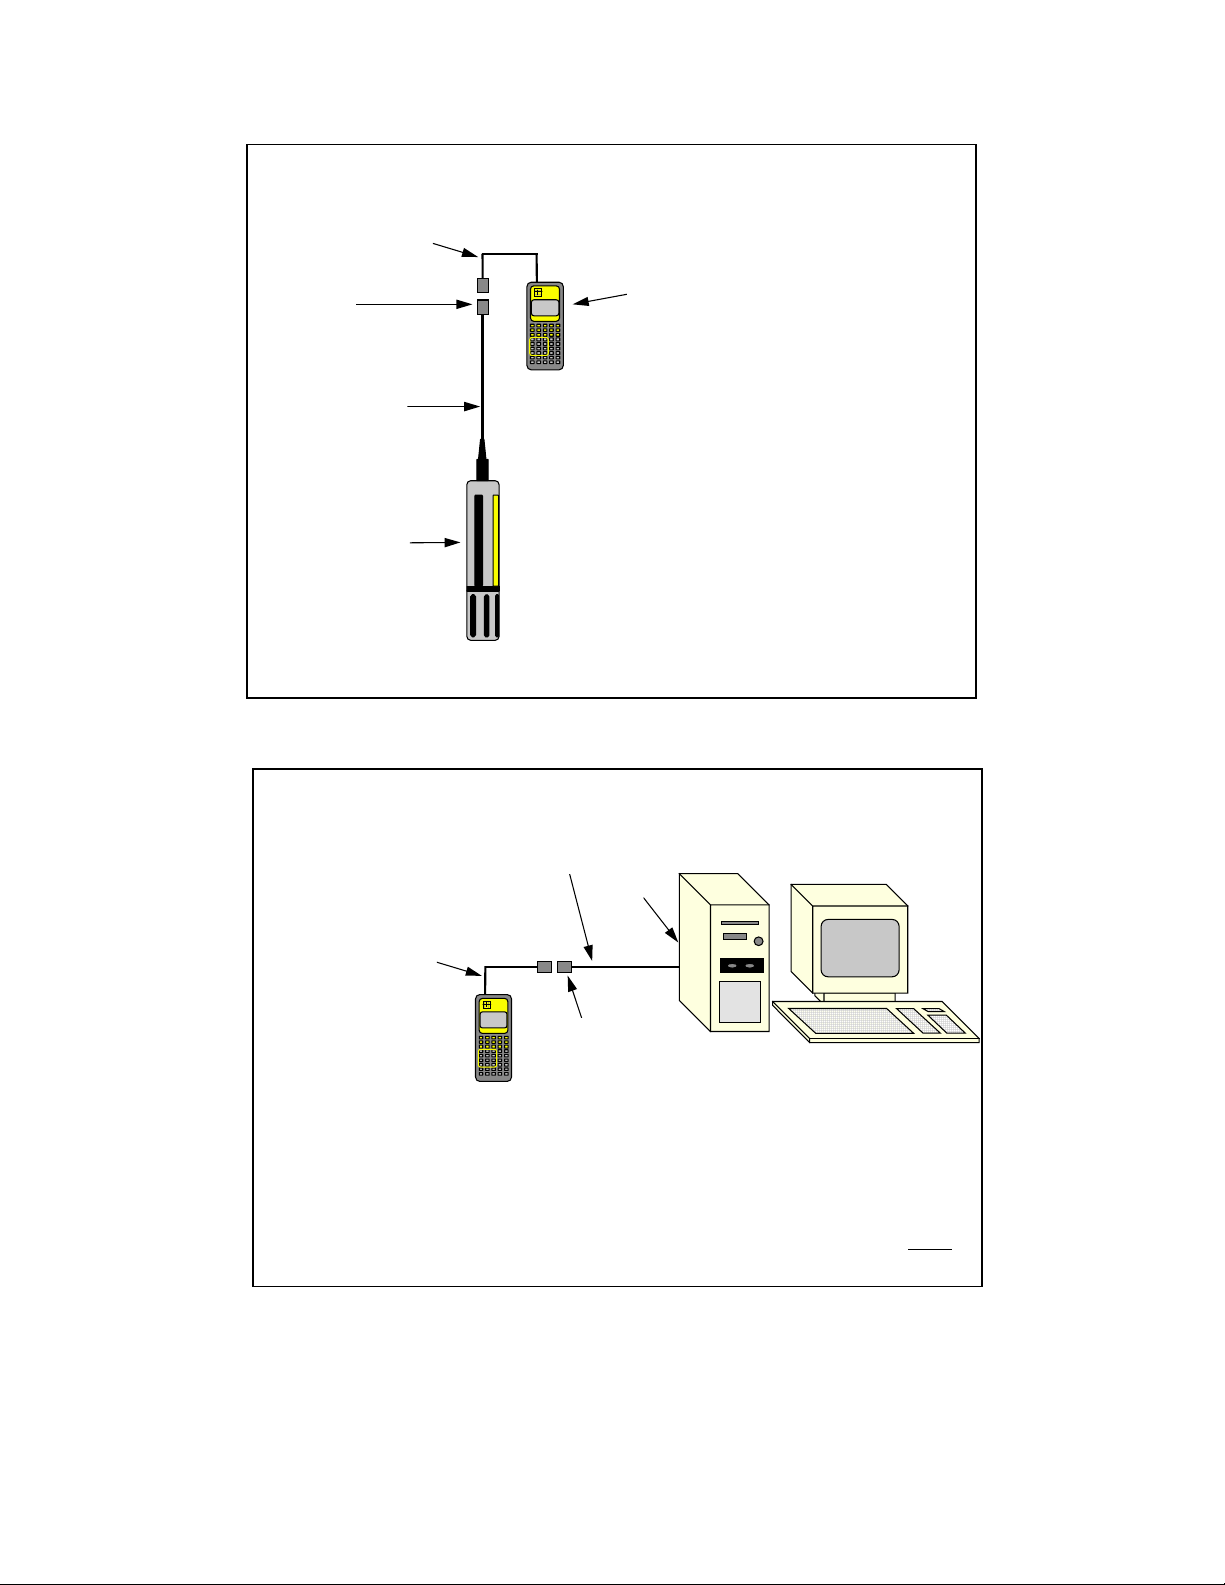
Upload Data from 6000UPG Sond e to 610-DM
6098 MS-8 Adapter
Environmental
Monitoring
YSI
MS-8
Systems
610-DM
610-DM
Cable
You will need...
❑ 6000UPG Sonde
❑ 610-DM Display/Logger
6000UPG
6000UPG Sonde
YSI 610’s operate on rechargeable batteries.
Each 610 comes with a 110 VAC Wall Socket Charger Unit.
❑ 6098 MS-8 Adapter for 610
Upload 610 Data Files to Lab Computer
Null Modem Cable
6099 DB-9 Adapter
DB-9
Environmental
Monitoring
YSI
Systems
610-DM
610-DM
DB-9
You will need...
❑ 610-DM
❑ 6099 DB-9 Adapter
❑ Null Modem Cable
❑ DB-9 to DB-25 Adapter may
be needed at Com Port
2-4
Page 15
2.3 SONDE SETUP
In the following section, you will be prov ided w ith step-by-step instructions on how to g et y our
UPG up and running. We recomm end following the steps in the order listed. Howev er,
6000
depending on your sonde configuration and the optional sensors which you hav e purchased, som e
of the steps may not apply to your setup. If so, simply skip to the next step in the protocol which is
relevant to your application.
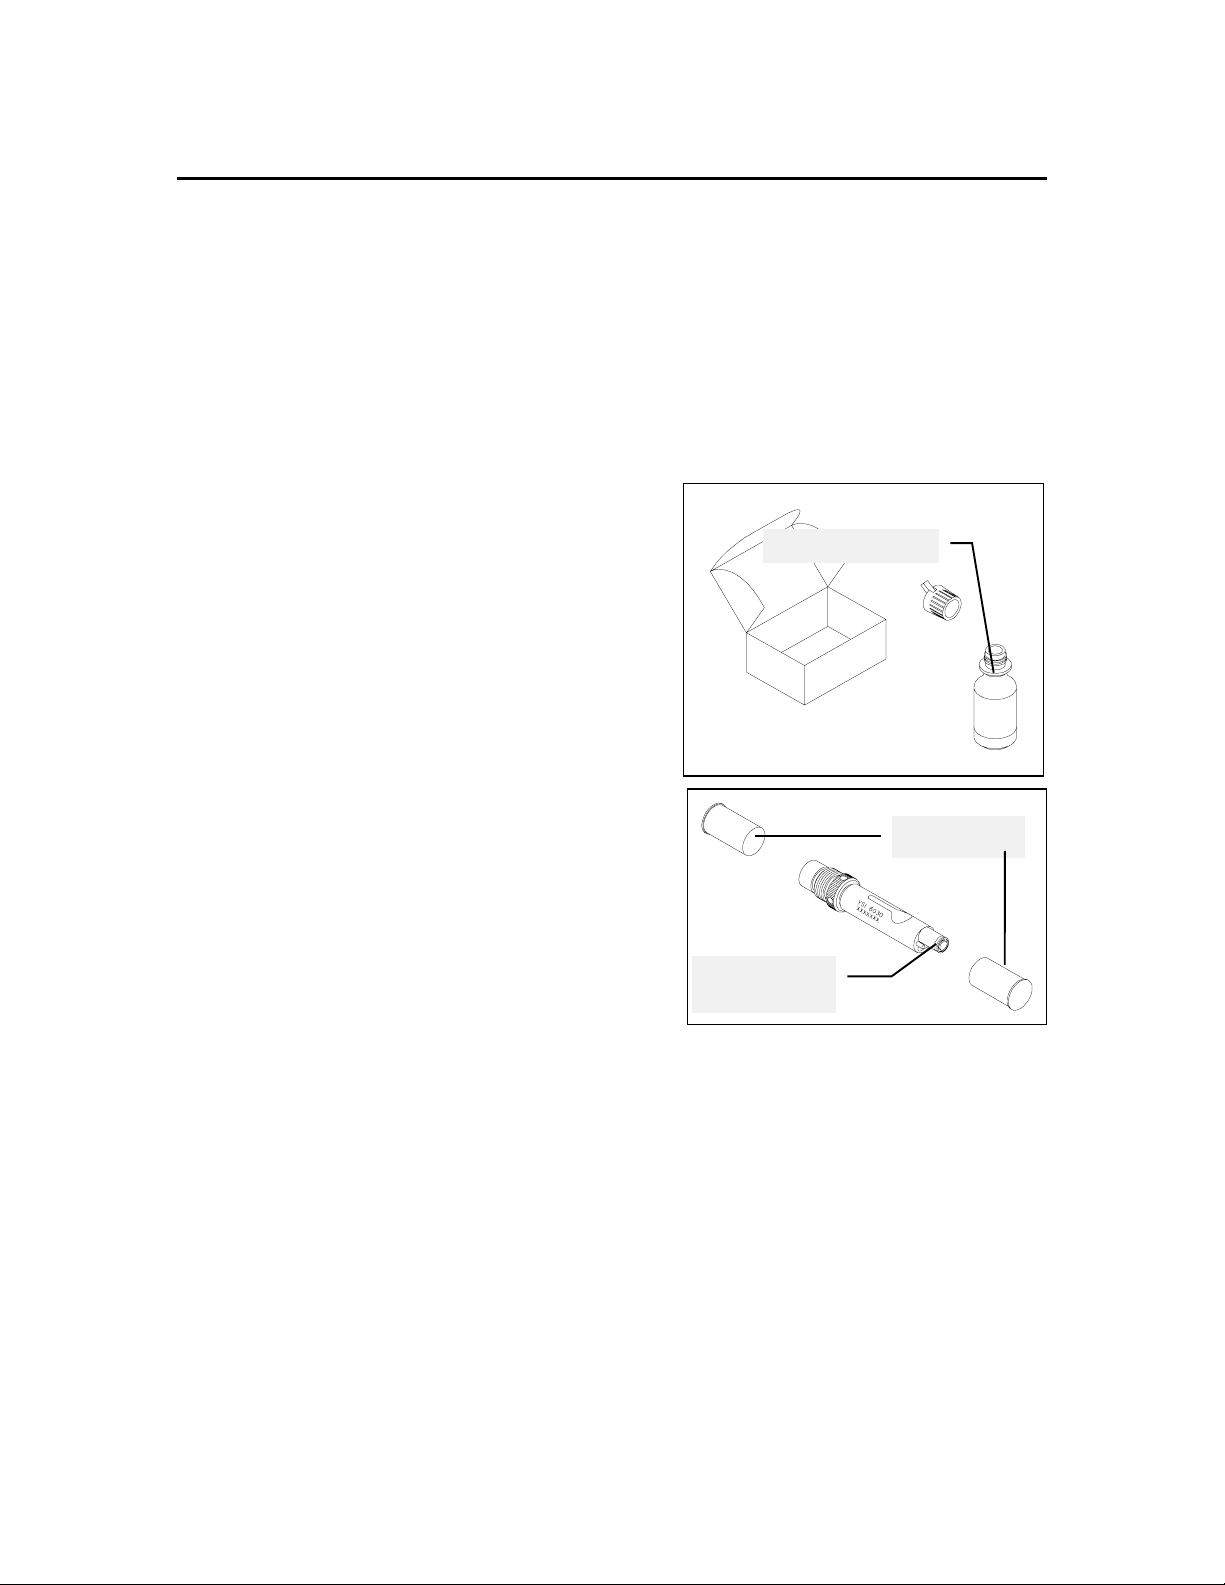
STEP 1. INSTALL YSI 6030 DO/COND/TEMP PROBE
Follow these instructions to prepare your new probe
and install it in the Model 6000
UPG.
1. Open the membrane k it and prepare the electroly te.
Dissolve the KCl crystals in the dropper bottle by
filling it to the neck with distilled water and shaking
until the solid is dissolved. Insure that the crystals are
fully dissolved before use.
2. Remove the two protectiv e caps and the dry
membrane from the 6030 probe.
NOTE: Your probe is shipped with a protective dry
membrane on the dissolved oxy g en sensor tip. It is
very important not to scratch or contam inate the sensor
tip. Handle the new probe with care. Avoid touching or
accidentally hitting the sensor tip.
Add distilled water
Protective Caps
Protective Dry
Membrane
2-5
Page 16

3. Follow the procedure described below to install a
new membrane on the dissolved oxy g en sensor tip.
A. Hold the probe in a vertical position and apply a
few drops of KCl solution to the tip. The fluid should
completely fill the small moat around the electrodes
and form a meniscus on the tip of the sensor. Be sure
no air bubbles are stuck to the face of the sensor. If
necessary, shake off the electrolyte and start over.
B. Secure a membrane between your left thum b and
the probe body. Always handle the memb rane with
care, touching it at the ends only.
C. With the thumb and forefinger of your right hand,
grasp the free end of the membrane. With one
continuous motion, gently stretch it up, over, and
down the other side of the sensor. The membrane
should conform to the face of the sensor.
D. Secure the end of the membrane under the
forefinger of your left hand.
E. Roll the O-ring over the end of the probe, being
careful not to touch the membrane surface with your
fingers. There should be no wrinkles or trapped air
bubbles. Small wrinkles may be removed by lightly
tugging on the edges of the m embrane.
F. Trim off any excess mem brane with a sharp k n ife or
scissors. Make sure the stainless steel temperature
sensor is not covered by excess mem brane. Being
careful not to get water in the connector, rinse off the
excess KCl solution.
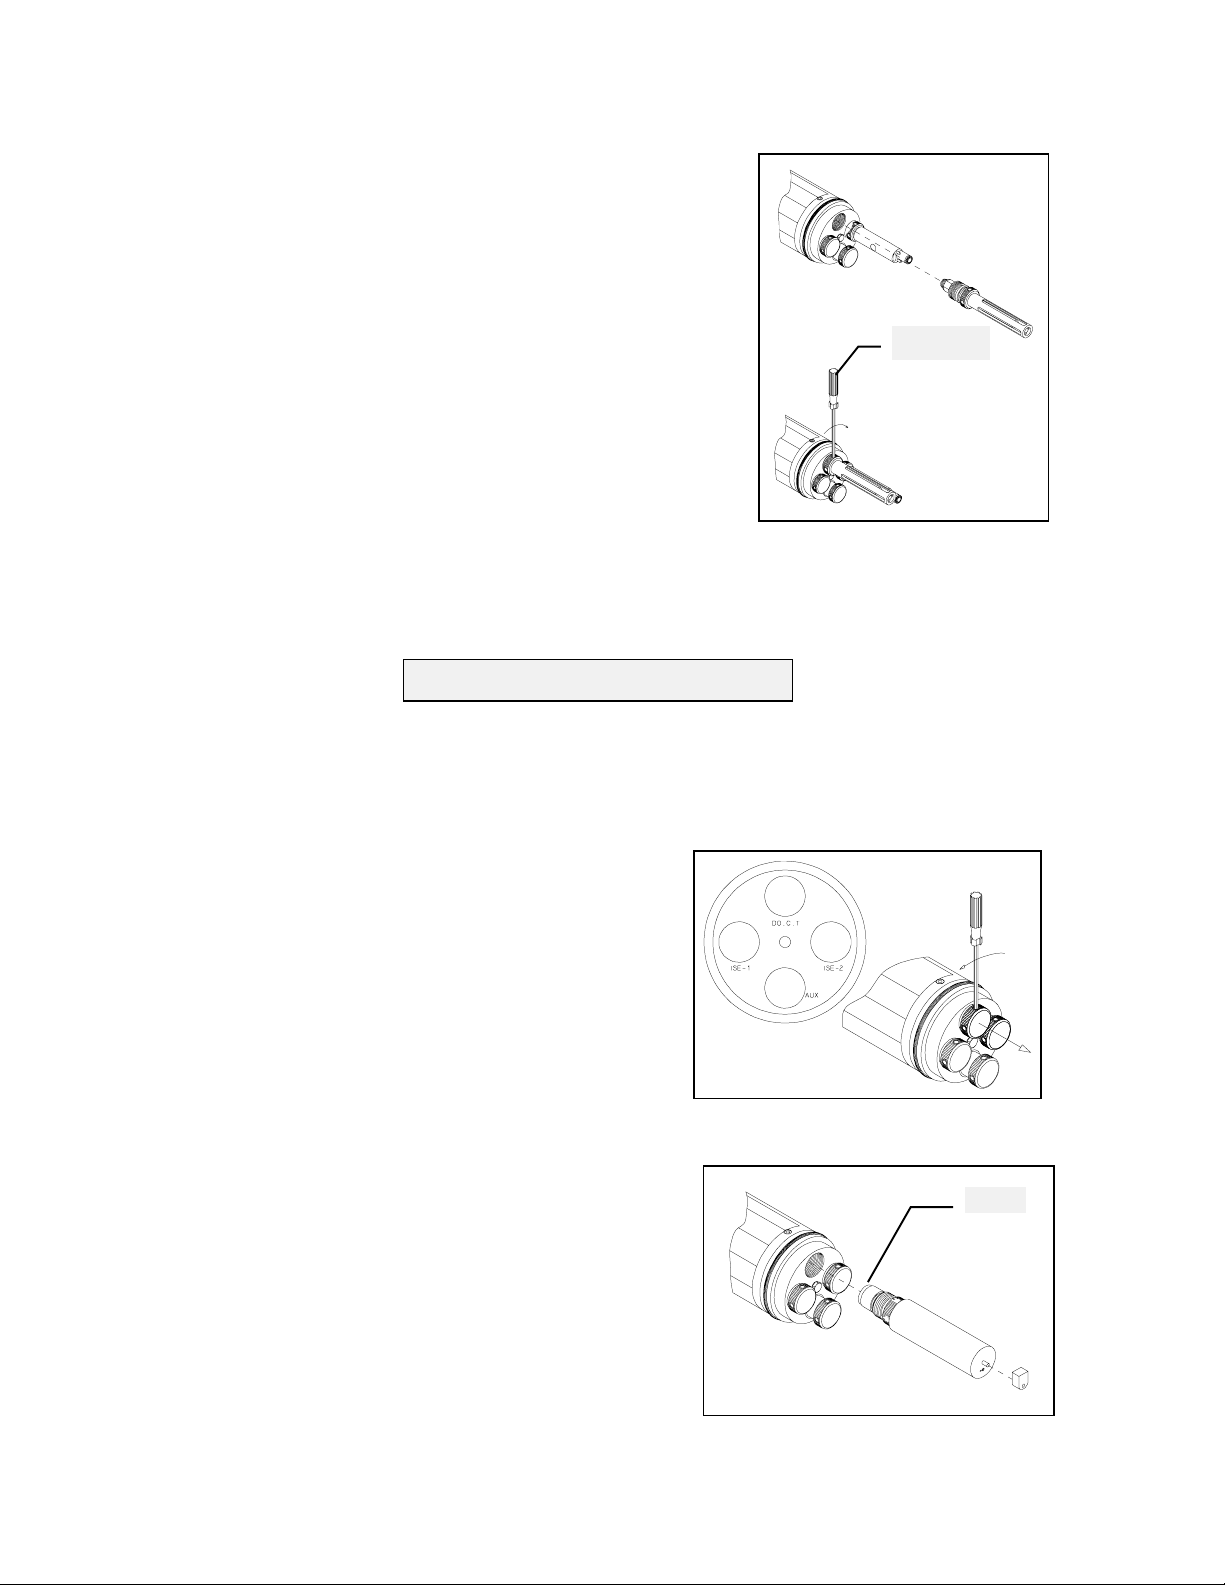
4. Using the hex driver supplied in the 6040
Maintenance Kit, remove the probe guard m ounting
screws from the sonde. Set the probe guard aside.
NOTE: Do not remove the two allen screws above the
guard.
E F
Hex Driver
Probe Guard
Mounting
Screws
Probe
Guard
2-6
Page 17
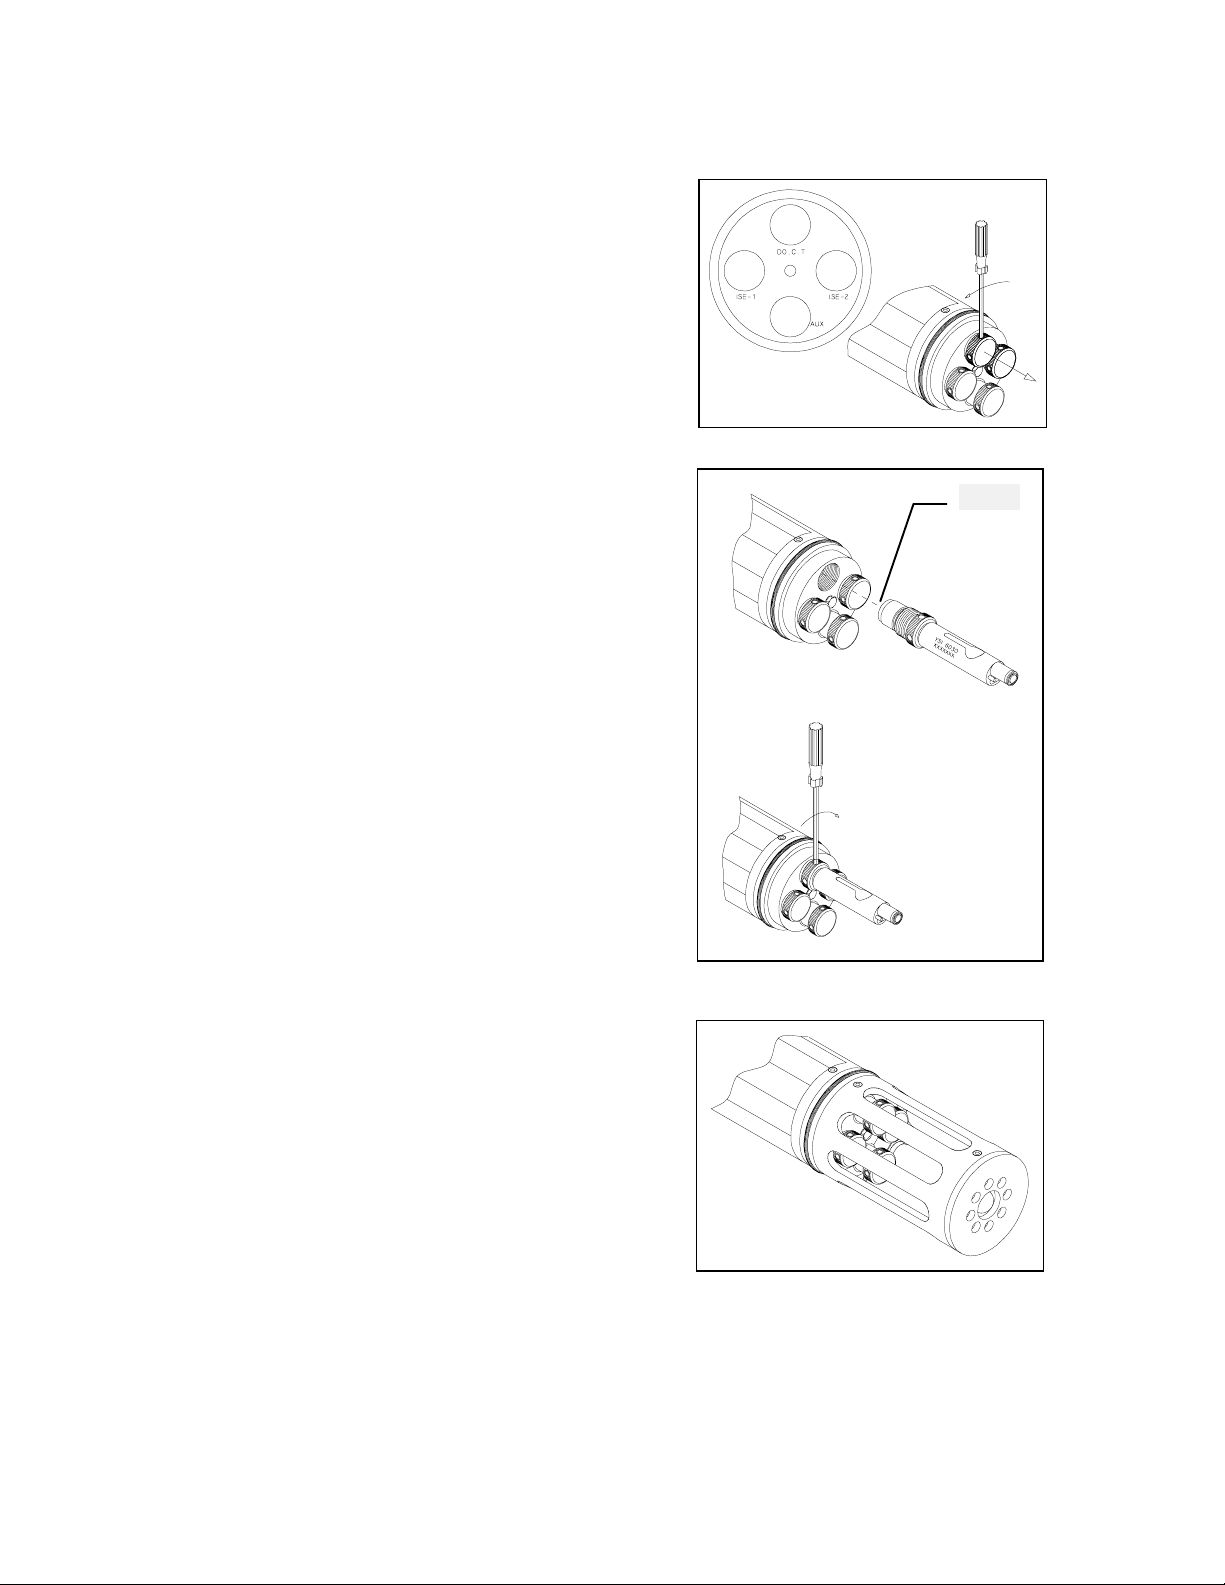
5. Locate the plug which seals the DO.C.T. port on the
g
sonde. Using the hex driver to assist you, remov e the
plug.
6. Install the 6030 probe into the sonde as described
below.
A. Apply a very thin coat of O-ring lubricant (supplied
in the 6040 Maintenance Kit) to the O-ring on the
connector side of the probe. Insert the probe in the port
marked DO.C.T.
B. With the connectors aligned, screw down the probe
nut, making sure that the probe and sonde connectors
are fully meshed. Use the hex driver to assist y ou in
tightening the nut.
DO NOT OVER TIGHTEN.
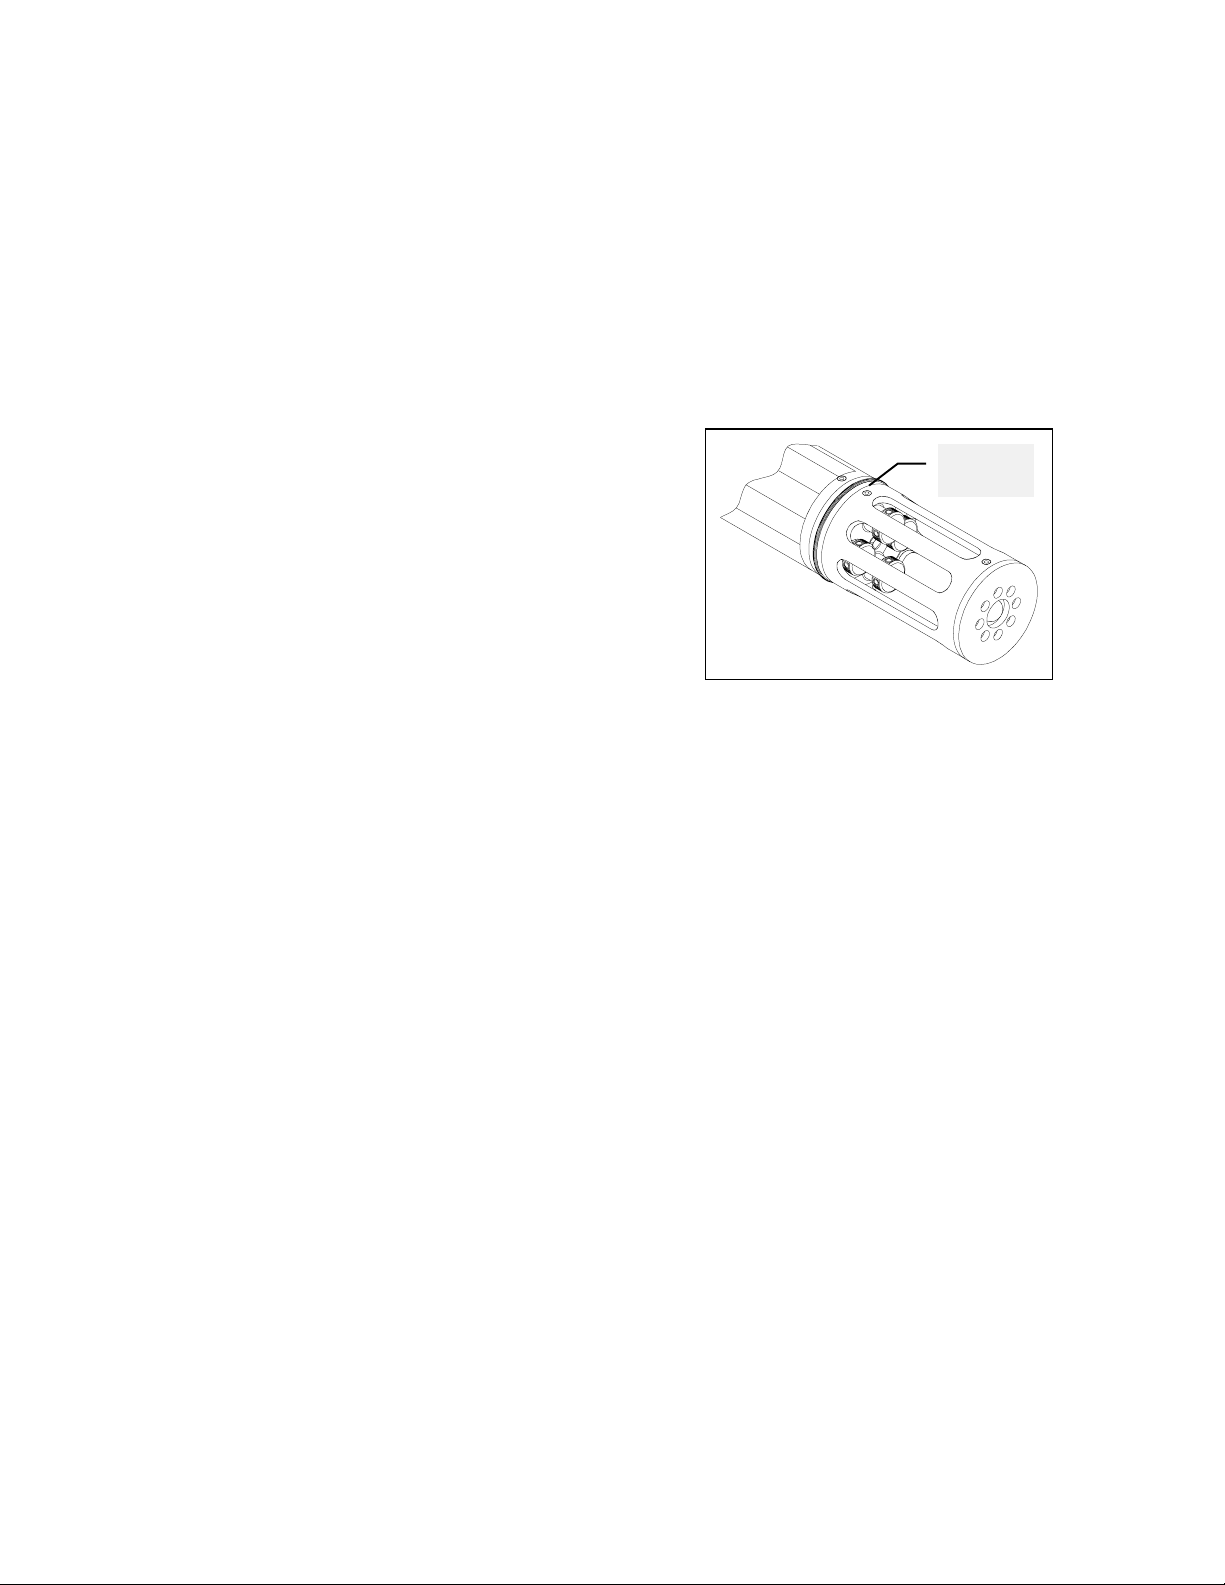
7. Replace the probe guard and tighten the probe guard
mounting screws.
O-rin
2-7
Page 18
STEP 2. INSTALL OTHER PROBES
If you have purchased any optional YSI probes, follow instructions provided below for all items
other than the 6029 conductivity/temperature sensor which is installed in an identical fashion to the
6030. The 6031 pH, 6032 ORP, 6033 low ionic strength pH, 6084 nitrate, and 6083 ammonium
probes can be ordered as options and do not require factory installation (see Section 4.7 for
software setup). The 6026 turbidity probe is installed by the user according to its accomp any ing
instructions, but requires an additional PCB which must be factory installed. The depth sensors are
factory installed options.
YSI 6031 pH Probe
YSI 6032 ORP Probe
YSI 6033 Low Ionic Strength pH Probe
Follow these instructions to prepare your new probe and install it in the 6000
NOTE: Instructions for preparation of use, maintenance and storage are included with each
electrode.
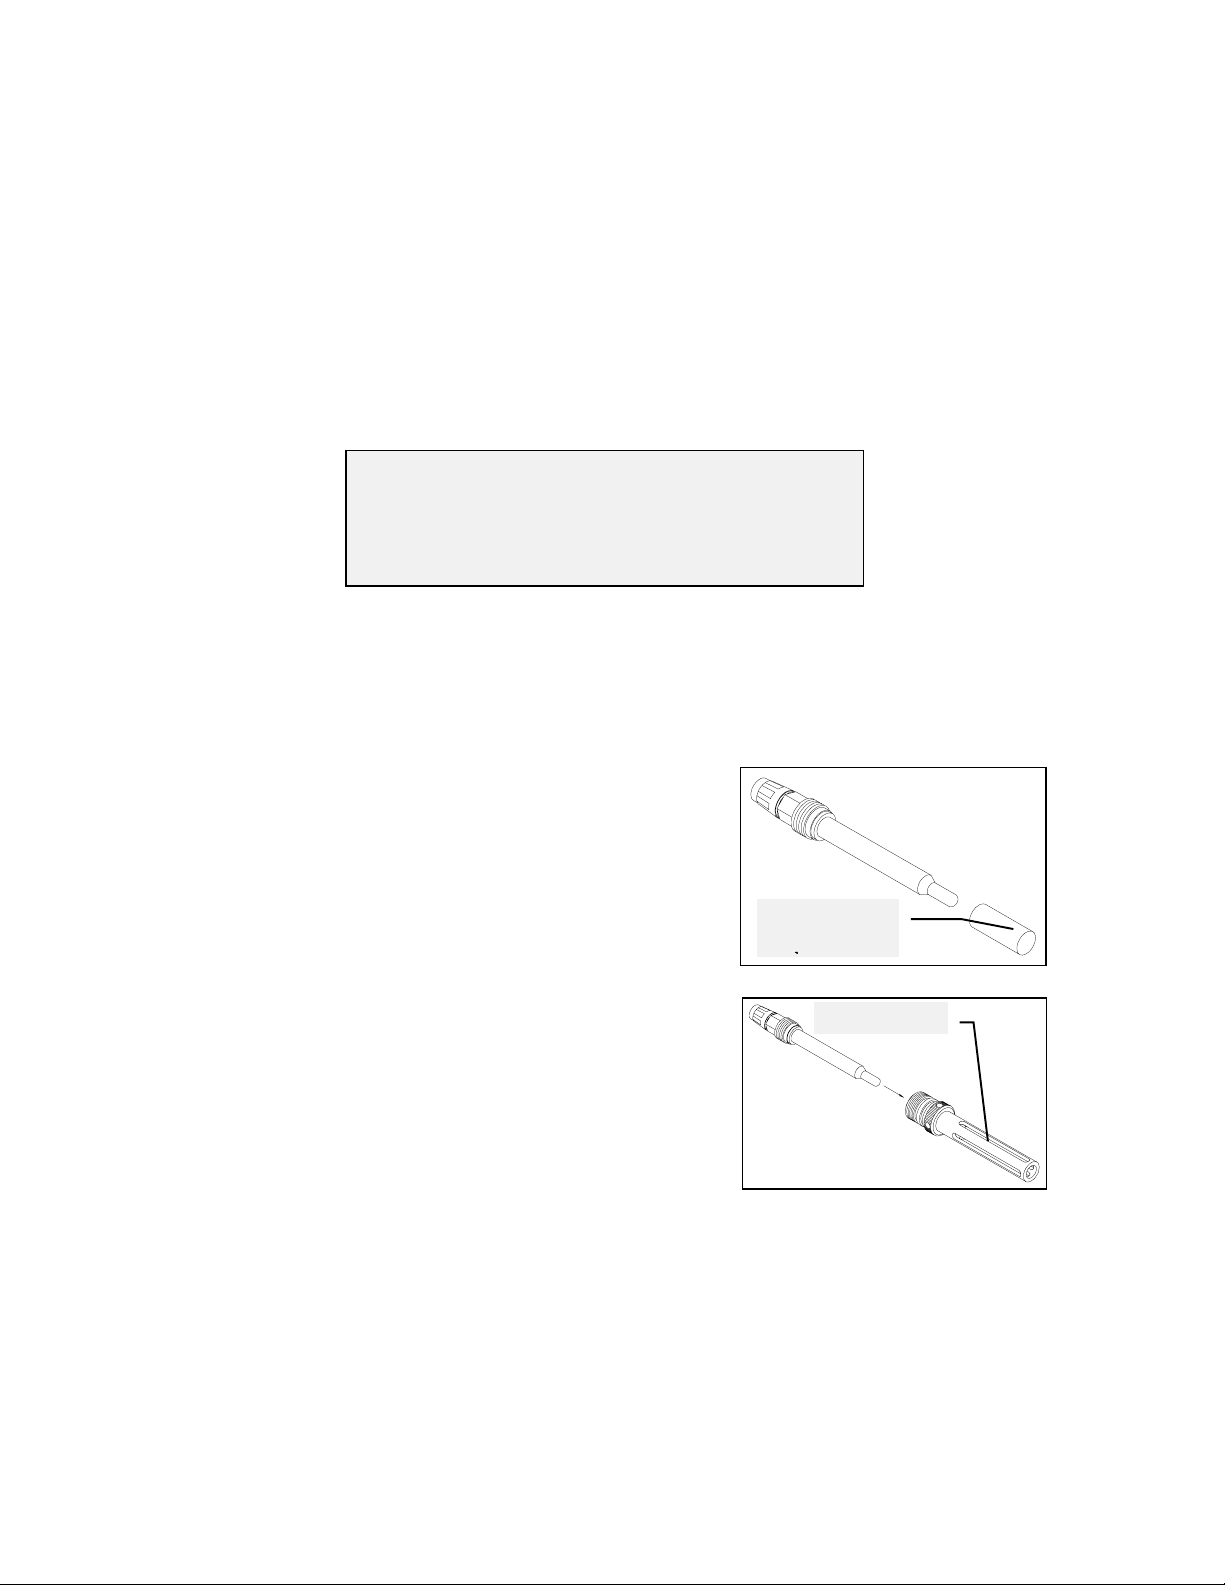
1. Remove the storage bottle or hy drating cap and rinse the
glass portion of the electrode with distilled water.
Hydrating Cap
or Storage
2. Apply a very thin coat of O-ring lubricant (supplied in the
YSI 6040 Maintenance Kit) to the O-ring on the glass shaft of
the new electrode. Insert the electrode into the probe housing
and hand tighten.
DO NOT OVER TIGHTEN.
UPG.
Probe
2-8
Page 19
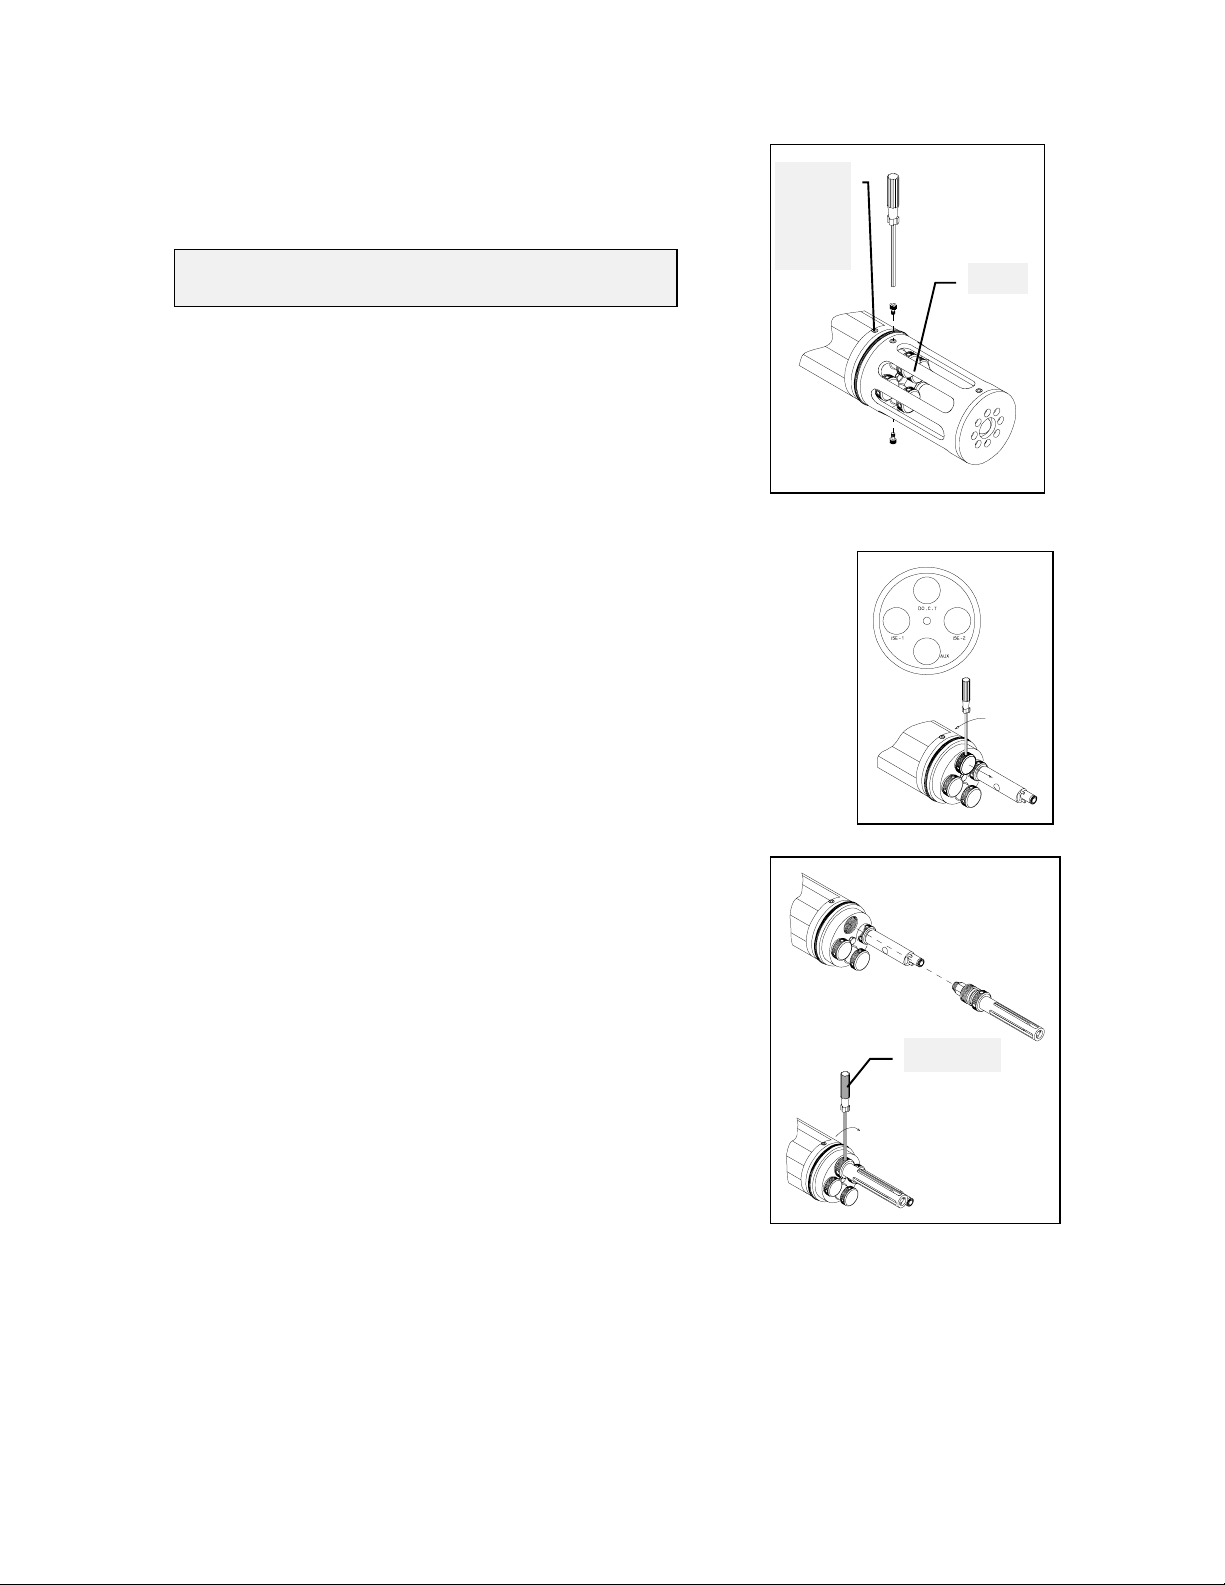
3. Using the hex driver (supplied in the YSI 6040 Maintenance
Kit), remove the probe guard m ounting screws from the sonde.
Set the probe guard and mounting screws aside.
Do Not
Remove
These
Screws
CAUTION:
Do not remove the two allen screws above the guard.
4. Locate the plug which seals the port ISE-1 or I S E- 2 on the sonde. pH
probes must be installed in the ISE- 1 port; ORP probes m u st be installed in
ISE-2 port.
Using the hex driver to assist you, remov e the plug.
Guard
5. Install the 6031, 6032 or 6033 probes into the sonde as
described below.
A. Remove the connector cap from the electrode and check to be
certain the electrode is still firmly seated in the probe housing, as
described in Step 2.
B. Apply a very thin coat of O-ring lubricant (supplied in the YSI
6040 Maintenance Kit) to the O-ring on the connector side of the
probe and to the O-ring on the probe housing. I nsert the probe
assembly into the selected sonde port.
C. Screw the probe assembly into the sonde. Use the hex driver to
assist you in tightening the probe into the sonde.
DO NOT OVER TIGHTEN.
Hex Driver
2-9
Page 20
YSI 6083 Amm onium Pr obe
YSI 6032 Nitrate Probe
Follow these instructions to prepare your new probe and install it in the Model 6000UPG.
NOTE: Instructions for preparation of use, maintenance and storage are included with each
electrode.
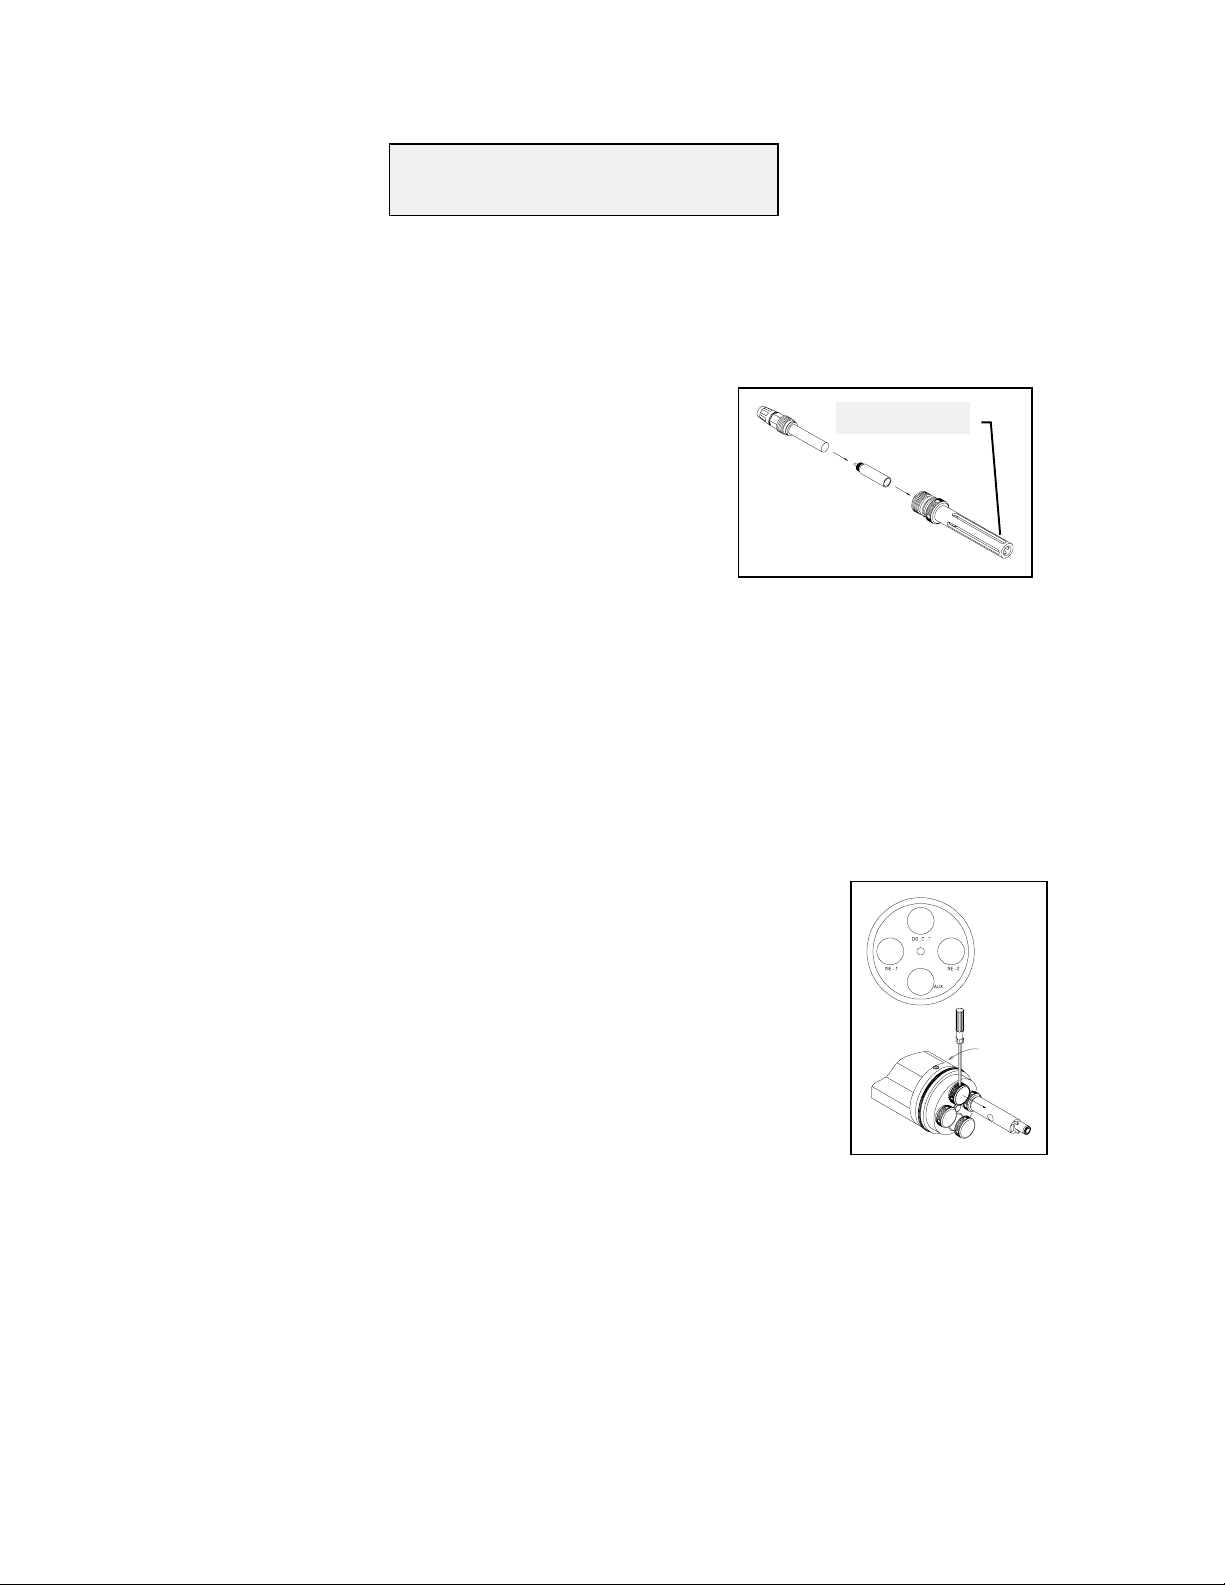
1. Note that the ammonium and nitrate probes consist of two
parts: A probe body and a membrane m odule which threads
into the end of the probe body.
2. Apply a very thin coat of O-ring lubricant (supplied in the
YSI 6040 Maintenance Kit) to the O-ring on m em brane
module. Thread the membrane m odule into the end of the
probe body and tighten by hand until the units mesh
completely.
Do not over tighten and in no case ever use any tools such as pliers in this operation.
Apply a very thin coat of O-ring lubricant (supplied in the YSI 6040 Maintenance Kit) to the
3.
O-ring on the plastic shaft of the new electrode. Insert the electrode into the probe housing and hand
tighten.
Probe
DO NOT OVER TIGHTEN.
Locate the plug which seals the port ISE-2 on the sonde. The am monium
4.
and nitrate sensors must be installed in this port.
Using the hex driver to assist you, remov e the plug.
2-10
Page 21
5. Install the 6083 or 6084 probe into the sonde as described
g
below.
A. Apply a very thin coat of O-ring lubricant (supplied in the
YSI 6040 Maintenance Kit) to the O-ring on the connector side
of the probe and to the O-ring on the probe housing. I nsert the
probe assembly into the selected sonde port.
B. Screw the probe assembly into the sonde. Use the hex driver
to assist you in tightening the probe into the sonde.
DO NOT OVER TIGHTEN.
YSI 6026 Turbidity Probe
Hex Driver
1
. Remove the turbidity probe from its box and any protectiv e caps from the probe.
2. Locate the plug which seals the auxiliary (AUX) port
on the sonde. Using the hex driver to assist you, remov e
the plug.
3. Install the 6026 probe into the sonde as described
below.
A. Apply a very thin coat of O-ring lubricant (supplied in
the 6040 Maintenance Kit) to the O-ring on the
connector side of the probe. Insert the probe in the port
marked AUX.
O-rin
B. With the connectors aligned, screw down the probe
nut, making sure that the probe and sonde connectors are
2-11
Page 22
fully meshed. Use the hex driver to assist y ou in tig htening the nut.
DO NOT OVER TIGHTEN.
After all probes have been installed, replace the probe
guard and tighten the probe guard mounting screws.
Mounting
Screw
2-12
Page 23
STEP 3. INSTALL BATTERIES
NOTE: Some 6000UPGs are not configured with internal battery capability. If the 6000UPG you
have purchased is configured to operate from internal batteries, it will hav e a battery compartment
and battery lid as illustrated below.
these battery installation instructions.
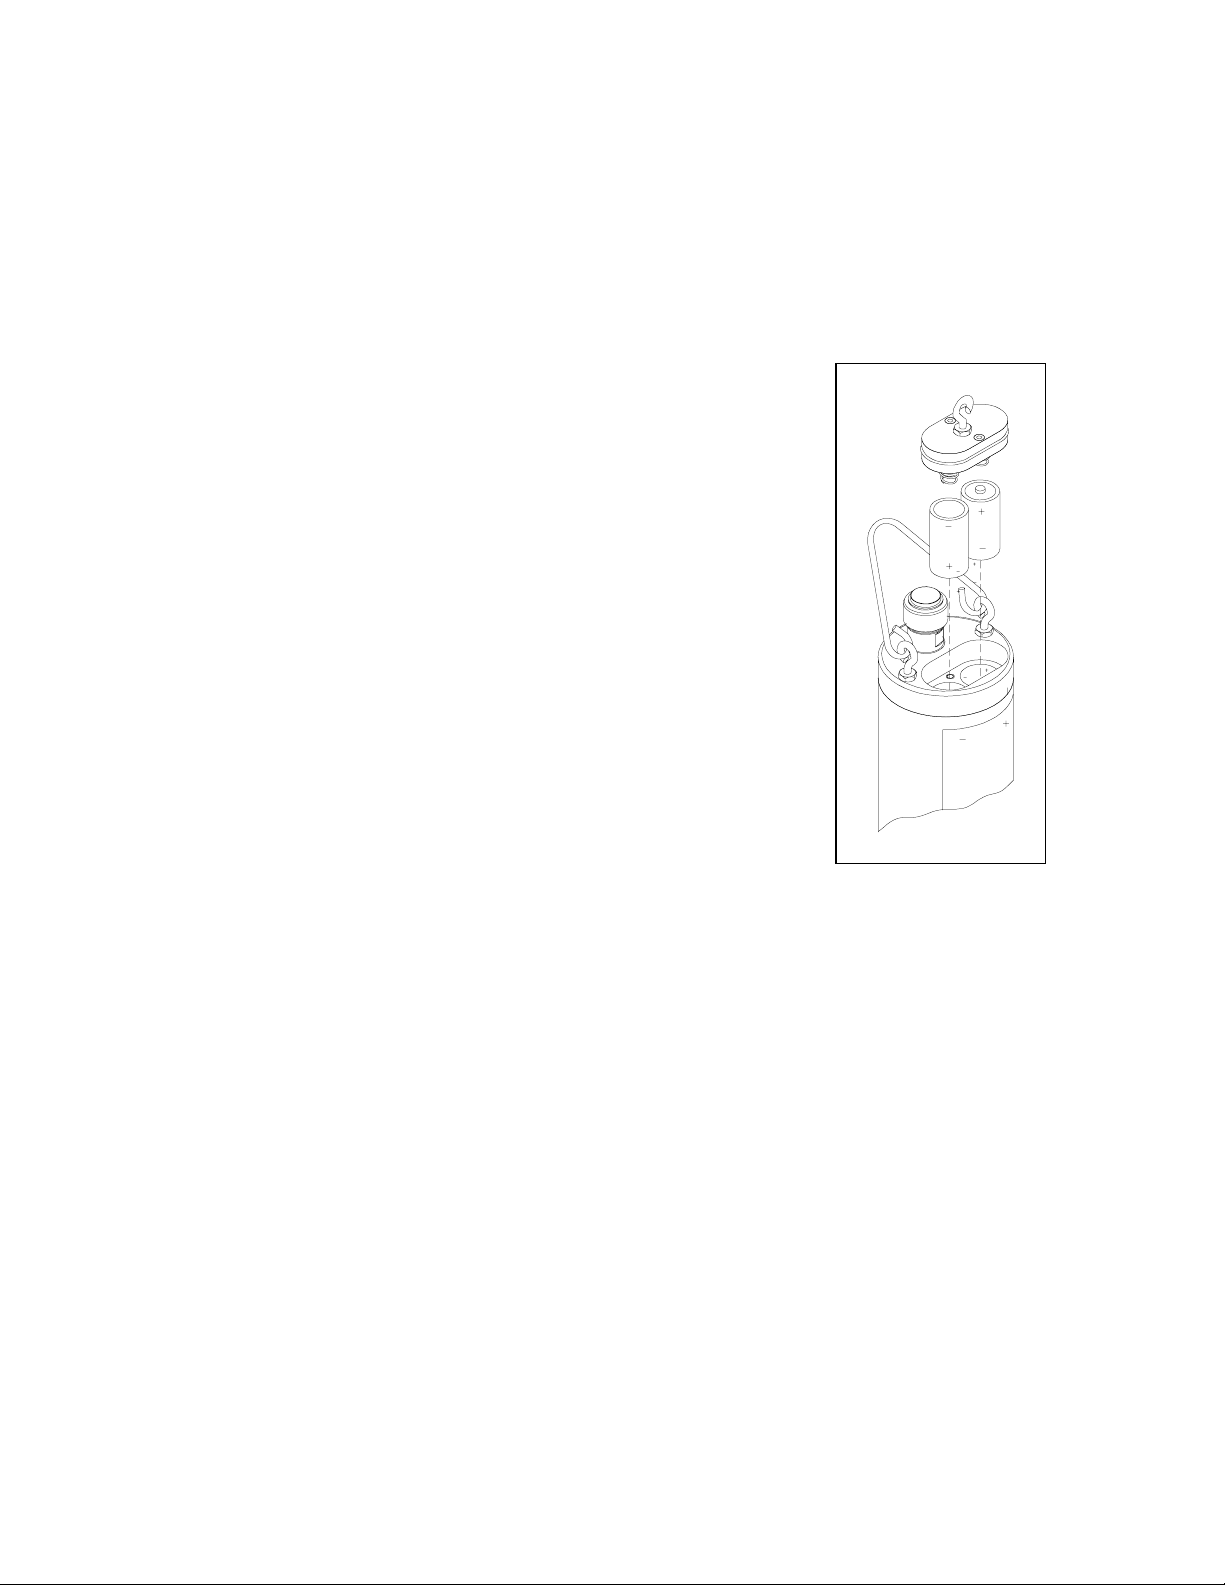
Your first set of batteries is supplied with the instrument. Install 8 C -size
alkaline batteries as follows:
Use the hex driver, supplied in the 6040 Maintenance Kit, to loosen the
battery lid screws.
NOTE: The battery lid screws are captive. It is not necessary to rem ov e
them from the lid comp letely .
Remove the battery lid and install the batteries, as show n.
NOTE: Observe the correct polarity before installing the batteries into
the battery chamber.
Be sure the bottom O-ring is installed in the g roov e of the lid. C heck the
O-ring and sealing surfaces for any contaminates which could interfere
with the O-ring seal of the battery chamber. Remove any contaminates
present. Also clean the protective O-ring w hich located in the middle of
the side of the battery lid.
If your 6000UPG does not have a battery compartment, ignore
Apply a very thin coat of O-ring lubricant (supplied in the 6040 Maintenance Kit) to both battery
chamber O-rings.
Return the battery lid and tighten the screws.
DO NOT OVER TIGHTEN.
2-13
Page 24

STEP 4. ATTACH CABLE
r
Remove the waterproof cap from the
sonde connector and set it aside for later
Waterproof
Cap
reassembly. Connect a PC interface cable
to the sonde connector. A built-in key will
ensure proper pin alignment. Rotate the
cable connector gently until the key
engages and then tighten the connectors
together by rotating clockwise. N ote that
the attachment is by hand only! No tools
are required nor should they be used.
Attach the strain relief connector to the
Sonde
Connecto
sonde handle. Rotate the strain relief
connector nut to close the connector's
opening.
The other end of the cable is a militarystyle 8-pin connector. This connector
plugs directly into the 610-D and 610- DM
display loggers. Most other applications
will require the use of an adapter. For example, to connect the 6000
6095b MS-8 to DB-9 adapter.
Strain Relief
Connector
UPG to a computer, use a YSI
STEP 5. REVIEW POWER OPTIONS
Some type of external power supply can be used to power the 6000UPG sonde in lieu of batteries.
For laboratory setup and calibration with the sonde interfaced to a computer, the YSI 6038 (110
VAC) or 6037 (220 VAC) can be employed. Most adapters include a short pigtail for power that
plugs into the power supply. After attaching the three pin connector on the power supply to the
pigtail, simply plug the power supply into the appropriate outlet. If you have purchased a 610-series
display/logger for use with your 6000
to be powered from the batteries in the display/logger or from the 610 power supply if the 610
internal batteries are not fully charged. However, the 6000
current draw on the 610 batteries resulting in less usable battery life than for other YSI instruments
such as the 600, 600XL, and 6000
the 6000
UPG if a 610 is used as the terminal.
See pages 2-2 to 2-4 for specific inform ation on cables, adapters and power supplies required for
connecting your 6000
UPG to various devices.
UPG, attachment of the cable to the 610 will allow your sonde
UPG circuitry will place a substantial
UPG. For this reason, we recomm end that batteries be installed in
2-14
Page 25
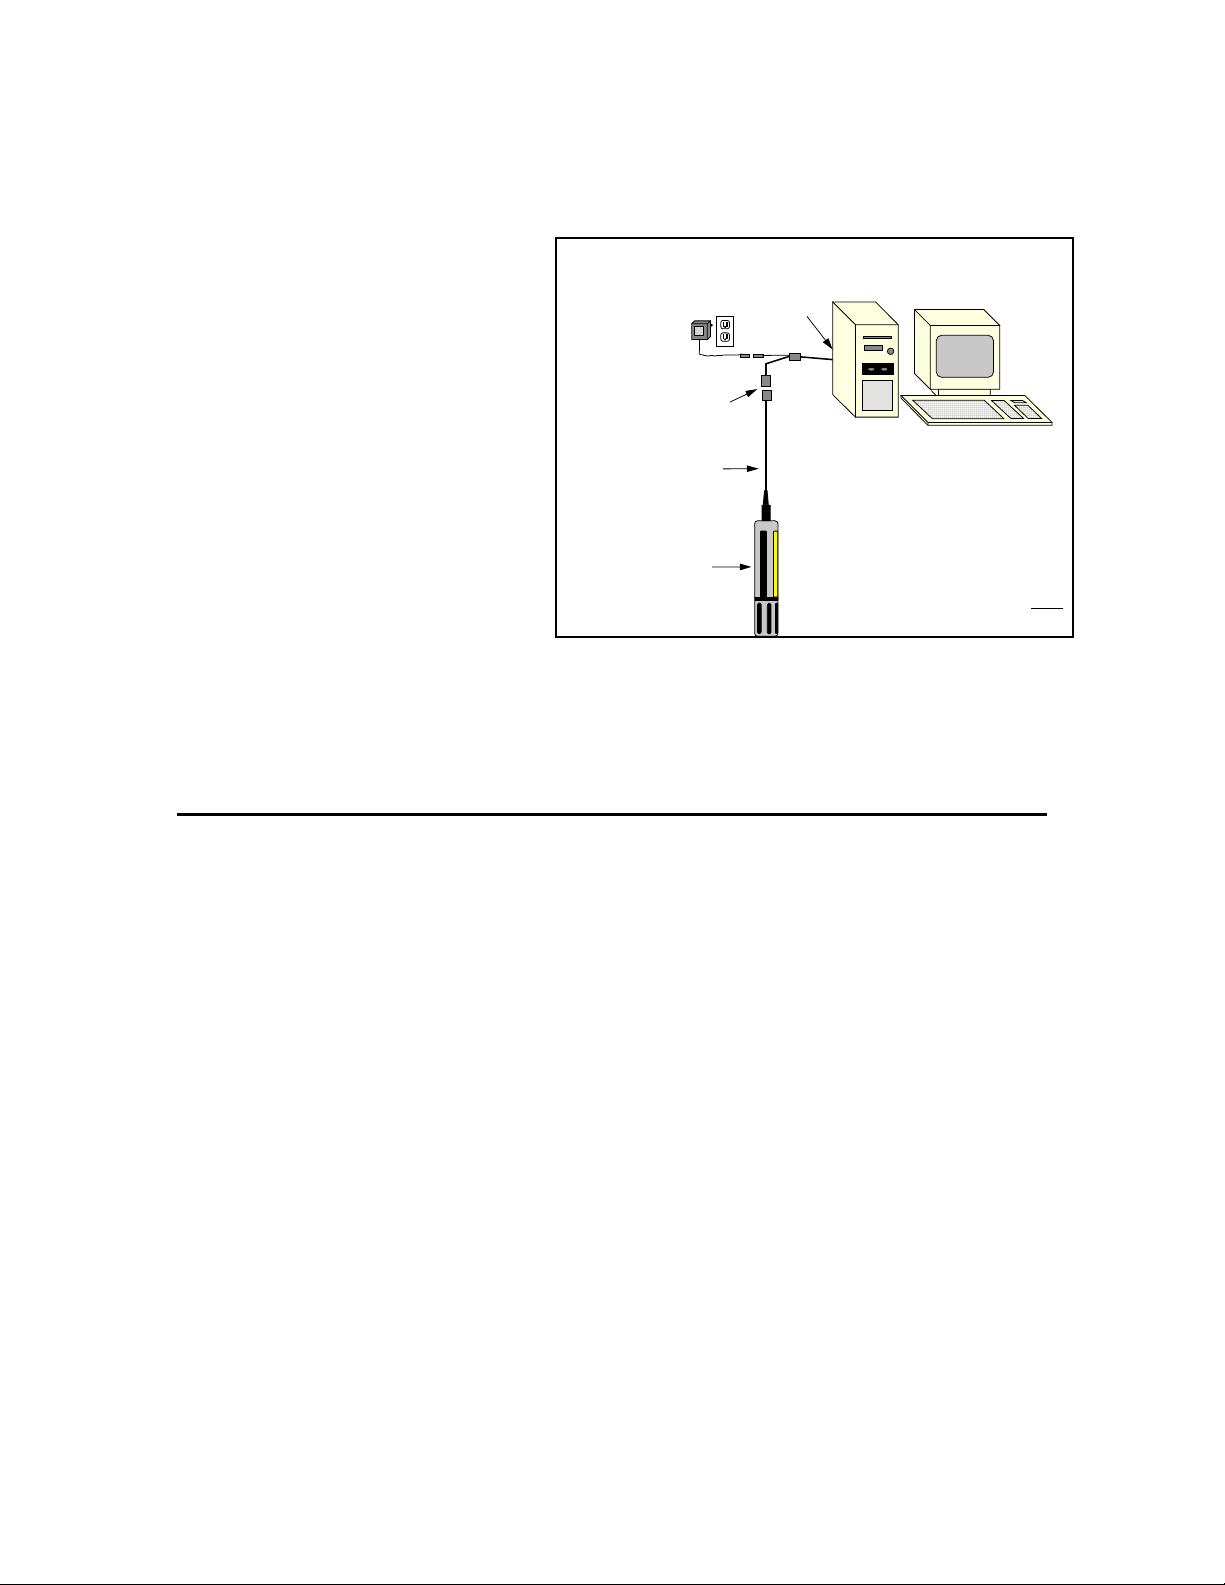
STEP 6. REVIEW SONDE/COMPUTER INTER F AC E
The system configuration best suited
for initial setup is shown in the
diagram to the right.
Below we will describe how to install
PC6000 software on your computer and
Power Supply*
6037: 220 VAC
6038: 110 VAC
communicate with the Sonde software.
If you have purchased a YSI 610 handheld display/logger, refer to the 610
manual which was enclosed with the 610
unit.
Note that the power supply is optional --
Not required if you use
the unit may be powered by internal,
user-installed batteries.
Your 6000
UPG is now physically set up for use. Proceed to the next section on software installation.
*
sonde battery power.
2.4 SOFTWARE INSTALLATION
6000UPG Sonde to Lab Computer
DB-9
6095B
Adapter
MS-8
Cable
6000UPG Sonde
You will need...
❑ 6000UPG Sonde
❑ Computer with Com Port
6000UPG
❑ 6095B MS-8/DB-9 Adapter
❑ Power Supply *
❑ DB-9 to DB-25 Adapter may
be needed at Com Port
PC6000 software is provided with the 6000UPG and is found on a disk in the back of this instruction
manual. Use this software with an IBM-compatible PC with at least 256KB of RAM and DOS 3.0
or later. If your system is not I B M-compatible, use any term inal em ulation prog ram with your
computer.
Insert the disk into your disk driv e. At the C :\ prompt, type the letter of the drive in which the
program disk was inserted followed by a colon, then press
Enter.
Example: A: [Enter]
To install PC6000 software execute the following command from the DOS prom pt:
INSTALL <destination>
where destination is the drive and directory in which you want the PC6000 files to be installed.
For example, the command:
INSTALL C:\PC6000 will install the PC6000 software to the C:
drive and \PC6000 directory.
If you are using a two disk driv e sy stem, follow the instructions in Section 5.2. After installing the
software, remove the disk from the drive and keep the original disk in a safe place.
2-15
Page 26

ECOWATCH FOR WINDOWS
If you have purchased Ecowatch for Windows, install the program from the Program Manag er
menu of your Windows system . Use this software with an I B M- compatible PC with a 386 (or
better) processor. The computer should also have at least 4MB of RAM and Windows Version 3.1
or later. First close any Windows applications which are currently running. After inserting the
Ecowatch floppy disk in your disk driv e, access the File command from the top m enu bar of the
Program Manager window. Click on Run and ty pe “a:\ setup.exe” at the prom pt. Press
click on “OK” and the display will indicate that Ecowatch is proceeding w ith a setup routine.
After the setup is complete, you will be prom pted to confirm that all applications have been closed
and choose the hard drive location where Ecowatch will be installed. After answering these
questions, the installation of Ecowatch will take place automatically . Simply follow the instructions
on the screen after installation is complete.
Enter or
2.5 PC6000 SOFTWARE SETU P
To start the software, make your current drive C:\P C6000 (or another directory where y ou hav e
installed PC6000). Type
menu bar will appear at the top of the computer screen:
PC6000 and press Enter. The PC6000 software will load. The PC6000
Sonde File Setup Real-Time Exit PC6000
2-16
Page 27
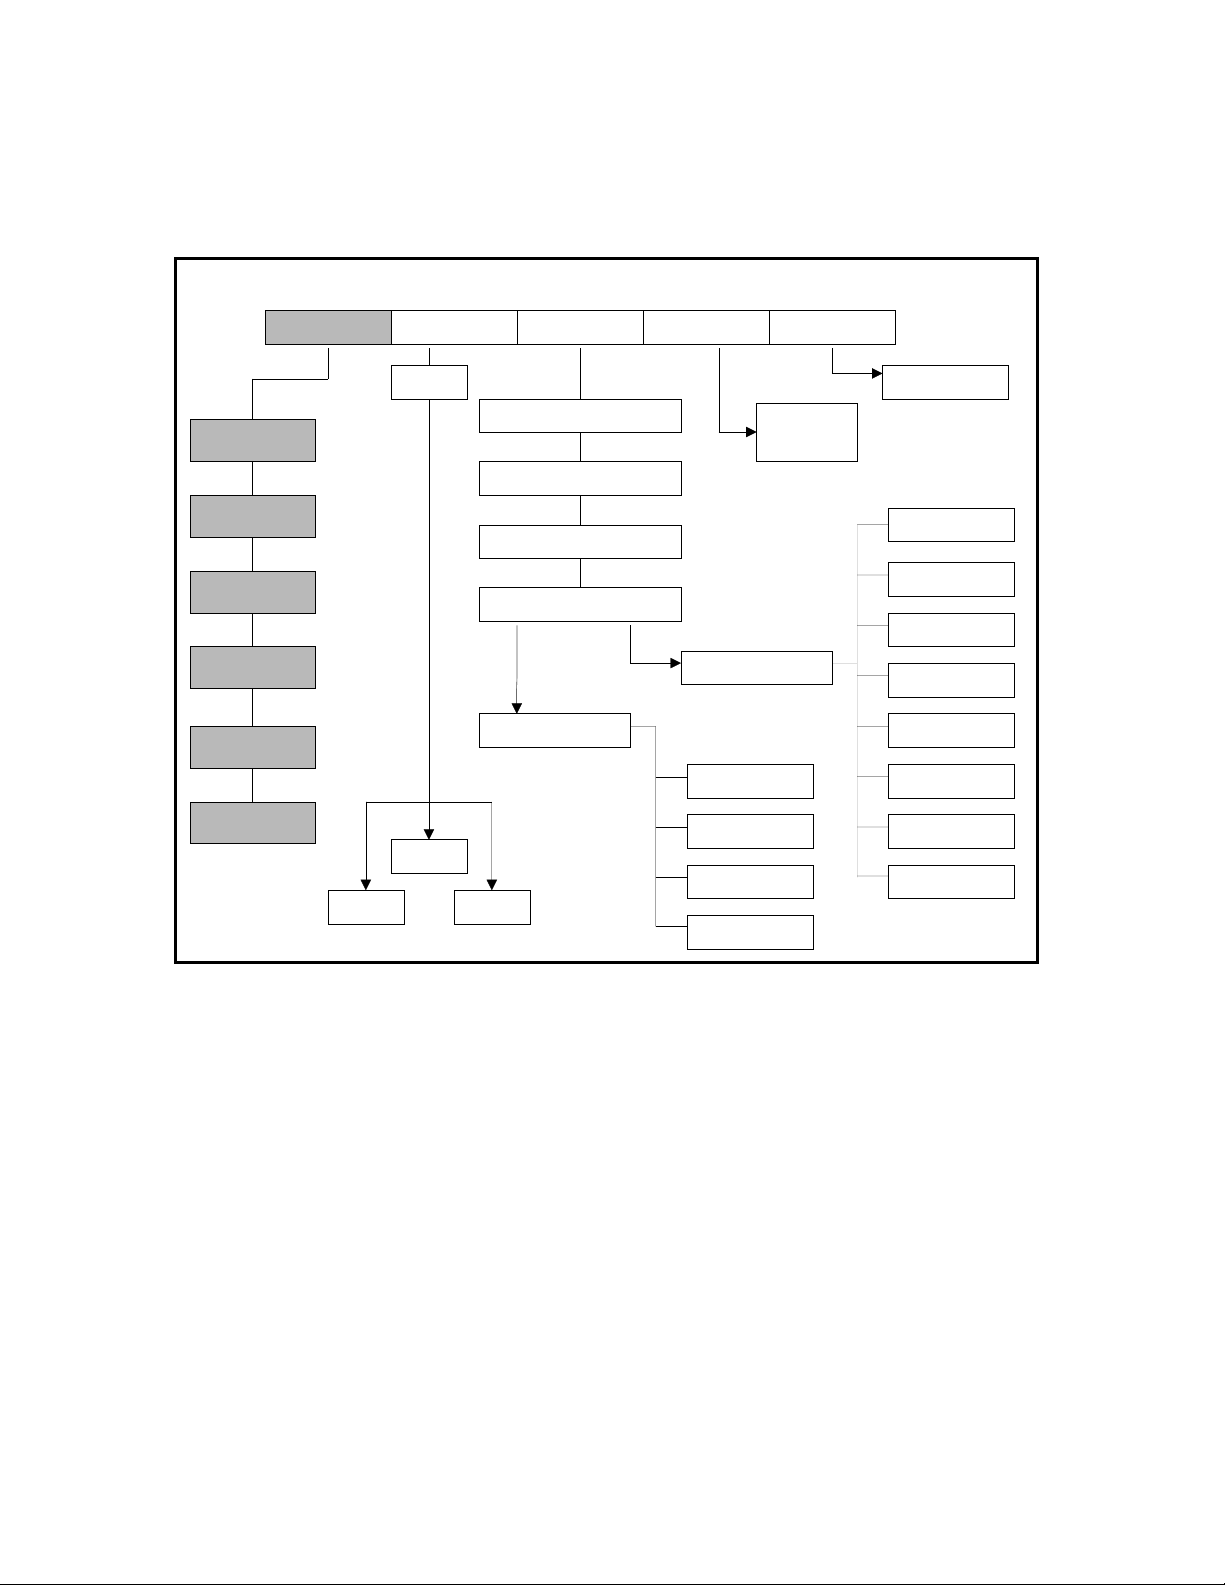
Use the arrow keys to move the cursor and hig hlig ht menu options. Press Enter to select a
highlighted option. Press
Esc to cancel an entry. A PC6000 Menu Flow Chart is shown below.
This menu chart should help you to locate submenus m ore easily .
6820
1. Run
2. Calibrate
3. System
4. Report
5. Sensor
6. Advanced
PC6000 MENU FLOW C HART
Sonde File Setup Real-Time Exit
Filename
View
Display Format
Computer Connection
Computer Display
More Setup
Advanced Setup
Advanced Setup
SystemModify
Data Capture
Global Switch
User-defined
Readings
Displayed
Data Fi l e s
Export
5/96
Return to DOS
Parser
Site Name
Instrument ID
Filename
Autoconfigure
X-axis Time
Parameter/Plot
Beep Notify
2-17
Page 28
To start, highlight Setup then press Enter. Check the default setup values.
---DISPLAY -FORMATS---------COMPUTER-CONNECTIONS------------Date format: MDY Com m port: 1
Date separator: / Baud rate 9600
Time separator: : Printer Port 1
Radix mark: . Printer type HP LaserJet laser
-------MORE-SETUP-------------COMPUTER-DISPLAY---------------------Data capture setup... Menu colors: User-defined menu colors
Advanced Setup... Plot colors: User-defined plot colors
Graphics mode: Automatic selection hi-res
Comm port:
Select this option to enter the number of the Comm port (1 or 2) to which the 6000
Be sure to press
Enter to confirm a new entry. If the default setting is correct there is no need to
UPG is connected.
change it.
Baud rate:
Select this option to check the baud rate. If the baud rate is not set to 9600, set it to 9600. To set
the baud rate, highlight it and press
from the list and press
Enter. NOTE: The Model 6000UPG default baud rate is 9600.
Enter. A list of possible baud rates will appear. Select 9600
Printer port:
Select this option to specify the parallel port (LPT1, LPT2 or LPT3) to which y our printer is
connected. If no printer is connected select LPT1. Press
Enter after making your selection.
Printer type:
Select this option to select the type of printer connected to your computer sy stem . F rom the list,
choose the selection that best describes your printer. If your printer is not on the list, refer to your
printer's instruction manual to determine w hat ty pe of printer your printer emulates. Press
Enter
after making your selection.
2-18
Page 29
Menu colors:
Select this option to choose a color scheme for the PC6000 menus. As you m ov e the cursor
between color schemes, the screen changes to display y our selection. Press
Enter to confirm a
selection.
Plot colors:
Select this option to choose a color scheme for the PC6000 plots. As you mov e the cursor between
color schemes, the screen changes to display your selection. Press
Enter to confirm a selection.
The other setup functions are described in Section 5.5, but usually are not necessary for a quick
start into 6000
UPG operations. Press Esc to exit the setup menu. The cursor will return to the
menu bar.
ECOWATCH FOR WINDOWS
No setup is required for this program after installation. Use the “Help” comm and in the top menu
bar to learn about the program.
2.6 SONDE SOFTWARE SETUP
There are two sets of software at work within the 6000UPG system. One is resident in your PC
(called PC6000) and was provided on floppy disk with this instruction manual. The other software
is resident in the sonde itself. When you select
software, begins direct communication with the sonde based software via standard VT100 term inal
emulation.
Using the arrow keys, highlight and select
will be displayed.
========================================
Main
----------------------------------------
1. Run 5. System setup
2. Calibrate 6. Report setup
3. File 7. Sensor setup
4. Status 8. Diagnostics
Select option (0 for previous menu):
Sonde from the PC6000 top-line menu, the PC based
Sonde from the top-line menu. The sonde Main m enu
2-19
Page 30

NOTE: If no menu is displayed and a # appears at the top of the computer screen, follow the
instructions on the screen and type
displayed, press
Esc until the Main menu appears. If you cannot get to the Main menu, check to be
MENU and press Enter. If a menu other than the Main menu is
sure the cable is properly connected, the batteries are properly installed and the Comm port and
other software parameters are set up as described in Section 2.4, or see Section 8, Troubleshooting.
NOTE: The sonde software is menu driven. Select a function by typing its corresponding number.
It is not necessary to press
Enter after a number selection. Use the 0 or Esc key to return to a
previous menu.
At the Main menu, select
========================================
System-setup
----------------------------------------
1. Date & time 4. Batteries
2. Radix 5. Instrument ID
3. Communication 6. Page Length
Select option (0 for previous menu):
1. Date & time
5. System setup. The System setup menu w ill be display ed.
Select this option to choose the date format and set the correct date and time. Select the format y o u
desire; month/day/year, day/m onth/year or year/month/day. Next enter the date and time as
prompted on the screen. Be sure to enter the hour, minute, and second values for the Time. The
software will reject a Time entered with hour and minute entries only. Press Enter after each entry.
NOTE: For convenience any non-numeric key (such as space) in addition to / and : will separate
the fields in the date and time entries.
4. Instrument ID
Select this option to identify your instrument with its serial number (located on the back of the
sonde) or any other name or number y ou wish, up to 31 characters. Then press
Enter.
Other options in the System setup menu are explained in detail in Section 4. Press Esc to backup to
the Main menu.
2-20
Page 31

========================================
Main
----------------------------------------
1. Run 5. System setup
2. Calibrate 6. Report setup
3. File 7. Sensor setup
4. Status 8. Diagnostics
Select option (0 for previous menu):
You must now enable (or activate) the sensors which have been installed in your 6000UPG sonde.
Select
7. -Sensor setup
========================================
Sensor-setup
---------------------------------------1-(*) Temp 7-( ) ISE2 ORP
2-(*) Cond 8-( ) ISE2 NH4+
3-(*) DO 9-( ) ISE2 NO34-( ) Depth A-(*) Batt
5-(*) ISE1 pH B-( ) Turb
6-( ) ISE1 mV C-( ) TDG
Select option (0 for previous menu):
Enter the corresponding number to enable the sensor(s) that are installed on the sonde. The
activated selection is indicated by the asterisk.
You will see reference to TDG (total dissolved gas) in the Sensor setup menu. This is for
possible future upgrade and is not currently available for your 6000
UPG.
NOTE: The sensors that you have installed in your sonde may not include all that are shown
“enabled” in the above screen. The display is only an example.
After all installed sensors have been enabled, press
0 or Esc to return to the Main Menu.
========================================
Main
----------------------------------------
1. Run 5. System setup
2. Calibrate 6. Report setup
3. File 7. Sensor setup
4. Status 8. Diagnostics
Select option (0 for previous menu):
Even if all of your installed sensors are enabled, the measurements for that sensor may not
appear on your display. In order for a specific parameter to be displayed:
1. The sensor must first be enabled (turned on).
2-21
Page 32

2. That parameter must be activated in the Report section of the Main Menu.
Select
4-Report from the Main sonde menu. The Report Setup menu will be displayed.
========================================
Report-setup
---------------------------------------1-(*) Date G-(*) Sal ppt
2-(*) Time H-(*) DO %
3-(*) Temp C I-(*) DO mg/L
4-( ) Temp F J-( ) Depth ft
5-( ) Temp K K-( ) Depth m
6-(*) SpCond mS/cm L-(*) pH
7-( ) SpCond uS/cm M-( ) pH mV
8-( ) Cond mS/cm N-( ) ORP mV
9-( ) Cond uS/cm O-( ) NH4+ mg-N/L
A-( ) Resist MOhm*cm P-( ) NH3 mg-N/L
B-( ) Resist KOhm*cm Q-( ) NO3- mg-N/L
C-( ) Resist Ohm*cm R-( ) Turb NTU
D-( ) TDS g/L S-( ) TDG mm-Hg
E-( ) TDS kg/L T-(*) Batt V
F-( ) TDS mg/L
Select option (0 for previous menu):
The asterisk (*) following a given number or letter indicates that the parameter will appear on all
outputs and reports.
To turn a parameter on or off, type the number or letter of that parameter at
the cursor. Continue this process until all parameters are either on or off as you wish.
After configuring your display with the desired parameters, press
0 or Esc to return to the Main
Menu.
See Section 4 for a more detailed description of the sonde menus. The sonde software is now set
up and ready to calibrate and run. Proceed to Section 3.
2-22
Page 33

3. BASIC OPERATION
In the previous Section, you learned how to install probes and set up the PC6000, Ecowatch for
Windows, and 6000
Model 6000
6000
UPG with a 610-series display/logg er, refer to the operations manual for the 610 to obtain
UPG and how to view your data on a computer display. I f y ou choose to use y our
similar instructions to those provided below.
3.1 GETTING READY TO CALIBRATE
WARNING: Reagents used to calibrate and check this instrument may be haz ardous to y our health.
Refer to Appendix A for health and safety information.
Before you begin the calibration procedures outlined below, you m ay find it helpful to follow some
or all of these calibration tips.
1. You will need one or more containers to hold calibration standards. YSI prov ides a calibration
cup, but a standard 800 mL beaker also works well.
UPG sonde software. In this section, you will learn how to calibrate and run the
2. If you use the 6000
UPG Transport Cup for dissolved oxygen calibration, mak e certain to loosen
the seal to allow pressure equilibration before DO calibration (water-saturated air calibration).
3. For maximum accuracy, the use of a small amount of previously -used calibration solutions to
prerinse the sonde is suggested. You may wish to sav e old calibration standards for this purpose.
4. Fill a large bucket with ambient temperature water for rinsing the sonde between calibration
solutions.
5. Have several clean, absorbent paper towels or cotton cloths available to dry the sonde between
rinses and calibration solutions. It is important to remov e as much residual liquid as possible from
the sonde after each rinse. Shake the sonde to remove excess rinse water from the inside of the
guard. Then dry the outside of the sonde and probe guard. Drying the sonde and probes in this way
reduces carry-over contam ination of calibrator solutions and increases the accuracy of the
calibration, particularly when using lower conductivity calibration standards.
6. It is not necessary to remov e the probe g uard to rinse and dry the probes between calibration
solutions. The inaccuracy resulting from simp ly rinsing the probe compartment and drying the
outside of the sonde is minimal.
3-1
Page 34

3.2 CALIBRATION PROCEDURES
WARNING: Calibration reagents may be hazardous to your health. Refer to Appendix A for
health and safety information.
A calibration cup is supplied with the Model 6000
UPG. Because the calibration cup fits over the
outside of the sonde probe guard, it is not recommended or necessary to rem o v e the probe g uard to
calibrate the sensors. Follow the procedures below to calibrate the sensors. Temperature does not
require calibration and is, therefore, not included in the Calibrate menu. ORP calibration is
required only infrequently and is discussed in Section 4.2. For more detailed calibration
procedures, which can be used to enhance the accuracy of some measurements, see Section 4.2.
The following sequence is provided as an EXAMPLE of the process the user will utilize to
calibrate all sensors. Although conductivity was chosen for this general example, more detailed
instructions for the calibration of the conductivity sensor are found in the next section.
From the sonde Main menu select 2. Calibrate.
========================================
Main
----------------------------------------
1. Run 5. System setup
2. Calibrate 6. Report setup
3. File 7. Sensor setup
4. Status 8. Diagnostics
Select option (0 for previous menu):
The Calibrate menu will be displayed.
========================================
Calibrate
----------------------------------------
1. Conductivity 6. pH
2. DO% 7. Ammonium
3. DO mg/L 8. Nitrate
4. Depth 9. Turbidity
5. ORP A. TDG
Select option (0 for previous menu):
Selection of any of the parameters from the Calibrate menu listing will require the user to input a
numerical value and then press Enter. For example, for calibration of the conductivity sensor, y ou
should select 1. Conductivity from the Calibrate menu and then 1. SpCond from the Cond
Calibration menu. The following display will be show n during the calibration sequence.
Enter SpCond in mS/cm (10):
3-2
Page 35

The number in parentheses is the default value of this parameter and will be used in the calibration
if only Enter is pressed without typing in another value. Remember that this entry should reflect
the actual value of your solution and that entry of values other than the default m ay be necessary.
Similar prompts will be display ed for calibration of all param eters.
========================================================
Date Time Temp SpCond Sal DO pH Batt
MM/DD/YY hh:mm:ss C mS/cm ppt % V
-------------------------------------------------------To calibrate, press <Enter> when the readings are stable.
05/22/96 09:53:43 27.73 5.05 2.72 54.9 8.73 12.2
After the calibration value is input (or the default accepted) and Enter is pressed, a real-time
display similar to that shown above will appear on the screen. N ote that all parameters which have
been enabled will appear, not just the one being calibrated at the moment. You should carefully
observe the stabilization of the readings of the parameter w hich is being calibrated and, w hen the
readings are stable for approximately 30 seconds, press Enter to accept the calibration. The
acceptance will be acknowledged and calibration of the chosen sensor is complete. Then, as
instructed, Hit any key to return to the Calibrate menu.
NOTE: If an ERROR message appears, begin the calibration procedure again. Be certain that the
value you enter for the calibration standard is correct. Also see Section 8, Troubleshooting for
more information on error messag es. If error messages continue to be observed during calibration,
contact YSI Customer Service (see Appendix C for contact inform ation).
CAUTION: With rare exception, be certain to immerse the entire array of sensors in solution
standards for calibration of all parameters. Most calibrations require readings not only from the
sensor being calibrated but also from the temperature sensor. Tem perature compensation is an
important criterion in nearly all of the calibration procedures. In addition to temperature, the
conductivity reading of the standard is required in several calibration routines and the reference
electrode of the pH probe must be in the same solution as the nitrate and ammonium sensors for
proper function.
Specific start-up calibration procedures for all sensors which commonly require calibration are
provided in the following paragraphs of this section. Remember that these are basic protocols
designed to get the user up and running with regard to the 6000
UPG. The more-detailed discussion
of sensor calibration found in Section 4.2 should be examined prior to use of the instrument in the
field.
NOTE: If the particular sensor listed is not installed in your sonde, proceed to the next sensor until
the calibration protocol is complete.
3-3
Page 36

IMPORTANT MESSAGE!
WHAT IF THERE IS NO RESPONSE TO A KEYSTROKE?
To save power, the 6000UPG will power down automatically if no interaction from the keyboard
occurs for approximately 30 seconds. When the software is in this “sleep” mode, the first
subsequent keystroke simply “wak es it up” and has no visible effect on the display. The next
keystroke after the unit is “awakened” w ill be input to the softw are in the intended m anner. Thus,
if you press a key after the 6000UPG has been inactive for some time and nothing seems to happen,
press the key again.
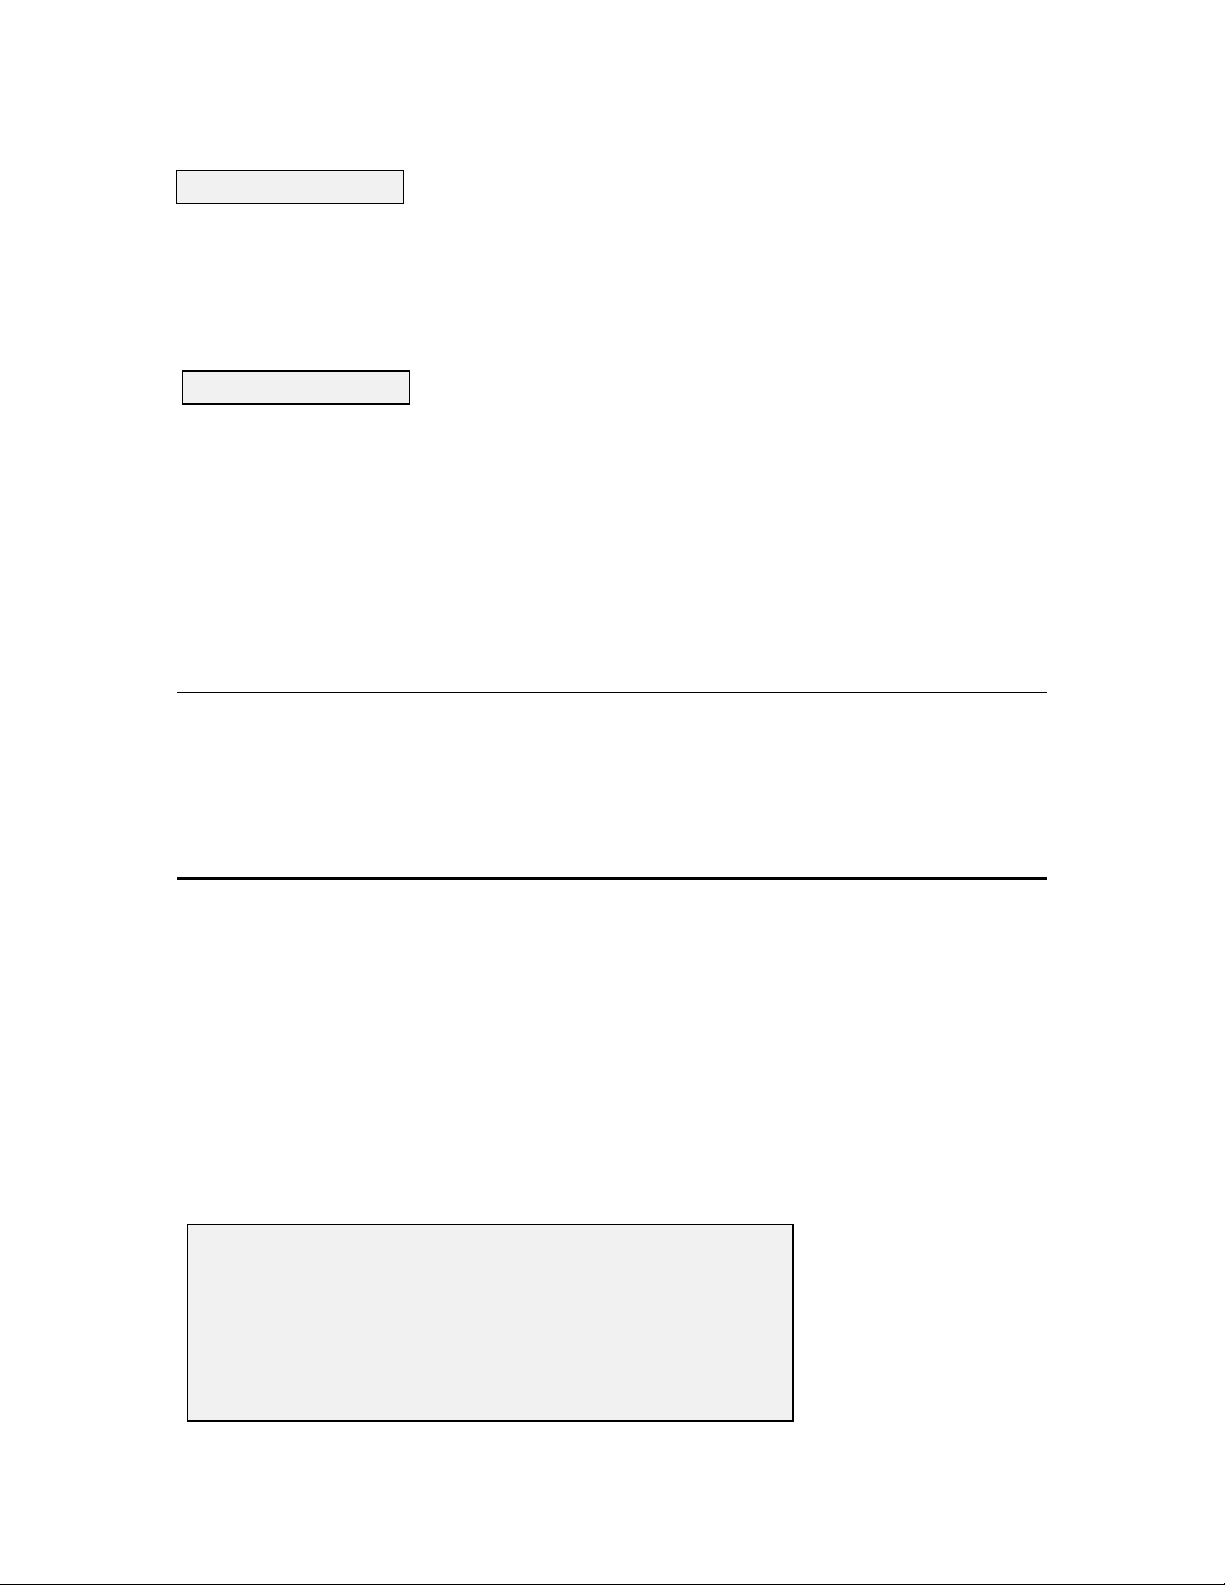
CONDUCTIVITY
NOTE: This procedure calibrates not only conductivity, but also specific conductance, salinity,
and total dissolved solids.
Place approximately 500 mL of conductiv ity standard in a clean and dry calibration cup.
The conductivity standard you choose should be within the same conductiv ity rang e as the water
you are preparing to sample. However, we do not recommend using standards less than 1 mS/cm.
For example:
❏ For fresh water choose a 1 mS/cm conductivity standard.
❏ For brackish water choose a 10 mS/cm conductiv ity standard.
❏ For sea water choose a 50 mS/cm conductivity standard.
Caution: Before proceeding insure that the sensor is as dry as possible. Ideally, rinse the
conductivity sensor with a small am ount of standard that can be discarded. Be certain that y ou
avoid cross contamination of standard solutions with other solutions. Make certain that there are no
salt deposits around the oxygen and pH/ORP probes, particularly if you are em ploy ing standards of
low conductivity.
Without removing the probe guard, carefully immerse the probe end of the sonde into the solution.
Gently rotate and/or move the sonde up and down to rem ov e any bubbles from the conductivity cell.
The probe must be completely im mersed past its vent hole.
Allow at least one minute for temperature equilibration before proceeding .
From the Calibrate menu, select 1. Conductivity to access the Conductivity calibration procedure
and then 1. SpCond to access the specific conductance calibration procedure. Enter the calibration
value of the standard you are using (mS/cm at 25 C) and press Enter. The current values of all
enabled sensors will appear on the screen and will change with time as they stabiliz e.
3-4
Page 37

Observe the readings under Specific Conductance or Conductivity and when they show no
significant change for approximately 30 seconds, press Enter. The screen will indicate that the
calibration has been accepted and prompt you to Hit any key to return to the Calibrate menu.
Rinse the sonde in tap or purified water and dry the sonde.
DISSOLVED OXYGEN
Place approximately 1/8 inch (3 mm ) of w ater or a wet spong e in the bottom of the Calibration Cup
or Transport Cup. Place the probe end of the sonde into the cup. Make certain that the DO and the
temperature probes are not immersed in the water. Wait approximately 10 minutes for the air in the
calibration cup to become water saturated and for the temperatures of the thermistor and the oxy g en
probe to equilibrate.
CAUTION: If the Transport Cup is used, make certain that the cup is vented to the atmosphere by
loosening the vent screw.
From the Calibrate menu, select 2. DO% to access the D O % calibration procedure.
Enter the current barometric pressure in mm of Hg . (Inches of Hg x 25.4 = mm Hg ).
NOTE: Remember that barometer readings which appear in meteorological reports are generally
corrected to sea level and are not useful for your calibration procedure unless they are
uncorrected.
Press Enter and the computer will indicate that the calibration procedure is in progress.
Calibration will AUTOMATICALLY occur after warmup interval.
Warming Sensors: 27
After approximately 1 minute, the calibration will be complete. Press any key, as instructed, and
the screen will display the percent saturation value which corresponds to your local barometric
pressure input. For example, if your barometer reads 742 m m Hg, the screen will display 97.6 %
(742/760) at this point.
After the calibration is complete, press any key to return to the Calibrate menu.
NOTE: Calibration of dissolved oxygen in the DO % procedure also results in calibration of the
DO mg/L mode and vice v ersa.
Rinse the sonde in water and dry the sonde.
3-5
Page 38

DEPTH
Following the DO calibration, leave the sonde in water-saturated air. Make certain that the sonde is
not submerged in water for the depth calibration.
From the Calibrate menu, select 3. Depth to access the depth calibration procedure. Input 0.00 or
some known sensor offset in feet (the depth sensor is about 0.46 feet above the bottom of the probe
compartment). Press Enter and monitor the stabilization of the depth reading s w ith tim e. When no
significant change occurs for approximately 30 seconds, press Enter to confirm the calibration and
zero the sensor with regard to current barometric pressure. Then, as instructed, Hit any key to
return to the Calibrate menu.
pH 2-POINT
Place approximately 400 mL of pH 7 buffer in a clean calibration cup. Carefully immerse the
probe end of the sonde into the solution.
Allow at least 1 minute for temperature equilibration before proceeding .
From the Calibrate menu, select 6. pH to access the pH calibration choices and then 2. 2-Point.
Press Enter and input the value of the buffer (or accept the default) at the prompt. Press Enter and
the current values of all enabled sensors will appear on the screen and will change with tim e as they
stabilize in the solution. Observe the readings under pH and when they show no significant change
for approximately 30 seconds, press Enter. The display will indicate that the calibration is
accepted.
After the pH 7 calibration is complete, Hit any key, as instructed on the screen, to continue.
Rinse the sonde in water and dry the sonde before proceeding to next step.
Place approximately 400 mL of a second pH buffer solution in a clean calibration cup. The second
buffer might be pH 4 if the sample is expected to be acidic or pH 10 if the sam ple is expected to be
basic. Carefully imm erse the probe end of the sonde into the solution.
Allow at least 1 minute for temperature equilibration before proceeding .
Press Enter and input the value of the second buffer at the prompt. Press Enter and the current
values of all enabled sensors will appear on the screen and will change with tim e as they stabiliz e in
the solution. Observe the readings under pH and when they show no significant chang e for
approximately 30 seconds, press Enter. After the second value calibration is complete, Hit any
key, as instructed on the screen, to return to the Calibrate m enu.
Rinse the sonde in water and dry the sonde.
Thoroughly rinse and dry the calibration cups for future use.
3-6
Page 39

AMMONIUM (NH
+
) and NITRATE (NO
4
-
) 3-POINT
3
WARNING: AMMONIUM AND NITRATE SENSORS CAN ONLY BE USED AT DEPTHS
OF LESS THAN 50 FEET (15 METERS). USE OF T HE SENSORS AT GREAT ER DEPT HS IS
LIKELY TO PERMANENTLY DAMAGE THE SENSOR MEMBRANE.
NOTE: The calibration procedures for ammonium and nitrate are sim ilar to pH except for the
reagents in the calibration solutions. Suggested values for calibrants are 1 and 100 m g /L of either
ammonium-nitrogen (NH
-N) or nitrate-nitrogen (NO3-N).
4
NOTE: The following procedure requires one 500 mL portion of 100 mg/L calibrant and two
500
mL portions of 1 mg/L calibrant. The 100 m g /l solution and one of the 1 mg/L solutions should be
at ambient temperature. The other 1 mg /L solution should be chilled to less than 10 C° prior to
beginning the procedure.
CAUTION: Proper calibration of the ammonium and nitrate sensors requires that the pH,
conductivity, and temperature probes also be im mersed in the same solution as the sensor being
calibrated. Therefore, do not remove the probe guard and attem pt to immerse individual sensors in
different vessels. For the ammonium and nitrate sensors to function at all, there must be solution
contact between the pH and the ammonium or nitrate probe.
Place 500 mL of 100 mg/L standard into a clean calibration cup. Carefully immerse the probe end
of the sonde into the solution.
Allow at least 1 minute for temperature equilibration before proceeding .
Select 7. Ammonium or 8. Nitrate to access the appropriate calibration choices. Then select
3. 3-Point. Press Enter and input the concentration value of the standard as requested or accept
the default. Press Enter and the current values of all enabled sensors will appear on the screen and
will change with time as they stabiliz e in the solution. O bserv e the readings under NH4+ or NO3- .
When they show no significant change for approximately 30 seconds, press Enter.
After the second value calibration is complete, as instructed, Hit any key to continue.
Rinse the sonde in water and dry the sonde prior to the next step.
Place 500 mL of the ambient temp erature 1 m g /L standard solution in a clean calibration cup.
Carefully immerse the probe end of the sonde into the solution.
Allow at least 1 minute for temperature equilibration before proceeding .
Press Enter and input the concentration value of the standard as requested or accept the default.
Press Enter and the current values of all enabled sensors will appear on the screen and will change
with time as they stabilize in the solution. Observ e the readings under NH4+ or NO3- and w hen
they have show no significant change for approxim ately 30 seconds, press Enter.
After the second value calibration is complete, as instructed, Hit any key to continue.
3-7
Page 40

Place 500 mL of the chilled 1 mg/L standard solution in a clean calibration cup. Carefully immerse
the probe end of the sonde into the solution.
Allow at least 5 minutes for temperature equilibration before proceeding. Press Enter and input the
concentration value of the standard as requested or accept the default. Press Enter and the current
values of all enabled sensors will appear on the screen and will change with tim e as they stabiliz e in
the solution. Observe the readings under NH4+ or NO3- and when they show no sig nificant chang e
for approximately 30 seconds, press Enter.
After the third value calibration is complete, Hit any key to return to the Calibrate menu.
Thoroughly rinse and dry the calibration cups for future use.
CALIBRATION TIP: AVOIDING DRIFT DURING CALIBRATION OF THE NH4+ AND
NO3- PROBES AFTER pH CALIBRATION. Exposure to the high ionic content of pH buffers
can cause a significant, but temporary, drift in either the ammonium or the nitrate probe.
Therefore, when calibrating the nitrate or ammonium sensor, we recommend that you use one of
the following methods to minimize errors in the subsequent readings:
❏ Calibrate pH first, immersing all of the probes in the pH buffers. After calibrating pH, place
the probes in 100 mg/L nitrate or ammonium standard and monitor the reading. Usually, the
reading starts low and may take as long as 30 minutes to reach a stable value. When it does,
proceed with the calibration.
❏ When calibrating pH, remove the probe guard and immerse only the pH and temperature
probes in the buffers. You can then calibrate nitrate or ammonium immediately after pH
calibration.
TURBIDITY 2-POINT
WARNING: THE TURBIDITY SENSOR CAN ONLY BE USED AT DEPTHS OF LESS THAN
200 FEET (61 METERS). USE OF THE PROBE AT GREATER DEPTHS IS LIKELY TO
PERMANENTLY DAMAGE THE SENSOR.
Select 9. Turbidity from the Calibrate Menu and then 2. 2-Point.
NOTE: One standard must be 0 NTU, and this standard must be calibrated first.
To begin the calibration immerse the sonde in approximately 300 mL of 0 NTU standard (clear
deionized, distilled, or tap water), as instructed, and press Enter. Input the value 0.00 NTU at the
prompt, and press Enter. After calibration of the mechanical wiper speed, the screen will display
real-time readings wh ich will allow y ou to determine when the turbidity values have stabiliz ed. If
the readings appear unusually high or low or are unstable, there are probably bubbles on the optical
surface. Activate the mechanical wiper by pressing the “3” k ey to remove the bubbles. After
stable readings are observed for approximately 40 seconds, press Enter to “confirm” the first
calibration and then, as instructed, Hit any key to continue.
3-8
Page 41

Dry the sonde and probes carefully and then place the sonde in approximately 300 mL of the second
turbidity standard (100 NTU is suggested). Input the correct turbidity value in NTU, press Enter,
and view the stabilization of the values on the screen in real-time. As described above, if the
readings appear unusually high or low or are unstable, activate the wiper to rem ove bubbles and be
sure to wait at least 40 seconds before confirming the calibration. After the readings have
stabilized, press Enter to “confirm” the calibration and then, as instructed, Hit any key to return to
the Calibrate menu.
Thoroughly rinse and dry the calibration cups for future use.
CAUTION: If the turbidity system has been set up as outlined in Section 2 of the manual, sig n al
averaging will be taking place during calibration and the response time of the sensor will be slightly
slower than that of the other sensors. This effect makes it critical to observe at least 40 seconds of
stable readings prior to “confirming” the calibration. Be particularly careful to tak e y our time
during the calibration of the turbidity system.
3.3 DISCRETE SAMPLING
To start taking readings with your 6000UPG, use the Discrete sampling m ode to turn on or turn off
the continuous sampling function. Data will be displayed to the screen and optionally saved to
internal flash disk memory or to a computer or logger display.
Select 1. Run from the sonde Main menu. The Run menu w ill be display ed.
========================================
Run
----------------------------------------
1. Discrete sample
2. Conditional Sample
3. Unattended sample
Select option (0 for previous menu):
Select 1. Discrete sample from the Run menu. The Run Discrete sam ple menu will be displayed.
========================================
Discrete-sample
----------------------------------------
1. Start sample
2. Site description
3. Sample interval
4. Close file
5. Set Auto-stop timer
Select option (0 for previous menu):
3-9
Page 42

Select the different functions in this menu to become fam iliar with the D iscrete sam p ling m ode.
Remember to use Esc or 0 to cancel functions or to back up to the previous display.
1. Start discrete sample
Select this option to start discrete sampling. After the initial sam pling time interval has passed, data
will be displayed on the screen.
A single line of data can be logged to flash disk mem ory by pressing 1. (screen prompt reads
'1-LOG last sample').
A set of data can be logged to flash disk by pressing 2. (screen prom pt reads '2-LOG ON/OFF'). A
message will be displayed that LOG is on, turn it off by selecting 2.
If installed, the turbidity probe face can be cleaned by pressing 3 (screen prompt reads ‘3-Clean
optics’).
Select Esc to exit discrete sampling.
2. Site description
Select this option to name the site of the sample if you intend to log data w hile discrete sampling.
Up to 31 characters can be entered, but only the first 8 will be used in naming the file after transfer
to a computer for analysis. The site description you enter will be display ed w ith the file nam e to
help you identify the file later.
3. Sample interval
Select this option to set the interval which will pass between sam ples. Enter the desired interval in
seconds. The default sample interval is 4 seconds.
4. Close file
Select this option to close any discrete sample file. A file is opened autom atically w henev er data is
logged to flash disk memory. When you exit discrete sample mode, you can close the file using this
function or you can leave it open and log to it later.
5. Set Auto-stop timer
3-10
Page 43

Select this option to set up a timer to automatically turn off discrete sampling. If you beg in a
discrete sample and forget to turn it off later, battery life will be g reatly reduced. F or this reason,
the Auto-stop timer can be set up to automatically turn off any activ e discrete sample if it has been
left on for a specified period of time. Simply ty pe in what y ou feel is an appropriate amount of
minutes, and the program will turn off discrete sampling after that many minutes have passed.
Setting the timer to 0 disables the Auto-stop timer and discrete sampling will never be stopped by
the Auto-stop timer.
After you have become fam iliar w ith these selections, press 1-Start Discrete Sample and observe
the data appear on your computer screen. The general form at of the display w ill be as follows,
although the detail will depend on which parameters which y ou hav e activated.
======================================================================
Date Time Temp SpCond Sal DO DO pH Turb Batt
MM/DD/YY hh:mm:ss C uS/cm ppt % mg/L NTU V
----------------------------------------------------------------------
*** 1-LOG last sample 2-LOG ON/OFF, 3-Clean optics ***
06/17/96 09:20:44 27.73 995 0.49 50.9 4.42 7.42 0.3 12.2
06/17/96 09:20:48 27.73 995 0.49 48.5 4.21 7.42 0.4 12.2
06/17/96 09:20:52 27.73 995 0.49 47.2 4.09 7.42 0.4 12.2
06/17/96 09:20:56 27.73 995 0.49 46.3 4.02 7.42 0.4 12.3
06/17/96 09:21:00 27.73 995 0.49 45.7 3.96 7.42 0.4 12.2
06/17/96 09:21:04 27.73 995 0.49 45.2 3.92 7.42 0.4 12.2
06/17/96 09:21:08 27.73 995 0.49 44.8 3.81 7.42 0.4 12.2
06/17/96 09:21:12 27.73 995 0.49 44.9 3.87 7.42 0.4 12.2
To stop the Discrete Sample mode, press Esc or ‘0’ until the sonde Main m enu is displayed.
3-11
Page 44

3.4 UNATTENDED SAMPLING
The Unattended Sampling Mode is designed to log reading s of all user-defined parameters at
intervals you specify. The 6000
Throughout the deployment, data is stored to internal flash disk m emory. This data can be
uploaded to the PC6000 software upon completion of the study, or at anytim e during the study
without stopping the logging.
Select 1. Run from the sonde Main menu. The Run menu w ill be display ed.
========================================
Run
----------------------------------------
1. Discrete sample
2. Conditional Sample
3. Unattended sample
Select option (0 for previous menu):
Select 3. Unattended sample from the Run menu. The current time and date, all activ e sensors,
battery voltage, and free flash disk space w ill be display ed.
UPG can be deployed for weeks at a tim e using this feature.
NOTE: If the current time and date are not correct, your unattended sampling study will not begin
or end when you desire. To correct the time and date see Section 2.5.
You will be asked to enter the following inform ation concerning the unattended sam p ling study y ou
wish to set up.
Enter starting date (XX/XX/XX):
Enter starting time (XX:XX:XX):
Enter duration in days (XX.XXX):
Enter interval in minutes (XX):
Enter site description (UNTITLE):
To gain experience, set up an unattended sampling study with the following responses to the abov e
questions:
Enter starting date: today's date
Enter starting time: current time
Enter duration in days: 1
Enter interval in minutes: 2
Enter site description: First-test
3-12
Page 45

NOTE: The time entry must include not only hours and m inutes, but also seconds. For example, if
you want to start a study at 8 AM, you must enter 8:00:00, and not just 8:00. The software will
prompt you with a beep if the time is entered incompletely.
You will be asked if all start-up inform ation is correct. C heck the information carefully and, if you
want to change something, press “N”. If all information is correct, press “Y”. The following
message will be displayed briefly :
*************************************
* INSTRUMENT IS IN UNATTENDED MODE *
*************************************
To continue the “First-test” study you have just started, disconnect the cable from the sonde and
screw on the waterproof connector cap. The unit is now ready for deployment. If the calibration
cup is installed, remove it and place the 6000
UPG in at least 6 inches of water. Leave it there for an
hour. Proceed to the next section.
CAUTION: If you intend to transfer data logged in an Unattended study to a 610-DM at a later
time, it is important back com p letely out of the sonde m enu structure before disconnecting the
cable. To do this, press the Esc key until you reach the Main menu. Then press Esc once more
and when the question “Exit menu? (Y/N)” appears, enter “Y”: The message “OK” followed by the
# sign will appear. At this point, disconnect the cable from the unit and allow data to be log g ed to
memory. Depending on the version of software in your 610, if you do not back out of the menu
structure, no communication will occur when using a 610 at a later time.
3-13
Page 46

3.5 RETRIEVING DATA FR OM THE 6000UPG
Attach the PC cable to the 6000UPG. Connect the other end of the cable to the serial port of your
computer.
Run the PC6000 software and select Sonde from the top-line menu using the arrow keys.
Sonde File Setup Real-Time Exit PC6000
NOTE: If communication with the sonde fails, first check all cable connections and the com m port
information under Setup of the PC6000 top-line menu. If all cable connectors are properly attached
and the comm port setting is correct, it is lik ely that the sonde batteries hav e been depleted. To
replace the sonde batteries see Section 2.2.
From the sonde Main menu select 1. Run.
NOTE: If the instrument is busy taking a sample it will display the following m essage:
** Instrument is busy. Please wait. **
Wait until the Run menu appears and select 3. Unattended Sample. The screen will display a
prompt asking if you wish to cancel the unattended sam p ling study .
** INSTRUMENT IS IN UNATTENDED MODE **
Start date and time : 05/31/96 11:04:08
Duration (days) : 30.000
Interval (minutes) : 2
Site description : First-test
UNATTENDED mode active. Cancel (Y/N)?
NOTE: Data can also be uploaded while an unattended sampling study is in progress.
3-14
Page 47

NOTE: If unattended sampling has already stopped autom atically because the duration y ou entered
earlier has expired, press Esc twice to return to the Main menu.
Press “Y” and Enter to stop the Unattended study.
Return to the sonde Main menu using the Esc key. Select 3. File to display the File menu.
========================================
File
----------------------------------------
1. Directory 5. Quick view file
2. Upload 6. Delete file
3. Quick Upload 7. Format FlashDisk
4. View file 8. Test FlashDisk
Select option (0 for previous menu):
Select 3. Quick upload to display the Quick-Up load m enu.
========================================
File Quick Upload
----------------------------------------
1. PC6000
2. Comma&''Delimited
3. ASCII Text
Select option (0 for previous menu):
Select 1. PC6000 to upload to the PC6000 software. A secondary menu will appear to show the
progress of the upload.
NOTE: Comma & " " Delimited and ASCI I Text formats are available for uploading data to a
spreadsheet or database program. See Section 4.3 for more details.
When the upload is complete, press Esc until the sonde Main menu returns. Press F10 to exit the
sonde menu and return to the PC6000 top-line menu.
3-15
Page 48
3.6 ANALYZING DATA WITH PC6000
Select File from the top-line menu.
Sonde Set Setup Real-Time Exit YSI PC6000
A box will appear on the screen asking you to enter a filenam e.
You may type a file nam e or press Enter for a directory. I f the directory contains more than one
data file, a list of files will be displayed. Use the arrow key s to hig hlig ht and the Enter key to select
the file of choice.
NOTE: If only one data file is resident in the directory, it will be automatically loaded.
After the selected file has been retrieved, the following menu w ill be display ed:
File
Filename: *.dat
MODIFY VIEW SYSTEM
Parameters... Header Print Report
Control Info... Report Print Plot
Scaling Info... Plot Definitions
Statistics Export
Any changes made from this menu will affect only the current file. To chang e default v alues for all
files, see Section 5.5.
Header
Select this option to view general information about the file. I nform ation displayed on the header
screen includes the file name, site description, a list of active sensors, and other details about this
file. Press Esc to return to the File menu.
3-16
Page 49

Report
Select this option to view a time-stam ped report of the data collected during the study . Press Esc to
return to the File menu.
Plot
Select this option to view a plot of the data collected during the study.
All plots and reports can be customized to your specific requirem ents. See Section 5.4 for details.
Press Esc until the top-line menu of the PC6000 program appears.
You have now completed Basic Operation, which includes both basic calibration procedures and
basic steps in taking a measurement and capturing data. There is much more inform ation in further
sections of the manual. Once you are comfortable with the basic operation, take time to explore
additional parts of the manual to learn more about this sophisticated environm ental monitoring
system.
3-17
Page 50

4. SONDE MENU
The Model 6000UPG functions are accessible through the sonde menu. The sonde menu structure
makes it simple and conv enient to select functions. This section prov ides a description of the
menus and their capabilities.
When moving between menus within the sonde software structure, use the 0 or Esc key to backup
to the previous menu. To exit menus and return to the sonde com m and line (# sig n), press 0 or
Esc until the question Exit menu (Y/N)? appears. Then type Y and press Enter. Type 'm enu' and
Enter from command line to return to a display of the Main sonde m enu.
IMPORTANT MESSAGE!
WHAT IF THERE IS NO RESPONSE TO A KEYSTROKE?
To save power, the 6000UPG will power down automatically if no interaction from the keyboard
occurs for approximately 30 seconds. When the software is in this “sleep” mode, the first
subsequent keystroke simply “wak es it up” and has no visible effect on the display. The next
keystroke after the unit is “awakened” w ill be input to the softw are in the intended m anner. Thus,
if you press a key after the 6000UPG has been inactiv e for some time and nothing seems to happen,
press the key again.
To gain experience with the sonde menus, select Sonde from the PC6000 menu bar and press
Enter. The sonde Main Menu will be displayed.
========================================
Main
----------------------------------------
1. Run 5. System setup
2. Calibrate 6. Report setup
3. File 7. Sensor setup
4. Status 8. Diagnostics
Select option (0 for previous menu):
4.1 RUN
Select 1. Run from the Main menu to choose a mode of operation, to begin taking readings or to
set up many of the parameters required for a study . There are three options on the Run m enu
(described below).
4-1
Page 51

========================================
Run
----------------------------------------
1. Discrete sample
2. Conditional Sample
3. Unattended sample
Select option (0 for previous menu):
4.1.1. DISCRETE SAMPLE
Select 1. Discrete sample from the Run menu. The Run Discrete- sample menu will be displayed.
========================================
Discrete-sample
----------------------------------------
1. Start sample
2. Site description
3. Sample interval
4. Close file
5. Set Auto-stop timer
Select option (0 for previous menu):
1. Start discrete sample
Select this option to start discrete sampling. After the initial sam pling time interval has passed, data
will be displayed on the screen. The following prompt w ill appear just below the screen header:
*** 1-LOG last sample 2-LOG ON/OFF, 3-Clean optics ***
A single line of data can be logged to flash disk m emory by pressing 1. A set of data can be logg ed
to flash disk by pressing 2. If y ou select 2 the following message will be display ed:
*** LOG is ON, hit 2 to turn it OFF, 3-Clean optics ***
If your unit has a turbidity probe installed, the optical surface will be cleaned by the wiper if y o u
select 3.
NOTE: The 3-Clean optics portion of the prompt will appear only if a turbidity probe is
installed in your unit and the sensor is enabled.
Select Esc or press 0 to exit discrete sampling.
4-2
Page 52
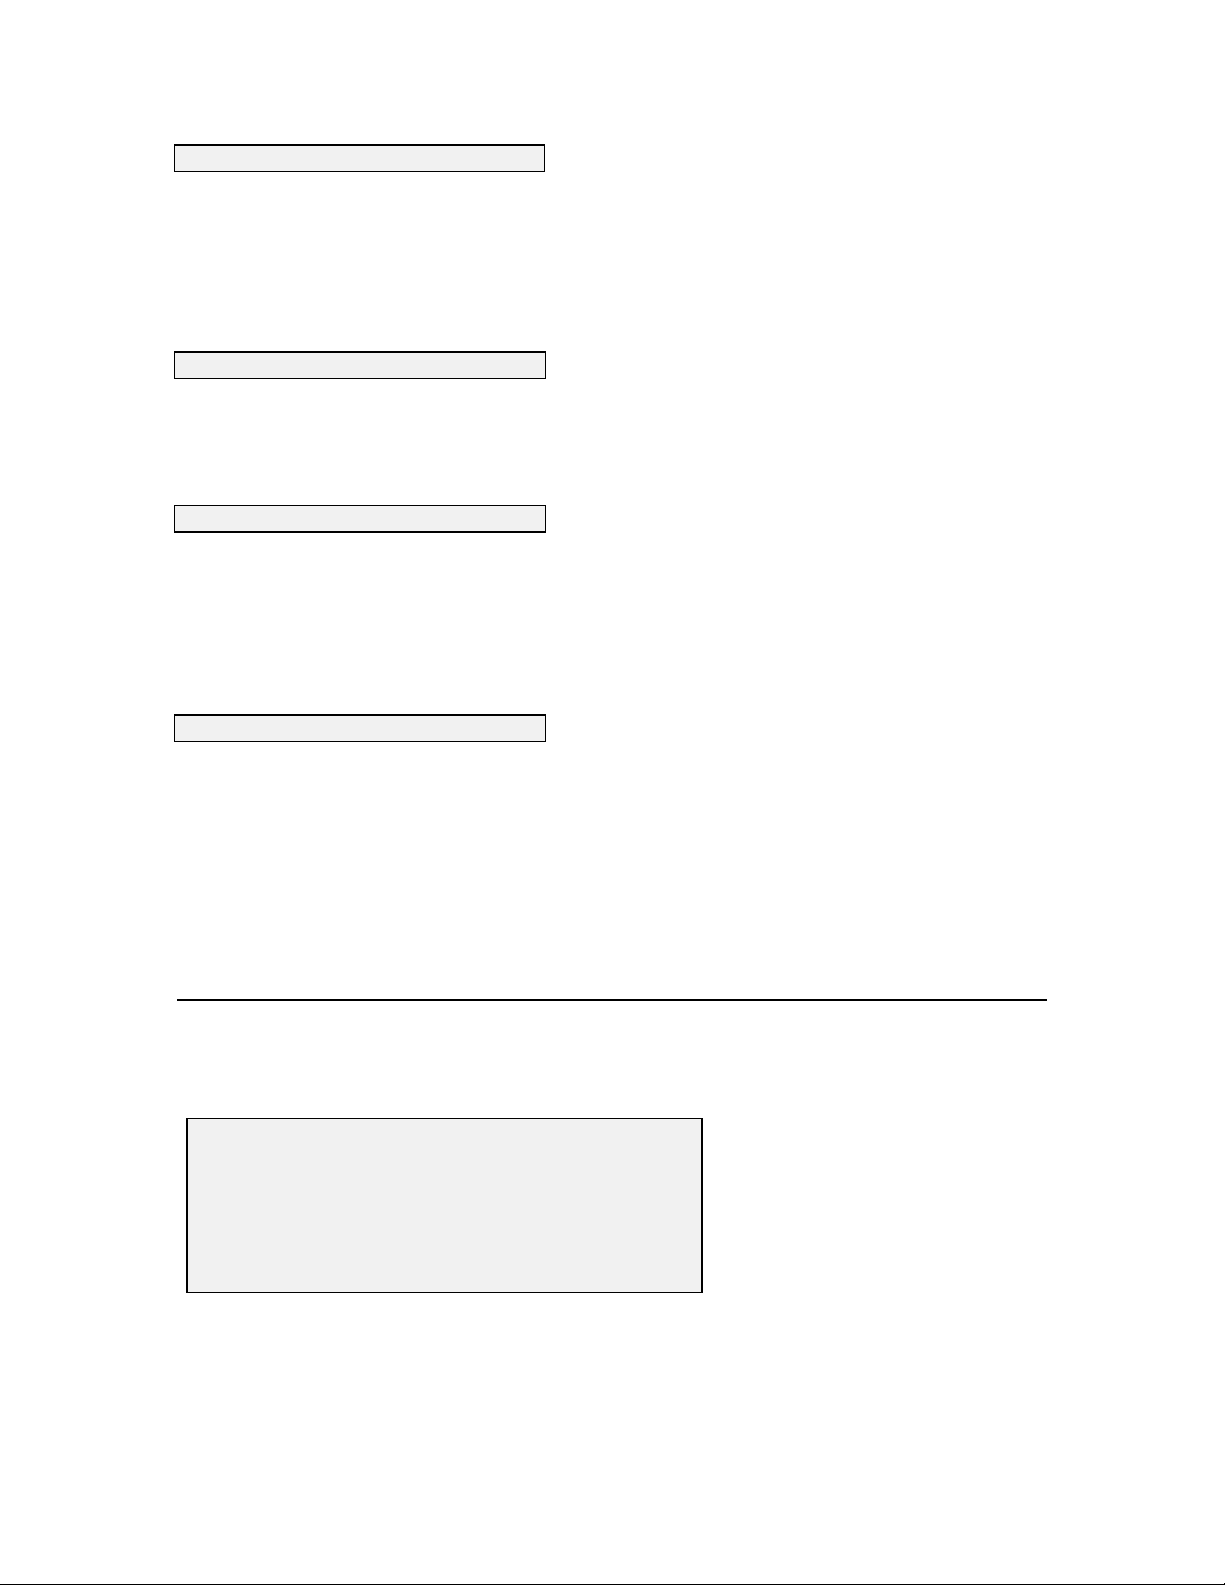
2. Site description
Select this option to name the site of the sample if you intend to log data w hile discrete sampling.
Up to 31 characters can be entered. However, remember that only the first 8 characters will be
used in naming the file after transfer to a computer or data logger. The site description you enter
will be displayed as the file name to help you identify the file later. If a discrete sampling file is
open, a new site description will not take effect until the existing file is closed.
3. Sample interval
Select this option to set up the number of seconds between samples. Enter the desired interval in
seconds. The default sample interval is 4 seconds.
4. Close file
Select this option to close any discrete sample file. A file is opened autom atically w henev er data is
logged to flash disk memory. When you exit discrete sample mode, you can close the file using this
function or you can leave it open and log to it later. In order to open a new discrete sample file, the
existing open discrete sample file must first be closed.
5. Set Auto-stop timer
Select this option to set the Auto-stop timer to turn off a discrete sample after a selected amount of
time has passed. If you beg in a discrete sam ple and forget to turn it off, battery life will be greatly
reduced. To set the timer, select and enter an appropriate amount of minutes for y our application,
and the program will turn off discrete sampling after that many minutes hav e passed. S etting the
timer to 0 disables the function and discrete sampling will never be stopped by the Auto stop timer.
4.1.2. CONDITIONAL SAMPLE
Select 2. Conditional sample from the Run menu and press Enter. The Run Conditional-sample
menu will be displayed.
========================================
Conditional-sample
----------------------------------------
1. Start sample 4. Close file
2. Site description 5. Define condition
3. Sample interval 6. External switch
Select option (0 for previous menu):
The conditional sampling feature of the 6000
UPG sets up the sonde to sample only when a
pre-specified condition exists.
4-3
Page 53

1. Start conditional sample
Select this option to begin conditional sampling. Conditional sample is much like Discrete Sample
with regard to setting site description, sample interv al, etc. The difference is that the specific
condition which you wish to act as a switch for the 6000
UPG must first be defined in 5. Define
condition. If an Unattended sample is active, a conditional sam ple can not be set up until the
unattended sample has been stopped. When conditional sampling is activ ated, the condition w ill
appear under the parameter header at the top of the screen and data will appear and be logged if the
condition is met.
2. Site Description
Select this option to name the site of the sample. The site description can have up to 31 characters,
but only 8 characters will be used when naming the file after transfer to a computer or data logger.
The site description you enter will be displayed as the file name to help y ou identify the file later.
3. Sample interval
Select this option to set up the number of seconds between samples. While the user defined
condition exists, the 6000
UPG will record data to flash disk mem o ry at the interv al y ou specify .
4. Close File
Select this option to close a conditional sample file. As soon as the first conditional sample data
has been logged to flash disk memory, the 6000
UPG will automatically open a file with the site
description you have entered. This file will remain open until it is closed using 4. Close File.
After you stop a conditional sample, you can leave the file open and log to the same file at a later
time. If you choose to log to an open file at a later tim e, y ou can continue to use the condition you
defined earlier or choose a new condition. In addition, you can also log to this file in a Discrete
Sample mode.
5. Define Condition
Select this option to set up any parameter as a conditional switch. You define a high or low level
threshold for the parameter you have selected which m ust exist before the 6000
UPG will log data to
flash disk memory . If, and only if, the condition of the sample reaches the level y ou hav e defined,
will the 6000
UPG begin logging data to flash disk m emory.
After 5 Define Condition is pressed, the following menu will be displayed.
4-4
Page 54

========================================
Set-Condition
---------------------------------------1-(*) Temp C F-( ) DO %
2-( ) Temp F G-( ) DO mg/L
3-( ) Temp K H-( ) Depth ft
4-( ) SpCond mS/cm I-( ) Depth m
5-( ) SpCond uS/cm J-( ) pH
6-( ) Cond mS/cm K-( ) pH mV
7-( ) Cond uS/cm L-( ) ORP mV
8-( ) Resist MOhm*cm M-( ) NH4+ mg-N/L
9-( ) Resist KOhm*cm N-( ) NH3 mg-N/L
A-( ) Resist Ohm*cm O-( ) NO3- mg-N/L
B-( ) TDS g/L P-( ) Turb NTU
C-( ) TDS kg/L Q-( ) TDG mm-Hg
D-( ) TDS mg/L R-( ) Batt V
E-( ) Sal ppt
Condition: Temp C > 18.000
Select option (0 for previous menu):
In this example, the instrum ent is set up to log sam p les only if the temperature of the sample is
above 18°C.
To alter the switch so that data is logged when the specific conductance is greater than 100 uS/cm
and temperature is greater than 18°C, first press 5 for SpCond m S /cm .
The prompt 0-lower or 1-higher than (1) will appear on the screen under the menu.
First type 1 (higher than) and press Enter.
The screen prompt will ask for the condition: Threshold (0.000):
Enter your new condition in uS/cm (100) and press Enter.
The screen will now display the altered menu which shows the new condition and data will be
logged only when the tem perature is g reater than 18 °C AND the specific conductance is greater
than 100 uS/cm.
4-5
Page 55

========================================
Set-Condition
---------------------------------------1-(*) Temp C F-( ) DO %
2-( ) Temp F G-( ) DO mg/L
3-( ) Temp K H-( ) Depth ft
4-( ) SpCond mS/cm I-( ) Depth m
5-(*) SpCond uS/cm J-( ) pH
6-( ) Cond mS/cm K-( ) pH mV
7-( ) Cond uS/cm L-( ) ORP mV
8-( ) Resist MOhm*cm M-( ) NH4+ mg-N/L
9-( ) Resist KOhm*cm N-( ) NH3 mg-N/L
A-( ) Resist Ohm*cm O-( ) NO3- mg-N/L
B-( ) TDS g/L P-( ) Turb NTU
C-( ) TDS kg/L Q-( ) TDG mm-Hg
D-( ) TDS mg/L R-( ) Batt V
E-( ) Sal ppt
Condition: Temp C > 18.000
Condition: SpCond uS/cm > 100.000
Select option (0 for previous menu):
NOTE: Before a condition can be applied to a parameter, the parameter must be selected for
viewing in the Report Setup menu. (See section 4.6). How ev er, y ou can set up conditions for any
and all of these selected parameters -- many more than the two shown in the above example.
After the condition is defined correctly, press Esc to return to the Conditional sample menu.
3. External switch
6000
UPG instruments designated UPG3 on the serial label hav e the capability of supplying a logic
level output to an external device through the YSI 6096 MS- 8 to fly ing lead adapter. When the
condition is met and the external switch is enabled, the 6000
external device. When the condition is not longer satisfied, the 6000
UPG will send a +5V signal to the
UPG will output a 0V signal. If
the external switch is not enabled, this output is put into a high impedance state and not driven.
4-6
Page 56

4.1.3. UNATTENDED SAMPLE
Select 3. Unattended sample from the Run menu. The following menu will be displayed.
========================================
Unattended-sample
---------------------------------------EMS6000 version 3.00 (6/07/96).
Current date and time: 06/04/96 07:29:53
Sensors: Temp,Cond,DO,ISE1 mV,Batt,Turb
Hardware revision: UPG3
Battery type: Alkaline
Battery voltage (Volts) : 12.3
Free Flash disk space (KBytes): 100
NOTE: If the current time and date are not correct, your unattended sampling study w ill not beg in
or end when you desire. To correct the time and date, see Section 2.5.
You will be asked to enter the following inform ation concerning the unattended sam p ling study y ou
wish to set up.
Enter Starting date (xx/xx/xx):
Enter Starting time (xx:xx:xx):
Enter duration in days (xx.xxx):
Enter interval in minutes (x):
Enter site description ():
Be sure to enter hours, minutes and seconds for time entry. I f y ou enter only hours and minutes, the
sonde will not accept the entry.
After entering the information, the program w ill re-display what you entered in the following
format.
4-7
Page 57

========================================
Run Unattended-sample Setup
---------------------------------------EMS6000 version 3.00 (5/24/96).
Current date and time: 06/04/96 07:37:58
Sensors: Temp,Cond,DO,ISE1 mV,Batt,Turb
Hardware revision: UPG3
Battery type: Alkaline
Battery voltage (Volts) : 12.2
Free Flash disk space (KBytes): 100
Start date and time : 06/04/96 07:29:53
Duration (days) : 30.000
Interval (minutes) : 15
Site description : Unattended Study
Estimated C-cell life at 25C (days): 46.9
Estimated Flash disk full (days): 56.1
First sample will begin in
6 minutes 55 seconds
Is all setup correct (Y/N)?
The program will automatically calculate how long batteries will last, and how long it w ill tak e for
flash disk memory to be filled. This information is displayed on the screen for your consideration.
If either the battery life, or the flash disk capacity w ill be exceeded sooner than the Duration you
entered, you may want to m ak e som e chang es. You might want to upload all existing data from
flash disk to your computer and then form at the flash disk to free up m emory. You may want to
change batteries if the current set is not completely new. You m ay want to chang e the sampling
interval to extend both battery and flash disk capacity.
If you make a mistake on your entry with regard to any of the input parameters, press N at the Is all
setup correct (Y/N)? prompt. The unattended setup sequence will reappear to allow you to make
corrections..
After all information is correct, press Y at the prompt and the following m essage will be displayed
briefly:
***************************************
** INSTRUMENT IS IN UNATTENDED MODE **
***************************************
The Unattended sample study will shut off autom atically w hen the duration y ou specified has
expired. If you want to shut off the study sooner, simp ly select 3. Unattended sample from the
Run menu. If the 6000
UPG is taking a reading at that m oment, you will see the following m essag e:
Instrument is busy. Please wait.
4-8
Page 58

This message will disappear when the unattended sam pling is over and you will be able to interact
with the sonde via the menu. You will be then be giv en the option to discontinue the unattended
sample as shown below.
** INSTRUMENT IS IN UNATTENDED MODE **
Start date and time : 05/31/96 11:04:08
Duration (days) : 30.000
Interval (minutes) : 2
Site description : First-test
UNATTENDED mode active. Cancel (Y/N)?
To stop the Unattended study, enter “Y” and press Enter.
4.2 CALIBRATE
All of the 6000UPG sensors (except temperature) require periodic calibration to assure high
performance. Select 2. Calibrate from the sonde Main menu, the C alibrate m enu w ill be
displayed.
========================================
Calibrate
----------------------------------------
1. Conductivity 6. pH
2. DO% 7. Ammonium
3. DO mg/L 8. Nitrate
4. Depth 9. Turbidity
5. ORP A. TDG
Select option (0 for previous menu):
1. Conductivity
Select this option to calibrate the conductivity probe and a second menu will offer y ou the options
of calibrating in Specific Conductance, Salinity, or Conductivity. After selecting the option of
choice (Specific Conductance is normally recommended), you will be asked to enter the value of
the standard used during calibration. Be certain that the units are correct. After pressing Enter,
4-9
Page 59

you will be able to follow the stabilization of the readings and confirm the calibration w hen the
readings are stable by pressing Enter as instructed on the screen.
2. DO %
Select this option to calibrate the oxygen probe in 100% water saturated air. Be certain that the
sensor has been thermally equilibrated in water-saturated air, and that the sensor show s stable
readings in Discrete Sample mode prior to beg inning the calibration routine, particularly after a
membrane change. See section 3.2 for m o re details. Reliev e pressure in the calibration cup, if
necessary. Remember that the 6000UPG transport cup is designed to be air tight and the vent
screw must be loosened if the vessel is used as a calibration chamber.
Then enter the local barometric pressure in mm Hg , press Enter, and the dissolved oxyg en sensor
will calibrate. Approximately 1 m inute is required for DO % calibration.
3. DO mg/L
Select this option to calibrate the oxygen probe to a water sample which contains a known
concentration of dissolved oxygen. For this calibration procedure, the sensor should be immersed
in water containing a known concentration (mg/L) of dissolv ed oxy g en, usually determined by
performing a Winkler titration. After therm al equilibration, enter this value, press Enter, and the 1
minute calibration procedure will begin.
4. Depth
Select this option to zero the depth sensor. The depth sensor is factory calibrated. It is, however,
necessary to zero the sensor with regard to the local barometric pressure. The zeroing procedure
should be carried out with the sonde suspended in air. Do not attempt to zero the depth probe when
the sonde is immersed. After the depth option is selected, enter 0.00 at the prompt, press Enter and
monitor the stabilization of the depth readings. After no changes occur for approximately 30
seconds, press Enter to confirm the calibration. As instructed, press any key to return to the
Calibrate menu.
Zeroing the depth sensor by the above protocol (entering 0.00 at the screen prompt) will result in a
measurement of the distance between the water surface and the bottom of the sonde bulkhead. This
bulkhead is approximately 0.46 ft above the bottom of the sonde guard. Thus, in order for the
observed depth to better reflect the distance between the water surface and the probe array, enter
0.46 at the screen prompt instead of 0.00.
5. ORP
Select this option to calibrate the ORP sensor. Immerse the ORP probe in a solution with a k nown
ORP value (we recommend Z obell solution) and press Enter. You will be prom pted to enter the
ORP value of the solution as found on the bottle. Press Enter, and monitor the stabilization of the
4-10
Page 60

ORP readings. After no changes occur for approximately 30 seconds, press Enter to confirm the
calibration. Then, as instructed, press any key to return to the Calibrate menu.
6. pH
On selecting this option, you will by g iv en the choice of 1-point, 2-point, or 3-point calibrations.
Select the 1-point option only if you are adjusting a previous calibration. If a 2- point or 3-point
calibration has been performed previously, you can adjust the calibration by carry ing out a one
point calibration. Immerse the sonde in a buffer of k nown pH v alue and press Enter. You will be
prompted to type in the pH value of the solution you are using . Press Enter again, and the screen
will display real-time readings which will allow you to determ ine wh en the pH reading s have
stabilized. Pressing Enter will confirm the calibration. Then, as instructed, press any key to return
to the Calibrate menu.
Select the 2-point option to calibrate the pH probe using only two calibration standards. In this
procedure, the pH sensor is calibrated using a pH 7 buffer and one additional buffer. A two point
calibration procedure (as opposed to a 3-point procedure) can save time if the pH of the m edia
being monitored is known to be either basic or acidic. For exam ple, if the pH of a pond is k nown to
vary between 5.5 and 7, a two point calibration with pH 7 and pH 4 buffers is appropriate. Three
point calibration with an additional pH 10 buffer will not increase the accuracy of this measurem ent
since the pH is not within this higher range. Be certain that the buffer and sensor are thermally
equilibrated prior to entering pH values.
To begin the calibration, immerse the sonde in pH 7 buffer, as instructed, and press Enter. The
screen will display real-time readings which will allow you to determ ine when the pH reading s hav e
stabilized. Pressing Enter will confirm the calibration. Following the instructions on the screen,
place the sonde in the second pH buffer, input the pH value, press Enter, and view the stabilization
of the values on the screen in real time. After the readings hav e stabiliz ed, press Enter to confirm
the calibration. Then, as instructed, press any key to return to the Calibrate menu.
Select the 3-point option to calibrate the pH probe using three calibration solutions. In this
procedure, the pH sensor is calibrated with a pH 7 buffer and two additional buffers. The 3 point
calibration method should be used to assure maximum accuracy when the pH of the media to be
monitored cannot be anticipated. The procedure for this calibration is the same as for a 2 point
calibration, but the software will prompt you to select a third pH buffer to com p lete the 3 point
procedure. Be certain that the buffer and sensor are thermally equilibrated prior to proceeding with
the calibration.
7. Ammonium
On selecting this option, you will by g iv en the choice of 1-point, 2-point, or 3-point calibrations for
your ammonium (NH
+
) sensor.
4
Select the 1-point option only if you are adjusting a previous calibration. If a 2- point or 3-point
calibration has been performed previously, you can adjust the calibration by doing a one point
calibration. Immerse the sonde in any solution of k nown ammonium concentration and press
4-11
Page 61

Enter. You will be prompted to type in the NH
+
value (in mg/L of NH4-N) of the solution you are
4
using. Press Enter again, and the screen will display real-time readings which will allow y ou to
determine when the NH4+ readings hav e stabiliz ed. P ressing Enter will confirm the calibration.
+
Select the 2-point option to calibrate the NH
both as close as possible to the temperature of your environm ental sam ple. In this procedure, the
+
NH
sensor is usually calibrated using solutions which contain 1 and 100 mg/L of NH4-N . Be
4
certain that the calibration solution and sensor are thermally equilibrated prior to entering NH
probe using only two calibration standards which are
4
+
4
values.
To begin the calibration immerse the sonde in the 1 mg/L standard, press Enter, input the NH
-N
4
value, and again press Enter. The screen will display real-tim e reading s w hich w ill allow y ou to
determine when the sensor has stabilized. Pressing Enter will confirm the first calibration.
Following the instructions on the screen, place the sonde in the second NH
+
standard, press Enter,
4
input the correct concentration value, again press Enter, and view the stabilization of the values on
the screen in real time. After the readings have stabiliz ed, press Enter to confirm the calibration.
Then, as instructed, press any key to return to the Calibrate menu.
Select the 3-point option to calibrate the NH
+
probe using two calibration solutions, one at
4
ambient temperature and one at a temp erature sig nificantly different from ambient. The 3-point
calibration method should be used to assure maximum accuracy when the temperature of the m edia
to be monitored cannot be anticipated. The procedure for this calibration is the same as for a 2point calibration, but the software will prompt you to place the sonde in the additional solution to
complete the 3-point procedure. Be certain that the calibration solution and sensor are thermally
equilibrated prior to proceeding with the calibration. The recommended order of calibration
standards is (1) 100 mg/L standard at ambient tem perature, (2) 1 mg/L standard at ambient
temperature, and (3) 1 mg/L standard at a different tem p erature (usually lower) than ambient. For
best results, insure a temperature difference of at least 10 C°.
8. Nitrate
On selecting this option, you will be giv en the choice of 1- point, 2-point, or 3-point calibrations for
your nitrate (NO
those in 7 above for the ammonium sensor, except that the calibrant values are in mg/L of NO
instead of NH
-
) sensor. The procedures for calibration of the nitrate sensor are identical to
3
-N.
4
-N
3
9. Turbidity
On selecting this option, you will be giv en the choice of 1- point, 2-point, or 3-point calibrations for
your turbidity sensor.
The 1-point option is used only to zero the turbidity probe. Place the sonde in clear w ater with no
suspended solids, and input 0 NTU at the screen prompt. Press Enter and the screen will display
real-time readings wh ich will allow y ou to determine when the turbidity readings have stabiliz ed.
Press Enter after the readings have stabilized to confirm the calibration and zero the sensor. Then,
4-12
Page 62

as instructed, press any key to return to the Calibrate menu. This procedure should only be used to
update a previous 2-point or 3-point calibration.
Select the 2-point option to calibrate the turbidity probe using only two calibration standards. One
of the standards must be clear water (0 NTU) and the other should be in the range of known
turbibity for the water to be monitored. For example, if the water to be ev aluated is k nown to be
low in turbidity, an appropriate choice of standards might be 0 and 10 NTU. If the water to be
evaluated is known to be very cloudy, an appropriate choice of standards might be 0 and 100 NTU.
To begin the calibration, immerse the sonde in the 0 NTU standard, as instructed, and press Enter.
It is mandatory that the 0 NTU standard be calibrated first. The screen w ill display real-time
readings which will allow you to determ ine w hen the reading s hav e stabiliz ed. P ressing Enter will
confirm the first calibration. Following the instructions on the screen, place the sonde in the second
turbidity standard, input the correct turbidity value in NTU, press Enter, and view the stabilization
of the values on the screen in real-time. After the reading s hav e stabiliz ed, press Enter to confirm
the calibration. Then, as instructed, press any key to return to the Calibrate menu.
Select the 3-point option for maximum accuracy ov er the entire rang e of 0 to 1000 N TU. As for
the 2-point procedure, one of the standards must by 0 NTU. Because of the linearity characteristics
of the sensors, we recommend that the other two standards have turbidity v alues of 10 and 100
NTU. However, the user can select any values w hich are deemed appropriate. The procedure for
this calibration is the same as for a 2-point calibration, but the software will prompt you to place the
sonde in the additional solution to complete the 3-point procedure.
For all turbidity calibration procedures, be certain be certain that the standard and sensor are
thermally equilibrated prior to proceeding with the calibration. Remember that all multipoint
turbidity calibrations must be done in order from 0 NTU and up. In this example, do 0 NTU, then
10 NTU, and finally 100 NTU.
4-13
Page 63

4.3 FILE
In general, selections from the File m enu allow the user to access data w hich has been stored in the
sonde flash disk memory . Select 3. File from the sonde Main menu and the File menu will be
displayed:
========================================
File
----------------------------------------
1. Directory 5. Quick view file
2. Upload 6. Delete file
3. Quick Upload 7. Format FlashDisk
4. View file 8. Test FlashDisk
Select option (0 for previous menu):
1. Directory.
Select this option to view on the computer screen a listing of all files currently stored in flash disk
memory.
2. Upload.
Select this option to view a list of files stored in flash disk memo ry . You can select any file or
portion of a file to transfer from flash disk mem ory to PC6000 or other software programs. Three
formats are possible for the transfer.
========================================
File Upload
----------------------------------------
1. PC6000
2. Comma&''Delimited
3. ASCII Text
Select option (0 for previous menu):
1. PC6000.
Select this option to upload a file from the sonde's flash disk m emory to the PC6000 software. Data
is uploaded in a form compatible with the PC6000 software which is supplied with the system .
4-14
Page 64

2. Comma&""Delimited
Select this option to upload data from the sonde's flash disk m emory to a software program other
than PC6000. Data is uploaded in comma & " " delim ited format directly to the specified disk drive
of your computer. This data format is ideal for im porting into most spreadsheet software and
allows you to perform custom data analy sis. A comma is still the delimiter, but the radix is
corrected to a period. In most cases, you should set the Pag e Leng th to “0” before using this ty pe of
upload format. See section 4.5 for details.
3. ASCII Text
Select this option to upload data from the sonde's flash disk m emory to a software program other
than PC6000. Data is uploaded in standard ASCII Text format directly to the specified disk driv e of
your computer.
After you have selected one of these three upload formats, a list of files currently stored on flash
disk memory w ill be display ed. At the bottom of the list, the following prompt will be display ed.
Enter file number to UPLOAD (1):
Input the number of the file which you wish to upload to y our com puter software and press Enter.
The following prompt questions will appear.
Enter starting date (XX/XX/XX):
Enter starting time (XX:XX:XX):
Enter stopping date (XX/XX/XX):
Enter stopping time (XX:XX:XX):
If you wish to upload the entire file, press Enter at each prompt. The complete file will beg in
uploading automatically and a box will appear on the screen showing the prog ress of the upload.
If you wish to upload only a portion of the file, enter the start and stop dates and tim es which
correctly define the portion of the file you wish to upload. Press Enter after each date or time. The
upload will begin automatically when all dates and times have been entered. A box will appear on
the screen showing the progress of the upload.
3. Quick upload
Select this option to cause the most recent flash disk file to be uploaded in its entirety to the
specified disk drive of your computer. The transfer of data can be carried out in the sam e three
formats applicable to the Upload option described above.
4-15
Page 65

4. View file.
Select this option to examine the data in any file currently stored in flash disk memory. The
following prompt will appear.
Enter file number to VIEW (1):
Input the number of the file you wish to v iew and press Enter. Next, you are asked for the start
date and time and the stop date and time. Input any seg ment of time which falls between the begin
and end dates and times on the file list displayed on the screen.
Selection of this option allows you to view an entire data file, or a portion of a file, on the computer
screen.
NOTE: If the dates or times you input do not fall within the begin and end times of the file y ou
have selected, no data will be displayed.
NOTE: The Pause/Break key can be used to stop the scrolling at any time during the scrolling
process. The Enter key is used to resume scrolling. Pressing the Esc key during the scrolling
process will give the user the option to abort the view.
5. Quick view file.
Select this option to view, on the computer screen, the last page of data from the last data file in
flash disk memory . The feature is particularly useful in quick ly rev iew ing recently acquired data at
field sites so that system performance can be assessed
6. Delete file.
Select this option to remove any desig nated file from the list of files in the directory.
NOTE: This procedure only clears the directory listing and does NOT provide extra storage
capacity.
7. Format Flash Disk.
Select this option to IRREVERSIBLY remove all files from the flash disk. I t is critical not to use the
Format Flash Disk command until all relevant data has been transferred to your com puter v ia an
upload option (see previous upload information in this section). You will need to form at the flask
disk periodically in order to clear space for new files.
NOTE: Use caution when choosing the Format Flash Disk option, since all data will be lost once
the procedure has begun. However, calibration and setup information will not be erased.
4-16
Page 66

8. Test Flash Disk
Select this option to verify that the entire flash disk memory system is work ing properly. As with
the Format Flash Disk comm and this option also IRREVERSIBLY rem ov es all files from flash disk
memory. After this option is selected, the flash disk w ill be formatted, written to, and confirmed.
During each process, prompts will appear on the screen to inform y ou of the prog ress of the
procedure.
To find out how much flash disk space is still available, select STATUS from the sonde Main
menu.
NOTE: Use caution when choosing the Test Flash Disk option, since all data will be lost once the
procedure has begun. However, calibration and setup information will not be erased.
4.4 STATUS
Select 4. Status from the sonde Main menu to obtain general inform ation about the sonde and its
setup. The battery voltage and available flash disk memory are also displayed. If an unattended
sample is in progress, all the preset unattended sampling information (such as start time and date,
duration etc.) will also be displayed. This information is helpful in mak ing choices about chang ing
batteries and/or formatting the flash disk prior to a new unattended sam p ling application or during
an ongoing study.
========================================
Status
---------------------------------------EMS6000 version 3.00 (6/07/96).
Current date and time: 06/05/96 07:13:33
Sensors: Temp,Cond,DO,ISE1 mV,Batt,Turb
Hardware revision: UPG3
Battery type: Alkaline
Battery voltage (Volts) : 12.3
Free Flash disk space (KBytes): 98
** INSTRUMENT IS IN UNATTENDED MODE **
Start date and time : 06/04/96 07:44:53
Duration (days) : 30.000
Interval (minutes) : 15
Site description : Unattended Study
Hit any key to continue...
4-17
Page 67

4.5 SYSTEM SETUP
========================================
Main
----------------------------------------
1. Run 5. System setup
2. Calibrate 6. Report setup
3. File 7. Sensor setup
4. Status 8. Diagnostics
Select option (0 for previous menu):
Select 5. System setup from the sonde Main menu to custom config ure your system with regard to
parameters such as date, time, radix, communication protocol, and instrument ID.
========================================
System-setup
----------------------------------------
1. Date & time 4. Batteries
2. Radix 5. Instrument ID
3. Communication 6. Page Length
Select option (0 for previous menu):
1. Date & Time
Select this option to choose the date format and set the correct date and time. Select a date format
from the list provided. The three choices are: month/day/y ear, day /month/year, or year/month/day .
Next enter the date and time as prompted on the screen. Press Enter after each selection.
Note: For convenience, any non-numeric key (such as space) in addition to / and : w ill separate the
fields in the date and time entries.
2. Radix
Select this option to choose either the period (.) or the comma (,) as the character to separate the
integer and fractional parts of a number (example 99.44 or 99,44). This separating character is
called a decimal point or radix mark. Choose the character which is com monly used in the country
in which the 6000
UPG is being used.
4-18
Page 68
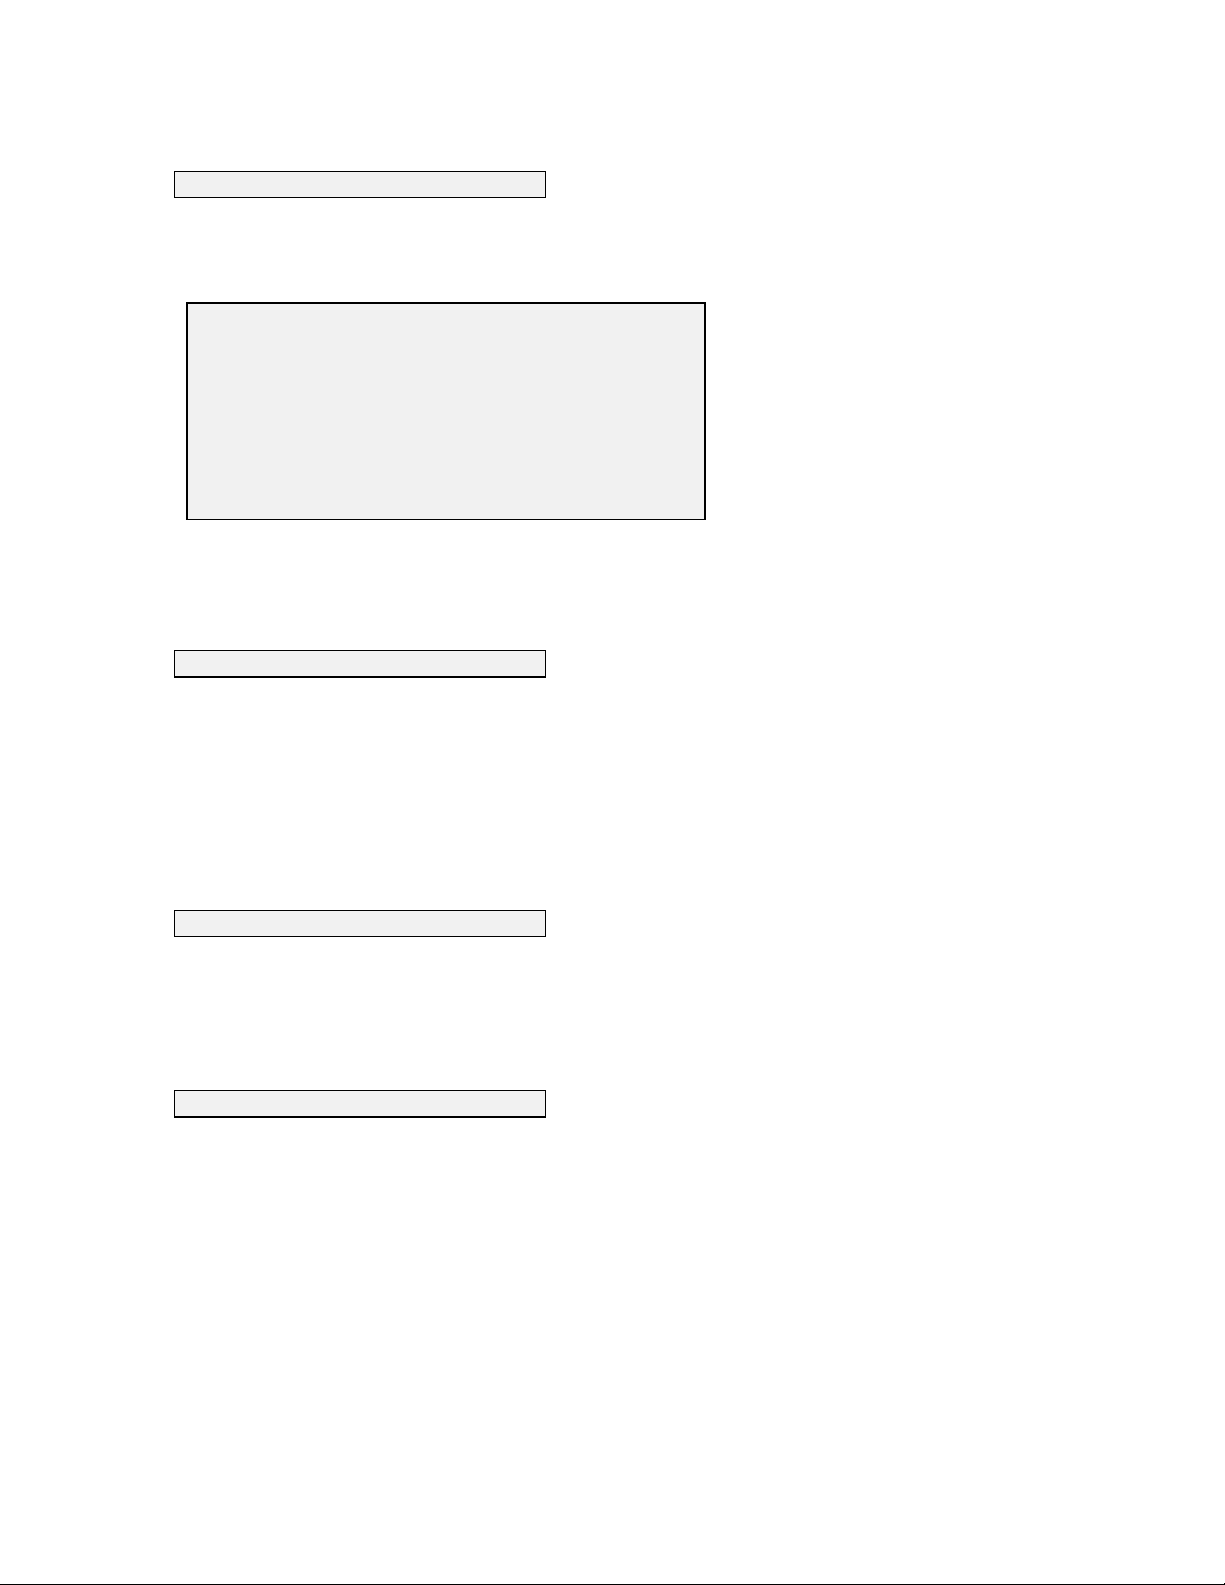
3. Communication
Select this option to set up communication parameters between the 6000
UPG Sonde and an outside
device, such as a personal computer. The following options are available:
========================================
System-setup Comm
----------------------------------------
1. RS-232 baud rate
2. RS-232 data size
3. Modem Setup
4. SDI-12 address
5. KERMIT padding
Select option (0 for previous menu):
After you enter the number associated with the option you prefer, a list of choices w ill appear.
Choose from the list by typing the number associated with the desired selection. See Section 9 for
more details.
4. Batteries
This option is intended to help insure that rechargeable alkaline or NiCad type batteries are not fully
discharged during an unattended study. If the recharg eable alk aline battery type is selected, the
6000
UPG will terminate the unattended study when the battery voltage reaches 8 volts (rather than
the 6 volt cut-off for standard alkaline batteries). Currently, rechargeable alkaline battery chem istry
is not well suited for long term unattended studies and battery life typically falls approximately 50%
with each recharge cycle. At this time, w e do not recom mend the use of either recharageable
alkaline or NiCad batteries for Unattended Deployment studies with the 6000
UPG.
5. Instrument ID
Select this option to record, within the sonde software, the serial number (or identification name) of
the sonde. The identification will be stored in a portion of the flash memory w hich will not be
erased when the flash disk is formatted.
6. Page Length
Select this option to modify the page length of reports. A four line header w ill appear at the top of
each page. The header lists all parameters which have been selected for output, see above. S etting
the page length to 0 will provide a header only at the beg inning of the data. Setting the v alue to 10
will provide one header and six lines of data (4 lines for the header + 6 lines of data = 10). You may
enter any number which provides the desired report presentation.
When uploading data directly from the sonde to a com puter disk driv e in either Comma & " "
Delimited or ASCI I Text format, it is generally w ise to set the pag e leng th to 0 in order to av oid
gaps in the data after importing into spreadsheet software.
4-19
Page 69

4.6 REPORT SETUP
========================================
Main
----------------------------------------
1. Run 5. System setup
2. Calibrate 6. Report setup
3. File 7. Sensor setup
4. Status 8. Diagnostics
Select option (0 for previous menu):
Select 6. Report setup from the sonde Main menu to configure all reports constructed by the
sonde. You will be able to design the report with regard to param eters and units of measure which
are viewed on the computer screen during operation. The following display w ill appear on
selection of Report Setup.
========================================
Report-setup
---------------------------------------1-(*) Date G-(*) Sal ppt
2-(*) Time H-(*) DO %
3-(c) Temp C I-( ) DO mg/L
4-( ) Temp F J-( ) Depth ft
5-( ) Temp K K-( ) Depth m
6-(c) SpCond mS/cm L-(*) pH
7-( ) SpCond uS/cm M-( ) pH mV
8-( ) Cond mS/cm N-( ) ORP mV
9-( ) Cond uS/cm O-( ) NH4+ mg-N/L
A-( ) Resist MOhm*cm P-( ) NH3 mg-N/L
B-( ) Resist KOhm*cm Q-( ) NO3- mg-N/L
C-( ) Resist Ohm*cm R-( ) Turb NTU
D-( ) TDS g/L S-( ) TDG mm-Hg
E-( ) TDS kg/L T-(*) Batt V
F-( ) TDS mg/L
Select option (0 for previous menu):
For this example, the parameters date, tim e, temperature in °C, specific conductance in mS/cm,
salinity, DO in percent air saturation, pH, and battery vo ltag e will appear on the screen in all
sampling and viewing applications. The “c” m ark er for temperature and specific conductance
indicate that these parameters have conditions applied to them (See section 4.1.2).
To change the screen display using this menu, sim p ly press the number of the parameter with its
desired units to cause it to appear in the screen display associated with real-time D iscrete and
Conditional Sampling and with the View and Quick View options of the File Menu. When a
particular choice is active, an asterisk (or a “c”) will appear in the parentheses associated with the
4-20
Page 70

selection. To deactivate a parameter from screen display, sim p ly press the number of the active
parameter, the asterisk will disappear, and the parameter w ill not appear on the screen during
operation.
NOTE: Choosing or not choosing parameters from this m enu does not turn sensors on and off.
Regardless of how the report is set up, all active sensors will continue to collect data. See Section
4.7.
NOTE: You will see reference to TDG (total dissolved gas) in the Report setup menu. This is
for possible future upgrade and is not currently available for your 6000
UPG.
4.7 SENSOR SETUP
========================================
Main
----------------------------------------
1. Run 5. System setup
2. Calibrate 6. Report setup
3. File 7. Sensor setup
4. Status 8. Diagnostics
Select option (0 for previous menu):
Select 7. Sensor setup to Enable or Disable (turn on or off) any sensor and to set up measurem ent
parameters for some sensors. This option also allows you to view or chang e inform ation which is
specifically related to certain sensors.
========================================
Sensor-setup
---------------------------------------1-(*) Temp 7-( ) ISE2 ORP
2-(*) Cond 8-( ) ISE2 NH4+
3-(*) DO 9-( ) ISE2 NO34-( ) Depth A-(*) Batt
5-(*) ISE1 pH B-( ) Turb
6-( ) ISE1 mV C-( ) TDG
Select option (0 for previous menu):
From this menu, simply press the number of the sensor which you desire to enable or disable.
When a particular sensor is active, an asterisk will appear in the parentheses associated with the
selection. In the example, the temperature, conductivity, dissolved oxygen, pH, and battery sensors
are enabled. To disable a sensor, simply press the number of the active sensor, the asterisk will
disappear, and the sensor will no longer be active.
4-21
Page 71

NOTE: You will see reference to TDG (total dissolved gas) in the Sensor setup menu. This is
for possible future upgrade and is not currently available for your 6000
UPG.
During activation of certain sensors, you will be ask ed to select parameters associated with the
operation of the sensor or with calculations made from data acquired by the sensor. Sensors for
which additional choices are necessary are described in detail below.
1. Conductivity
After activation of the conductivity sensor, you w ill be ask ed to enter the constant associated w ith
the calculation of total dissolved solids (TDS), a parameter which is calculated from specific
conductance. The default value of this parameter is 0.65 and any change to the v alue will be show n
in parentheses when the prompt appears.
NOTE: If this parameter is disabled, any other parameter which is calculated using conductiv ity
will also be disabled.
2. DO
After activation of the dissolved oxygen sensor, y ou w ill be ask ed to enter the D O Warm up time
associated with the Rapid Pulse Dissolved Oxygen Sensor. The default value of 40 seconds
provides adequate warm-up for m o st applications while m aintaining good battery life in long-term
unattended sampling studies. While very long warm-up setting s may marginally increase the
accuracy of the readings, their selection will reduce battery life.
A. Turbidity
After activation of the turbidity sensor, you will be ask ed to enter the number of wipes associated
with mechanical cleaning of the sensor optics prior to a reading being tak en. Normally, the default
value of 1 is suitable, but in some applications where the potential for fouling is great, a g reater
number of cleaning cycles m ay be necessary . A dditional wiping of the probe face w ill reduce
battery life.
After entering the number of wipes, you will be prompted to enter the Number of Samples to
Average. Entry of higher numbers such as 8 will result in g reater smoothing of the data and a more
average view of the turbidity in your sample, but with slightly reduced response time. Entry of
lower numbers such as 1 will result in jumpier readings w hich reflect the momentary turbidity.
4-22
Page 72

4.8 DIAGNOSTICS
========================================
Main
----------------------------------------
1. Run 5. System setup
2. Calibrate 6. Report setup
3. File 7. Sensor setup
4. Status 8. Diagnostics
Select option (0 for previous menu):
Select 8. Diagnostics to provide diagnostic data on each installed sensor. The following display
will appear, depending on the sensors which you have enabled in Sensor Setup.
========================================
Diagnostics
---------------------------------------Cell Constant: 4.99621
DO gain: 1.96879
Pres offset: 0
Turbidity/TDG status: 40
==============================
DO ISE1 ISE2 AUX
chrg mV mV adc
-----------------------------To exit, press <ESC>
-0.8 -187.0 87.8 11
Information taken from the display in this option can be helpful for both the user and authorized
service technicians in diagnosing problems which could occur with your sensors. In the lower
portion of the display, DO Chg refers to a unitless parameter which reflects the condition of the
electrode surfaces of the Rapid Pulse DO sensor. ISE1 mv and ISE2 mv refer to the voltage
output of the pH sensor (ISE1) and the other potentiometric sensor which could be ammonium,
nitrate, or ORP. AUX ADC refers to the digital output (A/D counts) of the turbidity sensor.
When Diagnostics is activated, the above parameters are displayed and are updated in real-time.
In the upper portion of the display, the information is not updated in real-time, the values being
derived from the last calibration of the particular sensors. In this section are shown the cell
constant of the conductivity sensor (Cell Constant), the sensitivity of the pulsed DO sensor (DO
Gain), the pressure offset of the depth sensor ( Pres Offset), and a hexidecimal value which
provides information about the function of the turbidity sensor (Turbidity Status).
To exit the Diagnostics mode, press Esc as prompted. The display will momentarily show the
message Initializing Sensors and then the Main menu will appear.
4-23
Page 73

5. PC6000 SOFTWARE
NOTE: If you have purchased Ecowatch for Windows for use with your Model 6000UPG,
consult the Help selection in the top menu bar if you have questions on the use of this
powerful Windows-based software. The following section deals with the MS-DOS-based
PC6000 which is offered with all YSI logger/sampler products at no charge.
5.1 Introduction
The PC6000 program is very useful in the operation of the 6000UPG. This PC based software can be
used with any IBM- compatible computer.
PC6000 enables you to:
• Configure and deploy the sonde
• Retrieve and process data from the sonde
• Capture data from the sonde
• Create a variety of reports and plots
• Print reports and plots
• Save reports and plots to disk
• Export data to other programs
The PC6000 program is completely menu-driven and easy to use. There are nine m enus, but
beginning users can generate reports and plots using only two menus.
Use the arrow keys to move the cursor and hig hlig ht menu options.
Use the Enter key to select a highlighted m enu option.
Use the Esc key to return to a previous screen.
When each menu option is highlighted, a short, descriptive help line is display ed at the bottom of
the screen.
5.2 INSTALLING THE PC6000 SOFTWA R E
The PC6000 software is provided with every 6000UPG and is located in the back of this instruction
manual. Use this software if you have an IB M-compatible PC with at least 300 KB of RAM and
5-1
Page 74

DOS 3.0 or later. Additional RAM and the presence of a math co-processor will improve the
operation of the program, but are not required.
NOTE: PC6000 imposes no limit on the number of lines a report can have, but after g enerating a
report, only the last 300 to 2500 lines can be viewed, depending on available RAM.
A graphics adapter is required for operation of the plotting feature. One RS- 232 port (also called a
comm port or serial port) is required to communicate with the sonde and to capture data files. This
port must be either com1 or com2 .
If your system is not I B M-compatible, use a terminal em ulation prog ram with your computer.
On IBM compatible com puter sy stems with a hard disk drive see section 2.3 for installation
instructions:
On systems with two floppy disk s proceed as follow s:
If necessary, exit whatever program or shell is running.
1. Make sure your computer is at the A or A:\ prom pt.
2. Make sure your DOS system disk is in driv e A.
3. Place a new disk in drive B and format it: F OR MAT B:
4. Place the original PC6000 software diskette in drive A.
5. Copy the software onto the new disk: COPY A:*.* B:
6. Store the original PC6000 software diskette in a cool clean place, away from magnets, video
screens, electronic and electrical equipment and cords.
7. When you want to use the software, put the copy of the PC6000 software into drive B, put any
data disk into drive A, and type: B:PC6000
Once PC6000 has loaded, the program disk can be rem ov ed from the disk drive. The disk must be
reinserted into the drive prior to exit from the Setup menu if any chang es hav e been made. This
will allow the program to update the configuration file on the disk.
NOTE: If you have a non-standard video adapter and m onitor (rare except on CAD work stations)
you will also need to:
1.) Put your video adapter into a compatible (standard) video m ode. Ty pically the manufacturer of
the video adapter provides a program or utility to set the v ideo mode.
2.) Type PC6000 -V to run the program. This tells PC6000 to send video output through the
computer BIOS (built-in firmware), rather than directly to v ideo m emory. This procedure slows
down the video output somewhat, but guarantees compatibility.
5-2
Page 75

5.3 THE SONDE MENU
The Sonde option of the PC6000 software is covered in detail in Section 4 of this manual. This
option emulates a VT 100 terminal which makes a direct connection between the sonde and y our
PC. Selecting this option will allow you to access and set up the sonde.
5.4 THE FILE MENU
Choosing File from the PC6000 menu bar allows y ou to specify and customize reports and plots
based on data which has been captured from the sonde. Select File from the menu bar, and press
Enter.
+------------------------------------------------------------------------------+
¦ Sonde File Setup Real-Time Exit YSI PC6000 ¦
¦------------------------------------------------------------------------------¦
¦ ¦
¦ ¦
Filename: *.dat
At this prompt, press Enter. A list of all data files in the current directory will be displayed. Select
the file you wish to retrieve from the list. I f only one data file exists, that file w ill be loaded
automatically.
To retrieve files stored on another drive or directory, at the filename: prompt, type the source drive
and directory and press Enter.
Example, typing A:\PC6000\ at the prom pt would provide the user with a list of all files located in
the directory named PC6000 and stored on a disk in the A: drive.
1. MODIFY File Options
Any modifications performed w ith these functions w ill allow you to customize data and format
reports and plots for a selected file only. See SETUP in this chapter to change default values
permanently.
Select the Parameters option:
5-3
Page 76

+------------------------------------------------------------------------------+
¦ Sonde File Setup Real-Time Exit YSI PC6000 ¦
¦------------------------------------------------------------------------------¦
¦ ¦
¦ ¦
¦ ¦
¦ +--------------------------------------------------------+ ¦
¦ ¦ Filename: SRUNS62O.DAT ¦ ¦
¦ ¦--------------------------------------------------------¦ ¦
¦ ¦ MODIFY ¦ VIEW ¦ SYSTEM ¦ ¦
¦ ¦------------------+------------------+------------------¦ ¦
¦¦Parameters... ¦ Header ¦ Print Report ¦ ¦
¦ ¦ Control Info... ¦ Report ¦ Print Plot ¦ ¦
¦ ¦ Scaling Info... ¦ Plot ¦ Definitions... ¦ ¦
¦ ¦ ¦ Statistics ¦ Export ¦ ¦
¦ +--------------------------------------------------------+ ¦
¦ ¦
¦ ¦
¦ ¦
¦ ¦
¦ ¦
¦ ¦
¦------------------------------------------------------------------------------¦
¦ Modify choice of parameters (and their details) wanted in report/plot ¦
+------------------------------------------------------------------------------+
The Parameters menu will be displayed.
+------------------------------------------------------------------------------+
¦ Sonde File Setup Real-Time Exit YSI PC6000 ¦
¦------------------------------------------------------------------------------¦
¦ ¦
¦ X-axis parameter ¦
¦ ------------------ ¦
¦ Date + Time ¦
¦ ¦
¦ Y-axis parameters ¦
¦ ------------------- ¦
¦ Temperature C ¦
¦ Specific Cond mS/cm ¦
¦ DO mg/L ¦
¦pH ¦
¦ ORP mV ¦
¦ Battery volts ¦
¦ Turbidity NTU ¦
¦ ¦
¦ ¦
¦ ¦
¦ ¦
¦ ¦
¦------------------------------------------------------------------------------¦
¦ Press Enter to modify the X-axis parameter, or to select a new one. ¦
+------------------------------------------------------------------------------+
Highlighting any parameter on this display will provide the following sub m enu.
+-----------------------+
¦ Add parameter here ¦
¦ Delete this parameter ¦
¦ Move parameter up ¦
¦ Move parameter down ¦
¦ Detail this parameter ¦
+-----------------------+
You may select ONE param eter for the X- axis, and up to 12 parameters for the Y-axis.
5-4
Page 77

Add parameter here
Select this option to add a parameter to a report or plot. A list of all available parameters which can
be added will be displayed. Choose those parameters which y ou want to be included in reports and
plots.
Delete this parameter
Select this option to delete the highlighted parameter from reports and plots.
Move parameter up
Move parameter down
Select these options to shift the highlighted parameter up or down one position. By using these
options all parameters within a report and plot can be displayed in the order you prefer.
Detail this parameter
Select this option to view detailed information of a highlighted parameter. PC6000 has many
built-in formulae. Each formula accepts certain inputs and produces a sing le output. A n example
of this is the formula for specific conductance, which is calculated from temperature and
conductivity.
Most formula inputs must be in the input data file from the sonde, but some can be entered as
constants. For example, the total dissolved solids (TDS) constant can be manually entered.
Once you have selected a parameter and pressed Enter, the following screen will be display ed:
5-5
Page 78

+------------------------------------------------------------------------------+
¦ Sonde File Setup Real-Time Exit YSI PC6000 ¦
¦------------------------------------------------------------------------------¦
¦ ¦
¦ ¦
¦ ¦
¦ Parameter: Specific Cond (mS/cm) ¦
¦ ¦
¦ Formula: Temp(C) Cond(mS/cm) ¦
¦ ¦
¦ Inputs: Temperature (C) from 6030 probe, channel 0 ¦
¦ Conductivity (mS/cm) from 6030 probe, channel 1 ¦
¦ ¦
¦ ¦
¦ ¦
¦ ¦
¦ Compensate: ¦
¦ ¦
¦ ¦
¦ ¦
¦ ¦
¦ ¦
¦------------------------------------------------------------------------------¦
¦ Press Enter to select a new formula for this parameter from a list ¦
+------------------------------------------------------------------------------+
Parameter:
This line simply redisplays the param eter y ou hav e just selected.
Formula:
Select this option to view and change the formula used by PC6000 to calculate the selected
parameter. This option will allow you to change form ulae and input sources only in circumstances
where multiple formulae or input sources exist. I f formula options for the highlighted parameter
exist, they will be displayed when pressing Enter while the formula is hig h lig hted.
Inputs:
This option is reserved for future software enhancements.
5-6
Page 79

Compensate:
Select this option to compensate a data file for long term sensor drift. This com pensation procedure
is also commonly called Post-Calibration.
Example: Dissolved oxygen data can be collected periodically throughout a long term deploy ment
using a separate, freshly calibrated DO meter. This independent data can then be used to
compensate the 6000
UPG data for the small sensor drift which normally occurs ov er time.
NOTE: The setup menu options for date format, date separator, time separator, and radix separator,
all apply here. The date, time, and value are separated from each other by spaces. Lines w hich do
not match the above format are ig nored.
To create a compensation file, use a word processing program or follow the procedure below. The
file must be simple ASCII. In WordPerfect you use the DOS Text Out feature. In Word, sav e as
file type Text Only (*.TXT). From DOS, proceed as follows:
1. Issue the DOS command "COPY CON DO.CMP".
2. Type all the lines in your file (make sure each line is correct before y ou press Enter for that
line).
An example line would look like this:
12/31/92 23:59:59 100
3. After the last line has been typed and entered, hold Ctrl and press Z, then press Enter.
4. The message 1 File(s) copied will be displayed.
NOTE: If only one data point is entered into the compensation file, all data after that date and time
will be corrected. If more than one data point is included in the com pensation file, data betw een
points will be corrected linearly.
To enter the compensation filename, press TAB while the highlight cursor is on com pensate. The
highlight cursor will mov e to the right. Enter the path and file name.
Example: C:\DO.CMP Enter.
When you enter a compensation filename, the prog ram performs a test load of that compensation
file. A summary is display ed so y ou can v erify the file structure. The sum mary includes how many
lines were accepted, rejected, or blank; the total number of lines, and the earliest and latest date.
If you compensate a constant used in calculating one param eter, y ou must also compensate the same
constant if you use it to calculate other parameters. A total of 1000 compensation points is allowed
for any single report or plot.
5-7
Page 80

Appendix E of this manual is an application note which will be very helpful as y ou prepare for data
collection to be used to compensate 6000
UPG data.
Select Control Info from the Modify menu. The Control Info menu will be display ed
+------------------------------------------------------------------------------+
¦ Sonde File Setup Real-Time Exit YSI PC6000 ¦
¦------------------------------------------------------------------------------¦
¦ ¦
¦ ¦
¦ ¦
¦ +--------------------------------------------------------+ ¦
¦ ¦ Filename: SRUNS62O.DAT ¦ ¦
¦ ¦--------------------------------------------------------¦ ¦
¦ ¦ MODIFY ¦ VIEW ¦ SYSTEM ¦ ¦
¦ ¦------------------+------------------+------------------¦ ¦
¦ ¦ Parameters... ¦ Header ¦ Print Report ¦ ¦
¦¦Control Info... ¦ Report ¦ Print Plot ¦ ¦
¦ ¦ Scaling Info... ¦ Plot ¦ Definitions... ¦ ¦
¦ ¦ ¦ Statistics ¦ Export ¦ ¦
¦ +--------------------------------------------------------+ ¦
¦ ¦
¦ ¦
¦ ¦
¦ ¦
¦ ¦
¦ ¦
¦------------------------------------------------------------------------------¦
¦ View or change the title or timing information for the report/plot ¦
+------------------------------------------------------------------------------+
The Control Info menu allows you to report or plot an entire file, or any portion of a file. Other
options on the Control Info menu allow you to av erag e sev eral data points tog ether and set up
reports and plots to display data in the format you choose.
+------------------------------------------------------------------------------+
¦ Sonde File Setup Real-Time Exit YSI PC6000 ¦
¦------------------------------------------------------------------------------¦
¦ ¦
¦ Enter title line ¦
¦ SRUNS62O.DAT ¦
¦ ¦
¦ First sample was at: 05/03/96 8:15:00 ¦
¦ Enter start time: begin ¦
¦ Enter stop time: end ¦
¦ Last sample was at: 06/01/96 19:00:00 ¦
¦ ¦
¦ Logging interval was: 900 seconds ¦
¦ Enter averaging interval: 0 ¦
¦ ¦
¦ X-axis time per screen: 42405 ¦
¦ ¦
¦ Cross-parameter style: AVG ¦
¦ Cross-parameter bins: 100 (maximum 2550) ¦
¦ ¦
¦ Parameters per plot: 2 ¦
¦ ¦
¦------------------------------------------------------------------------------¦
¦ Enter a title for the report or plot (it will be centered for you) ¦
+------------------------------------------------------------------------------+
Enter title line
5-8
Page 81

Select this option to assign a title which will appear on all reports and plots.
First sample was at:
Enter start time:
Enter stop time:
Last sample was at:
Select these options to view start and stop times of the file, and specify portions of the file to report
or plot. The first and last line of this block of information indicates the actual start and stop time of
the current file. You can identify any segment of time from within a file to report and plot data.
For example, if the duration of the deployment was fiv e day s, but y ou wish to see a report and plot
for only day three, simply enter the start and stop dates and times associated with day three. Even
though all five days of data are retained, reports and plots will show only day three.
Logging interval was:
Enter averaging interv al:
This option shows the sampling interval which was in effect throughout the deploy m ent. You may
choose to average several data points together for reporting and plotting . For example, if the
6000
UPG readings were captured every 900 seconds (15 m inutes) during the deploy m ent, you might
want the reports and plots to average four of these readings together so that the inform ation can be
reported or plotted on an hourly basis. To do this, define an averaging interval of 3600 seconds.
X-axis time per screen:
Select this option to specify the time interval on the X- axis. This line is only applicable when
Date + Time have been defined for the X-axis (see Parameters above). You can define the width
of a given plot screen in minutes by changing the number of minutes in this option.
Cross-parameter style:
Select this option to choose one of four plot styles. This option is only applicable if a parameter
other than Date + Time is selected for the X-axis (see Parameters above).
5-9
Page 82

An averaged plot (AVG) assumes a correlation between the X-axis parameter and the Y axis
parameters. The averaged plot divides the X axis into 100 equal- siz ed m emory bins. Each sample
is tallied into the appropriate memory bin based on its X-axis value. When finished, the average
value for each Y-axis parameter in each memory bin is displayed.
A sequential plot (SEQ), plots each point successively as it comes from the data file. A sequential
plot provides more detail on the data than an averaged plot, but can appear rather messy.
The increase (INC) and decrease (DEC) plots are types of sequential plots. An increasing plot only
displays points when the X-axis values are increasing. A decreasing plot only display s points when
the X-axis values are decreasing. The increasing and decreasing sequential plots are especially
useful if you are profiling and display depth on the X axis. Thus the plot shows only the time in
which the sonde is being lowered or raised.
Cross-parameter bins: 100 (maximum xxxx)
Select this option to set up the number of bins which will appear on the X-axis. This feature only
applies to reports and averaged plots (see above) with a parameter other than Date + Tim e on the X
axis. Changing this value modifies the num ber of bins into which the X-axis is divided. The
smaller the number of bins, the wider and more general is the plotted information. The maximu m
number of allowable bins varies with the capability of y our computer system, and is displayed in
parentheses.
Parameters per plot:
Select this option to setup the number of parameters which will be plotted tog ether. If you choose
1, there will be an individual X and Y axis displayed for each selected parameter. Select any
number of parameters per plot, (from 1 to 4) w hich prov ides y our data w ith the best plot
presentation.
5-10
Page 83

Select the Scaling Info menu option
+------------------------------------------------------------------------------+
¦ Sonde File Setup Real-Time Exit YSI PC6000 ¦
¦------------------------------------------------------------------------------¦
¦ ¦
¦ ¦
¦ ¦
¦ +--------------------------------------------------------+ ¦
¦ ¦ Filename: SRUNS62O.DAT ¦ ¦
¦ ¦--------------------------------------------------------¦ ¦
¦ ¦ MODIFY ¦ VIEW ¦ SYSTEM ¦ ¦
¦ ¦------------------+------------------+------------------¦ ¦
¦ ¦ Parameters... ¦ Header ¦ Print Report ¦ ¦
¦ ¦ Control Info... ¦ Report ¦ Print Plot ¦ ¦
¦¦Scaling Info... ¦ Plot ¦ Definitions... ¦ ¦
¦ ¦ ¦ Statistics ¦ Export ¦ ¦
¦ +--------------------------------------------------------+ ¦
¦ ¦
¦ ¦
¦ ¦
¦ ¦
¦ ¦
¦ ¦
¦------------------------------------------------------------------------------¦
¦ View or change scaling technique, minima, and maxima ¦
+------------------------------------------------------------------------------+
There are three scaling options.
+------------------------------------------------------------------------------+
¦ Sonde File Setup Real-Time Exit YSI PC6000 ¦
¦------------------------------------------------------------------------------¦
¦ Scaling technique: automatic ¦
¦ Copy default to manual ¦
¦ Copy automatic to manual Default Manual Automatic ¦
¦ Scaling Scaling Scaling ¦
¦ Parameter Units Minimum Maximum Minimum Maximum Minimum Maximum ¦
¦ ------------ -------- ------- ------- ------- ------- ------- ------- ¦
¦ Temperature C -5 45 -5 45 -5 45 ¦
¦ Specific Cond mS/cm 0 235 0 235 0 235 ¦
¦ DO mg/L 0 20 0 20 0 20 ¦
¦pH 214214214¦
¦ ORP mV -1000 1000 -1000 1000 -1000 1000 ¦
¦ Battery volts 0 30 0 30 0 30 ¦
¦ Turbidity NTU 0 1000 0 1000 0 1000 ¦
¦ ¦
¦ ¦
¦ ¦
¦ ¦
¦ ¦
¦ ¦
¦------------------------------------------------------------------------------¦
¦ Select scaling technique (default, manual, automatic) ¦
+------------------------------------------------------------------------------+
Default scaling offers fixed limits. These limits correspond to the rang e of each parameter as
defined by the sensor specifications, so your plot will always fit w ithin these lim its.
Manual scaling allows you to enter custom limits for each parameter.
Automatic scaling. The com puter scans the data file and determ ines its limits, then displays those
limits on the plot.
NOTE: When entering a scaling technique, you need only type the first letter of the desired
technique and press Enter. PC6000 will fill in the rest.
5-11
Page 84

Copy default to manual
Copy automatic to manual
Select these options to provide a quick way to copy from either the default or automatic limits
columns to the manual scaling colum n. O nce data has been copied into the manual scaling column,
it can be modified. After copying is com plete, any prev ious manual limits you m ay hav e defined
will be lost.
Default scaling
This column shows the default scaling limits. These lim its cannot be chang ed.
Manual scaling
This column shows the manual scaling limits which you can modify .
Automatic scaling
This column shows the automatic scaling lim its. These lim its can not be chang ed, but are updated
each time an automatically scaled plot is g enerated.
5-12
Page 85

2. VIEW File Options
All of the View options allow you to view file data on the screen.
+------------------------------------------------------------------------------+
¦ Sonde File Setup Real-Time Exit YSI PC6000 ¦
¦------------------------------------------------------------------------------¦
¦ ¦
¦ ¦
¦ ¦
¦ +--------------------------------------------------------+ ¦
¦ ¦ Filename: SRUNS62O.DAT ¦ ¦
¦ ¦--------------------------------------------------------¦ ¦
¦ ¦ MODIFY ¦ VIEW ¦ SYSTEM ¦ ¦
¦ ¦------------------+------------------+------------------¦ ¦
¦ ¦ Parameters... ¦ Header ¦ Print Report ¦ ¦
¦ ¦ Control Info... ¦ Report ¦ Print Plot ¦ ¦
¦ ¦ Scaling Info... ¦ Plot ¦ Definitions... ¦ ¦
¦ ¦ ¦ Statistics ¦ Export ¦ ¦
¦ +--------------------------------------------------------+ ¦
¦ ¦
¦ ¦
¦ ¦
¦ ¦
¦ ¦
¦ ¦
¦------------------------------------------------------------------------------¦
¦ Press Enter to view header information about the file ¦
+------------------------------------------------------------------------------+
Select the Header menu option to display complete inform ation about the sonde, probes, and
configuration of the current file.
+------------------------------------------------------------------------------+
¦ Sonde File Setup Real-Time Exit YSI PC6000 ¦
¦------------------------------------------------------------------------------¦
¦ ¦
¦ ¦
¦ ¦
¦ +--------------------------------------------------------+ ¦
¦ ¦ Filename: SRUNS62O.DAT ¦ ¦
¦ ¦--------------------------------------------------------¦ ¦
¦ ¦ MODIFY ¦ VIEW ¦ SYSTEM ¦ ¦
¦ ¦------------------+------------------+------------------¦ ¦
¦ ¦ Parameters... ¦ Header ¦ Print Report ¦ ¦
¦ ¦ Control Info... ¦ Report ¦ Print Plot ¦ ¦
¦ ¦ Scaling Info... ¦ Plot ¦ Definitions... ¦ ¦
¦ ¦ ¦ Statistics ¦ Export ¦ ¦
¦ +--------------------------------------------------------+ ¦
¦ ¦
¦ ¦
¦ ¦
¦ ¦
¦ ¦
¦ ¦
¦------------------------------------------------------------------------------¦
¦ Generate a report on the screen ¦
+------------------------------------------------------------------------------+
Select the Report menu option to display a complete list of all readings (as defined by the settings
in the Modify portion of the menu) from the current file to the screen. As the report is scrolled onto
the screen, it can be paused at any time by pressing any k ey. Once the entire report has been
displayed, use the arrow keys, the page up and page down k ey s, or the hom e and end k ey s to move
to any location within the report. If your com puter sy stem has limited RAM, early data points
within a report may become unav ailable for v iewing . To redisplay unav ailable data points, simply
redisplay the report from the beginning.
5-13
Page 86

+------------------------------------------------------------------------------+
¦ Sonde File Setup Real-Time Exit YSI PC6000 ¦
¦------------------------------------------------------------------------------¦
¦ ¦
¦ ¦
¦ ¦
¦ +--------------------------------------------------------+ ¦
¦ ¦ Filename: SRUNS62O.DAT ¦ ¦
¦ ¦--------------------------------------------------------¦ ¦
¦ ¦ MODIFY ¦ VIEW ¦ SYSTEM ¦ ¦
¦ ¦------------------+------------------+------------------¦ ¦
¦ ¦ Parameters... ¦ Header ¦ Print Report ¦ ¦
¦ ¦ Control Info... ¦ Report ¦ Print Plot ¦ ¦
¦ ¦ Scaling Info... ¦ Plot ¦ Definitions... ¦ ¦
¦ ¦ ¦ Statistics ¦ Export ¦ ¦
¦ +--------------------------------------------------------+ ¦
¦ ¦
¦ ¦
¦ ¦
¦ ¦
¦ ¦
¦ ¦
¦------------------------------------------------------------------------------¦
¦ Generate a plot on the screen ¦
+------------------------------------------------------------------------------+
Select the Plot menu option to display a plot of the current data file to the screen. The plot can be
customized, see Parameters and Control Info above. A plot can be abandoned at any time by
pressing Esc, or paused by striking any other k ey. If a plot is too large to fit on one screen, it will
automatically mov e to a new screen.
+------------------------------------------------------------------------------+
¦ Sonde File Setup Real-Time Exit YSI PC6000 ¦
¦------------------------------------------------------------------------------¦
¦ ¦
¦ ¦
¦ ¦
¦ +--------------------------------------------------------+ ¦
¦ ¦ Filename: SRUNS62O.DAT ¦ ¦
¦ ¦--------------------------------------------------------¦ ¦
¦ ¦ MODIFY ¦ VIEW ¦ SYSTEM ¦ ¦
¦ ¦------------------+------------------+------------------¦ ¦
¦ ¦ Parameters... ¦ Header ¦ Print Report ¦ ¦
¦ ¦ Control Info... ¦ Report ¦ Print Plot ¦ ¦
¦ ¦ Scaling Info... ¦ Plot ¦ Definitions... ¦ ¦
¦¦ ¦Statistics ¦ Export ¦ ¦
¦ +--------------------------------------------------------+ ¦
¦ ¦
¦ ¦
¦ ¦
¦ ¦
¦ ¦
¦ ¦
¦------------------------------------------------------------------------------¦
¦ View statistics from the most-recently generated report/plot ¦
+------------------------------------------------------------------------------+
Select the Statistics menu option to view statistics of a data file, or portion of a data file. As with
reports and plots, the displayed statistics are affected by the choices you have m ade in the
Parameters, and the Control info menus described previously. To v iew statistics for a portion of a
file enter the start and stop times in Control Info. Statistics are only available after a report or plot
is run.
5-14
Page 87

+------------------------------------------------------------------------------+
¦ Sonde File Setup Real-Time Exit YSI PC6000 ¦
¦------------------------------------------------------------------------------¦
¦ ¦
¦ ¦
¦ Sensor Type Minimum Maximum Mean Std.Dev. ¦
¦ ¦
¦ Temperature (C) 10.20 27.34 14.60 2.365 ¦
¦ Specific Cond (mS/cm) 0.00 0.82 0.76 0.099 ¦
¦ DO (mg/L) 7.50 10.86 8.80 0.638 ¦
¦ pH 6.85 7.61 7.33 0.108 ¦
¦ ORP (mV) 400.3 513.3 446.4 15.93 ¦
¦ Battery (volts) 10.3 12.8 11.0 0.46 ¦
¦ ¦
¦ ¦
¦ Number of samples = 2828 ¦
¦ ¦
¦ ¦
¦ ¦
¦ ¦
¦ ¦
¦ ¦
¦------------------------------------------------------------------------------¦
¦ View statistics. Press F2 to print. Press Esc to return... ¦
+------------------------------------------------------------------------------+
To print a copy of the statistics screen, press the F2 key.
5-15
Page 88

3. SYSTEM File Options
SYSTEM menu options allow you to print the report and plot, or export data to some other
software program. The specific setup format of the report or plot can also be frozen for future
access.
+------------------------------------------------------------------------------+
¦ Sonde File Setup Real-Time Exit YSI PC6000 ¦
¦------------------------------------------------------------------------------¦
¦ ¦
¦ ¦
¦ ¦
¦ +--------------------------------------------------------+ ¦
¦ ¦ Filename: SRUNS62O.DAT ¦ ¦
¦ ¦--------------------------------------------------------¦ ¦
¦ ¦ MODIFY ¦ VIEW ¦ SYSTEM ¦ ¦
¦ ¦------------------+------------------+------------------¦ ¦
¦ ¦ Parameters... ¦ Header ¦ Print Report ¦¦
¦ ¦ Control Info... ¦ Report ¦ Print Plot ¦ ¦
¦ ¦ Scaling Info... ¦ Plot ¦ Definitions... ¦ ¦
¦ ¦ ¦ Statistics ¦ Export ¦ ¦
¦ +--------------------------------------------------------+ ¦
¦ ¦
¦ ¦
¦ ¦
¦ ¦
¦ ¦
¦ ¦
¦------------------------------------------------------------------------------¦
¦ Generate a report on the printer (and screen) ¦
+------------------------------------------------------------------------------+
Select the Print Report option to send your report to the printer. After y ou select this option, a
prompt will appear on the screen asking if your printer is ready. Press Enter to proceed with the
print operation. If more than 8 parameters are to be printed, PC 6000 will assume you have a
wide-carriage printer. If y our printer is not wide-carriage, set your printer to compress mode before
printing (see your printer's m anual for instructions).
Note: The printer port option (in the setup menu) specifies the computer port to which the report
will be sent.
+------------------------------------------------------------------------------+
¦ Sonde File Setup Real-Time Exit YSI PC6000 ¦
¦------------------------------------------------------------------------------¦
¦ ¦
¦ ¦
¦ ¦
¦ +--------------------------------------------------------+ ¦
¦ ¦ Filename: SRUNS62O.DAT ¦ ¦
¦ ¦--------------------------------------------------------¦ ¦
¦ ¦ MODIFY ¦ VIEW ¦ SYSTEM ¦ ¦
¦ ¦------------------+------------------+------------------¦ ¦
¦ ¦ Parameters... ¦ Header ¦ Print Report ¦ ¦
¦ ¦ Control Info... ¦ Report ¦ Print Plot ¦¦
¦ ¦ Scaling Info... ¦ Plot ¦ Definitions... ¦ ¦
¦ ¦ ¦ Statistics ¦ Export ¦ ¦
¦ +--------------------------------------------------------+ ¦
¦ ¦
¦ ¦
¦ ¦
¦ ¦
¦ ¦
¦ ¦
¦------------------------------------------------------------------------------¦
¦ Generate a plot on the printer (and screen) ¦
+------------------------------------------------------------------------------+
5-16
Page 89

Select the Print Plot option to send your plot to the printer. After you select this option, a prom pt
will appear on the screen asking if your printer is ready. Press Enter to proceed with the print
operation. Printing takes place after the plot is completely draw n on the screen.
Note: The printer port option (in the setup menu) specifies the computer port to which the report
will be sent.
+------------------------------------------------------------------------------+
¦ Sonde File Setup Real-Time Exit YSI PC6000 ¦
¦------------------------------------------------------------------------------¦
¦ ¦
¦ ¦
¦ ¦
¦ +--------------------------------------------------------+ ¦
¦ ¦ Filename: SRUNS62O.DAT ¦ ¦
¦ ¦--------------------------------------------------------¦ ¦
¦ ¦ MODIFY ¦ VIEW ¦ SYSTEM ¦ ¦
¦ ¦------------------+------------------+------------------¦ ¦
¦ ¦ Parameters... ¦ Header ¦ Print Report ¦ ¦
¦ ¦ Control Info... ¦ Report ¦ Print Plot ¦ ¦
¦ ¦ Scaling Info... ¦ Plot ¦ Definitions... ¦ ¦
¦ ¦ ¦ Statistics ¦ Export ¦ ¦
¦ +--------------------------------------------------------+ ¦
¦ ¦
¦ ¦
¦ ¦
¦ ¦
¦ ¦
¦ ¦
¦------------------------------------------------------------------------------¦
¦ Select, modify, or create definitions of reports/plots ¦
+------------------------------------------------------------------------------+
Select the Definitions option to create and save different report or plot configurations from the
same data file. Each different file will contain all options and setup information y ou hav e defined
in the modify menus. See the MODIFY options earlier in this section. After y ou hav e selected
Definitions from the SYSTEM menu, the following menu will be displayed.
+------------------------------------------------------------------------------+
¦ Sonde File Setup Real-Time Exit YSI PC6000 ¦
¦------------------------------------------------------------------------------¦
¦ ¦
¦ ¦
¦ Active definition: default report/plot ¦
¦ ¦
¦ Select an action: Select a definition ¦
¦ Create new definition ¦
¦ Rename active definition ¦
¦ Delete active definition ¦
¦ Clear active definition ¦
¦ ¦
¦ ¦
¦ ¦
¦ ¦
¦ ¦
¦ ¦
¦ ¦
¦ ¦
¦ ¦
¦ ¦
¦------------------------------------------------------------------------------¦
¦ Select a definition to be active ¦
+------------------------------------------------------------------------------+
5-17
Page 90

Active definition:
Select this option to display the name of the current active definition.
Select a definition:
Select this option to retrieve an old definition.
Create new definition:
Select this option to create a new report and plot format which you will specify by variation of the
current format after the new format has been named. For example, if you want to report and plot
only dissolved oxygen reading s in mg/L for your study instead of all param eters, first create a new
definition at the prompt by typing “DO” (or any other desig n ation of y our choice). Then exit the
definition menu by pressing Esc. Scroll to the Param eters menu and eliminate all parameters
except DO, mg/L. This data presentation can then be reported, plotted, or exported, but more
importantly, if you return to this data file at a later tim e, the “DO ” definition can alw ay s be selected
to provide this same data format since it has been sav ed under its own desig nation.
Remember: Always name the new definition in the “create new designation” option prior to making
changes which will define the new format.
Rename active definition:
Select this option to change the name of the active definition.
Delete active definition:
Select this option to remove the active definition from the file.
5-18
Page 91

Clear active definition:
Select this option to reset the active definition to default values. Thus all customiz ation features
you previously set up are reset to default values.
+------------------------------------------------------------------------------+
¦ Sonde File Setup Real-Time Exit YSI PC6000 ¦
¦------------------------------------------------------------------------------¦
¦ ¦
¦ ¦
¦ ¦
¦ +--------------------------------------------------------+ ¦
¦ ¦ Filename: SRUNS62O.DAT ¦ ¦
¦ ¦--------------------------------------------------------¦ ¦
¦ ¦ MODIFY ¦ VIEW ¦ SYSTEM ¦ ¦
¦ ¦------------------+------------------+------------------¦ ¦
¦ ¦ Parameters... ¦ Header ¦ Print Report ¦ ¦
¦ ¦ Control Info... ¦ Report ¦ Print Plot ¦ ¦
¦ ¦ Scaling Info... ¦ Plot ¦ Definitions... ¦ ¦
¦ ¦ ¦ Statistics ¦ Export ¦¦
¦ +--------------------------------------------------------+ ¦
¦ ¦
¦ ¦
¦ ¦
¦ ¦
¦ ¦
¦ ¦
¦------------------------------------------------------------------------------¦
¦ Generate a report and send it to a disk file (and screen) ¦
+------------------------------------------------------------------------------+
Select the Export menu option to export a data file to another program. After selecting the Export
option you will be asked to name the file to be exported. The default nam e is the sam e as the
current data file with the extension PRN or CDF, depending on the export format selected. Export
formats are selected in the Advanced Setup menu; see Section 5.5. After the file has been exported
to disk, it can be retrieved using any prog ram you choose. This feature is especially useful when
exporting to a database or a spreadsheet program. Follow the importing instructions outlined in the
destination program to retrieve the export file you hav e created.
5-19
Page 92

5.5 THE SETUP MENU
Choosing the Setup option from the menu bar allows you to configure the PC program to your
specifications. Highlight Setup, from the m enu bar and press Enter.
+------------------------------------------------------------------------------+
¦ Sonde File Setup Real-Time Exit YSI PC6000 ¦
¦------------------------------------------------------------------------------¦
¦ ¦
¦ ¦
The setup menu will be displayed:
+------------------------------------------------------------------------------+
¦ Sonde File Setup Real-Time Exit YSI PC6000 ¦
¦------------------------------------------------------------------------------¦
¦ ¦
¦ ¦
¦ ¦
¦ -----DISPLAY-FORMATS----- -----------COMPUTER-CONNECTIONS----------- ¦
¦ Date format: mdy Comm port: 1 ¦
¦ Date separator: / Baud rate: 9600 ¦
¦ Time separator: : Printer port: 1 ¦
¦ Radix mark: . Printer type: HP LaserJet laser ¦
¦ ¦
¦ ¦
¦ -------MORE-SETUP-------- -------------COMPUTER-DISPLAY------------- ¦
¦ Data capture setup... Menu colors: Bering Sea (color) ¦
¦ Advanced Setup... Plot colors: Ohio River (color) ¦
¦ Graphics mode: Automatic selection hi-res ¦
¦ ¦
¦ ¦
¦ ¦
¦ ¦
¦ ¦
¦------------------------------------------------------------------------------¦
¦ Press Enter to access advanced setup items ¦
+------------------------------------------------------------------------------+
Other than the Comm port and Printer port options, the default values are adequate to perform
virtually every function of the 6000
UPG.
Comm port: 1
Baud rate: 9600
Select these options if it is necessary to change the default comm unications setup. These options
must be properly set before attempting to communicate with the software inside the sonde. See
Section 4.5. If you have difficulty communicating with the sonde, change the com m port and try
again. PC6000 allows only Comm port 1 or 2.
The baud rate can be changed by highlighting it and pressing Enter. Select from a list of possible
baud rates which will be displayed. The baud rate you select here must match the baud rate set in
the sonde (which defaults to 9600). See Section 4.3.
5-20
Page 93

Date format: MDY
Date separator: /
Time separator: :
Radix mark: .
Select any of these options to change them from their default. Users m ay specify any order of day
(D), month (M), and year (Y) by selecting Date format.. The other options are used primarily
outside of the US where other characters are sometimes used to separate numbers in dates, times, or
decimals.
Printer port: 1
Printer type: HP LaserJet laser
Select these options to tell PC6000 about your computer system ' s printer and how it is connected. If
you have difficulty printing, specify a different printer port here (1, 2, or 3) and try ag ain.
Select the Printer type: option to provide a list of printers which are supported by PC6000. Select
a printer that best describes your system' s printer. If you have difficulty printing, try a different
selection here. It may also be necessary to consult the printer instruction m anual to determine what
type of printer your printer emulates.
NOTE: The printer type option only affects plot output and has no effect on report printing.
Menu colors
Plot colors
Graphic Mode
Select these options to tell PC6000 what type of monitor your com puter has, and chang e the colors
of both menus and plots as they are displayed on the screen. These color selections have no effect
on the printed output of reports and plots. If none of the color schemes are to your liking, you can
setup a User Defined color scheme. See Section 5.7.
From the list provided, choose a graphics mode which best matches your video adapter and
monitor. If you hav e difficulty , consult y our v ideo adapter's instruction manual.
Data Capture Setup
See section 5.6 for a detailed explanation of this menu.
5-21
Page 94

Advanced Setup
See Section 5.7 for a detailed explanation of this menu.
5-22
Page 95

5.6 DATA CAPTURE / REAL-TIME SETUP
Once the Real-time mode has been properly set up, you will be able to view the data in real-time as
it is taken in the Discrete Sample mode by the sonde. Each reading is display ed at the bottom of the
real-time screen, and plots are updated with the arrival of each data point. In addition, the data will
be automatically stored to the disk drive (hard or floppy ) which y ou select. The setup process is not
difficult, but you should follow the instructions in the following section exactly to be sure of
successful operation in this mode.
STEP 1. Access the Sonde from the PC6000 menu bar and Start sampling. Make certain that the
parameters which you want to view in real time and are display ed correctly. Adjust these
parameters, if necessary, via the Report Setup menu of the Sonde software. Once the proper
parameters are displayed to the screen, exit the Sonde menu structure by pressing F10 and return to
the menu bar of the PC6000 software.
STEP 2: Select Setup from the PC6000 menu bar, and then Data capture setup, pressing Enter
after each entry. Access the Parser of this menu with the arrow keys and make certain that it is set
to 6000. If not, type 6000 at the prompt, and press Enter. Next access the Site Name portion of
the menu and enter any appropriate name. This nam e is prov ided for identify ing purposes only . It
is displayed on the File Header Menu, and it appears on the Real-Time plot screen and Real- Tim e
plot printout. Now access the Filename portion of the menu and enter the nam e of the file under
which you wish your data to be stored, and press Enter. Now access the Auto-configure entry of
the menu, and press Enter. There will be a 5-10 second delay while the PC6000 software exam ines
the sonde software to determine the parameters which you hav e decided to v iew in real- time. When
the process is complete, the these parameters will appear in the list in the lower portion of the Data
capture setup menu.
STEP 3: Set up the display which will be viewed in real-time. First, set the X-axis time per
screen in minutes. Next, set the Parameters per plot which can be a value from 1 to 4. Finally,
set the Beep notification to indicate the acquisition of either good data, bad data, or all data (both).
Bad data is defined as that which, when arriving from the sonde, contains errors in the
communication protocol and is rarely observ ed. I f y ou prefer, you can eliminate the beep function
completely by selecting off. B e sure to press Enter after each entry.
STEP 4: Set the scaling for each of the parameters in the lower right portion of the m enu. There is
no automatic scaling in this mode, so y ou should select the m anual scaling ranges which will result
in meaningful display of your data. These selections w ill becom e easier w ith experience. U se the
Tab key to move from Minimum to Maximum and the arrow keys to mov e v ertically w hen
carrying out this operation. Be sure to press Enter after each scaling entry.
STEP 5: After entering scaling factors, exit to the PC6000 menu bar by pressing Esc twice. Then
access the Sonde portion of the PC6000 menu and press Enter. Type “Menu” at the # prompt and
press Enter. Select the Run menu, and begin sampling at the samp le interv al which is suitable for
5-23
Page 96

you study. While the discrete sample mode is still operative, exit. to the PC 6000 menu bar by
pressing F10 (do not press Esc or the sampling will be terminated).
STEP 6: From the PC6000 menu bar, select Real-Time and press Enter. The Discrete Sample
data from the sonde will be plotted on the display and will be logg ed to disk automatically under
your designated file name.
COMMON CAUSES OF ERRORS IN REAL-TIME MODE:
1. The “Parser” is not set to “6000”. Set the Parser to “6000”
2. You have selected more parameters in the Sonde Report Setup than can be viewed on the
computer screen. Remove tim e and date and/or other less important parameters in the Report
Setup Menu so that all selected parameters are visible in Discrete Sample display.
3. The name which you entered for your data file already exists on your storage disk, but the file
format for the initial study is different from the current file form at. C hang e the name of the
data file or delete the existing data file of this name from y our disk .
4. You exited the Discrete Sample mode of the sonde software using Esc rather than F10.
Return to the Sonde menu and select Run. Restart the Start sampling mode and exit with
F10 to the PC6000 menu bar. Choose Real-Time and press Enter.
5.7 ADVANCED SETUP
From the PC6000 menu bar, select Setup. The setup menu will be display ed.
+------------------------------------------------------------------------------+
¦ Sonde File Setup Real-Time Exit YSI PC6000 ¦
¦------------------------------------------------------------------------------¦
¦ ¦
¦ ¦
¦ ¦
¦ -----DISPLAY-FORMATS----- -----------COMPUTER-CONNECTIONS----------- ¦
¦ Date format: mdy Comm port: 2 ¦
¦ Date separator: / Baud rate: 9600 ¦
¦ Time separator: : Printer port: 1 ¦
¦ Radix mark: . Printer type: HP LaserJet laser ¦
¦ ¦
¦ ¦
¦ -------MORE-SETUP-------- -------------COMPUTER-DISPLAY------------- ¦
¦ Data capture setup... Menu colors: Bering Sea (color) ¦
¦ Advanced Setup... Plot colors: Ohio River (color) ¦
¦ Graphics mode: Automatic selection hi-res ¦
¦ ¦
¦ ¦
¦ ¦
¦ ¦
¦ ¦
¦------------------------------------------------------------------------------¦
¦ Press Enter to access advanced setup items ¦
+------------------------------------------------------------------------------+
5-24
Page 97

Advanced Setup
Select this option to display the following menu.
+------------------------------------------------------------------------------+
¦ Sonde File Setup Real-Time Exit YSI PC6000 ¦
¦------------------------------------------------------------------------------¦
¦ ¦
¦ ¦
¦ ------------GLOBAL-SWITCHES------------ -----------EXPORT----------- ¦
¦ Default scaling technique: automatic Export file format: prn ¦
¦ Default parameters per plot: 2 Export date format: form ¦
¦ Full-screen sonde menu: no Export header format: - ¦
¦ Multiple formula query: yes CDF delimiter: , ¦
¦ ¦
¦ --------------DATA-FILES--------------- ¦
¦ Default data directory: ¦
¦ ¦
¦ -------------USER-DEFINED-------------- ¦
¦ User-defined menu colors... ¦
¦ User-defined plot colors... ¦
¦ User-defined printer control codes: ¦
¦ ¦
¦ ¦
¦ ¦
¦ ¦
¦------------------------------------------------------------------------------¦
¦ The scaling technique for new plots (default, manual, automatic) ¦
+------------------------------------------------------------------------------+
It is important to remember that the default values assigned to these options will be correct for m ost
operations. These options are provided for the advanced user who has special requirements of
PC6000.
NOTE: Most changes in the Advanced Setup Menu require the user to press Enter after the
parameter is altered.
Full-screen sonde menu: Y
Select this option to specify whether terminal emulation should use the entire PC screen, or should
take place within the usual border drawn by the PC software.
Export date format: FORM
Select this option to choose from a variety of date form ats for the exported data.
FORM (formatted):
MM/DD/YY and HH:MM:SS.
SEP (separated):
6 numeric values (m,d,y ,h,m ,s).
COMB (combination):
5-25
Page 98

YYYYMMDD and a string of the form HH:MM:SS.
JUL (Julian):
A ten-digit integral number of seconds past midnight March 1, 1984. NUM (numeric):
A fixed point number of the form DDDDDD.TTTTTT where DDDDDD is the number of days past
December 31 1899, and where TTTTTT is the fractional part of the day which has elapsed (.750000
is 6 PM).
REL (relative):
A fixed point number of the form HHHH.HHHH giving the number of hours elapsed since the first
sample in the file.
NOTE: The export date format only applies to CDF and SDF export files. The date and time
formats displayed on the PC6000 screen are determined in the SETUP menu.
Export header format: --
Select this option to specify what header lines (if any) should be included at the top of CDF and
SDF export files. The header can contain up to three lines.
(-): No header lines.
P: One header line, containing the name of each Parameter.
U: One header line, containing the name of each Unit.
T: One header line, containing the name of the report Title.
Multiple formula query: N
Select this option to change the characteristics of a derived parameter. This option should be set to
N for no, except for advanced users.
User-Defined menu colors
Select this option to customize the menu colors of PC6000. Changing the colors using this option
will permanently modify the color scheme of User Defined Colors in the Setup menu.
5-26
Page 99

To use this feature, select a menu item to be changed from the lists prov ided. Find the box which
has the same title as the item you selected. Watch the box as y ou press enter repeatedly to scroll
through the various color options. Stop scrolling when the desired color is displayed and press Esc.
Continue this process until all colors are as you prefer.
User-Defined plot colors
Select this option to modify the plot colors of PC6000. As detailed in the User-defined m enu colors
section above, select a plot item to be changed from the list prov ided and press Ente r. Watch the
sample plot as you repeatedly press Enter. Press Esc when the item color you prefer is display ed.
Repeat this process until all plot colors are as you prefer.
Default Data Directory:
Select this option to specify the drive and directory to which you want all PC6000 files to be stored.
Type the drive and directory to which you wish all PC6000 data files to be stored when captured
from the sonde.
Example: Typing C:\PC6000 would save all data files to the C:\ drive and to a directory called
PC6000.
User-defined printer control codes:
Select this option to manually enter special printer comm ands. Consult your printer's instruction
manual for the specific commands compatible with your printer.
Export file format: PRN
Select this option to setup a format if you wish to export data to another program ; see Section 5.4.
The correct format to specify is determined by the software to which y ou want to export data.
Consult the manual of the destination software to determine the compatible format.
The three export format choices PC6000 allows are:
Printer format (PRN):
Select this option to export data in exactly the same format as it would be sent to a printer. All pag e
headings, column headings, and form feeds are present in the export file.
Comma & " " delim ited format (CDF):
Select this option to export data in a format which encases all strings of data in double quotes, and
separates each option on each line with a comma (or other delim iter character). There will be no
spaces on any line unless they are inside a string.
5-27
Page 100
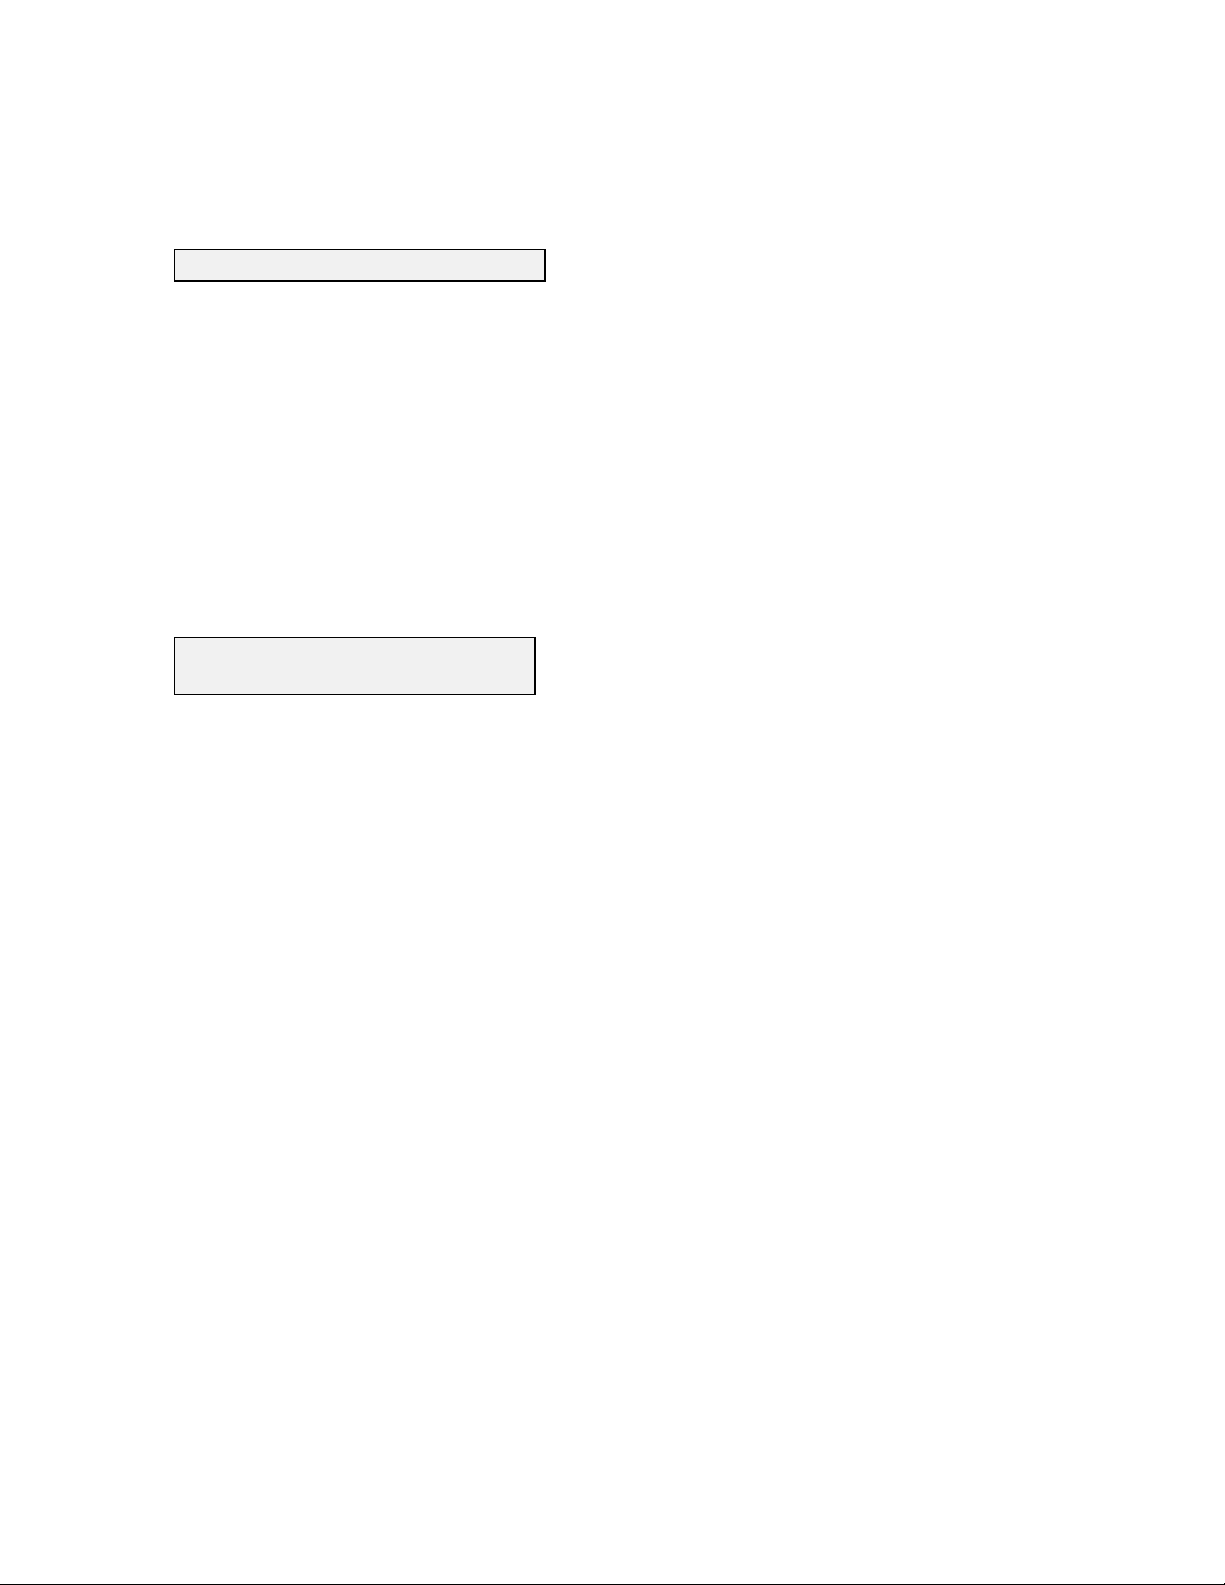
Example: "12/31/92","23:59:59",123.45,12.3,123
Space delimited format (SDF):
Select this option to export data in a format with fixed-column fields, which can be string or
numeric. Strings and dates are left-adjusted in their field, numbers are rig ht-adjusted. Strings are
not encased in quotes. Lines are fixed width, and columns are apparent when viewing the file.
Field widths are as follows: title is 80 characters; parameter names and units are 8 characters each;
numbers are 8 digits including the radix separator and decim al dig its; formatted dates are two 8
character strings separated by 1 space; separated dates are six 3-digit v alues; combined dates are an
8-digit number and an 8 character string separated by 1 space; Julian dates are 10 digits; numeric
dates are 13 digits; relative dates are 9 digits.
Example: 12/31/92 23:59:59 123.45 12.3 123
Default scaling technique: Automatic
Default parameters per plot: 2
Select these options to modify the default values for reports and plots. These options are described
in detail in the MODIFY portion of Section 5.4. The Setup menu determines what the default
scaling technique and parameters per plot should be for each new data file. To modify these
options for all future reports and plots change the values here. To modify these options only for a
current file, see Section 5.4.
5-28
 Loading...