

Page 1

User’ s
Manual
PCAS
PC Analyzer Server Software
IM 11B06B01-01E
Yokogawa Electric Corporation
IM 11B06B01-01E
Preminary Edition
Page 2

<T oc> <Ind> <Rev> <Introduction>
Introduction
Thank you for purchasing the PCAS PC Analyz er Server Softwere II.
The PC analyzer server is a computer system designed to collect data from multiple
GC1000 analyzers and other analyzers connected to an ANABUS network. This manual
describes the basic operation of the analyzer server.
● Intended Readers
The description of the installation procedure assumes that readers have a basic knowledge
of the hardware and software required f or installing the maintenance terminal.
The same applies to descriptions on other procedures that appear later in the manual and
descriptions including Windows.
Howev er , Chapter 2 describes basic operating procedures pertaining to Windo ws so that
the reader can perform operations ev en without a basic knowledge of Windo ws.
For further details on Windows , ref er to the respective man uals.
● Information Priority
i
In addition to this manual, operating procedures and precautions on handling are also
described in the help function (on-line manual) of the PCAS PC Analyzer Server and the
README.TXT file that is saved during installation. The priority of these information sources
is as follows.
(1) README.TXT file
(2) Help function (on-line manual)
(3) User’s manual (this man ual)
● Contents of the Pac kage
The contents of the package are as follo ws. Check the contents of your pac kage.
• PCAS installation disc (CD-ROM)
• PCAS PC Analyzer Server User’s Manual (M 11B06B01-01E)
• Capture It Operation Manual (IM 11B3G1-02E)
● Trademarks
•Microsoft and Windows are registered tr ademarks or trademarks of Microsoft Corporation.
• Ethernet is a registered trademark of Xerox Corporation.
• IBM is a registered trademark of International Business Machines Corporation.
• Other company and product names mentioned herein are registered trademarks or
trademarks of their respective holders.
All Rights Reserved Copyright © 2006, Yokoga wa Electric Corporation
IM 11B06B01-01E
1st Edition : June 30,2006-00Media No. IM 11B06B01-01E 1st Edition : June. 2006 (KP)
Page 3

<T oc> <Ind> <Rev> <Introduction>
● Regarding the Software
(1) Yokoga wa does not mak e any w arranties regarding the software e xcept those men-
tioned in the warranty.
(2) Use this software with one specified computer only. You must purchase another copy
of the software for use on each additional computer .
(3) Copying this software f or purposes other than backup is strictly prohibited.
(4) Store the floppy disks (original media) containing this software in a secure place.
(5) Reverse engineering such as the disassembly or decompilation of softw are is strictly
prohibited.
(6) No portion of the software may be transferred, e xchanged, leased, or sublet f or use b y
any third party without the prior permission of Yokogawa.
● Documentation Conventions
● Symbol Marks
The following symbol marks are used in front of explanatory text in this man ual.
ii
NOTE
TIP
REFERENCE
HELP !
: Indicates a matter to which attention must be paid from the view-
point of knowing an operation or function.
: Indicates a supplementary explanation.
: Indicates an item or page that should be referred to.
: Indicates text describing the action to be taken when a message or
indication is displayed during an operation.
● Keyboard Inscriptions
Keyboard operations are indicated in this manual as shown in the follo wing example .
(Inscription example) (Meaning)
[SHIFT]+[F1] .......... Indicates that the operator must press the [F1] key while pressing
the [SHIFT] key.
● Menu Inscriptions
Menu operations are indicated in this manual as shown in the f ollowing e xample.
(Inscription example) (Meaning)
Click on [Connect] in the [System] menu ......... Click on the [System] menu, then click on
the [Connect] command.
IM 11B06B01-01E
1st Edition : June 30,2006-00
Page 4

<Int> <Ind> <Rev>
PCAS
PC Analyzer Server
Toc-1
User’ s Manual
IM 11B06B01-01E 1st Edition
CONTENTS
Introduction........................................................................................................... i
1. Outline of PCAS ......................................................................................... 1
2. Using PCAS ............................................................................................... 4
2.1 Installing PCAS .................................................................................................. 4
2.1.1 PC Analyzer Server Setup ................................................................... 4
2.1.2 Firewall Settings .................................................................................11
2.2 Configuring Network Settings..........................................................................13
2.3 Starting PCAS .................................................................................................. 14
2.4 Configuring Settings ........................................................................................15
2.5 Performing Monitoring .................................................................................... 17
2.6 Performing Maintenance ..................................................................................17
2.7 Ending PCAS.................................................................................................... 17
3. Status Screen ...........................................................................................18
4. Maintenance Screen .................................................................................20
4.1 Analyzer Status Display Screen ...................................................................... 24
4.2 ASET Connection Status Display Screen........................................................27
5. Builder Screen ..........................................................................................28
5.1 System Parameter Configuration Screen........................................................29
5.2 Analyzer Parameter Configuration Screen......................................................33
5.2.1 Analyzer Configuration Screen (GC1000 Mark II) ...............................33
5.2.2 Analyzer Parameter Configur ation Screen (ASIU)...............................34
5.3 AI Unit Configuration Screen ...........................................................................37
6. Network Monitoring Screen .....................................................................38
7. Alarm Screen ............................................................................................42
7.1 Alarm Generated Dialog Box........................................................................... 43
7.2 Alarm Status Screen .........................................................................................44
7.3 Alarm History Screen........................................................................................45
7.4 Alarm Detailed Explanation Screen .................................................................46
User’ s Manual Revision Inf ormation .................................................................... i
IM 11B06B01-01E
1st Edition : June 30,2006-00
Page 5

Blank Page
Page 6
<T oc> <Ind> <PCAS>
1. Outline of PCAS
This chapter gives an outline of PCAS and explains basic inf ormation that needs to be
known before beginning operation.
■ What is an Analyzer Server?
An analyzer server is a system consisting of PC software (PCAS) for managing the netw ork
of an analyzer bus and saving the data of GC1000 Mark II and analyzer b us system interface unit (ASIU).
■ Features of the Analyzer Server
The analyzer server makes maintenance of analyzers simple because data such as concentration values, alarms, and chromatogr aphs can be continuously sav ed f or connected
analyzers (GC1000 Mark II and ASIU)
The data of up to 64 analyzers can be managed on one analyzer server that runs on a
general-purpose Windows PC . Furthermore, up to 14 analyzer servers can be operated on
the same network.
The analyzer server has functions for monitoring network status and keeping consistency
among multiple servers. A highly reliab le system can also be built b y using a dual redundant network configuration.
1
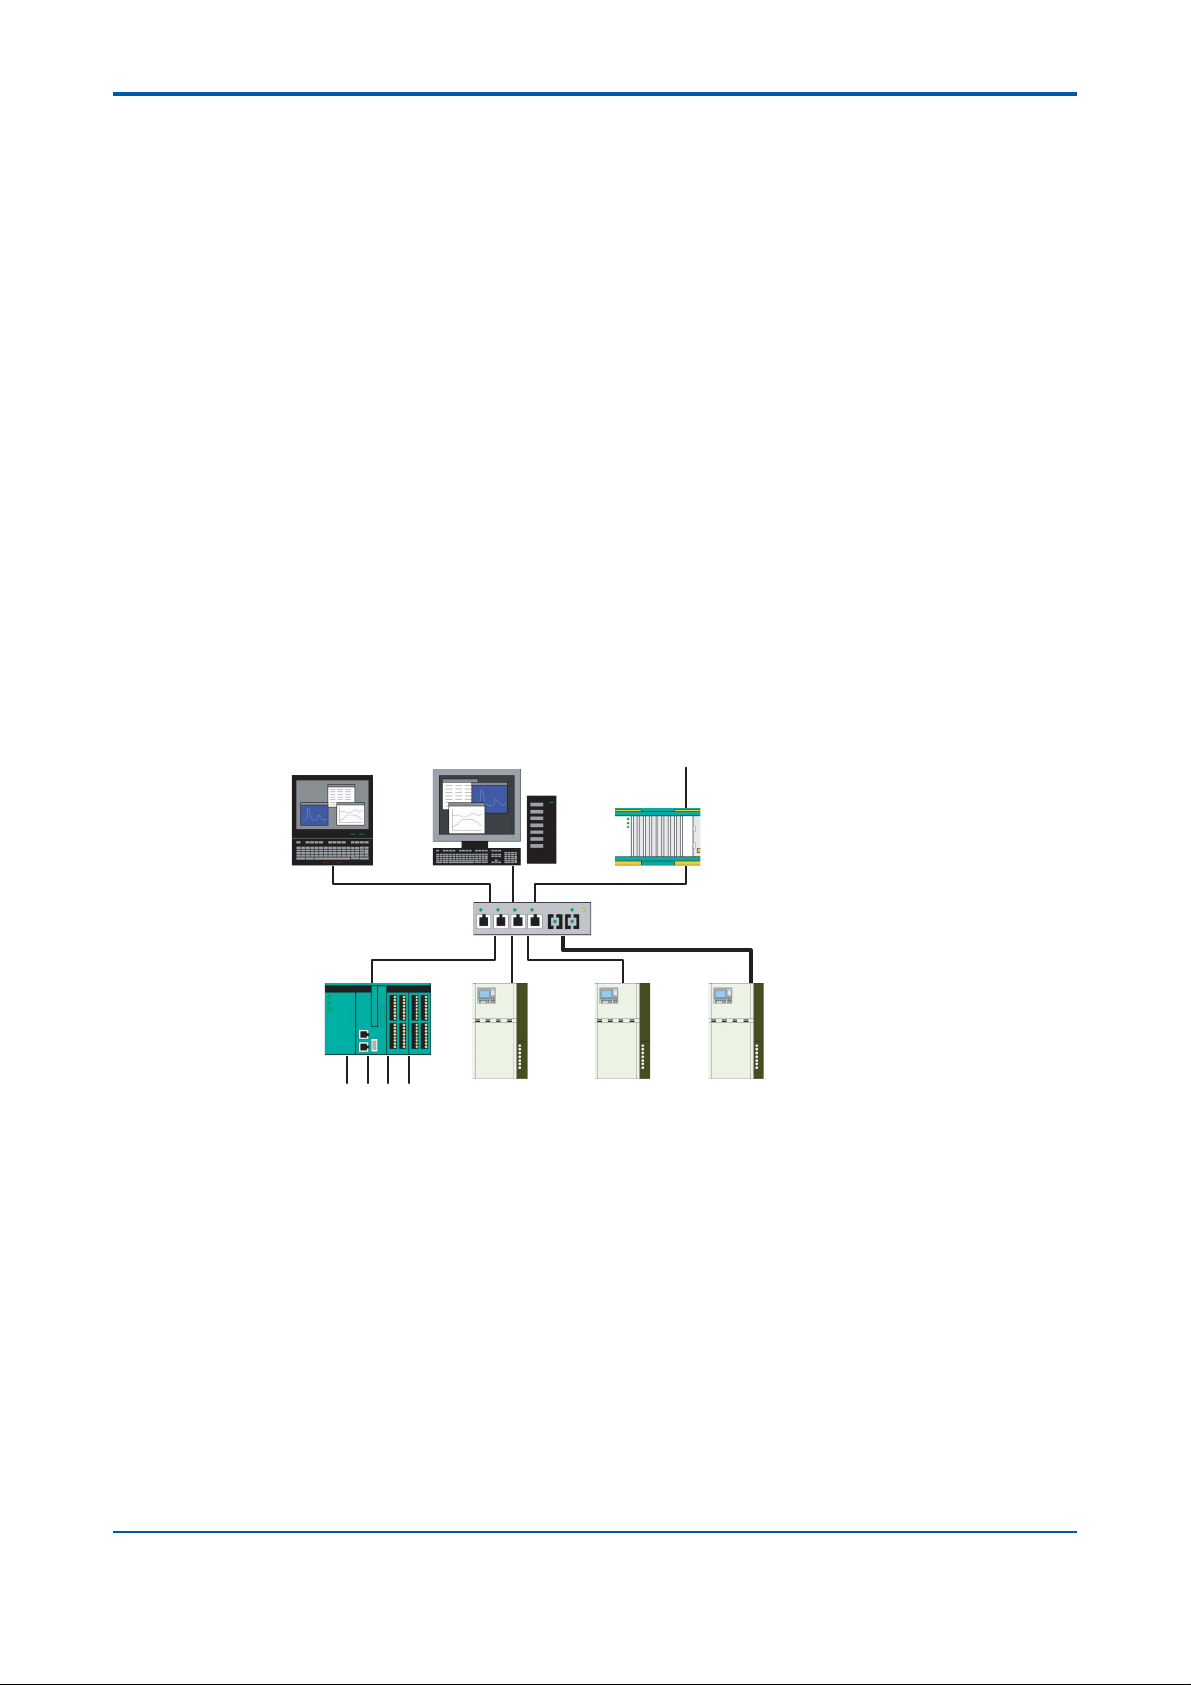
Engineering T erminal
(ASET/GCET)
Interface Unit
(ASIU)
DI/O AI
Typical System Configuration
Analyzer Server
(PCAS)
GC1000 MarkII GC1000 MarkII GC1000 MarkII
Gateway Unit
Twisted Pair
Wire
To DCS
(ASGW)
Hub
Optical Fiber
F0101.EPS
IM 11B06B01-01E 1st Edition : June 30,2006-00
Page 7

<T oc> <Ind> <PCAS>
■ Hardware Restrictions
The following hardware is required to run PCAS .
Operating environment
PC Specifications
Type: IBM PC compatible
Hard disk capacity: 10 GB or more of free space
Display: SVGA (1024 ⫻ 768)
OS: Windows 2000 with SP4, Windo ws XP Professional with SP2
Ethernet port: 1 port (100BaseTX or 100 BaseFX)
2 ports (100BaseTX or 100BaseFX) when dual redundant configuration
Other: CD drive
■ Software Requirements
PCAS
Model Name Basic Code
PCAS
Function
Language E
-A01
J
Option Code Specification
Software Package
Standard
English
Japanese
T0101.EPS
2
Analyzer server engineering terminal software (ASET) is used for handling data managed
by the PCAS. F or details on ASET, refer the user’s manual f or ASET (IM 11B06C01-01E).
Furthermore, when analyzer servers are used in a dual redundant configuration, the
following license and media are required.
Software License
License Code Description Remark
NT783AJ-LM11A Duplexed Network Program
for FCN/FCJ OPC Server
Software Media
CD-ROM Code Description Remark
NT203AJ-PC11E Software Media The software media provided for
Required for each PC
T0102.EPS
ASGW or ASIU can be used.
T0103.EPS
IM 11B06B01-01E
1st Edition : June 30,2006-00
Page 8

<T oc> <Ind> <PCAS>
■ Outline of Screens
PCAS has the following screens . F or details, ref er to chapters 3 to 7.
● Status Screen
This screen is for displa ying a list of the communication connection status of all registered
analyzers.
● Maintenance Screen
This screen is for uploading and downloading the parameters of analyz ers, changing the
communication status of the server, etc.
● Builder Screen
This screen is for displaying and configuring parameters required b y the system. The
storage periods for data can also be set in this screen.
● Network Monitoring Screen
This screen is for monitoring the network status of the analyzer bus.
3
● Alarm Screen
This screen is for displa ying alarms generated on PCAS. The alarm history can also be
displayed.
■ Explanation of T erms
● Server Equalization
This is the process of specifying any two servers (PCAS) when there are multiple servers
on the same network and copying and backing up all the inf ormation of one server onto the
other server.
● Primary Server and Secondary Server
The term primary server is used for the server that is the equalization source and the term
secondary server is used for the server that is the equalization destination.
● Electronic Message
This is the packet used f or communication e xchange between an analyz er and the server .
● Filter
This is a means of displaying only necessary/unnecessary electronic messages in the
Network Monitoring screen.
● Server Communication Status
This is the term used when indicating communication is permitted or no connection is possible.
● Memory Dump
This is the operation of the server acquiring the internal information of an analyzer in binary
format.
IM 11B06B01-01E 1st Edition : June 30,2006-00
Page 9
<T oc> <Ind> <PCAS>
2. Using PCAS
This chapter describes the procedures that need to be performed to use PCAS. F or descriptions on screen operations, refer to the description on each screen in chapter 3.
2.1 Installing PCAS
2.1.1 PC Analyzer Server Setup
This section describes the procedure for installing PC Analyzer Server (PCAS) on your PC
system. The operating system used in this description is Windows XP. Screen displa y and
operation may diff er for Windows 2000.
■ Setup Procedure
(1) Start Windows.
(2) Insert the setup disc into the CD drive. The f ollo wing dialog box appears to notify y ou
that the PC has automatically determined the software that should be installed. Confirm the content of the dialog box and then click the OK button.
4
F0201.EPS
PCASInstall Dialog Box.
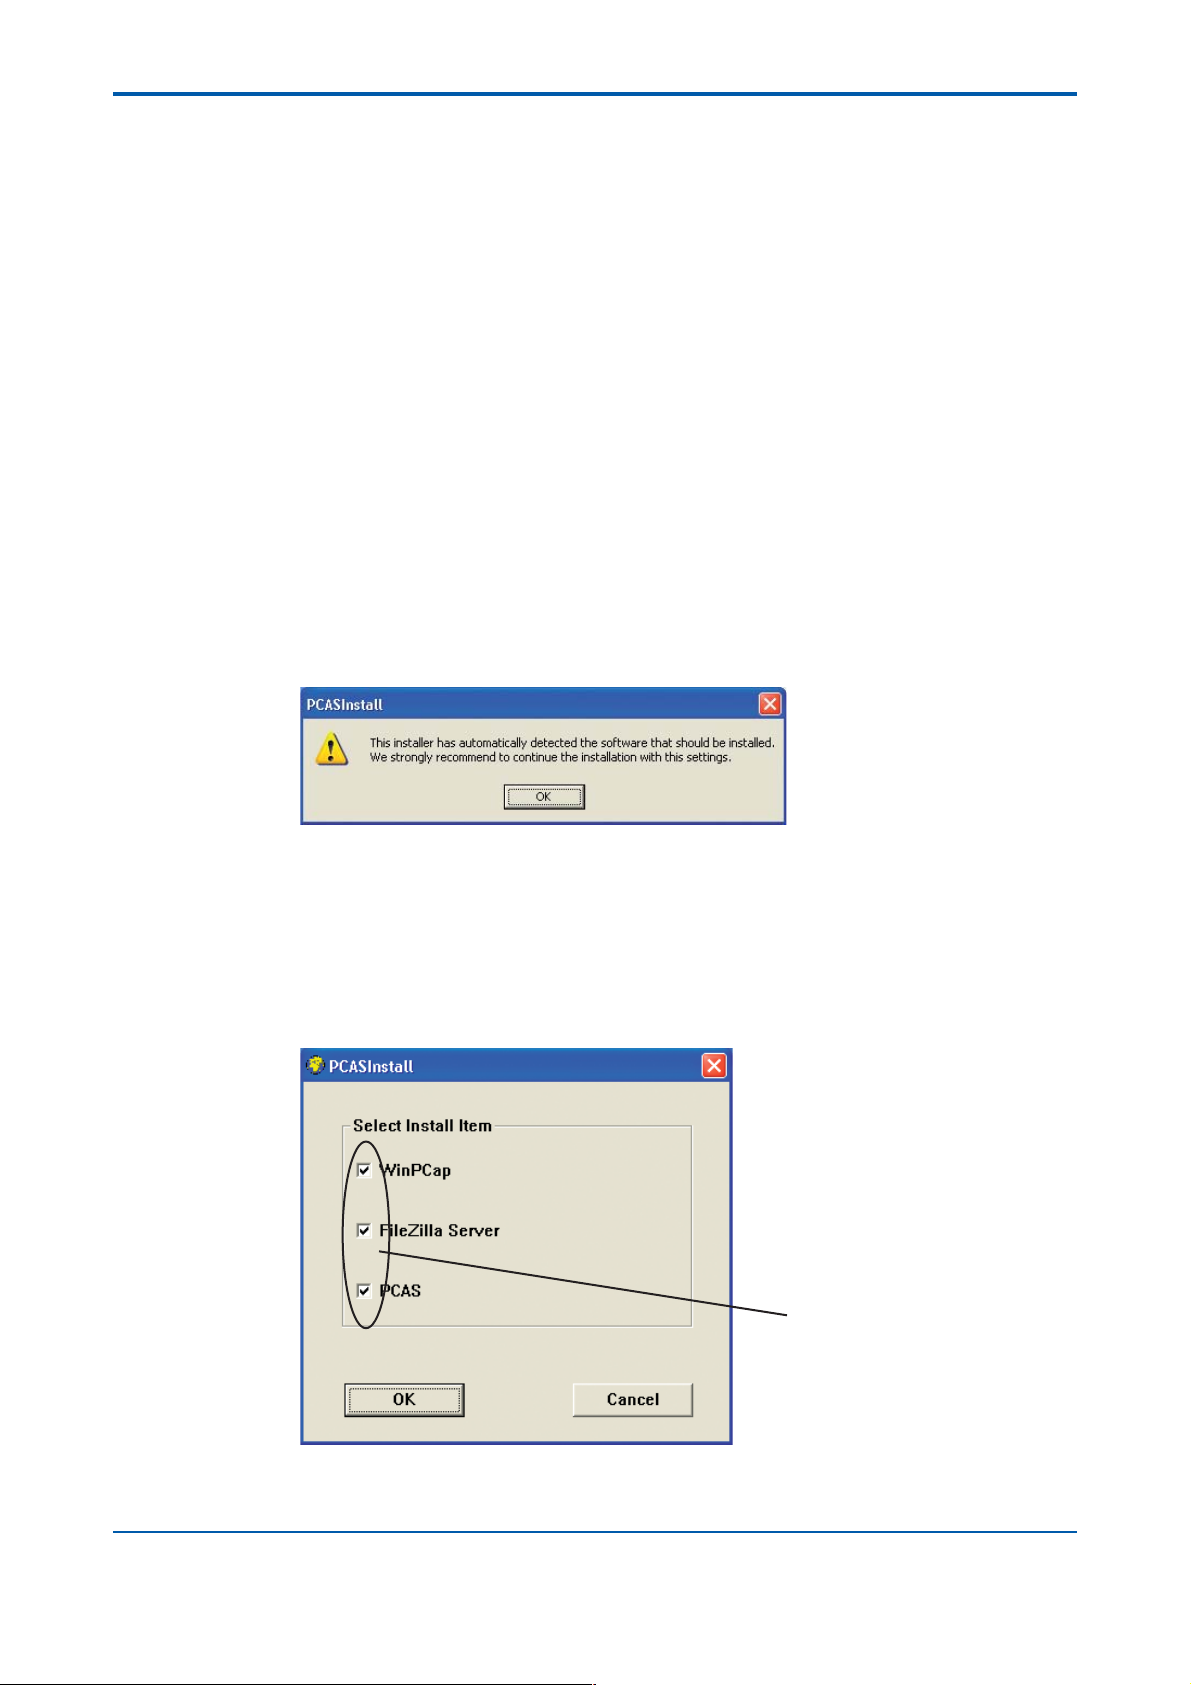
(3) The PCAS dialog box appears. Add chec kmarks for the items y ou want to install.
Checkmarks are added for all of the “WinPCap ,” “FileZilla Server, ” and “PCAS” items
the first time you install the software. The second and subsequent times , the items with
checkmarks added vary depending on the installation state, but chec kmarks are
added to required items automatically. Click the OK b utton without changing any of the
settings.
Leave these
checkmarks checked.
PCASInstall Dialog Box.
PCASInstall Dialog Box.
F0202.EPS
IM 11B06B01-01E
1st Edition : June 30,2006-00
Page 10
<T oc> <Ind> <PCAS>
The setup procedure for WinPcap 3.0 is perf ormed first.
(4) The installation wizard for WinPcap 3.0 setup starts and the W elcome to the Installa-
tion Wizard dialog bo x appears. To install WinPcap, click the Ne xt b utton. At this time , it
is strongly recommended to exit any other progr ams that may be running.
To cancel the installation, click the Cancel button. If y ou click this b utton, WinPcap 3.0
will not be installed.
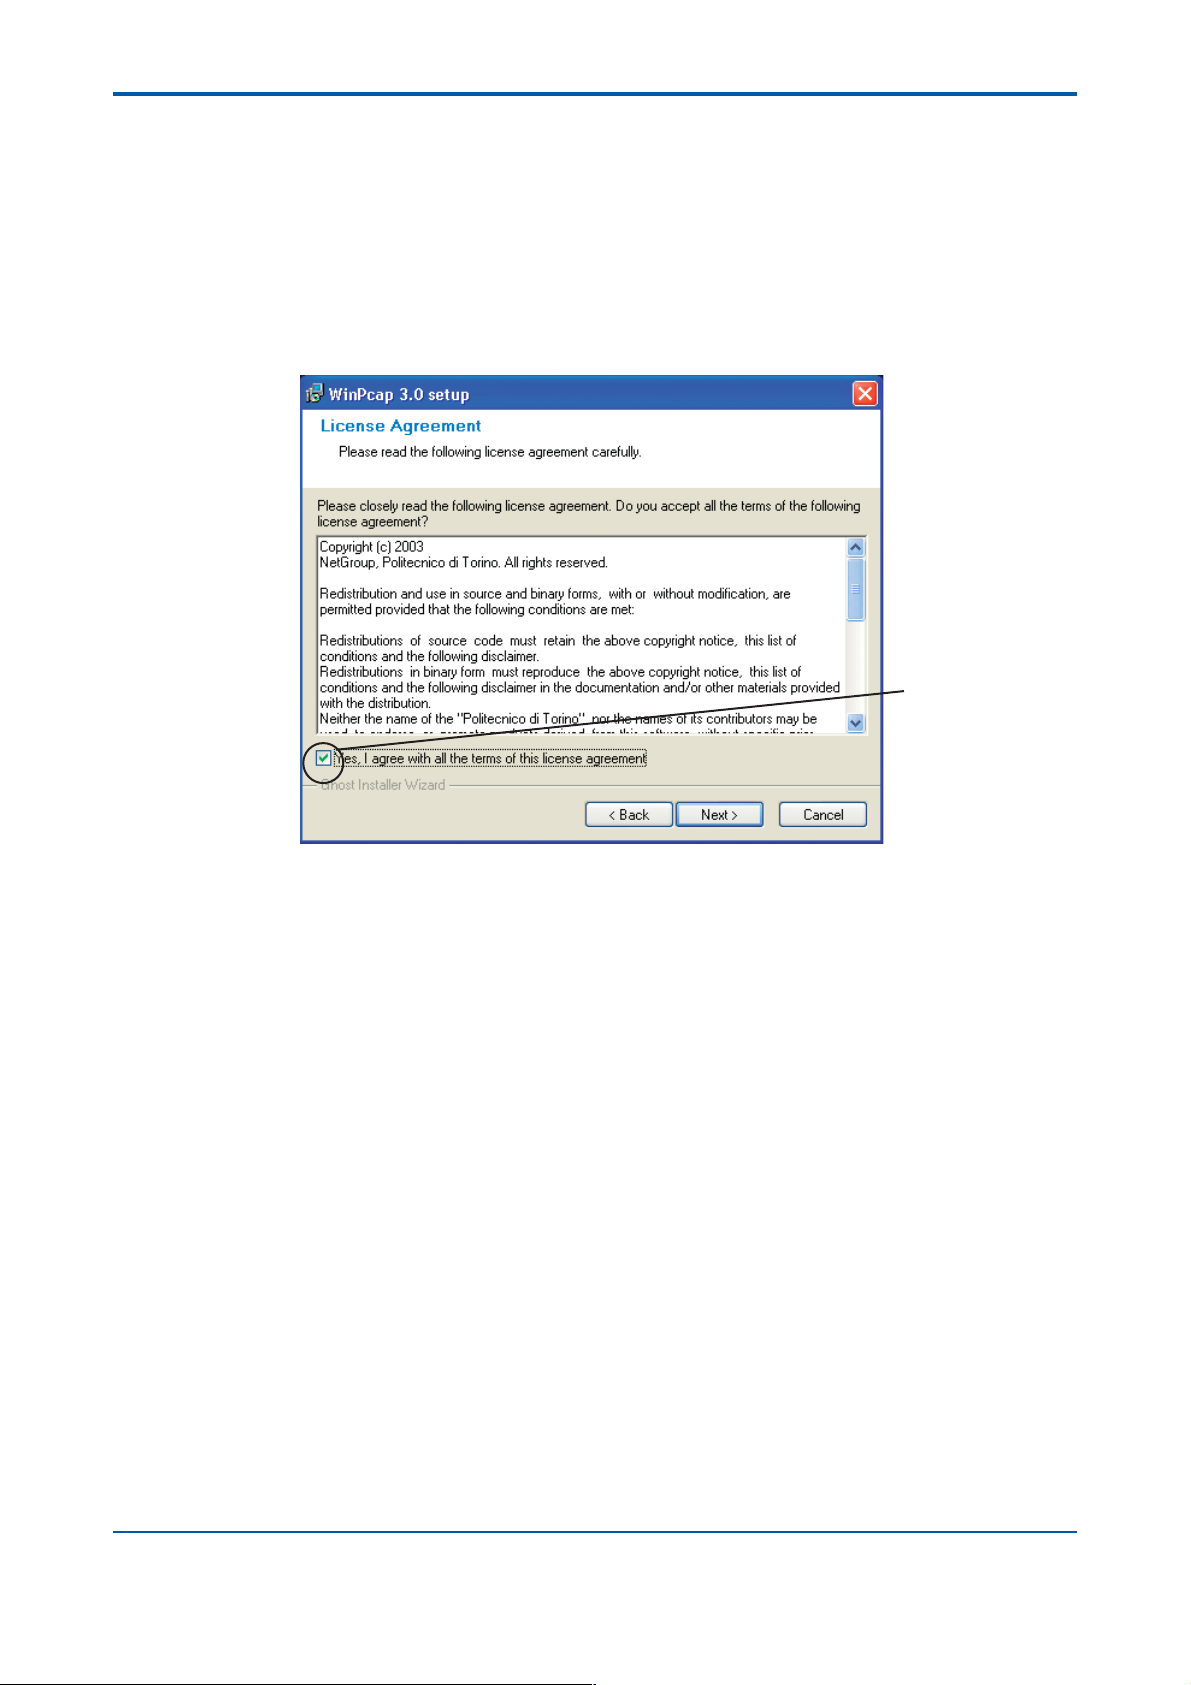
(5) When the OK button is clicked in Step (4), the f ollo wing License Agreement dialog bo x
appears. Carefully read the terms, add a checkmark to the checkbo x if y ou agree with
the terms, and then click the Next button.
5
Add a checkmark here.
F0203.EPS
WinPcap 3.0 Setup Dialog Box
(6) The Setup Status dialog box appears and WinPcap 3.0 is installed. After the installa-
tion is complete, the dialog box automatically s witches to the Readme Inf ormation
dialog box. Read the inf ormation and then click the Ne xt button.
(7) The Installation Complete dialog box appears. Click the OK button. The WinPcap 3.0
installation is now complete.
The setup procedure for FileZilla Server beta is performed next. The FileZilla Server beta
0.9.5 setup starts automatically after the WinPcap 3.0 setup ends.
(8) When the License Agreement dialog box of the FileZilla Server beta 0.9.5 setup
appears, read the terms and click the I Agree button if you ag ree with the terms.
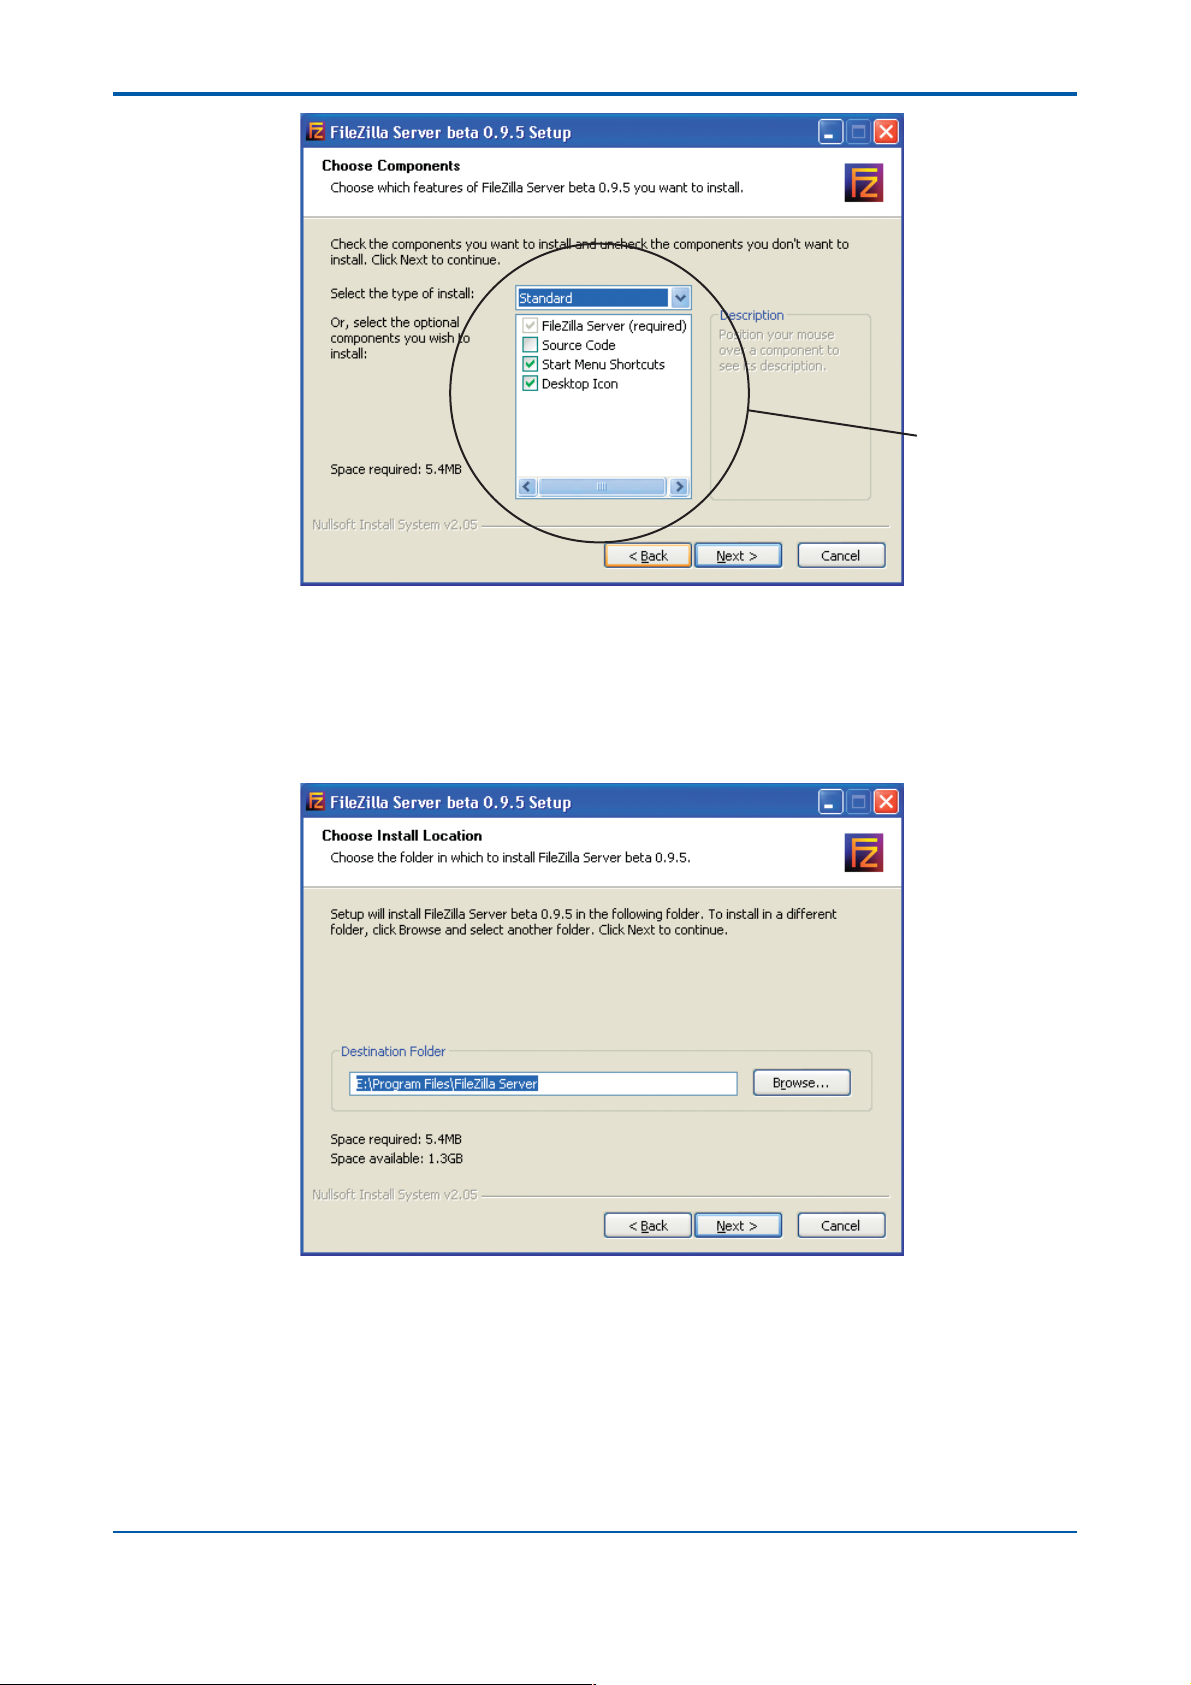
(9) If you agreed with the terms in Step (8), the Choose Components dialog box appears.
By default, Standard is selected for the combo bo x and chec kmarks are added to the
Start Menu Shortcuts and Desktop Icon checkbox es. PCAS will run normally if you
leave the settings unchanged.
Procedures described later in this user’s manual assume that these settings were left
unchanged. Therefore, lea ve them unchanged and then clic k the Ne xt button.
IM 11B06B01-01E 1st Edition : June 30,2006-00
Page 11
<T oc> <Ind> <PCAS>
Choose Components Dialog Box
(10) Select the installation location after component selection is complete. The Choose
Install Location dialog box appears. Directly enter the path in the input box of Destination Folder or click the Bro wse button and specify the installation location in the
Choose Folder dialog bo x that appears.
6
Leave these set to
their defaults.
F0204.EPS
After you specify an installation location in Destination Folder, click the Next b utton.
F0205.EPS
Choose Install Location Dialog Box
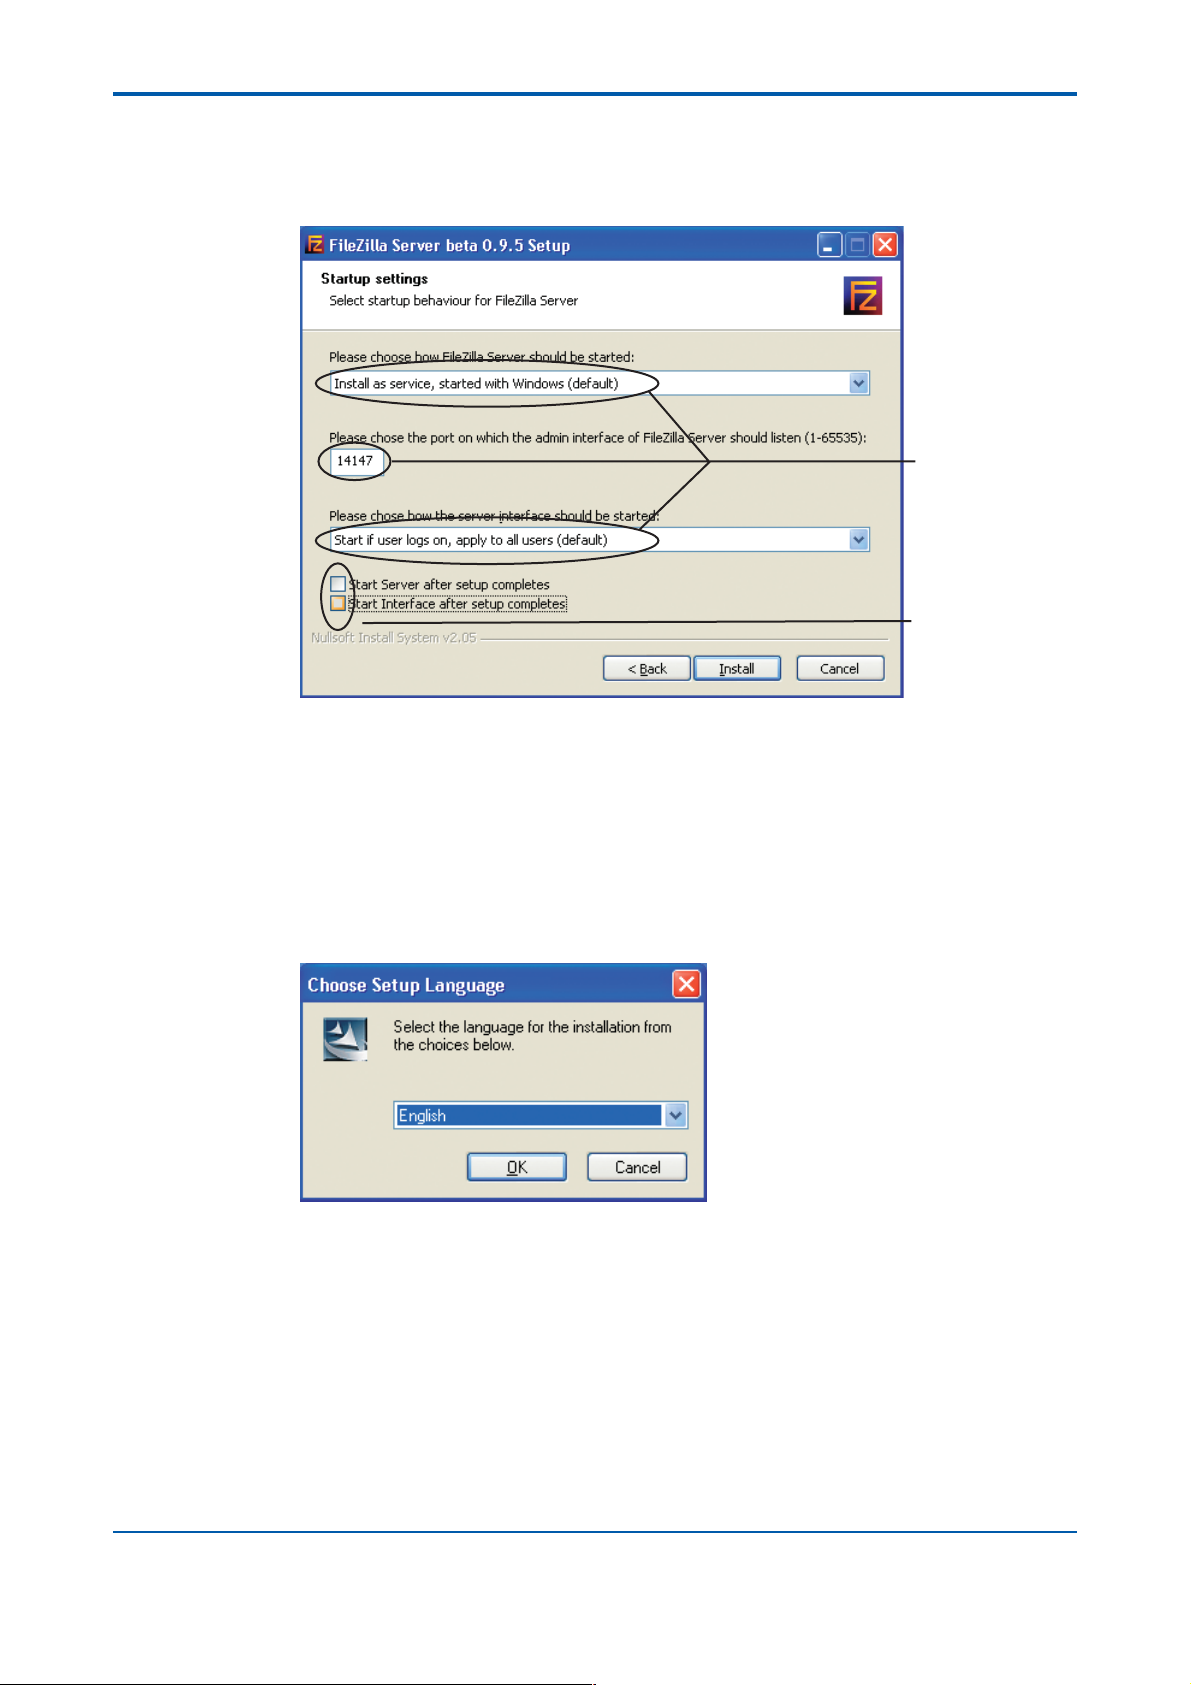
(11) The Startup settings dialog box appears next. This dialog box is f or configuring the
FileZilla Server startup settings.
The default settings f or the combo box es and input bo x are “Install as service, started
with Windows (def ault),” “14147,” and “Start if user logs on, apply to all users (default).”
These settings for startup of FileZilla Server and the server interface should be left set
to their defaults and procedures described later in this user’ s manual assume that
these settings were left unchanged. Theref ore, lea v e them unchanged.
IM 11B06B01-01E
1st Edition : June 30,2006-00
Page 12
<T oc> <Ind> <PCAS>
Furthermore, both checkbox es ha v e a checkmark added by def ault. These
checkbox es set whether to start FileZilla server and the server interface after the
setup is complete. Remov e these chec kmarks and then click the Install button because PCAS will be installed after the FileZilla setup ends.
7
Leave these set to
their defaults.
Remove both
checkmarks.
F0206.EPS
Startup Settings Dialog Box
(12) The installation screen appears and then the Installation Complete dialog box appears
automatically after the installation completes. Click the Close b utton.
The FileZilla Server beta 0.9.5 installation is now complete.
The setup procedure for PCAS is perf ormed next. The PCAS setup starts automatically
after the FileZilla Server beta 0.9.5 installation ends.
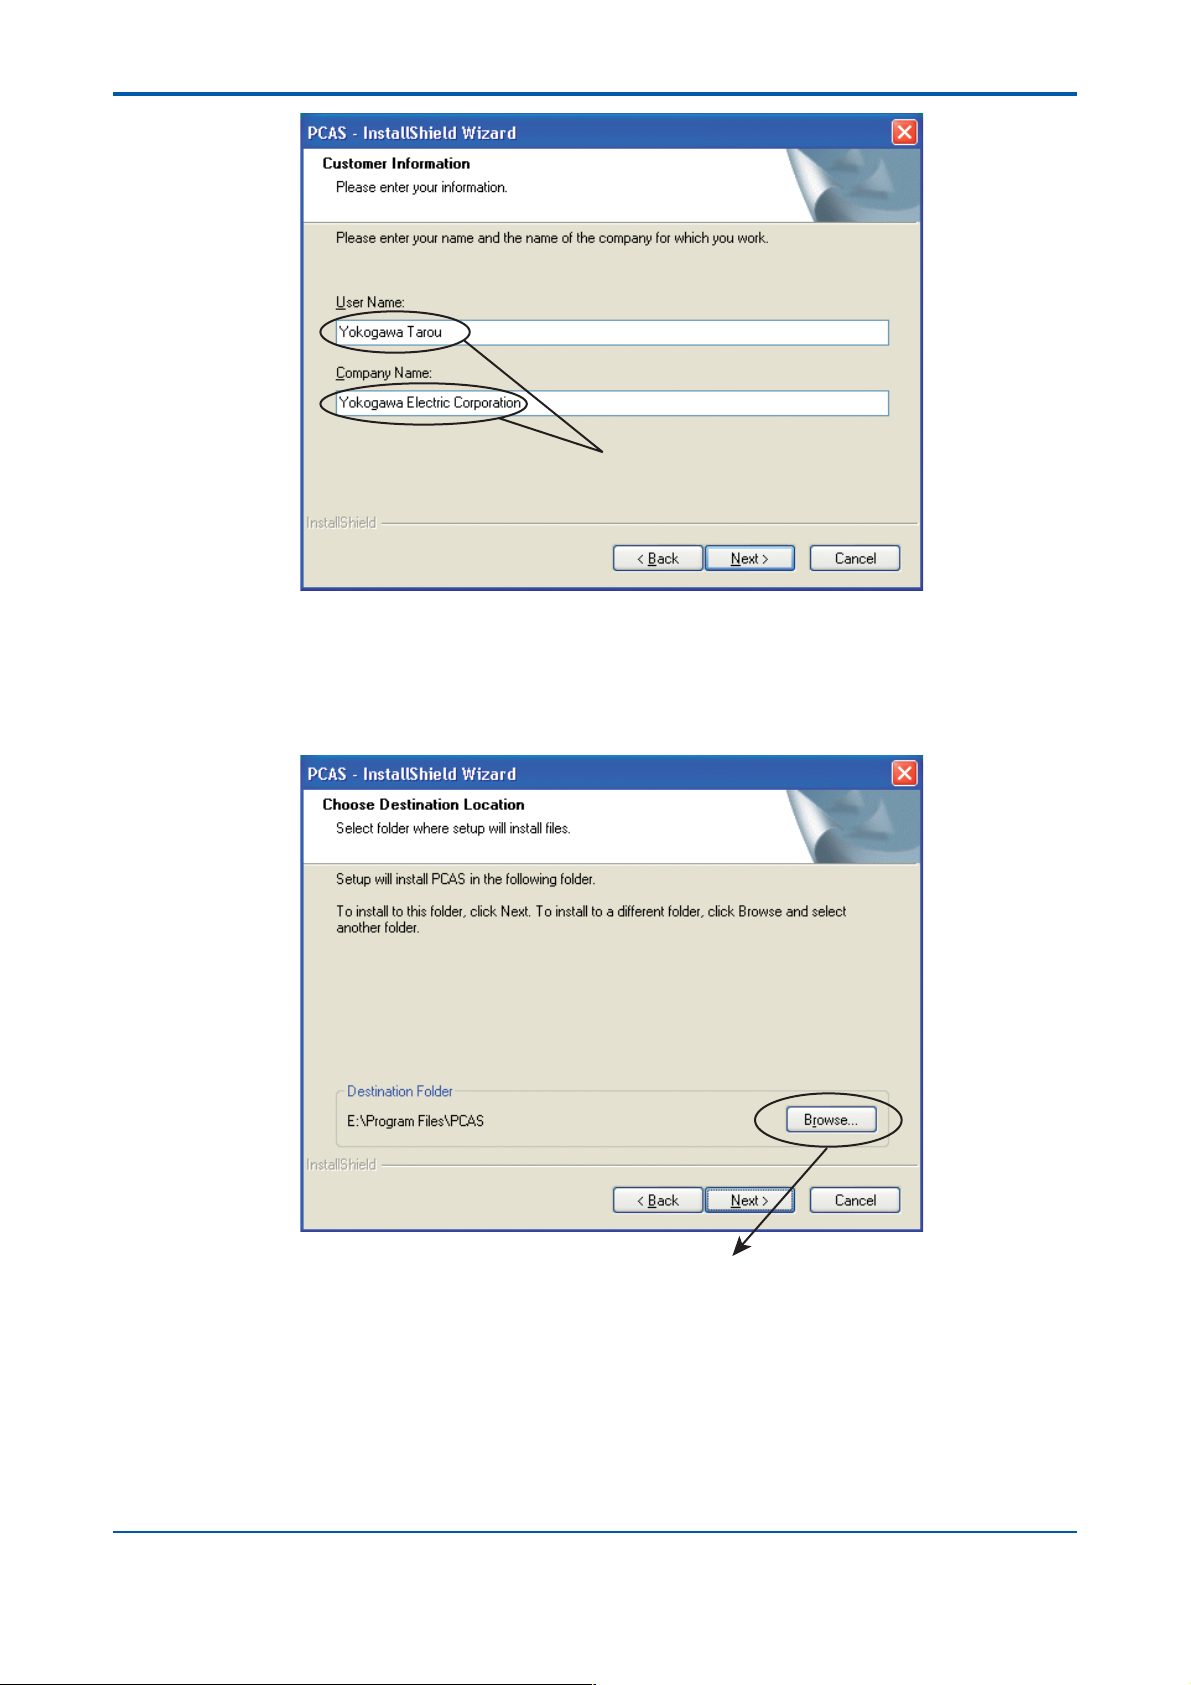
(13) When the Select Language dialog box appears , select English and then click the OK
button.
F0207.EPS
Select Language dialog box
(14) After the preparation dialog bo x for the PCAS InstallShield Wizard is displa y ed, the
InstallShield Wizard screen appears.
Click the Next b utton in the W elcome to PCAS Setup dialog box that appears .
(15) When the License Agreement dialog bo x appears, carefully read the terms and then
add a checkmark to the “Yes, I agree with all the terms of this license agreement”
checkbox if y ou agree with the terms, and then click the Ne xt b utton.
(16) When the User Information dialog box appears , correctly enter your user name and
company name in the text bo x es and then click the Ne xt button.
IM 11B06B01-01E 1st Edition : June 30,2006-00
Page 13
<T oc> <Ind> <PCAS>
Text boxes
F0208.EPS
User Information Dialog Box
8
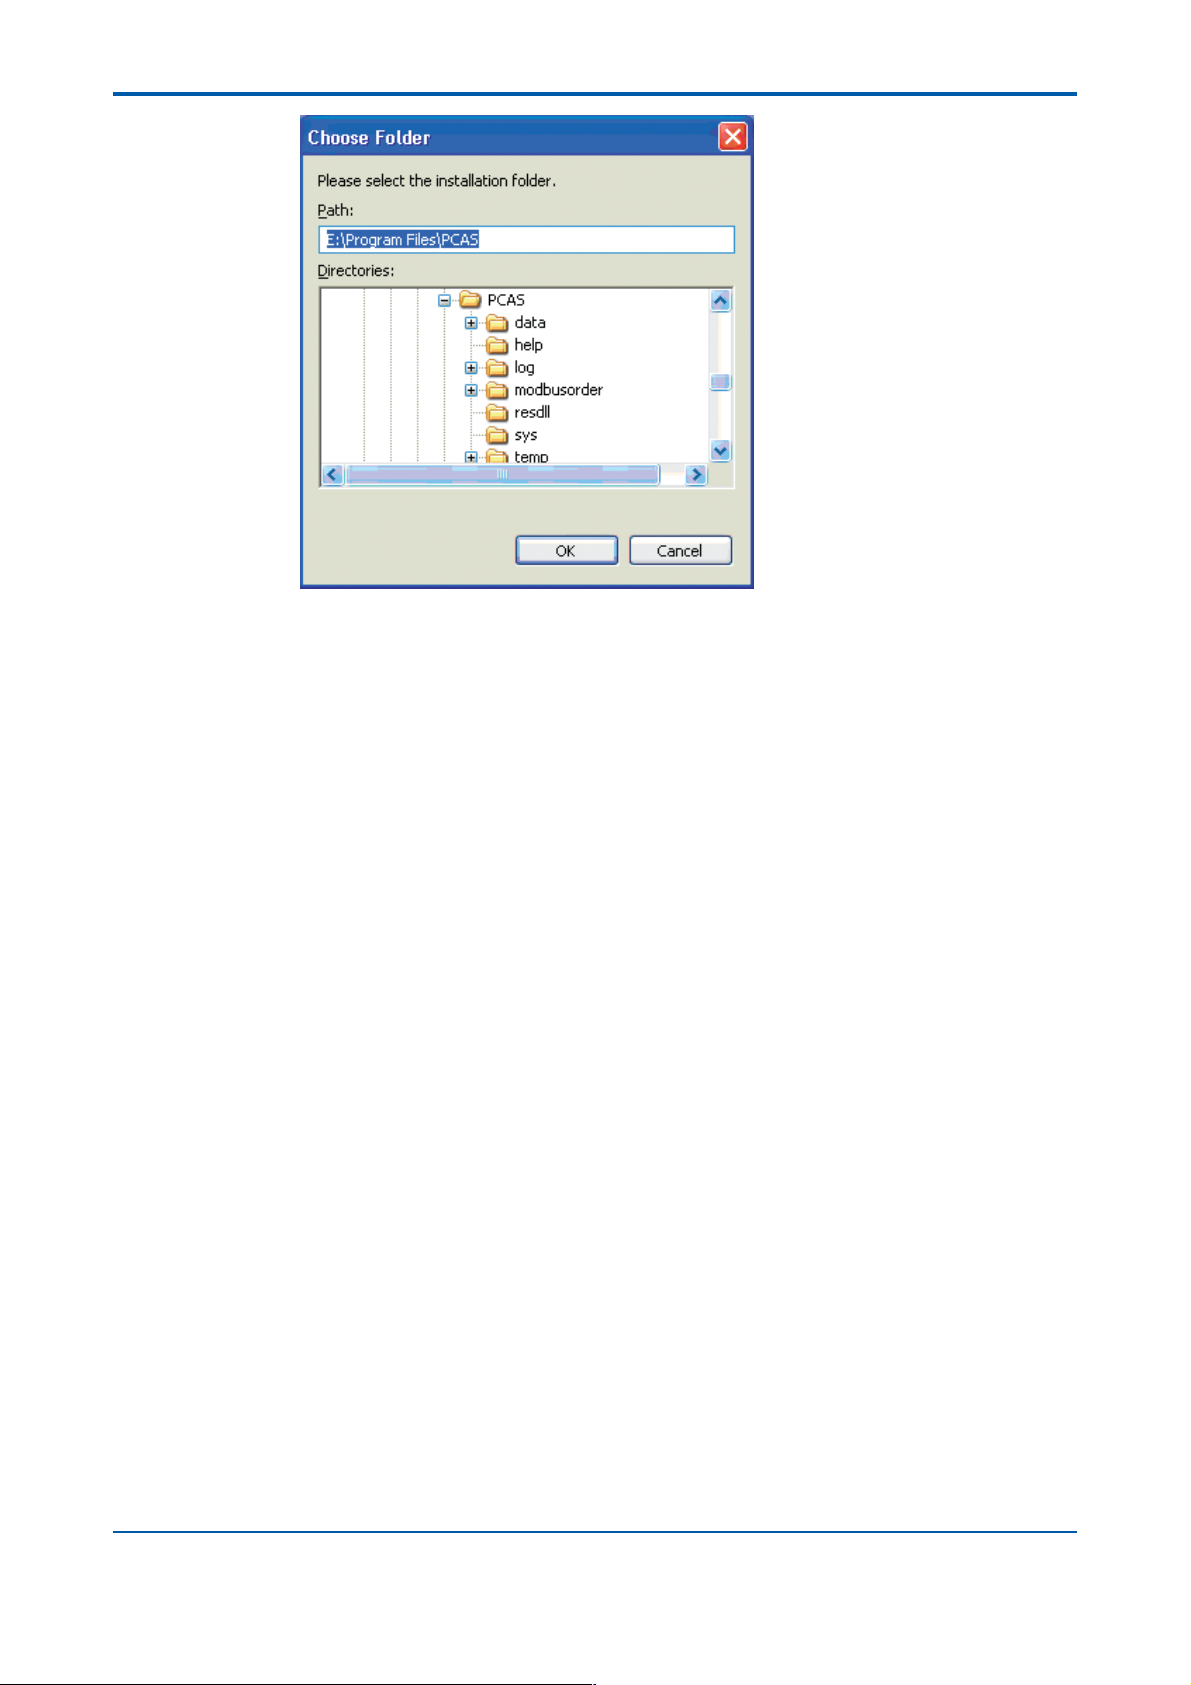
(17) The Choose Install Location dialog box appears ne xt. Click the Browse button and
specify the installation location in the Choose Folder dialog bo x that appears.
After you specify a folder f or the installation location, clic k the Ne xt button.
F0209.EPS
Choose Install Location Dialog Box
IM 11B06B01-01E
1st Edition : June 30,2006-00
Page 14
<T oc> <Ind> <PCAS>
F0210EPS
Choose Folder Dialog Box
9
(18) When the Installation Preparation Complete dialog bo x appears, clic k the Install
button.
(19) If you are installing the software a second or subsequent time and configur ation files
already exists, a dialog bo x appears at the end of the installation to prompt you to
select whether to update the files. Click the Y es button to update the files and the No
button to not update the files.
(20) The Setup Status appears and then a Readme file containing the latest information on
PC Analyzer Server 1.00.00 opens automatically when the installation completes.
Check the information in the file and then click X in the top right to close the file.
(21) The InstallShield Wizard Complete dialog box appears when y ou close the Readme
file. Add a checkmark to the “Yes, restart the PC now.” chec kbo x, remov e the disc from
the CD drive, and click the Complete b utton. The PC restarts and the setup is complete.
The installation of PCAS is now complete.
Note: If the PCAS installation location f older is changed when the setup is
performed a second or subsequent time, be sure to perform the f ollowing procedure. If this pr ocedure is not performed, PCAS will not run
properly.
IM 11B06B01-01E
1st Edition : June 30,2006-00
Page 15
<T oc> <Ind> <PCAS>
(1) Double-click FileZilla Server in the taskbar .
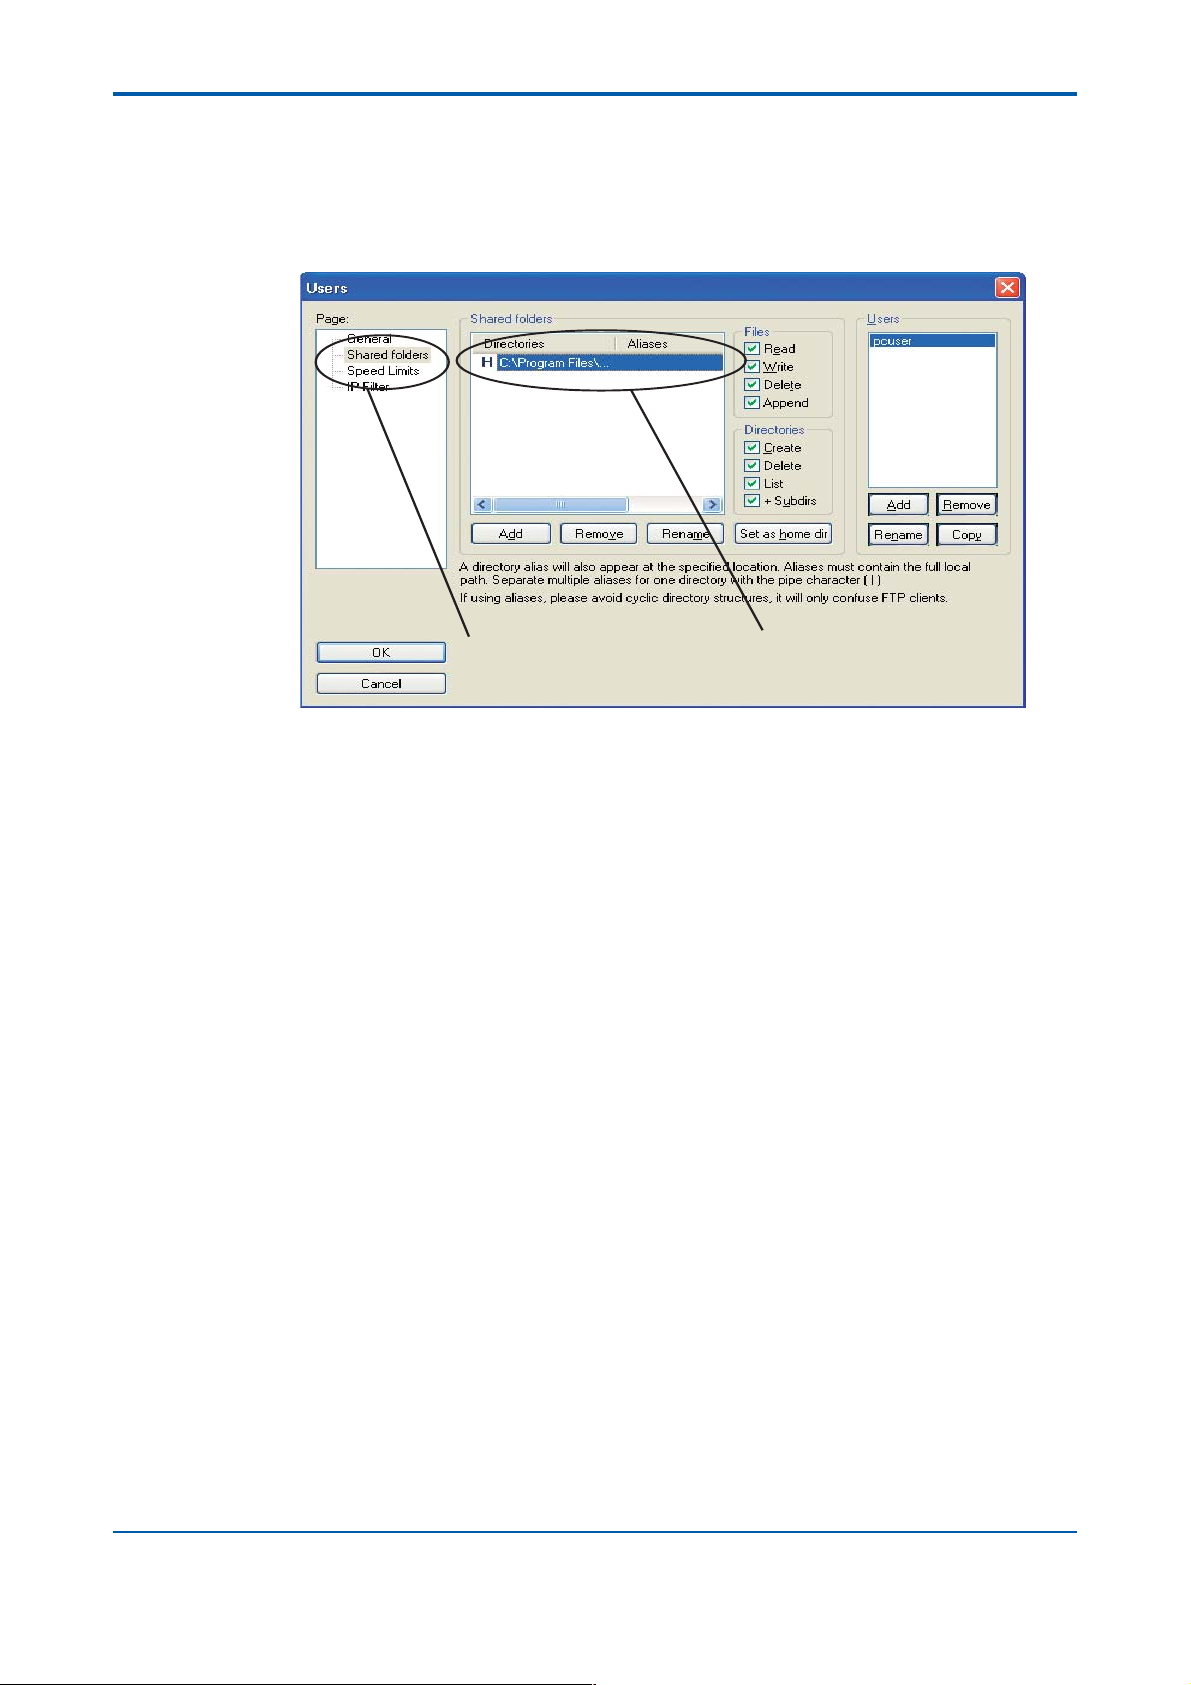
(2) Select Users from the Edit menu of the FileZilla Server window that appears.
(3) Select “Shared folders” in Page of the Users dialog box that opens. Double-click the
Directories section (indicated in red in the figure below) of Shared folders. The Choose
Folder dialog bo x appears.
Select Double-click
10
F0211.EPS
Users Dialog Box
(4) Specify the directory that you newly installed PCAS and then click Ok to close the
Choose Folder dialog bo x. Ne xt, click the OK b utton in the Users dialog bo x.
(5) Click the Minimize button in the top right of the FileZilla Server window to mak e
FileZilla Server resident. Be careful not to clic k the X button f or closing the windo w .
The procedure is now complete.
IM 11B06B01-01E
1st Edition : June 30,2006-00
Page 16
<T oc> <Ind> <PCAS>
2.1.2 Firewall Settings
The firewall needs to be configured after you set up PC Analyz er Server (PCAS). This
section describes the procedure for configuring the firewall.
■ Procedure for Setting Firewall of Operating System
(1) Select Control Panel in the Windows Start menu to open the Control P anel window.
11
F0212.EPS
Control Panel window
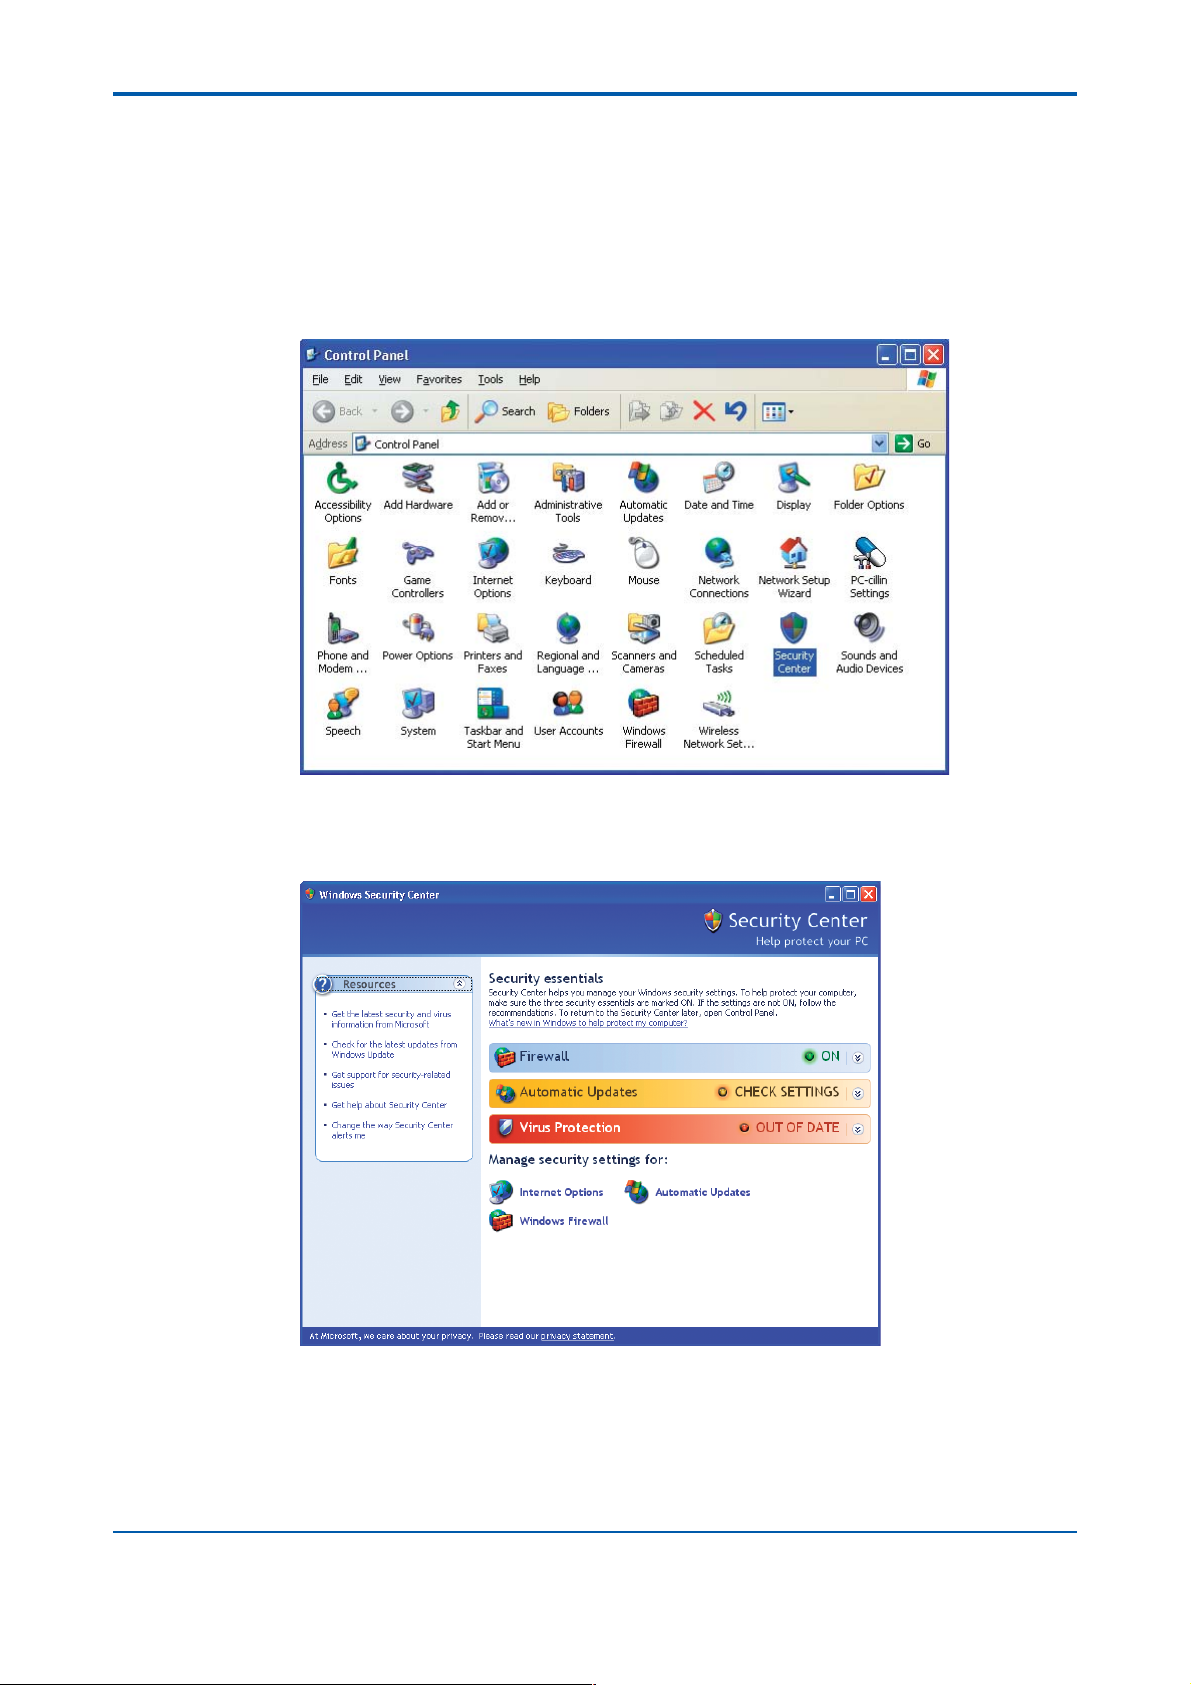
(2) Double-click the Security Center icon to open the Windows Security Center window.
F0213.EPS
Windows Security Center window
(3) Select Windows Fire wall to open the Windo ws Firew all dialog bo x and then select the
Advanced tab .
IM 11B06B01-01E
1st Edition : June 30,2006-00
Page 17

<T oc> <Ind> <PCAS>
12
F0214.EPS
Windows Firewall Dialog Box (Ad vanced tab)
(4) Select “Local Area Connection” and click the Settings b utton to display the Adv anced
Settings dialog box.
F0215.EPS
Advanced Settings Dialog Bo x (Service tab)
(5) Select “FTP Server ,” add a checkmark, and then select the ICMP tab .
IM 11B06B01-01E
1st Edition : June 30,2006-00
Page 18

<T oc> <Ind> <PCAS>
13
Advanced Settings Dialog Box (ICMP tab)
(6) Select “Allow incoming echo request,” add a chec kmark, and then click the OK button.
■ Running PCAS When Firewall Enabled
If firewall software is resident on the PC on which PCAS is started, PCAS may not run as
expected. In such a case, confirm the following two items. For details on confirming and
modifying settings, refer to the user’ s man ual of the firew all software.
(1) The FTP Server function is enabled.
(2) The TCP ports 34341 to 34348, 34352, and 34353 are enabled.
2.2 Configuring Network Settings
For dual redundancy, use the f ollowing dual redundant configuration.
Install the Duplexed Netw ork program f or FCN/FCJ OPC Server . For details on installation,
refer to the section on Duple xed Netw ork program installation f or FCN/FCJ OPC Server
described in the STARDOM FCN/FCJ installation procedure (IM 34P02Q91-01E). A license
and CD is required.
A virtual IP address and the diagnostic interval need to be configured.
F0216.EPS
IM 11B06B01-01E
1st Edition : June 30,2006-00
Page 19

<T oc> <Ind> <PCAS>
2.3 Starting PCAS
PCAS starts automatically when you log on to Windows. (Registered in Startup at the time
of installation.) When PCAS starts normally , the Status screen (ref er to “3.2 Status Screen”)
appears. After starting, PCAS attempts to establish a communication connection with all
registered analyzers.
PCAS is normally made to stay resident in a minimized state. It can also be started by
double-clicking the icon on the desktop . Multiple instances of PCAS can also be started.
Icon Display
The icon displayed f or PCAS changes as shown belo w in accordance with the state of
PCAS.
14
Alarm Status
None
Level 2 Alarm
Level 3 Alarm
Green
Yellow
Red
Icon Display Color
T0201.EPS
Popup Men u of Task Tray Icon
Double-clicking the PCAS icon in the task tra y displa ys the Status screen. When the icon in
the task tray is right-click ed, a popup menu appears. The configur ation of the popup menu
is as follows.
Menu Item
Maintenance Screen
Alarm Screen
Network Monitoring Screen
Exit PCAS
Starts the Maintenance screen.
Starts the Alarm Status screen.
Starts the Network Monitoring screen.
Ends PCAS. (Requires a password to be entered.)
Process When Selected
T0202.EPS
IM 11B06B01-01E
1st Edition : June 30,2006-00
Page 20

<T oc> <Ind> <PCAS>
2.4 Configuring Settings
In the Status screen, select Maintenance Screen from Screen menu. In the Maintenance
screen, select Level C f or User Le v el of the System menu and then enter a pass word.
If the server communication status is set to Permit Connection, click the Permit Server
Connection button and set the server communication status to Do Not P ermit Connection.
Select Builder Screen from the Screen menu of the Maintenance screen. In the Builder
screen, set the following items. (Refer to “5. Builder Screen.”)
Clicking System displays the System P ar ameter Configuration dialog bo x.
System Parameter Configuration Dialog Box
Display Item Description
Server ID
Network T ype
Server T ype
Latest Analysis Result
Period (Month)
History Chromatograph
(Each Time) Period (Month)
History Chromatograph
(1/10) Period (Month)
ASIU Instantaneous Value
Period (Month)
ASIU Average Value Period
(Month)
Disk Full Warning Capacity
(MB)
Disk Full Error Capacity
(MB)
Server T ag Name
Secondary Server IP
Address
History Data Auto Delete
Time
Communication Log
Storage
Maximum Communication
Log Size (MB)
The ID of the primary server.
241 to 254
The network type of the primary server.
Options: Dual/Single
The type of the primary server.
Options: Primary/Secondary
The storage period for the latest analysis results.
Range: 0 to 120 (Month)
The storage period for history chromatographs (each time).
Range: 0 to 120 (Month)
The storage period for history chromatographs (1/10).
Range: 0 to 120 (Month)
The storage period for the ASIU instantaneous values.
Range: 0 to 120 (Month)
The storage period for the ASIU average values.
Range: 0 to 120 (Month)
A disk full warning is generated if remaining hard disk space falls
below this value.
A disk full error is generated if remaining hard disk space falls below
this value.
The tag name of the primary server.
Enter up to 8 single-byte alphanumeric characters.
The IP address of the server paired with the primary server.
The time for automatically deleting history data when the end of the
storage period is reached.
The setting for selecting whether to save communication log data.
Options: Yes or No
The setting for specifying the maximum file size for the
communication log.
Range: 1 to 100
15
T0203.EPS
Press Analyzer and configure the analyzer settings.
The settings for GC1000 Mark II and ASIU differ . Select either “GC1000 Mark II” or “ASIU”
in the Analyzer Type item.
Analyzer Parameter Configuration Dialog Bo x (GC1000 Mark II)
Display Item Description
Analyzer ID The ID of the analyzer to register.
Analyzer Type
Analyzer Tag Name
The type of the analyzer to register.
Options: GC1000MK2 or ASIU
The IP address of the analyzer to register.Analyzer IP Address
The tag name of the analyzer to register.
Enter up to 8 single-byte alphanumeric characters.
IM 11B06B01-01E
T0204.EPS
1st Edition : June 30,2006-00
Page 21

<T oc> <Ind> <PCAS>
Analyzer Parameter Configuration Dialog Box (ASIU)
Display Item Description
Analyzer ID
Analyzer Type
Analyzer IP Address
Analyzer Tag Name
AI Storage Interval
(Seconds)
The ID of the analyzer to register.
The type of the analyzer to register.
Options: GC1000MK2 or ASIU
The IP address of the analyzer to register.
The tag name of the analyzer to register.
Enter up to 8 single-byte alphanumeric characters.
The save interval for instantaneous values.
Range: 60 to 3600
For ASIU , also configure the settings related to DO , DI, and AI.
Press the DO Related key and configure the DO related settings.
DO Related Settings
Display Item Description
No.
Tag Name
Signal Name
ON Color
OFF Color
The number of the DO.
The tag name of the DO.
Enter up to 8 single-byte alphanumeric characters.
The signal name of the DO.
Enter up to 8 single-byte alphanumeric characters.
The display color for when the DO is ON.
Options: White, Green, Red, Yellow, and Light Gray
The display color for when the DO is OFF.
Options: White, Green, Red, Yellow, and Light Gray
16
T0205.EPS
T0206.EPS
Next, press the DI Related ke y and configure the DI related settings.
DI Related Settings
Display Item Description
No.
Tag Name
Signal Name
ON Color
OFF Color
The number of the DI.
The tag name of the DI.
Enter up to 8 single-byte alphanumeric characters.
The signal name of the DI.
Enter up to 8 single-byte alphanumeric characters.
The display color for when the DI is ON.
Options: White, Green, Red, Yellow, and Light Gray
The display color for when the DI is OFF.
Options: White, Green, Red, Yellow, and Light Gray
Next, press the AI Related ke y and configure the AI related settings.
T0207.EPS
IM 11B06B01-01E
1st Edition : June 30,2006-00
Page 22

<T oc> <Ind> <PCAS>
AI Related Settings
Display Item Description
No.
Tag Name
Signal Name
Unit
Lower Limit range
Upper Limit range
The number of the AI.
The tag name of the AI.
Enter up to 8 single-byte alphanumeric characters.
The signal name of the AI.
Enter up to 8 single-byte alphanumeric characters.
The unit of the AI.
Options: All units registered in the AI Unit Configuration screen.
The lower limit range of the AI.
Range: ⫺9999.999 to 9999.999 (Lower limit range<upper limit range)
The upper limit range of the AI.
Range: ⫺9999.999 to 9999.999 (Lower limit range<upper limit range)
The units used for the AI can be defined. Ref er to “5.3 AI Unit Configuration Screen.”
2.5 Perf orming Monitoring
A list of the communication connection status of registered analyzers can be display ed.
(Refer to “3. Status Screen.”) If an alarm or error is generated, the current alarm status and
alarm history is displayed. (Ref er to “7. Alarm Screen. ”)
17
T0208.EPS
2.6 Perf orming Maintenance
The following operations can be perf ormed. (Ref er to “4. Maintenance Screen.”)
● Uploading and downloading analyzer parameters
The parameters set for GC1000 Mark II can be managed in file format.
● Equalizing server
When using two servers in a redundant configuration, stored data can be shared by both
servers.
● Dumping analyzer memory
This is used when confirming the internal data of a GC1000 Mark II.
● Resetting analyz er
The analyzer can be restarted after, for e xample , downloading parameters to the
GC1000 Mark II.
Ordinary operations such as changing the mode of the analyzer are performed with ASET.
For details, ref er to the user’ s man ual f or ASET (IM 11B06C01-01E).
2.7 Ending PCAS
A password is required to end PCAS .
IM 11B06B01-01E 1st Edition : June 30,2006-00
Page 23

<T oc> <Ind> <PCAS>
3. Status Screen
This screen is for displa ying a list of the communication connection status of all registered
analyzers.
Startup Method
• Start PCAS.
• Double-click the icon in the task tray.
Functions
• Displays a list of the communication connection status for all registered analyzers .
• Calls up the Maintenance screen, Network Monitoring screen, and Alarm Status screen.
Screen Configuration
18
Figure 3.1 Example of Status Screen
Server ID
Server T ag Name
Server Communication
Status
Analyzer Status
ID
Communication Status
The ID of the primary server. (Configure this in the Builder screen.)
The tag name of the primary server.
(Configure this in the Builder screen.)
Displays the current communication status. (Operation is performed
in the Maintenance screen.)
Permit Connection (Green):
Do Not Permit Connection (Light Gray):
Displays the status of analyzers with settings registered in the Builder screen.
The ID of the analyzer.
Displays the current communication status.
Performing Communication (Green):
Communication is being performed normally.
Establishing Connection (Yellow):
The communication connection is being processed.
Connection Disconnected (Red): Not connected. A ping command is
repeatedly sent at a specific interval.
Do Not Permit Connection (Light Gray):
A communication connection cannot be established because of the
server settings. A ping command is not sent.
F0301.EPS
DescriptionDisplay Item
IM 11B06B01-01E
T0301.EPS
1st Edition : June 30,2006-00
Page 24

<T oc> <Ind> <PCAS>
The number of display columns f or the analyzer status v aries as shown below depending
on the number of analyzers registered (maximum of 64 analyzers).
19
Number of Analyzers
1 to 32
33 to 40
41 to 48
49 to 56
57 to 64
■ Toolbar
: This perf orms the same function as the Maintenance Screen command
: This perf orms the same function as the Alarm Status Screen command
: This perf orms the same function as the Network Monitoring Screen command
: This perf orms the same function as the Contents command in the Help menu.
Number of Display Columns
4
5
6
7
8
T0302.EPS
in the Screen menu. The Maintenance screen opens. (Refer to chapter 4.)
in the Screen menu. The Alarm Status screen opens. (Refer to section 7.2.)
in the Screen menu. The Netw ork Monitoring screen opens. (Ref er to chapter 6.)
■ Button
: This performs the same function as the Close command in the System menu.
Help opens.
The Status screen closes. The PCAS softw are remains open but is minimiz ed to
the task tray.
IM 11B06B01-01E 1st Edition : June 30,2006-00
Page 25

<T oc> <Ind> <PCAS>
4. Maintenance Screen
This screen is for uploading and downloading the parameters of analyz ers and changing
the communication status (Permit Connection/Do Not P ermit Connection) of the server .
Startup Method
•Click Maintenance Screen from the popup menu that appears b y right-clicking the task tra y .
20
Functions
• In the Status screen, select Maintenance Screen from the Screen menu or click
The analyzer connection status display screen is displa yed when the Maintenance screen
starts.
• Changes the communication status (Permit Connection/Do Not Permit Connection) of
the server.
• Disconnects the communication connection of the specified ASET .
• Connects/disconnects the communication connection with the specified analyzer.
• Sets the time for all analyzers.
• Uploads/downloads the parameters of a GC1000 Mark II.
• Resets a GC1000 Mark II.
• Calls up the Builder screen, Network Monitoring screen, and Alarm Status screen.
• Changes the user level.
• Changes the display language to Japanese/English.
• Equalizes the server.
•Perf orms printout.
.
Screen Configuration
Figure 4.1 Example of Maintenance Screen
(when Analyzer Connection Status Display Screen is Selected)
F0401.EPS
IM 11B06B01-01E
1st Edition : June 30,2006-001st Edition : June 30,2006-00
Page 26

<T oc> <Ind> <PCAS>
The following two screens can be selected with the tabs in the bottom left.
Analyzer Connections: Displays the Analyzer Connection Status Display screen.
(Refer to section 4.1.)
ASET: Displa ys the ASET Connection Status Display screen. (Refer to section 4.2.)
Note: The initial state is to display Analyzer Connections (Analyzer Connection Status Display screen).
■ Toolbar
: This perf orms the same function as the User Level command in the System men u.
: This perf orms the same function as the Builder Screen command in the Screen
menu. The Builder screen opens. (Refer to chapter 5.)
: This perf orms the same function as the Alarm Status Screen command in the
Screen menu. The Alarm Status screen opens. (Refer to section 7.2.)
: This perf orms the same function as the Network Monitoring Screen command
in the Screen menu. The Network Monitoring screen opens. (Refer to chapter 6.)
21
: This perf orms the same function as the Print command in the System menu.
: This perf orms the same function as the Contents command in the Help menu.
Help opens.
■ Button
: This performs the same function as the Close command in the System menu.
The Maintenance screen closes.
■ Menu Items
■ Changing User Level
Change the user level with User Le v el command of the System menu. This User Le v el
command and the Set User Level b utton on the toolbar are disabled while the Builder
screen is open.
■ Changing Display Language to Japanese/English
Change the display language with the Language command of the System menu. This
operation can only be performed if the user lev el is C or abov e. PCAS restarts when the
display language is changed.
Note: If the language of the oper ating system is not selected, some display char acters may
not appear or may be garbled.
■ Equalizing Server
Copy the data on the secondary server to the primary server . Equaliz e the server with the
Equalize Server command of the System menu.
This operation can only be performed if the user lev el is D or abov e and the communication
status of the primary server is Do Not P ermit Connection.
IM 11B06B01-01E
1st Edition : June 30,2006-001st Edition : June 30,2006-00
Page 27

<T oc> <Ind> <PCAS>
Clicking the Equalize Server command in the System menu displa ys the f ollowing dialog
box.
F0402.EPS
Start Equalizing Dialog Box (When System Information of PCAS Matches)
22
F0403.EPS
Start Equalizing Dialog Box (When System Information of PCAS Does Not Match)
● Analyzers Subject to Equalizing
Select from analyzer IDs (001 to 240), ALL (all registered analyzers), and SYS (system).
● Equalizing Procedure
Select from equalizing after deleting data (the data of the primary server is deleted prior
to copying the data from the secondary server) and overwrite equalizing.
Clicking the Start Equalizing button of the Start Equalizing dialog box and then clicking the
Yes button in the confirmation message displays the f ollowing dialog bo x.
Execute Server Equalization Dialog Box
F0404.EPS
IM 11B06B01-01E
1st Edition : June 30,2006-00
Page 28

<T oc> <Ind> <PCAS>
Clicking the Execute Server Equalization b utton of the Execute Server Equalization dialog
box ex ecutes equalizing and displa ys the f ollowing dialog bo x.
F0405.EPS
Dialog Box Displayed During Server Equalizing
■ Printing
Print the current communication status of PCAS, analyzers, and ASET. Printing is performed with Print command of the System menu.
23
IM 11B06B01-01E
1st Edition : June 30,2006-00
Page 29

<T oc> <Ind> <PCAS>
4.1 Analyzer Status Display Screen
This screen is for displa ying the status of the server and a list of the communication connection status of registered analyzers.
Display Method
Select the Analyzer Connections tab of the Status screen. (Since this screen is selected as
the initial screen, it is displayed automatically when the Maintenance screen opens .
Screen Configuration
24
Figure 4.2 Example of Analyzer Status Display Screen
F0406.EPS
IM 11B06B01-01E
1st Edition : June 30,2006-00
Page 30

<T oc> <Ind> <PCAS>
Display Item Description
Server ID
Server T ag Name
Server IP Address
Server Version
Server T ype
Network T ype
Server Communication
Status
Secondary Server ID
Secondary Server IP Address
Secondary Server
Communication Status
Communication Status
Between Servers
Do Not Permit Server
Connection/Permit Server
Connection Button
Set Time Button
Analyzer Status
ID
Type
Tag Name
IP Address
Rev.
Communication Status
Switch Communication
Status Button
Operation Button
The ID of the primary server.(Configure this in the Builder screen.)
241 to 254
The tag name of the primary server.
(Configure this in the Builder screen.)
The IP address of the primary server.
(Configure this in the Builder screen.)
The version of the primary server.
(Configure this in the Builder screen.)
The type of the primary server. (Configure this in the Builder screen.)
Primary/Secondary
The network type of the primary server.
(Configure this in the Builder screen.)
Dual/Single
The current communication status. (Operation is performed in the
Maintenance screen.)
Communication Possible (Green)/Comm unication Not Possible (Light Gray)
The ID of the server paired with the primary server.
The IP address of the server paired with the primary server.
The communication status of the server paired with the primary server.
Communication Possible/Communication Not Possible
Communication status between the primary server and the secondary server.
Perf orming Communication (Green)/Estab lishing Connection
(Yellow)/Connection Disconnected (Red)/No Secondary Server (Light Gray)
Switches the server communication status between Permit
Connection and Do Not Permit Connection.
The Do Not Permit Server Connection button is displayed when the
server communication status is Permit Connection and the Permit
Server Connection button is displayed when the server
communication status is Do Not Permit Connection. This operation
can only be performed if the user level is C or above.
The time of all connected analyzers is adjusted to that of PCAS. This
operation can only be performed if the server communication status
is Permit Connection and the user level is C or above.
Displays the status of analyzers registered in the server.
Displays the ID of the analyzer. (Configure this in the Builder screen.)
The type of analyzer. (Configure this in the Builder screen.)
GC1000 Mark II/ASIU
The tag name of the analyzer. (Configure this in the Builder screen.)
The IP address of the analyzer. (Configure this in the Builder screen.)
The revision of the analyzer.
The communication status of the analyzer.
Perf orming Communication (Green)/Estab lishing Connection (Yellow)/
Connection Disconnected (Red)/Do Not Permit Connection (Light Gray)
Changes the communication status of individual analyzers. The Not
Possible button is displayed when communicating, establishing a
connection, or disconnected and the Permit button is displayed when
a connection is not possible. This operation can only be performed if
the user level is C or above. However, it cannot be performed if the
server communication status is Do Not Permit Connection.
Displays the Analyzer Operation dialog box. It is only displayed if the
analyzer type is GC1000 Mark II. This operation can only be
performed if the user level is C or above and the communication
status is performing communication.
25
T0401.EPS
Operation Button
Clicking the Operation button of the Analyz er Connection Status Display screen displa ys
the Analyzer Operation dialog box. This dialog box is f or operating GC1000 Mark II analyzers. Operation is only possib le for analyz ers that are connected. The f ollowing functions can
be selected when the user level is C or abo ve .
• Uploading parameters of GC1000 Mark II
•Downloading parameter to GC1000 Mark II
IM 11B06B01-01E 1st Edition : June 30,2006-00
Page 31

<T oc> <Ind> <PCAS>
• Dumping memory of GC1000 Mark II
• Resetting GC1000 Mark II
(Downloading program cannot be selected.)
26
F0407.EPS
Figure 4.3 Analyzer Operation Dialog Box
(1) Upload Parameter
This uploads parameters of the corresponding GC1000 Mark II. This operation is only
possible if the user lev el is C or abov e and the measurement status of the GC1000 Mark II
is Process Stopped. Ho we v er , the measurement status cannot be changed from the PCAS
window . Change the status from ASET, GCET , or EtherLCD. The e xtension of the sa ved
parameter file is “.pr7”.
(2) Download Parameter
This downloads the saved par ameters to the corresponding GC1000 Mark II. This oper ation is only possible if the user lev el is C or abov e and the measurement status of the
GC1000 Mark II is Process Stopped. The e xtension of the par ameter file is “.pr7”. The
GC1000 Mark II is reset after downloading completes.
(3) Dump Memory
This saves a memory dump of the corresponding GC1000 Mark II to a file. This oper ation is
only possible if the user lev el is C or abov e. Specify the first address (8-digit HEX number)
and data size 4-digit HEX number) of the memory dump and then execute the memory
dump. The extension of the sav ed memory dump file is “.dmp”. Use ordinary binary editing
software to confirm the content of the memory dump file.
(4) Reset Analyzer
This restarts the corresponding GC1000 Mark II. This operation is only possib le if the user
level is C or abo ve .
IM 11B06B01-01E
1st Edition : June 30,2006-00
Page 32

<T oc> <Ind> <PCAS>
4.2 ASET Connection Status Display Screen
This screen is for displa ying a list of the communication connection status of ASET.
Display Method
Select the ASET tab of the Status screen.
Screen Configuration
27
F0408.EPS
Figure 4.4 ASET Connection Status Display Screen
Display Item Description
Server ID
Server T ag Name
Server IP Address
Server Version
Server T ype
Network T ype
Server Communication
Status
Secondary Server ID
Secondary Server IP Address
Secondary Server
Communication Status
Communication Status
Between Servers
ASET Communication Status
Connection Number
Connection T ype
IP address
Rev.
Communication Status
Disconnect Communication
Button
The ID of the primary server.(Configure this in the Builder screen.)
241 to 254
The tag name of the primary server.
(Configure this in the Builder screen.)
The IP address of the primary server.
(Configure this in the Builder screen.)
The version of the primary server.
(Configure this in the Builder screen.)
The type of the primary server.(Configure this in the Builder screen.)
Primary/Secondary
The network type of the primary server.
(Configure this in the Builder screen.)
Dual/Single
The communication status of the primary server.
Communication Possible/Communication Not Possible
The ID of the server paired with the primary server.
The IP address of the server paired with the primary server.
The communication status of the server paired with the primary server.
Communication Possible/Communication Not Possible
Communication status between the primary server and the
secondary server.
Perf orming Communication (Green)/Estab lishing Connection
(Yellow)/Connection Disconnected (Red)/No Secondary Server (Light Gray)
Displays the communication status of the ASET.
Determined by the connection request from the ASET.
The type of connection request from the ASET.
Normal/Forced
The IP address of the ASET.
The revision of the ASET.
Displays the communication status of the primary server and ASET.
Performing Communication (Green)/Connection Disconnected (No
Indication)
Disconnects communication between the primary server and the
ASET. It is displayed during communication.
This operation can only be performed if the user level is C or above.
T0402.EPS
IM 11B06B01-01E 1st Edition : June 30,2006-00
Page 33

<T oc> <Ind> <PCAS>
5. Builder Screen
This screen is for displaying and configuring inf ormation to define in the system file of PCAS.
Startup Method
• Select Builder Screen in the Screen menu of the Maintenance screen or click .
(The initial state is to display System (System P arameter Configuration screen)).
Screen Configuration
28
F0501.EPS
Builder Screen
The following three screens can be selected with the tabs in the bottom left.
System: Displays the System P ar ameter Configuration screen. (Refer to section 5.1.)
Analyzer: Displays the Analyzer P arameter Configur ation screen. (Ref er to section 5.2.)
AI: Displays the AI Unit Configuration screen. (Refer to section 5.3.)
Note: The initial state is to display System (System Parameter Configuration screen).
■ Toolbar
: This performs the same function as the Open command in the System menu.
: This performs the same function as the Print command in the System menu.
: This performs the same function as the Contents command in the Help menu.
Help opens.
■ Buttons
OK Button: This confirms the edited content (reflects them on PCAS) and closes the
Builder screen.
Cancel Button: This discards the edited content and closes the Builder screen.
Apply Button: This confirms the edited content (reflects them on PCAS) and continues to
display the Builder screen.
IM 11B06B01-01E
1st Edition : June 30,2006-00
Page 34

<T oc> <Ind> <PCAS>
5.1 System Parameter Configuration Screen
This screen is for displa ying and configuring each type of parameter of PCAS.
Display Method
Click the System tab in the Builder screen.
29
Functions
■ Saving Edited Content to Parameter File
■ Printing Parameters
F0501.EPS
System Parameter Configuration Screen
•Saving edited content to a parameter file
•Printing parameters
Use the Save command or Sa ve As command of the System men u to sav e the currently
displayed par ameters to a file.
Use the Print command of the System menu to print the currently displayed parameters.
The following dialog bo x appears when this command is click ed.
IM 11B06B01-01E 1st Edition : June 30,2006-00
Page 35

<T oc> <Ind> <PCAS>
30
Functions
F0502.EPS
Parameter Print Dialog Box
● Print Items
Select the items to print from System/Analyzer Parameters , ASIU P arameters, and AI
Unit. Y ou can select multiple items .
● KGC Number
Enter a KGC number if necessary . Enter up 16 single-byte alphanumeric characters. IF
a KGC number is entered, it is printed on the bottom right of each page.
• Configuring parameters related to the PCAS system
•Permitting configuration of parameters if the server communication status is Do Not
Permit Connection and the user level is C or abov e
• Disabling edition if the server communication status is Permit Connection or the user
level is B or belo w
IM 11B06B01-01E
1st Edition : June 30,2006-00
Page 36

<T oc> <Ind> <PCAS>
Screen Configuration
Display Item Description
Server ID
Number of Analyzers
Network T ype
Server T ype
Secondary Server ID
Latest Analysis Result
Period (Month)
Latest Analysis Result
Space (GB)
History Chromatograph
(Each Time)
Period (Month)
History Chromatograph
(Each Time)
Space (GB)
History Chromatograph
(1/10)
Period (Month)
History Chromatograph
(1/10)
Space (GB)
ASIU Instantaneous Value
Period (Month)
ASIU Instantaneous Value
Space (GB)
ASIU Average Value Period
(Month)
ASIU Average Value Space
(GB)
Disk Full Warning Capacity
(MB)
Disk Full Error Value
Capacity (MB)
Server T ag Name
Secondary Server IP
Address
History Data Auto Delete
Time
Communication Log
Storage
Maximum Communication
Log Size (MB)
The ID of the primary server.
241 to 254
The number of analyzers registered on the primary server.
The network type of the primary server.
Options: Dual/Single
The type of the primary server.
Options: Primary/Secondary
The ID of the server paired with the primary server.
The storage period for the latest analysis results.
Range: 0 to 120 (Month)
The hard disk space required to store the latest analysis results.
The storage period for the history chromatographs (each time).
Range: 0 to 120 (Month)
The hard disk space required to store the history chromatographs
(each time).
The storage period for the history chromatographs (1/10).
Range: 0 to 120 (Month)
The hard disk space required to store the history chromatographs
(1/10).
The storage period for the ASIU instantaneous values.
Range: 0 to 120 (Month)
The hard disk space required to store the ASIU instantaneous
values.
The storage period for the ASIU average values.
Range: 0 to 120 (Month)
The hard disk space required to store the ASIU average values.
A disk full warning is generated if remaining hard disk space falls
below this value.
A disk full error is generated if remaining hard disk space falls below
this value.
The tag name of the primary server.
Enter up to 8 single-byte alphanumeric characters.
The IP address of the server paired with the primary server.
The time for automatically deleting history data when the end of the
storage period is reached.
The setting for selecting whether to save communication log data.
Options: Yes or No
The setting for specifying the maximum file size for the
communication log.
Range: 1 to 100
31
T0501.EPS
■ Data Sa ved on PCAS
This section describes information on the data saved on PCAS. The storage period can be
set in the System Parameter Configuration screen.
■ PCAS Data
Saved Data Description Storage Folder
Communication
log
The logs for communication
between PCAS and analyzers are
saved.
PCAS¥Log¥Axxx
File Name
CommLogxxx.log
T0502.EPS
IM 11B06B01-01E 1st Edition : June 30,2006-00
Page 37

<T oc> <Ind> <PCAS>
■ GC1000 Mark II Data
32
Saved Data Description
Latest analysis
results
History
chromatograph
(each time) data
History
chromatograph
(1/10) data
Lab analysis
results history
Calibration factor The calibration factor is
One day of analysis
results are saved to one
file.
One analysis is saved to
one file.
One analysis is saved to
one file.
Lab analysis results are
saved to one file.
saved to one file. Up to
1000 separate calibration
factor information and
calibration factor items can
be saved. If this number is
exceeded, a file is renamed
so that its name includes
“old.” If an “old” file already
exists, it is not overwritten.
Storage Folder
AnaID¥Ana¥y
yyyMM¥dd
AnalD¥FullCro
¥yyyyMM¥dd
AnalID¥SkipCro¥History chromatograph (1/10)
AnaID¥Lab Lab analysis results information
AnaID¥Cal Calibration factor information file:
Latest analysis results information
file: AnayyyyMMdd.inf
Latest analysis results file:
AnayyyyNNdd.nar
History chromatograph (each time)
information file: FullyyyyMMdd.inf
History chromatograph (each time) file:
FullyyyyMMddhhmmss.chr
information file: SkipyyyyMMdd.inf
History chromatograph (1/10) file:
SkipyyyyMMddhhmmss.chr
file: Lab.inf
Lab analysis results file: Lab.dat
Cal.inf
Calibration factor information old
file: Calold.inf
Calibration factor file: Cal.dat
Calibration factor old file: Cal.olda
File Name
T0503.EPS
■ ASIU Data
Saved Data Description
Instantaneous
value
Average value The average AI value within a set
The AI value of one analysis for
each second is saved to one file.
period is saved to one file.
Storage Folder
AnaID¥ASIUTr
d¥yyyyMM¥dd
AnaID¥ASIUTr
d¥yyyyMM¥dd
■ Description of Storage Folders and Files
PCAS: Installation folder of PCAS
AnaID: PCAS¥Data¥Axxx
yyyy: Year (4 digits)
MM: Month (2 digits)
dd: Day (2 digits)
hh: Hour (2 digits)
File Name
ASIU instantaneous value
information file:
ITrdyyyyMMdd.inf
ASUI instantaneous value file:
ITrdyyyyMMddhhmmss.dat
ASIU average value
information file:
IAveyyyyMMdd.inf
ASUI average value file:
IAveyyyyMMddhhmmss.dat
T0504.EPS
mm: Minute (2 digits)
ss: Second (2 digits)
xxx: Analyzer ID (3 digits)
IM 11B06B01-01E
1st Edition : June 30,2006-00
Page 38

<T oc> <Ind> <PCAS>
5.2 Analyzer Parameter Configuration Screen
This screen is for displa ying and configuring parameters of individual analyzers.
Display Method
Click the Analyzer tab of the Builder screen.
The screen configuration differs depending on the type of analyzer.
(1) GC1000 Mark II analyzer
(2) ASIU analyzer
a. DO Related
b. DI Related
c. AI Related
5.2.1 Analyzer Configuration Screen (GC1000 Mark II)
This screen is for displa ying and configuring the parameters of CG1000 Mark II.
33
F0503.EPS
Example of Analyzer Parameter Configuration Screen (GC1000 Mark II)
Display Item Description
Analyzer ID
Analyzer Type
Analyzer IP Address
Analyzer Tag Name
The ID of the analyzer to register.
The type of the analyzer to register.
Options: GC1000 Mark II/ASIU
The IP address of the analyzer to register.
The tag name of the analyzer to register.
Enter up to 8 single-byte alphanumeric characters.
T0505.EPS
■ Buttons
Delete Button: Deletes the analyzer currently displayed. This oper ation can only be per-
formed if the user lev el is C or abov e.
Add Button: Displa ys the Add Analyz er dialog box. This operation can only be perf ormed
if the user level is C or abo ve .
IM 11B06B01-01E 1st Edition : June 30,2006-00
Page 39

<T oc> <Ind> <PCAS>
5.2.2 Analyzer Parameter Configuration Screen (ASIU)
This screen is for displa ying and configuring the parameters of ASIU. The tabs can be used
to switch between the f ollowing three screens.
(a) DO R elated:This screen is for displaying and configuring parameters related to DO of
ASIU. (The initial state is to displa y the DO Related screen.)
(b) DI Related: This screen is for displaying and configuring parameters related to DI of
ASIU.
(c) AI Related: This screen is for displa ying and configuring parameters related to AI of
ASIU.
Table 5.2 Common Items of the Analyzer Parameter Configuration Screen of ASIU
Display Item Description
Analyzer ID
Analyzer Type
Analyzer IP Address
Analyzer Tag Name
AI Storage Interval
(Seconds)
The ID of the analyzer to register.
The type of the analyzer to register.
Options: GC1000 Mark II/ASIU
The IP address of the analyzer to register.
The tag name of the analyzer to register.
Enter up to 8 single-byte alphanumeric characters.
The save interval for instantaneous values.
Range: 60 to 3600
34
T0506.EPS
■ Buttons
Delete Button: Deletes the analyzer currently displayed. This oper ation can only be per-
formed if the user level is C or abo ve .
Add Button: Displa ys the Add Analyz er dialog box. This operation can only be perf ormed
if the user level is C or abo ve .
(a)DO Related
F0504.EPS
Figure 5.3 Example of Analyzer Parameter Configuration Screen of ASIU (DO Related)
IM 11B06B01-01E
1st Edition : June 30,2006-00
Page 40

<T oc> <Ind> <PCAS>
Table 5.3 DO Related Items
Display Item Description
No.
Tag Name
Signal Name
ON Color
OFF Color
The number of the DO
The tag name of the DO.
Enter up to 8 single-byte alphanumeric characters.
The signal name of the DO.
Enter up to 8 single-byte alphanumeric characters.
The display color for when the DO is ON.
Options: White, Green, Red, Yellow, and Light Gray
The display color for when the DO is OFF.
Options: White, Green, Red, Yellow, and Light Gray
(b)DI Related
35
T0507.EPS
Figure 5.4 Example of DI Related Display
Table 5.4 DI Related Items
Display Item Description
No.
Tag Name
Signal Name
ON Color
OFF Color
The number of the DI.
The tag name of the DI.
Enter up to 8 single-byte alphanumeric characters.
The signal name of the DI.
Enter up to 8 single-byte alphanumeric characters.
The display color for when the DI is ON.
Options: White, Green, Red, Yellow, and Light Gray
The display color for when the DI is OFF.
Options: White, Green, Red, Yellow, and Light Gray
F0505.EPS
T0508.EPS
IM 11B06B01-01E 1st Edition : June 30,2006-00
Page 41

<T oc> <Ind> <PCAS>
(c)AI Related
F0506.EPS
Figure 5.4 Example of AI Related Display
Table 5.4 AI Related Items
Display Item Description
No.
Tag Name
Signal Name
Unit
Lower Limit range
Upper Limit range
The number of the AI.
The tag name of the AI.
Enter up to 8 single-byte alphanumeric characters.
The signal name of the AI.
Enter up to 8 single-byte alphanumeric characters.
The unit of the AI.
Options: All units registered in the AI Unit Configuration screen.
The lower limit range of the AI.
Range: ⫺9999.999 to 9999.999 (Lower limit range<upper limit range)
The upper limit range of the AI.
Range: ⫺9999.999 to 9999.999 (Lower limit range<upper limit range)
36
T0509.EPS
IM 11B06B01-01E
1st Edition : June 30,2006-00
Page 42

<T oc> <Ind> <PCAS>
5.3 AI Unit Configuration Screen
This screen is for displa ying and configuring user-defined AI units for ASIU .
Display Method
Click the AI Unit tab of the Builder screen.
37
AI Unit Configuration Screen
Display Item Description
Unit Code
AI Unit
The code number for registering the AI unit.
Range: 20 to 99 (0 to 19 are unavailable because they are reserved
for the basic units.)
The AI units defined by the user.
Enter up to 3 single-byte alphanumeric characters.
F0507.EPS
T0510.EPS
IM 11B06B01-01E
1st Edition : June 30,2006-00
Page 43

<T oc> <Ind> <PCAS>
6. Network Monitoring Screen
This screen is for monitoring the network status of the analyzer bus.
Startup Method
• Click the Network Monitoring Screen in the Screen menu of the Maintenance screen.
• Click the Network Monitoring Screen button on the toolbar in the Maintenance screen.
• Click the Network Monitoring Screen from the popup menu that appears by right-clicking
the task tray.
Screen Configuration
38
Network Monitoring Screen
Display Item Description
Time
Sender
Recipient
Type
Message Contents
Displays the time when a message is generated.
Displays the sender IP address.
Displays the recipient IP address.
Displays the communication type. If a message thus generated
cannot determine which types it belongs to, the number of message
characters is displayed instead.
Type: TCP/UDP/ICMP/ARP
The following shows the maximum number of characters depending
on message types, from the beginning of message contents:
TCP (72 characters): If the number of data characters exceeds the
limit, “...” is represented for the missing part.
UDP (80 characters): If the number of data characters exceeds the
limit, “...” is represented for the missing part.
ICMP (3 characters): Displays send data length.
ARP (51 characters): Displays “Request who-has” (sender IP
address); “tell” (recipient IP address).
Other (20 characters): Displays the number of message characters.
F0601.EPS
T0601.EPS
IM 11B06B01-01E
1st Edition : June 30,2006-00
Page 44

<T oc> <Ind> <PCAS>
Functions
•Monitoring the network status of Ethernet analyzer bus.
■ Starting Monitoring of Network Status
Select the Start command in the System menu to display the Select Device dialog bo x.
F0602.EPS
Select Device Dialog Box
The Select Device dialog bo x displays a list of de vices on the network on which the PC is
running. Select a de vice and then clic k the OK button to start monitoring.
Note: If the auto sa ving of files is not set, the message “Monitoring buffer is full. Monitoring
has stopped.” appears when the monitoring data exceeds 1 MB . The corresponding data is
not saved.
39
■ Stopping Monitoring of Network Status
Select the Stop command in the System menu to stop network monitoring.
Note: If the automatic saving of files is not set, the monitoring data is not saved ev en if monitoring is stopped. Sa ve the data if
necessary.
■ Saving Network Status (Manual)
Select the Save command in the System menu to sa v e the network status. This operation is
not possible while network status monitoring is taking place. The data (up to 1 MB) currently
displayed in the list is sa ved to a file . The extension name of the file is “.nmd.” Set whether
or not to automatically save the network status from the Configuration screen.
■ Displaying Saved Network Status
Select the Open command in the System menu to display a sa ved netw ork status. This
operation is not possible while network status monitoring is taking place.
■ Configuring Network Monitoring Screen
Select the Configuration command in the System menu to display the Configur ation screen.
● Configuration Screen
This screen is for configuring the Network Monitoring screen.
IM 11B06B01-01E 1st Edition : June 30,2006-00
Page 45

<T oc> <Ind> <PCAS>
F0603.EPS
Configuration Screen
40
Display Item Description
Filter
The setting to select whether or not to use a filter for display when
displaying electronic messages on the Network Monitoring screen. If
NO is selected, the Filter List and related items (Add, Delete, and
Edit) are unavailable.
Options: YES/NO
Filter List
Displays the following items.
Sender IP Address, Recipient IP Address, Protocol, Sender Port
Number, Recipient Port Number, and Filter Rule
Add Button
Adds a new item to the filter. The Add dialog box is displayed.
This operation cannot be performed if No is selected for Filter.
Delete Button
Deletes a filter item.
This operation cannot be performed if No is selected for Filter or no
item is selected in the Filter List.
Edit Button
Edits the filter. The Edit dialog box is displayed.
This operation cannot be performed if No is selected for Filter or no
item is selected in the Filter List.
Auto Save
The setting to select whether to automatically save electronic
messages displayed in the Network Monitoring screen. If NO is
selected, the input box and Browse button for the output destination
cannot be used.
Options: YES/NO
Output Destination
Configures the directory for auto save. The Browse button can also
be used to select a directory.
T0602.EPS
IM 11B06B01-01E
1st Edition : June 30,2006-00
Page 46

<T oc> <Ind> <PCAS>
● Add Dialog Box
This dialog box is f or adding a new filter item.
F0604.EPS
Add Dialog Box
41
Display Item Description
IP
Sender IP Address
Recipient IP Address
Protocol
TCP and UDP
Sender Port
Recipient Port
Filter Rule
Note: Communication set to be rejected in Filter Rule is mask ed, and all the other communication set to be monitored is
displayed.
● Edit Dialog Box
This dialog box is for editing filter items . The details are the same as those of the Add dialog box.
Configures the IP addresses and protocol to use for the filter.
The sender IP address to use for the filter.
The recipient IP address to use for the filter.
The protocol to use for the filter.
Options: TCP/UDP/CMP/ARP/Other
The port number to use for the filter with TCP and UDP.
The sender port number to use for the filter.
The recipient port number to use for the filter.
Sets whether to monitor or reject (not monitor) communication
applicable to the set filter.
Options: Monitor/Reject
T0603.EPS
Edit Dialog Box
F0605.EPS
IM 11B06B01-01E 1st Edition : June 30,2006-00
Page 47

<T oc> <Ind> <PCAS>
7. Alarm Screen
If an alarm or error is generated on PCAS, a popup window is display ed to notify you of the
alarm. In addition to this window, there are also screens for displa ying the current alarm
status and alarm history of the PCAS.
There are the following f our types of screen.
• Alarm Generated dialog box
• Alarm Status screen
• Alarm History screen
• Alarm Detailed Explanation screen
● Alarm List
The alarms of PCAS are as follows.
Alarm numbers 400 to 499: Error (le vel 1 alarm)
Alarm numbers 500 to 599: Alarm (lev el 2 alarm)
42
Number
421
521
538
539
550
551
552
553
554
591
*1 Error type = 0: Ping error, 1: TCP error, 2: Application error (TCP1), 3: Application error (TCP2), 4: Application error
(TCP3)
*2 File code = 1: Detailed chromatogr aph 1, 2: Detailed chromatogr aph 2, 3: T emperature , 4: Pressure 1, 5: Pressure 2, 6:
Analysis results, 7: Initial database, 99: Other
*3 Server type = 0: Primary, 1: Secondary
Name
Disk Full Error
Disk Full Warning
Analyzer
Communication
Disconnected
Communication
with Server
Disconnected
FTP Forwarding
of Process Failed
Time and Date
Setting Failed
Secondary
Server T ype
Duplicate Alarm
Secondary
Server
Duplicate ID
alarm
Conffict of
Analyzer ID
Alarm History
Reset Message
Description
The available disk space has
become less than the server disk
full error capacity.
The available disk space has
become less than the server disk
full warning capacity.
Communication with the analyzer
is no longer possible.
Communication with the
secondary server is no longer
possible.
FTP file forwarding of process
status failed.
Setting the time and date of the
analyzers failed.
The primary server and the
secondary server are set to the
same type.
The primary server and the
secondary server are set to the
same ID number.
Analyzer ID on the database does
not match the ID registered on
the PCAS.
The alarm history was reset.
Level
1
2
2
2
2
2
2
2
2
2
DATA1
None
None
Analyzer ID
Secondary
server ID
Analyzer ID
Analyzer ID
Secondary
server ID
Secondary
server ID
Analyzer ID
Analyzer ID
DAT A2
None
None
*1
Error type
None
*2
File code
None
*3
Server type
None
Registered ID
None
T0701.EPS
IM 11B06B01-01E
1st Edition : June 30,2006-00
Page 48

<T oc> <Ind> <PCAS>
7.1 Alarm Generated Dialog Box
If an alarm or error is generated on PCAS, the Alarm Generated dialog box is display ed on
top of other windows. Ho we ver, this dialog box is not displa yed if the PC running PCAS is
also running ASET.
Screen Configuration
43
F0701.EPS
Figure 7.1 Example of Alarm Generated Dialog Box
Table 7.2 Alarm Generated Dialog Box Display Items
Display Item Description
Time Generated
F
ALM
Alarm Description
The time when the alarm was generated.
The status of the alarm.
1: Generated
The alarm number.
Displays an explanation of the alarm.
T0702.EPS
■ Buttons
Alarm Status Button: This displays the Alarm Status screen. The Alarm Generated
dialog box remains display ed when y ou display the Alarm Status
screen.
Alarm Details Button: This displa ys the Alarm Detailed Explanation screen for the alarm
highlighted in yellow . The alarm for which details are displa yed is
deleted from the Alarm Generated dialog box.
Confirm Separately Button: Deletes the alarm highlighted in yellow from the Alarm Gener-
ated dialog box. The dialog bo x closes when there are no alarms
to display.
Confirm All Button: Confirms all alarms. The Alarm Generated dialog box closes if this
button is click ed.
Note: Confirming an alarm is an operation that deletes the alarm display from the Alarm Generated dialog box. It does not
cancel the alarm status of PCAS. The condition that caused the alarm needs to be resolved in order to cancel the
alarm status.
IM 11B06B01-01E 1st Edition : June 30,2006-00
Page 49

<T oc> <Ind> <PCAS>
7.2 Alarm Status Screen
This screen is for displa ying the current alarm status of PCAS. Alarms are display ed in
order from the latest. Up to 168 alarms can be displa yed.
Display Method
• Select Alarm Status Screen in the Screen menu of the Status screen or click
• Select Alarm Status Screen in the Screen menu of the Maintenance screen or click
.
• Click Alarm Status Screen from the popup menu that appears by right-clicking the task
tray.
• Click the Alarm Status button in the Alarm Generated dialog box.
Screen Configuration
44
Figure 7.2 Example of Alarm Status Screen
Table 7.3 Alarm Status Screen Display Items
Display Item Description
Time Generated
F
ALM
Alarm Description
DATA1/DATA2
The time the alarm was generated.
The status of the alarm.
1: Generated
The alarm number.
Displays an explanation of the alarm.
Displays alarm information 1 and alarm information 2.
F0702.EPS
IM 11B06B01-01E
T0703.EPS
1st Edition : June 30,2006-00
Page 50

<T oc> <Ind> <PCAS>
7.3 Alarm History Screen
This screen is for displa ying the alarm history for alarms of PCAS that were generated in
the past. Alarms are displa yed in order from the latest. Up to 300 alarms can be displayed.
Display Method
Click Alarm History in the System menu of the Alarm Status screen.
Screen Configuration
45
Figure 7.3 Example of Alarm History Screen
Table 7.4 Alarm History Screen Display Items
Display Item Description
Time Generated
F
ALM
Alarm Description
DATA1/DATA2
The time the alarm was generated.
The status of the alarm.
0: Canceled, 1: Generated
The alarm number.
Displays an explanation of the alarm.
Displays alarm information 1 and alarm information 2.
F0703.EPS
T0704.EPS
IM 11B06B01-01E
1st Edition : June 30,2006-00
Page 51

<T oc> <Ind> <PCAS>
7.4 Alarm Detailed Explanation Screen
This screen is for displaying detailed e xplanations on alarms by alarm number .
Display Method
• Click the Alarm Details button in the Alarm Generated dialog box. (Displays a detailed
explanation on the alarm highlighted in yellow.)
• Click Alarm Details in the System menu of the Alarm Status screen, enter an alarm
number, and then clic k the OK button.
• Click Alarm Details in the System menu of the Alarm History screen, enter an alarm
number, and then clic k the OK button.
Screen Configuration
46
Figure 7.4 Example of Alarm Detailed Explanation Screen
Table 7.5 Alarm Detailed Explanation Display Items
Display Item Description
Alarm Number
Category
Message
Alarm Description
Related Data 1
Related Data 2
Alarm Status
Suspected Cause
Measure
The alarm number.
The alarm category.
The alarm number.
The alarm title.
The explanations of the meanings of alarm information 1 and alarm
information 2.
The detailed explanation of the alarm status.
The suspected cause of the alarm generated.
The measure to carry out to cancel the alarm.
F0704.EPS
IM 11B06B01-01E
T0705.EPS
1st Edition : June 30,2006-00
Page 52

<Int> <T oc> <Ind>
User’ s Manual Revision Inf ormation
● Title : PCAS PC Analyzer Server Software
● Manual No. : IM 11B06B01-01E
June 2006/Preminary Edition
Newly published
i
Subject to change without notice.
IM 11B06B01-01E
1st Edition : June 30,2006-00
Page 53

Blank Page
 Loading...