

Page 1
USER’S MANUAL
3D OPTICAL COHERENCE TOMOGRAPHY
3D OCT-1
PC SOFTWARE EDITION
Version 8.1X
39040 MANEX811
Page 2

Page 3

INTRODUCTION
CAUTION : Federal laws restricts this device to the sale by or on the order of a physician.
Thank you for purchasing the TOPCON 3D OCT-1 Optical Coherence Tomography.
FEATURES
The user's manual is made so that the customer can refer to this manual when learning how
to operate the 3D OCT-1 software and when using it. This manual does not describe how to
take a picture and how to diagnose the photographed image. For the photographing method,
refer to the description about "Capture" in the instruction manual that is attached to each hardware.
This manual is provided for the following products.
Objective products:
3D OCT-1, OCT Viewer
This manual includes the description about the functions that cannot be used in the OCT
Viewer. These
functions are explained as shown below.
Example: (This function cannot be used in OCT Viewer.)
PURPOSE OF THIS MANUAL
This manual explains the details of the function and use method to make a good use of the 3D
OCT-1 analysis software. Before using the software, carefully read this manual to ensure that
you operate it efficiently and safely. Always keep this manual at hand to make a good use of it.
ATTENTION
• Before using this software, carefully read this manual. Then, use the software according to
"LICENSE TERMS" and this manual. Topcon Corporation owns the copyright of the software. Reproduction and copying of the software and/or the User's Manual, in whole or in
part, without permission from Topcon Corporation, is strictly prohibited.
• The User's Manual is made on an assumption that the user already has knowledge about
the operation system of the personal computer and Microsoft Windows. The User's Manual
does not describe the details on how to handle common operation procedures of the personal computer and Microsoft Windows.
Topcon Corporation shall not take any responsibility for the results caused by wrongly operating the personal computer and/or Microsoft Windows.
• The specifications of the software and description of the User's Manual are subject to
change without advance notice.
0123
1
Page 4

TABLE OF CONTENTS
INTRODUCTION ....................................................................................................................................... 1
Displays for Safe Use ........................................................................................................................... 6
SAFETY CAUTIONS ................................................................................................................................. 7
User maintenance ............................................................................................................................... 10
Environment for Operation .................................................................................................................. 10
INTENDED PATIENT POPULATION ................................................................................................. 11
INTENDED USER'S PROFILE ........................................................................................................... 11
ESCAPE CLAUSES ............................................................................................................................ 11
1. STARTING ......................................................................................................................................... 12
1.1. Starting and Exiting the 3D OCT-1 Program ............................................................................... 12
1.1.1. To Start the 3D OCT-2000 Program: ..........................................................................................12
1.1.2. To Exit the 3D OCT Program: .....................................................................................................12
1.1.3. Main Menu and Tool bar Icons ....................................................................................................13
1.1.4. Options Settings ..........................................................................................................................15
2. CAPTURING TOMOGRAMS ............................................................................................................. 22
2.1. Main Screen ................................................................................................................................ 23
2.2. Selecting the Patient ................................................................................................................... 24
2.2.1. To Register a New Patient: .........................................................................................................25
2.2.2. Selecting the photography mode ................................................................................................28
2.3. Photography Window .................................................................................................................. 29
2.3.1. Patient information bar ................................................................................................................ 30
2.3.2. Primary Tomogram Viewing Area: Window A .............................................................................31
2.3.3. Fundus/Anterior Segment Image Viewing Area: Window B ........................................................ 32
2.3.4. Thumbnail View Panel ................................................................................................................35
2.3.5. Scan Information Panel ...............................................................................................................35
2.4. Fundus Tomography Data Display ............................................................................................. 36
2.4.1. [Radial Scan] photography .......................................................................................................... 36
2.4.2. [Line] photography ......................................................................................................................36
2.4.3. [5Line Cross] photography ..........................................................................................................37
2.4.4. [3D Wide] photography ...............................................................................................................37
2.4.5. [3D Macula (V)] photography ...................................................................................................... 38
2.4.6. [3D Macula] photography ............................................................................................................38
2.4.7. [3D Optic Disc] photography .......................................................................................................39
2.5. Fundus Photography Data .......................................................................................................... 40
2.5.1. Title bar .......................................................................................................................................40
2.5.2. C-2 Tool bar ................................................................................................................................41
2.5.3. C-3 Photography procedure/Screen display tab .........................................................................42
2.5.4. C-4 Thumbnail window ................................................................................................................43
2.5.5. C-5 Fundus image display area ..................................................................................................44
2.5.6. C-6 Information window ..............................................................................................................49
2.5.7. C-7 Photography result display list .............................................................................................. 49
2.5.8. C-8 Status bar .............................................................................................................................50
2.5.9. Setting .........................................................................................................................................51
2.5.10. Printing ..................................................................................................................................... 56
2.6. Scan Pattern Specifications ........................................................................................................ 59
2.6.1. Line Scan ....................................................................................................................................59
2
Page 5

2.6.2. 5 Line Cross Scan .......................................................................................................................59
2.6.3. 3D Scan ......................................................................................................................................60
2.6.4. Radial Scan .................................................................................................................................60
2.7. Saving and Deleting Captured Tomograms ................................................................................ 61
2.7.1. To Save a Tomogram ................................................................................................................. 61
2.7.2. To Delete a Tomogram: ..............................................................................................................61
2.8. Displaying Report of the Photographed Tomogram .................................................................... 62
2.8.1. Displaying and Printing the Report .............................................................................................. 62
3. DISPLAYING TOMOGRAMS ............................................................................................................. 64
3.1. Selection Mode Window ............................................................................................................. 64
3.1.1. Grid interface ............................................................................................................................... 65
3.1.2. Thumbnail Interface .................................................................................................................... 70
3.1.3. Date Interface ..............................................................................................................................71
3.2. Selecting and Retrieving the Patient ........................................................................................... 72
3.2.1. Selecting the patient ....................................................................................................................72
3.2.2. Retrieving the patient ..................................................................................................................72
3.3. Operating through Data List ........................................................................................................ 75
3.3.1. Contents on Data list ...................................................................................................................75
3.3.2. History data list screen ................................................................................................................76
3.3.3. Arranging Data Records ..............................................................................................................78
3.3.4. Comparing Data from the Data list ..............................................................................................78
3.3.5. Analyzing Data from the Data list ................................................................................................78
3.3.6. Making Reports from the Data list ............................................................................................... 79
3.4. View Window .............................................................................................................................. 80
3.4.1. A-1: Thumbnail area ....................................................................................................................81
3.4.2. A-2: Image Processing Controls area .........................................................................................81
3.4.3. A-3: Fundus/Anterior Segment Image Display Area ...................................................................83
3.4.4. A-4: Thickness Graph Area .........................................................................................................94
3.4.5. A-5: Tomogram display area/Auxiliary tomogram display area ...................................................95
3.4.6. A-6: 3D tomogram display area ................................................................................................ 104
3.5. Volume ...................................................................................................................................... 107
3.5.1. Cropping ....................................................................................................................................107
3.5.2. Subvolume ................................................................................................................................ 108
3.6. Slicing ....................................................................................................................................... 110
3.7. ILM/RPE/(IS/OS)/(BM) .............................................................................................................. 112
3.8. Bookmark and Right-click Menu ............................................................................................... 114
3.8.1. Bookmark ..................................................................................................................................114
3.8.2. Right-click Menu ........................................................................................................................115
3.9. Pin-point Registration™ ............................................................................................................ 117
3.9.1. Shadowgram .............................................................................................................................117
3.9.2. Automatic Positioning ................................................................................................................117
3.9.3. Manual Positioning .................................................................................................................... 117
3.9.4. Pin-point Registration™ ............................................................................................................ 118
3.9.5. Reference Image .......................................................................................................................119
3.10. Blood Vessel Detection ........................................................................................................... 123
3.10.1. How to use ..............................................................................................................................123
4. ANALYZING TOMOGRAMS ............................................................................................................ 125
4.1. Analyzing and Modifying Layers ............................................................................................... 125
3
Page 6

4.2. Analyzing the Optic Disc ........................................................................................................... 128
4.3. Fundus Image Analysis ............................................................................................................. 137
4.3.1. How to analyze ..........................................................................................................................137
4.3.2. A variety of measurement .........................................................................................................138
4.3.3. Tool bar .....................................................................................................................................139
4.4. Red-free Fundus Image Analysis .............................................................................................. 140
4.4.1. How to analyze ..........................................................................................................................140
4.4.2. A variety of measurement .........................................................................................................141
4.4.3. Tool bar .....................................................................................................................................141
4.5. Trend Analysis .......................................................................................................................... 142
4.5.1. How to use this function ............................................................................................................142
4.5.2. Explanation of window ..............................................................................................................143
4.5.3. [Data Replacement] button ....................................................................................................... 146
4.5.4. Outputting/saving the report ......................................................................................................148
4.6. Glaucoma Analysis in the Macula ............................................................................................ 149
4.6.1. How to use this function ............................................................................................................149
4.6.2. Outputting/saving the report ......................................................................................................150
4.7. Drusen Analysis ........................................................................................................................ 152
4.7.1. How to use this function ............................................................................................................152
4.7.2. Explanation of Window ..............................................................................................................153
4.7.3. Outputting/saving the report ......................................................................................................155
5. COMPARING ANALYSIS RESULTS ............................................................................................... 156
5.1. Types of Comparison ................................................................................................................ 156
5.2. Both Eyes Display ..................................................................................................................... 156
5.2.1. Selection of both eyes from the OCT data list ........................................................................... 156
5.2.2. Changing one eye display to both eyes display ........................................................................157
5.3. Comparison ............................................................................................................................... 159
5.3.1. Comparison ...............................................................................................................................159
5.4. Comparison: Advanced ............................................................................................................. 160
5.4.1. Comparison ...............................................................................................................................160
5.5. Compare ALL ............................................................................................................................ 162
5.5.1. Comparison of the images with different scan modes ..............................................................162
5.6. 3D Mosaic Comparison Results (3D Mosaic) ........................................................................... 164
5.6.1. 3D Mosaic Comparison Results ................................................................................................164
5.7. Saving Analyzed Results .......................................................................................................... 166
6. OUTPUTTING RESULTS ................................................................................................................. 167
6.1. Making / Saving Movies ............................................................................................................ 168
6.1.1. Making Movies - Automatic .......................................................................................................169
6.1.2. Making Movies - Manual ...........................................................................................................170
6.2. Exporting Images ...................................................................................................................... 171
6.2.1. When "File save dialog box" is displayed in export ...................................................................171
6.2.2. When "File save dialog box" is not displayed in export .............................................................171
6.3. Printing Images ......................................................................................................................... 172
6.4. Making Reports ......................................................................................................................... 173
6.4.1. To make a Report .....................................................................................................................173
6.4.2. List of Report Output Form ........................................................................................................173
6.4.3. Patterns that invalidate the output buttons ................................................................................ 174
6.4.4. Example of report ...................................................................................................................... 174
4
Page 7

7. MACRO FUNCTION ......................................................................................................................... 178
8. MANAGING DATA ........................................................................................................................... 180
8.1. Database Structure ................................................................................................................... 180
8.1.1. System Database ......................................................................................................................180
8.1.2. Study Drive ................................................................................................................................ 180
8.1.3. Changing Database ..................................................................................................................180
8.2. Editing/Deleting Patient Records .............................................................................................. 181
8.2.1. Editing Patient Information ........................................................................................................181
8.2.2. Copying Image Records ............................................................................................................182
8.2.3. Deleting Image Records ............................................................................................................182
8.3. Archive and Back Up ................................................................................................................ 184
8.3.1. Archiving Process .....................................................................................................................184
8.3.2. Copying Image Files ................................................................................................................. 185
8.4. Data Convert ............................................................................................................................. 187
8.4.1. Main menu ................................................................................................................................187
8.4.2. Reservation setting screen ........................................................................................................188
8.4.3. Scan length compensation ........................................................................................................190
9. TROUBLE SHOOTING .................................................................................................................... 191
9.1. Messages during Operation ...................................................................................................... 191
10. 3D OCT-1 PC SOFTWARE LICENSE TERMS .............................................................................. 192
11. APPENDIX 1 .................................................................................................................................. 199
11.1. 3D OCT: Axial Length Compensation Range ......................................................................... 199
11.2. Changing/Adding Database .................................................................................................... 200
11.3. A VARIETY OF SETTING ....................................................................................................... 204
5
Page 8
Displays for Safe Use
To encourage safe and proper use and to prevent harm to the operator and others or potential damage to
property, important messages are put on the instrument body and inserted in the User Manual.
We suggest that everyone understand the meaning of the following displays, icons and text before reading this user manual and observe all listed instructions.
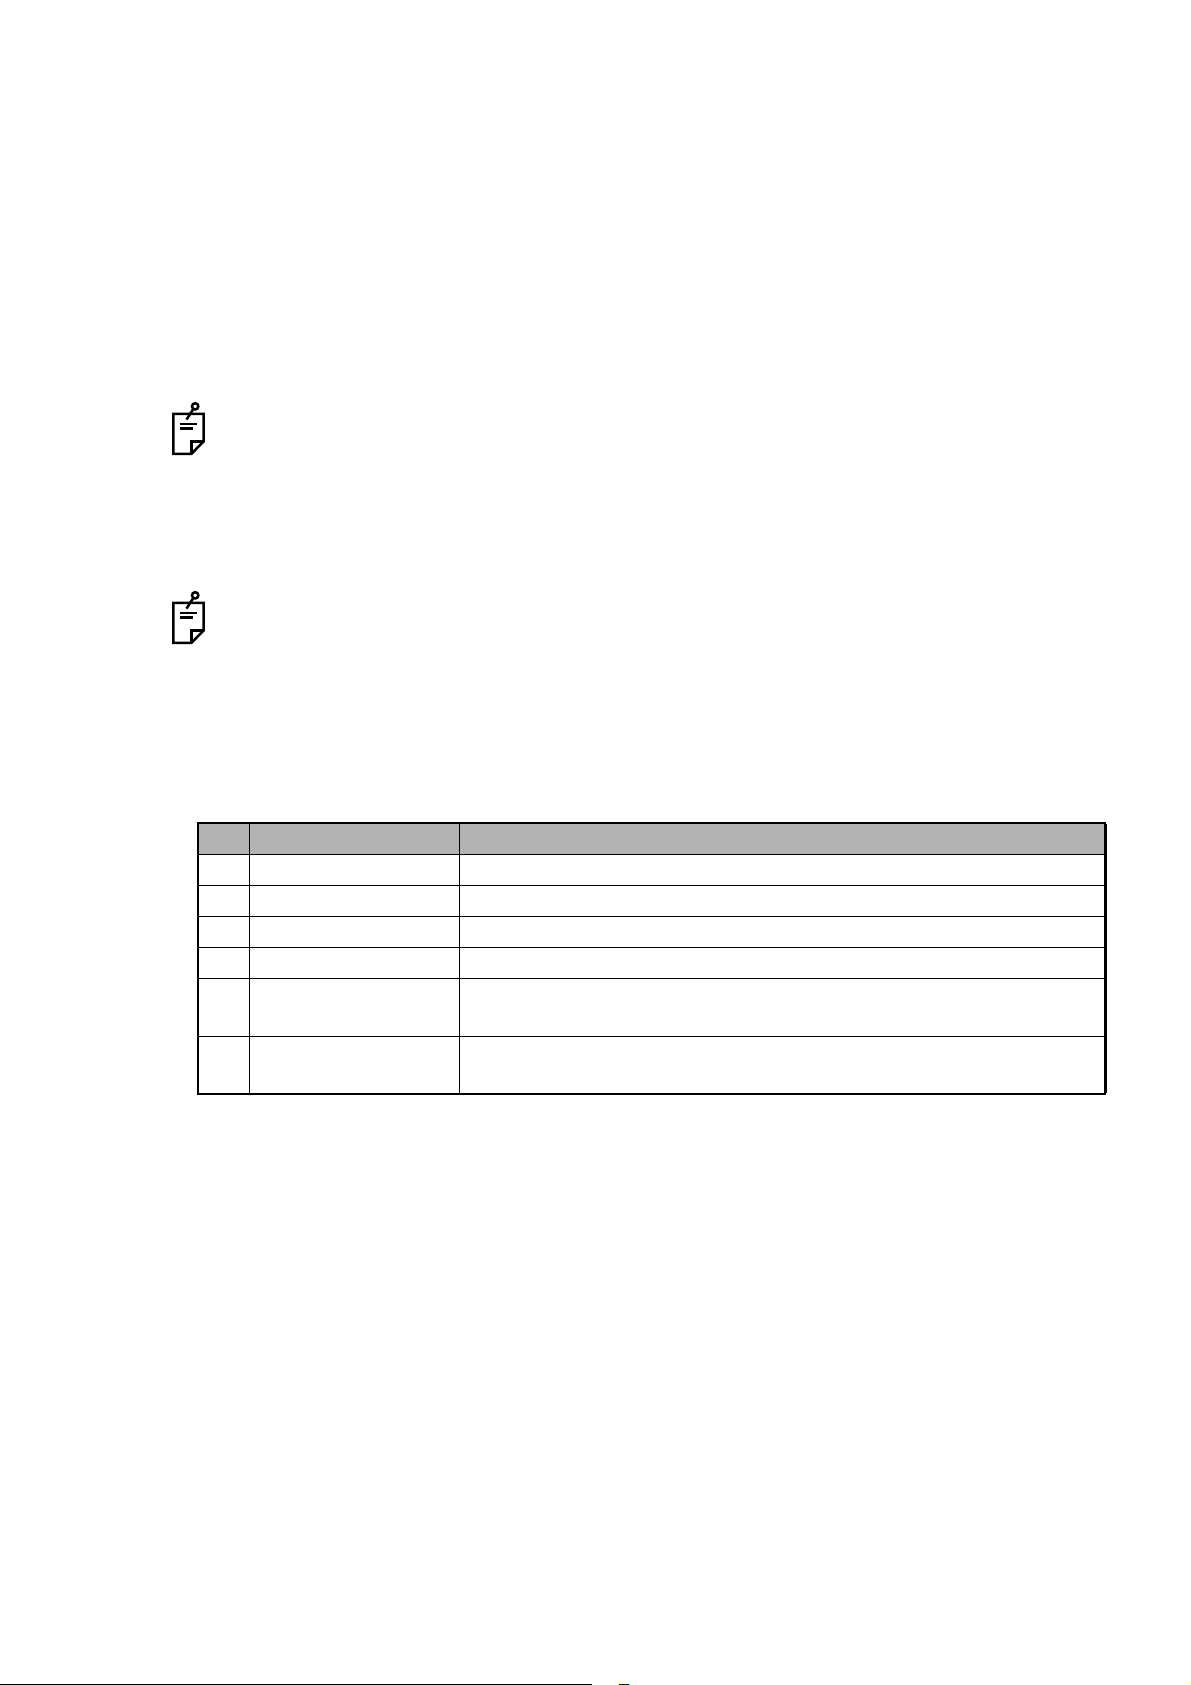
Display
Display Meaning
WARNING
CAUTION
Injury refers to cuts, bruises, burns, electric shock, etc. which do not require hospitaliza-
tion or extended medical treatment.
Physical damage refers to extensive damage to the building, nearby equipment and/or
surrounding furniture.
ICON
Icon Meaning
Incorrect handling by ignoring this display may lead to a risk of
death or serious injury.
Incorrect handling by ignoring this display may lead to personal injury or physical damage.
Prohibition
Specific content is expressed with words or a picture near the icon.
Mandatory Action
Specific content is expressed with words or a picture near the icon.
6
Caution
Specific content is expressed with words or a picture near the icon.
Page 9
SAFETY CAUTIONS
CAUTIONS
Icon Prevention item Page
The necessary capacity of memory and hard disk are changed depending
on the CPU in the personal computer or environment.
If the number of "Thread" in CPU is beyond 4, the processing may be
delayed. Reduce the number of "Thread" to use this software.
When the object to be displayed is changed, start this software again. 18
When entering the patient ID through the 3D OCT-1, a bar code reader, a
card reader, IMAGEnet, Multi-Viewer, etc., you must use only the alphabet,
numerals and "-". Moreover, the following symbols cannot be used for the
patient ID.
" \ / : 'Space' * ? . <> | _ ! # $ %
If you use a patient ID which does not meet the above conditions, the report
cannot be output correctly from time to time.
When the photography data is displayed, "Normative Date" is displayed
according to the patient's age at the photography date. However, it is limited
as mentioned below.
• When the patient is under 19, "Normative Data" for the age of 20 is displayed as reference.
• When the patient is over 81 years old, "Normative Data" for the age of 80
is displayed as reference.
10
10
25
27
When clicking the [Capture] button, sometimes the message "Ocular optical
information value exceeded the compensated limitation. Default value shall
apply." is displayed.
In this case, access "Data Management" again. Click the [Edit patient information]" button and then the [Ocular Param.] button to correct "Ocular
Parameters".
Sometimes the analysis function is not normally finished. In this case, the
thumbnail is marked with "Fail".
For "B-2: Filter", the data of the image being displayed are used and so you
cannot change the values of "Filter" directly.
The Measure Image function is based on the theoretical Gullstrand eye
model. If the parameters of the actual patient's eye, such as the diopter or
axial length, are different from the Gullstrand eye model, the measurement
results may be different from the length and size in reality. The clinician will
be solely responsible for the diagnoses and treatments based on the measurement results.
When modifying the data in optic disc analysis (refer to "4.2. Analyzing the
Optic Disc" (P.132), the circle center is calculated again.
28
62
83
90
94
7
Page 10
Icon Prevention item Page
When you have reanalyzed the data modified manually, the data modified
manually are erased and the "Disc" calculated automatically by the analysis
mode set in the "OCTSet Analysis" tab on P.219 is applied.
As the result of automatic positioning, the fundus image is sometimes
deformed to the oval shape on the fundus image display area (A-3). This is
the result of the positioning process and there is no problem.
After analysis, the images are automatically positioned. If sufficient data
required for overlapping are not provided, automatic positioning may not be
done correctly.
When you have changed to the original tomogram after changing to two or
more tomograms on the screen, you cannot return the edited layers to the
original status by "Undo Modify". After carrying out "Exit Modify", the edited
layers are decided and cannot be returned to the original status. However,
in both cases, the data are not saved. If you return to the patient list screen
without saving the data, you can start the operation from the beginning.
You cannot perform "Modify" for the image photographed by "OverSampling". When the "OverSampling" image is selected, the "Modify" function is
OFF. For the photography with "OverSampling", refer to the instruction
manual of the 3D OCT-2000 instrument body.
96
121
121
131
131
In the automatic optic disc analysis, sometimes errors occur due to the photographed condition as shown below. In this case, using the menu "Disc
Modify" displayed when selecting "Disc Segmentation", you can modify the
analysis result. Refer to "Disc Modify" on P.95 in addition to this page.
When RPE was not detected correctly (If the patients blinked, his/her fixation moved during scan, the tomogram overlaps the top edge of the image
area, or the image quality is low, this may occur), the analysis result may
not be correct.
The result of registration is as follows: Double-click an optional point on the
two tomogram display areas, the two fundus image display areas and the
upper right "Compare Window". The green line with a cross mark appears.
(Pin-point Registration™) Sometimes this green line with a cross mark
appears out of the 3D scan area (green frame).
There are two probable causes.
• On the two fundus image display areas, the fundus image is not aligned
with the "Overlay" image correctly.
• On "Compare Window", the two "Shadowgram" images are not aligned
with each other correctly.
138
162
171
8
To obtain the correct results, check the alignment on the two fundus image
display areas and on "Compare Window". If the images are not aligned correctly, carry out "Reposition" and repeat Step
The insufficient memory error may occur when selecting ten tomograms
depending on the environment.
2 and 3.
175
Page 11

Icon Prevention item Page
After clicking [Run] in the "Register" menu, Thickness Map is not displayed
from time to time. In this case, click [On/Off] in the "Thickness" menu.
To display Thickness Map, the same layers in the selected image as those
in "Image 1" must be analyzed. If the different layer has been analyzed,
click the layer detection display selector buttons properly (refer to "A-2:
Image Processing Controls area" on P.83) and analyze the necessary layer.
Then, try the operation again to display Thickness Map.
Make sure that no other windows or images are blocking or placed over the
Volume window during the movie-saving/recording procedure.
When batch export of the data including "_" (underbar) is performed for the
patient ID which was created by the old version software, sometimes the
data cannot be output with the filename that was set through "OCTSet".
When the analysis has failed, it is probable that the instrument did not take
a picture correctly. It is possible that the analysis will be successful if the
instrument takes a picture again.
To prevent your software from being infected with a computer virus through
the network:
• Please prepare an antivirus software. Please use the antivirus software
applicable to your use environment.
• TOPCON has already checked this instrument's operation when Trend
Micro Virus Buster Corporate Edition (Ver10.0 Service Pack 1) of Trend
Micro Incorporated is used.
175
175
178
181
190
214
9
Page 12
User maintenance
To ensure the safety and performance of this software, all maintenance works, unless specified in this
manual, shall be conducted by trained service engineers. The following maintenance task may be done
by the user. For details, refer to the relevant part of this manual.
• Archive and Back Up (Refer to P.197 in this manual.)
Environment for Operation
The necessary capacity of memory and hard disk are changed depend-
CAUTION
CAUTION
CAUTION
ing on the CPU in the personal computer or environment.
If the number of "Thread" in CPU is beyond 4, the processing may be
delayed. Reduce the number of "Thread" to use this software.
To operate the 3D OCT software normally, you must log on OS (Operating System) with Administrator's authority. If you log on OS with others
except Administrator's authority, you may not save the photography
data.
Item Operation spec. Recommended spec.
PC IBM PC/AT compatible machine
OS Windows 7 Professional 64bit
CPU Core2 DUO Core i7 (equivalent to 2600)
Clock 3GHz 3.4GHz
Core - 4
RAM 4GB 8GB
Hard disk At least 500GB (At least 7200RPM)
Drive (for installation/
backup of data)
Display SXGA (1280×1024) and 32-bit color WSXGA+ (1680×1050) and 32-bit color
Graphics board VRAM of 256MB with OpenGL capability VRAM of 512MB with OpenGL capability
Network card On-board LAN (to connect with LAN)
Expansion slot At least one free slot of PCI Express ×1
Database Microsoft SQL Server 2005
DVD-Multi drive
Expansion LAN card (applicable to PCI
Express Gigabit: for connecting OCT)
(for increasing the network card)
(SP2 or higher)
Microsoft SQL Server 2008 (SP1 or higher)
Microsoft SQL Server 2008 R2
10
When using Express Edition, it does not
operate correctly if the system manages an
enormous amount of patients/photographed data. In this case, please use
Standard Edition, etc.
Page 13

Item Operation spec. Recommended spec.
Browser It is necessary to install Internet Explorer
Version 8 (IE8) or Internet Explorer Version
9 (IE9).
If any other browser is used, the report is
not output correctly from time to time.
Others RAID control (to protect data)
INTENDED PATIENT POPULATION
The patient who undergoes an examination by this instrument must maintain concentration for a few
minutes and adhere to the following instructions:
- Fix the face to the chinrest, forehead rest.
- Keep the eye open.
- Understand and follow instructions when undergoing an examination.
INTENDED USER'S PROFILE
This software and 3D OCT-1 instrument are made on the assumption that they will be used by the doctors (ophthalmologists or others), optometrists and technicians who have the professional training and
experience about an ophthalmic image device.
The images and analysis results obtained by the instrument and software must be used for diagnosis
made by ophthalmologists and optometrists.
ESCAPE CLAUSES
TOPCON shall not take any responsibility for damage due to fire, earthquakes, actions by third
persons and other accidents, or damage due to negligence and misuse by the user and any
use under unusual conditions.
TOPCON shall not take any responsibility for damage derived from the inability to properly use
this software, such as loss of business profit and/or suspension of business.
TOPCON shall not take any responsibility for damage caused from using this software in a
manner other than that described in this User Manual. In the case of software products, the
license terms enclosed supersede any other understandings.
Diagnosis made shall be the responsibility of the pertaining doctors and TOPCON shall not
take any responsibility for the results of such diagnoses.
This software and 3D OCT-1 instrument are not made on the assumption that diagnosis will be
made by utilizing only the result that has been obtained by using this software.
3D OCT and IMAGEnet are the registered trademarks of TOPCON CORPORATION.
* In general, other company names and product names in this manual are the trademarks or the regis-
tered trademarks of those companies.
11
Page 14
1. STARTING
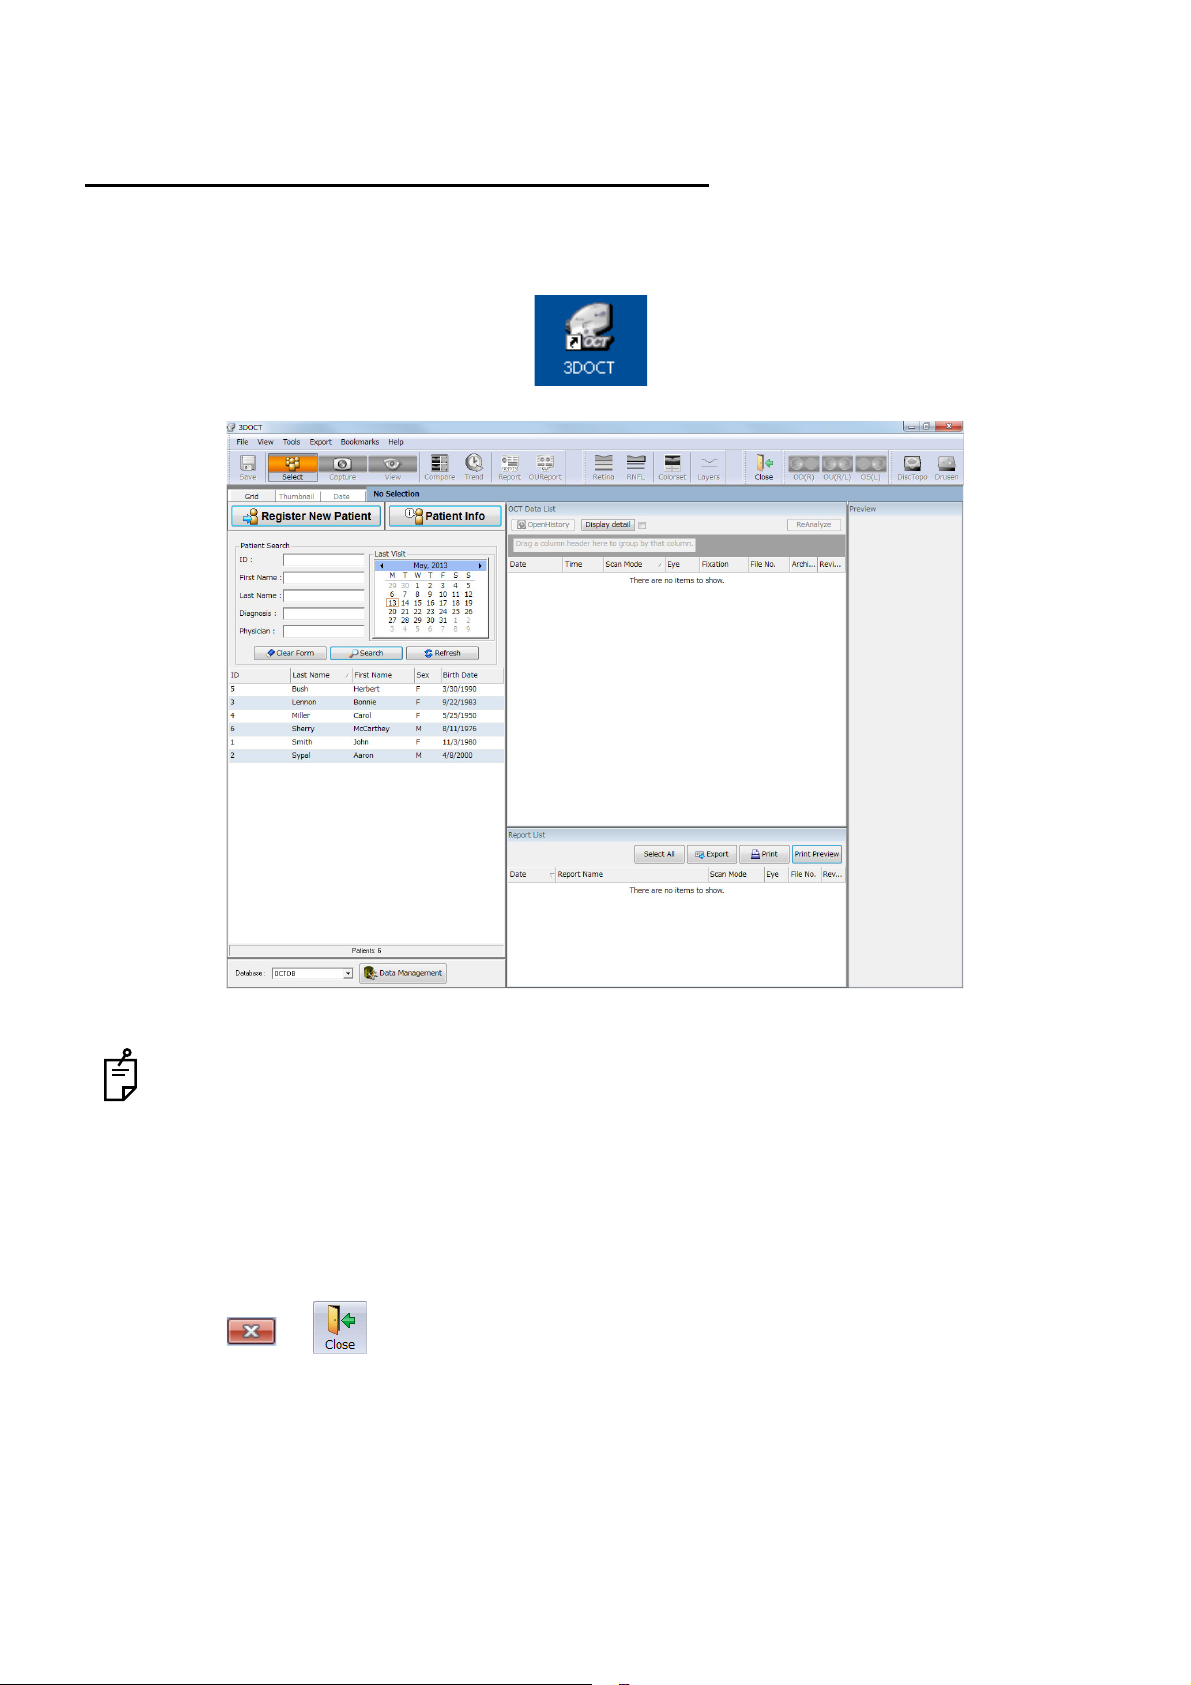
Main screen
1.1. Starting and Exiting the 3D OCT-1 Program
1.1.1. To Start the 3D OCT-2000 Program:
1 Double-click the [3DOCT] icon on the desktop.
When you start 3D OCT and "Failed to check the license." is displayed, double-click the [3D OCT]
icon to start it again. (If the above message is displayed on condition that the 3D OCT program is
registered in "Startup" and you start it, delete the program from "Startup". Then, start the 3D OCT
manually.)
1.1.2. To Exit the 3D OCT Program:
1 Click or .
12
STARTING
Page 15
1.1.3. Main Menu and Tool bar Icons
The 3D OCT-2000 program is organized into the following three categories: Capture, Analyze, and Data
Management. The user can select the desired operation by clicking on the respective icon on the start
screen.
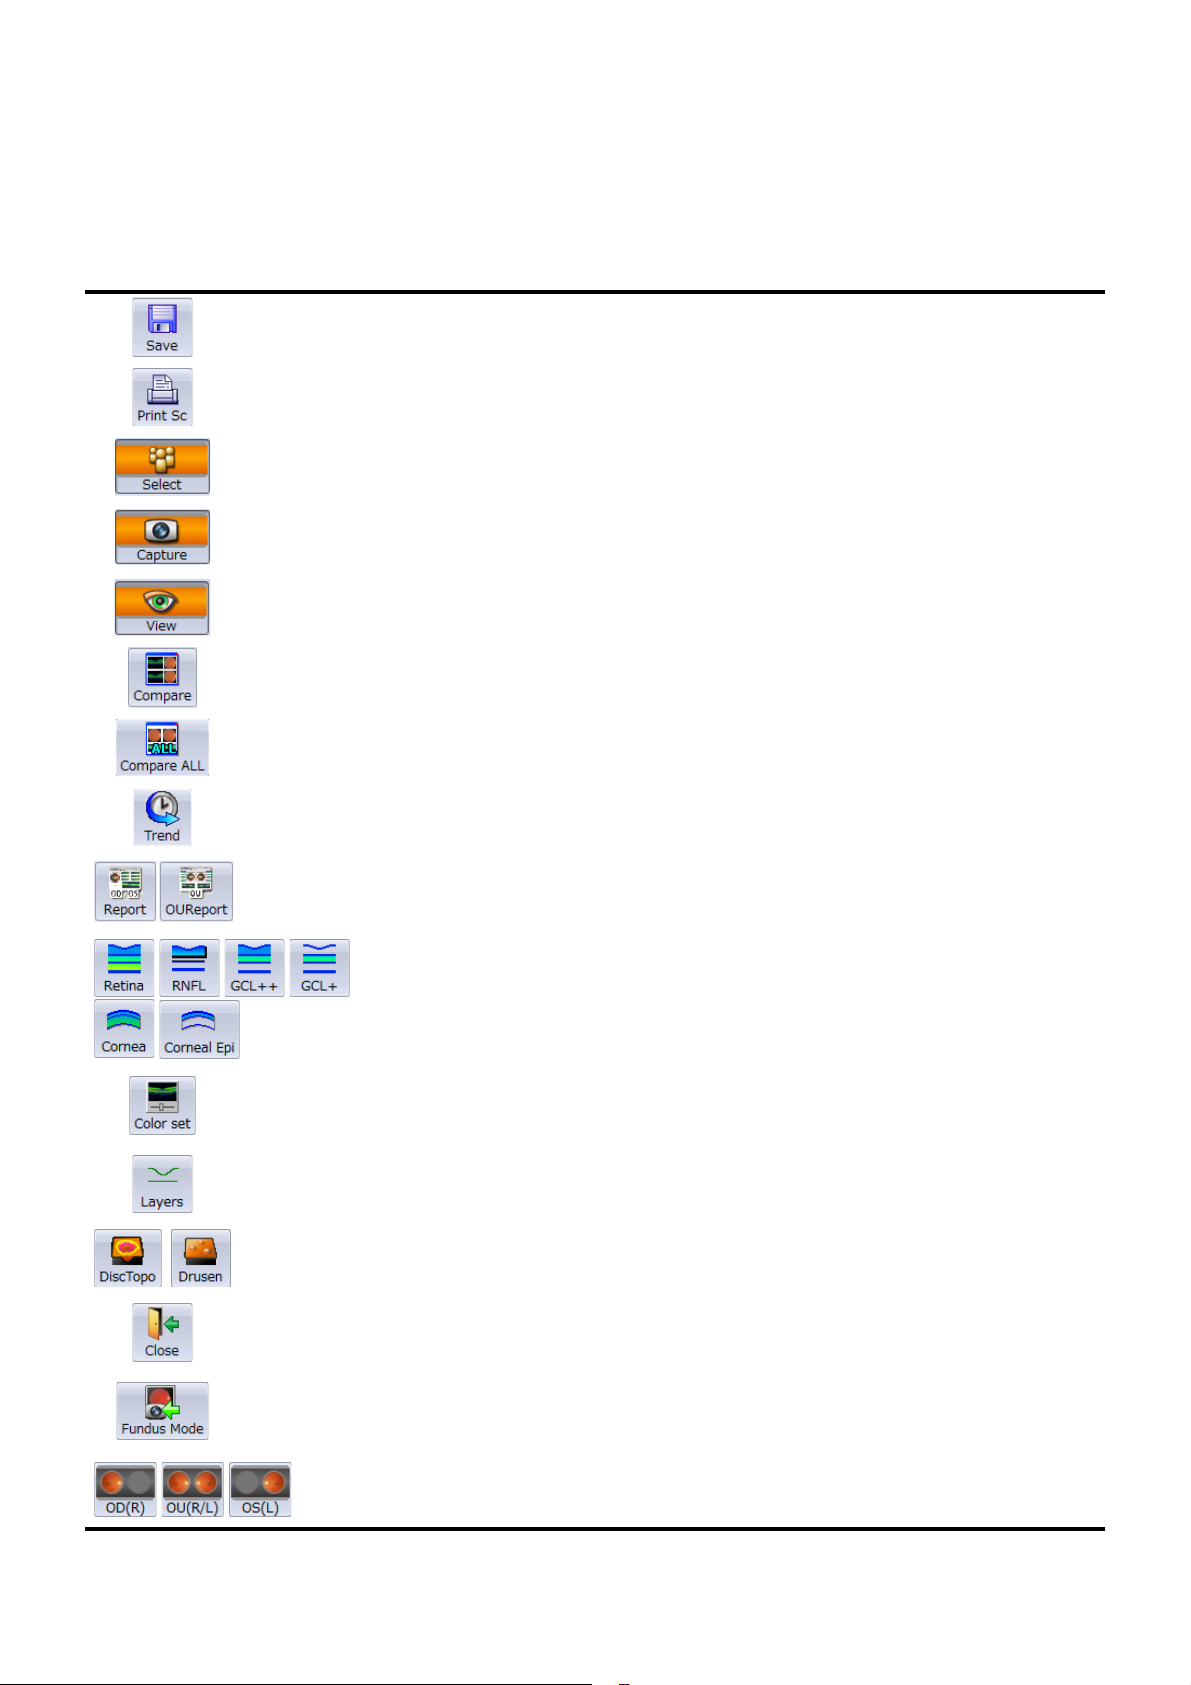
Icons on the tool bar
Save
Print Screen
Select Returns to the patient selection window.
Capture The user can perform photography and analysis.
Viewer The user can perform analysis.
Compare Displays the comparison screen.
Compare ALL
Trend Displays the "Trend Analysis" screen.
Output Prints the report or makes and saves movies.
When the image is changed, it is saved to the
revised file.
Prints the displayed image with the connected
printer.
The user can compare the images of different
scan modes.
Tomogram layer Changes the layer in the tomogram.
Color set
Layer Displays and hides the layer in the tomogram.
Utility bar This is provided to use the added functions.
Close Closes Data Management subcategory.
Fundus Mode Shifts to the "Fundus grabber" screen.
OD / OU / OS Changes the OD/OU/OS screens to each other.
Displays the color adjustment window of the
OCT image.
13
STARTING
Page 16
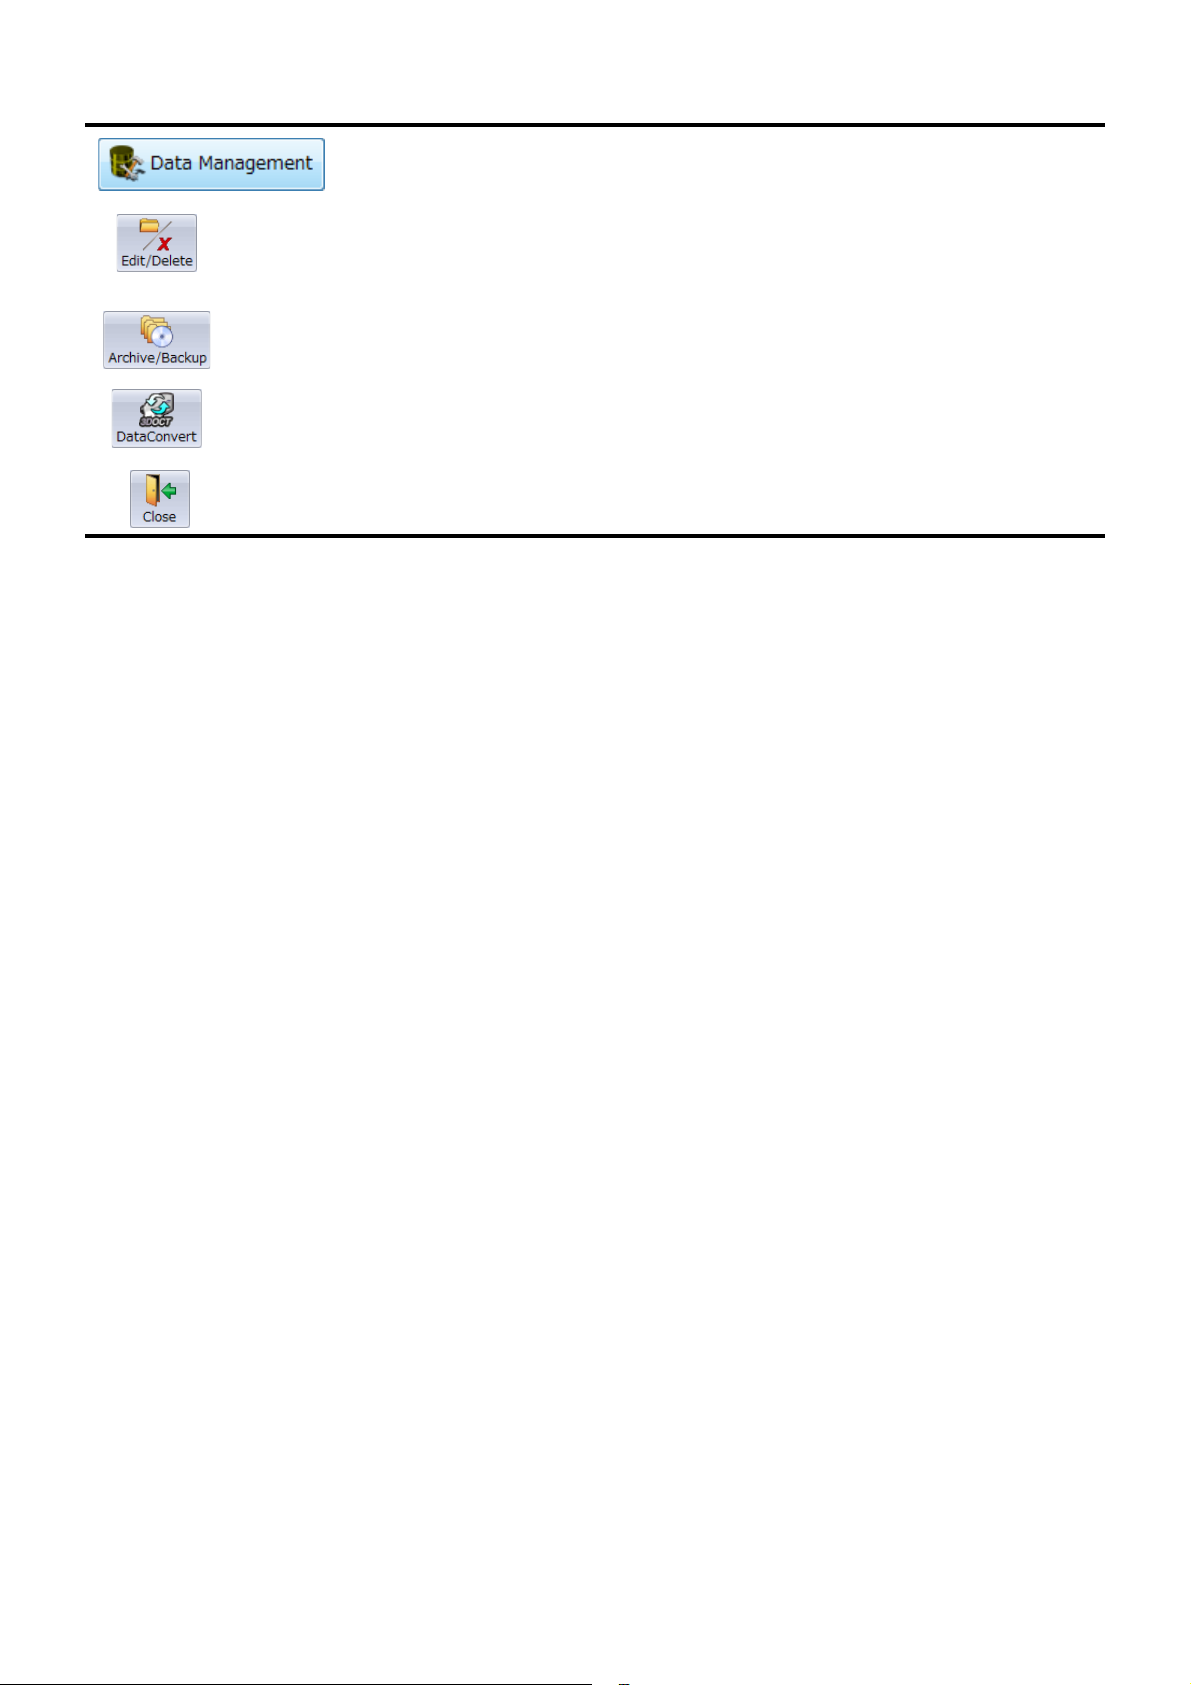
The user can manage data.
Edit/Delete
Allows the user to modify patient demographic
information fields and to delete saved tomogram
data.
Archive/Backup
Data Convert Shifts to the data conversion screen.
Close Closes Data Management subcategory.
Archives tomogram data into juke-box-like
archive folders.
14
STARTING
Page 17
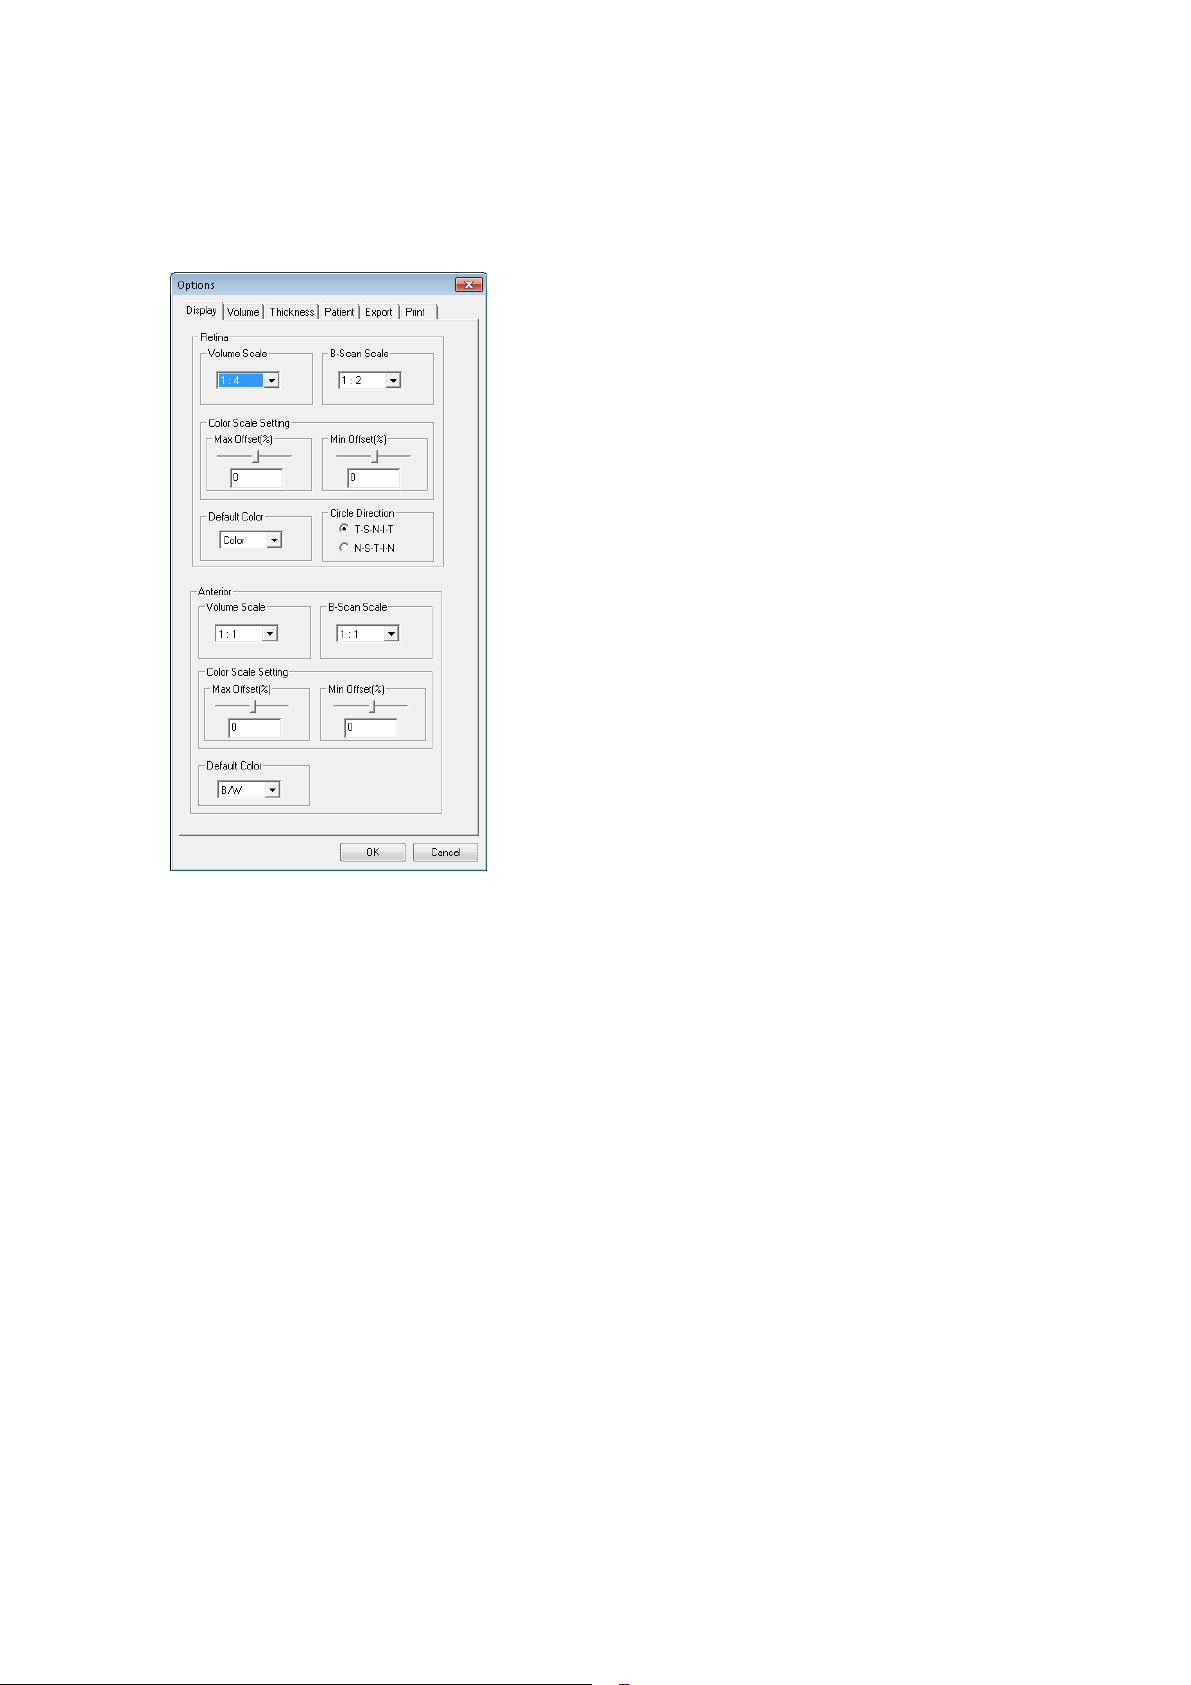
1.1.4. Options Settings
Display Tab
The user can make changes as desired to the following 3D OCT options.
1 From the Menu Bar, select Tool sOptions.
The Options dialog box displays.
On Display Tab, you can set the following items.
• Volume Scale
For "Retina", you can select one of "1:1", "1:2", "1:3" and "1:4". "1:4" is initially set.
For "Anterior", only "1:1" is usable.
• B-Scan Scale
For "Retina", you can select one of "1:1", "1:2", "1:3" and "1:4". "1:2" is initially set.
For "Anterior", only "1:1" is usable.
• Color Scale Setting
Set the compensation value against the maximum and minimum values after normalizing the
color scale.
You can change this value by operating the color scale bar on the "View" screen.
"0" is initially set for "Max Offset" and "Min Offset".
• Default Color
Set the initial display color of the B-Scan tomogram.
You can select one of "Color", "B/W" and "Reverse of B/W". "Color" is initially set.
15
STARTING
Page 18
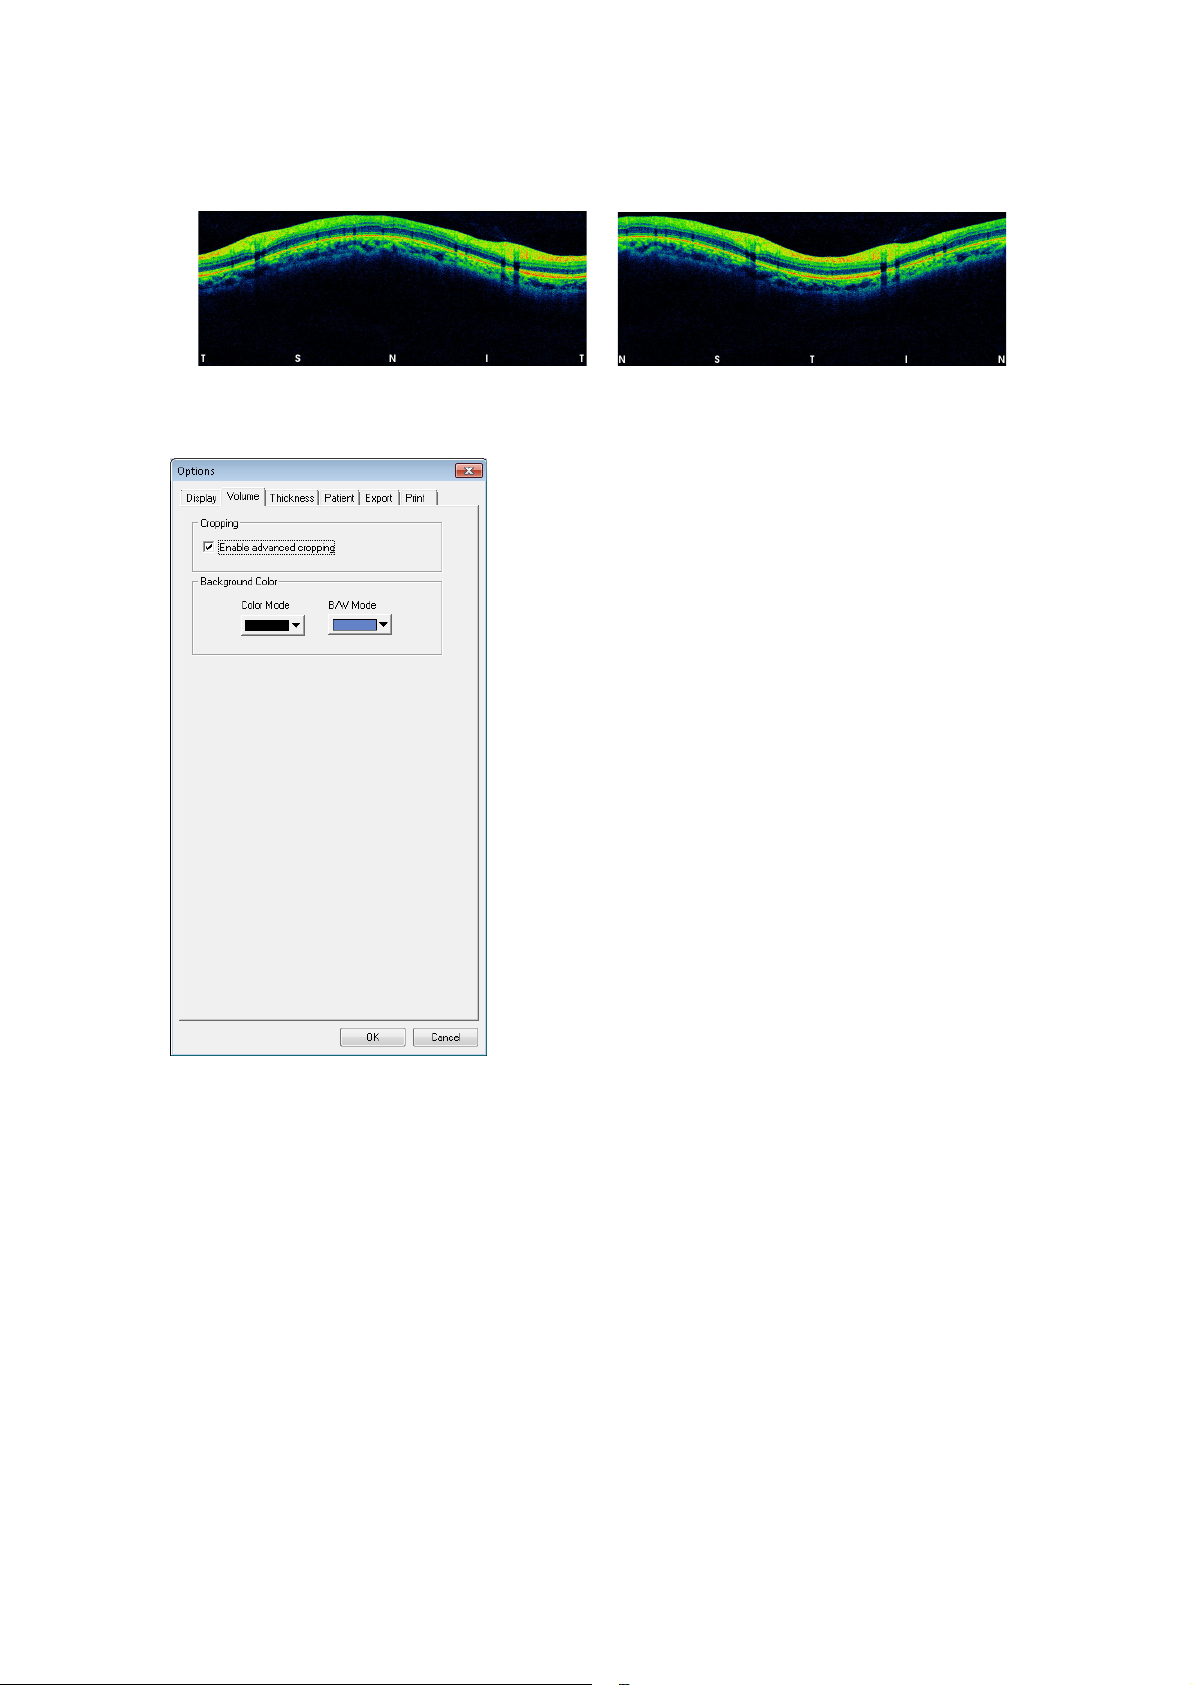
• Circle Direction (only for fundus)
(TSNIT) (NSTIN)
Volume Tab
Set the display direction of the "Circle" B-scan image.
You can select one of "TSNIT" and "NSTIN". "TSNIT" is initially set.
On Volume Tab, you can set the following items.
• Cropping
You can validate/invalidate "Advanced Cropping". As the initial status, "Advanced Cropping" is
disabled.
• Background Color
You can specify the background color in color mode.
You can specify the background color in B/W mode.
16
STARTING
Page 19

On Thickness Tab, you can set the following items.
Thickness Tab
•Grid
You can set color for "Grid Color" and "Text Color".
• Type of "Colormap"
"Legacy" is initially set.
You can select one of "Legacy", "T Style" and "Z Style" for fundus and one of "Legacy" and "T
Style" for anterior segment.
* "Anterior" cannot be used in 3D OCT-1.
• Layer Modification
"Pointing Mode" is initially set. You can select one of "Pointing Mode" and "Drawing Mode".
• Thickness Preference
Select "Retina", "RNFL" or the like in the panel. You can check the layer displayed in the
selected place.
The check marks are initially placed for the following two items.
• Show thickness layers only
Remove the check mark. Other layers are displayed in addition to the Thickness layer.
• Don't show layers on startup
Remove the check mark. When selecting data, the tomogram is displayed while the layer is
displayed.
For the anterior segment data, the "Don't show layers on startup" check box, "Anterior" of "Colormap" and "Layer Modification" on Thickness tab are valid.
17
STARTING
Page 20
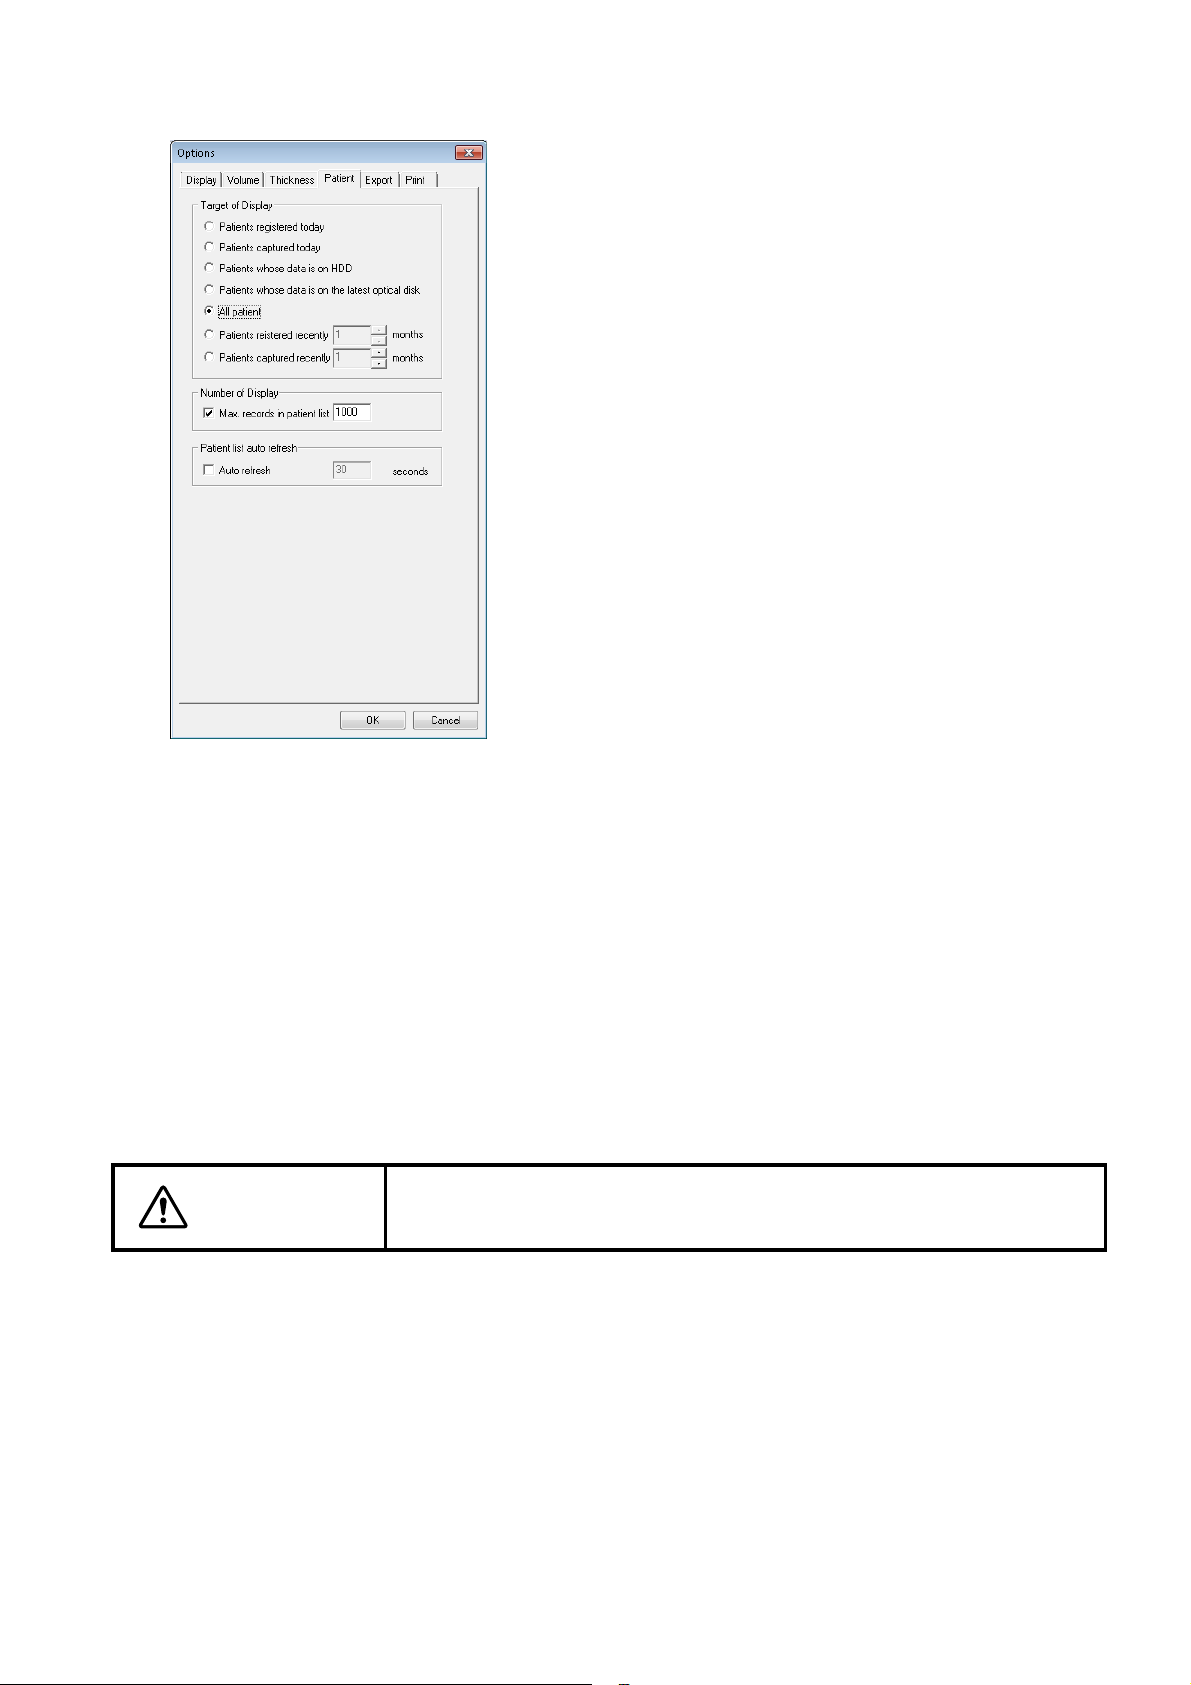
On Patient Tab, you can set the following item.
Patient Tab
• Target of Display
The check mark is initially placed for "All patient".
• Number of Display
You can set the maximum number of the patients to be displayed on the "Search Patient"
panel. "1000" is initially set. Remove the check mark, and all the patients that meet the
retrieval conditions are displayed.
• Patient list auto refresh
Place a check mark for "Auto Refresh". Each time the specified seconds have passed, the
patient list is updated in the same way as when pressing the list update button.
As the initial status, a check mark is not placed for "Auto Refresh".
18
STARTING
CAUTION
When the object to be displayed is changed, start this software again.
Page 21
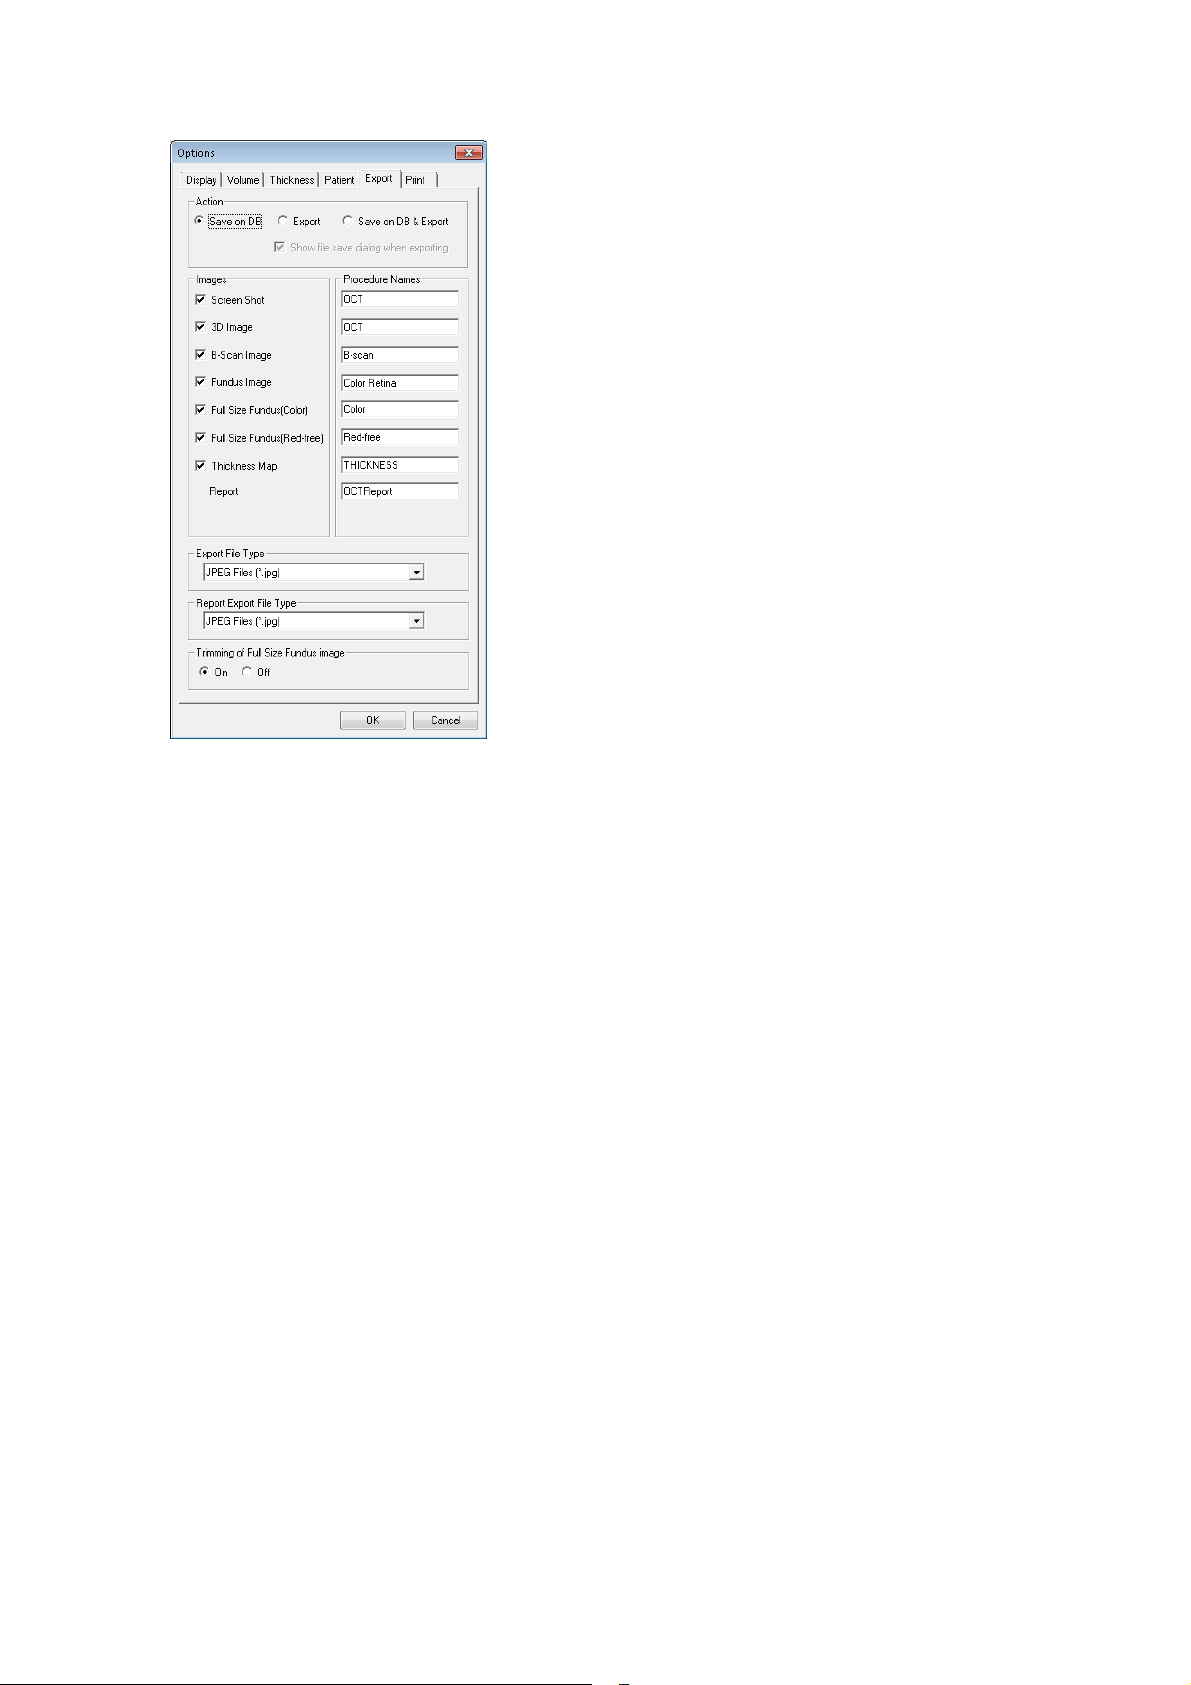
On Export Tab, you can set the following items.
Export Tab
•Action
Specify the operation of "Export".
(1) Save on DB: Registers the data to the set database of the IMAGEnet.
(2) Export: Outputs the data as a file to the set folder path.
(3) Save on DB & Export: Executes (1) and (2) at the same time.
(4) Show file save dialog when exporting
• Images
You can select the type of the image to be exported. The check marks are initially placed for
all the items.
Because report is not the object of batch export, only specifying the procedure name is
needed.
Specifies whether the "Save" dialog box should be displayed or not
in export.
Only when (2) or (3) is selected, you can set this item.
19
STARTING
Page 22
• Procedure Names
The name classified in IMAGEnet is displayed.
• Export File Type
You can select the file type when exporting an image. You can select one of "JPEG", "BMP",
"PNG" and "TIFF".
"JPEG" is initially set.
• Report Export File Type
You can select the file type when exporting a report. "JPEG" is initially set. You can select one
of "JPEG" and "PDF".
For the file format for export with "Fundus Grabber", refer to "File type setting" on P.225.
• Trimming of Full Size Fundus image
Set On/Off for trimming the full-size color fundus/red-free image.
"ON" is initially set.
The form of filename is "Patient ID_Date_Time_Procedure name_R (right) or L
(left)_Number.extension". The following table shows the forms of the patient ID, date, time,
procedure name, right/left and number.
Example)
12345_20100203_152816_Color Retina_R_001.jpg
12345_20100203_152816_R_001.jpg (when the "Procedure name" place is blank)
Output information Contents
1 Patient ID The ID number of the patient is outputted.
2 Date This is outputted in the form of "yyyymmdd".
3 Time This is outputted in the form of "hhmmss".
4 Procedure name The procedure name is outputted.
5 Right/Left "R" for right eye, "L" for left eye or "N" when there is no informa-
tion is outputted.
6 Number The number is automatically incremented not to make two or
more image files having the same name and is outputted.
When you select "Flip (Original)" of "Exported JPEG image form", the original image taken by
the camera is output. When you select "Normal", the archived image is output.
20
STARTING
Page 23
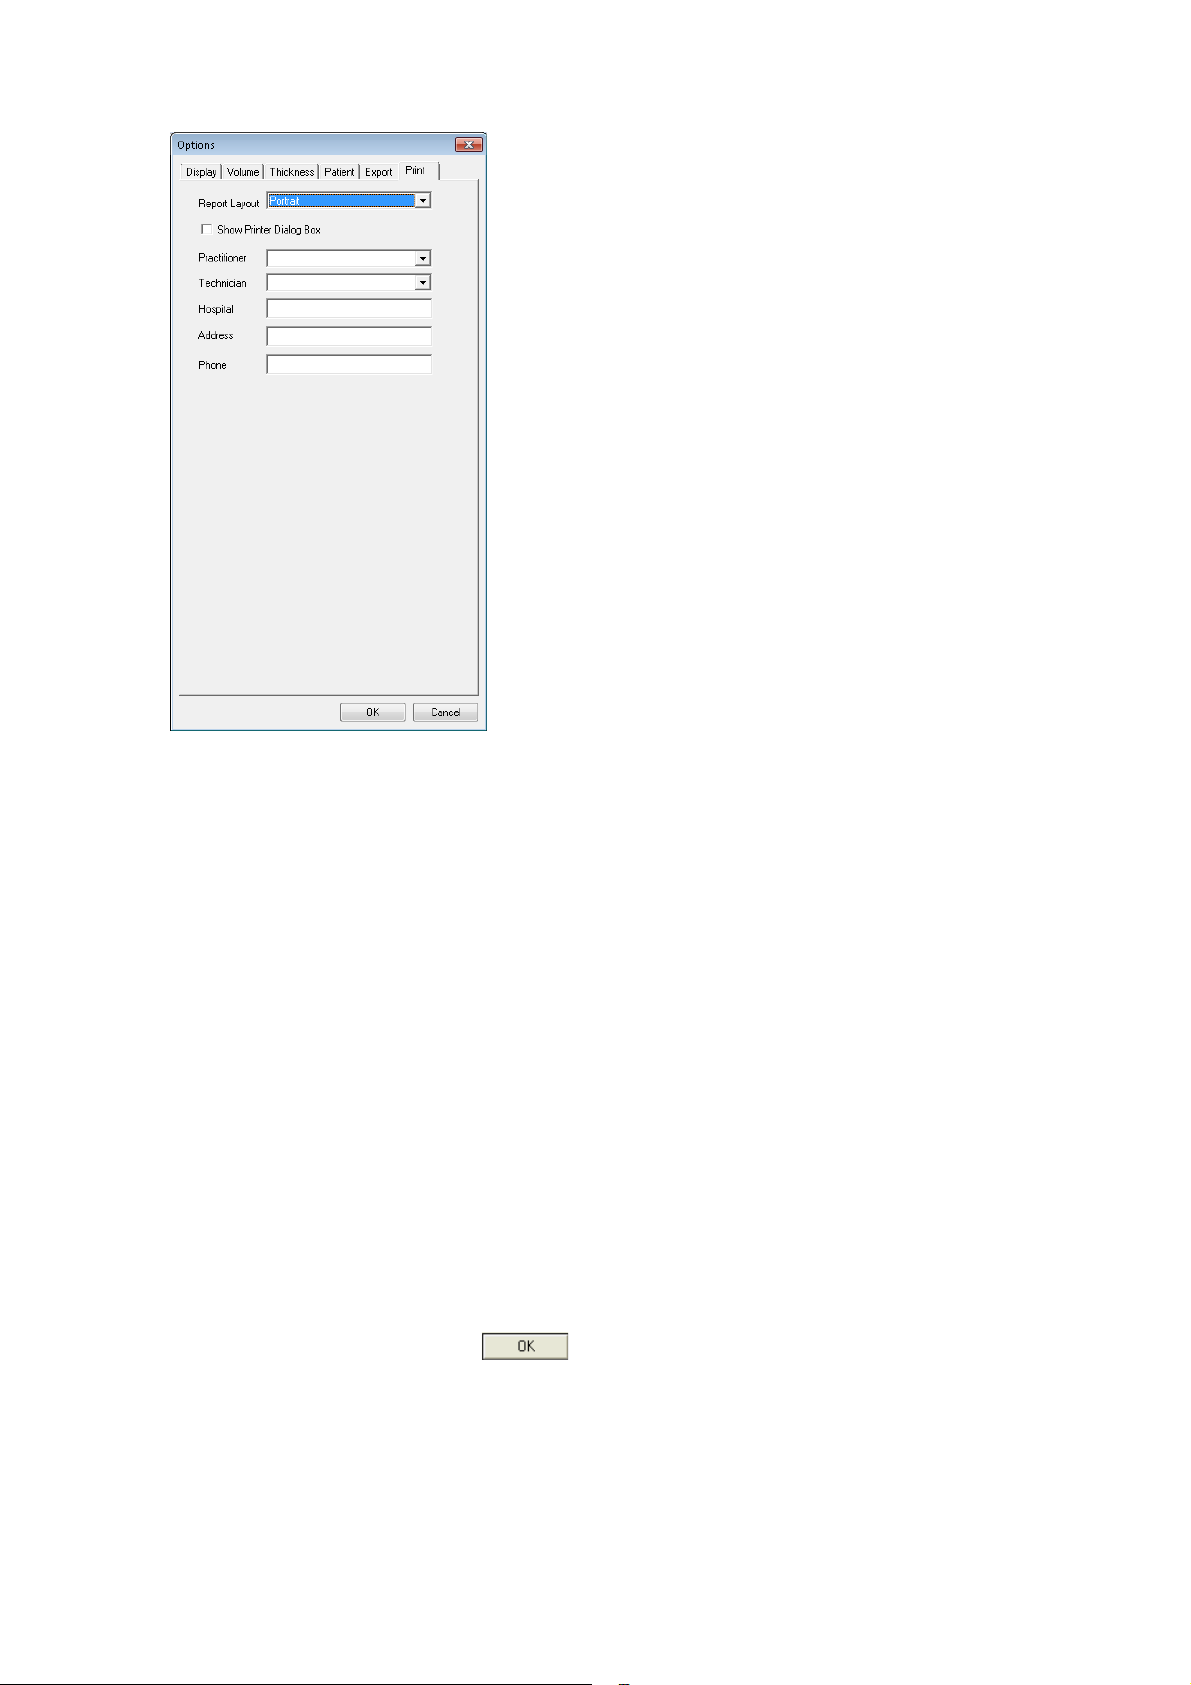
On Print tab, you can set the following items.
Print tab
• Report Layout
When "Portrait" is selected, the data is printed vertically.
When "Landscape" is selected, the data is printed horizontally.
"Portrait" is initially set.
• Place a check mark for "Show Printer Dialog Box", and the dialog box is displayed when printing.
• Practitioner
You can set a practitioner name that is output under "Comments" on the report.
• Technician
You can set a technician name that is output on "Technician" on the report.
•Hospital
You can set the name of facilities that is output under "Comments" on the report.
• Address
You can set the address that is output under "signature" on the report.
• Phone
You can set the telephone number that is output under "Date" on the report.
2 After selections are made, click .
21
STARTING
Page 24

2. CAPTURING TOMOGRAMS
If the installed software is the OCT Viewer, this function is not supported.
In case one of the components of the 3D OCT-1 system does not func-
NOTICE
Capturing images in 3D OCT-2000 software usually requires the following steps:
1 Preparing the patient. (For details, refer to the instruction manual for the instrument body.) 2 Entering patient information. In the case of a new patient, enter the patient information. 3 Pressing the photography button. 4 Select the scan mode in the instrument body.
tion properly, an error message may appear when the user attempts to
start a capture session. Please contact Topcon support personnel if this
occurs.
5 Capturing tomogram and fundus/anterior segment image
(For details, refer to the instruction manual for the instrument body.)
6 Receiving the captured data 7 Automatically saving and analyzing the tomogram and fundus/anterior segment image received
in Step
6.
22
CAPTURING TOMOGRAMS
Page 25
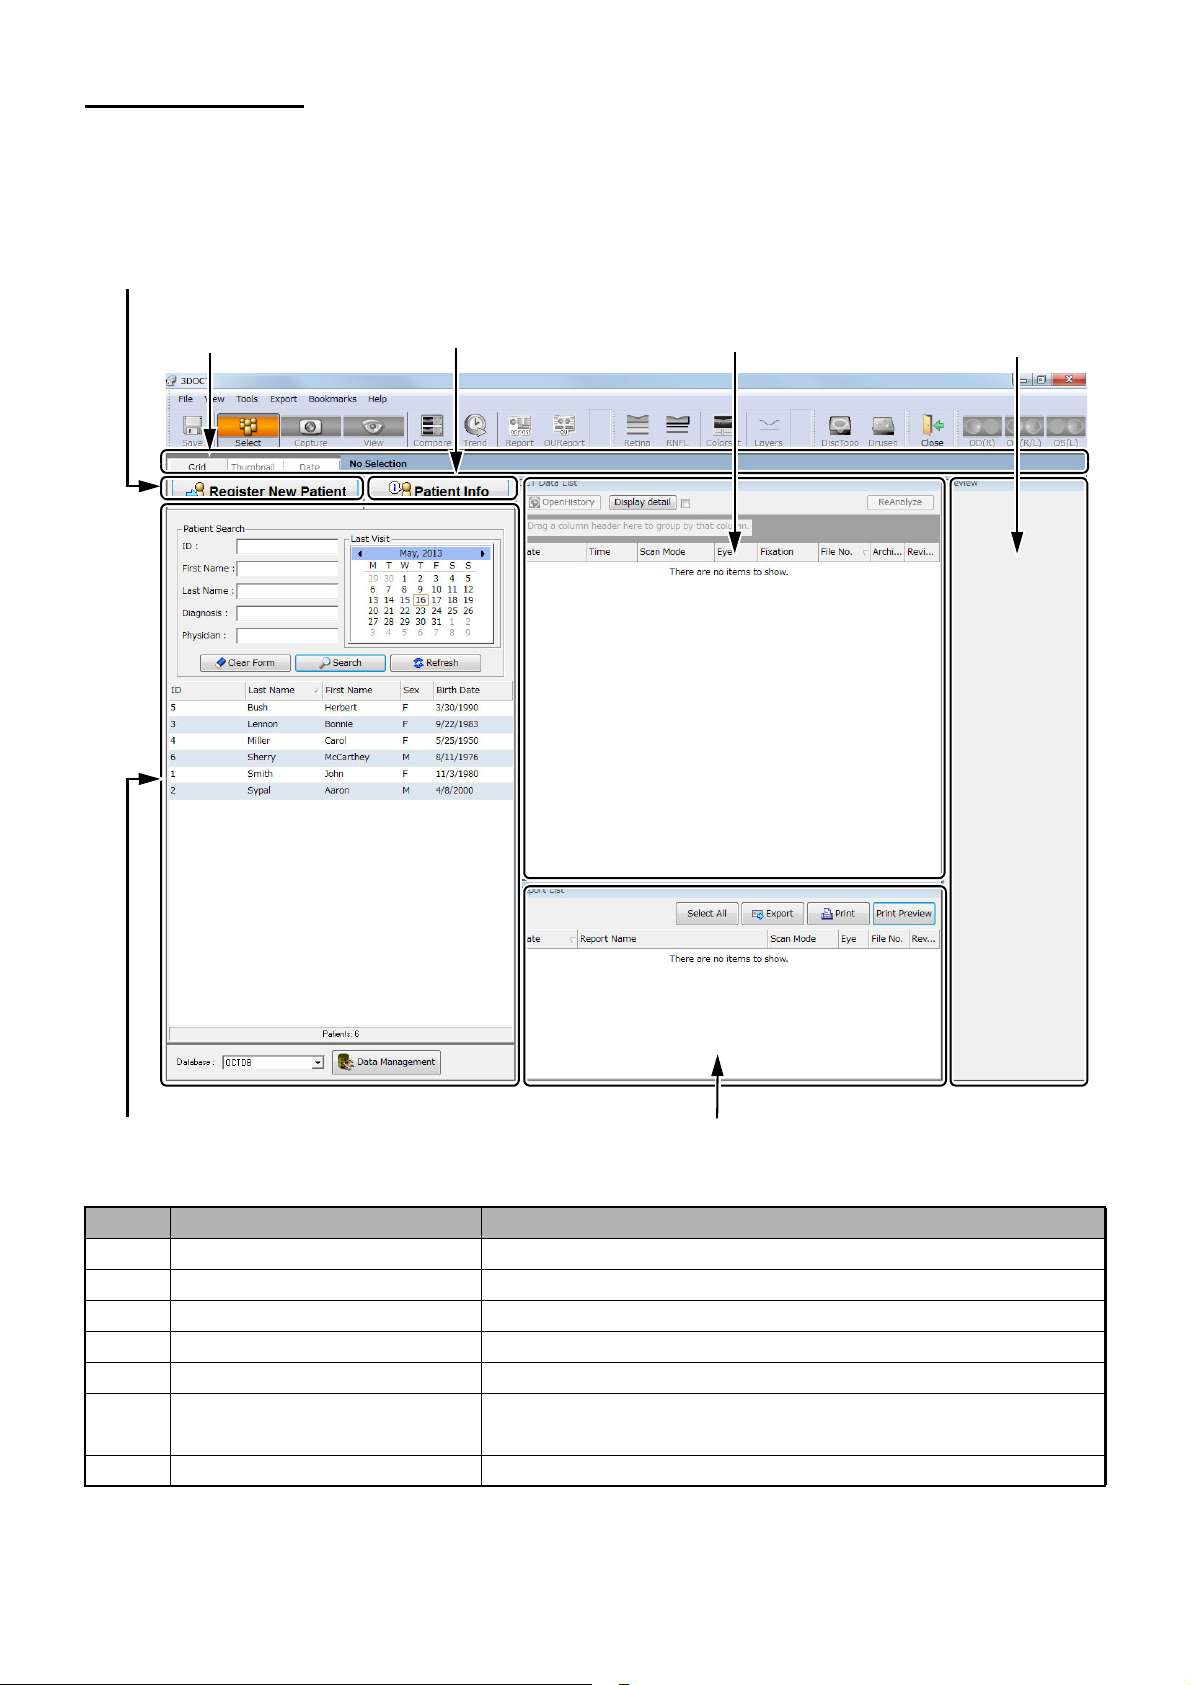
2.1. Main Screen
A-1:
Register New Patient button
A-3:
Patient Information panel
A-4:
Patient Info button
A-6:
Preview panel
A-7:
Report list
A-2:
Search Patient panel
A-5:
Data list
1 From the "Main" screen, you can shift to the screens for patient registration, patient selection,
data selection, photography, "View" and data management.
ID Name Description A-1 Register New Patient button Register a new patient. A-2 Search Patient panel The patient list is displayed. A-3 Patient Information panel Displays the information of the selected patient. A-4 Patient Info button Displays the patient information. A-5 Data list Displays the photography image list of the selected patient. A-6 Preview panel Displays the thumbnail images and photography information
A-7 Report list Displays the report list of the selected patient.
for the image selected on the Data list.
23
CAPTURING TOMOGRAMS
Page 26
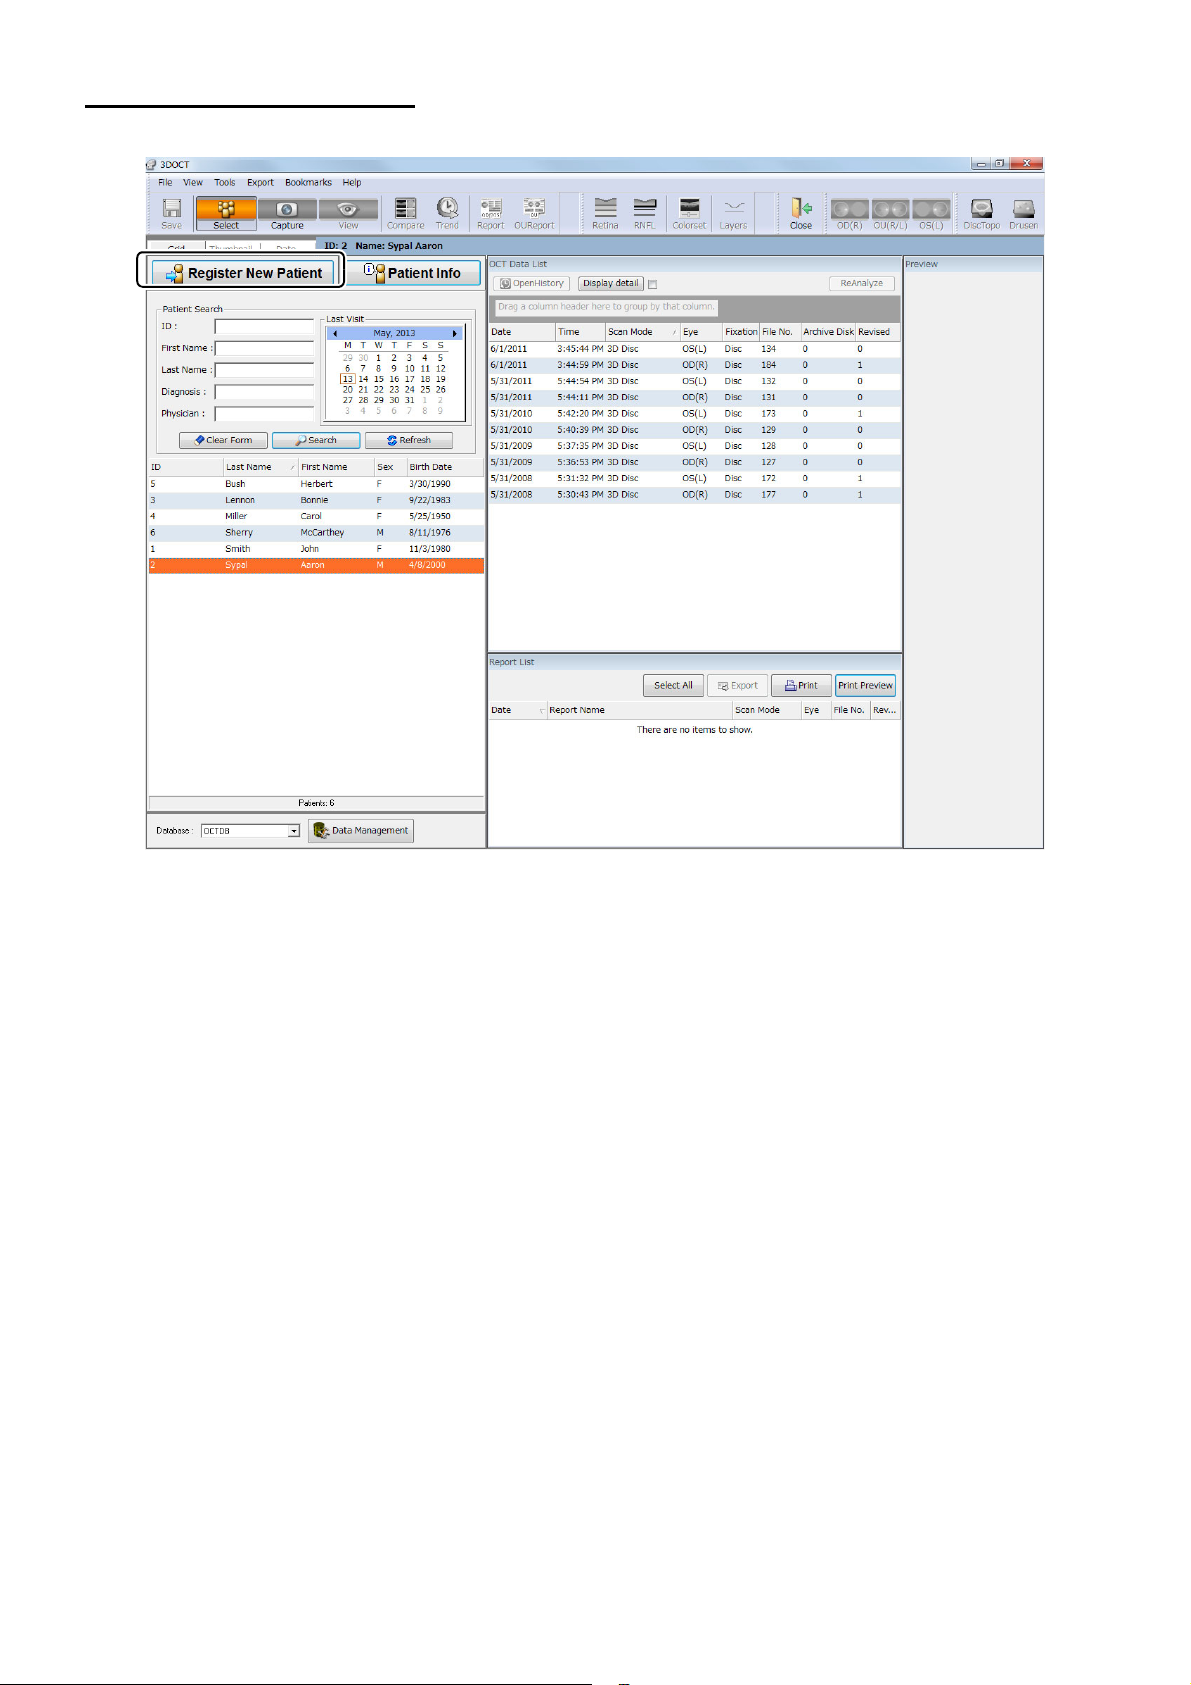
2.2. Selecting the Patient
Patient selection window
Select the patient to be photographed. In the case of a new patient, click [Register New Patient].
The patient information registration dialog box is displayed. If the patient information already exists in
database, select the patient from the Search Patient panel.
24
CAPTURING TOMOGRAMS
Page 27
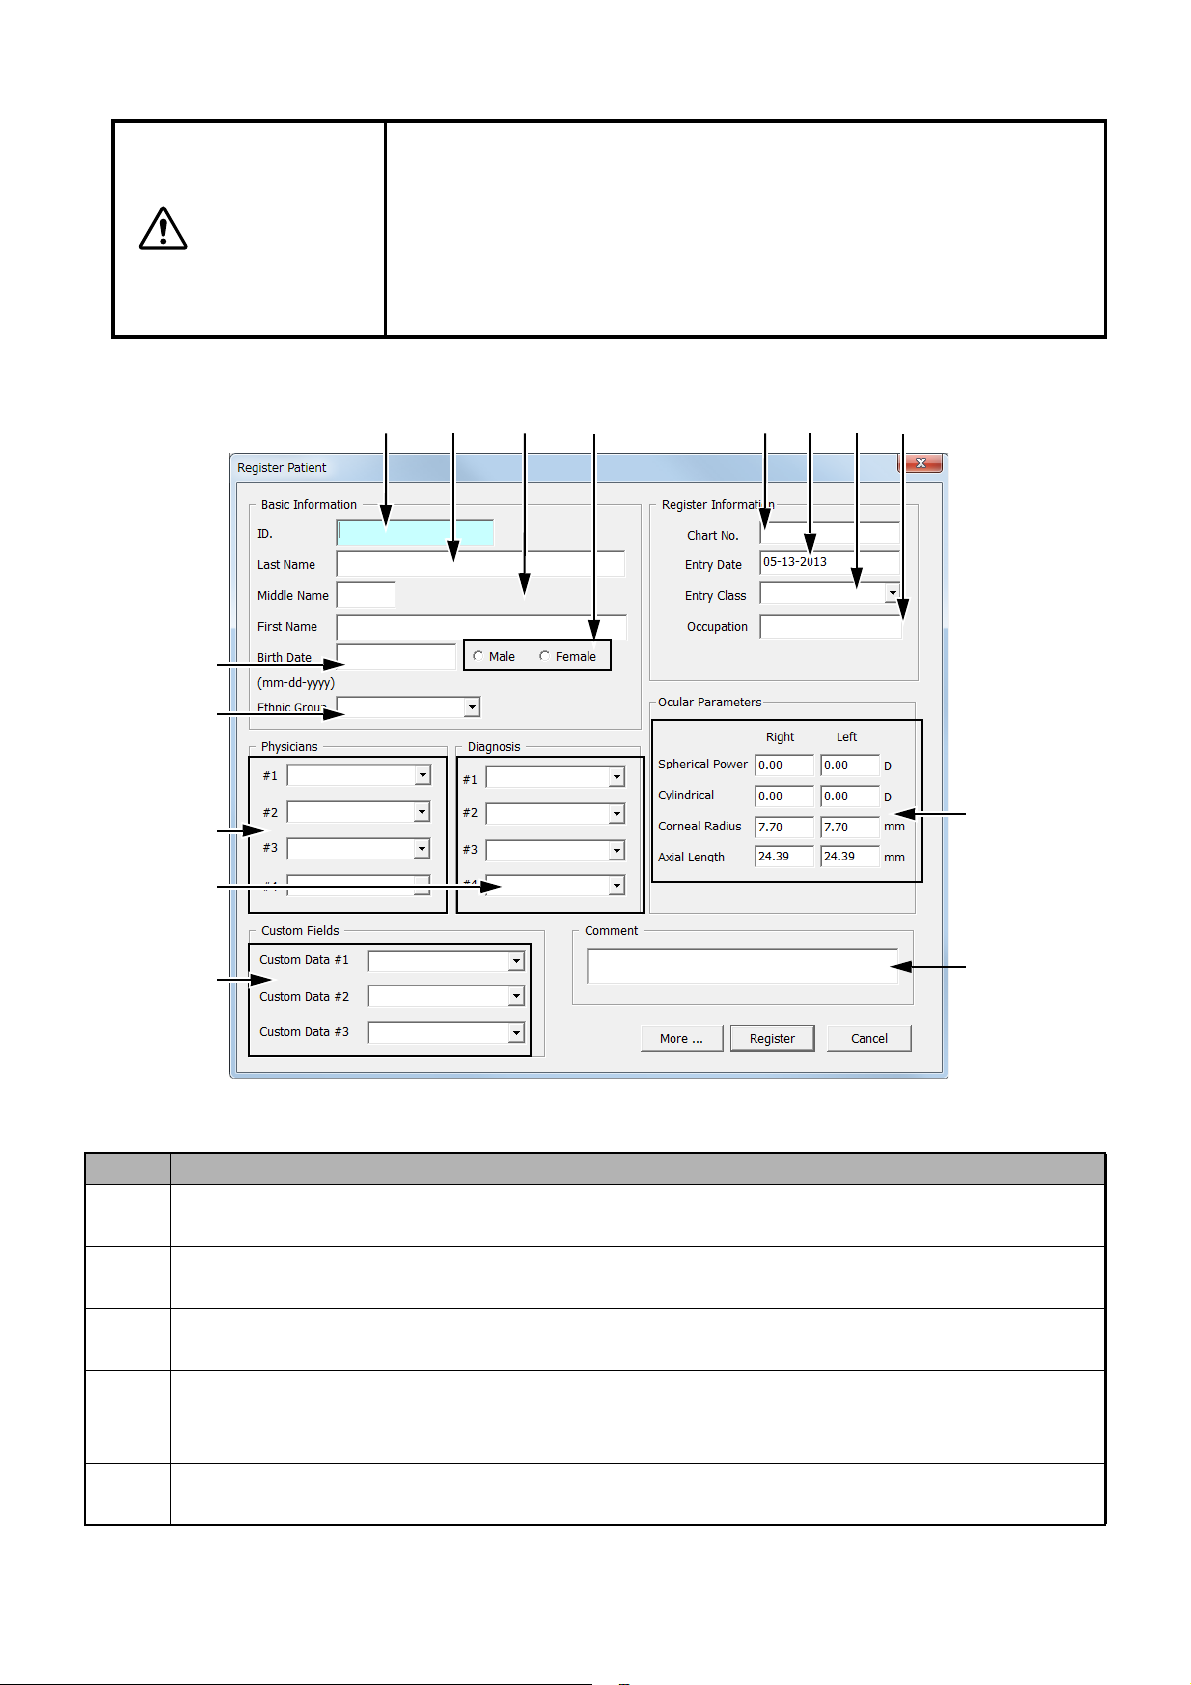
2.2.1. To Register a New Patient:
A-1 A-2 A-3 A-5
A-4
A-6
A-9 A-10 A-11 A-12
A-7
A-8
A-13
A-14
Patient information registration window
A-15
When entering the patient ID through the 3D OCT-1, a bar code reader,
a card reader, IMAGEnet, Multi-Viewer, etc., you must use only the
alphabet, numerals and "-". Moreover, the following symbols cannot be
CAUTION
used for the patient ID.
" \ / : 'Space' * ? . <> | _ ! # $ % &
If you use a patient ID which does not meet the above conditions, the
report cannot be output correctly from time to time.
ID Function
A-1 You can input the "em" characters up to 9 and "en" characters up to 19 for the patient ID.
A-2 You can input the "em" characters up to 11 and "en" characters up to 23 for the patient last
A-3 You can input the "em" characters up to 11 and "en" characters up to 23 for the middle name
A-4 Input [mm-dd-yyyy] to "Birth Date" with the numerals of "en". Example: 09-07-2009
A-5 Select "Male" or "Female". You can change this to one of the requisite input items by using the
This is one of the requirements.
name. You can change this to one of the requisite input items by using the option function.
and first name.
You can change this to one of the requisite input items by using the option function.
You cannot set the year before "1900" as "Birth Date".
option function.
25
CAPTURING TOMOGRAMS
Page 28
ID Function
A-6 Select from the combo box of "Ethnic Group".
items by using the option function.
A-7 You can input the "em" characters up to 7 and "en" characters up to 15 for each of "#1" to "#4".
A-8 You can input the "em" characters up to 7 and "en" characters up to 15 for each of "#1" to "#4".
A-9 You can input the "em" characters up to 7 and "en" characters up to 15 for "Chart No.".
A-10 The registration date is inputted here. You can input "Entry Date" with the "en" characters.
A-11 You can input the "em" characters up to 9 and "en" characters up to 19 for "Entry Class".
A-12 You can input the "em" characters up to 9 and "en" characters up to 19 for "Occupation".
A-13 You can input the "em" characters up to 9 and "en" characters up to 19 for each of "#1" to "#3".
A-14 You can input the "em" characters up to 31 and "en" characters up to 63 for "Comment".
A-15 You can input [Ocular Parameters.].
You can change this to one of the requisite input
1 Enter the patient information in the dialog box, as desired.
Be sure to input the ID.
2 You can enter the eyeball refraction data to [Ocular Parameters.].
Using the information entered to "Ocular Parameters", calculate the magnification to perform the following compensation.
Circle Scan Diameter Correction
• Compensation of circle diameter when photographing (only for "Circle" scan)
Trimming Circle from 3D Data
• Compensation of circle diameter when trimming a circle from 3D data (The data when
photographing is used for the eyeball refraction data.)
If this compensation magnification exceeds the allowable range "0.8 - 1.2 times", the message "Ocular optical information value exceeded the compensated limitation. Default value
shall apply." is displayed. In this case, do not perform the compensation but proceed to the
next processing.
Refer to "3D OCT: Axial Length Compensation Range" on P.212 for the compensation
range of "Axial Length" and "Spherical Power" on "Ocular Parameters".
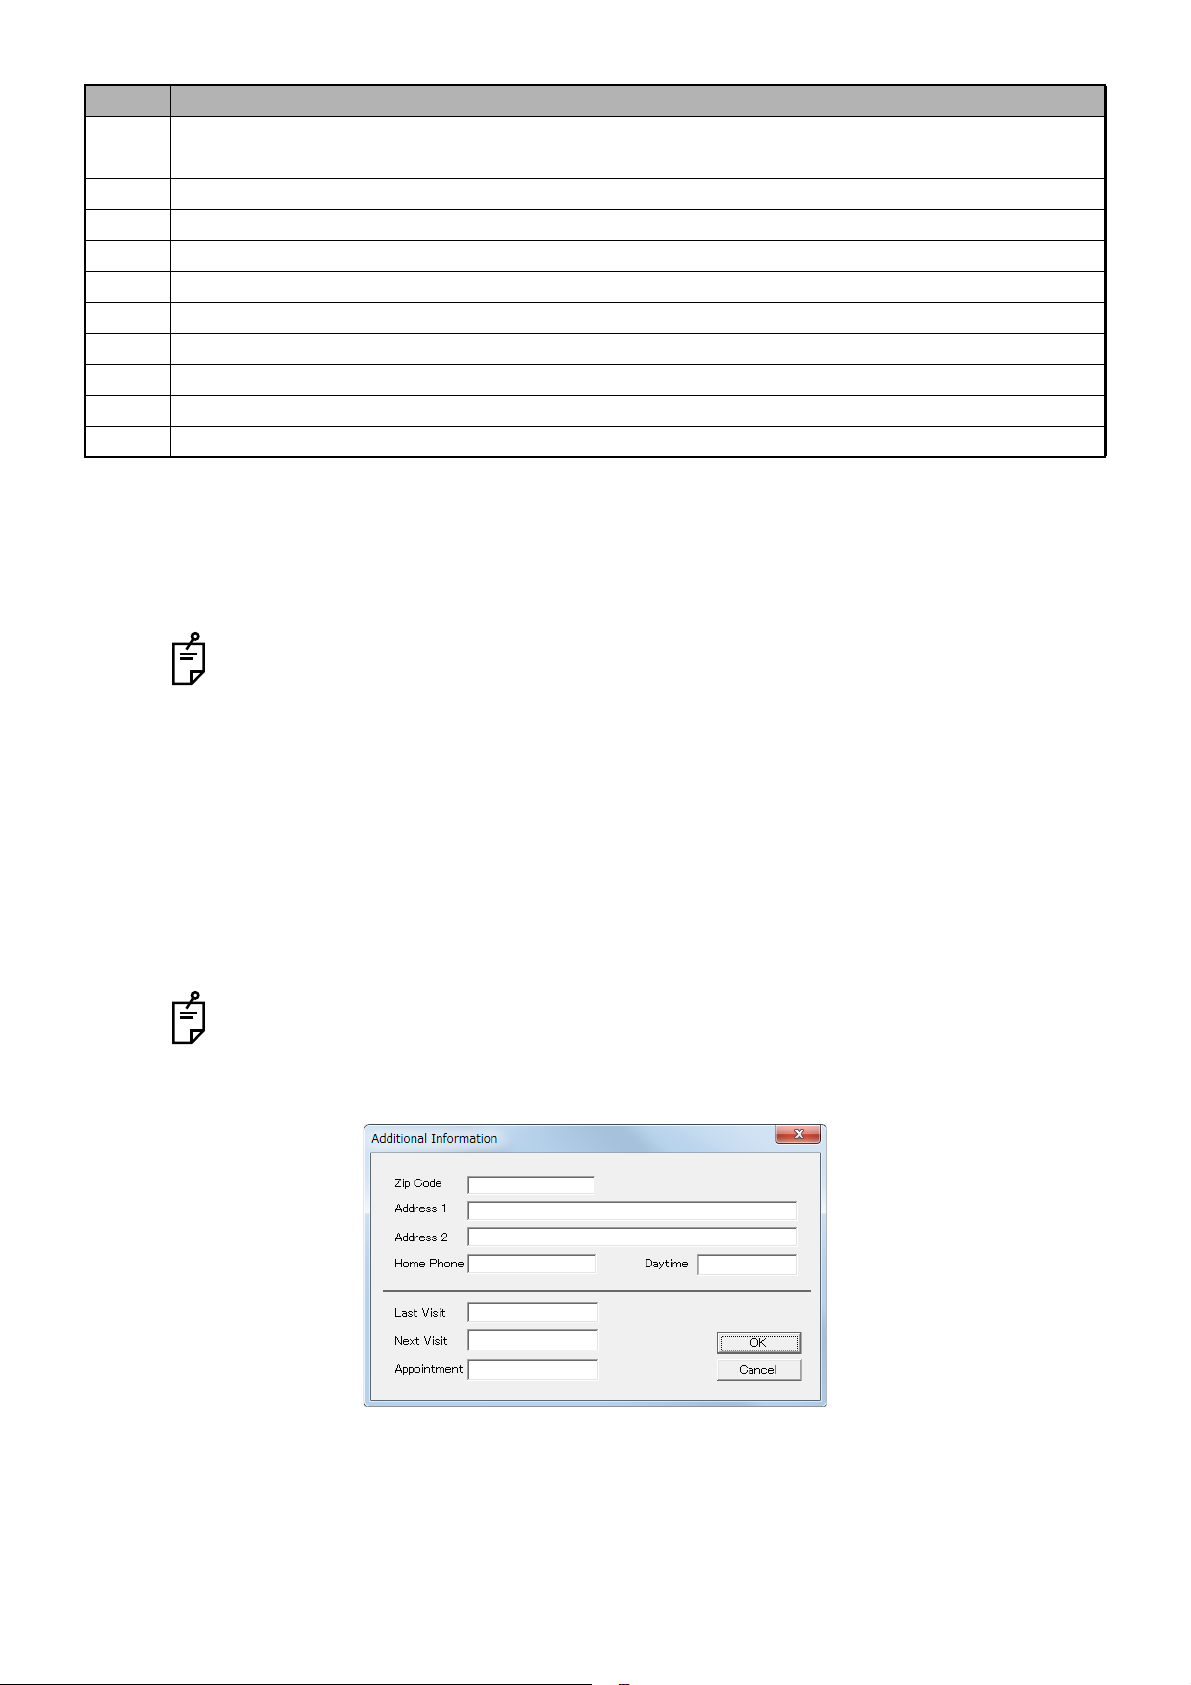
3 To add additional patient information, click More... .
26
CAPTURING TOMOGRAMS
Page 29
4 Click [Register].
Be sure to enter the ID. Enter other information of the patient according to the need.
CAUTION
When the patient ID does not fill in all the blanks of the specified digits, the blank digit is
automatically filled with "0". You can set On/Off of this function on the "Option" screen of
"OCTset".
To access the "Option" screen, select [Start] [all programs] [TOPCON] [3D OCT]
[OCTset] and start "OCT-Configurtion". Then, set On/Off as mentioned above.
When the photography data is displayed, "Normative Data" is displayed
according to the patient's age at the photography date. However, it is
limited as mentioned below.
• When the patient is under 19, "Normative Data" for the age of 20 is
displayed as reference.
• When the patient is over 81 years old, "Normative Data" for the age of
80 is displayed as reference.
27
CAPTURING TOMOGRAMS
Page 30
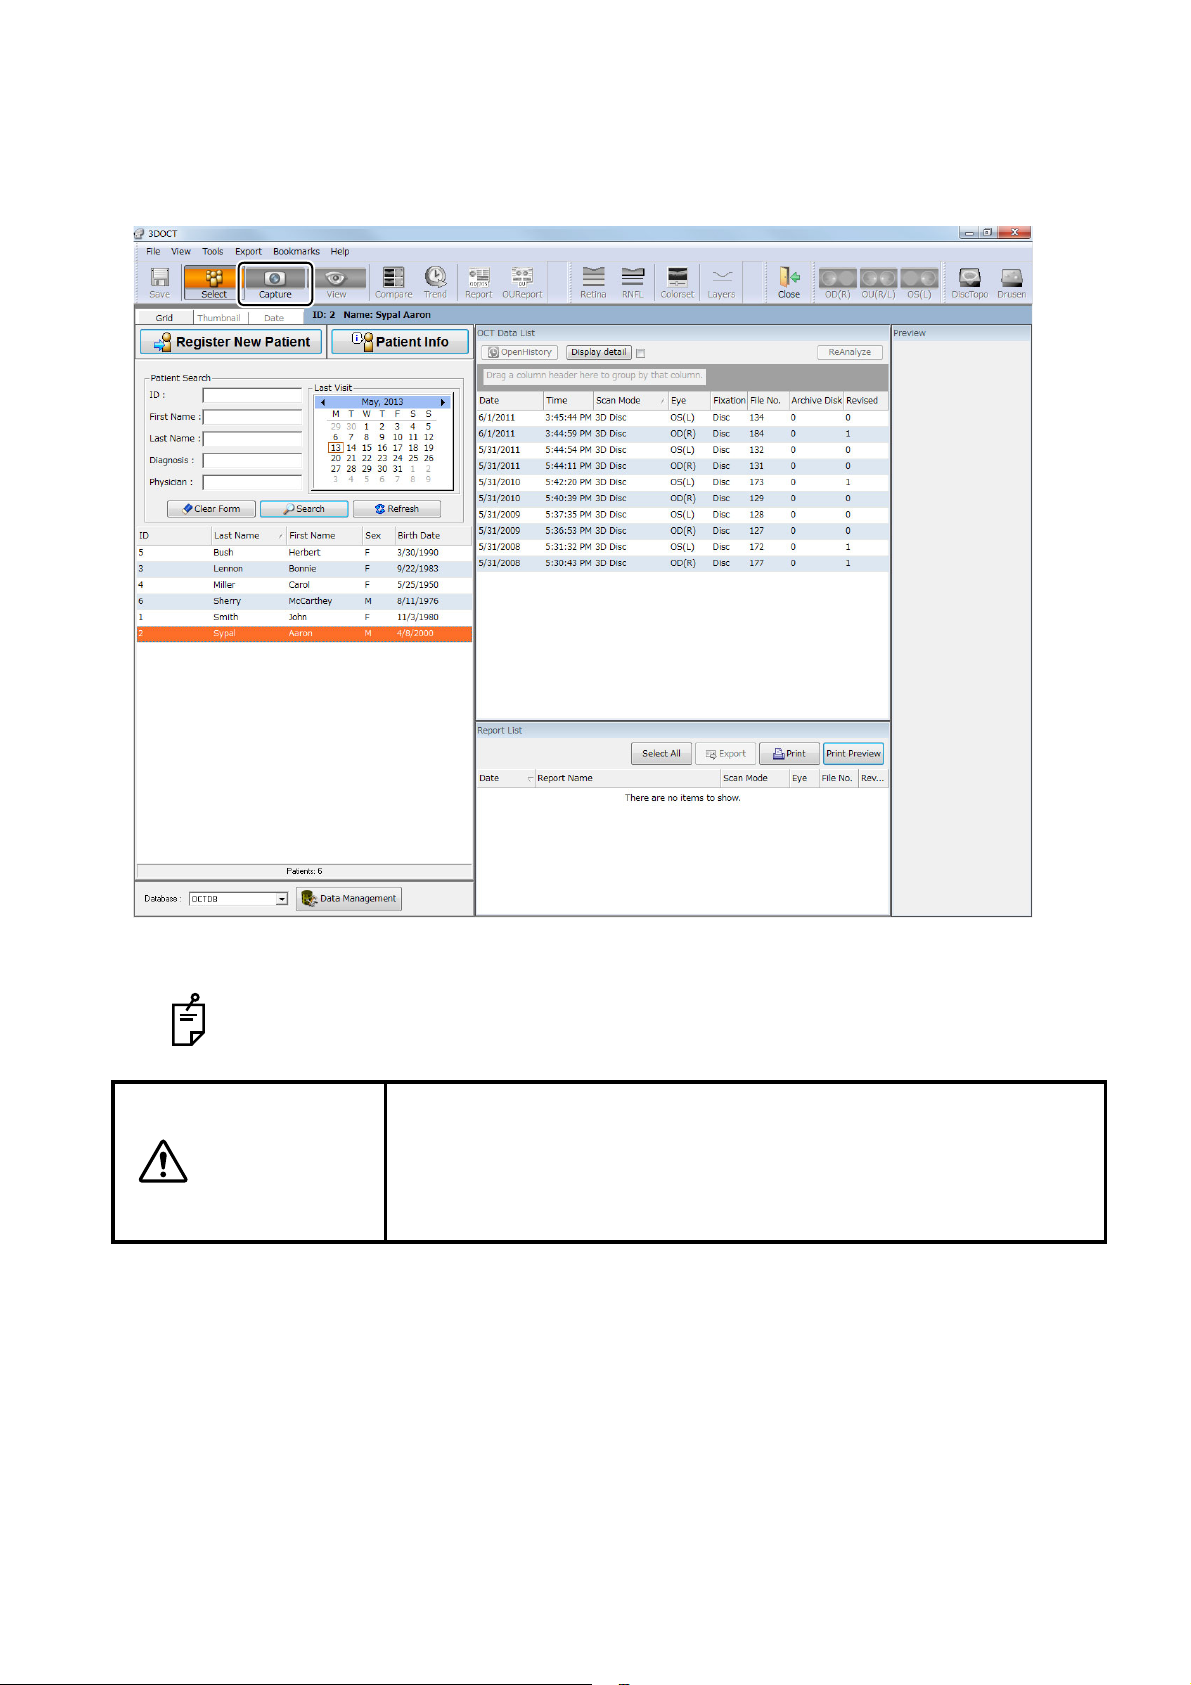
2.2.2. Selecting the photography mode
Patient selection window
After registering the patient information, the patient is added to the Search Patient panel. Select the
added patient. If the patient information already exists in database, select the patient from the Search
Patient panel. Then, click the Capture button.
You can also select the photography mode on the touch panel of the instrument body's
monitor.
When clicking the [Capture] button, sometimes the message "Ocular
optical information value exceeded the compensated limitation. Default
CAUTION
value shall apply." is displayed. In this case, access "Data Management"
again. Click the [Edit patient information]" button and then the [Ocular
Param.] button to correct "Ocular Parameters".
28
CAPTURING TOMOGRAMS
Page 31

2.3. Photography Window
Thumbnail View Panel Scan Information Panel
Window BWindow APatient Information Bar
Photography window
Window C
Select the photography mode, and the photography screen appears.
CAPTURING TOMOGRAMS
29
Page 32

2.3.1. Patient information bar
1 Click the blue Patient Information Bar.
2 Select the checkboxes for "Customize Information Panel" and click [OK]. The data of the
selected information items are displayed.
You can display or hide the following information.
Category: Patient
•ID
•Name
• Birth Date
•Sex
• Physician 1, 2, 3, 4
• Diagnosis 1, 2, 3, 4
In the photography of "Line: Anterior segment/3D: Anterior segment", "Image Quality" is not displayed. In the photography of "Radial: Anterior segment", "Signal Strength" instead of "Image
Quality" is displayed.
Category: Scan
• Segment
•Eye
•Date
•Age
• Scan Mode
• Scan Size
• Scan Length
•Fixation
• Image Quality
•File Name
• Label
• OCT Fucus Position
Category: Analysis
• Analysis Mode
• Analysis Version
• Revised Date
• Revised Time
• Revised
30
CAPTURING TOMOGRAMS
Page 33

2.3.2. Primary Tomogram Viewing Area: Window A
A-2:
Scan Position
Number
A-4:
Scan direction
A-1:
Tomogram
A-6:
Pseudo color display
A-8:
Reverse of B/W
A-5:
Annotation
A-9:
Changes the displayed image quantity.
Window A
A-11:
Overlap success image count
A-7:
B/W
A-10:
Progress bar
A-3:
Colormap
• 2D mode
A 2D tomogram is displayed in this area. Before photographing, nothing is displayed because there is
no data. (Background: black)
ID Function
A-1 2D-scan tomogram
A-2 When one data has the scan images at two or more positions, this number indicates the positions.
A-3 Indicates the pseudo color or B/W colormap.
A-4 Indicates the scan direction. The displayed position means the direction where a picture has
A-5 Shows/Hides annotations (A2 to A4). Indicates the color map of pseudo color or B/W.
A-6 Indicates the color map of pseudo color.
A-7 Toggle between color and B/W for the color map.
A-8 Reverses white and black as referring to the color of A-7.
A-9 Changes the quantity of the displayed tomograms on Window A.
A-10 This bar is displayed while imaging or overlapping is being executed after photographing. This
A-11 Displays "Overlap success image count/Set overlap image count".
been taken.
shows the progress of the processing. You can stop the processing with the [Cancel] button
next to this bar.
(This is displayed only when overlapping is done.)
CAPTURING TOMOGRAMS
31
Page 34

2.3.3. Fundus/Anterior Segment Image Viewing Area: Window B
B-1:
Color Fundus image
B-2:
Projection
B-4:
B/W fundus image
B-5:
Maximize
B-7:
3D scanning area
Window B
B-6:
Menu
B-3:
Red-free mode
The fundus/anterior segment image is displayed in this area. Before photographing, nothing is displayed
because there is no data. (Background: black)
The following example is the fundus image in 3D Scan.
ID Function
B-1 Color fundus image
B-2 Projection image of 3D tomogram data (only in 3D Scan) Place a mark in the check box, and
the Projection image is automatically displayed after analysis.
B-3 Changes to the red-free fundus image. Place a mark in the check box, and the Red-free fun-
dus image is automatically displayed after analysis.
B-4 B/W fundus image
B-5 Maximize Window B to the whole screen or return to its original size.
B-6 This is the menu to edit the Fovea position and Disc center position.
B-7 3D scanning area
Fovea. Pos. function
Set "On" for "Fovea pos." on the menu, and it is possible to edit the Fovea position. For details, refer to
"How to use the menu" on P.33.
Circle Pos. function
Set "On" for "Circle Pos." on the menu, and it is possible to edit the Disc center position. For details, refer
to "How to use the menu" on P.34.
32
CAPTURING TOMOGRAMS
Page 35

How to use the menu
Fovea pos. position display mode
[Fovea Pos.]
"Fovea pos" is valid for the "3D Macula (V)" and "3D Wide" photography.
The layer thickness (Retina/RNFL/GCL+/GCL++) in each Grid is calculated with the Grid center at the
Fovea position. The default Fovea position is automatically detected during analysis and is the position estimated from the retinal thickness.
Function Navigation ON Navigation OFF
Fovea Pos. [Fovea Pos.] [On]:
Changes to "On" for fovea
position display.
When "On" is set, the
Fovea position is displayed.
[Fovea Pos.] [Off]:
Changes to "Off" for fovea position
display.
33
CAPTURING TOMOGRAMS
Page 36

[Circle Pos.]
Circle pos. position display
Circle of 3.4mm whose center
is the Disc cente
Disc center
"Circle Pos." is validated when "3D Optic disc" (6mm×6mm, 512×128, the fixation: "Disc" or
"External fixation target") is set.
The user can edit the Disc center position manually.
The RNFL thickness is calculated according to the B-Scan image that is trimmed in the "Circle:
3.4mm" shape with the center is at "Disc center".
The default Disc center position is automatically detected during analysis and is the "center of gravity"
position of the Disc area (the same calculation as "4.2. Analyzing the Optic Disc").
To change the Disc center position from the default, you can change it by using this menu. The position edited here is validated for report and Viewer.
Function Navigation ON Navigation OFF
Circle Pos. [Circle Pos.] [On]
Changes to "On" for the Circle position display.
When "On" is set, the Disc
center is displayed.
When "On" is set, the Circle position is displayed. At this time, the B-Scan image shows the vertical
Circle center position.
[Circle Pos.] [OFF]
Changes to "OFF" for the Circle position display.
In "Fovea Pos." and "Circle Pos.", you can maximize and restore the fundus window and zoom in/
out by dragging the right mouse button.
When each position editing mode is accessed, a message is displayed on the instrument body
and you cannot take a picture.
34
CAPTURING TOMOGRAMS
Page 37

2.3.4. Thumbnail View Panel
The Thumbnail View panel is composed of the thumbnails of tomogram at the left side and the button
([Delete]) at the right side. The images displayed at the top and bottom in the thumbnail are shown below.
Photography
mode
Top Fundus image Fundus image -
Bottom Color fundus image Projection image Fundus image
Thumbnail is marked according to circumstances. Refer to "2.8. Saving and Deleting Captured Tomograms" on P.62 and "2.9. Displaying Report of the Photographed Tomogram" on P.63.
(Others except 3D scan) (3D scan)
Fundus tomography
Fundus
photography
2.3.5. Scan Information Panel
The scan information is displayed in this panel. Before photographing, blank is displayed because there
is no data.
35
CAPTURING TOMOGRAMS
Page 38

2.4. Fundus Tomography Data Display
The fundus tomography data are displayed as shown below.
2.4.1. [Radial Scan] photography
After [Radial Scan] is selected in the instrument body and photographing is finished, the photographed
image is displayed.
2.4.2. [Line] photography
After [Line] is selected in the instrument body and photographing is finished, the photographed image is
displayed.
36
CAPTURING TOMOGRAMS
Page 39

2.4.3. [5Line Cross] photography
After [5Line Cross] is selected in the instrument body and photographing is finished, the photographed
image is displayed.
2.4.4. [3D Wide] photography
After [3D Wide] is selected in the instrument body and photographing is finished, the photographed image
is displayed.
37
CAPTURING TOMOGRAMS
Page 40

2.4.5. [3D Macula (V)] photography
After [3D Macula (V)] is selected in the instrument body and photographing is finished, the photographed
image is displayed.
2.4.6. [3D Macula] photography
After [3D Macula] is selected in the instrument body and photographing is finished, the photographed
image is displayed.
38
CAPTURING TOMOGRAMS
Page 41

2.4.7. [3D Optic Disc] photography
After [3D Optic Disc] is selected in the instrument body and photographing is finished, the photographed
image is displayed.
39
CAPTURING TOMOGRAMS
Page 42

2.5. Anterior Segment Photography Data Display
In 3D OCT-1, the anterior segment function is option.
The anterior segment photography data are displayed as shown below.
2.5.1. [Radial Scan] photography
After [Radial Scan] is selected in the instrument body and photographing is finished, the photographed
image is displayed. In this example, cornea is photographed.
2.5.2. [Line Scan] photography
After [Line Scan] is selected in the instrument body and photographing is finished, the photographed
image is displayed. In this example, the anterior chamber angle is photographed.
40
CAPTURING TOMOGRAMS
Page 43

2.6. Fundus Photography Data
C-3:
Photography procedure/Screen display tab
C-2: Tool barC-1: Title bar
C-8: Status bar
C-5:
Image display
window
C-6:
Information window
C-7:
Photography result list
C-4:
Thumbnail window
Fundus grabber screen
Software name Tab name
Select the "Fundus Photo" mode in the OCT instrument body. The top screen is changed and the system
shifts to the fundus grabber mode. You can edit or output the photographed fundus image. You can also
access the fundus grabber mode by clicking [Fundus mode] on the Tool bar.
2.6.1. Title bar
Item Description
Software name "OCT Fundus Grabber" is displayed.
Tab name The tab name in the active status is displayed.
41
CAPTURING TOMOGRAMS
Page 44

2.6.2. C-2 Tool bar
Save & Close
Print
Export
Delete
Fit to Window
100% Indicates the displayed image in its original size.
Previous image Moves the selected image in the thumbnail list to the preceding one.
Discards the image reserved for deletion and saves others. After saving, the window is closed.
Prints the displayed image. In the "ALL IMAGES" tab, the two or more
selected images are printed.
Outputs the thumbnail list and the selected image in the "ALL
IMAGES" tab to the specified folder.
Changes the reserve of deletion for the selected image. When an
image is reserved for deletion, the "DELETED" mark is displayed over
the image.
Maximizes the displayed image according to the image display window.
Next image Moves the selected image in the thumbnail list to the next one.
Return
Enhance Raises the contrast of the displayed image.
Auto contrast Adjusts the contrast of the displayed image automatically.
Zoom in
Zoom out
Composite
Red-free
Returns the contrast adjustment of the displayed image to the last status.
Zooms in the displayed image. (You can also zoom in by rotating the
mouse wheel or dragging the right mouse button.)
Zooms out the displayed image. (You can also zoom out by rotating
the mouse wheel or dragging the right mouse button.)
Selects two or more images in the "ALL IMAGES" tab and generates
the composite image.
Generates a digital red-free image from the selected color image. You
can generate two or more red-free images in "ALL IMAGES" tab.
OCT mode
Close
42
CAPTURING TOMOGRAMS
Exits from the fundus photography screen and shifts to the "FastMap"
screen.
Returns to the patient selection screen. Press this button, and the
check message is displayed once.
Page 45

2.6.3. C-3 Photography procedure/Screen display tab
By changing the tab, you can change the image display window and thumbnail list.
Tab Description
Color This is the tab for the color fundus image. This is activated by the link
operation with the photography mode of the instrument body.
Red-free This is the tab for the digital red-free image. This is displayed when the
digital red-free photography is done.
COMPOSITE This is the tab for the composite image. This is displayed when the com-
posite operation is done.
ALL IMAGES Displays the list of all images.
You can move the tab position by dragging it. The move is saved hereafter.
43
CAPTURING TOMOGRAMS
Page 46

2.6.4. C-4 Thumbnail window
Right/left of the photographed eye
OD (R): Right eye
OS (L): Left eye
This window displays the photographed or generated images for each procedure on one vertical line with
the lapse of time.
The image selected on the thumbnail panel is displayed on the image display window.
On the thumbnail, the right/left of the photographed eye is displayed.
Mouse operation for the thumbnail window
The following actions are done by operating the mouse on the thumbnail window.
Mouse operation Action Contents
Click the left button. Selection The thumbnail is selected.
Click the right button. Menu Displays the menu.
Click the left button: Selection
Click the left mouse button on the aimed thumbnail. The thumbnail is selected. The selected thumbnail is displayed on the image display window.
1 Click the left mouse button on the thumbnail.
2 The thumbnail is selected and the fundus
image is displayed.
44
CAPTURING TOMOGRAMS
Page 47

For the selected thumbnail, it is possible to perform the operation of the menu icons.
[Select an image from the thumbnail window.] [Select the "ALL IMAGES" tab.]
When fundus is photographed or when a fundus image is generated, the image is selected automatically and is displayed on the image display window.
Click the right button: Menu
Click the right mouse button on the aimed thumbnail. The following menu is displayed.
1 Click the right mouse button on the thumbnail.
When selecting "Menu", On/Off of the check is changed.
When the check is set to "On", you can specify the image, which is reserved for deletion, not to be
displayed. In this case, the image reserved for deletion is not included in the count of the photography result list.
2.6.5. C-5 Fundus image display area
One fundus image selected from the thumbnail window is displayed on this area.
When the "ALL IMAGES" tab is selected, the list of all the images on the thumbnail is displayed.
45
CAPTURING TOMOGRAMS
Page 48

[Select an image from the thumbnail window.]
(1)
(2) (3)
(4)
Supplemental photography information
The following information is indicated on the image display window.
No. Display Contents Display position
(1) R/L "OS (L)" for left eye and "OD: (R)" for right eye are displayed. Upper left
(2) Picture angle "45°" and "30°" are displayed.
(3) Fixation Displays one of "Disc", "Macula" and "Center". The external
fixation target is not displayed.
(4) Flash level Displays the flash level ("Ws" value). This is not displayed
for the "Red-free" tab.
These pieces of information are not displayed for the "COMPOSITE" tab.
These are not displayed when "Annotation" is valid, either. Instead, the information of "Annotation" is displayed.
Mouse operation for the image display window
The following actions are done by operating the mouse on the image display window.
Mouse operation Action Contents
Click the right button. Menu Displays the size adjustment menu.
Double-click the left button. Red-free The "Color" tab shifts to the "Red-free" tab.
The "Red-free" tab returns to the "Color" tab.
Drag the right button (FastMap style).
Or
Rotate the mouse wheel (IMAGEnet
style).
Drag the mouse wheel (FastMap style).
Or
Drag the left button (IMAGEnet style).
Zoom in/out
of the image
Move of
image
Zooms in or out the image.
Only when the image is enlarged, it can be
moved. The image moves according to the
move of mouse.
Upper right
Click the mouse wheel. Magnifier Changes to the "Magnifier" mode.
Click again. The original mode is reset.
For changing "FastMap style" and "IMAGEnet style", refer to "2.6.9. Setting".
46
CAPTURING TOMOGRAMS
Page 49

Click the right button: Menu
Click the right mouse button on the image display window. The following menu is displayed.
1 Click the right mouse button on the image display window. The following menu is displayed.
"Fit-to-window" maximizes the displayed image according to the image display window. "View
100%" displays the image in the original size.
Click the mouse wheel: Magnifier
1 Click the mouse wheel. The magnifier (green square frame) is displayed at the mouse cursor
position.
2 Move the mouse cursor, and the magnifier follows it. So, you can adjust the part to be observed.
47
CAPTURING TOMOGRAMS
Page 50

[Select the "ALL IMAGES" tab.]
Right/left of the photographed eye
OD (R): Right eye
OS (L): Left eye
Selected status
When the "ALL IMAGES" tab is selected, the list of all the fundus images on the thumbnail is displayed.
The right/left of the photographed eye is attached to each image.
Mouse operation for the "ALL IMAGES" fundus image display area
The actions with mouse in the fundus image display area, which is changed by the "ALL IMAGES" tab,
are shown below.
Mouse operation Action Contents
Click the left button. Selection The thumbnail is selected. The selection is classified
into "IMAGEnet style" and "Windows style".
Double-click the left button. Change/Display The double-clicked image is displayed on the fundus
image display area of the "Color" tab.
Click the right button. Menu Displays the menu.
[Ctrl] key + Mouse wheel Zoom in/out Zooms in/out the image list.
Click the left button: Selection
The selection method is different between "IMAGEnet style" and "Windows style".
IMAGEnet style: Two or more thumbnails can be selected by single-click.
As pressing the [Ctrl] key, click the left mouse button. The selected status is
reversed.
Windows style: As pressing the [Ctrl] key, click the left mouse button. Two or more thumbnails can
be selected.
As pressing the [Shift] key, click the left mouse button. The thumbnails in the
selection range can be selected at a time.
For changing the style, refer to "2.6.9. Setting".
48
CAPTURING TOMOGRAMS
Page 51

Double-click the left button: Display
Zoom in
Zoom out
The double-clicked image is changed to other image and then is active on the thumbnail window.
1 Double-click the left mouse button on the image in the list.
Click the right button: Menu
1 Click the right mouse button on the thumbnail. The following menu is displayed.
When selecting "Menu", On/Off of the check is changed.
When the check is set to "On", you can specify the image, which is reserved for deletion, not to be
displayed. In this case, the image reserved for deletion is not included in the count of the photography result list.
[Ctrl] key + Mouse wheel: Zoom in/out
1 As pressing the [Ctrl] key, roll the mouse wheel.
49
CAPTURING TOMOGRAMS
Page 52

2.6.6. C-6 Information window
(1)
(2)
(3) (4) (5)
(6)
Count of the photographed
images
The information about the patient and the OCT instrument body is displayed.
No. Information Contents
(1) Patient ID The patient ID entered before photography
(2) Patient name The patient name entered before photography
(3) Fundus photography mode Indicates "Color fundus photography".
(4) Right/left information of the
photographed eye
(5) Flash level of the
OCT instrument body
(6) Fixation position of the OCT
instrument body
The FA timer counter is displayed only when the timer counter is counting for FA photography
images.
The real-time status of the OCT instrument body is displayed in the areas of the fundus photography mode, the right/left information of the photographed eye, the flash level and fixation position of
the OCT instrument body.
"OS: (L)" for left eye and "OD (R)" for right eye are displayed.
Displays the flash level ("Ws" value).
Displays one of "Disc", "Macula", "Center" and "External fixation
target".
2.6.7. C-7 Photography result display list
The count of the photographed images in each photography mode is displayed.
Only in the FA fundus photography mode, the timer is displayed while "Timer" is counting.
50
CAPTURING TOMOGRAMS
Page 53

When any image is reserved for deletion, "Shot" displays "Count of images without reserve for
2188×2136 (569,1436) 40%
(1)
(2) (3)
deletion/All images". When "Hide deleted images" is set, the count of other images except those
reserved for deletion is displayed.
Example:
When three pictures in color are taken and two images are reserved for deletion:
• When "Hide deleted images" is set
Capture Mode Timer Shot
Color 1
• When "Hide deleted images" is not set
Capture Mode Timer Shot
Color 1/3
2.6.8. C-8 Status bar
When the cursor is in the fundus image display area, the following information is displayed.
No. Information Contents
(1) Image size Length × Width
(2) Mouse cursor coordinate The upper left corner is the origin (0, 0) in real size. When the
cursor is not in the fundus image display area, (-, -) is displayed.
(3) Image magnification ratio Displayed by "%".
When the cursor is on the menu icon, the function of the icon is displayed.
51
CAPTURING TOMOGRAMS
Page 54

2.6.9. Setting
(1)
(2)
(6)
(7)
(8) (4)
(5)
(10)
(3)
(9)
Shift to the grabber setting screen of the "Fundus photography" tab in "OCTSet.exe" (OCT Configuration).
You can set a variety of data about the fundus grabber. For starting "OCTSet", refer to "11.3. A VARIETY
OF SETTING" on P.217.
(1) Image Directory
Specify a directory to save the image log file temporarily.
"Secondary" is a spare area when the "Primary" capacity is full.
It is possible to use the folder selection dialog box with the [Browse...] button and specify the
directory. Be careful not to specify the same drive for "Primary" and "Secondary".
(2) Log Directory
Specify a directory to save the photography log file temporarily.
It is possible to use the folder selection dialog box with the [Browse...] button and specify the directory.
(3) Show patient select window when capture is finished.
Set whether the "FastMap" capture mode should be finished and the patient selection list should be displayed when finishing fundus photography to close the window.
Place a mark in the check box. This item is validated and the patient selection list is displayed.
(4) Thumbnail Selection Style
Set the thumbnail selection method in the "ALL IMAGES" tab.
IMAGEnet style: Two or more thumbnails can be selected by single-click.
As pressing the [Ctrl] key, click the button. The selected status is reversed.
Windows style: As pressing the [Ctrl] key, click the button. Two or more thumbnails can be
selected.
As pressing the [Shift] key, click the button. The thumbnails in the selection range
can be selected at a time.
52
CAPTURING TOMOGRAMS
Page 55

(5) Mouse Operation Style
Specification of the display position
Specification of the photo size
Format of date
Set the mouse operation in the fundus image display area.
IMAGEnet style: By rotating the mouse wheel, you can zoom in/out the image. As pressing the
mouse left button, drag the image. You can move the image.
FastMap style: As pressing the mouse right button, drag the image up and down. You can zoom
in/out the image. As pressing the mouse wheel, drag the image up and down or
right and left. You can move the image.
(6) Enable Write to Image
Set annotation to write information to the photographed image.
When the check is set to "On", the [Image Setting] button is enabled. You can set the data.
(7) Image Setting
Set annotation in the following dialog box.
Information Contents
Specification of the display position Specify where each piece of information should be displayed on
the image. Select one of "None", "Upper Left", "Upper Right",
"Lower Left" and "Lower Right".
Specification of the photo size Specify the photo size when writing information.
Format of date Set the format of date.
yyyymmdd: Year/Month/Day
mmddyyyy: Month/Day/Year
ddmmyyyy: Day/Month/Year
CAPTURING TOMOGRAMS
53
Page 56

(8) Trimming Set
Setting of Color/FA picture angle
Setting of FAF trimming
Set trimming in the following dialog box.
Information Contents
Setting of Color/FA picture angle Only when a check mark is placed for angle, the setting is vali-
dated.
Setting of FAF trimming When this item is validated, trimming is performed with the com-
pensation value of the instrument body.
54
CAPTURING TOMOGRAMS
Page 57

(9) Image Quality Setting
Selection Influence on edge Smoothing level of contrast noise
OFF None None
LOW Small Low
MID Medium Medium
HIGH Large High
Information Contents
Contrast Select whether contrast should be enhanced for the image captured by
Fundus grabber.
ON : Contrast is enhanced.
OFF : Contrast is not enhanced.
Use LUT for enhancement Contrast is enhanced according to the value set in "Look Up Table".
Set the path for the "Look Up Table" file (.csv).
Use auto contrast The histogram is automatically analyzed, the contrast tilt is calculated
and then contrast processing is done.
Set the minimum tone range between 0 and 255.
Use standard contrast You can set the contrast enhancement level by 10 steps.
Gamma Reverse-gamma:
Removes the gamma correction of digital camera. Enter the gamma
value applied to the digital camera. The really applied value (1/
displayed at the right side.
Smoothing process As keeping the edge as much as possible, the contrast noise is
smoothed.
) is
55
CAPTURING TOMOGRAMS
Page 58

(10) Print Setting
Press [Template Setting], and a dialog box is displayed. You can set, add and change the data for template.
Setting Name
Select "List". You can select a setting name from the list.
1 Press [New...], and the following dialog box is displayed. The user can make a new setting name
by entering a name.
2 Press [Remove...], and the displayed setting is deleted. The following check dialog box is dis-
played.
3 Press [Yes]. Deletion is finished.
Template File Path
Specify the template file path in the horizontal direction.
Press the [Browse...] button, and the selection dialog box is displayed. You can input a path directly in
the dialog box.
Template File Path (V)
Specify the template file path in the vertical direction.
Press the [Browse...] button, and the selection dialog box is displayed. You can input a path directly in
the dialog box.
Printer Name
Display the list of the installed printers and select a printer.
Press the [Property...] button. The printer setting dialog box is displayed.
Press the [OK] button. The contents for the template set currently are saved. Press the [Cancel] button. The set data are discarded.
56
CAPTURING TOMOGRAMS
Page 59

2.6.10. Printing
(4)
(11)
(10)
(9)
(2)
(1)
(3)
(5)
(6)
(7)
(8)
Press , and the print dialog box is displayed. You can set the data for printing and perform previewing. This icon is valid only when an image is selected.
When the image reserved for deletion is selected, is not validated.
(1) [OK] button
Press the [OK] button in the dialog box. Printing is performed according to the set data. The dialog box is
closed.
(2) [Cancel] button
Press the [Cancel] button in the dialog box. The set data are discarded and the dialog box is closed.
(3) Setting Name
Displays the setting name list that is set in "OCTSet.exe" (OCT software environment setting). Select a
name.
57
CAPTURING TOMOGRAMS
Page 60

(4) Set data for printing
Validated only when "Not use
template set" is selected.
Usually validated.
Displays the "Property" dialog box for printer.
Displays the template file path and printer that are set in (3).
These data cannot be changed here. Only when "Not use template set" is selected in (3), the setting for the template file path and printer is validated. You can set the data on this dialog box.
As a template file, you can specify the file having the extension ".WRI" that exists in the "GrabberPlugins\Print" folder of the 3D OCT program folder (example: C:\Program Files\TOPCON\3DOCT-2000).
(5) Remove Mask
Specify the mask method for the fundus image according to the need. There are two methods: one is to
apply a mask by image processing and the other is to specify a mask file.
"Mask File" is the black-and-white Bit Map image as shown below. This is used as a template to
remove the black portion around the image. To create a mask file, use "Maskedit.exe".
"Maskedit.exe" is contained in the CD-ROM of IMAGEnet R4™. It is necessary to save the mask
file with the following filename.
Picture angle_Horizontal pixels_Vertical pixels_Procedure.bmp
Example: 45_2048_1536_Color.bmp
(6) Layout
Set the layout for printing. The following table shows the selectable items.
No. Contents
1 Original
21UP
32UP (H)
42UP (V)
54UP
66UP (V)
79UP
816UP
58
CAPTURING TOMOGRAMS
Page 61

(7) Brightness
Move the slide bar to adjust the image brightness. It is possible to return to the original brightness by the
[Reset] button. You can validate the current bar status on all the images to be printed by the [Apply All]
button.
When an image is displayed in the "Multi Map" status, click the image on the print preview screen.
The image is selected (green frame). When adjusting brightness for the "Multi Map" display,
brightness is adjusted for all the selected images. Click the selected image, and the selection is
canceled.
1 Click the image in the "Multi Map" status.
(8) Image
This is the image to be printed.
(9) Preview...
The print image preview is displayed. When the "ALL IMAGES" tab is selected, the images are displayed
in the "Multi Map" status.
(10) Print Page
Select [All Pages]. All the previews on the thumbnails are printed. Select [Current Page]. Only the image
displayed as the preview is printed.
(11) Move of Page
You can move the page of the print image preview.
59
CAPTURING TOMOGRAMS
Page 62

2.7. Scan Pattern Specifications
Left eye
Right eye
S
S
I
TNNT
S:superior
I :inferior
T :temporal
N :nasal
I
S
S
I
I
Left eye
Right eye
NNTT
The following figures show the status as viewed from the operator side.
2.7.1. Line Scan
In the scan range, move on the line (blue line in the figure below), which connects the coordinates of the
given start point and end point, by the step divided by the given resolution. Be sure to move from the start
point to the end point.
2.7.2. 5 Line Cross Scan
In the scan range, move on the five cross lines (blue lines in the figure below), which pass through the
center point, by the step divided by the given resolution. "9.0mm" is initially set for the scan length. Be
sure to move from the start point to the end point.
60
CAPTURING TOMOGRAMS
Page 63

2.7.3. 3D Scan
[3D-Scan]
End point
Live-Scan
position
Start point
End point
Start point
Live-Scan
position
Left eye
Right eye
S
S
I
I
N
N
T
T
Start point
End point
Live-Scan
position
Start point
End point
[3D-Scan](V)
Left eye
Right eye
S
S
I
I
N
N
T
T
Live-Scan
position
Left eyeRight eye
Move on the inside of the square, which is composed of the given start point and end point, horizontally
and vertically by the step divided by the given resolution.
The scan for [3D Macula] and [3D Disc] is shown below. ("6.0×6.0mm" is fixed for the scan length in both of
these scans.)
The scan for [3D Macula (V)] and [3D Wide] is shown below. (As the scan length, "7.0×7.0mm" is fixed for
[3D Macula (V)] and "12.0×9.0mm" is fixed for [3D Wide].)
2.7.4. Radial Scan
In the scan range, perform scanning by the specified diameter and by the step divided by the given resolution. "6.0mm" is initially set for the scan length. The start point for Line-Scan and rotating direction are
reversed for each of right and left eyes. For the right eye, rotation is done counterclockwise in the horizontal direction. For the left eye, rotation is done clockwise in the horizontal direction.
S
7
6
8
5
4
9
10
11
12
T
I
T
S
7
6
8
9
10
11
12
5
4
3
2
1
I
N
N
3
2
1
61
CAPTURING TOMOGRAMS
Page 64

2.8. Saving and Deleting Captured Tomograms
2.8.1. To Save a Tomogram
1 After imaging and overlapping, the captured tomogram is automatically saved.
The saved thumbnail is marked with "S".
2 Then, analysis is automatically done. After analysis, the thumbnail is marked with "P".
Sometimes the analysis function is not normally finished. In this case,
CAUTION
2.8.2. To Delete a Tomogram:
the thumbnail is marked with "Fail".
1 Highlight the thumbnail. You can select two or more thumbnails at this time. 2 Click Delete in the Thumbnail View panel. 3 Click OK to confirm the deletion.
62
CAPTURING TOMOGRAMS
Page 65

2.9. Displaying Report of the Photographed Tomogram
2.9.1. Displaying and Printing the Report
Displaying the report
1 Select the thumbnail that has been analyzed, and the button on the tool bar are vali-
dated. In some of the scan patterns, these buttons are not validated.
For details, refer to "Patterns that invalidate the output buttons" on P.184.
2 Click the buttons, and the report is displayed.
Orientation:
Select "Portrait", and the vertically long report is displayed. Select "Landscape", and the horizontally long report is displayed.
Color Mode:
The tomogram to be indicated on the report is displayed in "Color Mode".
CAPTURING TOMOGRAMS
63
Page 66

Printing the report
Click the button, and the displayed report is printed by the connected printer. Install the
printer and set the necessary data for printing beforehand.
Export of report
Click the button. The displayed report is output as an image of "jpeg", etc.
Comments
Click the button, and the comment input screen appears.
Click the [Save] button. The entered comment is saved for each report and is output to the "Comments" column on the report.
64
CAPTURING TOMOGRAMS
Page 67

3. DISPLAYING TOMOGRAMS
This chapter will explain how to select the patient and tomogram data ("Selection Mode Window", "Selecting and Retrieving the Patient" and "Operating through Data list") first. Next, it will explain the "View" window that is the display screen ("View Window"). At last, it will explain the positioning process of images
("Pin-point Registration™").
3.1. Selection Mode Window
The selection mode window has three types of interfaces and you can select them by the following tabs
(at the upper left corner on the screen).
1) Grid (default)
2) Thumbnail
3) Date
65
DISPLAYING TOMOGRAMS
Page 68

3.1.1. Grid interface
A-5:
Patient Information Panel
A-1:
Search Patient Panel
A-2:
Data list
A-4:
Preview Panel
A-3:
Report list
[Selection] mode window (Grid interface)
A-7:
Patient Info button
A-6:
Register New
Patient button
The [Selection] mode window (Grid interface) consists of the following seven items.
ID Name Description
A-1 Search Patient Panel Displays the patient list.
A-2 Data list Displays the photographed image list of the selected patient.
A-3 Report list Displays the report list of the selected patient.
A-4 Preview Panel Displays the thumbnails and photography information of the
image selected on the Data list.
A-5 Patient Information Panel Displays the information of the selected patient.
A-6 Register New Patient button Register a new patient.
A-7 Patient Info button Displays the patient information.
Hereafter, these seven items will be explained.
66
DISPLAYING TOMOGRAMS
Page 69

A-1: Search Patient Panel
Patient Search Box
Patient List
Database Selection
Calendar
The Search Patient Panel consists of the following four items.
[Patient Search Box]
Refer to "Selecting and Retrieving the Patient" on P.73.
[Patient List]
The Patient List section is arranged by the ID, Last Name, First Name, Sex, and DOB attributes. The user
may sort any attribute by clicking on that category tab (sorting).
[Database Selection]
The "System" database is selected by default when the software starts. The user can switch to "Data
Drive" if necessary.
[Calendar]
Refer to "Selecting and Retrieving the Patient" on P.73.
67
DISPLAYING TOMOGRAMS
Page 70

A-2: Data list
The Data list displays the photography information of the patient selected from the Search Patient Panel.
For the operation from the data list, refer to "3.3" on P.76.
A-3: Report list
The Report list displays the list of the reports already made.
The data corresponding to the report selected on the report list is highlighted on the OCT data list.
Select All : Selects all the reports.
Export : Export the selected report.
Print : Prints the selected report.
Print Preview : Displays the print image of the selected report.
Print: Prints a report.
Done: Finishes the print preview.
Zoom In: Displays a report in a bigger size than usual.
Zoom Out: Displays a report in a smaller size than usual.
xxx%: Select the "zoom in/out" ratio from 25%, 50%, 75%, 100%, 125%, 150%, 175% and 200%.
68
DISPLAYING TOMOGRAMS
Page 71

A-4: Preview Panel
The Preview Panel displays the thumbnails and photography information of the image selected on the
Data list. The following photography information is displayed.
• Segment
• Scan Size
• Scan Length
•Site ID
• Machine s/n
•Date
•Time
• Analysis Version
• Revised Data
• Revised Time
•Revised
• Fixation
• Image Quality
• Color Fundus
• Thickness Analysis
• Disc Analysis
•Analysis Mode
• OCT Focus Position
In "Radial Scan" of the anterior segment photography, "Signal Strength" is displayed instead of
"Image Quality".
"Disc Analysis" is valid for the data of "3D Scan, 6.0×6.0mm, 512×128 pixels, and Fixation: Disc/
External fixation". For details of "Disc Analysis", refer to "Analyzing the Optic Disc" on P.132.
69
DISPLAYING TOMOGRAMS
Page 72

A-5: Patient Information Panel
The Patient Information Panel displays the information of the selected patient.
You can change the data to be displayed. Click [Patient Information Panel], and the following menu
appears. Place a check mark for the desired item. Remove the check mark from the undesired item.
You can display or hide the following information.
•ID
•Name
• Date of Birth
•Sex
• Physician 1,2,3,4
• Diagnosis 1,2,3,4
A-6: Register New Patient button
Register a new patient. Refer to "To Register a New Patient:" on P.25.
A-7: Patient Info button
Click the [Patient Info] button, and the following "Patient Information" window is displayed.
70
DISPLAYING TOMOGRAMS
Page 73

3.1.2. Thumbnail Interface
[Selection] mode window (Thumbnail Interface)
The data of the selected patient are displayed with the thumbnail list.
71
DISPLAYING TOMOGRAMS
Page 74

3.1.3. Date Interface
[Selection] mode window (Date Interface)
The Date interface uses a specific date or ranges of dates to locate a patient's record. Click a date on the
calendar at the left or specify a date range by dragging the mouse to highlight the date or range. To select
patient data, click on a specific date or highlight a date range (by dragging the mouse). All tomogram data
records captured during the specified date range will display on the Data list.
72
DISPLAYING TOMOGRAMS
Page 75

3.2. Selecting and Retrieving the Patient
Select and retrieve the patient from the Search Patient Panel.
3.2.1. Selecting the patient
1 Click the patient (name) whose image should be displayed on the patient list of the Search
Patient Panel.
You can select the data of only one line (only one patient) at a time. The selected name is
highlighted in orange, and his/her tomogram data are displayed on the Data list.
3.2.2. Retrieving the patient
You can retrieve the patient list by using the following items in the Patient Search Box;
•ID
•First Name
• Last Name
• Diagnosis
•Physician
and the following item on Calendar.
• Last Photo Date
[Retrieving with ID, First/Last Name, Diagnosis Code and Physician]
1 Input the data to be retrieved to the items in the Patient Search Box. 2 Click [Search].
You can search using the first letter only. For example, if you type in "A" in the Last Name
field, all patients with the last name beginning with "A" will display.
Press [Clear Form], and the data input to each field of "Patient Search" is cleared.
Press [Refresh], and "Patient List" and "Data List" are updated to the newest.
73
DISPLAYING TOMOGRAMS
Page 76

[Show patient dialog box for new registration when no patient is found.]
On condition that a check mark is placed for [Show patient dialog box for new registration when no
patient is found.] on the "Patient" tab of "OCTSet.exe" (OCT software environment setting), if the
desired patient is not found by retrieving, the new registration screen for the patient is displayed.
For starting "OCTSet", refer to "11.3. A VARIETY OF SETTING" on P.217.
74
DISPLAYING TOMOGRAMS
Page 77

[Retrieving with "Last Visit" (One date)"]
1 Click the date to be retrieved on Calendar.
2 Click [Search].
[Retrieving with "Last Visit" (Date range)]
1 Select a date range by dragging the mouse.
2 Click [Search].
75
DISPLAYING TOMOGRAMS
Page 78

3.3. Operating through Data List
3.3.1. Contents on Data list
Once you select the desired patient on Search Patient Panel, the photography data are classified by the
following items and are displayed on Data list.
Date: The date when the picture was captured
Time: The time when the picture was captured
Scan Mode: Scan mode used for photographing
Eye: Right eye (OD (R)) or left eye (OS (L))
Fixation: Fixation type set in photography
File No.: Name of the file that saves the captured and analyzed data
Archive Disk: The archive disk number where the image data resides
Revised: Times of the data revision
When the FDS file is saved or when the revised data is selected, the [OpenHistory] button is valid.
Press the [OpenHistory] button, and the history data list screen appears. You can select the original
data (FDS) and the revised data.
76
DISPLAYING TOMOGRAMS
Page 79

Press the [Display detail] button, and [FollowUp] and [Analysis] are displayed in the data list. When the
[Display detail] check box is set to ON, [FollowUp] and [Analysis] are displayed every time a patient is
selected. When the setting is changed not to display [FollowUp] and [Analysis], the display time of
"OCT Data List" is shortened.
Follow-up: Shows that the data was obtained by "Follow Up" photography (Follow) or it was "Base-
Line" of the selected data (Base).
Analysis: Indicates whether or not the data was analyzed (refer to "Saving Analyzed Results" on
P.176) and the analysis mode.
Double-click the one-line data. If the data has been revised, the newest revised data is displayed. If the
data is not revised, the data at photography is displayed and the View Window is accessed.
FDS file has the tomogram data with the unarchived format.
FDA file has the archiving format and analysis result of the tomogram data. Each time you perform "ReAnalyze" or press the [Save] button on the "View" screen, the data is saved to a new FDA
file. To see the FDA file having the old analysis results, press the [OpenHistory] button and select
a desired file on the "HistoryRecord" screen.
77
DISPLAYING TOMOGRAMS
Page 80

3.3.2. History data list screen
A-1:
OCT Data list
A-3:
Preview Panel
A-2:
Report list
Select the data to be displayed and press the [OK] button. The View window is accessed.
ID Name Contents
A-1 OCT data list The revised data history list is displayed.
A-2 Report list The report of the selected data is displayed.
A-3 Preview Displays the selected data information and thumbnails.
78
DISPLAYING TOMOGRAMS
Page 81

When selecting data on the history data list screen, the system operation is limited as mentioned
below.
• The following buttons on the tool bar are not valid.
[Save]
[Capture]
[Compare ALL]
[Compare]
[Viewer]
[OD/OS Report]
[OU Report]
[OD(R)]
[OU(R/L)]
[OS(L)]
• Menu
Tools
The result of the operation for the [Add Reference Image] menu is not saved.
The [Mosaic] menu is not valid.
Export
The [Batch Export] menu is not valid.
• Tomogram display area
The [Modify] menu for each layer is not valid.
The result of the operation for the [Measure] menu of [Caliper] is not saved.
• Fundus/anterior segment display area
The [Analyze] button is not valid.
The [Disc Modify] menu when [Disc Topo] is displayed is not valid.
• Thumbnail area
It is not possible to specify a filter.
79
DISPLAYING TOMOGRAMS
Page 82

3.3.3. Arranging Data Records
The user may arrange the tomogram data records by dragging any of the column headings into this
space:
1 Drag the Scan Mode column header into place.
2 The data records are then sorted by Scan Mode.
To return the sorting display to the original, finish this process with the button. Then, access
this screen again.
3.3.4. Comparing Data from the Data list
Select the data of the right and left eyes captured by the same scan mode and click the button.
You can compare the data.
For details of comparison, refer to "COMPARING ANALYSIS RESULTS" on P.166.
3.3.5. Analyzing Data from the Data list
To analyze data from the data list, use the [ReAnalyze] button. Select data and click the [ReAnalyze] button. Analysis will be performed according to the setting with Macro Function.
For setting of the [ReAnalyze] button, refer to "11.3. A VARIETY OF SETTING" on P.217.
For details of Macro Function, refer to "MACRO FUNCTION" on P.190.
80
DISPLAYING TOMOGRAMS
Page 83

3.3.6. Making Reports from the Data list
Select data and click the [Report] or [OU Report] button. The report is made and previewed.
OU Report
Select the scan data corresponding to [OU Report] (refer to "Patterns that invalidate the output buttons"
on P.184) and click the [OU (R/L)] button. The "Select Record" dialog box where the selectable data are
displayed is displayed.
Select another eye from the "Select Record" dialog box and click [OK]. The reports for both eyes are
made and previewed.
When you specify one OS (L) data and one OD (R) data that can be output as the both eyes report
and click the [OU Report] button, the both eyes report is made and previewed without displaying
the [Select Record] dialog box.
When the Disc Topo reference plane height is changed on the "Analysis" tab of "OCTSet", this
change is not effective in the "Disc Topo" value of the report unless "ReAnalyze" is performed.
81
DISPLAYING TOMOGRAMS
Page 84

3.4. View Window
2D/3D tabs
2D mode
A-1.
Thumbnail area
A-2.
Image processing controls area
A-3.
Fundus/anterior segment
image display area
A-4.
Thickness graph area
A-5.
Tomogram
display area
A-6.
3D tomogram display area
2D/3D tabs
A-5.
Auxiliary tomogram
display area
3D mode
Once a tomogram is selected, the View Window is automatically accessed. On View Window,
in 3D/Radial Scan except "3D Macula (V)" and "3D Wide", the 2D/3D tabs are displayed and
you can change the displayed tomogram. In the case of other scans, the tomogram is displayed in 2D mode. (The 2D/3D tabs are not displayed.)
See "Drusen Analysis" on P. 162. about the View Window when you use Drusen analysis.
The View Window consists of the following areas.
82
DISPLAYING TOMOGRAMS
ID Area 2D/3D
A-1 Thumbnail area 2D/3D
A-2 Image processing controls area 2D/3D
A-3 Fundus/anterior segment image display area 2D/3D
A-4 Thickness graph area 2D
A-5 Tomogram display area 2D
A-5 Auxiliary tomogram display area 3D
A-6 3D tomogram area 3D
Page 85

3.4.1. A-1: Thumbnail area
B-1:
Thumbnail
B-2:
Filter
Noise Floor (NF) Max
ID Name Description
B-1 Thumbnail Displays the thumbnail images of the data applicable to the conditions of B-2.
B-2 Filter You can specify three conditions.
Eye You can specify the right or left eye.
Scan You can specify the type of scan used for photography.
Date You can specify the date of photography.
For "B-2: Filter", the data of the image being displayed are used and so
CAUTION
you cannot change the values of "Filter" directly.
3.4.2. A-2: Image Processing Controls area
[Scale adjustment]
Color set: Press the [Color set] button, and the "OCT Color Setting" window.
It is possible to adjust the color map of tomogram by adjusting the scale on the "OCT Color Setting"
window.
The data lower than the value of "Noise Floor" (NF) (noise reference surface) is displayed in black.
The data higher than the value of "Max" is displayed in white. "25%" of the data range is the initial
value for "NF", and "75%" for "Max".
The changed value is held by the [Set] button. The initial value is set again by the [Reset] button.
83
DISPLAYING TOMOGRAMS
Page 86

[Selection of layer detection display]
Fundus
Fundus
You can select GCL++ and GCL+ only when you open the 3D (V) and 3D-Wide data.
Anterior segment
[Showing/Hiding layers]
Retina:
RNFL:
Retina:
RNFL:
GCL++:
GCL+
Cornea:
CorneaIEpi:
Calculates the thickness between the ILM-RPE layers.
Calculates the thickness between the ILM-NFL layers.
Calculates the thickness between the ILM-RPE layers.
Calculates the thickness between the ILM-NFL layers.
Calculates the thickness between the ILM-IPL layers.
Calculates the thickness between the NFL-IPL layers
Calculates the corneal thickness.
Calculates the corneal epithelium thickness.
When the [Layers] button is selected, layers are displayed. This button corresponds to On/Off of the
menu [ILM]/[RPE] of "A-5: Tomogram display area/Auxiliary tomogram display area". Refer to "A-5:
Tomogram display area/Auxiliary tomogram display area" on P.98.
[Utility button]
Disc Topo : Disc Segmentation
Drusen : Drusen Analysis
The functions of Utility buttons correspond to those of the "Tools" menu.
When the data is analyzed with "Type2 (New)" of "Segmentation Analysis Type" ("OCTSet Analysis" tab on P.219), the "Drusen" analysis cannot be used for it.
The functions of the "Tools" menu can be added or deleted. When the software is installed, the
Utility buttons correspond to the above functions. The functions related to the Utility buttons may
be changed due to the addition or deletion on the "Tools" menu.
[OD / OU / OS button]
OD (R) : Right eye
OU (R/L) : Both eyes
OS (L) : Left eye
The OD/OU/OS icons indicate the eye data displayed on the "View" screen. Moreover you can change
the displayed eye data by these icons.
84
DISPLAYING TOMOGRAMS
Page 87

3.4.3. A-3: Fundus/Anterior Segment Image Display Area
C-1:
Color / B/W selection
C-6:
Menu
C-5:
Maximize
C-4:
Tumbnail overlay
C-8:
3D scanning area
C-7:
Tomogram location indicator
C-3:
Analysis of fundus image
C-2:
Red-free mode
Explanation of Window
This window displays the fundus or anterior segment image.
The positional correlation between the image on the fundus/anterior segment image display area and the
tomograms on the 3D/auxiliary tomogram display areas is indicated, including the "overlay" image. For
details, refer to "Pin-point Registration™" on P.121. In this chapter, the fundus image will be explained as
an example.
ID Name Description
C-1 Color and B/W selection Select the color or B/W image. ("Color" is selected as default.)
C-2 Red-free mode Shifts to the red-free image. (When a mark is placed in the check
C-3 Fundus image analysis Shifts to the fundus image analysis screen.
C-4 Thumbnail overlay image The images which can selected from the "overlay" menu are dis-
C-5 Maximize Maximize this sub-window to the whole screen or return to its
C-6 Menu Menu (This will be explained in "How to use the menu"on P. 87.)
C-7 Tomogram location indicator The tomogram of the part shown by this indicator is displayed on
C-8 3D scanning area This shows the 3D scanning area.
box at the right of "Red-free", the red-free image is automatically
displayed in the next photography and after.)
played as thumbnails.
original size.
Window A.
DISPLAYING TOMOGRAMS
85
Page 88

How to ...
Color fundus image
B/W fundus image
Red-free
Zoom In/Out of Color Fundus Images
Hold down the right mouse button and drag it up/down.
Move (Pan) Color Fundus Images
Hold down the mouse wheel button and drag it up/down and right/left.
Select the color fundus image, IR fundus image and red-free (fundus image).
Click "Color Fundus", "IR Fundus" and "Red-free".
Pin-point Registration™
See “Pin-point Registration™” on P. 121 for details about Pin-point Registration.
Overlay function
Refer to "How to use the menu" on P. 87.
Grid function
Refer to "How to use the menu" on P. 87.
Circle function
Refer to "How to use the menu" on P. 87.
86
DISPLAYING TOMOGRAMS
Page 89

How to use the menu
Projection image Shadowgram image
The menu displays five items, "Overlay", "OCT-LFV", "Grid", "Circle" and "Disc Modify". The menu is
changed depending on the scan pattern and photography mode. In the sub-menus of these five menu
items, the menu is changed depending on the scan pattern and photography mode.
[Overlay]
When the Overlay function is used, the user can display one of the projection image, shadowgram image
and Thickness Map in the overlap status with the color fundus image or B/W fundus image.
Overlay image type Meaning
Projection image Image made by integrating the reflection strength in the Z direction
of tomogram (This can be displayed on the photography screen.)
Shadowgram image Image made by integrating 50 pixels under RPE of tomogram.
Thickness Map image The two-dimensional map for the selected thickness.
The examples are shown below for the projection and shadowgram images.
To access the Overlay image, click the desired image in the [Overlay] menu or click [Thumbnail overlay
image]. To erase the Overlay image, press "On/Off" in the [Overlay] menu or click [Thumbnail overlay
image] again.
87
DISPLAYING TOMOGRAMS
Page 90

To rearrange the Overlay image, click [Overlay] and then [Reposition]. Place the cursor on the image. As
After rearranging the projection image
(The 3D scanning area has been moved to
the upper right.)
pressing the left mouse button, drag the image to an optional position.
To make transparent the Overlay image, click [Overlay] while the Overlay image is on the screen and
press [Transparent]. Press it again, and the image returns to its original status.
The table below shows the relation between the Overlay image and the usable scan patterns. Only the
Projection image is displayed for 3D Scan of anterior segment.
Scan
pattern
Overlay
image
Projection - - #1
Shadowgram - - #2
Thickness Map - #2
#1: The Overlay image can be displayed only for the original image.
#2: The Overlay image can be displayed only for the analyzed image.
The table below shows the relation between the Reposition and Transparent functions and the usable
scan patterns.
Scan
pattern
Overlay
image
Line/
5Line
Cross
Line/
5Line
Cross
Radial
Radial
3D/
3D (V)/
3D Wide
3D/
3D (V)/
3D Wide
Reposition - -
Transparent -
88
DISPLAYING TOMOGRAMS
Page 91

[OCT-LFV]
Example where the OCT-LFV image is displayed
The OCT-LFV (OCT Live Fundus View) function displays the OCT-LFV image on the IR fundus image
(black-and-white fundus image). You can use this function when the IR fundus image is displayed in any
other photography except 3D photography.
The OCT-LFV image can be displayed for the following scan patterns.
Displayable Undisplayable
Line
5 Line Cross
Radial
Only when "ON" is set for "OCT-LFV" and the OCT instrument takes a picture, the "OCT-LFV"
image can be displayed.
The example where the OCT-LFV image is displayed is shown below.
3D: Macula
3D: Optic disc
3D: Macula (V)
3D: Wide
Anterior segment: Radial
Anterior segment: Line
To display the OCT-LFV image, click [On/Off] in the [OCT-LFV] menu or click [Thumbnail OCT-LFV
image]. To erase the OCT-LFV image, click [On/Off] in the [OCT-LFV] menu or click [Thumbnail OCT-LFV
image] again.
To make the OCT-LFV image translucent, click [OCT-LFV] on condition that the OCT-LFV image is displayed and press [Transparent]. Click [Transparent] again, and the OCT-LFV image is returned to the
original status.
89
DISPLAYING TOMOGRAMS
Page 92

[Grid]
The Grid function displays the thickness between selected layers in each grid as the average value.(See
"A-2: Image Processing Controls area"on P. 83.) The result of the comparison with normal data can also
be displayed as a colormap.
Grid is defined as follows.
Grid type Grid definition
Rectangular • 10×10 grid where the length of one side is equal to 1/10 of 6mm (in "3D Vertical"
scan)
• 24×24 grid where the length of one side is equal to 1/24 of one side length of 3D
scan area (in "3D Disc 512×128 6×6mm" scan)
• 6×6 grid where the length of one side is equal to 1/6 of one side length of 3D
scan area (in 3D scan except the above-mentioned scans)
ETDRS The nine fields separated from the three concentric circles (diameter: 1, 3 and
6mm) by the ±45-degree line.
RNFL4 The area divided into four sections equally on the circumference. The circle radius
can be changed by selecting "On" of [On/Off] in the [Circle] menu.
RNFL6 The area divided into six sections equally on the circumference by 45 degrees in
vertical direction and by 90 degrees in horizontal direction. The circle radius can
be changed by selecting "On" of [On/Off] in the [Circle] menu.
RNFL12 The area divided into twelve sections equally on the circumference. The circle
radius can be changed by selecting "On" of [On/Off] in the [Circle] menu.
"ETDRS" is valid for "Radial" and "3D: Macula, 6.0×6.0mm".
"RNFL4", "RNFL6" and "RNFL12" are valid for "3D: Disc, 6.0×6.0mm".
The Measure Image function is based on the theoretical Gullstrand eye
model. If the parameters of the actual patient's eye, such as the diopter
or axial length, are different from the Gullstrand eye model, the mea-
CAUTION
surement results may be different from the length and size in reality. The
clinician will be solely responsible for the diagnoses and treatments
based on the measurement results.
90
DISPLAYING TOMOGRAMS
Page 93

The examples are shown below.
Grid - RNFL6
Grid - Rectangular Grid - ETDRS
Circle-4
91
DISPLAYING TOMOGRAMS
Page 94

The following tables show the correspondence between the above-mentioned grids and scan modes.
Scan
pattern
Function
Rectangular - -
ETDRS - - -
RNFL4 -- --
RNFL6 -- --
RNFL12 - - - -
Circle-4 -----
Circle-12 - - - - -
Line/
5Line
Cross
Radial 3D 3D (V) 3D Wide
92
DISPLAYING TOMOGRAMS
Page 95

The [Grid] menu also has the following four functions.
Function Description
Show Volume Displays the volume of the divided area between selected layers.
Show Invariant Displays the normalized RNFL thickness concerning the distance from the optic
disc.
Show Normative Displays the result of the comparison with Normative data on the Grid.
Reposition Moves the grid on the fundus image to an optional position.
The tables below show the relation between these functions and the usable scan patterns.
Scan
pattern
Function
Show Volume - - -
Show Invariant - - - -
Show Normative - - -
Reposition - -
The [Grid] menu is not displayed for anterior segment.
Line/
5Line
Cross
Radial 3D 3D (V) 3D Wide
93
DISPLAYING TOMOGRAMS
Page 96

Circle
The "Circle" function can be used in the following scan modes.
Valid Invalid
3D: Macula
3D: Optic disc
The Circle function is used to display the tomogram of the circle with an optional radius, whose center is
set near the optic disc.
(When the eye fixation is set at others except "Disc", the circle whose center is at the middle of the scan
area is displayed.)
Function Navigation On Navigation Off
Circle
(can be used with
combination of Overlay/Grid functions.)
Click an optional place on Tomogram display area. You can change the radius with the mouse
wheel button (scroll wheel). You can also change the radius with the slider bar at the bottom of the
tomogram display area.
CAUTION
Line
5 Line Cross
Radial
Click Circle. To turn off the Circle function, click Circle again.
When modifying the data in optic disc analysis (refer to "4.2. Analyzing
the Optic Disc" (P.132), the circle center is calculated again.
3D: Macula (V)
3D: Wide
Radial: Anterior segment
Line: Anterior segment
94
DISPLAYING TOMOGRAMS
Page 97

Disc Modify
Start of the "Disc Modify" mode
The "Disc Modify" function can be used in the following scan modes.
Valid Invalid
3D: Optic disc
(512×128, 6×6mm)
The user can modify "Disc" manually. "Disc segmentation" (refer to P.132) is recalculated according to the
modified "Disc". The "Disc Modify" function can be used only when "Disc segmentation" is applied.
Function Navigation On Navigation Off
Disc Modify
(can be used with combination
of "Shadowgram" of "Overlay".)
Line
5 Line Cross
Radial
3D: Macula
Click [Disc Modify]
[Modify (Point7)] or [Modify
(Point18)].
3D: Optic disc (except "512×128, 6×6mm")
3D: Macula (V)
3D: Wide
Radial: Anterior segment
Line: Anterior segment
To turn off the "Disc Modify" function, use one of the following methods:
• Click [Disc Modify] [Exit Modify].
• Click [Disc Modify] [Cancel].
(The difference between operations
is shown below.)
95
DISPLAYING TOMOGRAMS
Page 98

Using the mouse, drag the modification point to an optional position. The modification point cannot be
Drag an optional modification point. After moving and dragging,
modification is performed.
moved to the outside of the scan area. After dragging the modification point, the image is automatically
modified so that the "Disc" edge line can pass the modification point. (The following figures are the example of "Modify (Point7)".
[Disc Modify]: You can select one of "Modify (Point7)" and "Modify (Point18)".
[Exit Modify]: Saves the modification and exits from the "Disc Modify" mode. After finishing, the recal-
culation result is displayed on "Fundus". When pressing the [Save] button, the result is
saved.
[Cancel]: Discards the modification and exits from the "Disc Modify" mode. The check message
is displayed. Press [OK]. The modification is not validated and the system returns to
the status before "Disc Modify" starts.
CAUTION
When you have reanalyzed the data modified manually, the data modified manually are erased and the "Disc" calculated automatically by the
analysis mode set in the "OCTSet Analysis" tab on P.219 is applied.
96
DISPLAYING TOMOGRAMS
Page 99

3.4.4. A-4: Thickness Graph Area
D-3:
Change Graph and Map to each other.
D-1:
Thickness Graph
D-2:
Maximize
Explanation of Window
In 2D mode, the Thickness graph for the displayed tomogram is indicated.
ID Name Description
D-1 Thickness Graph The graph about the depth between the layers corresponding to the tomo-
gram, which is displayed in the Primary Viewing Area (Window A), is indicated.
D-2 Maximize Maximize this sub-window to the whole screen or return to its original size.
D-3 Change Graph and
Map to each other
In 3D scan and Radial scan, it is possible to display the Thickness map.
Change the displays of Thickness graph and Thickness map to each
other.
How to use the menu
The menu is displayed only for Map. In the "Surface" menu, there are "Colormap", "Fundus Image" and
"Smooth". By using these items, it is possible to specify "Colormap display", "fundus image display" and
"Smoothing of image".
97
DISPLAYING TOMOGRAMS
Page 100

3.4.5. A-5: Tomogram display area/Auxiliary tomogram display area
E-10:
Menu
E-1:
To mo g ram
E-3:
Orientation Markers
E-2:
Scan Position Number/
Scan direction
E-9:
Color change
E-8:
Annotation
E-7:
2 View / Thumbnail Off
E-4:
Slide Scroll
E-5:
Slice Movie Function
E-11:
Overlap success image count
E-12:
Maximize
E-6:
Colormap
The tomogram display area indicates both 2D and 3D scan images. The auxiliary tomogram display area
indicates only the 2D scan images. It is possible to perform registration between the fundus/anterior segment image display area and these two areas by the "Pin-point Registration™" function. For details, refer
to "Pin-point Registration™" on P.121.
Explanation of Window
[Tomogram display area]
The tomogram display area indicates the 2D scan tomogram in 2D mode.
98
DISPLAYING TOMOGRAMS
 Loading...