


查询THS3112供应商
LOW-NOISE, HIGH-SPEED CURRENT FEEDBACK AMPLIFIERS
THS3112
THS3115
SLOS385 – SEPTEMBER 2001
FEATURES
Low Noise
D
– 2.9 pA/√Hz
– 10.8 pA/√Hz
– 2.2 nV/√Hz
Noninverting Current Noise
Inverting Current Noise
Voltage Noise
D Wide Supply Voltage Range ±5 V to ±15 V
D Wide Output Swing
– 25 V
Supply
Output Voltage, R
PP
= 100 Ω, ±15-V
L
D High Output Current, 150 mA (Min)
D High Speed
– 110 MHz (–3 dB, G=1, ±15 V)
– 1550 V/µs Slew Rate (G = 2, ±15 V)
D Low Distortion, G = 2
– -78 dBc (1 MHz, 2 V
, 100-Ω load)
PP
D Low Power Shutdown (THS3115)
– 300-µA Shutdown Quiescent Current Per
Channel
D Thermal Shutdown and Short Circuit
Protection
D Standard SOIC, SOIC PowerP AD , and
TSSOP PowerP AD Package
D Evaluation Module Available
APPLICATIONS
Communication Equipment
D
D Video Distribution
D Motor Drivers
D Piezo Drivers
DESCRIPTION
The THS3112/5 are low-noise, high-speed current
feedback amplifiers, ideal for any application requiring
high output current. The low noninverting current noise
of 2.9 pA/√Hz
pA/√Hz
signal resolution. The THS3112/5 can operate from
±5-V to ±15-V supply voltages, while drawing as little as
4.5 mA of supply current per channel. It offers low
–78-dBc total harmonic distortion driving 2 V
100-Ω load. The THS3115 features a low power
shutdown mode, consuming only 300-µA shutdown
quiescent current per channel. The THS3112/5 is
packaged in a standard SOIC, SOIC PowerP AD, and
TSSOP PowerPAD packages.
and the low inverting current noise of 10.8
increase signal to noise ratios for enhanced
into a
PP
VOLTAGE NOISE AND CURRENT NOISE
100
Hz
Hz
nV/
pA/
10
– Voltage Noise –
– Current Noise –
n
I
V
PowerPAD is a trademark of Texas Instruments.
PRODUCTION DATA information is current as of publication date.
Products conform to specifications per the terms of Texas Instruments
standard warranty. Production processing does not necessarily include
testing of all parameters.
V
n
n
1
10
Please be aware that an important notice concerning availability, standard warranty, and use in critical applications of
Texas Instruments semiconductor products and disclaimers thereto appears at the end of this data sheet.
vs
FREQUENCY
VCC = ±5 V to ±15 V
TA = 25°C
I
n–
I
n+
100
1 K
f – Frequency – Hz
10 K
100 K
THS3112
SOIC (D) AND
SOIC PowerPAD
(TOP VIEW)
1 OUT
1 IN–
1 IN+
V
CC–
1
2
3
4
www.ti.com
(DDA) PACKAGE
V
8
7
6
5
CC+
2 OUT
2 IN–
2 IN+
THS3115
1 OUT
1 IN–
1 IN+
V
CC–
N/C
GND
N/C
SOIC (D) AND
(TOP VIEW)
1
14
2
13
3
12
4
11
5
10
6
7
9
8
V
CC+
2 OUT
2 IN–
2 IN+
N/C
SHUTDOWN
N/C
TSSOP PowerPAD (PWP) PACKAGE
Copyright 2001, Texas Instruments Incorporated
1

THS3112
THS3112EVM
THS3115
SLOS385 – SEPTEMBER 2001
T
A
0°C to 70°C THS3112CD THS3112CDDA THS3115CD THS3115CPWP
–40°C to 85°C THS3112ID THS3112IDDA THS3115ID THS3115IPWP
SOIC-8
(D)
AVAILABLE OPTIONS
PACKAGED DEVICE
SOIC-8 PowerPAD
(DDA)
SOIC-14
(D)
TSSOP-14
(PWP)
EVALUATION
MODULES
THS3112EVM
THS3115EVM
absolute maximum ratings over operating free-air temperature (unless otherwise noted)
Supply voltage, V
Input voltage ± V
. . . . . . . . . . . . . . . . . . . . . . . . . . . . . . . . . . . . . . . . . . . . . . . . . . . . . . . . . . . . . . . . . . . . . . . . . . . . .
CC+
to V
CC–
†
33 V. . . . . . . . . . . . . . . . . . . . . . . . . . . . . . . . . . . . . . . . . . . . . . . . . . . . . . . . . . . . . . .
CC
Output current (see Note 1) 275 mA. . . . . . . . . . . . . . . . . . . . . . . . . . . . . . . . . . . . . . . . . . . . . . . . . . . . . . . . . . . . . . .
Differential input voltage ± 4 V. . . . . . . . . . . . . . . . . . . . . . . . . . . . . . . . . . . . . . . . . . . . . . . . . . . . . . . . . . . . . . . . . . . .
Maximum junction temperature 150°C. . . . . . . . . . . . . . . . . . . . . . . . . . . . . . . . . . . . . . . . . . . . . . . . . . . . . . . . . . . . .
Total power dissipation at (or below) 25°C free-air temperature See Dissipation Ratings Table. . . . . . . . . . .
Operating free-air temperature, T
: Commercial 0°C to 70°C. . . . . . . . . . . . . . . . . . . . . . . . . . . . . . . . . . . . . . . .
A
Industrial –40°C to 85°C. . . . . . . . . . . . . . . . . . . . . . . . . . . . . . . . . . . . . . . . .
Storage temperature, T
: Commercial –65°C to 125°C. . . . . . . . . . . . . . . . . . . . . . . . . . . . . . . . . . . . . . . . . . . .
stg
Industrial –65°C to 125°C. . . . . . . . . . . . . . . . . . . . . . . . . . . . . . . . . . . . . . . . . . . . . . .
Lead temperature 1,6 mm (1/16 inch) from case for 10 seconds 300°C. . . . . . . . . . . . . . . . . . . . . . . . . . . . . . . .
†
Stresses beyond those listed under “absolute maximum ratings” may cause permanent damage to the device. These are stress ratings only, and
functional operation of the device at these or any other conditions beyond those indicated under “recommended operating conditions” is not
implied. Exposure to absolute-maximum-rated conditions for extended periods may affect device reliability.
NOTE 1: The THS3112 and THS31 15 may incorporate a PowerP AD on the underside of the chip. This acts as a heatsink and must be connected
to a thermally dissipating plane for proper power dissipation. Failure to do so may result in exceeding the maximum junction temperature
which could permanently damage the device. See TI Technical Brief SLMA002 for more information about utilizing the PowerPAD
thermally enhanced package.
DISSIPATION RATING TABLE
PACKAGE
D-8 95°C/W
DDA 67°C/W 1.87 W
D-14 66.6°C/W
PWP 37.5°C/W 3.3 W
‡
This data was taken using the JEDEC proposed high-K test PCB.
For the JEDEC low-K test PCB, the θJA is168°C/W for the D-8
package and 122.3°C/W for the D-14 package.
θ
JA
‡
‡
TA = 25°C
POWER RATING
1.32 W
1.88 W
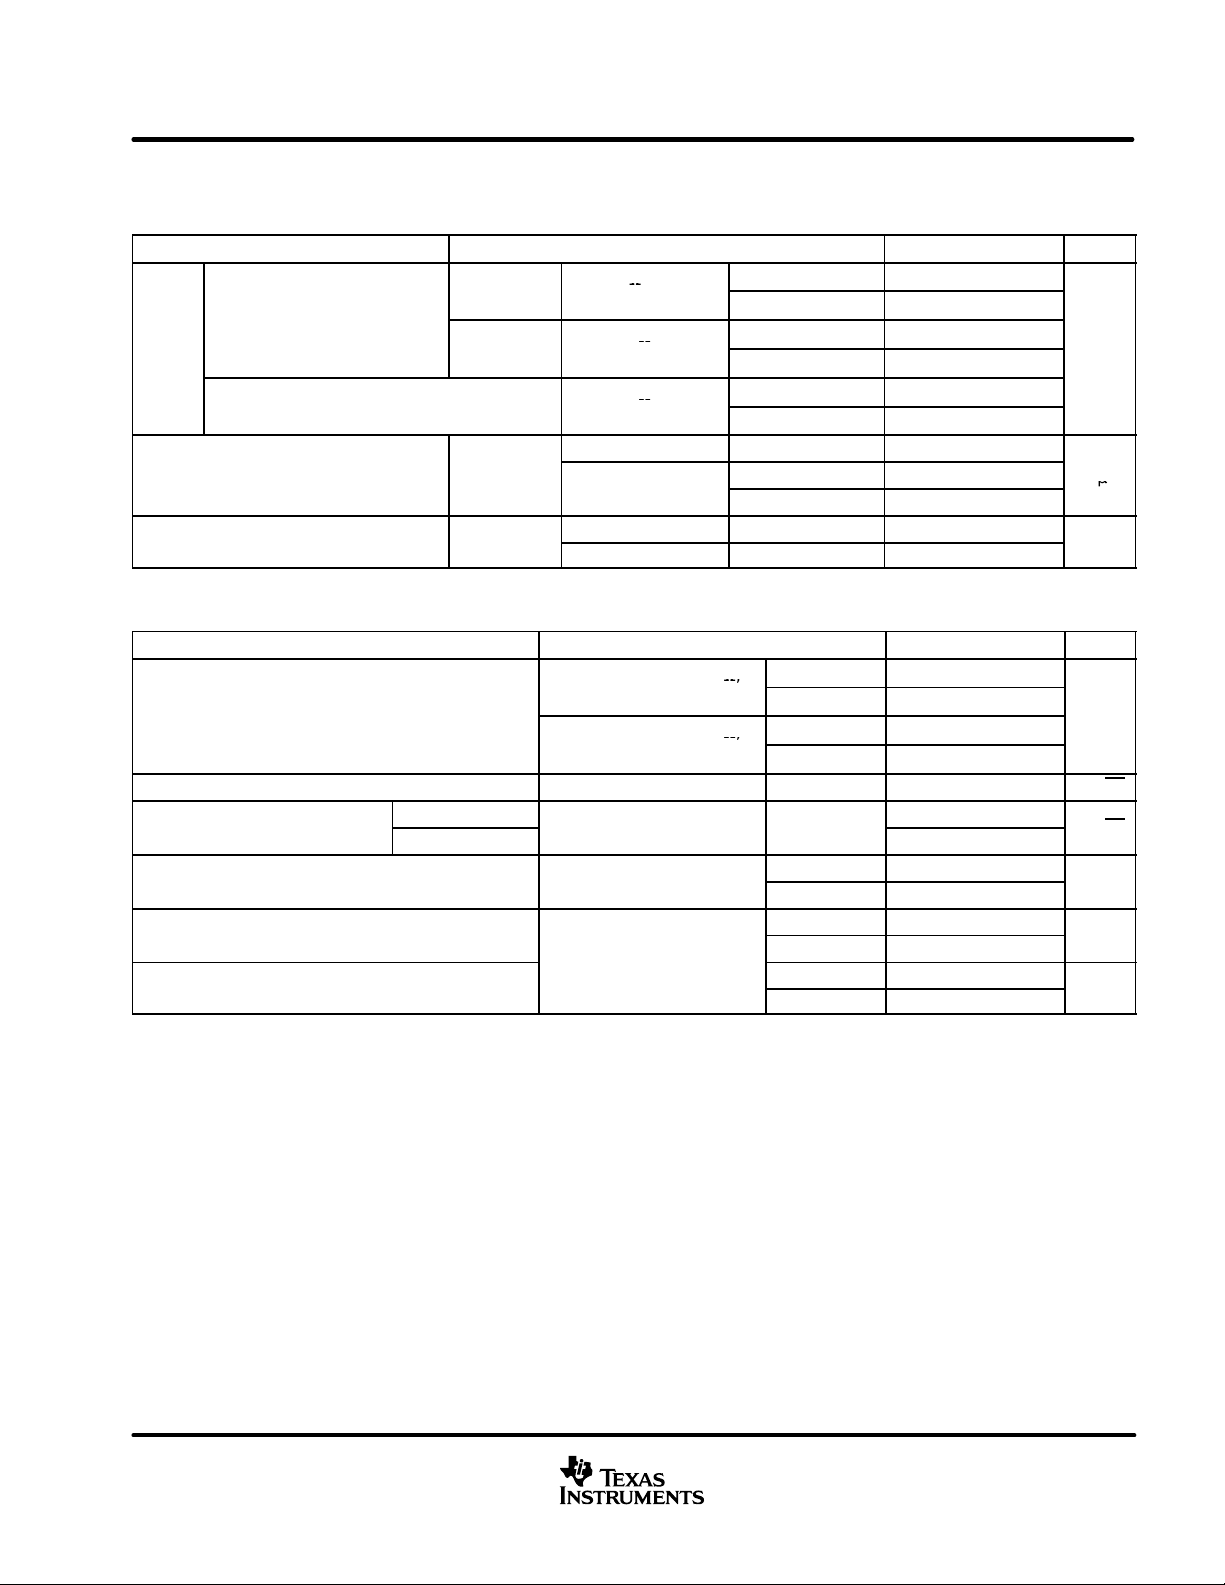
recommended operating conditions
Supply voltage, V
Operating free-air temperature, T
Shutdown pin input levels, relative to the GND pin
2
CC+
to V
CC–
MIN NOM MAX UNIT
Dual supply ±5 ±15
Single supply 10 30
A
C-suffix 0 70
I-suffix –40 85
High level (device shutdown) 2
Low level (device active) 0.8
www.ti.com
V
°C
V
R
F
kΩ,
R
F
750 Ω,
R
F
750 Ω,
SR
Slew rate (see Note 2), G8
R
680 Ω
V/µs
G 2, R
F
680 Ω,
G 2, R
F
680 Ω,
G = 2
f = 1 MHz
G
R
150 Ω
40 IRE modulation
THS3112
THS3115
SLOS385 – SEPTEMBER 2001
electrical characteristics over recommended operating free-air temperature range, TA = 25°C,
= ±15 V, RF = 750 Ω, RL = 100 Ω (unless otherwise noted)
V
CC
dynamic performance
PARAMETER TEST CONDITIONS MIN TYP MAX UNIT
RF = 1 kΩ,
RL = 100 Ω
Small-signal bandwidth (–3 dB)
BW RL = 100 Ω
Bandwidth (0.1 dB)
SR Slew rate (see Note 2), G=8
t
s
NOTE 2: Slew rate is defined from the 25% to the 75% output levels.
Settling time to 0.1%
G = 2
=
F
G = –1
1
G = 1
RF = 750 Ω,
G = 2
RF = 750 Ω,
G = 2
VO = 10 V
VO = 5 V
VO = 2 V
VO = 5 V
noise/distortion performance
PARAMETER TEST CONDITIONS MIN TYP MAX UNIT
G = 2, RF = 680 Ω,
VCC = ±15 V, f = 1 MHz
THD Total harmonic distortion
V
n
I
n
Input voltage noise VCC = ±5 V, ±15 V f = 10 kHz 2.2 nV/√Hz
Input current noise
Crosstalk
Differential gain error
Differential phase error
Noninverting Input
Inverting Input
G = 2, RF = 680 Ω,
VCC = ±5 V, f = 1 MHz
VCC = ±5 V, ±15 V f = 10 kHz
G = 2, f = 1 MHz,
,
VO = 2 Vpp
= 2,
40 IRE modulation
±100 IRE Ramp
NTSC and PAL
PP
PP
PP
PP
L
=
VCC = ±5 V 95
VCC = ±15 V 110
VCC = ±5 V 103
VCC = ±15 V 110
VCC = ±5 V 25
VCC = ±15 V 48
VCC = ±15 V 1550
VCC = ±5 V 820
VCC = ±15 V 1300
VCC = ±5 V 50
VCC = ±15 V 63
V
= 2 V –78
O(PP)
V
= 8 V –75
O(PP)
V
= 2 V –76
O(PP)
V
= 6 V –74
O(PP)
VCC = ±5 V –67
,
VCC = ±15 V –67
VCC = ±5 V 0.01%
VCC = ±15 V 0.01%
VCC = ±5 V 0.011°
VCC = ±15 V 0.011°
2.9
10.8
MHz
V/µs
dBc
pA/√Hz
dBc
ns
www.ti.com
3

THS3112
V
IO
V
±15 V
V
CC
CC
V
CC
V
CC
±15 V
V
±5 V
V
±15 V
THS3115
SLOS385 – SEPTEMBER 2001
electrical characteristics over recommended operating free-air temperature range, TA = 25°C,
= ±15 V, RF = 750 Ω, RL = 100 Ω (unless otherwise noted) (continued)
V
CC
dc performance
PARAMETER TEST CONDITIONS MIN TYP MAX UNIT
Input offset voltage
V
IO
I
IB
Z
OL
Channel offset voltage matching
Offset drift TA = full range 10 µV/°C
– Input bias current
+ Input bias current
Input offset current
Open loop transimpedance
VCC = ±5 V,
=
CC
V
= ±5 V,
= ±5 V,
VCC = ±15 V
VCC = ±5 V,
VCC = ±15 V
TA = 25°C 3 8
TA = full range 13
TA = 25°C 1 3
TA = full range 4
TA = 25°C 23
TA = full range 30
TA = 25°C 0.33 2
TA = full range 3
TA = 25°C 4 22
TA = full range 30
RL = 1 kΩ, 1 MΩ
mV
µA
input characteristics
PARAMETER TEST CONDITIONS MIN TYP MAX UNIT
V
ICR
CMRR Common-mode rejection ratio
R
I
C
i
Input common-mode voltage range
Input resistance
Input capacitance 2 pF
output characteristics
PARAMETER TEST CONDITIONS MIN TYP MAX UNIT
V
O
I
O
r
o
Output voltage swing
Output current drive
Output resistance open loop 14 Ω
G = 4, VI = 1 V,
=
CC
G = 4, VI = 3.4 V,
=
CC
G = 4, VI = 1.025 V,
VCC = ±5 V
G = 4, VI = 3.4 V,
VCC = ±15 V
VCC = ±5 V
VCC = ±15 V
V
= ±5 V,
= ±5 V,
VI = –2.5 V to 2.5 V
= ±15 V,
=
V
VI = –12.5 V to 12.5 V
+ Input 1.5 MΩ
– Input
,
RL = 1 kΩ, TA = 25°C 3.9
RL = 100 Ω,
RL = 1 kΩ, TA = 25°C 13.5
RL = 100 Ω,
RL = 25 Ω,
RL = 25 Ω,
TA = full range
TA = 25°C 56 62
TA = full range 54
TA = 25°C 63 67
TA = full range 60
TA = 25°C 3.6 3.8
TA = full range 3.4
TA = 25°C 12.2 13.3
TA = full range 12
TA = 25°C
±2.5 ±2.7
±12.5 ±12.7
15 Ω
100 130
175 270
V
dB
V
mA
4
www.ti.com

THS3112
THS3115
SLOS385 – SEPTEMBER 2001
electrical characteristics over recommended operating free-air temperature range, TA = 25°C,
= ±15 V, RF = 750 Ω, RL = 100 Ω, GND = 0 V (unless otherwise noted) (continued)
V
CC
power supply
PARAMETER TEST CONDITIONS MIN TYP MAX UNIT
VCC = ±5 V
I
CC
PSRR Power supply rejection ratio
Quiescent current (per amplifier)
VCC = ±15 V
VCC = ±5 V
VCC = ±15 V
shutdown characteristics (THS3115 only)
PARAMETER TEST CONDITIONS MIN TYP MAX UNIT
I
CC(SHDN)
t
DIS
t
EN
I
IL(SHDN)
I
IH(SHDN)
NOTE 3: Disable/enable time is defined as the time from when the shutdown signal is applied to the SHDN pin to when the supply current has
Shutdown quiescent current (per channel) V
Disable time (see Note 3) VCC = ±15 V 0.1 µs
Enable time (see Note 3) VCC = ±15 V 0.4 µs
Shutdown pin input bias current for power up VCC = ±5 V, ±15 V, V
Shutdown pin input bias current for power down VCC = ±5 V, ±15 V, V
reached half of its final value.
= 0 V, VCC = ±5 V, ±15 V 0.3 0.45 mA
GND
TA = 25°C 4.4 5.5
TA = full range 6
TA = 25°C 4.9 6.5
TA = full range 7.5
TA = 25°C 53 60
TA = full range 50
TA = 25°C 68 74
TA = full range 66
= 0 V 18 25 µA
(SHDN)
= 3.3 V 110 130 µA
(SHDN)
mA
dB
TYPICAL CHARACTERISTICS
Table of Graphs
FIGURE
Small signal closed loop gain vs Frequency 1 – 11, 13, 14
Gain and phase vs Frequency 12
Small signal closed loop noninverting gain vs Frequency 15, 16
Small signal closed loop inverting gain vs Frequency 17, 18
Small and large signal output vs Frequency 19, 20
Harmonic distortion
Vn, I
n
CMRR Common-mode rejection ratio vs Frequency 26
PSRR Power supply rejection ratio vs Frequency 27
Crosstalk vs Frequency 28
Z
o
SR Slew rate vs Output voltage step 30
V
IO
I
B
V
O
I
CC
Voltage noise and current noise vs Frequency 25
Output impedance vs Frequency 29
Input offset voltage
Input bias current vs Free-air temperature 33
Output voltage vs Output current 34, 35
Output voltage headroom vs Output current 36
Supply current (per channel) vs Supply voltage 37
Shutdown response 38
vs Frequency 21, 22
vs Peak–to–peak output voltage
vs Free-air temperature 31
vs Common-mode input voltage
23, 24
32
www.ti.com
5

THS3112
THS3115
SLOS385 – SEPTEMBER 2001
TYPICAL CHARACTERISTICS
SMALL SIGNAL CLOSED LOOP GAIN
vs
3
0
–3
–6
–9
–12
Small Signal Closed Loop Gain – dB
–15
0.1 1 10 100 1000
FREQUENCY
RF = 750 Ω
RF = 1.2 kΩ
G = –1,
VCC = ±5 V,
RL = 100 Ω
f – Frequency – MHz
RF = 560 Ω
Figure 1
SMALL SIGNAL CLOSED LOOP GAIN
vs
FREQUENCY
RF = 560 Ω
RF = 750 Ω
G = –4,
VCC = ±5 V,
RL = 100 Ω
1
f – Frequency – MHz
RF = 430 Ω
10 100 1000
Small Signal Closed Loop Gain – dB
15
12
9
6
3
0
–3
0.1
SMALL SIGNAL CLOSED LOOP GAIN
vs
3
0
–3
–6
–9
–12
Small Signal Closed Loop Gain – dB
–15
0.1 1 10 100 1000
FREQUENCY
RF = 750 Ω
RF = 1.2 kΩ
G = –1,
VCC = ±15 V,
RL = 100 Ω
f – Frequency – MHz
RF = 560 Ω
Figure 2
SMALL SIGNAL CLOSED LOOP GAIN
vs
21
18
15
12
9
6
3
Small Signal Closed Loop Gain – dB
0
0.1 1 10 100 1000
FREQUENCY
RF = 430 Ω
RF = 750 Ω
G = –8,
VCC = ±5 V,
RL = 100 Ω
f – Frequency – MHz
RF = 200 Ω
SMALL SIGNAL CLOSED LOOP GAIN
vs
15
12
9
6
3
0
Small Signal Closed Loop Gain – dB
–3
0.1 1 10 100 1000
FREQUENCY
RF = 560 Ω
RF = 750 Ω
G = –4,
VCC = ±15 V,
RL = 100 Ω
f – Frequency – MHz
RF = 430 Ω
Figure 3
SMALL SIGNAL CLOSED LOOP GAIN
vs
21
18
15
12
9
6
3
Small Signal Closed Loop Gain – dB
0
0.1 1 10 100 1000
FREQUENCY
RF = 750 Ω
G = –8,
VCC = ±15 V,
RL = 100 Ω
f – Frequency – MHz
RF = 200 Ω
RF = 430 Ω
Figure 4
SMALL SIGNAL CLOSED LOOP GAIN
vs
FREQUENCY
Small Signal Closed Loop Gain – dB
2
1
0
–1
–2
–3
–4
–5
–6
0.1 1
G = 1,
VCC = ±5 V,
RL = 100 Ω
RF = 750 Ω
RF = 1.1 kΩ
RF = 1 kΩ
10
f – Frequency – MHz
Figure 7
6
100 1000
Figure 5
SMALL SIGNAL CLOSED LOOP GAIN
vs
FREQUENCY
3
0
–3
–6
G = 1,
VCC = ±15 V,
–9
RL = 100 Ω
Small Signal Closed Loop Gain – dB
–12
0.1 1 10 100 1000
RF = 750 Ω
RF = 910 Ω
RF = 1.1 kΩ
f – Frequency – MHz
Figure 8
www.ti.com
Figure 6
SMALL SIGNAL CLOSED LOOP GAIN
vs
FREQUENCY
RF = 1 kΩ
RF = 750 Ω
G = 2,
VCC = ±5 V,
RL = 100 Ω
1
f – Frequency – MHz
RF = 560 Ω
10
100
Small Signal Closed Loop Gain – dB
8
7
6
5
4
3
2
1
0
0.1
Figure 9
1000

THS3112
THS3115
SLOS385 – SEPTEMBER 2001
TYPICAL CHARACTERISTICS
SMALL SIGNAL CLOSED LOOP GAIN
vs
FREQUENCY
RF = 1 kΩ
G = 2,
VCC = ±15 V,
RL = 100 Ω
1
f – Frequency – MHz
RF = 560 Ω
RF = 750 Ω
10 100 1000
Small Signal Closed Loop Gain – dB
9
6
3
0
–3
–6
–9
0.1
Figure 10
SMALL SIGNAL CLOSED LOOP GAIN
vs
FREQUENCY
Small Signal Closed Loop Gain – dB
21
18
15
12
9
6
3
0
0.1
RF = 430 Ω
RF = 750 Ω
G = 8,
VCC = ±5 V,
RL = 100 Ω
1
f – Frequency – MHz
10
RF = 200 Ω
100 1000
Figure 13
SMALL SIGNAL CLOSED LOOP GAIN
vs
15
12
9
6
3
0
Small Signal Closed Loop Gain – dB
–3
0.1 1 10 100 1000
FREQUENCY
RF = 560 Ω
RF = 750 Ω
G = 4,
VCC = ±15 V,
RL = 100 Ω
f – Frequency – MHz
RF = 430 Ω
RF = 1 kΩ
Figure 11
SMALL SIGNAL CLOSED LOOP GAIN
vs
21
18
15
12
9
6
3
Small Signal Closed Loop Gain – dB
0
0.1 1 10 100 1000
FREQUENCY
RF = 750 Ω
RF = 430 Ω
G = 8,
VCC = ±15 V,
RL = 100 Ω
f – Frequency – MHz
RF = 200 Ω
Figure 14
GAIN AND PHASE
vs
FREQUENCY
RF = 560 Ω
RF = 750 Ω
G = 4,
VCC = ±15 V,
RL = 100 Ω
1
f – Frequency – MHz
RF = 430 Ω
RF = 1 kΩ
10
Gain and Phase – dB
15
12
9
6
3
0
–3
0.1
Figure 12
SMALL SIGNAL CLOSED LOOP
NONINVERTING GAIN
vs
RF = 560 Ω
RF = 750 Ω
RF = 1 kΩ
VCC = ±5 V,
RL = 100 Ω
f – Frequency – MHz
FREQUENCY
RF = 250 Ω
20
15
10
5
0
–5
–10
–15
10 100 1000
Small Signal Closed Loop Non Inverting Gain – dB
Figure 15
100 1000
SMALL SIGNAL CLOSED LOOP
NONINVERTING GAIN
vs
RF = 430 Ω
RF = 750 Ω
RF = 1 kΩ
VCC = ±5 V,
RL = 100 Ω
f – Frequency – MHz
FREQUENCY
RF = 200 Ω
21
18
15
12
9
6
3
0
–3
–6
–9
–12
–15
10 100 1000
Small Signal Closed Loop Non Inverting Gain – dB
Figure 16
SMALL SIGNAL CLOSED LOOP
INVERTING GAIN
vs
RF = 560 Ω
RF = 750 Ω
VCC = ±5 V,
RL = 100 Ω
f – Frequency – MHz
FREQUENCY
RF = 430 Ω
21
18
15
12
9
6
3
0
–3
–6
–9
–12
–15
Small Signal Closed Loop Inverting Gain – dB
10 100 1000
Figure 17
www.ti.com
SMALL SIGNAL CLOSED LOOP
INVERTING GAIN
vs
RF = 560 Ω
RF = 750 Ω
VCC = ±15 V,
RL = 100 Ω
f – Frequency – MHz
FREQUENCY
RF = 430 Ω
21
18
15
12
9
6
3
0
–3
–6
–9
–12
–15
Small Signal Closed Loop Inverting Gain – dB
10 100 1000
Figure 18
7

THS3112
THS3115
SLOS385 – SEPTEMBER 2001
TYPICAL CHARACTERISTICS
SMALL AND LARGE SIGNAL OUTPUT
vs
18
)
PP
(V
12
6
0
–6
–12
–18
Small and Large Signal Output – dB
–24
0.1 1 10 100 1000
FREQUENCY
4 V
VCC = ±5 V, G = 2
PP
RF = 680 Ω, RL = 100 Ω
2 V
PP
1.125 V
PP
0.711 V
PP
0.4 V
PP
0.125 V
PP
f – Frequency – MHz
Figure 19
HARMONIC DISTORTION
vs
–20
–40
–60
–80
Harmonic Distortion – dB
–100
5th Harmonic
–120
0.1 1 10 100
FREQUENCY
G = 2,
RF = 680 Ω,
RL 100 Ω,
VCC = ±15 V,
V
= 2 V
O(PP)
f – Frequency – MHz
2nd Harmonic
3rd Harmonic
4th Harmonic
SMALL AND LARGE SIGNAL OUTPUT
vs
4 V
PP
f – Frequency – MHz
FREQUENCY
VCC = ±15 V, G = 2
RF = 680 Ω, RL = 100 Ω
2 V
PP
1.125 V
PP
0.711 V
PP
0.4 V
PP
0.125 V
PP
18
)
PP
12
6
0
–6
–12
–18
Small and Large Signal Output – dB (V
–24
0.1 1 10 100 1000
Figure 20
HARMONIC DISTORTION
vs
PEAK-TO-PEAK OUTPUT VOLTAGE
–10
G = 2,
RF = 680 Ω,
RL 100 Ω,
–30
VCC = ±5 V,
f = 1MHz
–50
2nd Harmonic
3rd Harmonic
–70
Harmonic Distortion – dB
–90
–110
012345678
VPP – Peak-to-Peak Output Voltage – V
2nd Harmonic
4th Harmonic
5th Harmonic
HARMONIC DISTORTION
vs
FREQUENCY
–20
G = 2,
RF = 680 Ω,
RL 100 Ω,
VCC = ±5 V,
–40
VO = 2 V
PP
Harmonic Distortion – dB
–60
–80
–100
–120
3rd Harmonic
4th Harmonic
5th Harmonic
0.1 1 10 100
f – Frequency – MHz
2nd Harmonic
Figure 21
HARMONIC DISTORTION
vs
PEAK-TO-PEAK OUTPUT VOLTAGE
–70
2nd Harmonic
–80
–90
–100
Harmonic Distortion – dB
–110
0123456789
VPP – Peak-to-Peak Output Voltage – V
3rd Harmonic
5th Harmonic
4th Harmonic
G = 2,
RF = 680 Ω,
RL 100 Ω,
VCC = ±15 V,
f = 1MHz
Figure 22
VOLTAGE NOISE AND CURRENT NOISE
vs
FREQUENCY
Hz
nV/
– Voltage Noise –
V
100
Hz
pA/
10
– Current Noise –
V
n
n
I
1
10
VCC = ±5 V to ±15 V
TA = 25°C
I
n+
n
100
f – Frequency – Hz
I
n–
1 K
10 K
Figure 25
8
100 K
Figure 23
COMMON-MODE REJECTION RATIO
vs
80
70
60
50
40
30
20
10
0
CMRR – Common-Mode Rejection Ratio – dB
0.1 1 10 100
FREQUENCY
VCC = ±15 V
VCC = ±5 V
f – Frequency – MHz
G = 2,
RL 100 Ω,
RF = 1 kΩ
Figure 26
www.ti.com
Figure 24
POWER SUPPLY REJECTION RATIO
vs
70
60
50
PSRR – ±5 V
40
30
20
10
0
PSRR – Power Supply Rejection Ratio – dB
0.1 1 10 100
FREQUENCY
PSRR – ±15 V
f – Frequency – MHz
G = 2,
RL = 100 Ω,
RF = 680 Ω
Figure 27

F
THS3112
THS3115
SLOS385 – SEPTEMBER 2001
TYPICAL CHARACTERISTICS
CROSSTALK
vs
FREQUENCY
0
G = 2,
–10
VCC = ±5 V to ±15 V,
RL = 100 Ω,
–20
RF = 680 Ω
–30
–40
–50
–60
Crosstalk – dBc
–70
–80
–90
–100
0.1 1 10 100 1000
f – Frequency – MHz
Figure 28
INPUT OFFSET VOLTAGE
vs
FREE-AIR TEMPERATURE
0
VCC = ±15 V,
VCM = 0 V,
–1
RL = 100 Ω
–2
–3
–4
– Input Offset Voltage – mV
IO
–5
V
–6
–40 –20 0 20 40 60 80
TA – Free-Air Temperature – °C
OUTPUT IMPEDANCE
vs
100
Ω
10
1
– Output Impedance –
0.1
O
Z
0.01
0.1 1 10 100 1000
FREQUENCY
VCC = ±5 V to ±15 V,
RF = 1 kΩ
f – Frequency – MHz
1800
G = 2
1600
RF = 680 Ω,
RL = 100 Ω,
sµ
1400
TA = 25°C
V/
1200
1000
800
600
SR – Slew Rate –
400
200
0
024681012
Figure 29
INPUT OFFSET VOLTAGE
vs
COMMON-MODE INPUT VOLTAGE
10
5
0
–5
– Input Offset Voltage – mV
–10
IO
V
–15
85
–15 –10 –50 5 1015
VCM – Common-Mode Input Voltage – V
VCC = ±15 V,
TA = 25°C,
RL= 100 Ω
9
8
Aµ
7
6
5
4
VCC = ±5 V, I
3
– Input Bias Current –
2
IB
I
1
0
–40 –20 0 20 40 60 80
SLEW RATE
vs
OUTPUT VOLTAGE STEP
VCC = ±15 V
VCC = ±5 V
VO – Output Voltage Step – V
Figure 30
INPUT BIAS CURRENT
vs
FREE-AIR TEMPERATURE
VCC = ±15 V, I
IB–
VCC = ±5 V, I
TA – Free-Air Temperature – °C
IB+
VCC = ±15 V, I
IB–
IB+
85
Figure 31
OUTPUT VOLTAGE
vs
OUTPUT CURRENT
5
4.5
4
3.5
3
2.5
2
1.5
– Output Voltage – V
O
V
VCC = ±5 V,
1
RF = 750 Ω
0.5
TA = 25°C
0
0 50 100 150 200 250
IO – Output Current – mA
Figure 34
Figure 32
OUTPUT VOLTAGE
vs
15
13.5
12
– Output Voltage – V
10.5
O
V
9
OUTPUT CURRENT
VCC = ±15 V,
RF = 750 Ω
TA = 25°C
0 50 100 150 200 250
IO – Output Current – mA
Figure 35
www.ti.com
Figure 33
OUTPUT VOLTAGE HEADROOM
vs
OUTPUT CURRENT
5
|VCC| – |VO|
4.5
VCC = ±15 V and ±5 V
TA = 25°C
4
G = 4,
3.5
RF = 750 Ω
3
2.5
2
1.5
1
Output Voltage Headroom – |V|
0.5
0
0 50 100 150 200 250
IO – Output Current – |mA|
Figure 36
9

THS3112
THS3115
SLOS385 – SEPTEMBER 2001
TYPICAL CHARACTERISTICS
SUPPLY CURRENT (PER CHANNEL)
vs
SUPPLY VOLTAGE
TA = 85°C
TA = 25°C
TA = –40°C
0 2.5 5 7.5 10 12.5 15
VCC – Supply Voltage – ±V
– Supply Current (Per Channel) – mA
CC
I
16
14
12
10
8
6
4
2
0
Figure 37
SHUTDOWN RESPONSE
5
4
3
2
1
– Output Voltage – V
O
0
V
VCC = ±15 V
G = 8
RF = 330 Ω
RF = 100 Ω
VI = 0.5 VDC
012345678910
t – Time – ns
Figure 38
2
1.5
1
0.5
0
Shutdown Pulse – V
10
www.ti.com

THS3112
THS3115
SLOS385 – SEPTEMBER 2001
MECHANICAL DATA
D (R-PDSO-G**) PLASTIC SMALL-OUTLINE PACKAGE
14 PINS SHOWN
0.050 (1,27)
14
1
0.069 (1,75) MAX
A
0.020 (0,51)
0.014 (0,35)
0.010 (0,25)
0.004 (0,10)
DIM
8
7
PINS **
0.010 (0,25)
0.157 (4,00)
0.150 (3,81)
M
0.244 (6,20)
0.228 (5,80)
Seating Plane
0.004 (0,10)
8
14
0.008 (0,20) NOM
0°–ā8°
16
Gage Plane
0.010 (0,25)
0.044 (1,12)
0.016 (0,40)
A MAX
A MIN
NOTES: A. All linear dimensions are in inches (millimeters).
B. This drawing is subject to change without notice.
C. Body dimensions do not include mold flash or protrusion, not to exceed 0.006 (0,15).
D. Falls within JEDEC MS-012
0.197
(5,00)
0.189
(4,80)
www.ti.com
0.344
(8,75)
0.337
(8,55)
0.394
(10,00)
0.386
(9,80)
4040047/D 10/96
11

THS3112
THS3115
SLOS385 – SEPTEMBER 2001
MECHANICAL INFORMATION
DDA (S–PDSO–G8) Power PADt PLASTIC SMALL-OUTLINE
1,27
85
14
4,98
4,80
0,49
0,35
3,99
3,81
1,68 MAX
M
0,10
6,20
5,84
Seating Plane
Thermal Pad
(See Note D)
0,20 NOM
0°–8°
Gage Plane
0,25
0,89
0,41
1,55
1,40
NOTES: A. All linear dimensions are in millimeters.
B. This drawing is subject to change without notice.
C. Body dimensions do not include mold flash or protrusion not to exceed 0,15.
D. The package thermal performance may be enhanced by bonding the thermal pad to an external thermal plane.
This pad is electrically and thermally connected to the backside of the die and possibly selected leads.
PowerPAD is a trademark of Texas Instruments.
0,13
0,03
0,10
4202561/A 02/01
12
www.ti.com

THS3112
THS3115
SLOS385 – SEPTEMBER 2001
MECHANICAL DATA
PWP (R-PDSO-G**) PowerPAD PLASTIC SMALL-OUTLINE
20 PINS SHOWN
0,65
20
1
1,20 MAX
0,30
0,19
11
4,50
4,30
10
A
0,15
0,05
PINS **
DIM
M
0,10
6,60
6,20
Seating Plane
0,10
1614
Thermal Pad
(See Note D)
20
0,15 NOM
0°–ā8°
Gage Plane
0,25
0,75
0,50
2824
A MAX
A MIN
NOTES: A. All linear dimensions are in millimeters.
B. This drawing is subject to change without notice.
C. Body dimensions do not include mold flash or protrusions.
D. The package thermal performance may be enhanced by bonding the thermal pad to an external thermal plane.
This pad is electrically and thermally connected to the backside of the die and possibly selected leads.
E. Falls within JEDEC MO-153
PowerPAD is a trademark of Texas Instruments Incorporated.
5,10
4,90
5,10
4,90
6,60
6,40
7,90
7,70
9,80
9,60
4073225/F 10/98
www.ti.com
13

IMPORTANT NOTICE
Texas Instruments Incorporated and its subsidiaries (TI) reserve the right to make corrections, modifications,
enhancements, improvements, and other changes to its products and services at any time and to discontinue
any product or service without notice. Customers should obtain the latest relevant information before placing
orders and should verify that such information is current and complete. All products are sold subject to TI’s terms
and conditions of sale supplied at the time of order acknowledgment.
TI warrants performance of its hardware products to the specifications applicable at the time of sale in
accordance with TI’s standard warranty . Testing and other quality control techniques are used to the extent TI
deems necessary to support this warranty . Except where mandated by government requirements, testing of all
parameters of each product is not necessarily performed.
TI assumes no liability for applications assistance or customer product design. Customers are responsible for
their products and applications using TI components. T o minimize the risks associated with customer products
and applications, customers should provide adequate design and operating safeguards.
TI does not warrant or represent that any license, either express or implied, is granted under any TI patent right,
copyright, mask work right, or other TI intellectual property right relating to any combination, machine, or process
in which TI products or services are used. Information published by TI regarding third–party products or services
does not constitute a license from TI to use such products or services or a warranty or endorsement thereof.
Use of such information may require a license from a third party under the patents or other intellectual property
of the third party , or a license from TI under the patents or other intellectual property of TI.
Reproduction of information in TI data books or data sheets is permissible only if reproduction is without
alteration and is accompanied by all associated warranties, conditions, limitations, and notices. Reproduction
of this information with alteration is an unfair and deceptive business practice. TI is not responsible or liable for
such altered documentation.
Resale of TI products or services with statements different from or beyond the parameters stated by TI for that
product or service voids all express and any implied warranties for the associated TI product or service and
is an unfair and deceptive business practice. TI is not responsible or liable for any such statements.
Mailing Address:
Texas Instruments
Post Office Box 655303
Dallas, Texas 75265
Copyright 2002, Texas Instruments Incorporated

Copyright © Each Manufacturing Company.
All Datasheets cannot be modified without permission.
This datasheet has been download from :
www.AllDataSheet.com
100% Free DataSheet Search Site.
Free Download.
No Register.
Fast Search System.
www.AllDataSheet.com
 Loading...