

Page 1

User Manual
Scope MultimeterGuided Component
Tests
Tools
OBD-II/EOBD
Previous Vehicles
and Data
Scanner
TSBs
ZEEMSGB341A Rev. A
Page 2

Legal Information
IMPORTANT:
Trademarks
Snap-on, ShopStream Connect, and MODIS are trademarks registered in the United States and other countries, of
Snap-on Incorporated. All other marks are trademarks or registered trademarks of their respective holders.
Copyright Information
© 2016 Snap-on Incorporated. All rights reserved.
Disclaimer of Warranties and Limit ation of Liabilities
All pictures and illustrations shown are for reference purposes only. All information, specifications and illustrations in
this manual are based on the latest information available at the time of printing and are subject to change without
notice. While the authors have taken due care in the preparation of this manual, nothing contained herein:
• Modifies or alters in any way the standard terms and conditions of the purchase, lease, or rental agreement
under the terms of which the equipment to which this manual relates was acquired.
• Increases in any way the liability to the customer or to third parties.
Snap-on
®
reserves the right to make changes at any time without notice.
Before operating or maintaining this unit, please read this manual carefully paying extra attention to the safety
warnings and precautions.
Contact Information (United Kingdom)
Visit our websites at:
https://www1.snapon.com/diagnostics/UK/Diagnostics.htm
ShopStream Connect
https://www1.snapon.com/ukssc
For Technical Assistance
Phone / E-mail:
+44 (0) 845 601 4736 / diagnosticsUKproductsupport@snapon.com
For technical assistance in all other markets, contact your selling agent.
ZEEMSGB341A Rev. A 31-H-16 GB
i
Page 3

Content s
Safety Information................................................................................................................v
Chapter 1: Using This Manual.............................................................................................1
Conventions............................................................................................................................ 1
Bold Text.......................................................................................................................... 1
Symbols ...........................................................................................................................1
Terminology .....................................................................................................................1
Notes and Important Messages ....................................................................................... 2
Hyperlinks ........................................................................................................................2
Procedures....................................................................................................................... 2
Chapter 2: Introduction........................................................................................................3
Control Buttons.......................................................................................................................3
Data and Power Connections................................................................................................. 4
Battery Pack and Stand..........................................................................................................5
Power Sources ....................................................................................................................... 6
Internal Battery Pack........................................................................................................ 6
AC/DC Power Supply....................................................................................................... 6
Vehicle Power ..................................................................................................................6
Technical Specifications ......................................................................................................... 7
Chapter 3: Basic Operation and Navigation ......................................................................8
Turning On/Off and Emergency Shutdown............................................................................. 8
Turning On .......................................................................................................................8
Turning Off .......................................................................................................................8
Emergency Shutdown...................................................................................................... 9
Basic Navigation.....................................................................................................................9
Home Screen Layout .......................................................................................................9
Title Bar.......................................................................................................................... 10
Home Screen Icons ....................................................................................................... 11
Common Toolbar Control Icons ..................................................................................... 12
Scroll Bar .......................................................................................................................13
Screen Messages.................................................................................................................13
System Messages.......................................................................................................... 13
Communication Messages............................................................................................. 14
Data Cable Connection ........................................................................................................ 14
Chapter 4: Scanner.............................................................................................................16
Screen Layout and Toolbar Icons......................................................................................... 16
Screen Layout................................................................................................................ 16
Scanner Control Icons ................................................................................................... 17
Scanner Demonstration Program .........................................................................................17
Scanner Operation ..............................................................................................................18
Connecting the Data Cable............................................................................................18
Vehicle Identification ......................................................................................................18
ii
Page 4

System Selection ...........................................................................................................20
System Main Menu Options........................................................................................... 25
Exiting Scanner ....................................................................................................................39
SureTrack .............................................................................................................................40
SureTrack Operation...................................................................................................... 40
Chapter 5: OBD-II/EOBD ....................................................................................................47
Basic Operations .................................................................................................................. 47
Screen Layout and Toolbar Controls .............................................................................47
Connecting the Data Cable............................................................................................47
Saving and Reviewing Data Files .................................................................................. 47
OBD-II/EOBD Menu ............................................................................................................. 47
OBD Health Check......................................................................................................... 48
OBD Direct .....................................................................................................................50
Chapter 6: TSBs..................................................................................................................57
Operation..............................................................................................................................57
Chapter 7: Guided Component Tests...............................................................................61
Extras Menu (Top Level Menu Items) .................................................................................. 61
Power User Tests .......................................................................................................... 61
How To Guide ................................................................................................................62
Features and Benefits....................................................................................................62
Index ..............................................................................................................................62
Screen Layout and Icons...................................................................................................... 63
Screen Layout................................................................................................................ 63
Guided Component Tests Control Icons ........................................................................ 63
Operation..............................................................................................................................65
Component Information ................................................................................................. 66
Tests .............................................................................................................................. 68
Saving and Reviewing Data Files .................................................................................. 70
Chapter 8: Previous Vehicles and Data............................................................................71
Previous Vehicles and Data Menu ....................................................................................... 71
Vehicle History ............................................................................................................... 71
View Saved Data ........................................................................................................... 72
Viewing Codes and Code Scan Results ........................................................................ 73
Delete Saved Data......................................................................................................... 75
Chapter 9: Scope Multimeter.............................................................................................76
Overview............................................................................................................................... 76
Digital Multimeter (DMM) ............................................................................................... 76
Graphing Multimeter (GMM) .......................................................................................... 77
Lab Scope...................................................................................................................... 78
Tests and Capabilities (Quick Reference) ............................................................................79
Test Leads and Accessories ................................................................................................81
Channel 1 Lead.............................................................................................................. 81
Channel 2 Lead.............................................................................................................. 81
Alligator Clips and Probes..............................................................................................82
Secondary Ignition Coil Adapter Lead and Clip-on Adapter
(optional) ..............................................................................................................82
iii
Page 5

Low Amp Current Probe (optional).................................................................................83
Pressure Transducers and Adapters (optional) ............................................................. 83
General Information..............................................................................................................84
Scope Multimeter Screen Layout and Features............................................................. 84
Measurement Out of Range (Alert) ................................................................................ 86
Operation and Controls ........................................................................................................87
Test Lead / Probe Connection ....................................................................................... 87
Test Lead / Probe Calibration ........................................................................................ 88
Control Panel and Settings ............................................................................................ 89
Secondary Ignition Testing .......................................................................................... 104
Optional Settings ................................................................................................................106
Display (Grid on/off) .....................................................................................................106
Divisions.......................................................................................................................107
Saving and Reviewing Scope / Multimeter Data Files ........................................................ 110
Data Buffer................................................................................................................... 110
Saving Files .................................................................................................................111
Stopping and Reviewing Data Files ............................................................................. 112
Saving Screens............................................................................................................ 113
Using the Zoom Function .............................................................................................114
General Reference ............................................................................................................ 117
Basic Setup Tips (unknown signal type) ..................................................................... 117
Using Known Good Waveforms ...................................................................................118
Troubleshooting Signals ............................................................................................. 119
Units of Measurement / Conversions ........................................................................... 120
Glossary of Common Terms ....................................................................................... 122
Chapter 10: Tools .............................................................................................................125
Tools Menu.........................................................................................................................125
Connect-to-PC .............................................................................................................126
Configure Shortcut Button............................................................................................ 126
System Information ...................................................................................................... 127
Settings ........................................................................................................................128
Chapter 11: ShopStream Connect..................................................................................143
Chapter 12: Maintenance.................................................................................................147
Cleaning and Inspecting the Diagnostic Tool ..................................................................... 147
Cleaning the Touch Screen ......................................................................................... 147
Battery Pack Service .......................................................................................................... 147
Battery Pack Safety Guidelines ................................................................................... 148
Replacing the Battery Pack.......................................................................................... 149
Disposing of the Battery Pack......................................................................................150
Index..................................................................................................................................151
iv
Page 6

Safety Information
READ ALL INSTRUCTIONS
For your own safety, the safety of others, and to prevent damage to the product and vehicles upon
which it is used, it is important that all instructions and safety messages in this manual and the
accompanying Important Safety Instr uction s manual be read and understood by all persons
operating, or coming into contact with the product, before operating. We suggest you store a copy
of each manual near the product in sight of the operator.
For your safety, read all instructions. Use your diagnostic tools only as described in the tool user’s
manual. Use only manufacturer recommended parts and accessories with your diagnostic tools.
This product is intended for use by properly trained and skilled professional automotive
technicians. The safety messages presented throughout this manual and the accompanying
Important Safety Ins tructions manual are reminders to the operator to exercise extreme care when
using this product.
There are many variations in procedures, techniques, tools, and parts for servicing vehicles, as
well as in the skill of the individual doing the work. Because of the vast number of test applications
and variations in the products that can be tested with this instrument, we cannot possibly
anticipate or provide advice or safety messages to cover every situation. It is the responsibility of
the automotive technician to be knowledgeable of the system being tested. It is essential to use
proper service methods and test procedures. It is important to perform tests in an appropriate and
acceptable manner that does not endanger your safety, the safety of others in the work area, the
equipment being used, or the vehicle being tested.
It is assumed that the operator has a thorough understanding of vehicle systems before using this
product. Understanding of these system principles and operating theories is necessary for
competent, safe and accurate use of this instrument.
Before using the equipment, always refer to and follow the safety messages and applicable test
procedures provided by the manufacturer of the vehicle or equipment being tested. Use the
product only as described in it’s user manual. Use only manufacturer recommended parts and
accessories with your product.
Read, understand and follow all safety messages and instructions in this manual, the
accompanying Important Safety Instr uction s manual, and on the test equipment.
Environmental Conditions:
• This product is intended for indoor use only
• This product is rated for Pollution Degree 2 (normal conditions)
v
Page 7
Safety Information Safety Signal Words
'$1*(5
:$51 ,1*
&$87,21
:$51 ,1*
Safety Signal Words
All safety messages contain a safety signal word that indicates the level of the hazard. An icon,
when present, gives a graphical description of the hazard. Safety Signal words are:
Indicates an imminently hazardous situation which, if not avoided, will result in death or serious
injury to the operator or to bystanders.
Indicates a potentially hazardous situation which, if not avoided, could result in death or serious
injury to the operator or to bystanders.
Indicates a potentially hazardous situation which, if not avoided, may result in moderate or minor
injury to the operator or to bystanders.
Safety Message Conventions
Safety messages are provided to help prevent personal injury and equipment damage. Safety
messages communicate the hazard, hazard avoidance and possible consequences using three
different type styles:
• Normal type states the hazard.
• Bold type states how to avoid the hazard.
• Italic type states the possible consequences of not avoidi ng the ha zard.
An icon, when present, gives a graphical description of the potential hazard.
Safety Message Example
Risk of unexpected vehicle movement.
• Block drive wheels before performing a test with engine runn ing.
A moving vehicle can cause injury.
Important Safety Instructions
For a complete list of safety messages, refer to the accompanying Important Safety Instructions
manual.
SAVE THESE INSTRUCTIONS
vi
Page 8

Chapter 1 Using This Manual
This manual contains tool usage instructions. Some of the illustrations shown in this manual may
contain modules and optional equipment that are not included on your system. Contact your sales
representative for availability of other modules and optional equipment.
1.1 Conventions
The following conventions are used.
1.1.1 Bold Text
Bold emphasis is used in procedures to highlight selectable items such as buttons and menu
options.
Example:
• Press the OK button.
1.1.2 Symbols
Different types of arrows are used.
The “greater than” arrow (>) indicates an abbreviated set of selection instructions.
Example:
• Select Tools > Connect-to-PC.
The example statement abbreviates the following procedure:
1. Select Tools from the home screen.
2. Highlight Connect-to-PC on the Tools menu.
3. Select Connect-to-PC.
The solid arrows (e, c, d, b) are navigational instructions referring to the four directions of the
directional arrow keys.
Example:
• Press the down d arrow.
1.1.3 Terminology
The term “select” means tapping an item on the touch screen, or highlighting a button or menu
item and pressing the Accept, OK, Yes, or other similar button to confirm the selection.
Example:
• Select Brightness.
The above statement abbreviates the following procedure:
1
Page 9

Using This Manual Conventions
NOTE:
IMPORTANT:
IMPORTANT:
1. Navigate to and highlight the Brightness selection.
2. Press the OK, or similar, button.
1.1.4 Notes and Important Messages
The following messages are used.
Notes
A NOTE provides helpful information such as additional explanations, tips, and comments.
Example:
i For additional information refer to...
Important
IMPORTANT indicates a situation which, if not avoided, may result in damage to the test
equipment or vehicle.
Example:
Do not disconnect the data cable while the Scanner is communicating with the ECM.
1.1.5 Hyperlinks
Hyperlinks, or hot links, that take you to other related articles, procedures, and illustrations are
available in electronic documents. Blue colored text indicates a selectable hyperlink.
Example:
Read all applicable before using this tool!
1.1.6 Procedures
An arrow icon in the left-margin area indicates a procedure.
Example:
z To change screen views:
1. Select the Graph icon.
The dropdown menu displays.
2. Select an option from the menu.
The screen layout changes to the format selected.
2
Page 10

Chapter 2 Introduction
Scope MultimeterGuided Component
Tests
Tools
OBD-II/EOBD
Previous Vehicles
and Data
Scanner
TSBs
The MODIS™ Edge is a multi-function tool that combines a Diagnostic Scan Tool with a
two-channel lab scope, graphing multimeter, and the exclusive Snap-on
Tests database into a single hand-held unit.
This chapter introduces the basic features of the Diagnostic Tool, including the control buttons,
data ports, battery pack, and power sources. Technical Specifications are provided at the end of
this chapter.
2.1 Control Buttons
There are four “push type” control buttons and one “thumb pad rocker type” multi-directional
button located on the right side of the Diagnostic Tool. All other Diagnostic Tool operations are
controlled through the touch screen.
®
Guided Component
1
2
3
4
Figure 2-1 Front view
Item Button Description
• To exit a menu or program.
1
N/X or Cancel - Push
type button
• To close an open list and return to the previous
menu or screen.
• To answer “No” when a yes/no choice is given.
• To confirm a selection from a menu or program.
2
a or Accept - Push
Y/
type button
• To select an item that was highlighted using the
direction arrows.
• To advance to the next screen in a series.
• To answer “Yes” when a yes or no choice is
given.
5
3
Page 11
Introduction Data and Power Connections
Item Button Description
Buttons move the cursor or highlight in their
respective direction:
3
Directional - Thumb
pad rocker type buttons
• Up (b)
• Down (d)
• Left (e)
• Right (c)
Programmable function button that can provide a
4
S (Shortcut) - Push type
button
shortcut for performing a variety of routine tasks.
Refer to Configure Shortcut Button‚ on page 126 for
additional information.
5
Power (On/Off) - Push
type button
Turns the Diagnostic Tool on and off. Also, press
and hold for 5 seconds for emergency shutdown.
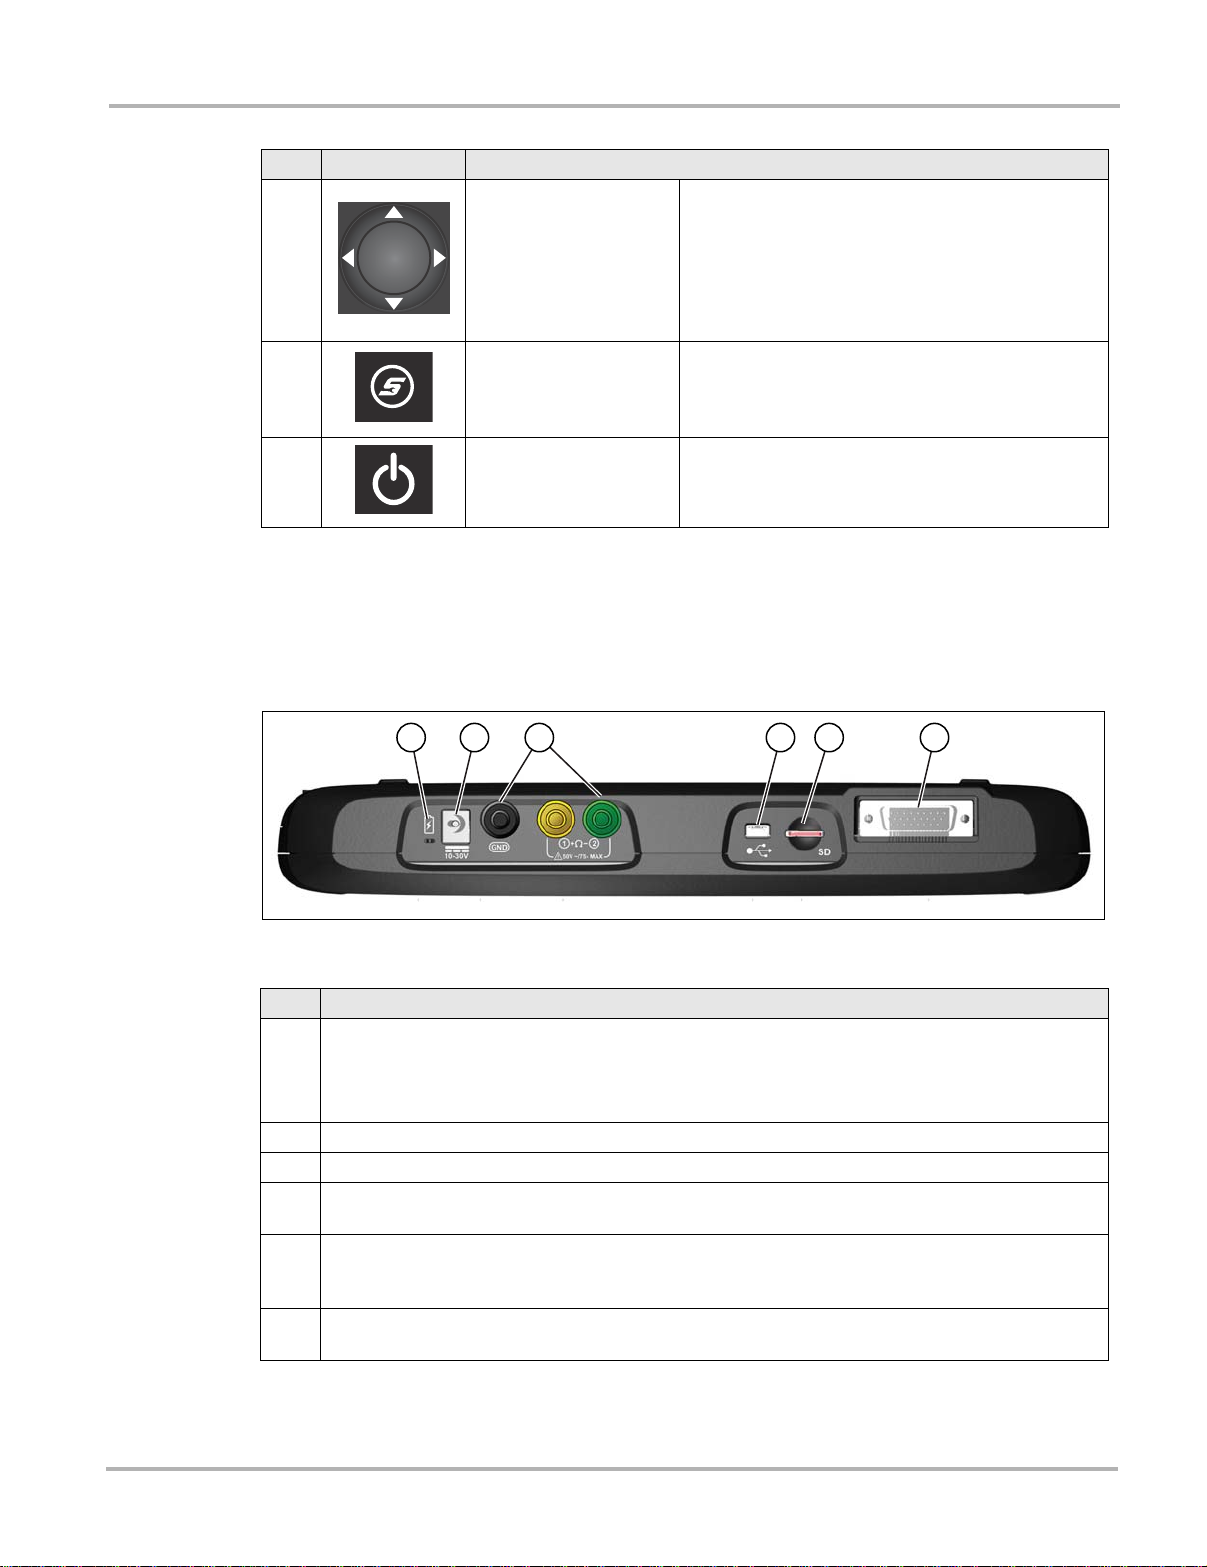
2.2 Data and Power Connections
Connectors and jacks for the scope multimeter, data communication cables and the AC/DC power
supply are located on the top of the Diagnostic Tool.
Item Description
Battery Status Indi ca to r LED
• Green - battery is fully charged
1
• Red - battery is charging
• Amber - indicates there is a battery issue (correct before operating)
2 DC Power Supply Jack - AC/DC power supply connection
3 Scope/Multimeter Jacks - Scope and multimeter lead connections
Mini USB Jack - USB cable connection used to connect the Diagnostic Tool to a personal
4
computer
Micro secure digital (uSD) Card - contains operating system programming. IMPORTANT The
5
uSD card must be installed for the Diagnostic Tool to operate. Do not remove the uSD card
while the Diagnostic Tool is powered on.
Data Cable Connector - Data cable connection used to connect the Diagnostic Tool to a vehicle
6
data link connector
Figure 2-2 Top view
4
Page 12
Introduction Battery Pack and Stand
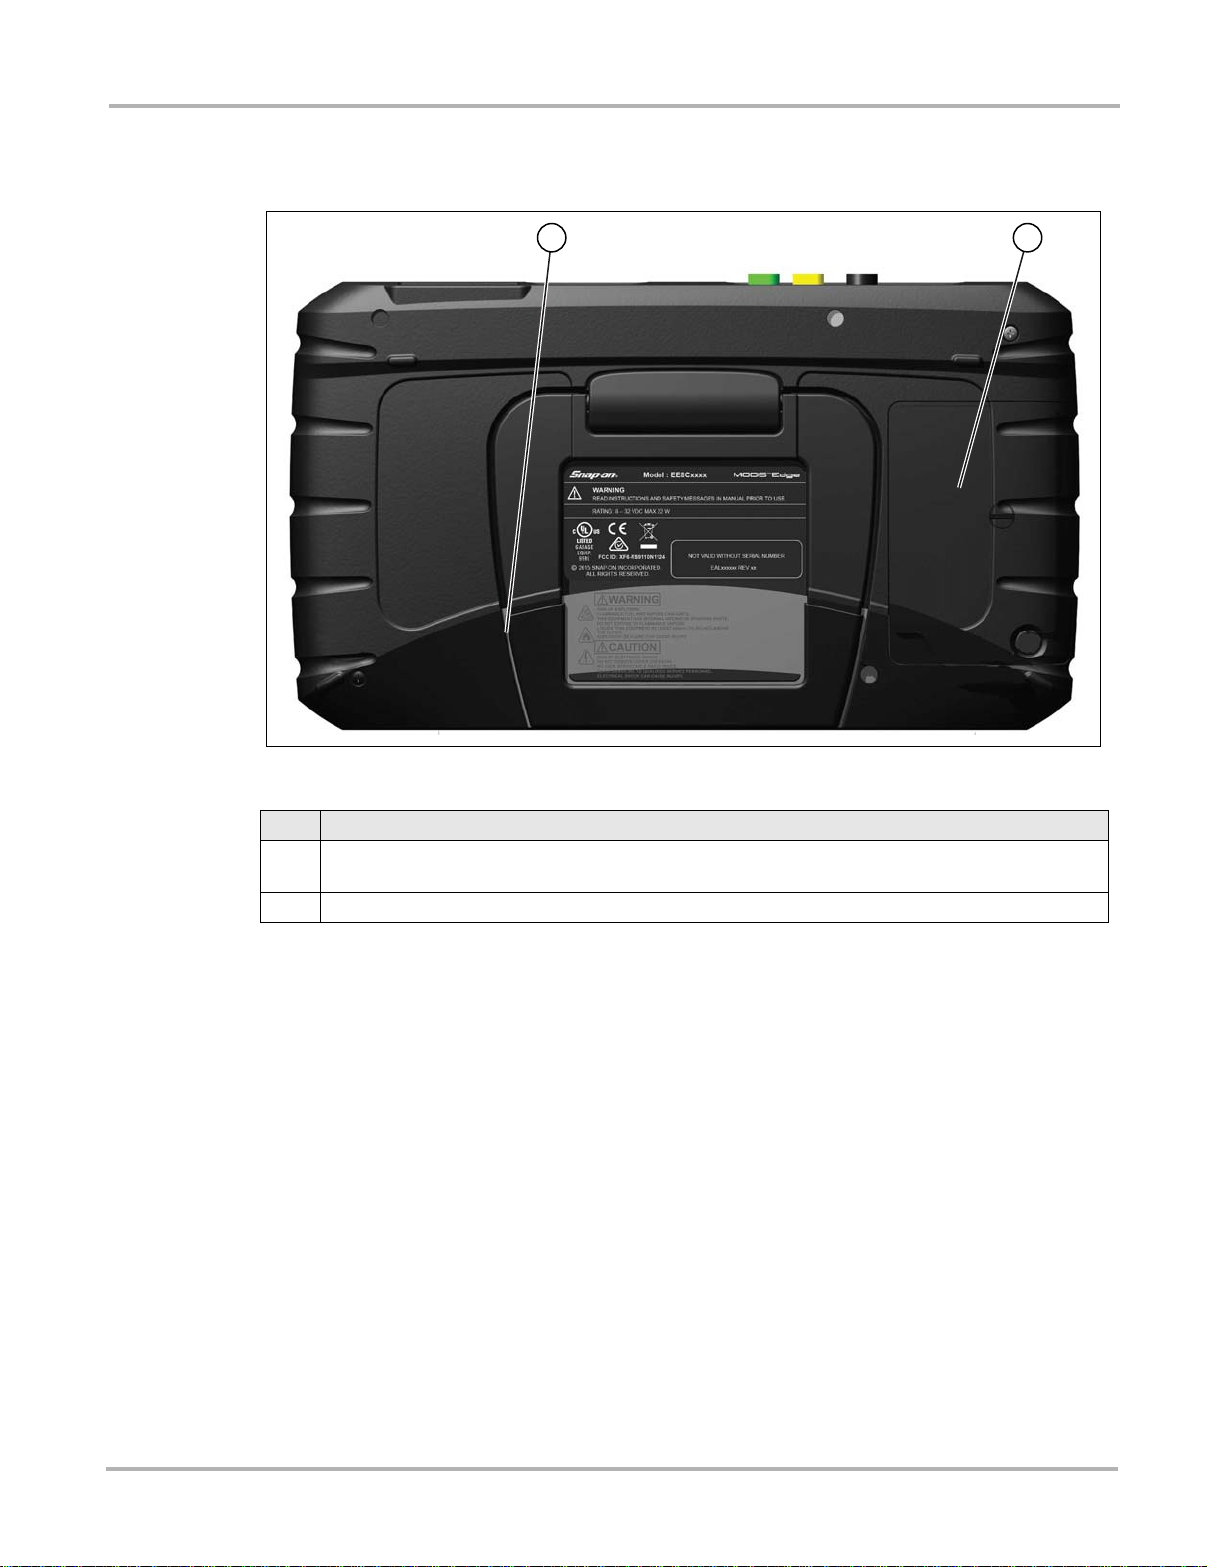
2.3 Battery Pack and St and
Figure 2-3 Rear view
Item Description
Built in-Stand (shown closed) - The built-in stand extends from the back of the Diagnostic Tool
1
and clips into the Diagnostic Tool for storage.
2 Battery Cover
5
Page 13

Introduction Power Sources
IMPORTANT:
IMPORTANT:
2.4 Power Sources
Your Diagnostic Tool can receive power from any of the following sources:
• Internal Battery Pack
• AC/DC Power Supply
• Vehicle Power
2.4.1 Internal Battery Pack
The Diagnostic Tool can be powered from the internal rechargeable battery pack. A fully charged
battery provides sufficient power for about 3 hours of continuous operation.
Battery charging occurs when the Diagnostic Tool is connected to the AC/DC Power Supply and
to a live AC power source.
The Battery Status Indicator LED (located next to the DC power supply jack) indicates battery
status (Figure 2-3).
• Green - indicates battery is fully charged
• Red - indicates battery is charging
• Amber - indicates a battery issue. This is usually caused by excessive battery temperature
(above 104°F/40°C), which disables charging. Allow the Diagnostic Tool to cool down before
continuing operation.
2.4.2 AC/DC Power Supply
The Diagnostic Tool can be powered from a standard AC outlet using the AC/DC power supply.
The connector on the end of the output cable of the AC/DC power supply attaches to the DC
power supply input jack on top of the Diagnostic Tool. Use only the AC/DC power supply provided.
Never connect the AC/DC power supply to the DC power supply input on the Diagnostic Tool when
the Diagnostic Tool is communicating with a vehicle.
2.4.3 V e hicle Power
All OBD-II/EOBD vehicles have vehicle battery power (B+) available on the DLC. The Diagnostic
Tool is powered through the Data Cable when connected to the vehicle DLC. A green LED
indicator on the DLC end of the data cable, illuminates when power is being supplied to the cable.
If the LED fails to illuminate, check that the data cable is properly connected and then check the
DLC power circuit. See Data Cable Connection‚ on page 14 for additional data cable information.
An optional power cable is required when testing non-OBD-II/EOBD models that do not have
vehicle battery power (B+) available on the DLC. Contact your sales representative for availability.
Never connect the optional power cable to the DC power supply input on the Diagnostic Tool when
the Diagnostic Tool is communicating with a vehicle.
6
Page 14

Introduction T echnical Specifications
2.5 T echnical S pecifications
Item Description / Specification
Touch Screen
Display
Meter
Battery
Power Supply
DC Operating V oltage
Width
Height
Depth
Weight (including
battery):
Operating Temperature
Range (ambient)
Storage Temperature
(ambient)
Operating Altitude
Environmental
Conditions
Resistive Touch Panel
8.0 inch diagonal, Color LCD
800 x 480 resolution SWVGA
Category 1
Rechargeable lithium-ion battery pack
Approximately 3 hour run time
Approximately 5 hour charge time
Supply Rating; 15VDC, 2A
10 to 30VDC
11.06 in. (281.0 mm)
6.29 in. (160.0 mm)
1.58 in. (40.3 mm)
2.65 lb (1.20 kg)
At 0 to 90% relative humidity (non-condensing)
32 to 113°F (0 to 45°C)
At 0 to 70% relative humidity (non-condensing)
–4 to 140°F (–20 to 60°C)
Maximum 2000 m
This product is intended for indoor use only
This product is rated for Pollution Degree 2 (normal conditions)
7
Page 15

Chapter 3 Basic Operation and
IMPORTANT:
Navigation
This chapter describes basic Diagnostic Tool operation, navigation, screen layout, icon functions,
and screen messages. Before you operate the Diagnostic Tool, make sure the battery pack is fully
charged or the Diagnostic Tool is powered by the AC power supply.
3.1 T urning On/Off and Emergency Shut down
The following sections describe how to turn the Diagnostic Tool on and off and how to perform an
emergency shutdown.
3.1.1 Turning On
The Diagnostic Tool will automatically turn on and open the Home screen (Figure 3-1) when power
is supplied through the Data Cable or by the AC/DC Power Supply. If the Diagnostic Tool does not
automatically turn on, press and release the Power button on the front of the Diagnostic Tool to
turn the Diagnostic Tool on.
3.1.2 Turning Off
All vehicle communication must be terminated BEFORE turning off the Diagnostic Tool. A warning
message displays if you attempt to turn the Diagnostic Tool off while communicating with the
vehicle. Forcing a shut down while communicating may lead to ECM problems on some vehicles.
Never disconnect the Data Cable when the Diagnostic Tool is communicating with the vehicle
ECM.
z To turn off the Diagnostic Tool:
1. Press the N/X button or select the Back or Home icon to navigate to the Home screen.
The “stopping communication” message appears briefly before the Home screen displays.
2. Disconnect the Diagnostic Tool Data Cable from the vehicle.
3. Press and release the Power button.
A confirmation screen displays.
4. Press the Y/a button or select OK from the menu to turn the Diagnostic Tool off. To continue
operating, press the N/X button or select Cancel from the menu.
8
Page 16
Basic Operation and Navigation Basic Navigation
IMPORTANT:
1
2
Scope MultimeterScanner Guided Component
Tests
Tools
OBD-II/EOBD
Previous Vehicles
and Data
TSBs
3.1.3 Emergency Shutdown
Using the emergency shutdown procedure while communicating with the vehicle ECM may lead
to ECM problems on some vehicles.
During normal operation turn the Diagnostic Tool off using the Turning Off procedure above. The
emergency shutdown procedure should only be used If the Diagnostic Tool does not respond to
navigation or control buttons or exhibits erratic operation. To force an emergency shutdown, press
and hold the Power button for five seconds until the Diagnostic Tool turns off.
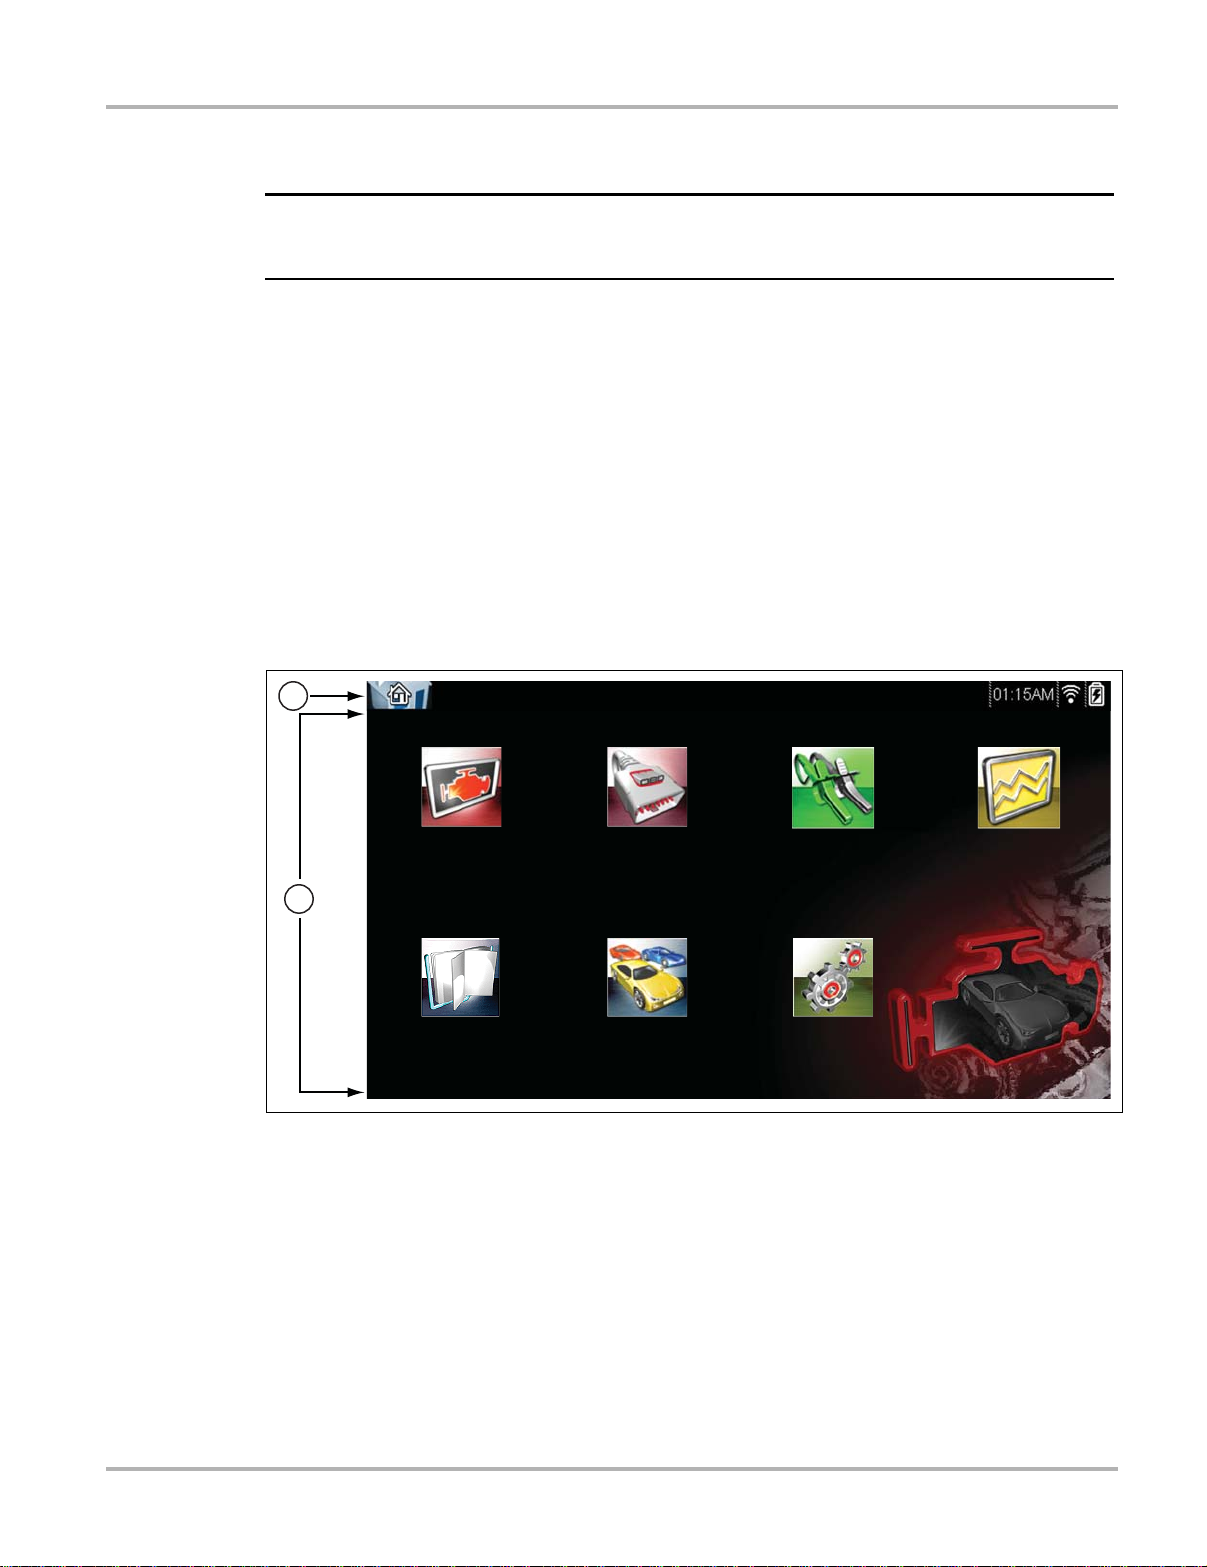
3.2 Basic Navigation
3.2.1 Home Screen Layout
The Home screen includes a title bar and main body. The Home screen contains icons, one for
each of the primary Diagnostic Tool functions.
1— Title Bar
2— Main Body
Figure 3-1 Home screen
9
Page 17
Basic Operation and Navigation Basic Navigation
3.2.2 Title Bar
The title bar at the top of the screen provides basic information about current Diagnostic Tool
operating conditions. Title bar options vary depending upon vehicle make and model, what
function is active, what test is being performed, or what menu is selected. The title bar contains
information only, there are no selectable items.
Elements of the Title bar let you know at a glance:
• What Diagnostic Tool function is currently active.
• The current time.
• Wi-Fi signal strength
• The source and status of the power being supplied to the Diagnostic Tool.
An active function icon is always displayed along the left-hand edge of the Title bar. These icons
resemble their Home screen icon counterparts in appearance and color. The name of the function
displays to the right of the icon on some screens.
A real time clock displays to the left of the power supply icon. The clock is powered by a dedicated
internal battery, so the correct time is maintained even when the main battery pack is discharged.
Use the Tools function to set the clock and format how time is displayed. See Clock Settings‚ on
page 132 for additional information.
The Title bar displays other information that varies depending upon what functions are being
performed. Other information may include:
• The identification (ID) of the test vehicle
• The name of the active menu or function
• The name of the test being performed
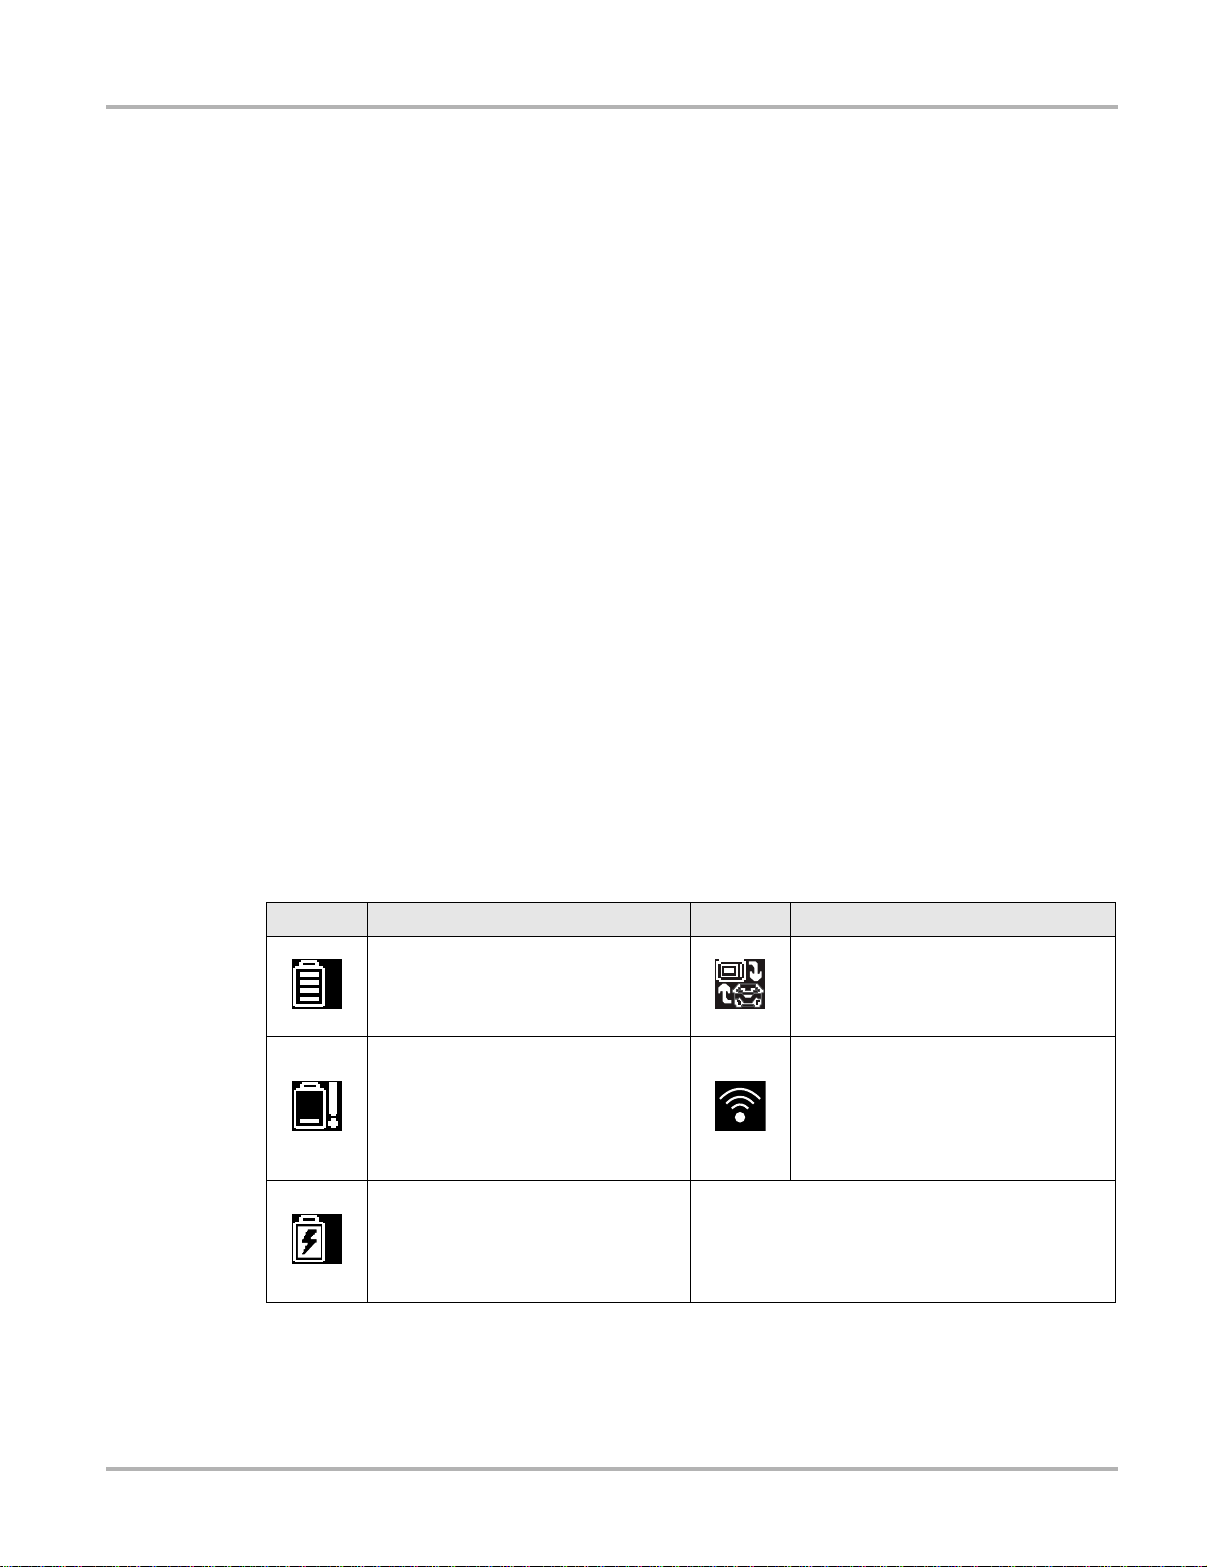
Table 3-1 Title Bar Icons
Icon Function Icon Function
Full Battery Charge Level - Indicates
power is being supplied by the internal
battery pack. Horizontal bars diminish
as the battery discharges.
Low Battery Charge Level - Indicates
the internal battery pack is low and
needs to be recharged immediately. A
warning message will also display on
the screen when the battery gets low.
External Power Connected -
Indicates power is being supplied
through the data cable connection to a
vehicle or by the AC/DC Power Supply
and charging the battery pack.
Active Vehicle Communication -
Indicates the Diagnostic Tool is actively
communicating with a vehicle.
Wi-Fi Signal Strength - Indicates
signal strength of the wireless network
connection.
Three bars - indicate full strength signal
Zero to 1 bar - indicate weak or no
signal
10
Page 18
Basic Operation and Navigation Basic Navigation
3.2.3 Home Screen Icons
Each available Diagnostic Tool function is represented by a icon on the home screen. The table
below provides descriptions of the icon functions.
Select an icon from the Home screen to start a function. You can also use the control buttons to
activate a function, a yellow border around the icon indicates it is highlighted, or in focus. Use the
Directional buttons (e, c, b, d) to highlight the desired function and then press the Y/a button
to select it. A “please wait” message may display briefly, then automatically clear once the function
is loaded and ready for use.
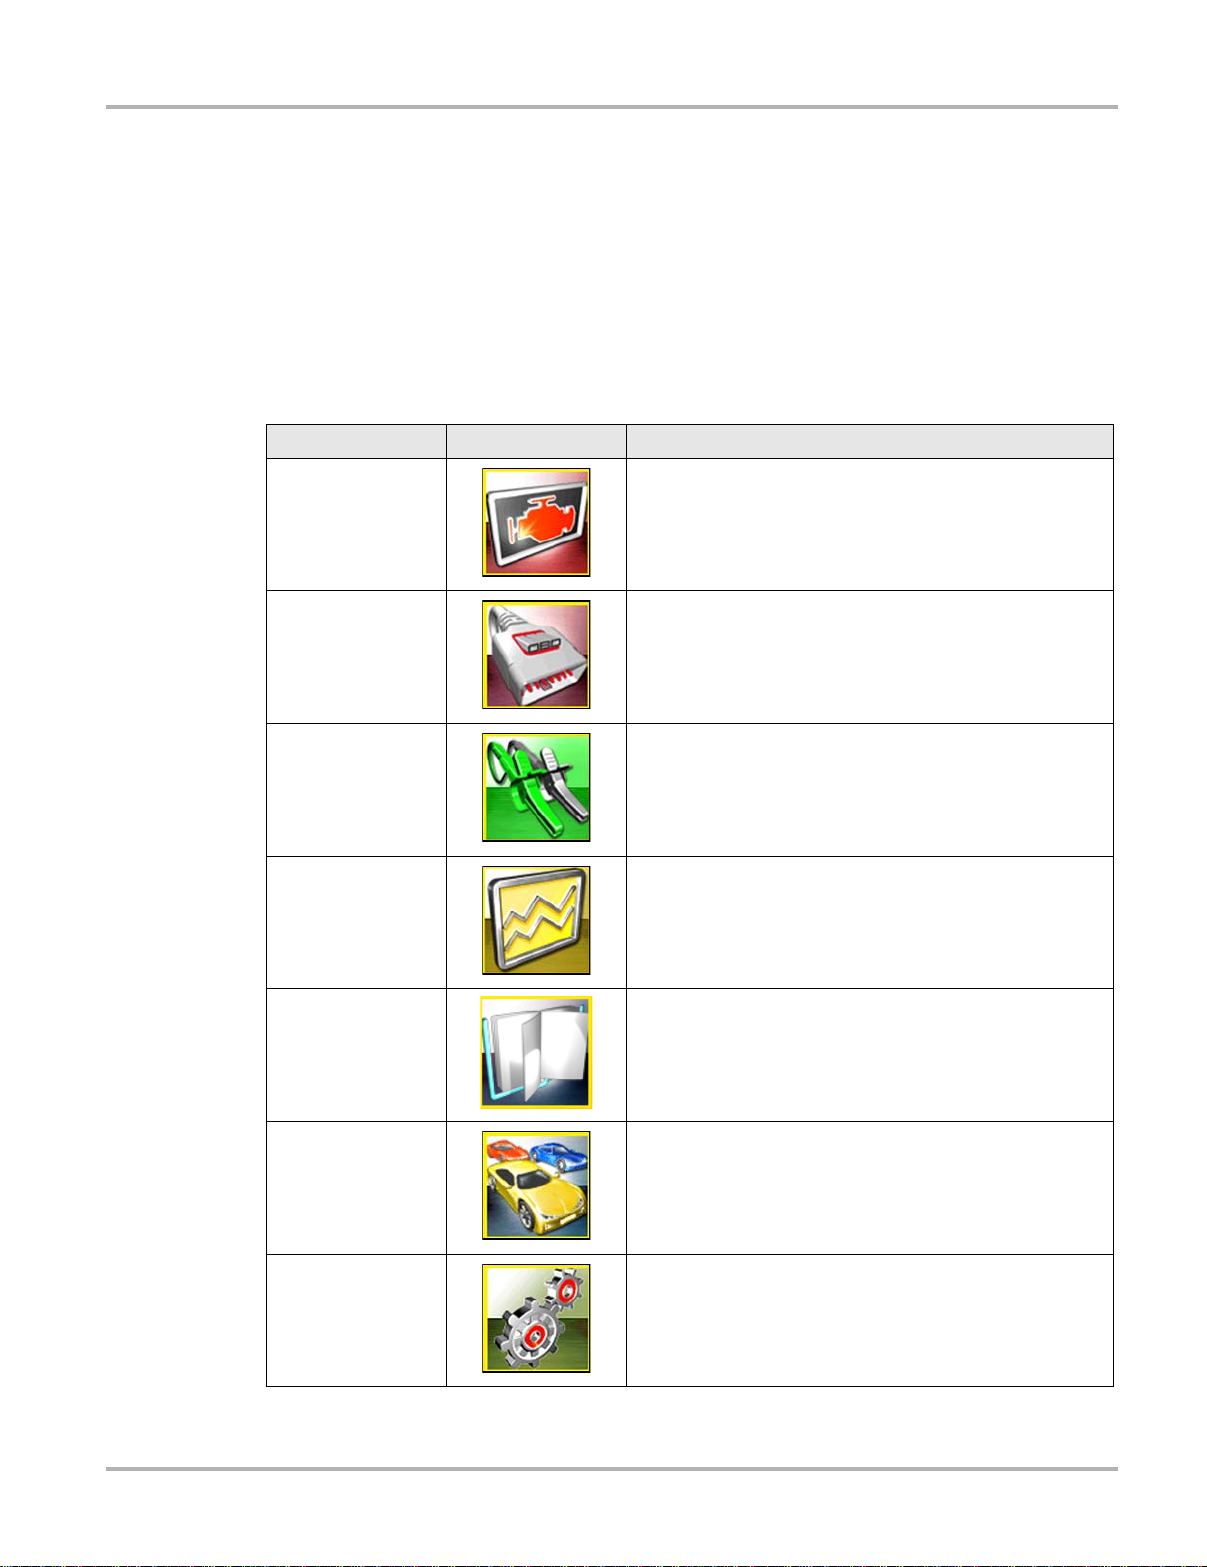
Table 3-2 Home screen icons
Function Name Function Icon Description
Used to communicate with the electronic control systems of
Scanner
OBD-II/EOBD
a vehicle. This function allows you to retrieve diagnostic
trouble codes (DTCs), view PID data and perform diagnostic
tests. See Scanner‚ on page 16 for details.
Allows you to access generic OBD-II/EOBD data and tests
without identifying the vehicle being tested. See OBD-II/
EOBD‚ on page 47 for details.
Guided Component
Tests
Scope Multimeter
TSBs
Previous
Vehicles & Data
Tools
Allows you to perform diagnostic tests for the identified
vehicle. See Guided Component Tests‚ on page 61.
Allows you to perform lab scope, graphing multimeter and
digital multimeter tests and measurements. See Scope
Multimeter‚ on page 76.
Allows you quick access to vehicle OEM technical service
bulletins. See TSBs‚ on page 57.
Allows you to quickly reconfigure the Diagnostic Tool to a
recently tested vehicle and to access saved data files.See
Previous Vehicles and Data‚ on page 71 for details.
Allows you to adjust Diagnostic Tool settings to your
personal preferences and perform other special functions.
See To ol s ‚ on page 125 for details.
11
Page 19
Basic Operation and Navigation Basic Navigation
3.2.4 Common Toolbar Control Icons
Common control icon functions are described in the following table. Specific function control icons
are described in their applicable chapters. Displayed control icons vary depending on the active
function or test. Select a control icon on a screen to activate a control function. You can also use
the control buttons to activate a function, a yellow border around the icon indicates it is highlighted,
or in focus. Use the Directional buttons (e, c, b, d) to highlight the desired function and then
press the icon, or the Y/a button to select it.
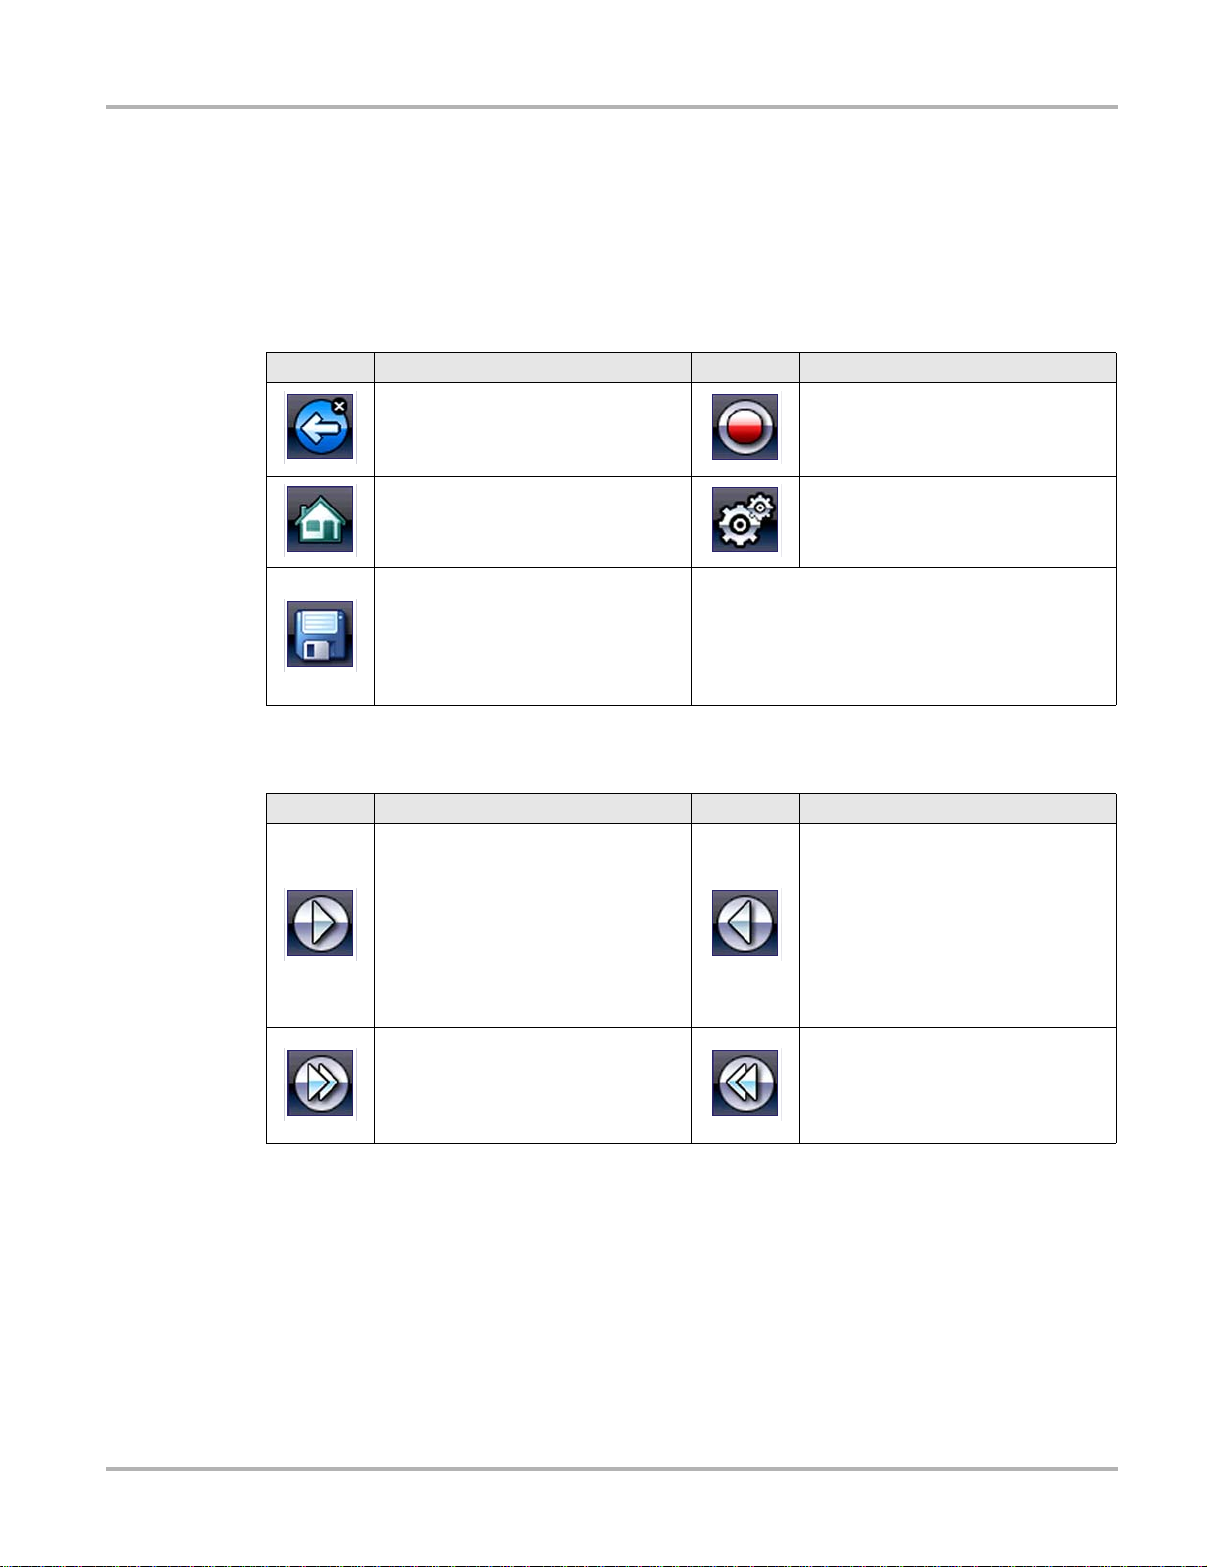
Icon Function Icon Function
Back - Returns to the previously
viewed screen. Icon is located on the
left-hand edge of the toolbar.
Home - Returns to the Home screen.
Icon is located next to the Back icon
on the left side of the toolbar.
Save - Writes data from buffer
memory to a file. The saved “movie”
file can be accessed for future
reference by selecting Previous
Vehicles and Data > View Saved
Data.
Record - Indicates the data being
displayed is paused and not being
updated. Selecting resumes data
collection.
Tools - Opens the tools menu.
—
The icons below are used to navigate through paused or saved data (“movie”) files during
playback.
Icon Function Icon Function
Step Forward - allows forward
movement in singular steps. To
quickly step forward, select this icon
(yellow frame appears) then press and
hold the Y/
(Note: To quickly step forward during
Scanner data playback, press and
hold the icon down until a red frame
appears around the icon.)
Skip Forward - allows forward
movement in multiple steps. To quickly
skip forward, select this icon (yellow
frame appears around icon) then
press and hold the Y/
a button.
a button
Step Back - allows backward
movement in singular steps. To
quickly step backward, select this icon
(yellow frame appears) then press and
hold the Y/
(Note: To quickly step backward
during Scanner data playback, press
and hold the icon down until a red
frame appears around the icon.)
Skip Back - allows backward
movement in multiple steps. To quickly
skip backward, select this icon (yellow
frame appears around icon) then
press and hold the Y/a button.
a button.
12
Page 20

Basic Operation and Navigation Screen Messages
3.2.5 Scroll Bar
A vertical scroll bar appears along the right-hand edge of the screen when additional data
expands above or below what is currently on the screen (Figure 3-2).
Figure 3-2 Scroll bar
1— Beginning - Moves to beginning of data displayed.
2— Step up - Moves up one increment of the data displayed.
3— Slider (position indicator) - Select and drag the Slider to scroll through data. The slider
indicates the relative position of the current screen to the total available data.
4— Step down - Moves down one increment of the data displayed.
5— End - Moves to end of data displayed.
The Up (b) and Down (d) directional buttons can also be used to move through the data one line
at a time. Press and hold a directional button to rapidly scroll through data.
3.3 Screen Messages
3.3.1 System Messages
There are four types of system messages that may be displayed:
Message Type Description
Loading and connecting messages display when the Diagnostic Tool is performing an
Loading and
Connecting
Confirmation
Warning
Error
internal operation, such as loading a database, establishing communications with the
vehicle, or initiating a test. The message automatically clears once the internal
operation is complete.
Confirmation messages inform you when you are about to perform an action that cannot
be reversed or when an action has been initiated that requires a confirmation to
continue.When a response is not required, the message displays briefly, then
disappears.
Warning messages inform you when completing the selected action may result in an
irreversible change or in the loss of data. A confirmation is required to continue
Error messages inform you when a system or procedural error has occurred, for
example if the data cable becomes disconnected during operation.
13
Page 21

Basic Operation and Navigation Data Cable Connection
IMPORTANT:
3.3.2 Communication Messages
When “no communication” messages are displayed, it indicates the Diagnostic Tool and the
vehicle electronic control module are not communicating.
The following conditions cause “no communication” messages to display:
• The Diagnostic Tool is unable to establish a communication link with the vehicle.
• The vehicle is not equipped with the system that was selected.
• There is a loose connection.
• There is a blown vehicle fuse.
• There is a wiring fault on the vehicle.
• There is a circuit fault in the data cable or adapter.
• Incorrect vehicle identification was entered.
Refer to the Vehicle Communication Software manuals for manufacturer-specific problems.
3.4 Data Cable Connection
Connection of the data cable to the Diagnostic Tool and vehicle data link connector (DLC) is
required for Scanner and OBD-II/EOBD testing.
Use the approved cables and accessories for your diagnostic tool. Cable length must not exceed
114.17 inches (2.9 meters).
Depending on the vehicle, the supplied DA-4 data cable may be used alone or may require
optional adapters.
• All OBD-II/EOBD compliant vehicles - Use the supplied DA-4 data cable. The 26-pin end of
the cable attaches to the data cable connector on the top of the Diagnostic Tool. The16-pin
end connects to the vehicle DLC.
• All OBD-I (non-OBD-II/EOBD) compliant vehicles - Use the supplied DA-4 data cable with
the optional DA-5 adapter and a manufacturer specific adapter. The 26-pin end of the cable
attaches to the data cable connector on the top of the Diagnostic Tool. The16-pin end
connects to the DA-5 adapter, the DA-5 adapter connects to the manufacturer specific adapter
and then connects to the vehicle DLC.
On-screen cable and adapter connection instructions are provided while using the Scanner and
OBD-II/EOBD functions. The instructions may also include the location of the vehicle DLC
(Figure 3-3).
Figure 3-3 Vehicle connection data cable message
14
Page 22

Basic Operation and Navigation Data Cable Connection
NOTE:
For data cable vehicle power connection information, see Vehicle Power‚ on page 6.
i The data cable, includes an LED light on the vehicle DLC connector end, that can be used for
locating the vehicle DLC. The LED light is powered by the diagnostic tool battery.
z To connect the data cable to the vehicle:
1. After identifying a vehicle using the Scanner or OBD-II/EOBD function, review the on-screen
information for data cable usage and DLC location (Figure 3-3).
2. Connect the data cable to the diagnostic tool.
3. If needed, press the LED light button switch on the end of the cable to turn the LED light on,
and locate the DLC.
4. Turn the vehicle ignition on.
5. Select Continue once the data cable is connected.
The Diagnostic Tool establishes communication with the vehicle, then displays a list of
available tests. If the Diagnostic Tool is unable to establish a communications link, a “no
communications” message displays.
15
Page 23
Chapter 4 Scanner
This chapter describes the basic operation of the Scanner function.
The Scanner icon is located on the Home screen.
The Scanner function allows your diagnostic tool to communicate with the electronic control
systems of a vehicle. This allows you to retrieve diagnostic trouble codes (DTCs), view PID data
and perform diagnostic tests.
4.1 Screen Layout and Toolbar Icons
The following screen layout and toolbar controls apply to both the Scanner and the OBD-II/EOBD
functions.
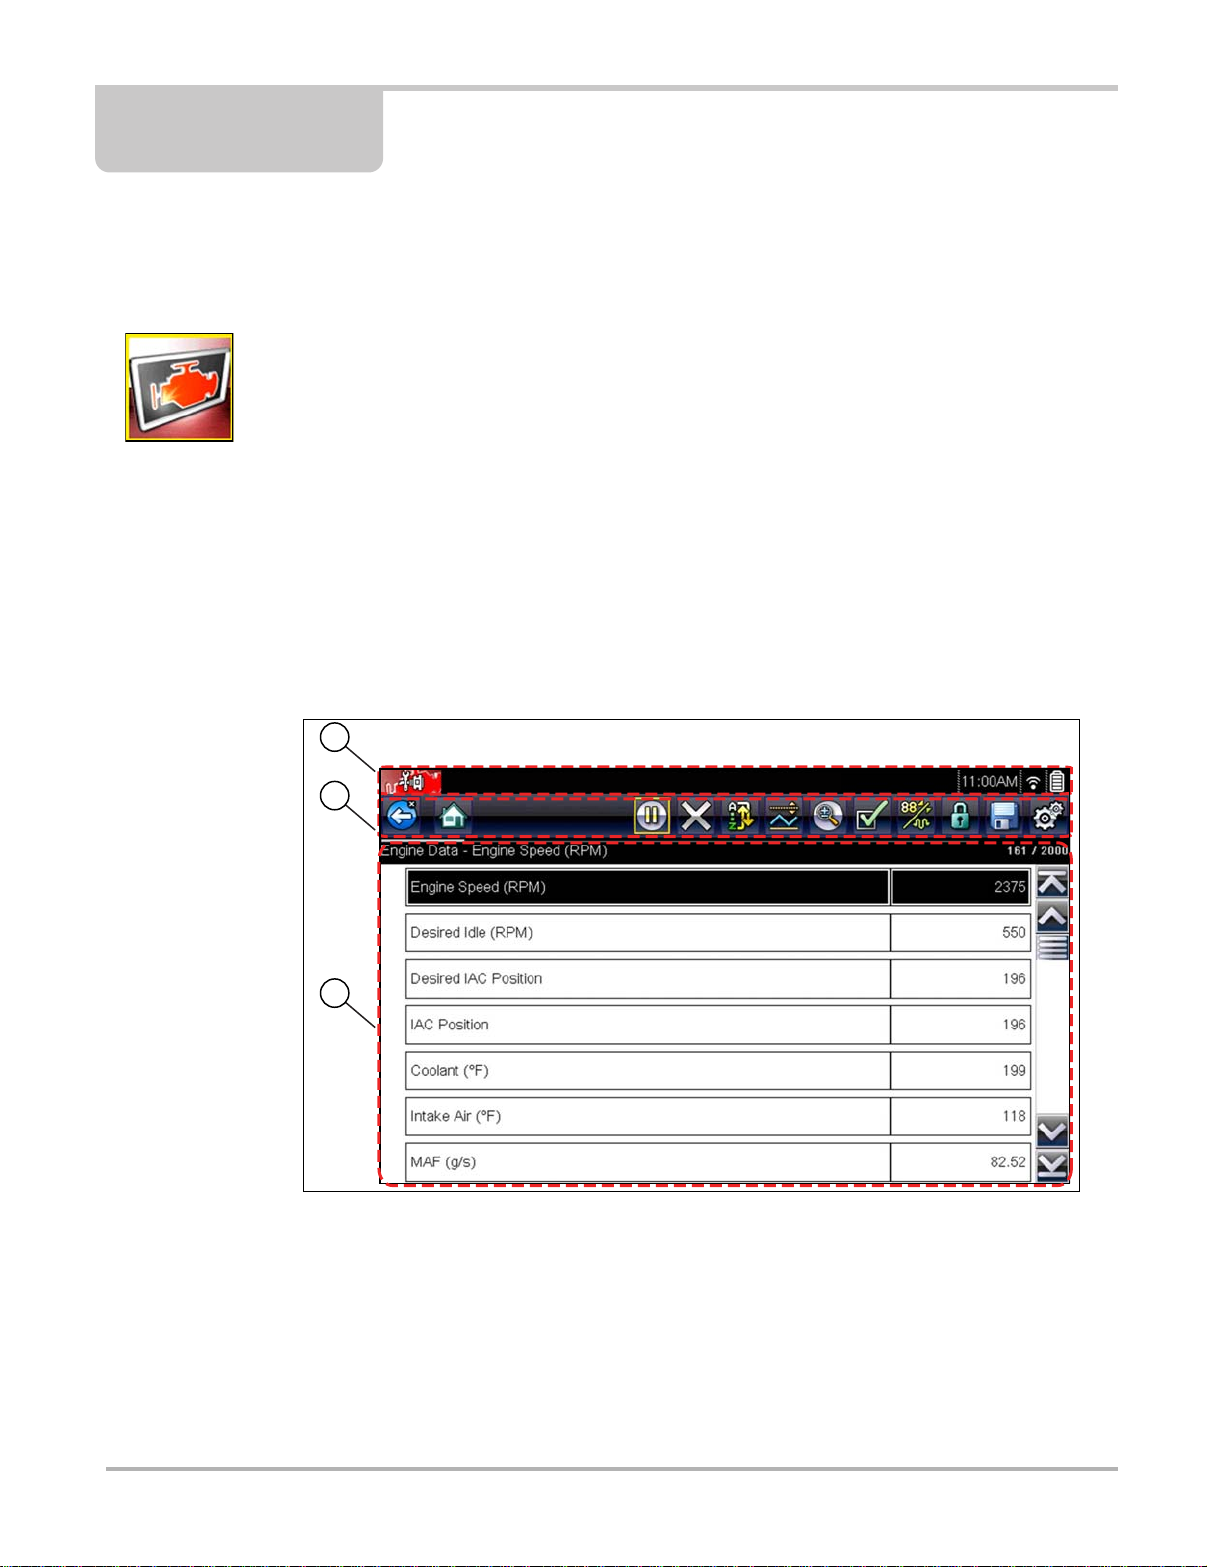
4.1.1 Screen Layout
1
2
3
1— Title bar—shows active test, vehicle and diagnostic tool status
2— Toolbar—contains control icons
3— Main body—displays menus, PID and test data
2009 Peugeot 407 1.6L 16V T-Diesel (9HZ)
Figure 4-1 Screen layout
The Title bar appears for all functions and displays information only, there are no selectable items.
Refer to Title Bar‚ on page 10 for details.
16
Page 24

Scanner Scanner Demonstration Program
IMPORTANT:
4.1.2 Scanner Control Icons
The scanner toolbar contains control icons. Control icons may vary depending on the active
function or test. A yellow frame surrounding an icon (highlighted), indicates it is selected. Other
control icons (not shown) are described in Common Toolbar Control Icons‚ on page 12.
Icon Function Icon Function
Pause - Indicates PID data from the
vehicle is being displayed. Selecting
pauses data collection.
Custom Data List - Opens a menu for
selecting which PIDs display in the list.
Clear - Erases all the PID data in the
buffer and begins a new recording.
Selecting opens a confirmation
message.
Trigger - Opens a menu that allows
you to set, arm, and clear threshold
values that automatically trigger PID
data to be saved from buffer memory
to a file.
Zoom - Incrementally increases and
decreases the scale of the data being
displayed.
Change View - Changes display
options between PID list or graph
displays.
Lock/Unlock - Locks or unlocks the
highlighted parameter. Locked PIDs
move to the top of the list and do not
scroll as you move through the data.
Sort - Determines the order in which
PIDs are listed on the screen.
4.2 Scanner Demonstration Program
The Scanner demonstration program contains actual ECM PID data that allows you to navigate
and become familiar with the many capabilities of the Scanner function without actually
connecting to a vehicle. The following sections in this chapter provide detailed information on
navigating through the Scanner function and various menus. As you navigate through the
Demonstration program, refer to the applicable section for additional information.
z To start the demonstration program:
1. From the Home screen, select the Scanner icon.
The manufacturer menu displays.
2. Select the Demonstration icon.
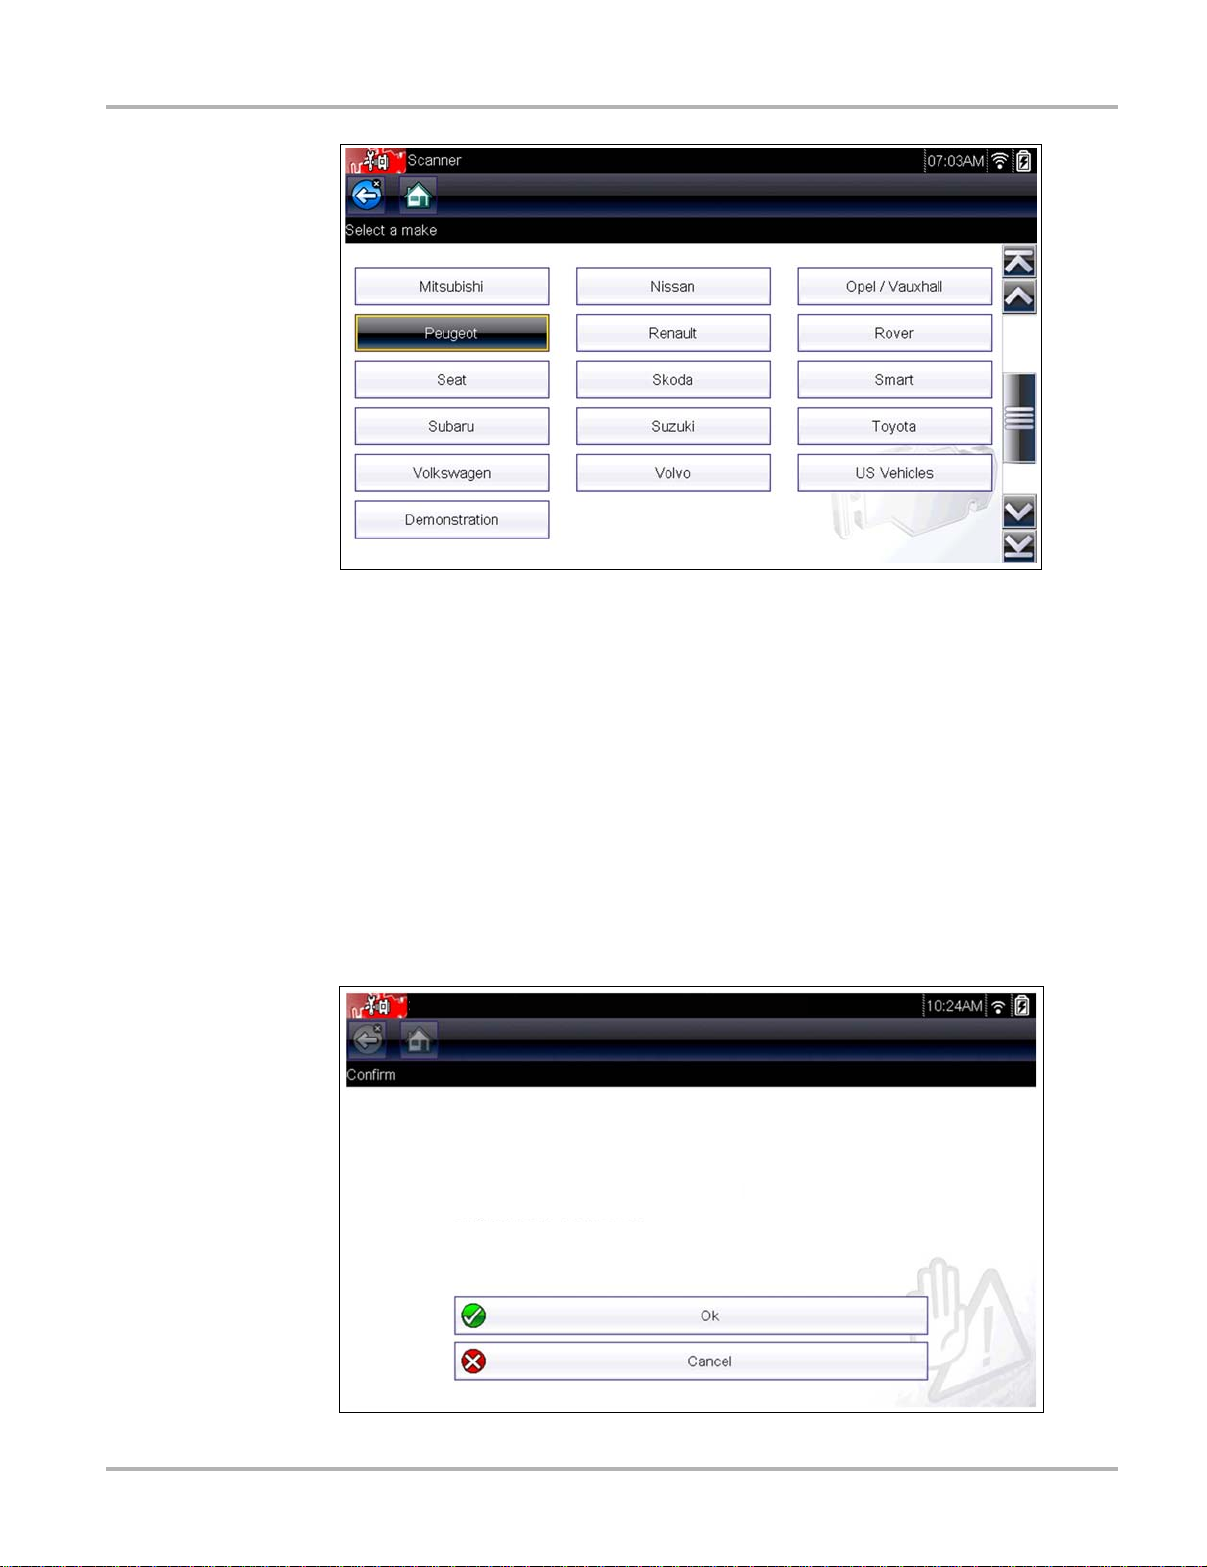
Do not connect a vehicle to the diagnostic tool while using the Demonstration program.
3. Follow the on-screen instructions and make the selection as needed until the confirmation
screen displays.
4. Select OK on the confirmation screen to load the demonstration database.
A message displays “Demo mode: Do not connect to vehicle.”
5. Select Continue.
A systems menu, which shows all of the systems available for testing, displays.
6. Select a system from the menu, then select submenus as applicable to display the desired
demonstration information.
17
Page 25

Scanner Scanner Operation
NOTE:
NOTE:
4.3 Scanner Operation
Scanner Operation (Quick Reference)
z
1. Connect the data cable to the vehicle, and diagnostic tool.
Note: If the diagnostic tool is turned off, when the OBD-II data cable is connected to the
vehicle DLC, the diagnostic tool will automatically turn on.
2. Turn the diagnostic tool on (if required).
3. Turn the vehicle ignition switch on.
4. Select Scanner from the Home screen.
5. Select the vehicle year and make
6. Select Auto or Manual ID and enter the vehicle information at the screen prompts to continue.
7. Select a System to test.
8. Select a Test to be performed.
i The above information applies to most OBD-II vehicles.
4.3.1 Connecting the Data Cable
Connection of the data cable to the diagnostic tool and vehicle DLC is required for Scanner
testing, see Data Cable Connection‚ on page 14.
4.3.2 Vehicle Identification
The vehicle must be correctly identified for the diagnostic tool to communicate and display data
correctly. Menus and navigation will vary by vehicle.
z Identifying a vehicle:
i Menus and navigation will vary by vehicle.
1. Select Scanner from the Home screen.
A list of vehicle manufacturers (make) displays (Figure 4-2).
The list includes Demonstration, which opens the Demonstration program (see Scanner
Demonstration Program‚ on page 17).
2. Select a vehicle manufacturer (Figure 4-2).
18
Page 26
Scanner Scanner Operation
Figure 4-2 Manufacturer list
A model year menu displays.
3. Select the vehicle year.
4. If the vehicle supports automatic identification, a menu choice will display providing the option
to either “Auto ID the vehicle” or “Manual ID the vehicle”.
Selecting Auto ID will automatically enter the vehicle’s information, and then display the
vehicle confirmation screen, see step 7.
Selecting Manual ID will display a list of vehicle models, see step 5.
5. Select the vehicle model.
6. Several selections may be required to get to the vehicle confirmation screen. If applicable,
make any other additional menu sections that may be required to select the vehicle.
7. The vehicle confirmation screen displays (Figure 4-3).
8. Select OK to confirm the vehicle (Figure 4-3).
2009 Peugeot 407 1.6L 16V T-Diesel (9HZ)
Current Vehicle Identication Is:
VIN: ------A----D--1----------Vehicle: 2009 Peugeot 407
Engine: 1.6L T-Diesel (9HZ)
Figure 4-3 Vehicle confirmation screen
19
Page 27
Scanner Scanner Operation
NOTE:
4.3.3 System Selection
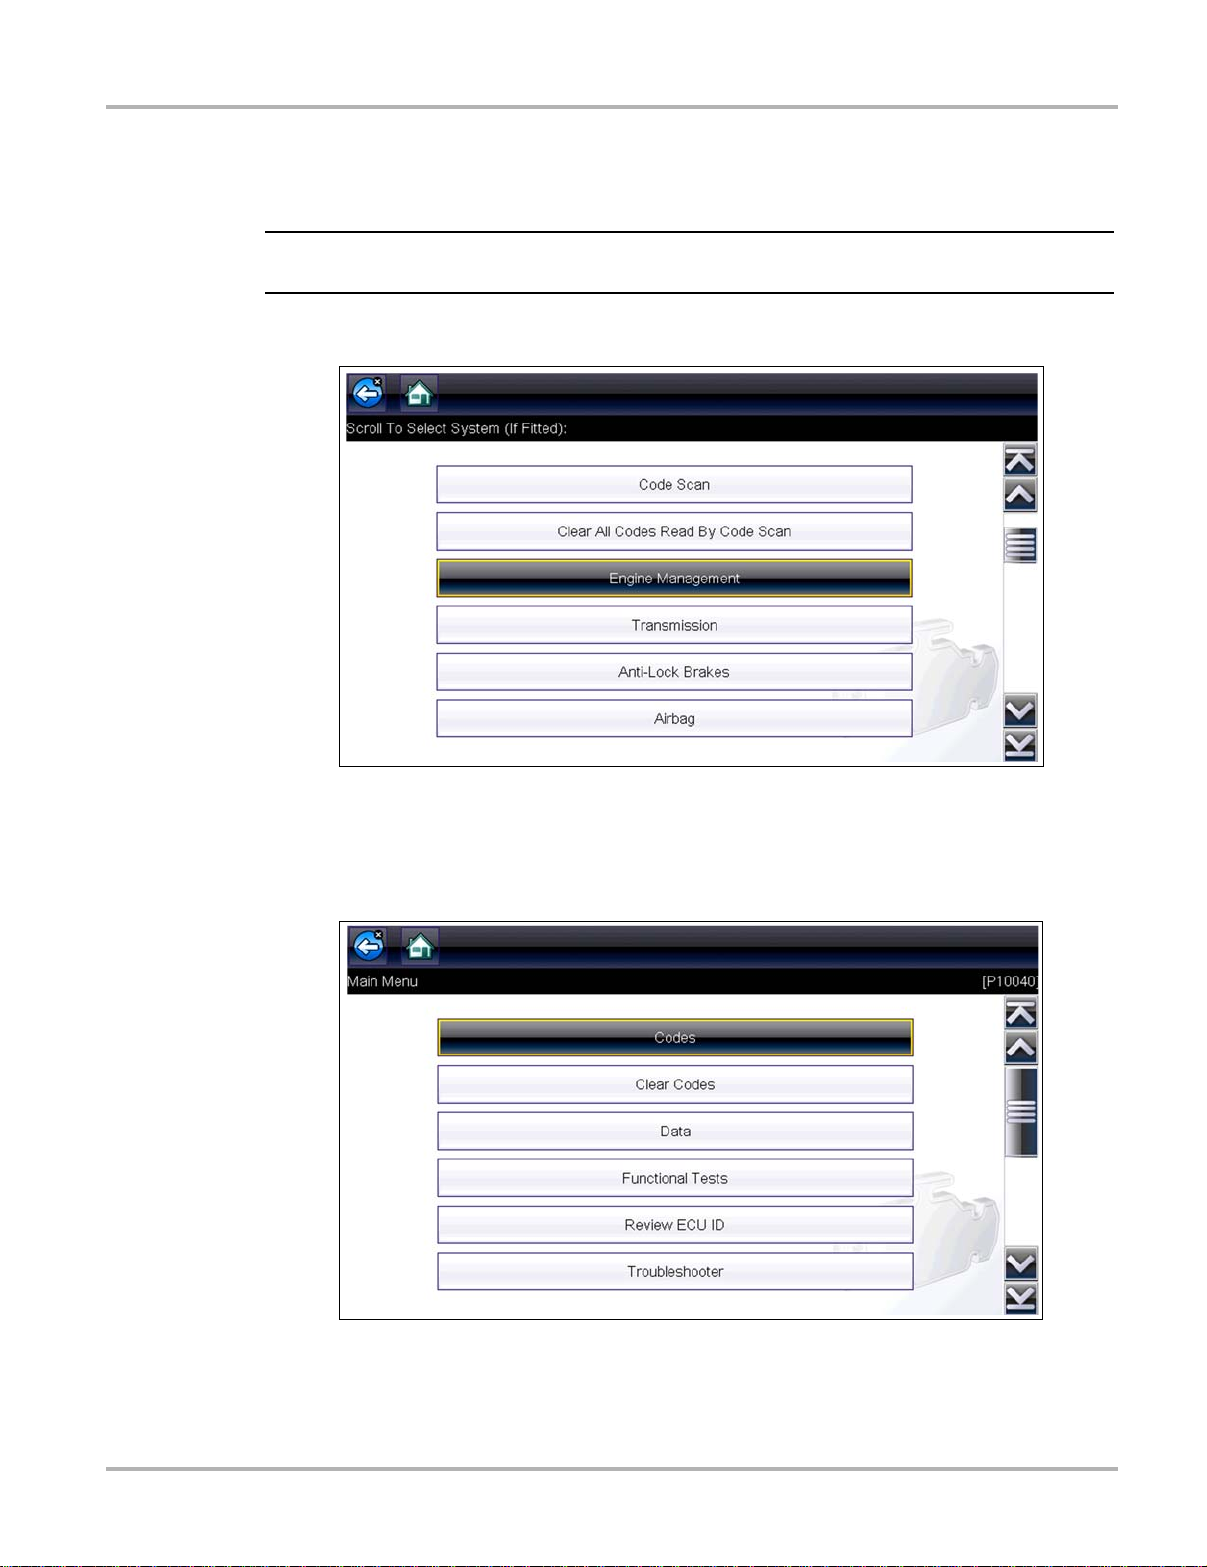
After a vehicle is identified, a menu of available systems, and options are displayed (Figure 4-4).
i Only the systems and options available for the vehicle are included in the menu list.
Select a system or option (Figure 4-4).
Figure 4-4 Typical systems menu
If a system (e.g. Engine, Transmission, Antilock Brakes, etc) is selected, the diagnostic tool may
establish communication with the vehicle, then display the system main menu (available tests)
(Figure 4-5). For sub-menu option information, see System Main Menu Options‚ on page 25.
Figure 4-5 System main menu
20
Page 28
Scanner Scanner Operation
Code Scan
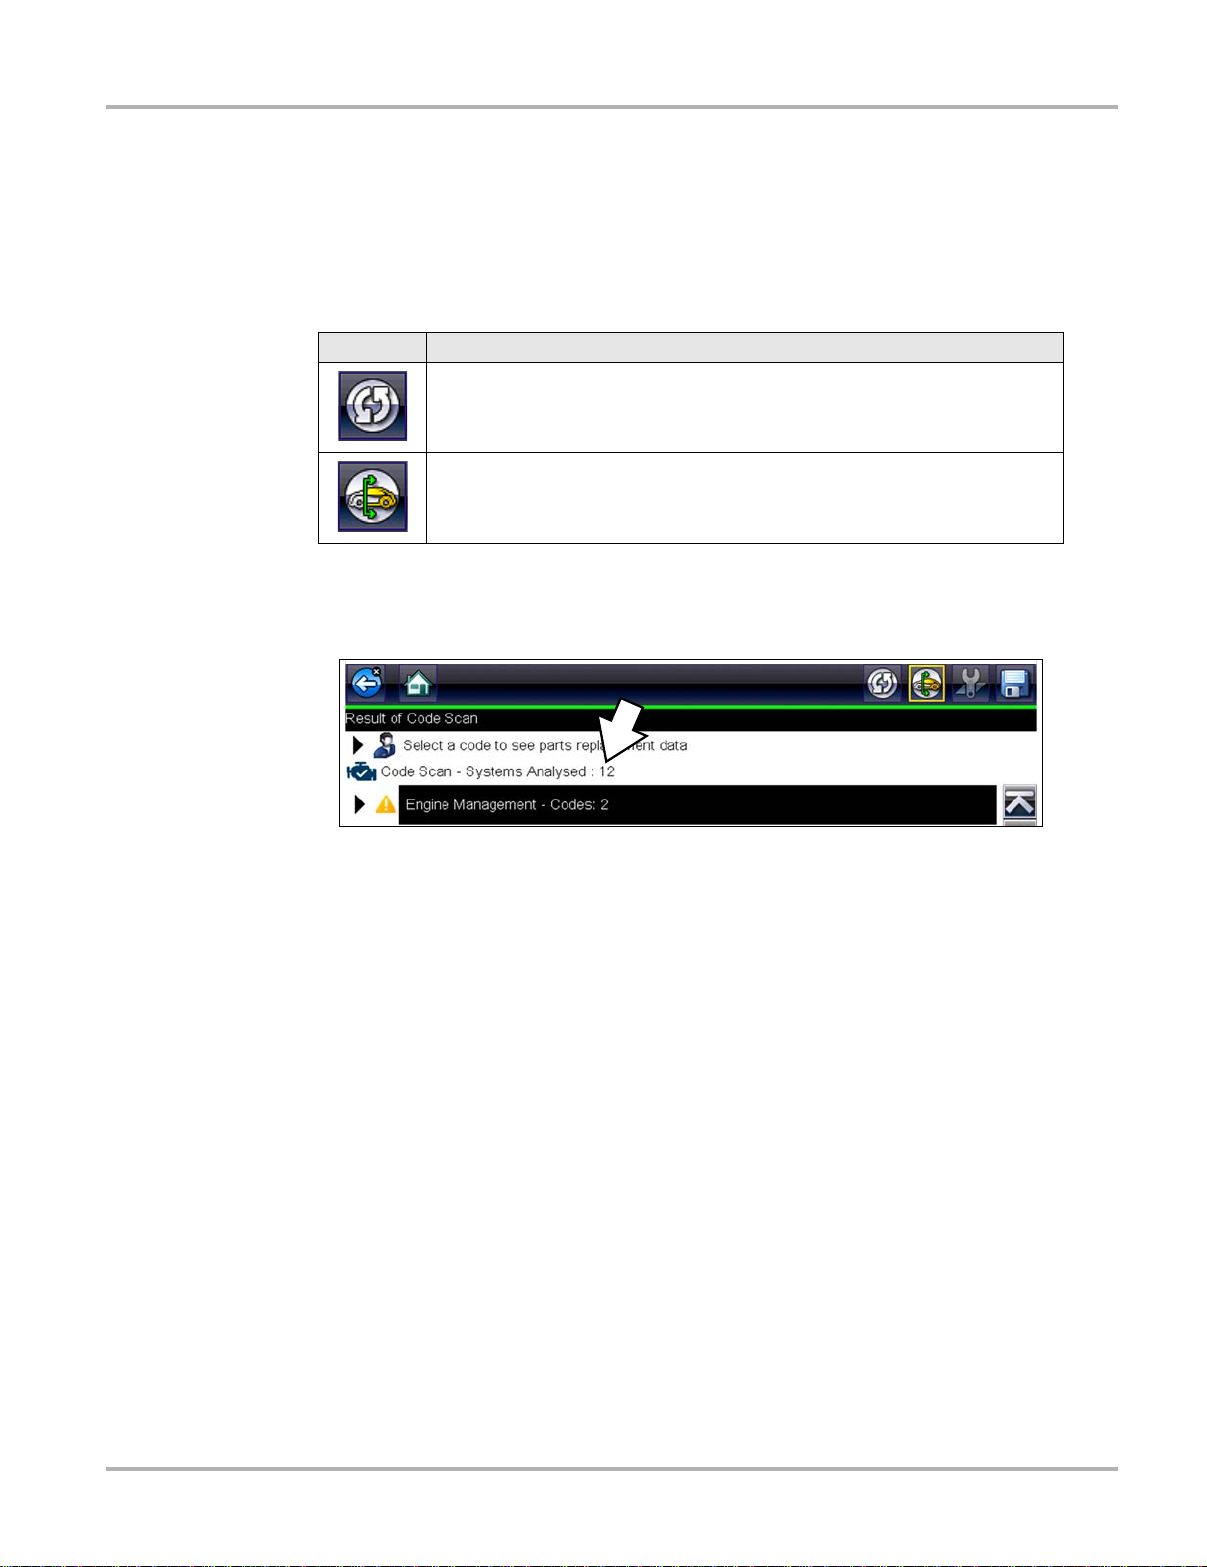
Depending on the vehicle, the Code Scan option (if supported) may be available from the menu.
Selecting Code Scan starts an active scan of vehicle control modules, and opens the Code Scan
results screen (Figure 4-6). A green progress bar is shown at the top indicating the active
scanning progress. Once completed, the results are displayed by system category.
The following Code Scan related control icons are used:
Icon Function
Refresh - Refreshes the code scan data (restarts the code scan)
System - Opens the main menu of the system selected
The following results are displayed progressively as the modules are scanned:
• The total number of systems (modules ) dete cted (Figure 4-6).
Figure 4-6 Code Scan systems analyzed result total
Quick reference indicators are used to show system code status (Figure 4-6):
- Green icon “a” mark - No Codes
- Yellow Triangle icon “!” mark - Codes are present
21
Page 29
Scanner Scanner Operation
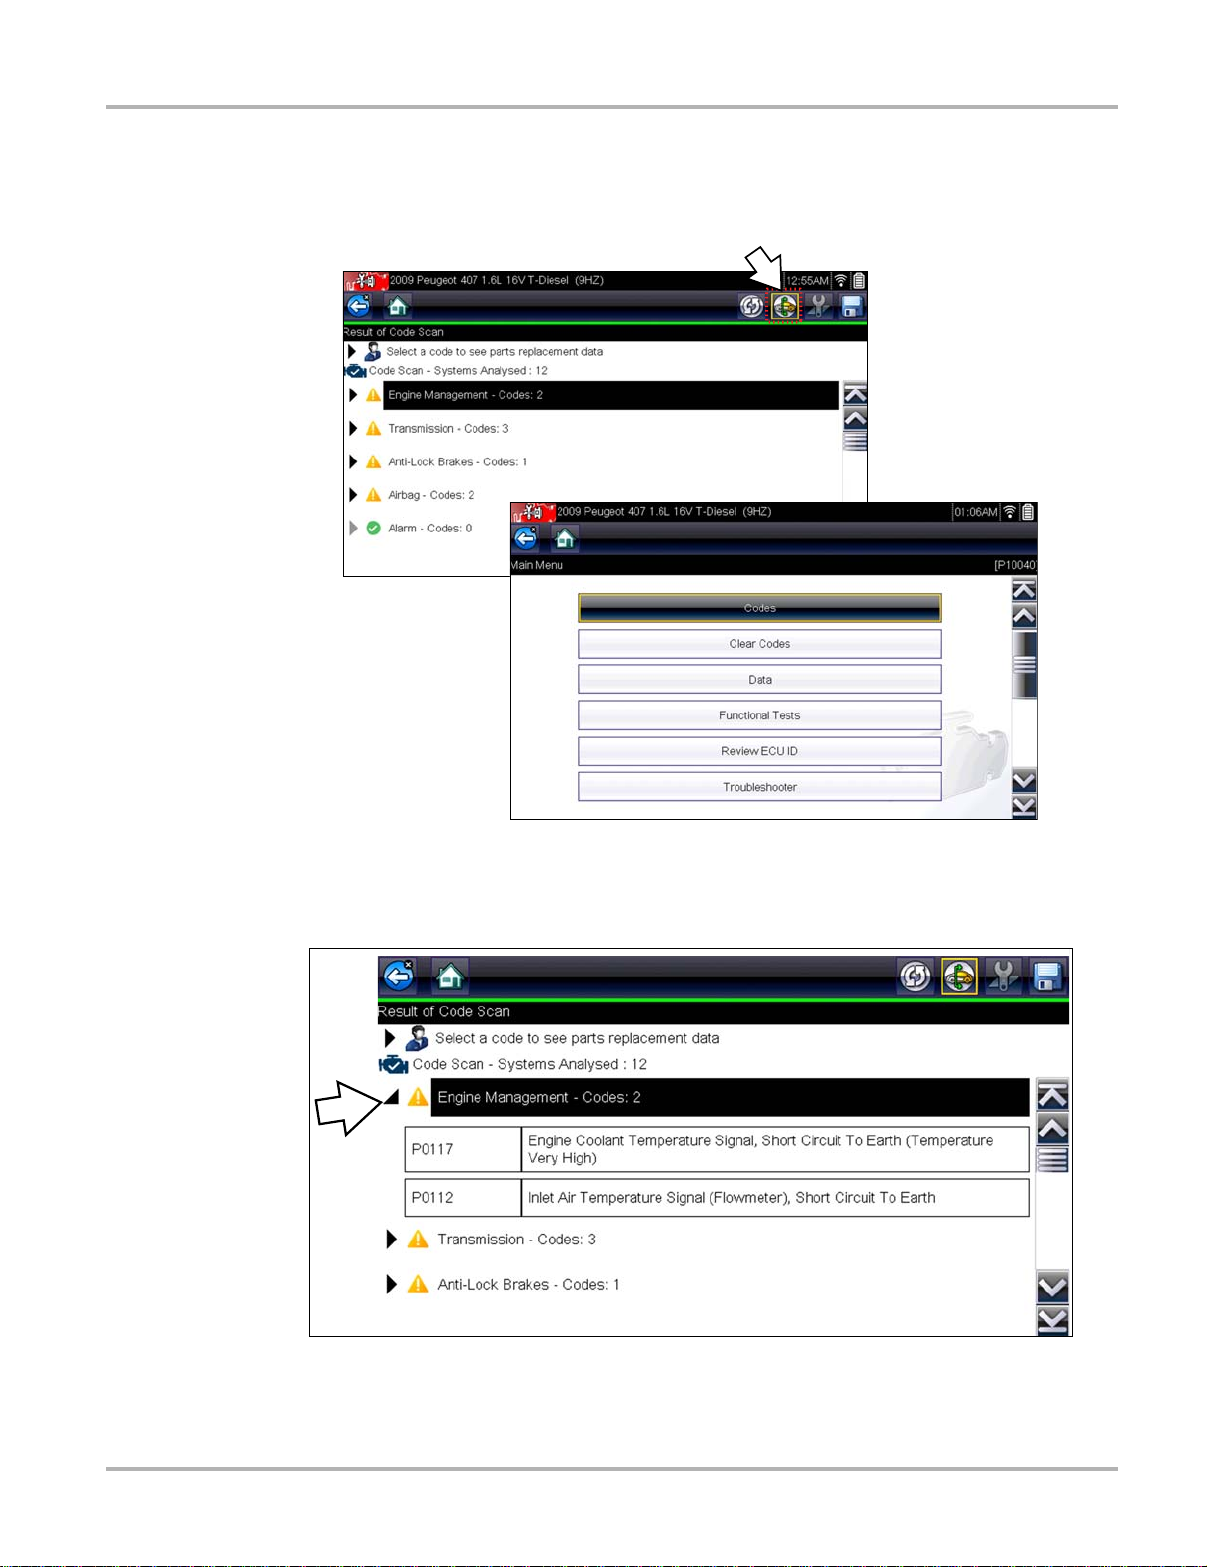
• A list of all the systems analyzed with DTCs tota ls. A categorized system list with DTC
totals is displayed in the order they are scanned. To view the main menu for a system in the
list, select the system, then select the System icon (Figure 4-7).
Figure 4-7 System icon (opens Main Menu)
Select the expand/collapse icon (Figure 4-8) on the left side of a system category title to
expand or collapse a systems’ DTC list.
Figure 4-8 Expand/Collapse Icon (expanded result)
22
Page 30
Scanner Scanner Operation
NOTE:
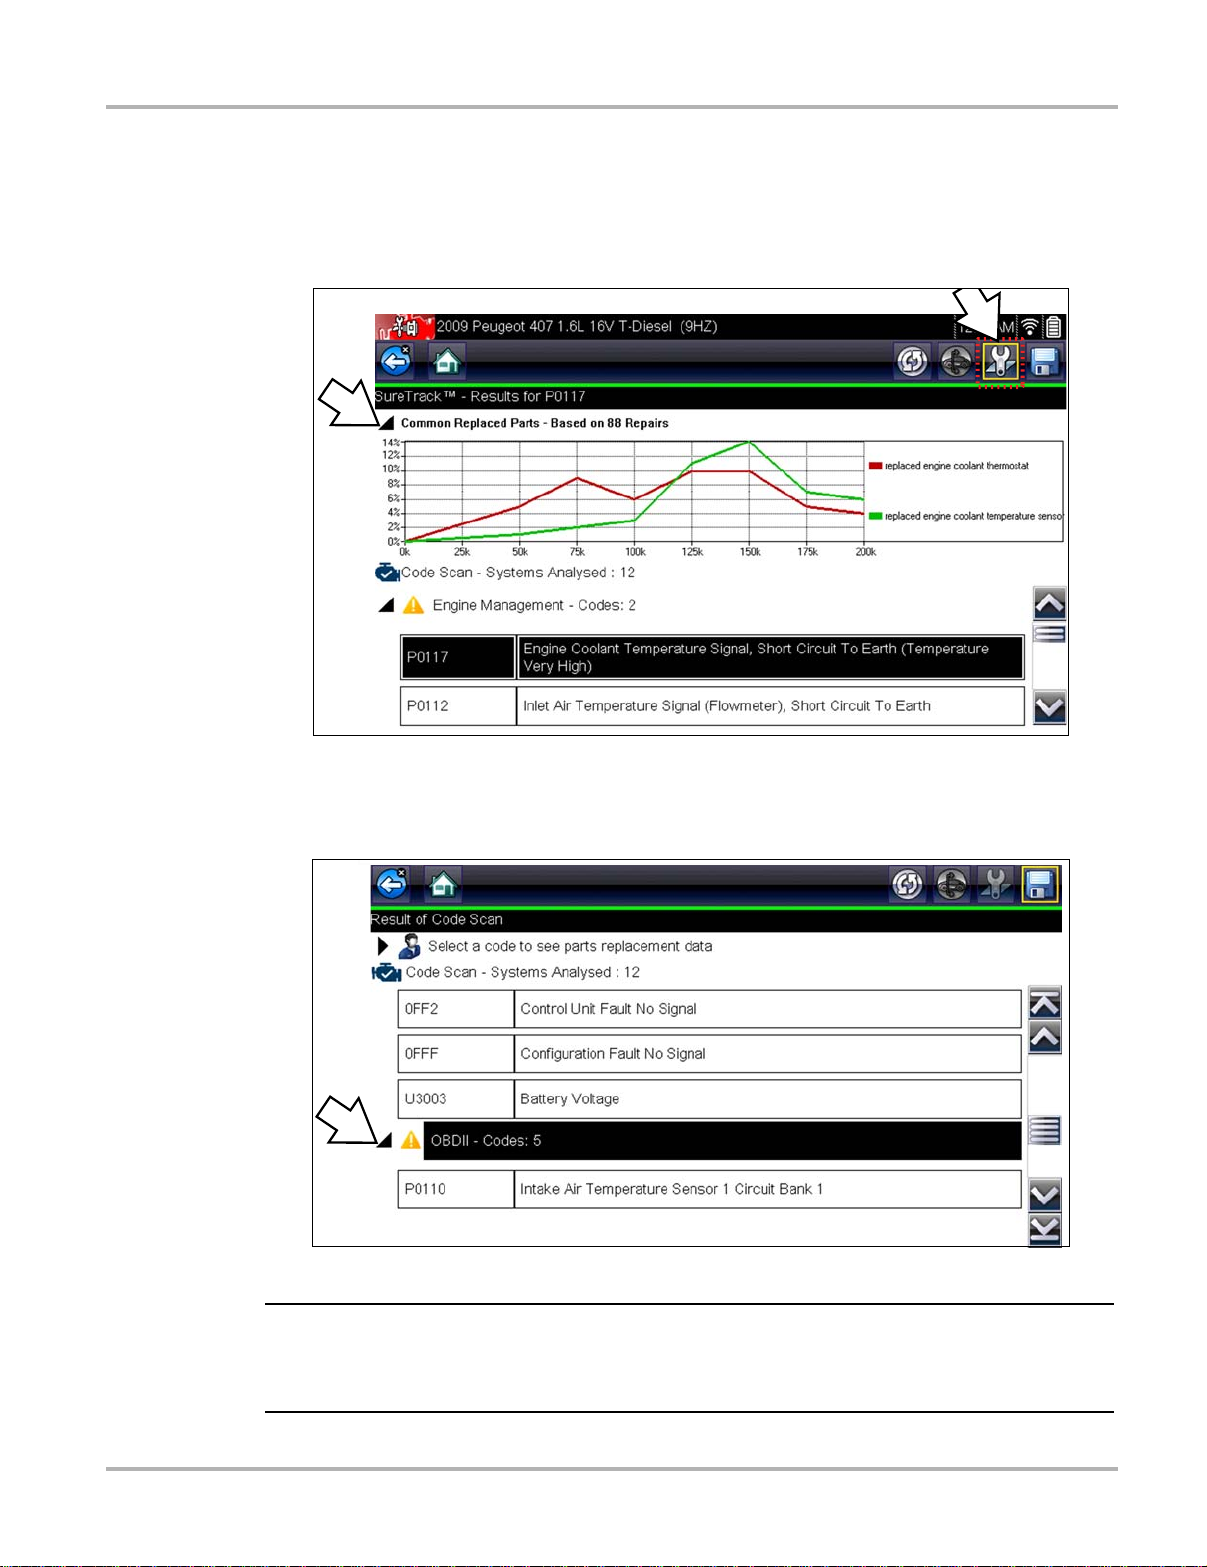
• SureTrack
from a list allows you to view available SureTrack information for the DTC. Select the
Common Replaced Parts graph or the Fix It ! icon from the toolbar to view the information.
For additional information on SureTrack, and common replaced parts graph see SureTrack®‚
on page 40.
®
Common Replaced Parts and rep air information for DTCs. Selecting a DTC
Figure 4-9 Common Replaced Parts graph icon and Fix It! icon (in toolbar)
• Global OBDII DTCs. Towards the end of the Code Scan list Global OBDII DTCs are
displayed.
Figure 4-10
i Some vehicles may not display global OBD-II information in the Code Scan list. A message will be
displayed to inform you the OBD-II - codes and monitors for this vehicle may be accessed using
the global OBD-II function. See OBD-II/EOBD‚ on page 47.
23
Page 31

Scanner Scanner Operation
NOTE:
NOTE:
• Readiness Monitor Test Status. At the end of the Code Scan list, readiness monitor test
results are displayed as “Tests Complete” or “Not Complete”.
Quick reference indicators are used to show monitor status.
- Green icon “a” mark - Monitor test is complete
- Grey icon “—” mark - Monitor test is not complete
Figure 4-11
i Monitors that are not supported by the vehicle are not displayed in Code Scan.
Saving Codes, and Code Scan Results (Vehicle System Report)
When using the code scan feature, or when viewing individual system codes (e.g. engine,
transmission) selecting the Save icon from the toolbar saves the results as report formatted file.
The saved file(s) can be viewed using two methods:
• On the diagnostic tool - See Viewing Code Results on the Diagnostic Tool‚ on page 73.
• In Vehicle System Report format using ShopStream Connect - See Vehicle System Report -
Viewing Code Results Using ShopStream Connect‚ on page 74.
Clear All Codes Read by Code Scan
Selecting Clear All Codes Read by Code Scan erases DTCs from all vehicle system modules
that were read by Code Scan.
i The Clear All Codes Read by Code Scan function may not clear OBD-II generic codes on some
vehicles.
24
Page 32

Scanner Scanner Operation
NOTE:
4.3.4 System Main Menu Options
Once a System is selected (e.g. Engine, Transmission, Antilock Brakes, etc) is selected, the
diagnostic tool may establish communication with the vehicle, then display the System Main Menu
(available tests).
i Menus and navigation will vary by vehicle.
The System Main Menu may include:
• Codes Menu—displays diagnostic trouble code (DTC) records from the vehicle electronic
control module. Selecting may open a submenu of viewing options.
• Clear Codes—erases DTC records and other data from the ECM. This selection is found on
a Codes submenu for some models.
• Data Display— displays PID data from the vehicle electronic control module. Selecting may
open a submenu of viewing options.
• Functional Tests—provides specific subsystem tests. The tests vary depending on the
manufacturer and model.
• Actuator T ests—similar to functional tests, checks the operation of certain actuators, such as
solenoid valves and relays.
• Memory Resets—allows you to reprogram adaptive values for certain components after
making repairs. Selecting opens a submenu. These options are found on the Functional Tests
Menu for some models.
• System Tests—provides specific subsystem testing. Performing these tests is similar to
functional tests.
• Generic Functions—lets you access certain available Generic OBD II functions from a
proprietary menu (1996 and newer vehicles only).
• Troubleshooter—provides step-by-step procedures, integrating PIDs and retrieving trouble
codes when appropriate, for specific symptoms of the identified vehicle.
The following sections, describe some of the System Main Menu items listed above.
Codes Menu
This selection may appear as Codes, Codes Menu, Codes Only, Codes (No Data), Service Codes
or something similar on the menu. Selecting opens a list of viewing options that includes:
• Display Codes‚ on page 26
• Clear Codes‚ on page 27
• Freeze Frame/Failure Records‚ on page 27
• DTC Status‚ on page 28
25
Page 33

Scanner Scanner Operation
Display Codes
This function opens either a list of diagnostic trouble codes (DTCs) stored in the selected vehicle
electronic control module (ECM), or a submenu of DTC viewing options. The code list includes the
DTC and a brief description (Figure 4-12).
If SureTrack
troubleshooting information from SureTrack (e.g. Common Replaced Parts data (Figure 4-12),
Real Fix and Related Fixes) will also be available. For additional information about using
SureTrack, see SureTrack‚ on page 40.
®
(optional) is active and data is available for a selected DTC, additional
2009 Peugeot 407 1.6L 16V T-Diesel (9HZ)
3
4
1
2
5
Figure 4-12 DTC results
1— Fix It! Icon — opens SureTrack Dashboard
2— Save Icon — saves the displayed DTCs to an (.XML) file
3— SureTrack Status Bar — displays active SureTrack status or result
4— Common Replaced Parts Graph Icon — toggles graph display on/off
5— DTC Results List — displays current DTCs
Submenu options may include:
• Trouble Code Info rmation—opens a list of codes in ECM memory
• History Codes—opens a list of codes whose symptoms are not currently present. History
codes indicate an intermittently occurring problem.
• Failed This Ignition—opens a list of codes that set during the current ignition cycle.
• MIL SVS or Message Requested—displays ECM requests to turn on the malfunction
indicator lamp (MIL) or service vehicle soon (SVS) lamp, or display a driver information alert.
• Last Test Failed—displays a complete list of failed tests.
• T est Failed Since Code Cleared—displays a list of tests that failed since the last time codes
were cleared from ECM memory.
26
Page 34

Scanner Scanner Operation
NOTE:
IMPORTANT:
Clear Codes
The diagnostic tool clears codes from the vehicle electronic control module memory on most
vehicles. If this function is not available on the test vehicle, Clear Codes does not appear as a
menu option.
i Clear Codes is also available from OBD-II Health Check (see OBD Health Check‚ on page 48).
z To clear codes:
1. Select Clear Codes from the Codes Menu.
A confirmation message displays.
2. Make sure any conditions shown on the confirmation message are met, then select Yes.
A “codes cleared” message displays once the operation is complete.
3. Select Continue to return to the Codes Menu.
Clearing codes erases all temporary ECM information, including Freeze Frame/Failure Records.
Make sure no vital diagnostic information will be lost before clearing codes.
Freeze Frame/Failure Records
This selection displays the DTC that was set, along with corresponding data, when the ECM
commanded the malfunction indicator lamp (MIL) to turn on.
27
Page 35

Scanner Scanner Operation
DTC Status
This selection allows you to view the records of a particular DTC.
z To check DTC status
1. Select DTC Status from the Codes Menu.
The DTC Status entry field displays (Figure 4-13).
2. Use the touch keypad on the screen to enter the characters of the DTC.
3. Select the Check Mark icon on the toolbar once all the code characters are entered.
The DTC status report displays (Figure 4-13).
4. Select Back to return to the DTC status entry screen.
5. Select Back again to return to the Codes menu.
Figure 4-13 DTC Status entry field
28
Page 36

Scanner Scanner Operation
NOTE:
Data Display
Select Data to view PID data from the vehicle ECM. In data display mode the screen has a toolbar
and a main body (Figure 4-14).
Figure 4-14 Data display screen
The toolbar control icons are described in Scanner Control Icons‚ on page 17 and Common
Toolbar Control Icons‚ on page 12.
During data display the main body of the screen is divided into two columns; the left-hand column
has a description of the parameter and the right-hand column shows the parameter value or state.
Parameters are listed in the order in which they are transmitted by the ECM, so expect variations
between years, makes, and models.
Up to three parameters can be locked, or fixed, at the top of the list. Locked parameters do not
change as you scroll through the parameter list. The Lock/Unlock icon on the toolbar selects
which parameters are fixed (see Locking Parameters‚ on page 31).
Displayed data may also be paused or saved for detailed review and future reference, see Saving
Files‚ on page 34 and Pausing and Reviewing Data Files‚ on page 35.
Customizing the Data List
The Custom Data List icon on the toolbar is used to determine which specific parameters display.
Minimizing the number of parameters on the data list allows you to focus on any suspicious or
symptom-specific data parameters. You can add or remove most parameters from the list. Certain
vital parameters may not be removed. These appear in gray at the top of the list along with a lock
icon, and they cannot be selected.
i Limiting the number of parameters that display to those that apply to a particular situation results
in a faster data refresh rate, and reduces the amount of memory used for saved files.
29
Page 37

Scanner Scanner Operation
z To create a custom data list:
1. Select the Custom Data List icon on the toolbar.
The data selection screen displays and selection icons appear. Check marks to the left of the
parameter description indicate which parameters are selected for display. A second smaller
check box indicates a parameter that is locked.
The toolbar icons provide options for selecting and deselecting parameters to include or
remove from the custom data list:
Icon Description
Select/Deselect, use to mark individual
parameters to hide or display. Locked
parameters cannot be deselected.
Select All/Deselect All, use to hide or
display all of the parameters in the list.
Locked parameters cannot be hidden. Items
at the top of the list that cannot be
highlighted are locked and cannot be turned
off.
2. Create a custom data list by selecting (check mark box by parameter name) the parameters
to include.
3. Select Back to display the updated data list.
Changing Screen Views
Selecting the View icon opens a drop-down menu of options:
• PID List
• 1 Graph
• 2 Graph
• 4 Graph
The PID (parameter identification) List view is a 2-column display with the name of the parameters
in the left column and their current values in the right column (Figure 4-15).
The 1, 2, and 4 Graph views divide the screen horizontally to simultaneously display data graphs
for the indicated number of parameters (Figure 4-15). Use the scroll bar or the up (b) and down
(d) icons to view other parameters in the list.
30
Page 38

Scanner Scanner Operation
NOTE:
Figure 4-15 Four graph view
i Any previously set conditions, such as held data or locked lines of data, remain in effect when the
screen view is changed.
Locking Parameters
Use the Lock/Unlock icon to hold selected lines of the data in place and prevent them from
scrolling, or to release previously locked lines of data. Up to three lines of data may be held at a
time. This feature allows you to position related parameters together, making it easier to monitor
their values and spot inconsistencies.
Locked parameters display as the top frames on the main body of the display screen, as well as
at their usual position within the data list (Figure 4-16). A lock icon appears to the left of the
parameter name to indicate it is locked.
z To lock parameters:
1. Highlight the parameter to be locked.
2. Select the Lock/Unlock icon on the toolbar to lock it.
A copy of the locked parameter is now shown at the top of the data list, and a lock icon
appears alongside the parameter name.
3. Highlight and select additional parameters to lock.
31
Page 39

Scanner Scanner Operation
NOTE:
Up to three parameters can be locked at a time. Once locked, a parameter remains locked
until it is manually unlocked, or communication with the vehicle is stopped.
2009 Peugeot 407 1.6L 16V T-Diesel (9HZ)
Figure 4-16 Locked parameters
i If three parameters are locked, one of them must first be unlocked before another parameter can
be locked.
z To unlock parameters:
1. Scroll through the data list and highlight the parameter to be unlocked, or released.
2. Select the Lock/Unlock icon on the toolbar.
The released parameter and the lock icon disappear from the list at the top of the data list.
3. Repeat Step 1 and Step 2 to release other parameters if needed.
Setting Trigger Levels
The trigger icon allows you to configure the diagnostic tool to automatically save PID data from
buffer memory to a file when a parameter value crosses a threshold. When triggering is armed, a
"Trigger event" pauses data collection and saves data to a file.
Selecting the Trigger icon opens a menu that includes:
• Set Trigger—establishes upper and lower signal values to initiate an event capture for the
highlighted parameter.
• Arm Trigger—activates the diagnostic tool to capture an event when the signal crosses a
threshold value.
Trigger lines change colors to indicate the trigger is armed.
• Clear All Triggers—deletes all previously set trigger levels.
If triggers are set the menu options are:
• Clear Trigger—deletes set trigger levels for the highlighted parameter.
• Disarm T rigger—de-activates event capture capability.
• Clear All Triggers—deletes all previously set trigger levels.
32
Page 40

Scanner Scanner Operation
NOTE:
z To set trigger levels :
1. Highlight the parameter to be used for triggering the recording.
2. Select the Trigger icon.
3. Select Set Trigger from the drop-down menu.
A graph of the highlighted parameter with a trigger toolbar above it fills the main body of the
screen (Figure 4-17).
2009 Peugeot 407 1.6L 16V T-Diesel (9HZ)
Figure 4-17 Trigger set screen
The trigger level line displays as a solid line running horizontally across the data graph. An
upper and lower trigger level must be set, the upper level is set first.
4. Select the plus (+) and minus (–) icons on the toolbar, or use the up b and down d arrow
buttons to position the upper trigger level to where you want it on the graph.
5. Select a on the toolbar, or press the Y/a button, to set the upper threshold.
A lower trigger level line now appears at the mid-point of the graph.
6. Select the plus (+) and minus (–) icons on the toolbar, or use the up b and down d arrow
buttons to position the lower trigger level line to where you want it on the graph.
7. Select a on the toolbar, or press the Y/a button, to set the lower threshold.
The display returns to the PID data view and the trigger points appear as horizontal lines across
the designated parameter graph. Repeat this procedure to establish trigger points for other
parameters if desired. Once armed, any data points that register outside of your set conditions
pause data collection and save data to a file.
i Only three parameters can have trigger levels set at one time, but only one of the conditions needs
to be satisfied for triggering to occur.
33
Page 41

Scanner Scanner Operation
NOTE:
z To arm triggers:
1. Select the Trigger icon on the toolbar.
2. Select Arm Triggers from the drop-down menu.
The trigger lines on the data graphs change color to indicate an armed condition.
Triggers for all of the graphs are armed simultaneously. Once triggering is armed, it remains in that
state until you switch it off. If trigger settings are modified or are added for other parameters, they
are armed as soon as you exit the setting screen.
Saving and Reviewing Scanner / OBD-II/EOBD Data Files
The following procedures are used when saving and reviewing data files for Scanner and
OBD-II/EOBD.
Saving Files
During normal operation, data from the vehicle’s ECM is continuously being stored in buffer
memory as it is displayed onscreen. Buffer memory is limited to a predetermined “total” size and
is displayed on the counter (located below the toolbar on the right side of the screen)
(Figure 4-19).
Selecting Save writes the stored buffer memory to a file. Saving data is useful when trying to
isolate an intermittent problem or to verify a repair during a road test. The saved file can be played
back (similar to a movie clip) by selecting Previous Vehicles and Data > V iew Saved Dat a. See
View Saved Data‚ on page 72 for additional information.
i The Save icon performs the same function as “Save Movie” function choice for the programmable
Shortcut button, see Configure Shortcut Button‚ on page 126 for details.
The saved data file can also be downloaded to a personal computer (PC) using the Mini USB jack.
Once connected to the PC, the data files can be printed, transferred, and copied using
ShopStream Connect. ShopStream Connect is an application that creates an interface between
the diagnostic tool and a PC. The ShopStream Connect application is available free online, see
the ShopStream Connect website information at the front of this manual for additional information.
The toolbar control icons are described in Scanner Control Icons‚ on page 17 and Common
Toolbar Control Icons‚ on page 12.
34
Page 42

Scanner Scanner Operation
4BWJOH4$.
/PUF4BWJOHMBSHFGJMFTNBZUBLFTFWFSBMNJOVUFT
z To save data:
• Select Save.
A save dialog box displays while data is being saved. The data is saved when the message
box disappears.
Figure 4-18 Save dialog box
Saving Screens
The Shortcut button can be programmed to save a snapshot of a visible screen as a bitmap file,
see Configure Shortcut Button‚ on page 126 for details The saved file can be viewed by selecting
Previous Vehicles and Data > View Saved Dat a, see View Saved Data‚ on page 72 for
additional information.
Pausing and Reviewing Data Files
During normal operation, data from the vehicle’s ECM is continuously being stored in buffer
memory as it is displayed onscreen. The Pause feature, allows you to temporarily pause data
collection to review it in detail.
z To pause and review data
Toolbar control icons are described in Scanner Control Icons‚ on page 17 and Common Toolbar
Control Icons‚ on page 12.
1. While viewing data, select the Pause icon.
On the toolbar, the playback control icons are displayed. A counter displays along the right-
hand edge of the screen between the toolbar and the main body. A bar graph to the left of the
counter shows how much data is in the memory buffer. A slider on the bar graph indicates the
position of the current screen in relation to the entire contents of the data buffer.
Use the slider to quickly scroll through the data. Use the control icons to accurately position
the cursor. The cursor (vertical line), indicates your position when in the graph mode, appears
once you begin navigating (Figure 4-19).
35
Page 43

Scanner Scanner Operation
NOTE:
9
87
6
54321
2009 Peugeot 407 1.6L 16V T-Diesel (9HZ)
1— Skip Back
2— Skip Forward
3— Step Back
4— Step Forward
5— Record
Figure 4-19
2. Scroll up or down to review the list of data.
3. Select the desired control icon to move forward or back incrementally in the selected direction.
6— Bar Graph
7— Slider
8— Counter (current position / total)
9— Cursor
z To resume:
• Select the Record icon.
The display changes back to display data and the Pause icon is shown on the toolbar. A
vertical rule runs through the data graph to indicate data was paused at that point.
i The Shortcut icon can be set to perform the Pause/Play function. See Configure Shortcut Button‚
on page 126 for additional information.
Functional T ests
The Functional Tests selection is used to access vehicle-specific subsystem tests. Available
tests vary by manufacturer, year, and model. Only the tests available for the identified vehicle
display in the menu.
There are several types of functional tests:
• Information Test s—these are read-only tests, like selecting “VIN” from a Functional Tests
menu to display the VIN of the identified vehicle.
• T oggle T ests—these tests switch a component, such as a solenoid, relay, or switch, between
two operating states.
36
Page 44

Scanner Scanner Operation
• Variable Control Tests—these tests command a certain value for a system or component,
such as varying spark timing in 1° increments or EGR valve duty cycle in 10% increments.
• Reset Test s—these tests reset the adaptive, or learned, values that are stored in the vehicle
electronic control module memory.
• Scripted Tests—these tests are software routines that place the vehicle into special
operating modes for performing certain repairs, such as bleeding brakes with ABS.
Selecting Functional Tests opens a menu of test options that varies by make, year, and model.
Selecting a menu option either activates the test or opens a submenu of additional choices. Follow
all screen instructions while performing tests. How and what information is presented on the
screen varies according to the type of test being performed and the vehicle being serviced.
Toggle and variable control tests often display functional test controls on the toolbar at the top of
the screen with PID data in the main body (Figure 4-20).
2009 Peugeot 407 1.6L 16V T-Diesel (9HZ)
Figure 4-20 Functional test screen
A Test icon on the toolbar activates the test, and a Return, or similarly named, icon cancels the
test. For variable control tests, the variable value displays between the main body and the toolbar.
Plus and Minus icons on the toolbar increase and decrease the variable value.
A Data List icon, shown to the left, is available on the toolbar for some tests. This feature allows
you to change which data list displays in the main body without exiting the functional test. The icon
is only available when the test is inactive.
Generic Functions
Generic Functions are use to perform generic OBD-II/EOBD tests, for additional information see
OBD-II/EOBD‚ on page 47.
37
Page 45

Scanner Scanner Operation
NOTE:
Troubleshooter (Fast-Track®)
Fast-Track Troubleshooter is a database of experience-based repair strategies and information,
that has been compiled and validated by top-notch technicians. Troubleshooter simplifies the
diagnosis process, as it contains information on virtually all common diagnostic trouble code
(DTC) problems and driveability symptoms.
Troubleshooter information is organized into a series of diagnostic tips that are designed to quickly
lead you to the root cause of a particular problem. The tips are vehicle-specific, which means only
tips that relate to the identified vehicle are presented. Selecting opens a menu that may include:
• Code Tips—provides detailed information on setting conditions, testing, and interpreting test
results for specific codes.
• Symptom Tips—provides diagnostic tests and procedures based on vehicle operation.
• Time Savers—provides supplemental information, such as firing order and #1 cylinder
location, that may be needed to make a diagnosis.
• Common Problems—provides advice and remedies for certain “pattern failures” that have
been experienced on vehicles of the same model.
• T ests and Procedures—explains how to perform certain tests on the specific test vehicle.
Some tips provide specifications and installation information as well.
• Fast-T rack Data Scan—contains information and guidelines on how to validate data readings
for certain sensors and actuators, PID data values are provided.
• Fast-T rack Fixe s—provides actual repair information for related repairs.
i Troubleshooter appears in a Scanner menu only if tips are available for the system selected on the
identified vehicle.
Certain PID data parameter values display directly within the tip when performing Troubleshooter
tests and procedures.
Figure 4-21 Troubleshooter tip
38
Page 46

Scanner Exiting Scanner
NOTE:
4.4 Exiting Scanner
Scanner function remains open as long as there is an active communication link with the vehicle.
You must interrupt this communication link in order to exit from tests and power down the
diagnostic tool. A warning message displays if you attempt to shut down while the diagnostic tool
is communicating with the vehicle.
i Damage to the vehicle electronic control module (ECM) may occur if communication is disrupted.
Make sure the data cable is properly connected at all times during testing. Exit all tests before
disconnecting the data cable or powering down the diagnostic tool.
z To exit the Scanner function:
1. From any active data screen, select the Back icon on the toolbar.
A “stopping communications” message briefly displays followed by the Data menu.
2. From the Data Menu, select Back on the toolbar.
Again, a “stopping communications” message briefly displays followed by the Main menu.
Now, the diagnostic tool is no longer communicating with the vehicle and it is safe to return to the
Home screen and power down the diagnostic tool.
39
Page 47

Scanner SureTrack
NOTE:
NOTE:
4.5 SureT rack
SureTrack is a comprehensive source of expert knowledge for professional technicians,
combining diagnostic experience and detailed parts replacement records. SureTrack will help you
improve diagnostic accuracy and reduce repair time.
SureTrack features:
• A Common Replaced Parts graph displaying the parts that are most frequently replaced to
successfully complete repairs based on actual vehicle repairs.
• Tips and fixes obtained from completed repairs, validated by SureTrack expert technicians.
• Up-to-the-minute intelligence based on vehicles currently being serviced nationwide.
i To access SureTrack, you must have the current software update installed on your scan tool, the
Wi-Fi radio turned on and connected to a wireless network. For Wi-Fi setup and connection see,
Configure Wi-Fi - Operation, Setup and Testing‚ on page 133
4.5.1 SureTrack Operation
Before you begin using SureTrack, familiarize yourself with the SureTrack control icons shown
below.
Common
Fix It! Icon Related Tips Icon Real Fixes Icon Menu Exit Icon
Opens the
SureTrack
dashboard
SureTrack repair information may be accessed while reviewing DTC using the Scanner function.
As an example, navigate to Engine > Codes Menu > Display Codes > Engine Trouble Code
Information to view current DTCs and related repair information.
If SureTrack information is available for a selected DTC, the SureTrack status bar will display
“SureTrack - Results for XXX” (XXX = the selected DTC).
To view SureTrack information for a specific DTC, select the desired DTC from the list to highlight
it, then select the Fix It! icon (Figure 4-22). Selecting Fix It! opens the SureTrack dashboard. See
SureTrack Dashboard on page 42 for additional information.
Displays Related
Tips for the selected
DTC
Displays Related
and Real Fixes for
the selected DTC
Exits the
SureTrack
dashboard
Replaced Parts
Graph Icon
Toggles Common
Replaced Parts
Graph display on/off
i The Common Replaced Parts graph can be viewed directly from the DTC results screen by
selecting the Common Replaced Parts Graph icon, located to the left of Common Replaced Parts
Graph title bar (Figure 4-22).
40
Page 48

Scanner SureTrack
'PSE'PDVT-%PID1
Figure 4-22 SureTrack DTC results
1— Fix It! Icon — opens SureTrack Dashboard
2— Save Icon — saves the DTCs list (see, Saving and Reviewing Scanner / OBD-II/EOBD
Data Files on page 34)
3— SureTrack Status Bar — displays the active SureTrack status or result
4— Common Replaced Parts Graph Icon — toggles graph display open/close
5— DTC Results List — displays current DTCs
41
Page 49

Scanner SureTrack
'PSE'PDVT-%PID1
SureTrack Dashboard
Selecting the Fix It! icon from the DTC results screen opens the SureTrack dashboard. The initial
Dashboard screen displays both the Common Replaced Parts Graph and either a Tip or Real Fix
for the current DTC (depending on availability). The Related Tips and Real Fixes icons are also
available from this screen (Figure 4-23).
5— Common Replaced Part Graph Icon
— toggles graph display open/close
6— Common Replaced Part Graph
7— Real Fix
1— Fix It! Icon
2— Related Tips Icon
3— Real Fixes Icon
4— Dashboard Exit Icon
Figure 4-23 SureTrack dashboard
42
Page 50

Scanner SureTrack
Common Replaced Parts Graph
The Common Replaced Parts graph is displayed by selecting the Fix It! icon or can be viewed
directly from the DTC results screen by selecting the Common Replaced Parts Graph icon,
located to the left of Common Replaced Parts Graph title bar. The Common Replaced Parts graph
shows the percentage of verified fixes (using the parts listed) derived from the total number of
repairs by mileage. The graph may display one or more replacement parts based on the captured
information. The example below shows a common replaced part for DTC P0106. In this example,
the Airflow Sensor is the most common replaced part based on 86 repairs involving vehicles with
up to 200k miles. From the graph it can be determined that the majority of the repairs were made
to vehicles with 125k or more miles, with 30% at 125k miles and approximately 28% at 175k miles
(Figure 4-24).
Figure 4-24 Common Replaced Parts graph
43
Page 51

Scanner SureTrack
'PSE'PDVT-%PID1
'PSE'PDVT-%PID1
Real Fixes and Related Fixes
– Real Fixes - Verified successful repair information and/or procedures for the selected
DTC
– Related Real Fixes - Additional Real Fixes that may be related to the selected DTC.
Fixes have been researched and obtained from professional automotive OEM and specialty
technicians from a vast range of repair shops. Fixes may not be available for every vehicle and or
DTC.
Fixes (if available) can be displayed in two ways:
• Selecting the Fix It! icon (Figure 4-23) from the DTC results screen opens the SureTrack
dashboard which may include Real Fixes for the selected DTC. If Real Fixes are not available
for the DTC, Tips may be displayed.
• Selecting the Real Fixes icon (Figure 4-23) displays Related and Real Fixes (if available).
Selecting an item from the list opens additional details about the Fix in a Complaint, Cause,
Correction format (Figure 4-25and Figure 4-26).
Figure 4-25 Real Fix example
Figure 4-26 Related and Real Fixes examples
44
Page 52

Scanner SureTrack
'PSE'PDVT-%PID1
'PSE'PDVT-%PID1
Tips and Related Tips
–
Tips - Experience-based diagnostic and repair tips and information for the selected DTC
– Related Tips - Additional Tips that may be related to the selected DTC
Tips have been researched and obtained from professional automotive OEM and specialty
technicians from a vast range of repair shops. Tips may not be available for every vehicle and or
DTC.
Tips (if available) can be displayed in two ways:
• Selecting the Fix It! icon from the DTC results screen opens the SureTrack dashboard which
may include Tip(s) for the selected DTC. If Tips are not available for the DTC, Real Fixes may
be displayed.
• Selecting the Related Tips icon will display a list of Related Tips. Selecting an item from the
list, opens additional details about the Related Tip (Figure 4-27).
Tip information may include DTC descriptions, symptoms, setting conditions, repair actions and
procedures, clearing conditions, diagnostic aids and other references.
Figure 4-27 Tips and Related Tips examples
45
Page 53

Scanner SureTrack
SureTrack S tatus Messages
Depending on your software version and connection status one of the following messages may
appear in the SureTrack status bar:
• SureTrack Content May Be Available! - indicates SureTrack content may be available,
however you are not currently connected to the Snap-on web services network. This message
may be caused by a Wi-Fi connection issue or if you do not have the current scan tool
software upgrade installed. See Wi-Fi Troubleshooting and Status Messages‚ on page 137 for
SureTrack Troubleshooting information.
• No connection to SureT r ack. Plea se try again la ter. - indicates you are not currently
connected to the Snap-on web services network, except when displayed in the OBD/EOBD
function as SureTrack is not accessible in OBD/EOBD mode. If this message is displayed in
the Scanner function, it may be caused by a Wi-Fi connection issue, or if you do not have the
current software upgrade installed. See Wi-Fi Troubleshooting and Status Messages‚ on
page 137 for SureTrack Troubleshooting information.
• Verifi ed parts replacement data not available. Tap the wrench icon for more results -
indicates SureTrack parts replacement information is not available at this time, however
related tips or other service information may be available (select the Fix It! icon).
• Loading content from SureTrack - indicates SureTrack information is being updated from
the Snap-on web services network.
• A new diagnostic software upgrade is ava ilable. See yo ur sales re presen tative for
details - indicates your access to SureTrack will be expiring soon and you should contact your
sales representative to purchase the current software upgrade.
• Y our SureT rack acce ss has expired. See your Sales repres entative to r enew . - indicates
your access to SureTrack has expired and you should contact your sales representative to
purchase the current software upgrade.
46
Page 54

Chapter 5 OBD-II/EOBD
NOTE:
This chapter describes the basic operation of the OBD-II/EOBD function.
The OBD-II/EOBD icon is located on the Home screen.
The OBD-II/EOBD function allows you to access “generic” OBD-II/EOBD data.
Generic OBD-II/EOBD data is data limited to emission related diagnostics such as:
• Checking for emissions-related diagnostic trouble codes (DTCs)
• Checking the cause of an illuminated malfunction indicator lamp (MIL)
• Checking monitor status prior to emissions certification testing
To access other available electronic control module (ECM) data for vehicle specific systems,
parameters or enhanced diagnostics use the Scanner function, see Scanner on page 16.
i The OBD-II/EOBD function can also be used to access “generic” OBD-II/EOBD data for
OBD-II/EOBD compliant vehicles that are not included in the Scanner function databases.
5.1 Basic Operations
5.1.1 Screen Layout and Toolbar Controls
Screen layout and toolbar controls are similar to the Scanner function, see Scanner Control Icons
on page 17.
5.1.2 Connecting the Data Cable
Connection of the data cable to the Diagnostic Tool and vehicle DLC is required for OBD-II/EOBD
testing, see Data Cable Connection‚ on page 14.
5.1.3 Saving and Reviewing Data Files
Save and Pause control icon operation and data review procedures are the same as used for the
Scanner function, see Saving and Reviewing Scanner / OBD-II/EOBD Data Files‚ on page 34.
5.2 OBD-II/EOBD Menu
The following options are available from the OBD-II/EOBD menu:
• OBD Health Check
• OBD Direct
47
Page 55

OBD-II/EOBD OBD-II/EOBD Menu
5.2.1 OBD Health Check
The OBD-II Health Check offers a way to quickly check for and clear emissions-related diagnostic
trouble codes (DTCs), and to check readiness monitors for emissions testing. Selecting opens a
connection message. Select Continue or press the Y/a button to open a submenu of test options
(Figure 5-1).
Figure 5-1 OBD Health Check menu
Global OBD II Code Check
Global OBDII Code Check displays stored emission related generic DTCs reported by the ECM.
Selecting opens a submenu with two choices: Codes and Pending Codes. Either option opens a
code list (Figure 5-2).
The DTC results screen is similar to the same screen used in the Scanner function, as both display
the SureTrack results message below the toolbar. However, SureTrack is not accessible and no
information is displayed in OBD-II/EOBD mode. SureTrack is only accessible in the Scanner
function where the vehicle has been identified.
Figure 5-2 DTC Results Screen
48
Page 56

OBD-II/EOBD OBD-II/EOBD Menu
NOTE:
Codes
The Codes option displays a list of current emission related DTCs.
OBD-II/EOBD Codes have a priority according to their emission severity. The priority of the code
determines the illumination of the MIL and the code erase procedure. Vehicle manufacturers have
implemented the ranking differently, so there are differences between makes.
Pending Codes
The purpose of this service is to enable the Diagnostic Tool to obtain “pending” or maturing
diagnostic trouble codes. These are codes whose setting conditions were met during the last drive
cycle, but need to be met on two or more consecutive drive cycles before the DTC actually sets.
i Save valuable time by using this service to verify test results after a single drive cycle following a
vehicle repair and code clearing procedure.
• If a test failed during the drive cycle, the DTC associated with that test is reported. If the
pending fault does not occur again within 40 to 80 warm-up cycles, the fault is automatically
cleared from memory.
• Test results reported by this service do not necessarily indicate a faulty component or system.
If test results indicate another failure after additional driving, then a DTC is set to indicate a
faulty component or system, and the MIL is illuminated.
Refer to the Global OBD Vehicle Communication Software Manual for additional information.
Global OBD II Clear Codes
This option is used to clear all emission related diagnostic data, such as DTCs, freeze frame data,
and test results, from the memory of the selected ECM. Although OBD-II/EOBD displays generic
OBD-II/EOBD data only, clearing codes erases all of the stored data, including any enhanced
codes and freeze frame information.
A confirmation screen displays when the clear codes option is selected to prevent accidental loss
of data. Select to continue from the confirmation screen. Refer to the Global OBD Vehicle
Communication Software Manual for additional information.
Readiness Monitors
This test checks the status of the readiness monitoring system. An OBD-II /EOBD control system
runs continuous and periodic tests to check the status of emission-related systems. Two options
are available for Readiness Monitors:
• Monitors Complete Since DTC Cleared—displays the status of all monitors that have run
since the last time ECM memory was erased.
• Monitors Complete This Cycle—displays the status of the monitors that ran during the
current drive cycle only.
49
Page 57

OBD-II/EOBD OBD-II/EOBD Menu
Selection of either option displays test results as shown in the data viewer (Figure 5-3).
Quick reference indicators are used to show monitor status on the left side of the screen
(Figure 5-3):
• Green icon “a” mark - Monitor test is complete
• Grey icon “—” mark - Monitor test is not complete
• Red icon “X” mark - Monitor test is not supported by vehicle
Use the scroll bar to view the entire list of Readiness Monitors.
Selecting Save from the toolbar saves the monitor data as an .SCM file for review at a later time.
See View Saved Data‚ on page 72 for additional information.
MIL Status
This test checks the ECM commanded state (on or off) if the malfunction indicator lamp.
5.2.2 OBD Direct
OBD Direct includes the following menu and submenu choices:
• OBD Diagnose
– Start Communication - initiates a test session
– Connector Information - provides DLC location details
– Manual Protocol Selection - provides choices for communication protocol
• OBD Training Mode - allows you to familiarize yourself with the capabilities of OBD-II/EOBD
while navigating through menus without being connected to a vehicle.
Figure 5-3 Readiness monitor test report
50
Page 58

OBD-II/EOBD OBD-II/EOBD Menu
Start Communication
Use the following procedure to begin an OBD-II/EOBD test session:
z To perform an OBD-II/EOBD Test:
1. Connect the data cable to the test vehicle.
2. Select Start Communications from the OBD-II/EOBD menu.
A series of messages are displayed indicating automatic detection of vehicle type (12 or 24 V)
has occurred and then the detected controllers are displayed.
The Diagnostic Tool establishes a communication link with the test vehicle, then opens an
information screen (Figure 5-4).
Figure 5-4 Protocol information
The information screen shows how many control modules were detected, which ECM is
communicating, and which communication protocol is being used.
3. Select Continue.
A Select Service menu of available tests opens:
– Readiness Monitors‚ on page 52
– MIL Status‚ on page 52
– Fast-Track Troubleshooter‚ on page 52
– ($01) Display Current Data‚ on page 53
– ($02) Display Freeze Frame Data‚ on page 53
– ($03) Display Trouble Codes‚ on page 53
– ($04) Clear Emissions Related Data‚ on page 53
– ($05, 06, 07) Display Test param./Results‚ on page 54
– ($08) Request Control of On-board System‚ on page 55
– ($09) Read Vehicle Identification‚ on page 55
– ($09) In-use Performance Tracking‚ on page 55
– ($0A) Emission Related DTC with Permanent Status‚ on page 55
51
Page 59

OBD-II/EOBD OBD-II/EOBD Menu
IMPORTANT:
All service modes are not supported by all vehicles, so the available menu selections will vary.
Figure 5-5 Service mode menu
4. Select a test to continue.
Readiness Monitors
Use this menu item to check the readiness of the monitoring system. Monitors not supported will
display “not supported”. Scroll, if needed, to view the entire list of monitors (Figure 5-3). Selecting
Readiness Monitors opens a submenu with two choices:
• Monitors Complete Since DTC Cleared—displays the results of all monitor tests that have
run since the last time the vehicle electronic control module (ECM) memory was cleared.
• Monitors Complete This Cycle—displays only the results of monitor tests that ran during the
current drive cycle, they reset when the ignition is switched off.
MIL Status
This item is used to check the current condition of the malfunction indicator lamp (MIL). Additional
information, such as which ECM commanded the MIL on and the distance driven while the MIL is
on (if supported), can also be displayed. The MIL Status report can also be saved as part of the
vehicle records.
Fast-Track Troubleshooter
Fast-Track® Troubleshooter is a database of experience-based repair strategies and information,
that has been compiled and validated by top-notch technicians. The Troubleshooter system
simplifies the diagnosis process, as it contains information on virtually all common diagnostic
trouble code (DTC) problems and driveability symptoms for most vehicles covered by the vehicle
communication software.
52
Page 60

OBD-II/EOBD OBD-II/EOBD Menu
($01) Display Current Data
Use this test to display the serial data transmitted by the selected vehicle electronic control
module (ECM). The main body of the screen has two columns; the left-hand column is a
description of the parameter and the right-hand column is the parameter value or state. Viewing
options and operations are the same as the Scanner function, see Data Display‚ on page 29 for
more information.
Figure 5-6 Current data display
($02) Display Freeze Frame Data
Freeze frame data provides a “snapshot” of critical parameter values at the time a DTC set.
This item is used to display freeze fame data for any stored emission related diagnostic trouble
codes (DTCs). In most cases the stored frame is the last DTC that occurred. Certain DTCs, those
that have a greater impact on vehicle emissions, have a higher priority. In these cases, the highest
priority DTC is the one for which the freeze frame records are retained.
($03) Display Trouble Codes
This is used to display any stored emission related DTCs reported by the ECM. The display is
similar to the Scanner function code display (see Display Codes‚ on page 26 for details). The list
does not include enhanced DTCs in this mode.
($04) Clear Emissions Related Data
This item is used to clear all emission related diagnostic data, such as DTCs, freeze frame data,
and test results, from the memory of the selected ECM.
53
Page 61

OBD-II/EOBD OBD-II/EOBD Menu
z To clear emission related Data:
1. Select Clear Emissions Related Data from the menu.
A confirmation message displays to help prevent loss of any vital data (Figure 5-7).
Figure 5-7 Clear codes confirmation message
2. Continue from the confirmation message.
The screen updates several times as ECM memory is erased, then a “data has been cleared”
message displays.
3. Select Continue to return to the Select Service menu.
($05, 06, 07) Display Test param./Re sults
This option opens a submenu of parameters and test results from various sensors, monitor test
results, and a record of DTC setting conditions detected during the last drive cycle. The submenu
includes:
• ($05) Oxygen Sensor Monitoring
• ($06) On-board Monitored Systems
• ($07) DTCs Detected During Last Drive
($05) Oxygen Sensor Monitoring
This option opens a menu of tests available for checking the integrity of the oxygen (O2) sensors.
Making a selection displays all of the pertinent O2 sensor parameters for the specific test. The test
identification (ID) displays at the top of the data list.
($06) On-board Monitored Systems
This option opens a menu of tests from the monitored systems. The available data is for specific
systems and components that the on-board diagnostic system monitors continuously, such as
misfire, or non-continuously, such as the catalyst system. Making a menu selection displays the
test results.
54
Page 62

OBD-II/EOBD OBD-II/EOBD Menu
($07) DTCs Detected During Last Drive
This test opens a record of any DTCs that set during the last completed drive cycle. Select to open
the DTC list.
($08) Request Control of On-board System
This service enables bidirectional control of the ECM. This service allows the Diagnostic Tool to
control the operation of an on-board system, test, or component.
($09) Read Vehicle Identifica tion
The purpose of this service is to enable the Diagnostic Tool to request and display vehicle-specific
information, such as the vehicle identification number (VIN), the calibration identification, and the
calibration verification number (CVN), of the test vehicle. Select a menu item to retrieve the
information. Select Return to go back to the menu.
($09) In-use Performance Tracking
This option displays the “In-use Performance Tracking” of data. It is a record of the number of
times each of the monitor tests have been completed. Select Return to go back to the menu.
($0A) Emission Related DTC with Permanent Status
This option displays a record of any “permanent” codes. A permanent status DTC is one that was
severe enough to illuminate the MIL at some point, but the MIL may not be on at the present time.
Whether the MIL was switched off by clearing codes or because the setting conditions did not
repeat after a specified number of drive cycles, a record of the DTC is retained by the ECM.
Permanent status codes automatically clear after repairs have been made and the related system
monitor runs successfully.
Connector Information
This option opens a database of vehicle diagnostic connector locations that includes most makes
and models. The menu driven interface leads you quickly to difficult to find test connectors.
z To locate a vehicle diagnostic connector:
1. Select Connector Information from the System menu.
A list of vehicle manufacturers displays.
2. Select a manufacturer from the list.
A list of models available from the selected manufacturer displays.
3. Select a model from the list.
If a cable adapter is needed, which one and how to connect it displays.
4. Select Continue.
Information on where to locate the vehicle diagnostic connector displays.
5. Select Continue to return to the System menu.
55
Page 63

OBD-II/EOBD OBD-II/EOBD Menu
IMPORTANT:
Manual Protocol Selection
Communication protocol is a standardized way of transferring data between an ECM and a
Diagnostic Tool. Global OBD may use the following communication protocols:
• ISO 15765-4 (CAN)
• ISO 27145 (WWHOBD CAN)
• ISO J1939 (CAN)
• ISO 9141-2 (K-LINE)
• SAE J1850 PWM (Pulse Width Modulation)
• SAE J1850 VPW (Variable Pulse Width)
• ISO 14230-4 (Keyword Protocol 2000)
• SAE J2284/ISO 15765-4 (CAN)
When initially attempting to establish communication with the ECM the Diagnostic Tool attempts
to communicate trying each protocol in order to determine which one is being used. During normal
operation the communication protocol is automatically detected. If automatic detection fails,
communication protocol can be manually selected.
Using unsupported OBD communication protocols may activate warning lights and can set
network related faults. Only use the manual selection option when OBD protocol is already known.
Select Manual Protocol Selection to open a menu of options (Figure 5-8).
Figure 5-8 Manual protocol selection menu
Select the Back icon or press the N/X button to return to the OBD-II/EOBD Main menu.
56
Page 64

Chapter 6 TSBs
NOTES:
NOTE:
This chapter describes the basic operation, and navigation of the TSBs (Technical Service
Bulletins) function.
The TSBs icon is located on the Home screen.
The TSBs function can provide the following Original Equipment Manufacturer (OEM) Technical
Service Bulletin information (if available) for the identified vehicle:
• Symptoms
• Causes or Defects*
• Solutions*
• Repair Times
• Parts Required
* Illustrations provided if available.
i
— To use the TSB feature you MUST have the current software upgrade installed on your
diagnostic tool, and be connected to a wireless network with Internet access.
— If you experience a wireless network connection loss, TSB data will not refresh and/or may
cause the program to stop. To continue use, you must re-establish your Internet connection.
6.1 Operation
i The information and procedures provided by the TSBs function is vehicle specific, therefore a
vehicle must be identified before information can be displayed.
There are two methods to access this function:
• Selecting the TSBs icon from the Home screen - See Viewing TSBs (using the Home
Screen icon)‚ on page 58.
• Selecting the TSBs menu option from within a current Scan ner ses sion - See Viewing
TSBs (using Scanner)‚ on page 60.
57
Page 65

TSBs Operation
Scope MultimeterScanner Guided Component
Tests
Tools
OBD-II/EOBD
Previous Vehicles
and Data
TSBs
z Viewing TSBs (using the Home Screen icon)
1. Select the TSBs icon from the Home Screen (Figure 6-1).
Figure 6-1 Home Screen - TSBs icon
2. Identify the vehicle, by following the screen prompts to select the vehicle information
(e.g. make, year, model, etc.).
3. Select OK.
4. Select a vehicle area, (e.g. Engine, Transmission, Brakes, etc) (Figure 6-2).
5. Select the desired TSB.
If applicable, use the scroll bar or directional buttons (b, d) to scroll up/down to view all of the
information.
The example shown in Figure 6-3 shows a typical TSB, describing the symptom, cause,
solution, repair time, parts required, and shows an illustration of the applicable part location.
Figure 6-2 Vehicle Area Menu
58
Page 66

TSBs Operation
Figure 6-3 Typical - TSB
59
Page 67

TSBs Operation
z Viewing TSBs (using Scanner)
1. From within a current Scanner session select TSBs from the System menu (Figure 6-4).
Figure 6-4 Scanner System Menu - TSBs Option
2. Select a vehicle area, (e.g. Engine, Transmission, Brakes, etc) (Figure 6-5).
Figure 6-5 Vehicle Area Menu
3. Select the desired TSB.
If applicable, use the scroll bar or directional buttons (b, d) to scroll up/down to view all of the
information.
See TSB example in Figure 6-3. The example, illustrates the typical sections of a TSB, the
symptom, cause, solution, repair time, parts required, and shows an illustration of the
applicable part location.
60
Page 68

Chapter 7 Guided Component Tests
NOTE:
The Guided Component Tests function provides you with an extensive collection of vehicle
specific component tests and reference information. It is like having access to a complete library
of automotive repair manuals for testing multiple vehicle components.
The preconfigured meter tests and reference information provided are vehicle specific and
designed to help save you diagnostic time, verify faulty components, and verify the repair.
Detailed instructions and reference information are provided to guide you through the testing
process, from locating the component, to selecting the appropriate test, showing test lead
connections, and illustrating electrical connector and pin configurations. In addition, test results
(including waveform examples), procedures, tips, and specifications may also be provided.
i Availability of tests and information may vary.
As an added resource, the Extras Menu provides even more support by including (non-vehicle
specific) tests and resources that allow you to quickly perform common tests, review basic
reference information and more.
7.1 Extras Menu (T op Level Menu Items)
The Extras Menu is a companion feature to the Guided Component Tests function. This resource
includes a wide collection of common (non-vehicle specific) reference information and tests, such
as measuring fuel pump current ramp, and monitoring CKP and CMP signals simultaneously. Also
included are, basic component operation and theory information, testing procedures, tips,
definitions, illustrations, diagnostic tool feature descriptions and accessory information.
• Power User Tests
• How To Guide
• Features and Benefits
• Index
Figure 7-1 Extras Icon (Top Level Menu Items)
7.1.1 Power User Tests
The Power User Tests option gives you quick access to a pre-configured meter for conducting a
number of control system tests. Tests are available with or without on-screen help. Help typically
provides a description of the test along with expected results and a link to the pre-set meter.
61
Page 69

Guided Component Tests Extras Menu (Top Level Menu Items)
7.1.2 How To Guide
The How To option provides a list of available on-screen instructions for performing tasks. Scroll
to view the entire list. Topics include:
• 10-MINUTE ELECTRONIC CLASS—provides basic electronics and circuit instructions.
• 15-MINUTE IGNITION CLASS—provides an introduction to basic ignition testing.
• ILLUSTRA TED TERMS & DEFINITIONS—provides definitions of terms, drawings and tips
associated with component testing.
• NO-ST ART BASICS—provides a guideline for diagnosing a no-start condition.
• O2 SENSOR & FEEDBACK SYSTEM ANALYSIS—displays a “live” graphing component
test meter with tips explaining the fundamental concepts of O2 sensor diagnostics.
• TEST TIPS—gives instructions for performing specific tests along with drawings and tips.
• 20-MINUTE CURRENT RAMP CLASSES—provides an introduction to current ramp testing.
7.1.3 Features and Benefits
Selecting Features and Benefits opens a menu page that includes:
• 5-MINUTE WALK THRU WITH DEMO BOARD—explains how to use the optional
demonstration board to generate sample signals and sharpen your skills.
• Features & Benefits—provides descriptions and a brief overview of meter functions.
• Accessories—opens a menu of available optional equipment.
• Product description—provides descriptions and a brief overview of meter operations.
The optional demonstration board transmits a number of adjustable electronic signals similar to
what is commonly found on modern vehicles. The demonstration board not only helps you learn
how to use the Guided Component Tests software, it allows you to hone your skills and diagnostic
techniques without an actual test vehicle. Contact your sales representative for details.
7.1.4 Index
This feature allows you to access detailed service information and specifications for a specific
component.
Selecting Index opens an alphabetical list of components, systems, tests, terms, and other items
for which there is a brief help file. Some items open an additional menu. Use the Back and Exit
buttons on the Toolbar to return or close the screen.
62
Page 70

Guided Component Tests Screen Layout and Icons
7.2 Screen Layout and Icons
This section describes the Guided Component Tests control icon functions and screen layout.
7.2.1 Screen Layout
1
2
3
4
1— Vehicle Identification
2— Toolbar—contains control icons
3— Main Body—displays menus, information, meter scales and signal traces
4— Information Panel—displays test information
5— Expand/Collapse icon—toggles Main body view between full and split views
2009 Peugeot 407 1.6L 16V T-Diesel (9HZ)
Figure 7-2 T est screen
5
Main Body
The main body of a Guided Component Test screen may display any of the following:
• Selectable Menu - Select menu options using the touch screen or control buttons.
• Component Information - Provides information to assist you with testing.
• T est Meter - The test meter can display up to two signals, simultaneously. Signal and display
adjustments are made through the Control Panel. Signals are displayed using a grid with
scales, both vertical (y axis), and horizontal (x axis).
Meter touch screen functionality is limited, however you can adjust the zero baseline position
(0 value) of the signal on the horizontal scale by touching and dragging the zero baseline
marker.
63
Page 71

Guided Component Tests Screen Layout and Icons
7.2.2 Guided Component Tests Control Icons
Guided Component Tests toolbar control icons may vary depending on the active function or test.
A yellow frame surrounding an icon (highlighted), indicates it is selected. Other control icons (not
shown) are described in Common Toolbar Control Icons‚ on page 12.
Table 7-1
Icon Function
Stop - Stops the data buffer.
Control Panel - (a). In full screen mode (when
selected) this icon displays a white frame around it,
and opens the control panel at the bottom of the
screen; while switching the active selection focus to
the Show/Hide or Probe icon in the Control Panel.
(b). In split screen mode (control panel open), when
selected this icon displays a white frame around it,
and switches the active selection focus to the
Show/Hide or Probe icon in the Control Panel.
Note: Switching active selection focus to the Control
Panel allows manual navigation (using the directional
control buttons) of the Control Panel control icons.
Cursors - Toggles cursors on/off.
Expand/Collapse Icon - Toggles the Main body
display between full and split screen.
64
Page 72

Guided Component Tests Operation
7.3 Operation
As the information and tests provided within the Guided Component Test function is vehicle
specific, the vehicle must first be identified in order to retrieve the correct data.
z To identify a vehicle:
The vehicle identification process is the same as the process used for the Scanner function,
see Vehicle Identification‚ on page 18 for additional information. Once the vehicle is identified,
a list of Systems is displayed.
z To select a system and component to test:
1. Select a system from the list (Figure 7-3).
Figure 7-3 Systems Menu
A list of components (and/or sub systems) is displayed (Figure 7-4).
2. Select a component to test.
Figure 7-4 Component Menu
65
Page 73

Guided Component Tests Operation
NOTE:
Depending on the vehicle and component selected, different options and sub-menus may be
displayed. Information and tests may vary:
• Component Information— see Component Information‚ on page 66.
• Tests— see Tests‚ on page 68.
• Reference Information—provides identification of components, connector pin location
and functions, and abbreviation reference.
7.3.1 Component Information
Component Information provides (if available) specific operational information on the selected
component, and may also include electrical connector and pin location and function details
z To view component information:
1. Select a component.
2. Select Component Information from the Component Test menu (Figure 7-5).
Figure 7-5 Component T est s Menu
i An additional selection may be required for some components (e.g. selecting front or rear for an
oxygen sensor (O2S).
66
Page 74

Guided Component Tests Operation
Component Information is displayed (Figure 7-6 and Figure 7-7).
Figure 7-6 Component Information Screen
Figure 7-7 Component Information Screen - Continued
Screens are divided into sections to quickly guide you to the correct information (available
sections and information will vary):
• Operation—provides a general description of component operation.
• Tech note—provides component related tips (e.g. common failures or faults), additional
information may include OEM service updates and recall information.
• Connector—displays illustrated electrical connectors and socket/pin identification.
• Location—provides component locations, testing tips, and alternate testing locations if
available.
Use the scroll bar to view additional information.
3. Select Back on the Toolbar, or press the N/X button, to return to the component menu.
67
Page 75

Guided Component Tests Operation
NOTE:
7.3.2 Tests
Tests provides (if available) specific instructions to help you perform tests on components.
Selecting a component test opens a preconfigured meter to start the test, and may also provide
connection instructions, specifications and testing tips.
z To select a test:
1. Select a component.
2. Select a Test from the Component Test menu (Figure 7-8).
The component test menu lists all of the tests available for the selected component. Choices
vary by the type of component, as well as the make, model, and year of the vehicle.
Figure 7-8 Component Test Menu
i An additional selection may be required for some Component Tests (e.g. selecting front or rear for
an oxygen sensor).
68
Page 76

Guided Component Tests Operation
The test screen displays (Figure 7-9).
A Guided Component Test screen initially opens with the information panel below the main
body. Use the scrollbar to display hidden information.
Figure 7-9 T est screen
Tap on the Information Panel once to display the information panel in full screen view. Tap on
it again to return to split view. The Expand/Collapse icon can also be used to toggle through
split and full screen views (Figure 7-10).
2009 Peugeot 407 1.6L 16V T-Diesel (9HZ)
2009 Peugeot 407 1.6L 16V T-Diesel (9HZ)
Figure 7-10 View Options
Some tests (e.g. signature integrity tests) may include waveforms examples within the
information panel. These waveform examples allow you to compare your test results for quick
diagnosis (Figure 7-11).
69
Page 77

Guided Component Tests Operation
Figure 7-11 Waveform Example
3. Select Back on the toolbar to return to the menu.
Channel Settings
The test meter is preconfigured, for most of the component tests. However, if the need to change
channel settings is needed, adjustments can be made by selecting the Control Panel icon from
the toolbar to display the Control Panel (Figure 7-12). For additional information on channel
settings, see Control Panel and Settings‚ on page 89.
Figure 7-12 Control Panel - Channel Controls
7.3.3 Saving and Reviewing Data Files
Save and Stop control icon operation and data review procedures are the same as used for the
Scope/Multimeter function, see Stopping and Reviewing Data Files‚ on page 112.
70
Page 78

Chapter 8 Previous Vehicles and Dat a
This chapter describes the basic operation of the Previous Vehicles and Data function.
The Previous V e hicles and Data icon is located on the Home screen. This function allows you to
select recently tested vehicles and access saved data files.
8.1 Previous V ehicles and Data Menu
The following options are available from the Previous Vehicles and Data menu:
• Vehicle History
• View Saved Data‚ on page 72
• Delete Saved Data‚ on page 75
8.1.1 Vehicle History
The Diagnostic Tool stores the identification of the last twenty-five vehicles tested, so there is no
need to go through the complete vehicle identification sequence when performing a retest after
repairs have been made. The oldest vehicle record is deleted when a new vehicle is identified
once there are twenty-five vehicles on file.
Figure 8-1 Vehicle history list
71
Page 79

Previous Vehicles and Data Previous Vehicles and Data Menu
NOTE:
z To select from the vehicle History:
1. Select Previous V ehicles and Da ta from the Home screen.
2. Select Vehicle His tory from the menu.
A list of up to 25 previously tested vehicles displays. Each vehicle is given a unique file name.
Scroll to view the entire list.
3. With the item to be opened highlighted, either select the vehicle ID or press the Y/a button.
The appropriate software loads and a vehicle ID confirmation screen displays.
4. Select OK or press the Y/a button to continue.
The System Menu for the selected vehicle displays.
8.1.2 View Saved Data
Selecting the View Saved Data menu option opens a list of all the saved data (e.g. code scan,
scope and pid movies) files and screen images that are stored in memory. Saved files are listed in
chronological order by the date and time that they were created with the most recent files are at
the top of the list.
Figure 8-2 Saved data list
Saved files can either be opened directly on the Diagnostic Tool, or downloaded to a personal
computer and opened using ShopStream Connect. See Saving and Reviewing Scanner / OBD-II/
EOBD Data Files‚ on page 34, and ShopStream Connect‚ on page 143 for additional information.
i A maximum of 50 files are displayed. To view all (if more than 50) files stored, use ShopStream
Connect. See ShopStream Connect‚ on page 143 for additional information.
z To review a saved data file or image:
1. Select Previous V ehicles and Da ta from the Home screen.
2. Select View Saved Dat a from the menu.
3. Select a file to review from the list.
72
Page 80

Previous Vehicles and Data Previous Vehicles and Data Menu
2009 Peugeot 407 1.6L 16V T Diesel (9HZ)
2011 BMW 5-Series (E60/E601) 2.5 Petrol
2011 BMW 5-Series (E60/E601) 2.5 Petrol
2011 BMW 5-Series (E60/E601) 2.5 Petrol
2011 BMW 5-Series (E60/E601) 2.5 Petrol
2009 Peugeot 407 1.6L 16V T Diesel (9HZ)
8.1.3 Viewing Codes and Code Scan Result s
When code scan or single system code results are saved, they are saved in (.XML) file format
(Figure 8-3).
Figure 8-3 Typica l - C ode R esu lts (.XML) file
The saved (.XML) file(s) can be viewed using two methods:
• On the diagnostic tool - See Viewing Code Results on the Diagnostic Tool‚ on page 73.
• In Vehicle System Report format using ShopStream Connect - See Vehicle System Report -
Viewing Code Results Using ShopStream Connect‚ on page 74, and ShopStream Connect‚
on page 143.
z Viewing Code Results on the Diagnostic Tool
Selecting a system code or a code scan results file from your saved file list (Figure 8-3), opens the
file onscreen. When opened, the (.XML) file displays basic vehicle information and a list of DTCs
with a brief description of each.
If SureTrack is active and data is available, additional troubleshooting information from SureTrack
(e.g. Common Replaced Parts data (Figure 8-4), Real Fix and Related Fixes) will also be
displayed.
73
Page 81

Previous Vehicles and Data Previous Vehicles and Data Menu
Figure 8-4 Typical - Code Scan Results (.XML file) viewed onscreen
z Vehicle System Report - Viewing Code Results Using ShopStream Connect
Saved code scan results can be transfered to a personal computer (PC) using
ShopStream Connect, and opened as a printable “Vehicle System Report”, see ShopStream
Connect‚ on page 143, for additional information.
Figure 8-5 Typical - V ehicle System Report (.XML file) viewed in ShopS tream Connect
74
Page 82

Previous Vehicles and Data Previous Vehicles and Data Menu
NOTE:
8.1.4 Delete Saved Data
This menu option is used to permanently erase saved files from memory.
z To delete a saved file:
1. Select Previous V ehicles and Da ta from the Home screen.
2. Select Delete Saved Data from the menu.
A list of saved files displays.
i The Select All/Deselect All and Delete icons become available on the toolbar so that you can
either delete individual files or clear the entire memory buffer all at once.
3. Select a file from the list and a confirmation message displays.
4. Select an option from the confirmation message:
– OK—deletes the selected file and returns to the saved files list, which no longer includes
the deleted file.
– Cancel—returns to the saved files list without deleting the selected file.
5. Select Back on the toolbar to return to the Previous Vehicles and Data menu, select Home to
return to the Home screen.
75
Page 83

Chapter 9 Scope Multimeter
The Scope Multimeter function allows you to perform multiple types of circuit and component
measurement tests. This chapter includes general operation procedures, instructions for saving
and reviewing test data, optional settings, and general reference information.
9.1 Overview
The Scope Multimeter test functions are:
• Digital Multimeter (DMM)
• Graphing Multimeter (GMM)
• Lab Scope
9.1.1 Digital Multimeter (DMM)
The digital multimeter gives you the ability to quickly make precise common electrical
measurements (e.g. DC and AC voltage, resistance and amperage) on circuits and components
to verify operation. The meter displays measurements in a digital numerical format, and is typically
used for measuring signals that are not rapidly changing.
The DMM is ideal for performing basic tests on most standard automotive circuits, and displays
the results in a large easy to see format.
To use the DMM, select the Scope Multimeter icon from the home screen then select Digital
Multimeter from the menu. See Tests and Capabilities (Quick Reference)‚ on page 79 for a list of
available testing functions.
Specifications
Function Range Accuracy/Comments
Signal
Measurement
VDC (Full Scale) 75VDC Do not measure greater than 75VDC
VAC (Full Scale) 50VAC Do not measure greater than 50VAC (rms)
Signal
Measurement
Input Impedance
Ohm Measurement
Diode Test
Continuity Test
Ohms 40 Ω—4 MΩ Fixed scales or auto ranging
Glitch Capture Approximately 50 µS -
Diode test 2V scale -
Ch. 1— (yellow jack)
10 MΩ -
Ch. 1— (yellow jack (–))
Ch. 2— (green jack (+))
Input is referenced to common ground
(GND— (black jack)
-
76
Page 84

Scope Multimeter Overview
9.1.2 Graphing Multimeter (GMM)
Unlike the DMM, the graphing multimeter provides two channels for testing and plots a visual
graphing line of the signal instead of displaying digital values. The GMM displays a signal’s
measurements over time on a two-dimensional grid. This plotted graph is basically a graphical
history (histogram) of the signal’s measurements over time.
The GMM uses a higher sample rate (than a DMM) to calculate signal measurements. This
characteristic along with the visual graph, make the GMM ideal for finding intermittent dropouts or
glitches that may not be obvious when viewing a digital value. A key advantage of the GMM is
being able to capture a signal over a long time interval and then review it’s graphical history, to
visually see if and when dropouts have occurred.
In addition, the GMM uses a combination of filter and peak detect modes to provide a good
balance between detecting fast glitches and preventing unwanted noise from displaying.
Unlike the lab scope, the sweep scales used with typical GMM tests are of longer time intervals,
and may range from seconds to minutes, compared to the lab scope sweep scales that use
relatively short time intervals (e.g. milli and micro seconds). This allows you to monitor a signal
over a longer period of time when looking for erratic glitches or dropouts.
To use the GMM, select the Scope Multimeter icon from the home screen then select Graphing
Multimeter from the menu. See Tests and Capabilities (Quick Reference)‚ on page 79 for a list of
available testing functions.
Specifications
Function Range Accuracy/Comments
Signal
Measurement
Sample Rate 1.5 MSPS
Band Width 3 MHz 3 db point @ 3 MHz
Input Impedance
VDC (Full Scale) 75VDC Do not measure greater than 75VDC
VAC (Full Scale) 50VAC Do not measure greater than 50 VAC (rms)
Ohm Measurement
Diode Test
Continuity Test
Ohms 40 Ω—4 MΩ Fixed scales
Low Amp Probe
1. Do not use the Low Amp Probe to measure current on conductors at a potential greater than
46VAC peak or 70VDC.
Ch. 1— (yellow jack)
Ch. 2— (green jack)
10 MΩ @ DC
4 kΩ @ 3 MHz
Ch. 1— (yellow jack (–))
Ch. 2— (green jack (+))
20A scale (100mV/Amp)
40A scale (10mV/Amp)
60A scale (10mV/Amp)
Each channel input is referenced to common
ground (GND— black jack)
Continuous sampling,
MSPS = mega samples per second
Channel 1 and 2
-
Connect the positive (+) Amp Probe lead to
the yellow jack on the diagnostic tool for
values on Ch.1, or to the green jack for
values on Ch. 2. Connect the negative (–)
lead to GND (black jack)
1
.
77
Page 85

Scope Multimeter Overview
9.1.3 Lab Scope
Similar to the GMM, the lab scope (oscilloscope) plots a visual image line of a signal’s
measurements over time on a two-dimensional grid. The visual line that is displayed is commonly
called a trace, and the graphical form created by a signal is called a waveform.
Unlike the DMM, the lab scope allows you to visually see a signals waveform, which in turn allows
you to see the strength and shape of the signal, as well as any noise that may be occurring on the
circuit. The lab scope also samples signals at a high rate, which allows you to see a higher level
of detail in short samples of the signal, especially in signals that change rapidly. In addition, the lab
scope also provides more control over the acquisition of the signal and in how it is displayed,
through the use of triggers and channel controls. All of these features allow you to analyze signals
in great detail when performing diagnostics.
To use the lab scope, select the Scope Multimeter icon from the home screen then select Lab
Scope from the menu. See Tests and Capabilities (Quick Reference)‚ on page 79 for a list of
available testing functions.
Specifications
Function Range Accuracy/Comments
Signal
Measurement
Sample Rate
Band Width 3 MHz 3 db point @ 3 MHz
Input Impedance
VDC (Full Scale) 100mV–400V Do not measure greater than 75VDC
VAC (Full Scale) 100mV–400V Do not measure greater than 50 VAC (rms)
Ch. 1— (yellow jack)
Ch. 2— (green jack)
For 50µS sweep 6 (MS/s)
For 100µS sweep 3 (MS/s)
For all other sweeps 1.5 (MS/s)
10 MΩ @ DC
4 kΩ @ 3 MHz
Each channel input is referenced to common
ground (GND— black jack)
Continuous sampling,
(MS/s) = mega samples per second
Channel 1 and 2
Connect the positive (+) Amp Probe lead to
20A scale (100mV/Amp)
Low Amp Probe
1. Do not use the Low Amp Probe to measure current on conductors at a potential greater than
46VAC peak or 70VDC.
40A scale (10mV/Amp)
60A scale (10mV/Amp)
78
the yellow jack on the diagnostic tool for
values on Ch.1, or to the green jack for
values on Ch. 2. Connect the negative (–)
lead to GND (black jack)
1
.
Page 86

Scope Multimeter T est s and Cap abilities (Quick Reference)
NOTE:
9.2 T est s and Cap abilities (Quick Reference)
The following chart identifies and describes available tests by function.
i Not all the tests listed are described in this manual. This list is intended as reference only.
D
G
M
M
LS Test Function
M
M
Two Channel Lab Scope Displays two Lab Scope channels automatically
a
a
a
aa
a
a
aa Volts AC RMS
aa Ohms (Ω)
a Diode/Continuity
a Frequency
a Pulse Width
a Injector Pulse Width
a Duty Cycle
aaaLow Amps (20)
Dual Graphing Meter Displays two Graphing Multimeter channels automatically
Ignition Probe
a
Volts DC
Volts DC - Average
Measures secondary Ignition voltage 2 to 50kV. Displays
secondary ignition (kV) waveforms.
Measures direct current voltage. DC voltage is measured
through the two test leads connected to a DC circuit.
Measures DC voltage using a filter to determine the
average voltage over a period in time. DC voltage is
measured through the two test leads connected to a DC
circuit.
Measures the effective AC voltage, not the peak voltage
which results in measurements with higher accuracy. The
AC RMS (root mean square) voltage value can be
defined as the equivalent DC voltage of the AC voltage
measured. RMS values are commonly used in AC
electrical measurement, as they are more representative
of DC measurements.
Measures electrical resistance (opposition to current) 0 to
4 MΩ. Scope supplied DC current is passed through the
circuit to measure the resistance between the two
connected test leads.
Measures voltage drop across a diode and continuity
through a diode. Scope supplied DC current is passed
through the diode to measure the voltage drop between
the two connected test leads. Typical setup for positive to
negative current flow - positive lead (anode +/side) and
negative (cathode -/side)
Measures the number of times a signal repeats itself per
second. Used to measure frequency of signals such as
CKP, CMP and wheel speed sensors.
Measures the on-time of various components (e.g.
components that cycle on and off like the EGR, or
canister purge).
Measures fuel injector on-time when checking for
variances when engine load is changed and/or physical
problems with the injector
Measures the ratio of the pulse width to the complete
cycle width, the on-time of components that cycle on and
off like EGR, or canister purge from 0–100%
Used to measure amperage of typical devices (e.g.
ignition coils, injectors, fuel pumps) that may draw up to
20A peak (startup) when initially started. Also used to
measure parasitic draw.
79
Page 87

Scope Multimeter T est s and Cap abilities (Quick Reference)
D
G
M
M
LS Test Function
M
M
Used to measure amperage of typical motors and devices
aaaLow Amps (40)
aaaLow Amps (60)
a MC Dwell (60)
a MC Dwell (90)
aa100 PSI Vacuum
aa100 PSI Pressure
aa500 PSI Pressure
aa5000 PSI Pressure
aaMT5030 Vacuum
aaMT5030 Pressure
aaEEDM506D Temperature
that may draw up to 40A peak (startup) when initially
started.
Used to measure amperage of larger motors and devices
that may draw up to 60A peak (startup) when initially
started.
Measures carburetor Mixture Control Solenoids (0–60°).
The duty cycle of the solenoid is expressed in the dwell
angle of a 6 cylinder engine: 100% = 60 deg.
Measures fuel system Mixture Control Solenoids (0–90°).
The duty cycle of the solenoid is expressed in the dwell
angle of a 4 cylinder engine: 100% = 90 deg.
Used to measure vacuum up to 20 in.Hg,
using the 0–100 psi transducer
Used to measure pressures for typical systems such as,
fuel, oil, EVAP, hydraulic/transmission fluid etc. up to 100
psi, using the 0–100 psi transducer
Used to measure pressures for typical systems such as,
hydraulic/transmission fluid pressure, cylinder
compression, and AC high side up to 500 psi, using the
0–500 psi transducer
Used to measure pressures for typical systems such as,
ABS, power steering, and heavy-duty hydraulic system
fluid up to 5000 psi, using the 0–5000 psi transducer
Used to measure vacuum up to 29 in.Hg,
using the MT5030 pressure transducer adapter
Used to measure fluid and gas pressures up to 500 psi,
using the MT5030 pressure transducer adapter
Used to measure temperatures from -50° to 1800° F
(-45 to 982° C), using the EEDM506D pressure
transducer adapter
80
Page 88

Scope Multimeter T est Leads and Accessories
NOTE:
IMPORTANT:
9.3 T est Leads and Accessories
Some of the leads, probes and adapters supplied with or that may be available, are explained in
the following section.
i Not all test leads and/or accessories may be available in all markets. Contact your sales
representative for information, or to find out more about these and other available accessories.
Avoid damaging test leads, do not pull on the wire when removing the leads from their jacks. Pull
only on the lead terminal end.
9.3.1 Channel 1 Lead
The shielded yellow lead is used with channel 1, and is color matched with the channel 1 jack on
the diagnostic tool.
This lead also includes two black, right-angle common ground plugs. One plug is standard and the
other is stackable. The standard ground plug should always be connected to the ground (GND)
jack on the diagnostic tool.
The stackable ground plug is used for connecting additional ground leads, such as the Channel 2
or the Secondary Coil Adapter lead grounds. The stackable ground lead is internally connected to
the standard ground lead, therefore it does not need to be connected to the diagnostic tool ground
jack.
9.3.2 Channel 2 Lead
The shielded green lead is used with channel 2, and is color matched with the channel 2 jack on
the diagnostic tool. This lead also includes a black, right-angle stackable ground plug.
Figure 9-1 Yellow Channel 1 Lead
Figure 9-2 Green Channel 2 lead
81
Page 89

Scope Multimeter T est Leads and Accessories
NOTE:
9.3.3 Alligator Clips and Probes
Insulated alligator clips and probes (pointed type) can be attached to the end of the test leads.
Each alligator clip is color matched with a test lead, and the probes are available in red and black.
Figure 9-3 Alligator clips
9.3.4 Secondary Ignition Coil Adapter Lead and Clip-on Adapter
(optional)
The secondary ignition adapter lead can be used with the secondary ignition clip-on wire adapter,
coil-in-cap (CIC), or coil-on-plug (COP) secondary ignition adapters to display secondary ignition
signals. The clip-on adapter clips over a secondary ignition wire to pickup a signal, and the CIC
and COP adapters attach to the ignition coil. The coil adapter lead includes a black, right-angle
stackable ground plug, and a RCA type connector that is used to connect the lead to a secondary
ignition adapter. The spring clamp is used to connect to a ground.
Figure 9-4 Secondary Ignition Coil Adapter Lead and Clip-on Wire Adapter
i Contact your sales representative for additional information on OEM specific CIC and COP
secondary ignition adapters.
82
Page 90

Scope Multimeter T est Leads and Accessories
9.3.5 Low Amp Current Probe (optional)
The Low Amp Current Probe is used measure AC or DC current up to 60A. This probe includes
two scales (0 to 20A) and (0 to 60A) that can be used to provide accurate and reliable nonintrusive current measurement for components such as, ignition coils, fuel injectors, fuel pumps,
relays, and electric motors.
Figure 9-5 Low Amp Current Probe
9.3.6 Pressure Transducers and Adapters (optional)
Different pressure transducers and adapters are available for measuring positive and negative
gas and liquid pressures. Depending on the adapter, measurement capabilities range from 1 to
5000 psi and up to 29 inHg. Measurement and application capabilities vary per device.
83
Figure 9-6
Page 91

Scope Multimeter General Information
NOTE:
1
3
4
5
2
9.4 General Information
This section describes the general Scope Multimeter control icon functions, screen layout and
optional settings. The screen layout and control icon functions are shared between the
digital/graphing multimeters and lab scope.
i Scope and Multimeter tests are not vehicle specific, therefore vehicle identification is not required.
9.4.1 Scope Multimeter Screen Layout and Features
1— Toolbar—contains navigational and control icons
2— Data Buffer Position Indicators—graphical and numerical position indicators
3— Main Body—contains the meter/scope display
4— Control Panel—contains channel/trace controls
5— Expand/Collapse icon—toggles display between split and full screen views
Figure 9-7
84
Page 92

Scope Multimeter General Information
Scope Multimeter Control Icons
The following control icons are common across most Scope Multimeter functions, however use
may vary depending on the active function or test. A yellow frame surrounding an icon
(highlighted), indicates it is selected. Other control icons (not shown) are described in Common
Toolbar Control Icons‚ on page 12.
Icon Function
Stop - Stops the data buffer
Control Panel - (a). In full screen mode, when selected this icon becomes surrounded
by a white frame and opens the control panel at the bottom of the screen while
switching active selection focus to the Show/Hide or Probe icon in the Control Panel.
(b). In split screen mode (control panel open), when selected this icon becomes
surrounded by a white frame and switches active selection focus to the Show/Hide or
Probe icon in the Control Panel.
Note: Switching active selection focus to the Control Panel allows manual navigation
(using the directional control buttons) of the Control Panel control icons
Zoom - Increases and decreases screen magnification. The zoom function is only
available during data review (scope stopped).
Cursors - Toggles cursors on/off.
Main Body
The main body may display the following:
• Menu - Select from a menu using the touch screen or the control buttons.
• Meter/Scope Display - Up to two signal traces can be displayed simultaneously. Each trace is
displayed as voltage over time and the voltage level is recorded on the vertical, or “y”, axis and
time is presented on the horizontal, or “x”, axis of the screen.
Data Buffer Position Indicators
The graphing multimeter and lab scope functions have the capability to save, store and playback,
data (signals) utilizing internal storage “buffer” memory.
The Data Buffer Position Indicators are used to visually see the overall amount and position of the
of stored buffer data during saving and playback.
For additional information on the Data Buffer, Data Buffer Position Indicator and Saving, Storing
and Reviewing Data files, see Saving and Reviewing Scope / Multimeter Data Files‚ on page 110.
85
Page 93

Scope Multimeter General Information
:$51 ,1*
IMPORTANT:
9.4.2 Measurement Out of Range (Alert)
When performing a test, if a group of arrows displays onscreen, this indicates that the
measurement is out of range for the scale selected.
• Arrows pointing UP—measurement over maximum range
• Arrows pointing DOWN—measurement under minimum range
Voltage measurements also display arrows in place of live values when the voltage exceeds the
input rating of the meter.
Figure 9-8
Risk of electrical shock.
• Do not exceed voltage limits between inputs as indicated on the rating label.
• Use extreme c aution when working with circuits that have greater than 40 volts AC or
24 volts DC.
Electrical shock can cause personal injury, equipment damage, or circuit damage.
If arrows are displayed in the live voltage values, discontinue circuit testing.
Correct an out-of-range condition by selecting a scale setting appropriate for the signal being
sampled. See Scale (Vertical scale adjustment)‚ on page 90 for more information.
86
Page 94

Scope Multimeter Operation and Controls
NOTE:
IMPORTANT:
1 2
3
9.5 Operation and Controls
This section describes the general operation and controls used to configure the scope or meter to
perform testing. All three functions share similar control panel settings, see Control Panel and
Settings‚ on page 89 for additional information.
i The information in the following sections is intended as a guide and general overview of the
controls and functions used within the Scope Multimeter. Not all the settings or controls described
throughout this section are applicable with all functions.
z To open a scope multimeter function:
1. Select the Scope Multimeter icon from the home screen.
2. Select either Lab Scope, Graphing Multimeter or Digital Multimeter from the menu.
9.5.1 Test Lead / Probe Connection
Standard “safety type” test lead jacks are located on the top of the diagnostic tool, and are
compatible with many test leads and probes. Insert the applicable test lead or probe terminal end
into the jack to compete the connection.
To avoid damaging test leads, do not pull on the wire when removing the leads from their jacks.
Pull only on the lead terminal end.
1— Ground Jack (Black)
2— Channel 1 Jack (Yellow)
3— Channel 2 Jack (Green)
Figure 9-9 Scope Multimeter Test Lead Jacks
87
Page 95

Scope Multimeter Operation and Controls
NOTE:
9.5.2 Test Lead / Probe Calibration
Certain tests may display a confirmation prompt asking “Do you wish to calibrate this probe?”
before continuing with the test. As general practice, it is important to ensure the test probe is
calibrated before testing, to ensure accurate results.
Typical resistance, pressure, and vacuum tests will display the calibration message, reminding
you to calibrate the probe. To perform the probe calibration, select Yes at the prompt and continue
to follow the onscreen instructions to complete the calibration.
Example: For the ohms (resistance) calibra tion process, once completed , zero ohms should
be displayed when the leads are connected together. When the leads are separated, the
upward arrows on the display indicate infinite resistance or an open circuit.
i During an ohms test or a pressure test, a manual probe recalibration can be initiated by selecting
the probe icon from the Control Panel to open the probe menu. Then select either the Ohms or
Pressure (100, 500, 5000) items from the probe menu. The menu selections will display a graphic
of a balance scale with an “X” through it (on right side) to indicate that probe is not calibrated.
Figure 9-10 Probe menu - Ohms with “not calibrated” indicator displayed
88
Page 96

Scope Multimeter Operation and Controls
NOTE:
NOTE:
5
4
3
1
2
9.5.3 Control Panel and Settings
The control panel is common to all three Scope Multimeter functions, and contains the
channel (or “trace”) settings and controls that are used to monitor and adjust the signal being
measured. This section provides a general overview of all the channel settings and control
features used across all three Scope Multimeter functions.
i This section is intended as a general overview of the channel settings. Not all the settings or
controls described in this section are applicable with all functions, some may be “grayed out” or
not active (applicable) depending on the function or test. Function availability is noted as
applicable.
i The control panel can be toggled on/off by selecting the Expand/Collapse Icon to switch the
screen between full and split test meter views.
1— Cursors
2— Control Panel Icon
3— Data Buffer Position Indicators—graphical and numerical position indicators
4— Zero Base Line Indicators
5— Control Panel—contains channel/trace controls and settings
Figure 9-11
89
Page 97

Scope Multimeter Operation and Controls
NOTE:
NOTE:
Scale, Sweep and Probe Settings
The most common and typically the first adjustments made when performing tests are the setup
or adjustment of the scales and selection of a probe. All three of these adjustments are made from
the control panel and are described in the following sections.
The following illustration is for reference, and identifies key terms and features used thought the
following sections:
1
2
1— Vertical Scale - [Y axis]
2— Horizontal (sweep or time) Scale - [X axis]
3— Vertical Scale Menu
4— Vertical Scale Icon
5— Sweep Scale Icon
3
4
5
Figure 9-12
Scale (Vertical scale adjustm ent)
The vertical scale (Y-axis) represents what is being measured (voltage, amperage, pressure etc.),
and the unit of measurement it is being measured in. The vertical scale is “always” divided into10
major divisions; how these divisions are defined, sets the scale of measurement.
i Vertical scales (either channel) can be set independently.
i Optional vertical scale preference settings are available. The Divisions option allow you to change
(to your preference) how the vertical scale menu selections are represented, and the type of value
that displays in the vertical scale icon. See Divisions‚ on page 107.
To adjust the vertical scale unit of measurement, select the V ertical Scale icon to open the vertical
scale menu. Select a value then press the N/X button, to exit the menu. The value displayed in the
vertical scale icon indicates the active value.
90
Page 98

Scope Multimeter Operation and Controls
NOTE:
Example: Selecting 10V, changes the vertical scale to a 10V volt scale. The scale is “always”
divided by 10, therefore each division is incremented by 1V.
Figure 9-13
Example: Selecting 50 psi displays a 50 psi scale that is divided by 10, therefore each division
is incremented by 5 psi.
Figure 9-14
Sweep (Horizontal or Time scale adjustment)
The horizontal scale (X-axis) represents time, and the unit of measurement it is being measured
in. The horizontal scale is “always” divided into10 major divisions, how these divisions are defined,
sets the scale of measurement. The value displayed in the sweep Scale icon indicates the active
sweep setting.
i The sweep setting applies to all channels and cannot be set independently per channel.
91
Page 99

Scope Multimeter Operation and Controls
To adjust the sweep scale unit of measurement value, select the Sweep Scale icon to open the
sweep scale menu. Select a value then press the N/X button, to exit the menu.
1— Sweep Scale
2— Sweep Scale Menu
3— Sweep Scale Icon
Figure 9-15
Example: Selecting 500ms, changes the sweep scale to a 500ms scale. The scale is “always”
divided by 10, therefore each division is incremented by 50 ms.
Figure 9-16
92
Page 100

Scope Multimeter Operation and Controls
Probe (Probe type “test” selection)
Different types of Probes are available from the probe option menu, depending on which type of
test you are performing. Changing the probe selection, also changes the vertical scale to the
applicable type of measurement.
To select a Probe type, select the Probe icon to open the probe option menu, then select a probe.
The probe icon will change to the selected probe. Select Close from the menu to close the menu.
Figure 9-17 Probe option menu
For probe calibration information, see Test Lead / Probe Calibration‚ on page 88.
Probe “test” Options
Menu Option Probe / Device Used
Test Lead - Volts DC
Vacuum 100
Pressure 100
Pressure 500
Pressure 5000
Low Amps 20
Low Amps 60
Ignition
EEDM506D Temperature (optional) Part number - EEDM506D temperature adapter
MT5030 Vacuum
MT5030 Pressure
Standard Channel 1 and 2 test leads with alligator clips or
test probes
(optional) 0-100 psi pressure transducer with pressure
adapter
(optional) 0-500 psi pressure transducer with pressure
adapter
(optional) 0-5000 psi pressure transducer with pressure
adapter
(optional) Low Amp ProbeLow Amps 40
(optional) Secondary ignition adapter lead with desired
secondary ignition coil adapter
(optional) Part number - EEDM5030 0-500 pressure
adapter
93
 Loading...