

Conzerv EM6400NG+
User Manual
NHA2768503-05
01/2021
www.se.com

Legal Information
The Schneider Electric brand and any trademarks of Schneider Electric SE and its
subsidiaries referred to in this guide are the property of Schneider Electric SE or its
subsidiaries. All other brands may be trademarks of their respective owners.
This guide and its content are protected under applicable copyright laws and
furnished for informational use only. No part of this guide may be reproduced or
transmitted in any form or by any means (electronic, mechanical, photocopying,
recording, or otherwise), for any purpose, without the prior written permission of
Schneider Electric.
Schneider Electric does not grant any right or license for commercial use of the guide
or its content, except for a non-exclusive and personal license to consult it on an "as
is" basis. Schneider Electric products and equipment should be installed, operated,
serviced, and maintained only by qualified personnel.
As standards, specifications, and designs change from time to time, information
contained in this guide may be subject to change without notice.
To the extent permitted by applicable law, no responsibility or liability is assumed by
Schneider Electric and its subsidiaries for any errors or omissions in the informational
content of this material or consequences arising out of or resulting from the use of the
information contained herein.
Safety information
Important information
Read these instructions carefully and look at the equipment to become familiar
with the device before trying to install, operate, service, or maintain it. The
following special messages may appear throughout this manual or on the
equipment to warn of potential hazards or to call attention to information that
clarifies or simplifies a procedure.
The addition of either symbol to a “Danger” or “Warning” safety label indicates
that an electrical hazard exists which will result in personal injury if the
instructions are not followed.
This is the safety alert symbol. It is used to alert you to potential personal injury
hazards. Obey all safety messages that accompany this symbol to avoid possible
injury or death.
Conzerv EM6400NG+
DANGER
DANGER indicates a hazardous situation which, if not avoided, will result in
death or serious injury.
Failure to follow these instructions will result in death or serious injury.
WARNING
WARNING indicates a hazardous situation which, if not avoided, could result
in death or serious injury.
CAUTION
CAUTION indicates a hazardous situation which, if not avoided, could result in
minor or moderate injury.
NOTICE
NOTICE is used to address practices not related to physical injury.
Please note
Electrical equipment should be installed, operated, serviced and maintained only
by qualified personnel. No responsibility is assumed by Schneider Electric for any
consequences arising out of the use of this material. A qualified person is one who
has skills and knowledge related to the construction, installation, and operation of
electrical equipment and has received safety training to recognize and avoid the
hazards involved.
NHA2768503-05 3

Conzerv EM6400NG+
Notices
FCC
This equipment has been tested and found to comply with the limits for a Class A
digital device, pursuant to Part 15 of the FCC rules. These limits are designed to
provide reasonable protection against harmful interference when the equipment is
operated in a commercial environment. This equipment generates, uses, and can
radiate radio frequency energy and, if not installed and used in accordance with
the instruction manual, may cause harmful interference to radio communications.
Operation of this equipment in a residential area is likely to cause harmful
interference in which case the user will be required to correct the interference at
his own expense.
The user is cautioned that any changes or modifications not expressly approved
by Schneider Electric could void the user’s authority to operate the equipment.
This digital apparatus complies with CAN ICES-3 (A) /NMB-3(A).
4 NHA2768503-05

Table of Contents
Safety precautions ......................................................................................9
Introduction ................................................................................................10
Meter overview......................................................................................... 10
Meter features..........................................................................................10
Feature summary .....................................................................................10
Measured parameters...............................................................................12
Data display and analysis tools..................................................................13
Meter configuration...................................................................................13
Hardware references................................................................................ 14
Meter types .............................................................................................. 14
Supplemental information..........................................................................14
Panel meter .............................................................................................14
Tamper-resistant cover ............................................................................. 15
Meter mounting ........................................................................................15
Meter wiring .............................................................................................15
Direct connect voltage limits ......................................................................15
Balanced system considerations................................................................17
Serial communications..............................................................................17
Pulse output............................................................................................. 19
Conzerv EM6400NG+
Energy ...............................................................................................12
Demand .............................................................................................12
Instantaneous.....................................................................................12
Power quality...................................................................................... 12
Power Monitoring Expert ..................................................................... 13
Power SCADA Operation .................................................................... 13
RS-485 wiring..................................................................................... 18
Display and meter setup ..........................................................................20
Display overview ......................................................................................20
LED indicators.......................................................................................... 20
Energy pulsing LED ............................................................................21
Heartbeat / serial communications LED ................................................21
Button functions ....................................................................................... 21
Meter screen menus ................................................................................. 22
Display screen menus .........................................................................22
Setup screen menus ........................................................................... 24
Demand .............................................................................................30
Communications setup........................................................................ 32
Setting up the password ......................................................................32
Setting up date and time......................................................................33
Diagnostics (Diag) screen menus......................................................... 33
Clear screen menus ............................................................................35
Lock / Unlock...................................................................................... 37
Remote meter setup ................................................................................. 38
Overview ................................................................................................. 38
ION setup ................................................................................................ 38
RS-485 port setup .................................................................................... 38
Using a serial communications converter to set up RS-485 .................... 38
NHA2768503-05 5

Conzerv EM6400NG+
Meter setup through RS-485 .....................................................................39
Meter configuration using ION setup .......................................................... 39
Viewing meter data ...................................................................................40
Viewing meter data from the display ...........................................................40
Using ION Setup to view or modify configuration data.................................. 41
Using software to view meter data..............................................................41
Power Monitoring Expert ........................................................................... 42
Power SCADA Operation .........................................................................42
Modbus command interface ......................................................................42
Measurements and calculations ............................................................. 43
Meter initialization.....................................................................................43
Real-time readings ................................................................................... 43
Energy measurements..............................................................................43
Quadrant based VARh ..............................................................................43
Min/max values ........................................................................................44
Power demand .........................................................................................44
Power demand calculation methods ..................................................... 44
Block interval demand .........................................................................44
Synchronized demand......................................................................... 45
Thermal demand ................................................................................45
Current demand .......................................................................................46
Predicted demand............................................................................... 46
Peak demand ..................................................................................... 47
Timer.......................................................................................................47
Power quality .............................................................................................48
Harmonics overview ................................................................................. 48
Total harmonic distortion %........................................................................48
Harmonic content calculations ............................................................. 48
THD% calculations..............................................................................48
Displaying harmonics data ........................................................................ 48
Maintenance and upgrades..................................................................... 50
Maintenance overview .............................................................................. 50
Troubleshooting LED indicators .................................................................50
Meter memory..........................................................................................50
Meter battery............................................................................................50
Viewing firmware version, model and serial number ....................................51
Firmware upgrades................................................................................... 51
Firmware upgrade using DLF3000 .......................................................51
Technical assistance .................................................................................52
Verifying accuracy..................................................................................... 53
Overview of meter accuracy ...................................................................... 53
Accuracy test requirements .......................................................................53
Verifying accuracy test ..............................................................................54
Required pulses calculation for accuracy verification testing ........................ 55
Total power calculation for accuracy verification testing ...............................56
Percentage error calculation for accuracy verification testing ....................... 56
Accuracy verification test points.................................................................56
Energy pulsing considerations ...................................................................57
VT and CT considerations..........................................................................57
Example calculations ................................................................................ 58
6 NHA2768503-05

Conzerv EM6400NG+
Typical sources of test errors .....................................................................59
Power and power factor ...........................................................................60
Power and power factor ............................................................................ 60
Current phase shift from voltage ................................................................60
Real, reactive and apparent power (PQS)................................................... 60
Power factor (PF) ..................................................................................... 61
Power factor sign convention ...............................................................61
Power factor min/max convention.........................................................62
Power factor register format................................................................. 63
Specifications ............................................................................................65
NHA2768503-05 7

Safety precautions Conzerv EM6400NG+
Safety precautions
Installation, wiring, testing and service must be performed in accordance with all
local and national electrical codes.
DANGER
HAZARD OF ELECTRIC SHOCK, EXPLOSION, OR ARC FLASH
• Apply appropriate Personal Protective Equipment (PPE) and follow safe
electrical work practices. See NFPA 70E, CSA Z462 or other local
standards.
• Turn off all power supplying this device and the equipment in which it is
installed before working on or in the equipment.
• Always use a properly rated voltage sensing device to confirm that all power
is off.
• Follow guidelines in the Wiring section of the related Installation Sheet.
• Assume communications and I/O wiring are hazardous live until determined
otherwise.
• Do not exceed the maximum ratings of this device.
• Do not short secondary terminals of Voltage Transformer (VT).
• Do not open secondary terminals of Current Transformer (CT).
• Ground secondary circuit of CTs.
• Do not use the data from the meter to confirm power is off.
• Replace all devices, doors and covers before turning on power to this
equipment.
Failure to follow these instructions will result in death or serious injury.
NOTE: See IEC 60950-1 for more information on communications and I/O
wiring connected to multiple devices.
WARNING
UNINTENDED OPERATION
• Do not use this device for critical control or protection of persons, animals,
property or equipment.
Failure to follow these instructions can result in death, serious injury, or
equipment damage.
WARNING
POTENTIAL COMPROMISE OF SYSTEM AVAILABILITY, INTEGRITY, AND
CONFIDENTIALITY
• Change default passwords/passcodes to help prevent unauthorized access
to device settings and information.
• Disable unused ports/services and default accounts, where possible, to
minimize pathways for malicious attacks.
• Place networked devices behind multiple layers of cyber defenses (such as
firewalls, network segmentation, and network intrusion detection and
protection).
• Use cybersecurity best practices (for example: least privilege, separation of
duties) to help prevent unauthorized exposure, loss, modification of data and
logs, interruption of services, or unintended operation.
Failure to follow these instructions can result in death, serious injury, or
equipment damage.
NHA2768503-05 9

Conzerv EM6400NG+ Introduction
Introduction
Meter overview
The EM6400NG+ series meters are digital meters that offer comprehensive 3phase electrical instrumentation and load management facilities in a compact and
rugged package.
The EM6400NG+ meters offer value for the demanding needs of your energy
monitoring and cost management applications. All meters in the EM6400NG+
series range comply with Class 1, Class 0.5S, or Class 0.2 accuracy standards
and feature high quality, reliability and affordability in a compact and easy to install
format.
Meter features
The EM6400NG+ meter supports many features, a few of the features are listed
below:
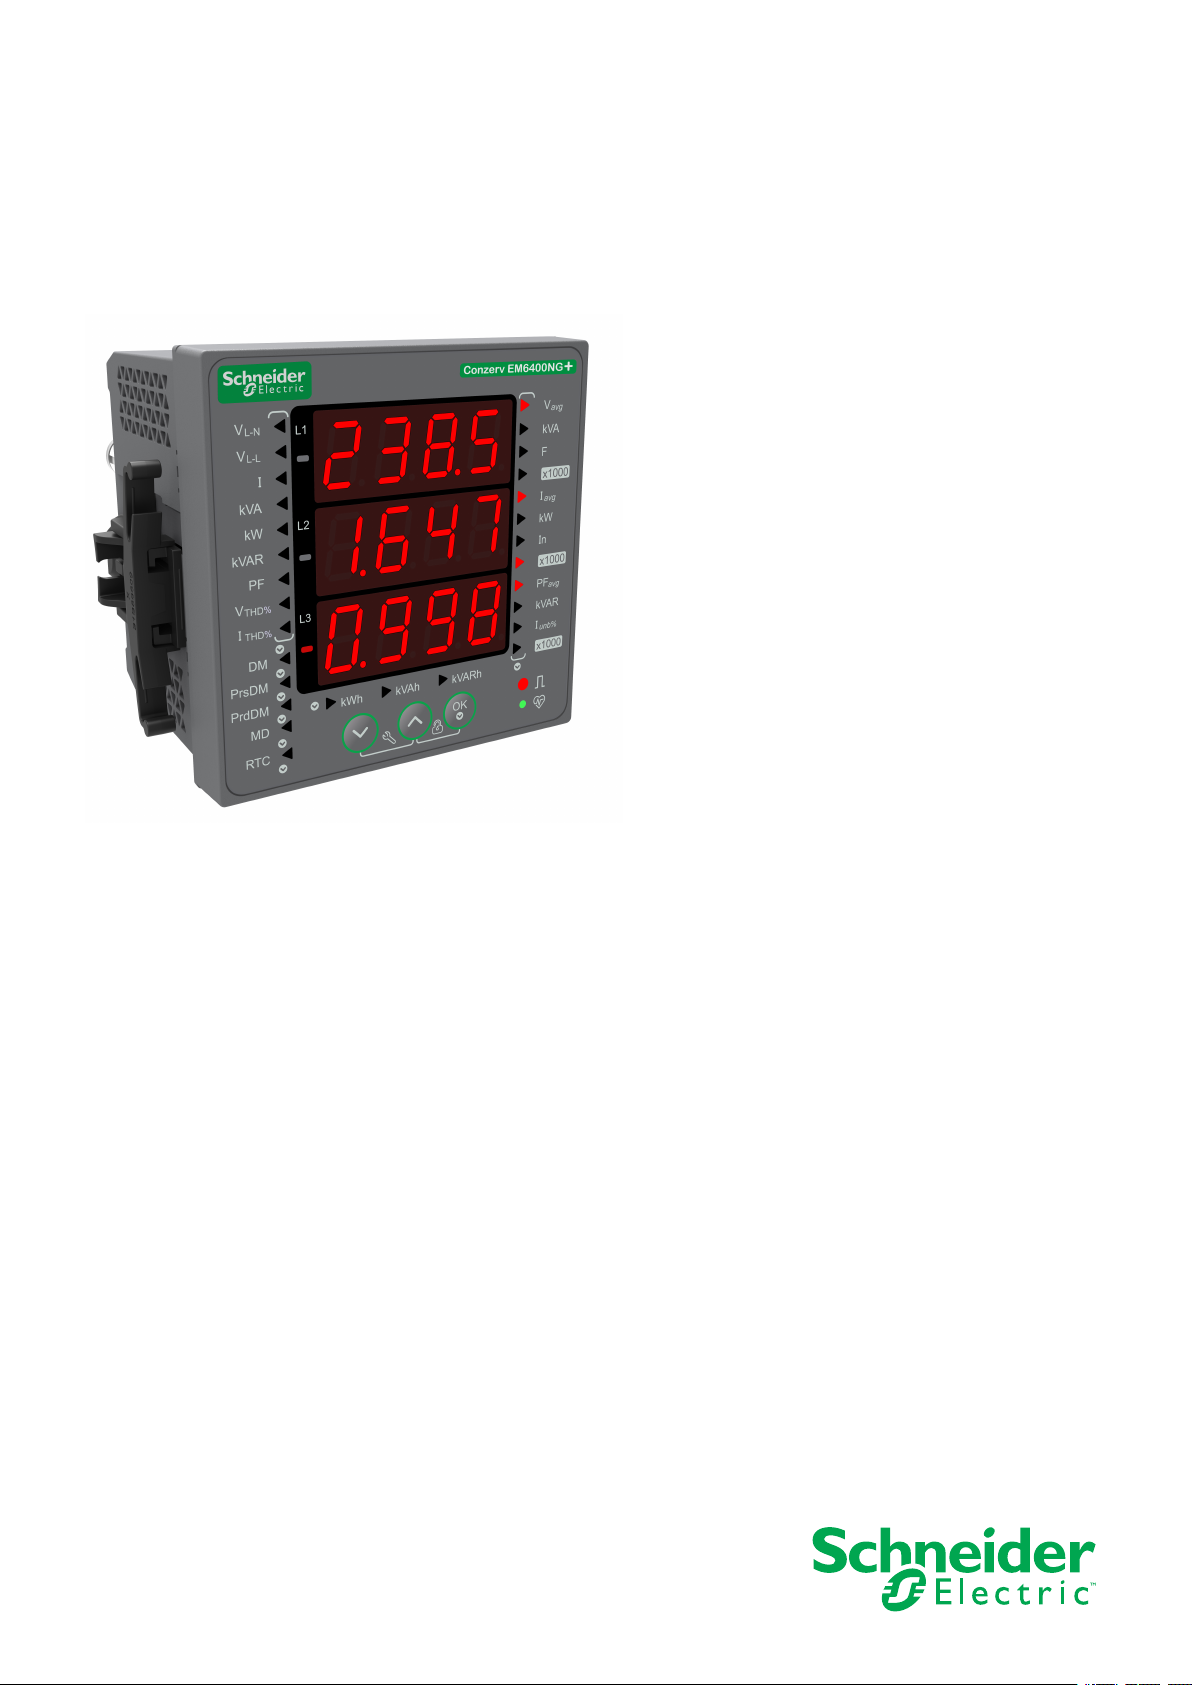
• LED display screen: Intuitive self-guided navigation using three buttons LED
display, with three lines of concurrent values. Two columns of LEDs given on
the either side of the meter’s front panel indicate the parameter name being
displayed.
• Energy accounting and balancing.
• Measurement of both True PF and Displacement PF.
• EM6400NG+ POP (Class 1 and 0.5S) and RS-485 (Class 1, 0.5S, and 0.2)
models.
• THD% and individual harmonics up to 15
• Active, reactive, and apparent energy readings.
• Min/Max values of instantaneous parameters with timestamp.
• Cybersecurity: The meter supports the disabling of RS-485 port through front
panel keys to prevent unauthorized access. Toggle the RTU devices in case
of limited availability of nodes in software system.
• Suppression current: The meter can be configured to disregard the
measurement of induced / auxiliary load current in the circuit (can be set from
5 to 99 mA).
You can use the meter as a stand-alone device, but its extensive capabilities are
fully realized when used as part of an energy management system.
th
order for voltage and current.
For applications, feature details and the most current and complete specifications
of the EM6400NG+ meters, see the EM6400NG+ technical datasheet at www.se.
com.
Feature summary
Parameter EM6400NG+ POP EM6400NG+ RS-485
Accuracy Class for Wh Class 1
Class 0.5S
Accuracy Class for VARh 2.0
1.0
Sampling rate per cycle 64 64
Current:
• Per-phase and 3 phase average
• Calculated neutral current
10 NHA2768503-05
✔ ✔
Class 1
Class 0.5S
Class 0.2
2.0
1.0

Introduction Conzerv EM6400NG+
Parameter EM6400NG+ POP EM6400NG+ RS-485
Voltage:
• V L-N - per-phase and 3 phase average
• V L-L - per-phase and 3 phase average
✔ ✔
Power Factor
• Per phase and 3 phase total
Frequency
Power:
True PF True PF
Displacement PF
✔ ✔
✔ ✔
• Active power (kW) - Phase wise and total
• Apparent power (kVA) - Phase wise and total
• Reactive power (kVAR) - Phase wise and total
3 Phase unbalance Current Current
Voltage
Demand parameters (kW, kVA, kVAR, I)
• Last demand
✔
(no timestamp)
✔
• Present demand
• Predictive demand
• Peak demand: Timestamp for peak demand
Energy: kWh, kVAh, kVARh (4 Quadrant)
• Delivered (Import / Forward)
• Received (Export / Reverse)
1
Delivered
Received
Delivered
Received
Total
1
Net
Last cleared (Old)
Meter On hours
—
✔
Load Run hours
Power Interruptions
1
1
1
1
THD:
✔ ✔
• Voltage L-N per phase
• Voltage L-L per phase
• Current per phase
Individual Harmonics
1
Min / Max with timestamp
1
—
—
Up to 15th odd harmonics
✔
• V L-L average
• V L-N average
• Current average
• Frequency
• Active power, Total
• Apparent power, Total
• Reactive power, Total
• Power factor, Total
RTC
—
✔
Communication POP RS-485 Modbus RTU
Retrofit (RtFt)
—
✔
For configuring legacy communication data models
1. Indicates features that can be read through communication only.
NHA2768503-05 11

Conzerv EM6400NG+ Introduction
Measured parameters
Energy
The meter provides bi-directional, 4-quadrant, Class 1 / Class 0.5S / Class 0.2
accurate energy metering.
The meter stores all accumulated active, reactive and apparent energy
parameters in non-volatile memory:
• kWh, kVARh, kVAh (delivered)
• kWh, kVARh, kVAh (received)
• kWh, kVARh, kVAh (delivered + received)
• kWh, kVARh, kVAh (delivered - received)
NOTE: Based on the energy scale selection, when any of energy parameters
overflow at 999999999.999 all energy parameters value resets.
Demand
The meter provides last, present, predicted, and maximum (peak) demand values,
and a timestamp when the maximum (peak) demand occurred.
Instantaneous
The meter supports standard demand calculation methods, including sliding block,
fixed block, rolling block, thermal and synchronized.
Peak demand registers can be reset manually (password protected).
Demand measurements include:
• W, VAR, VA demand total
• Amps demand average
The meter provides highly accurate 1-second measurements, average values,
including true RMS, per phase and total for:
• Per phase and average voltage (line-to-line, line-to-neutral)
• Per phase and average current, and neutral current
NOTE: Neutral current is calculated.
• Per phase and total power (VA, W, Var)
• Per phase and average for true and displacement power factor
• System frequency
• Per phase and maximum of all three for voltage unbalance and current
unbalance
Power quality
The meter provides complete harmonic distortion metering, recording, and realtime reporting, up to the 15
The following power quality measurements are available:
• Individual odd harmonics up to 15
• Total harmonic distortion (THD%) for current and voltage (displays line-to-line
or line-to-neutral, based on selected system configuration)
12 NHA2768503-05
th
harmonic for all voltage and current inputs.
th
order (voltage and current, per phase)

Introduction Conzerv EM6400NG+
Data display and analysis tools
Power Monitoring Expert
EcoStruxure™Power Monitoring Expert is a complete supervisory software
package for power management applications.
The software collects and organizes data gathered from your facility’s electrical
network and presents it as meaningful, actionable information via an intuitive web
interface.
Power Monitoring Expert communicates with devices on the network to provide:
• Real-time monitoring through a multi-user web portal
• Trend graphing and aggregation
• Power quality analysis and compliance monitoring
• Preconfigured and custom reporting
See the EcoStruxure
how to add your device into its system for data collection and analysis.
Power SCADA Operation
™
Power Monitoring Expert online help for instructions on
EcoStruxure™Power SCADA Operation is a complete real-time monitoring and
control solution for large facility and critical infrastructure operations.
It communicates with your device for data acquisition and real-time control. You
can use Power SCADA Operation for:
See the EcoStruxure
how to add your device into its system for data collection and analysis.
Meter configuration
Meter configuration is performed through the display or through ION Setup.
ION Setup is a meter configuration tool that can be downloaded for free at
www.se.com.
See the Conzerv EM6400NG Load Manager topic in the ION Setup online help or
in the ION Setup device configuration guide. To download a copy, go to
www.se.com and search for ION Setup device configuration guide.
• System supervision
• Real-time and historical trending, event logging
• PC-based custom alarms
™
Power SCADA Operation online help for instructions on
NHA2768503-05 13
Conzerv EM6400NG+ Hardware references
Hardware references
Meter types
The EM6400NG+ series is available in one physical form factor.
Commercial Reference Description
METSEEM6400NGPOCL1 Class 1 panel mount meter with pulse output and integrated display.
METSEEM6400NGPOCL5 Class 0.5S panel mount meter with pulse output and integrated
METSEEM6400NGRSCL1 Class 1 panel mount meter with RS-485 and integrated display.
METSEEM6400NGRSCL5 Class 0.5S panel mount meter with RS-485 and integrated display.
METSEEM6400NGRSCL2 Class 0.2 panel mount meter with RS-485 and integrated display.
Supplemental information
This document is intended to be used in conjunction with the installation sheet that
ships in the box with your device and accessories.
See your device’s installation sheet for information related to installation.
See your product’s catalog pages at www.se.com for information about your
device, its options and accessories.
You can download updated documentation from www.se.com or contact your local
Schneider Electric representative for the latest information about your product.
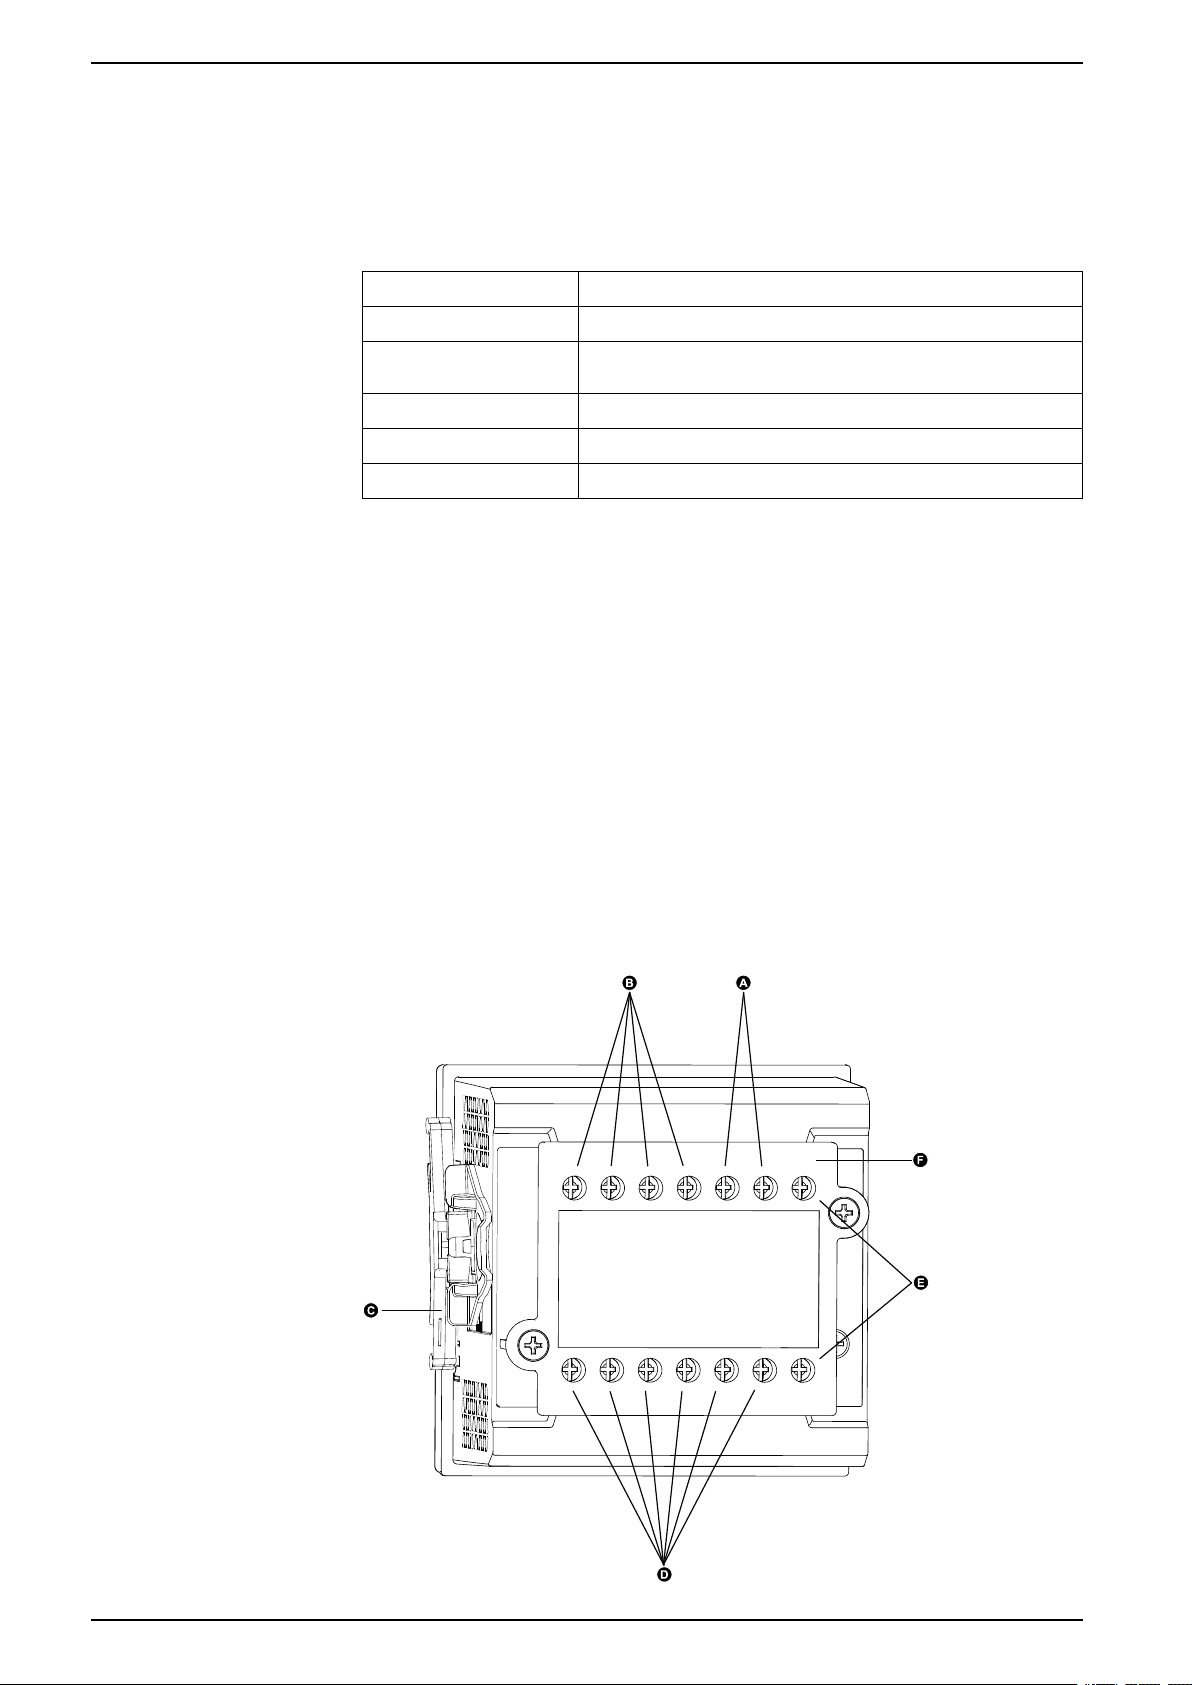
Panel meter
display.
The back of your meter supports various power system connections.
14 NHA2768503-05

Hardware references Conzerv EM6400NG+
A Auxiliary power supply (control power) terminals (L+, N-)
B Input voltage terminals (V1, V2, V3, VN)
C Retainer clip
D Input current terminals [A1(S1, S2), A2 (S1, S2), A3 (S1, S2)]
E RS-485 communications/POP terminals (D1+, D0-)
F Protective cover
Tamper-resistant cover
The tamper-resistant cover helps prevent tampering with the meter’s voltage and
current measurement inputs.
The tamper-resistant cover encloses the terminals, the conductor fixing screws
and a length of the external conductors and their insulation. The covers are
secured by tamper-resistant meter seals.
The meter’s tamper-resistant cover must be installed by a qualified installer.
Meter mounting
For mounting instructions and safety precautions, see the installation sheet that
was shipped with your device
You can also download the latest copy at www.se.com.
Meter wiring
For wiring instructions and safety precautions, see the meter installation sheet that
was shipped with your meter.
You can also download the latest copy at www.se.com.
Direct connect voltage limits
You can connect the meter’s voltage inputs directly to the phase voltage lines of
the power system if the power system’s line-to-line or line-to-neutral voltages do
not exceed the meter’s direct connect maximum voltage limits.
The meter's voltage measurement inputs are rated by the manufacturer for up to
277 V L-N / 480 V L-L. However, the maximum voltage allowed for direct
connection may be lower, depending on the local electrical codes and regulations.
As per installation category II / III the maximum voltage on the meter voltage
measurement inputs should not exceed 277 V L-N / 480 V L-L for CAT III and 347
V L-N / 600 V L-L for CAT II.
If your system voltage is greater than the specified direct connect maximum
voltage, you must use VTs (voltage transformers) to step down the voltages.
NHA2768503-05 15
Conzerv EM6400NG+ Hardware references
N
Power system
description
Single-phase 2wire line-toneutral
Single-phase 2wire line-to-line
Single-phase 3wire line-to-line
with neutral
3-phase 3-wire
Delta
ungrounded
Meter setting Symbol Direct connect maximum (UL / IEC) # of VTs (if
required)
Display
(meter)
1P.LN 1PH 2Wire L-N
1P.LL 1PH 2Wire L-L
1P.3L 1PH 3Wire L-L
3P.3L 3PH 3Wire
Display
(communication)
with N
Installation
category III
Installation
category II
≤ 277 V L-N ≤ 347 V L-N 1 VT
480 V L-L 600 V L-L 1 VT
≤ 277 V L-N / 480
V L-L
≤ 347 V L-N / 600
V L-L
2 VT
480 V L-L 600 V L-L 2 VT
Ungrounded Delta
3-phase 3-wire
Delta corner
grounded
3-phase 3-wire
Wye ungrounded
3-phase 3-wire
Wye grounded
3-phase 3-wire
Wye resistancegrounded
3PH 3Wire Corner
Grounded Delta
3PH 3Wire
Ungrounded Wye
3PH 3Wire
Grounded Wye
3PH 3Wire
Resistance
Grounded Wye
480 V L-L 600 V L-L 2 VT
480 V L-L 600 V L-L 2 VT
480 V L-L 600 V L-L 2 VT
480 V L-L 600 V L-L 2 VT
3-phase 4-wire
open Delta
center-tapped
3P.4L 3PH 4Wire
Center-Tapped
Open Delta
240 V L-N / 480 V
L-L
240 V L-N / 480 V
L-L
3 VT
16 NHA2768503-05
Hardware references Conzerv EM6400NG+
N
N
N
Power system
description
3-phase 4-wire
Delta centertapped
3-phase 4-wire
ungrounded Wye
3-phase 4-wire
grounded Wye
Meter setting Symbol Direct connect maximum (UL / IEC) # of VTs (if
Display
(meter)
Display
(communication)
3PH 4Wire
Center-Tapped
Delta
3PH 4Wire
Ungrounded Wye
3PH 4Wire
Grounded Wye
Installation
category III
240 V L-N / 480 V
L-L
≤ 277 V L-N / 480
V L-L
≤ 277 V L-N / 480
V L-L
Installation
category II
240 V L-N / 480 V
L-L
≤ 347 V L-N / 600
V L-L
≤ 347 V L-N / 600
V L-L
required)
3 VT
3 VT or 2 VT
3 VT or 2 VT
3-phase 4-wire
resistancegrounded Wye
3PH 4Wire
Resistance
Grounded Wye
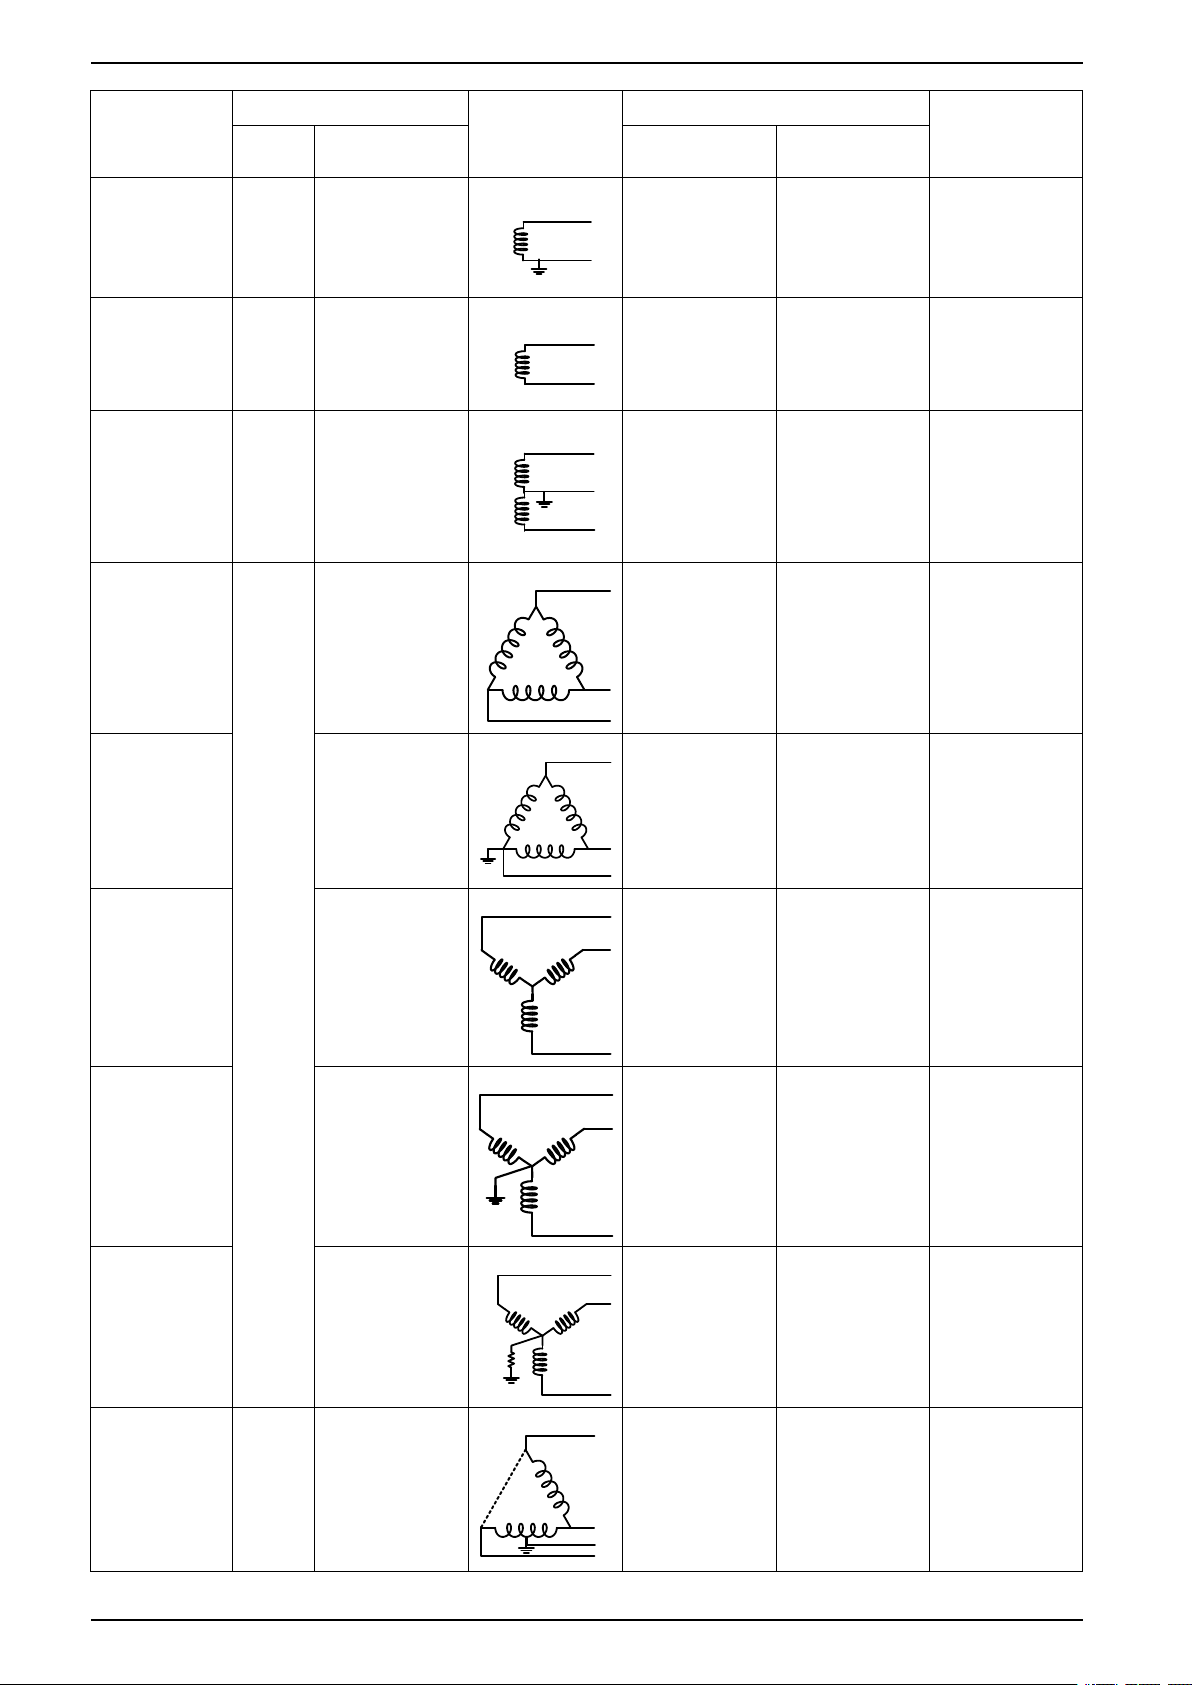
Balanced system considerations
In situations where you are monitoring a balanced 3-phase load, you may choose
to connect only one or two CTs on the phase(s) you want to measure, and then
configure the meter so it calculates the current on the unconnected current
input(s).
NOTE: For a balanced 4-wire Wye system, the meter’s calculations assume
that there is no current flowing through the neutral conductor.
Balanced 3-phase Wye system with 2 CTs
The current for the unconnected current input is calculated so that the vector sum
for all three phases equal zero.
Balanced 3-phase Wye or Delta system with 1CT
≤ 277 V L-N / 480
V L-L
≤ 347 V L-N / 600
V L-L
3 VT or 2 VT
The currents for the unconnected current inputs are calculated so that their
magnitude and phase angle are identical and equally distributed, and the vector
sum for all three phase currents equal zero.
NOTE: You must always use 3 CTs for 3-phase 4-wire center-tapped Delta or
center-tapped open Delta systems.
Serial communications
The meter supports serial communications through the RS-485 port. Up to 32
devices can be connected on a single RS-485 bus.
NHA2768503-05 17
Conzerv EM6400NG+ Hardware references
+
-
120 Ω
C
+
-
In an RS-485 network, there is one master device, typically an Ethernet to RS-485
gateway. It provides the means for RS-485 communications with multiple slave
devices (for example, meters). For applications that require only one dedicated
computer to communicate with the slave devices, an RS-232 to RS-485 converter
can be used as the master device.
RS-485 wiring
Connect the devices on the RS-485 bus in a point-to-point configuration, with the
(+) and (-) terminals from one device connected to the corresponding (+) and (-)
terminals on the next device.
NOTE:
Straight-line topology only. Loop or ring topology is not supported.
Resistor is an optional accessory that you can order separately. To terminate a
series, it is recommended to use a 120 Ω / 0.5 W resistor.
RS-485 cable
Use a shielded 2 wires or 1 twisted pair RS-485 cable to wire the devices. Use the
twisted pair to connect the (+) and (-) terminals.
RS-485 terminals
C Common. This provides the voltage reference (zero volts) for the data plus and data minus
signals
Shield. Connect the bare wire to this terminal to help suppress signal noise that may be
present. Ground the shield wiring at one end only (either at the master or the last slave
device, but not both.
-
Data minus. This transmits/receives the inverting data signals.
+
Data plus. This transmits/receives the non-inverting data signals.
NOTE: If some devices in your RS-485 network do not have the C terminal,
use the bare wire in the RS-485 cable to connect the C terminal from the
meter to the shield terminal on the devices that do not have the C terminal.
RS-485 maximum cable length
The total distance for devices connected on an RS-485 bus should not exceed
900 m (2953 ft).
RS-485 network configuration
After you have wired the RS-485 port and powered up the meter, you must
configure the serial communications port in order to communicate with the meter.
Each device on the same RS-485 communications bus must have a unique
address and all connected devices must be set to the same protocol, baud rate,
and parity (data format).
NOTE: To communicate with the meter using ION Setup, you must set the
serial site and all connected devices in the RS-485 network to the same parity
setting.
18 NHA2768503-05
Hardware references Conzerv EM6400NG+
D1+
≤40 V
≤20 mA
D1-
(60)
(61)
Pulse output
The meter is equipped with one pulse output port (D1+, D0-).
You can configure the pulse outputs for use in the following application:
• Energy pulsing applications, where a receiving device determines energy
usage by counting the k_h pulses coming from the meter’s pulse output port.
One pulse output can handle voltage less than or equal to 40 V DC (20 mA
maximum). For higher voltage applications, use an external relay in the switching
circuit.
NHA2768503-05 19
Conzerv EM6400NG+ Display and meter setup
Conzerv EM6400NG+
%
%
%
Display and meter setup
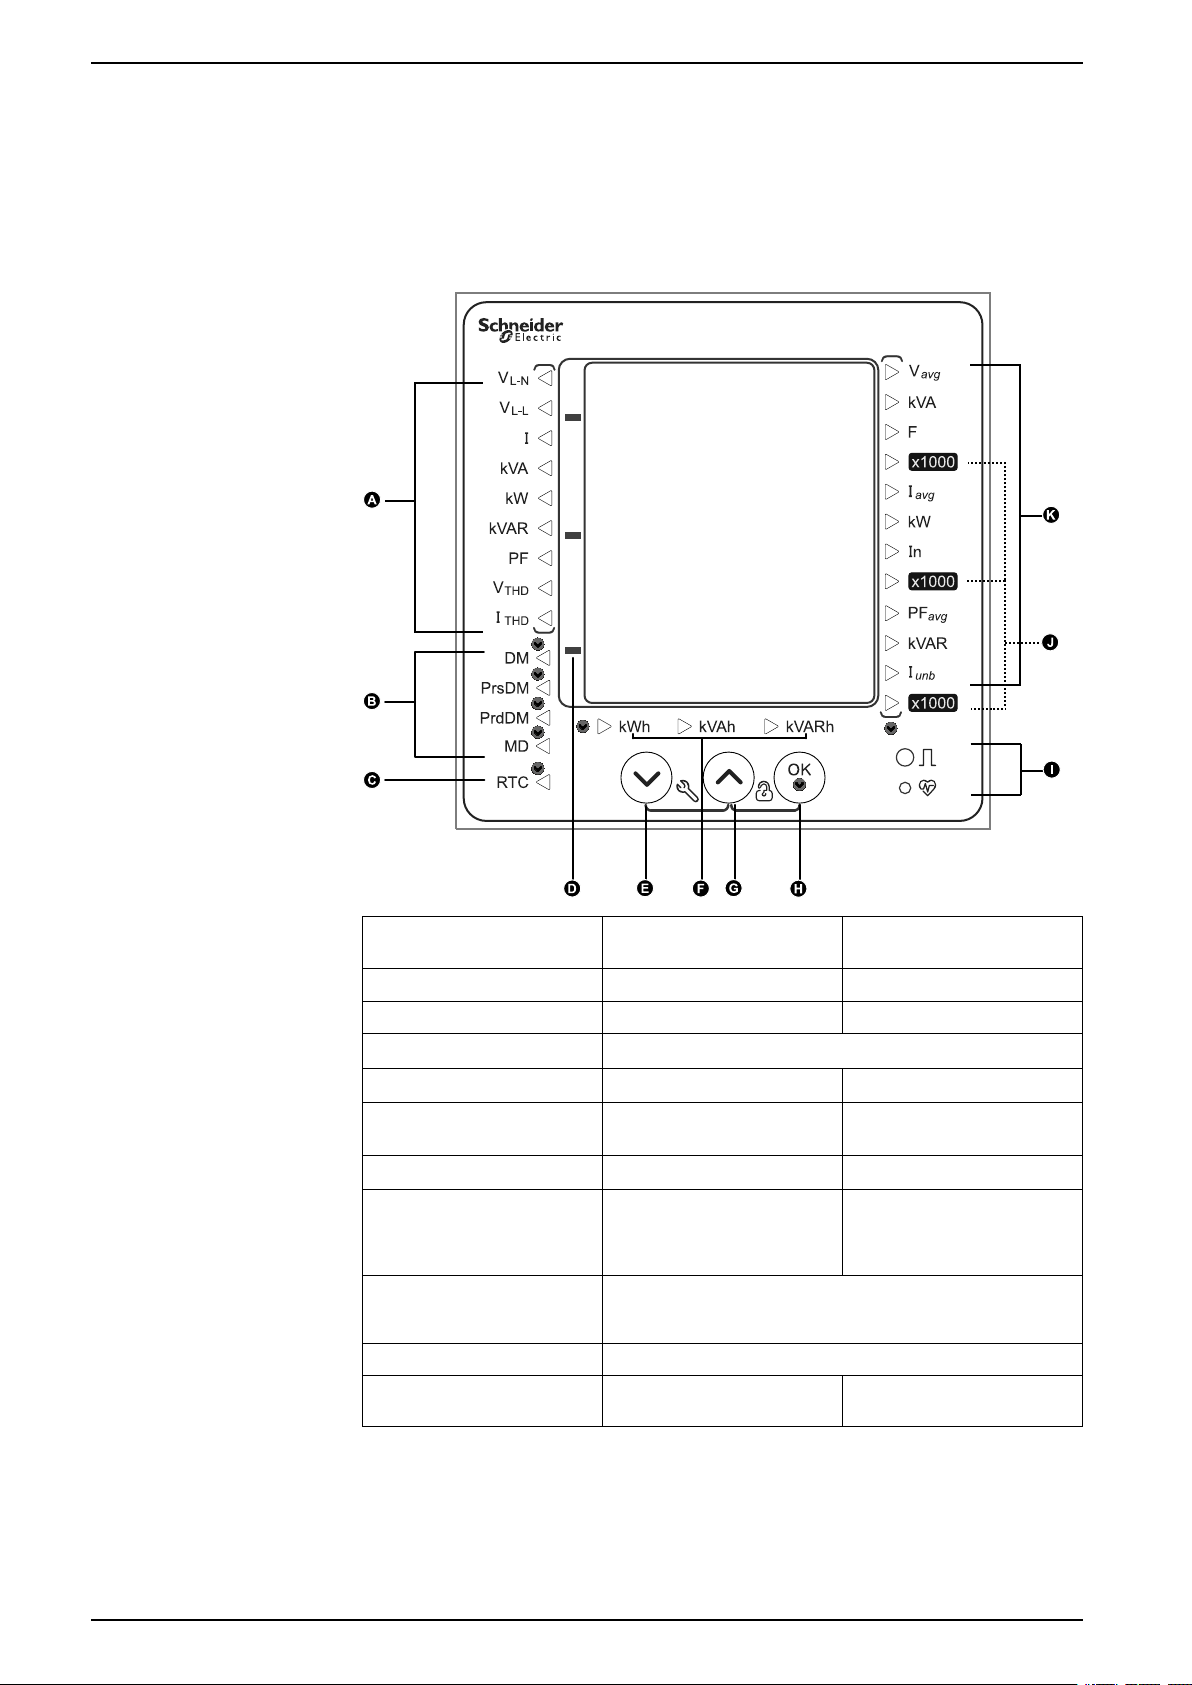
Display overview
The display lets you use the meter to perform various tasks such as setting up the
meter, displaying data screens, or performing resets.
LED indicators
A Phase measurements V
B Demand measurements DM, PrsDM, PrdDM, MD
C RTC Date and time
D Negative indicator
E Navigation key To navigate down
F Energy readings Apparent energy, Active
G Navigation key To navigate up
H OK Enter key
I Energy pulsing LED (Red)
J x 1000 indicator
K System measurements V
Heartbeat / communications LED (Green)
, V
, I, kVA, kW, kVAR,
L-N
L-L
THD
, kVA, F, I
avg
unb
, I
THD
, kW, In, PF
avg
PF, V
energy, and Reactive energy
To toggle between
measurement parameters
kVAR, I
avg
,
The LED indicators alert or inform you of meter activity.
20 NHA2768503-05
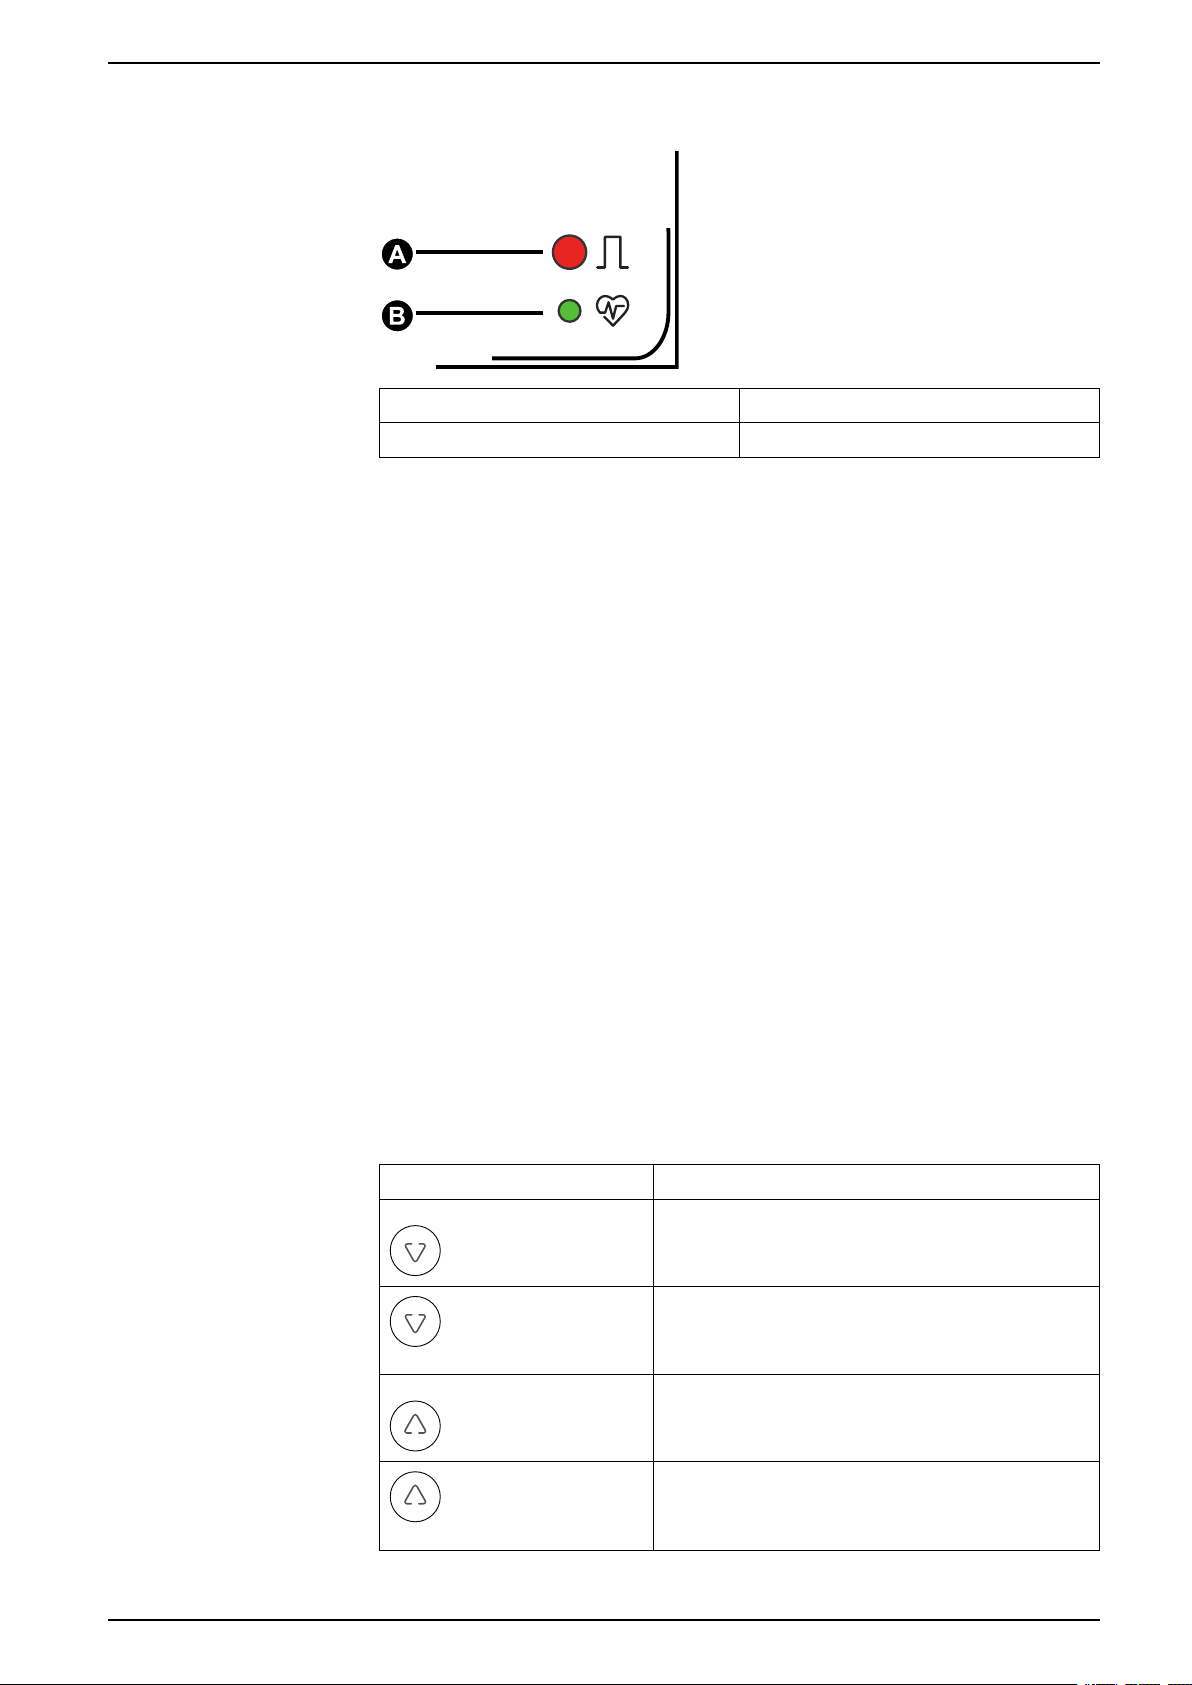
Display and meter setup Conzerv EM6400NG+
A Alarm / energy pulsing LED (Red)
B Heartbeat / serial communications LED (Green)
Energy pulsing LED
The EM6400NG+ meter has an energy pulsing LED that can be configured for
energy pulsing.
This LED flashes at a rate proportional to the amount of energy consumed. This is
typically used to verify the meter’s accuracy.
NOTE: EM6400NG+ meter does not support alarm function.
Heartbeat / serial communications LED
The heartbeat / serial communications LED blinks to indicate the meter’s
operation and serial Modbus communications status.
The LED blinks at a slow, steady rate to indicate the meter is operational. The LED
flashes at a variable, faster rate when the meter is communicating over a Modbus
serial communications port.
You cannot configure this LED for other purposes.
NOTE: A heartbeat LED that remains lit and does not blink (or flash) can
indicate a problem. In this case, power down the meter and reapply power. If
the LED still does not blink or flash, contact Technical Support.
Button functions
The meter supports single press and combination press functions of the buttons.
Symbol Description
To navigate down the list of items.
To move cursor to the left.
Press and hold for 2
seconds.
To navigate up the list of items.
To move cursor to the right.
Press and hold for 2
seconds.
NHA2768503-05 21

Conzerv EM6400NG+ Display and meter setup
Symbol Description
To select a parameter.
To enter into or exit Clear page.
Press and hold for 2
seconds.
To enter into or exit Setup page.
To enter into or exit Diagnostics page.
To lock or unlock a meter page.
Meter screen menus
Display screen menus
All meter screens are grouped logically, according to their function. You can
access any available meter screen by first selecting the Level 1 (top level) screen
that contains it.
With the meter front panel, you can view parameter values; configure parameters;
perform demand resets; perform LED checks; and view meter information. Each
of these functions can be accomplished by pressing the Up, Down, and OK
buttons on the front panel.
These button actions achieve different results according to the mode that the
meter is in:
• Display mode (default): view parameter measurements
• Setup mode: configure a parameter
• Clear mode: reset measurements
• Lock mode: lock or unlock a screen
This section describes front panel navigation within each mode.
In Display mode, you can view values from the following measurement groups:
• System measurements
• Phase measurements
• Energy measurements
• Demand measurements
• RTC
Viewing display parameters
The meter’s display screen and buttons allow you to view the required
parameters.
1. Press the OK button to navigate to different measurement types.
2. Press the Up or Down button to navigate to the previous or next value under
each measurement type.
22 NHA2768503-05

Display and meter setup Conzerv EM6400NG+
F
System measurement
Vavg
kVA
Iavg
kW
In
PFavg
kVAR
Iunb
%
Phase measurement
V
L-N
V
L-L
I
kVA
kW
kVAR
PF
V
THD%
I
THD%
V1, V2, V3
A1, A2, A3
V12, V23, V31
kVA1, kVA2, kVA3
kW1, kW2, kW3
kVAR1, kVAR2, kVAR3
V1
THD
, V2
THD
, V3
THD
PF1, PF2, PF3
A1
THD
, A2
THD
, A3
THD
Demand measurement
RTC
DM
PrsDM
PrdDM
MD
kW, kVA, kVAR, Iavg
kW, kVA, kVAR, Iavg
kW, kVA, kVAR, Iavg
kW, kVA, kVAR, Iavg
Energy measurement
kWh
kVAh
kVARh Reactive Energy - Import/Export
Active Energy - Import/Export
Apparent energy - Import/Export
RTC
Date and Time
Display screen menu tree
Use the menu tree to navigate to the setting you want to view.
The below image summarizes the available meter screens and parameters:
Display parameters
The meter displays various power system measurements.
Measurement Group Parameters Measured
System measurements V
Phase measurements V
Demand measurements DM, PrsDM, PrdDM, MD
RTC Date and time
Energy readings kWh (Active energy): Delivered / Received
, kVA, F, I
avg
, V
L-N
L-L
, kW, In, PF
avg
, kVAR, I
avg
, I, kVA, kW, kVAR, PF, V
THD
unb
, I
THD
NOTE: RTC is only applicable for meters
with RS-485 communication. Meters with
POP do not support this function.
kVAh (Apparent energy): Delivered / Received
kVARh (Reactive energy): Delivered / Received
NOTE: When the x 1000 LED is lit, multiply the displayed value by 1000 for
the actual value.
NHA2768503-05 23

Conzerv EM6400NG+ Display and meter setup
Button functions in viewing display parameters
Display mode is the default page when you power up the meter.
Mode Button Function
Display Mode
To view the next parameter value.
To view the previous parameter value.
To move from one measurement group to the
next measurement group.
Setup screen menus
Setup screen enables you to configure various setup parameters.
Below is the list of setup parameters and the configurations it supports.
24 NHA2768503-05

Display and meter setup Conzerv EM6400NG+
Ct.SE
Setup parameters
tYPE
Vt.SE
Vt
Ct
FrEq
Vt.Pr
Ct.Pr
Pd
Pd.CY
Pd.ut
Pd.SY
Ad
Ad.CY
Ad.ut
Ad.SY
LED
L.PLS
L.PAr
CoM
Id
bAud
Prty
PASS
YEAr
dAtE
hour
PoP
P.PLS
P.PAr
A.SuP
Ther, t.Sb, t.b, t.rb, CS.b, CS.rb, CL.b, Cl.rb
1 to 60 mins
1 to 60 mins
00:00 - 23:59
Ther, t.Sb, t.b, t.rb, CS.b, CS.rb, CL.b, Cl.rb
1 to 60 mins
00:00 - 23:59
1 to 60 mins
1P.LN, 1P.LL, 1P.3L, 3P.3L, 3P.4L
0100 V to 999000 V
no.Vt, 2.VT, 3.VT, 1.VT
100, 110, 115, 120
A.1, A.2, A.3, A.12, A.23, A.31, A.123
1 A to 32760 A
50 Hz, 60 Hz
1 A, 5 A
5 mA
Off, EnrG, ALM
1 to 9999000(Pulse per k_h)
d.Wh, r.Wh, t.Wh, d.Vrh, r.Vrh, t.Vrh, d.VAh, r.VAh, t.VAh, nonE
ON, OFF
1 to 247
4800, 9600, 19200, 38400
Even, Odd, None
0000 - 9999
YYYY (2000 to 2127)
M(month) - 1 to 12, dd(day) - 1 to 31
HH(hours) - 00 to 23, M(minutes) - 00 to 59
Off, EnrG
1 to 9999000 (k_h)
Wh, Vrh, VAh
Ct.Sq
Ct.rV
nonE, A.1, A.2, A.3, A.12, A.23, A.31, A.123
A.123, A.321, A.312, A.231, A.213, A.132
EM6400NG+ meter setup menus
NHA2768503-05 25
NOTE: The setup parameters CoM, Id, bAud, Prty, YEAr,. dAtE, and hour are
applicable for the commercial references METSEEM6400NGRSCL1,
METSEEM6400NGRSCL5, and METSEEM6400NGRSCL2. The setup
parameters PoP, P.PLS, and P.PAr are available for the commercial
references.METSEEM6400NGPOCL1, and METSEEM6400NGPOCL5.
Entering setup
The meter’s display screen and buttons allow you to navigate to and edit the
required parameters.
1. Press and hold the Up key and Down key simultaneously for 2 seconds.
2. Enter the password. Default password is 0000.
3. Press OK key to enter setup.
4. Press and hold the Up key and Down key simultaneously for 2 seconds to exit
Setup after viewing parameters.
Setup parameters
The meter supports configuration of various measurement parameters.

Conzerv EM6400NG+ Display and meter setup
Name on display Description Input range Default value
tYPE = Power System
Configurations
Vt= VT Connect Input range = no.Vt, 2.VT, 3.VT, 1.
Vt.Pr = Primary Voltage (V L-L) 100 V to 999000 V
Vt.SE = Secondary Voltage (V LL)
Ct = CT Terminal A.1, A.2, A.3, A.12, A.23, A.31,
Input range = 1P.Ln, 1P.LL, 1P.3L,
3P.3L, 3P.4L Default value = 3P4L
NOTE: Other power system
configurations can be set
through ION setup.
VT
NOTE: The VT Connect
parameters are enabled
based on selected power
system configuration.
NOTE: Vt.Pr will not be
enabled if VT Connect is no.
VT.
100, 110, 115, 120 V
NOTE: Vt.SE will not be
enabled if VT Connect is no.
VT.
A.123
NOTE: The Ct terminal
parameters are enabled
based on the selected power
system and VT connect
configuration.
3P.4L
no.Vt
120
120
A.123
Ct.Pr = CT Primary 1 A to 32760 A
NOTE: Ct primary can be set
to 32767 A through
communication.
Ct.SE = CT Secondary 1 A, 5 A 5
FrEq = System Frequency 50 Hz, 60 Hz 50
A.SuP: A.Suppression (Minimum
current at which meter starts
functioning)
Ct.Sq = CT Sequence Input range = A.123, A.321,
Ct.rV = CT Polarity Correction Input range = nonE, A1, A.2, A.3,
5 mA to 99 mA 5
A.312, A.231, A.213, A.132
NOTE: The CT Sequence is
applicable for 3P.3L and
3P.4L configurations and
A.123 CT Terminal value. If
you change the Power
System Configurations or CT
Terminal value, then the CT
sequence resets to the
default value.
A.12, A.23, A.31, A.123
NOTE: The CT Polarity
Correction parameters are
enabled based on selected
Power System
Configurations and CT
100
A.123
nonE
26 NHA2768503-05

Display and meter setup Conzerv EM6400NG+
Name on display Description Input range Default value
Terminal value. If you change
the Power System
Configurations or CT
Terminal value, then the CT
Polarity Correction resets to
the default value.
Pd = Power Demand tHEr, t.Sb, t.b, t.rb, CS.b, CS.rb,
CL.b, CL.rb
t.b
Pd.CY = Power Demand Period 1 to 60 mins
NOTE: The demand update
time is available for rolling
block methods under power
demand.
Pd.ut = Power Demand Update
Time
Pd.SY = Power Demand Clock
Sync Time
Ad = Current Demand tHEr, t.Sb, t.b, t.rb, CS.b, CS.rb,
Ad.CY = Current Demand Period 1 to 60 mins 15
1 to 60 mins
NOTE: The power demand
update time is available for
rolling block methods under
power demand.
00:00 to 23:59
NOTE: The clock sync time
is available only for clock
sync block and clock sync
roll block methods under
power demand.
CL.b, CL.rb
15
15
00.00
t.b
Ad.ut = Current Demand Update
Time
Ad.SY = Current Demand Clock
Sync Time
LEd = LED Off, EnrG Off
L.PLS = LED Pulse Weight 1 to 9999000 (Pulse per k_h)
LPAr = LED Energy Parameter d.Wh, r.Wh, t.Wh, d.Vrh, r.Vrh, t.
1 to 60 mins
NOTE: The current demand
update time is available for
rolling block methods under
current demand.
00:00 to 23:59
NOTE: The clock sync time
is available only for clock
sync block and clock sync
roll block methods under
current demand.
NOTE: Pulse per energy
values cannot be viewed if
LED is off.
Vrh, d.VAh, r.VAh, t.VAh, nonE
NOTE: LED parameter
values cannot be viewed if
LED is off.
15
00.00
1
nonE
NHA2768503-05 27

Conzerv EM6400NG+ Display and meter setup
Name on display Description Input range Default value
PASS = Password 0000 - 9999 0000
CoM = Communication
NOTE: Id, baud rate, and
parity cannot be viewed if
com is off.
Id = Unit Id 1 to 247 1
bAud = Baud Rate 4800, 9600, 19200, 38400 19200
Prty = Parity EVEn, odd, nonE EVEn
YEAr = RTC YYYY ( 2000 to 2127) NA
ON, OFF, RTFT
NOTE: ON / OFF: To enable
/ disable communications
port.
NOTE: Retrofit (RTFT): For
configuring legacy
communication data models
(Applicable only in
EM6400NG+ RS-485 meter
model).
ON
dAtE = Month:Date MM (month) - 1 to 12
dd (day) - 1 to 31
hour = Hours:Minutes HH (hours) - 00 to 23
MM (minutes) - 00 to 59
PoP = Communication Pulse
Output
P.PLS = POP Pulse Weight 1 to 9999000 (pulse per k_h) 200
Off, EnrG
NOTE: Pulse weight and
energy parameter cannot be
viewed if POP is off.
NA
NA
EnrG
28 NHA2768503-05

Display and meter setup Conzerv EM6400NG+
Name on display Description Input range Default value
P.PAr = POP Energy Parameter Wh, VAh, Vrh Wh
Indicates optional setup parameters
Button functions in viewing setup parameters
The meter supports single press and combination press functions of the buttons to
view setup parameters.
Mode Button Function
To navigate to the next parameter
configuration screen.
To navigate to the previous parameter
configuration screen.
Setup Menu
Enter setup mode to configure the displayed
parameter value.
Press and hold the Up and Down buttons
simultaneously for 2 seconds to enter Setup.
Exit setup with the same button sequence.
Button functions in editing setup parameters
The meter supports single press and combination press functions of the buttons to
edit setup parameters.
Mode Button Function
Flashing Digit: To decrease the numeric
value.
Flashing Value: To view the next value from
the list.
Flashing Decimal Point: To move the decimal
point to the left.
Flashing Digit: To increase the numeric value.
Flashing Value: To view the previous value
from the list.
Setup Menu
Press and hold for 2 seconds.
Press and hold for 2 seconds.
Flashing Decimal Point: To move the decimal
point to the right.
Flashing Digit / Flashing Decimal Point: To
move the position of the cursor to left.
Flashing Digit / Flashing Decimal Point: To
move the position of the cursor to right.
NHA2768503-05 29

Conzerv EM6400NG+ Display and meter setup
Mode Button Function
To select a parameter to edit the values.
To select configured parameter values.
To save the changes made to setup
parameter.
Press and hold the Up and Down buttons
simultaneously for 2 seconds to enter Setup.
Exit setup with the same button sequence.
Editing setup parameters
You can edit various measurement parameters as required.
1. Press and hold the Up and Down buttons simultaneously for 2 seconds to
enter Setup.
2. Enter password. Default password is 0000.
3. Press OK.
4. Press the Up or Down button to select a parameter to edit.
The selected parameter flashes the digit, value, or decimal point that is
required to be set (the meter automatically determines which option to flash
for editing, depending on the parameter).
5. Increase or decrease the digit value, move the decimal point, or select a
value from a pre-programmed list using the Up or Down button.
6. Press OK after making the required changes.
7. Press and hold the Up and Down buttons simultaneously for 2 seconds to exit
Setup.
8. Select Yes to save your settings.
Exiting setup parameters
The following steps describe how to exit setup mode without editing any
parameter values.
1. Press and hold the Up and Down buttons simultaneously for 2 seconds to
enter Setup.
2. Enter password. Default password is 0000.
3. Press OK.
4. Press the Up or Down button to view various setup parameters.
5. Press and hold the Up and Down buttons simultaneously for 2 seconds to exit
Setup without making any changes to the parameter values.
Demand
Demand parameters
Demand is a measure of average consumption (typically power or current) over a
fixed programmed time interval.
30 NHA2768503-05

Display and meter setup Conzerv EM6400NG+
Power / current demand setup parameters
Parameter Values Description
Method • Thermal: Ther
• Timed Sliding Block: t.Sb
• Timed Block: t.b
• Timed Rolling Block: t.rb
• Command Sync Block:
CS.b
• Command Sync Rolling
Block: CS.rb
• Clock Sync Block: CL.b
• Clock Sync Rolling Block:
Cl.rb
NOTE: Command sync
and clock sync methods
are applicable for meters
with RS-485
communication only.
Interval 1 – 60 Set the demand interval, in minutes.
Subinterval
(update time)
Clock Sync Time 00:00 – 23:59 Applies only to clock sync methods (these
1 – 60 Applies only to rolling block methods.
Select the appropriate demand calculation
method for your needs.
Define how many subintervals the demand
interval should be equally divided into.
synchronize the demand interval to the
meter’s internal clock).
Define what time of day you want to
synchronize the demand.
Viewing demand values on Display screen
You can view the demand values provided on the display screen by navigation
through display parameters.
1. Press OK to navigate to demand values on display screen.
2. The LED indicates last demand (DM).The values displayed on the screen
indicate kVA, kW, and kVAR.
3. Press the Down button to view I
avg
values.
4. Repeat the steps to view present demand (PrsDM), predictive demand
(PrdDM), and max demand (MD) values.
Viewing demand values in Setup screen
The meter supports editing power and current demand through setup mode.
1. Press and hold the Up and Down buttons simultaneously for 2 seconds to
enter Setup.
2. Enter password. Default password is 0000.
3. Press OK.
4. Press the Down button to select Pd (power demand) or Ad (current demand)
parameter.
5. Press OK.
6. Press the Down button to select required values from the existing list.
7. Press OK.
8. Press and hold the Up and Down buttons simultaneously for 2 seconds to exit
Setup.
NHA2768503-05 31

Conzerv EM6400NG+ Display and meter setup
9. Select Yes to save your settings.
Communications setup
After wiring the meter’s serial communications ports, you can configure these
ports so you can connect to the meter remotely and use device configuration
software such as ION Setup to configure the meter.
The setup screen allows you to configure the meter’s RS-485 communications
port so you can use software to access the meter’s data or configure the meter
remotely.
To turn on communication in setup screen, follow these steps:
1. Press and hold the Up and Down buttons simultaneously for 2 seconds to
enter setup.
2. Enter password. Default password is 0000.
3. Press OK.
4. Press the Down button to select a CoM (communication) parameter.
5. Press OK.
6. Press the Down button to select on from the list.
7. Press OK.
8. Press and hold the Up and Down buttons simultaneously for 2 seconds to exit
Setup.
9. Select Yes to save your settings.
Setting up the password
RS-485 communication parameters
Parameter Values Description
Address 1 to 247 Set the address for this device. The address must be
Baud Rate 4800, 9600, 19200,
Parity –
Number of
stop bits
38400
Even – 1
Odd – 1
None – 2
unique for each device in a communications loop.
Select the speed for data transmission. The baud rate
must be the same for all devices in a communications
loop.
Select None if the parity bit is not used. The parity
setting must be the same for all devices in a
communications loop.
NOTE: Communication parameters display ON / OFF / Retrofit (RTFT).
NOTE: Retrofit provides you an option of configuring legacy data models for
your device to communicate with newer models. (Applicable only in
EM6400NG+ RS-485 meter model).
The meter password can only be configured through the front panel.
The factory-default setting for all passwords is “0000” (zero). Changing the default
password for screens that are password protected prevents unauthorized
personnel from accessing certain screens such as the Setup and Clear screens.
To change the meter password using Setup, follow these steps:
1. Press and hold the Up and Down buttons simultaneously for 2 seconds to
enter Setup.
2. Enter password. Default password is 0000.
3. Press OK.
4. Press the Down button to select PASS (password) parameter.
5. Press OK.
32 NHA2768503-05

Display and meter setup Conzerv EM6400NG+
6. Press the Down button to change the digits.
NOTE: Hold Down button for 2 seconds to move the cursor to the next
digit.
7. Press OK.
8. Press and hold the Up and Down buttons simultaneously for 2 seconds to exit
Setup.
9. Select Yes to save your settings.
Password settings
Parameter Values Description
Setting up date and time
Pass 0000 - 9999 Sets the password for accessing the meter setup
screen.
NOTE: Common password applies across all
parameters.
Lost password
Visit www.se.com for support and assistance with lost passwords or other
technical problems with the meter. Make sure you include your meter’s model,
serial number and firmware version in your email or have it readily available if
calling Technical Support.
The Clock setup allows you to set the meter’s date and time.
1. Press and hold the Up and Down buttons simultaneously for 2 seconds to
enter Setup.
2. Enter password. Default password is 0000.
3. Press OK.
4. Press the Down button to select year, date, and hour parameter.
5. Press OK.
6. Press Down button to change the digits.
NOTE: Hold the Down button for 2 seconds to move the cursor to the next
digit.
7. Press OK.
8. Press and hold the Up and Down buttons simultaneously for 2 seconds to exit
Setup.
9. Select Yes to save your settings.
NOTE: You must always set or sync the meter time to local time.
Clock setup parameters
Parameter Values Description
Year YYYY Set the current year using format displayed on screen.
Date MM:DD Set the current date using the format displayed on
Hour HH:MM Use the 24 hours format to set the current time in local
screen, where date is in MM (month) and DD (date)
format.
time, where the time is in HH (hour) and MM (minutes)
format.
Diagnostics (Diag) screen menus
In Diag, you can verify the front panel LEDs, and view meter information.
Below is the list of Diag parameter that are displayed on the meter screen.
NHA2768503-05 33

Conzerv EM6400NG+ Display and meter setup
Diag parameters
All LEDs on
OS version
Meter Model
RS version
Serial number
Diagnostics error code
Delivered run hours
Received run hours
On hours
Interruptions
RS-485
EM6400NG+ meter diag menus
Viewing Diag
The meter’s display screen and buttons allow you to navigate to the Diag.
1. Press and hold the Down and OK buttons simultaneously for 2 seconds to
view Diag.
2. Press the Down button to navigate to the next screen.
3. Press and hold the Down and OK buttons simultaneously for 2 seconds to
exit Diag.
Diag screens
The meter displays various diagnostics screens.
Screens Description
All LEDs on On entering diag screen, all LEDs on the front panel light up. The display shows four eights (8888), four
Meter Model Displays the meter model number.
Serial number Displays the meter serial number, for example SN.0500005174.
OS version Displays the operating system version number, for example OS 1.00.0.
RS version Displays the reset (boot code) version number, for example RS 1.00.0.
decimal points (....) per line, negative indicators, and parameter LEDs. This indicates that the front panel LEDs
and display are operating correctly.
NOTE: Ensure you have your meter’s serial number information available while contacting Technical
Support for help.
Diagnostics error code Displays the error codes of the meter for diagnostics. The following are the diagnostics error codes.
Run hours
34 NHA2768503-05
• 0003 is the error code for RAM failure.
• 0005 is the error code for NVRAM failure.
• 0009 is the error code for RTC failure.
• 0011 is the error code for Calibration failure.
• 0021 is the error code for Clipping detected.
• 0041 is the error code for Over-Running energy pulse output.
• 0081 is the error code for Backup RAM failure.
• 0101 is the error code for Language file mismatch.
• 0201 is the error code for Language string mismatch.
Delivered / Import Indicates the period the load has been delivered. This counter accumulates as
long as the load is ON.

Display and meter setup Conzerv EM6400NG+
Clear parameters
Energy
MD
DM
Hi Lo
Screens Description
On hours
Interruptions
RS-485
Received / Export Indicates the period the load has been received. This counter accumulates as
Indicates the period for which the power meter's auxiliary supply is ON, regardless of the voltage and current
inputs.
Number of supply outages, means the number of auxiliary supply interruptions. If the power meter auxiliary
supply is from a UPS then the INTR (number of interruptions) will be zero (as long as the UPS stays ON), even
if the voltage signals die out from time to time.
Communication error
code
Communication settings
screen
long as the load is ON.
Displays the communication errors of the meter. The following are the
communication error codes.
• F is the error code for Illegal function error
• A is the error code for Data Address error
• D is the error code for Data value error
• E is the error code for Slave device failure error
• B is the error code for Device busy error
• C is the error code for CRC error
• O is the error code for Over Run error
• U is the error code for Unit ID error
Displays the unit ID, baud rate, and parity values of the meter.
Button functions in viewing Diag screen
The meter supports single press and combination press functions of the buttons to
view Diag screens.
Clear screen menus
Mode Button Function
To navigate to the next screen.
To navigate to the previous screen.
Setup Menu
Press and hold the Down and OK buttons
simultaneously for 2 seconds to view Diag.
Exit Diag screen with the same button
sequence.
Clear screen enables you to reset energy, demand, min / max, or max demand
values.
Below is the list of clear screen parameter that are displayed on the meter screen.
Meter clear screen menus
NHA2768503-05 35
Entering Clear screen
The meter’s display screen and buttons allow you to navigate to Clear.
1. Press and hold the OK button for 2 seconds.

Conzerv EM6400NG+ Display and meter setup
2. Press the Up button to select Yes.
3. Press OK.
4. Enter password. Default password is 0000.
5. Press OK.
6. Press the Down or Up button to navigate to the required parameter for
clearing the values.
7. Press and hold the OK button simultaneously for 2 seconds to exit Clear
screen.
Clear parameters
The meter supports reset of various parameters.
Parameters Description
Energy Resets the energy values. The meter supports reset of the following parameter values:
DM Used for demand synchronization function. The meter supports reset of the following parameter values:
Hi Lo Resets the minimum and maximum (min/max) values. The meter supports reset of the following parameter
MD Resets the maximum demand values.
• Active energy - Import / Export
• Reactive energy - Import / Export
• Apparent energy - Import / Export
• Run Hour
• Last demand
• Present demand
• Predictive demand
values:
• V L-L average
• V L-N average
• Current average
• Frequency
• Active power, Total
• Apparent power, Total
• Reactive power, Total
• Power factor, Total
• W, VA, VAR, and current demand with timestamp
Button functions in editing Clear parameters
The meter supports single press functions of the buttons to enter Clear screens.
Mode Button Function
Press and hold OK button for 2 seconds to
enter Clear.
Press OK button to clear/reset parameter
values.
Press and hold OK button for 2 seconds to
exit Clear.
Clear Screen
36 NHA2768503-05
To navigate to the next parameter.
To navigate to the previous parameter.

Display and meter setup Conzerv EM6400NG+
Lock / Unlock
Lock enables you to set the a meter screen to default screen. You can scroll to
other display screens while a screen has been locked. Once the manual scrolling
is stopped, the meter displays the default (lock) screen after four minutes.
The meter’s display screen and buttons allow you to lock or unlock any screen.
To lock / unlock a meter screen:
• Press and hold the Up and OK buttons simultaneously for 2 seconds to lock
or unlock a meter screen.
NOTE:
You can only lock the display parameters.
You cannot enter the Setup or Clear when a meter screen is locked.
Button functions in locking / unlocking meter screen
The meter supports a combination press function of the buttons to lock or unlock a
screen.
Mode Button Function
Lock / Unlock
Press and hold the Up and OK buttons
simultaneously for 2 seconds to lock or
unlock a meter screen.
NHA2768503-05 37

Conzerv EM6400NG+ Remote meter setup
Remote meter setup
Overview
You can configure the meter’s setup parameters through the meter’s RS-485
communications port.
The meter is factory-configured with default RS-485 communications port settings.
You must modify the default settings before connecting the meter to your RS-485
network. To configure the RS-485 port, you need:
• ION Setup
NOTE: Remote meter setup is applicable only for meter models supporting
RS-485 communication.
ION setup
Go to www.se.com and search for ION Setup to download a copy of the
installation file.
If you already have an existing installation of ION Setup, it is recommended that
you upgrade to the latest version in order to access new features or
enhancements and properly configure features available on your device.
Refer to the online help to learn how to use ION Setup.
RS-485 port setup
The meter is factory-configured with default serial communications settings that
you may need to modify before connecting the meter to the RS-485 bus.
The meter is factory-configured with the following default serial communications
settings:
• Protocol = Modbus RTU
• Address = 1
• Baud rate = 19200
• Parity = Even
You can use a communications converter (USB to RS-485 or RS-232 to RS-485)
device to connect to the meter.
Using a serial communications converter to set up RS-485
You can use a communications converter (USB to RS-485 or RS-232 to RS-485)
to connect to the meter.
NOTE: Configuring the serial communications settings using this method may
cause ION Setup to lose communications when the changes are sent to your
meter. You must reconfigure ION Setup to match the new settings to reestablish communications with your meter.
1. Configure the serial communications converter’s settings to be compatible
with the meter’s default communications settings.
2. Connect the meter’s RS-485 port to the serial communications converter.
3. Connect the communications converter to the computer.
4. Start ION Setup in Network mode.
38 NHA2768503-05

Remote meter setup Conzerv EM6400NG+
5. Add a serial site and set its properties:
• Comm link = Serial
• Comm port = select which serial (or USB) port the communications
converter is attached to
• Baud rate = 19200
• Format = select a format with even parity
6. Add a meter to the site and set its properties:
• Type = EM6400NG series load manager
• Unit ID = 1
7. Use the setup screens to modify the meter’s setup parameters.
8. Use the RS-485 Base Comm setup screen to modify the meter’s serial
communication settings.
9. Click Send to save your changes to the meter. You need to reconfigure ION
Setup to match the changed settings in order to re-establish communications
with your meter.
10. Exit ION Setup.
RS-485 port settings
Parameter Values Description
Protocol Modbus RTU Select the communications format used to
Address 1 to 247 Set the address for this device. The address
Baud rate 4800, 9600, 19200, 38400 Select the speed for data transmission. The
Parity Even, Odd, None Select None if the parity bit is not used. The
Meter setup through RS-485
After the meter’s RS-485 port is configured and connected to the RS-485 network,
you can use ION Setup to configure all other meter setup parameters.
transmit data. The protocol must be the same
for all devices in a communications loop.
ION Setup does not support ASCII 8, ASCII 7 or
JBus protocols.
must be unique for each device in a
communications loop.
baud rate must be the same for all devices in a
communications loop.
parity setting must be the same for all devices in
a communications loop.
Meter configuration using ION setup
Start ION Setup, create a site (or if applicable, use an existing site), then add your
meter to the site.
See the “EM6400NG series” topic in the ION Setup online help or in the ION
Setup device configuration guide. To download a copy, go to www.se.com and
search for ION Setup device configuration guide.
NHA2768503-05 39

Conzerv EM6400NG+ Viewing meter data
Conzerv EM6400NG+
%
%
%
Viewing meter data
Viewing meter data from the display
Voltage average, current average, and power factor average are displayed the
first time a meter is powered up, after which the last viewed screen or locked
(default) screen is displayed every time the meter is powered up.
Meters data screens
Meter data display screens
The meter screens in EM6400NG+ meter is divided as per phase measurements,
system measurements, demand measurements, energy measurements, and
RTC.
The screen menu items are listed below:
System measurements
V
avg
kVA Apparent power total
F Frequency (Hz)
x1000 Multiplication factor
I
avg
kW Active power total
In Neutral current
x1000 Multiplication factor
PF
avg
kVAR Reactive power total
Voltage 3 phase average
Current 3 phase average
Power factor average
40 NHA2768503-05

Viewing meter data Conzerv EM6400NG+
System measurements (Continued)
I
unb
x1000 Multiplication factor
Current unbalance
Phase measurements
V
L-N
V
L-L
I Current A1 A2 A3
kVA Apparent Power kVA1 kVA2 KVA3
kW Active Power kW1 kW2 kW3
kVAR Reactive Power kVAR1 KVAR2 KVAR3
PF Power factor – : Leading PF PF1 PF2 PF3
V
THD
I
THD
Voltage Line to neutral V1 V2 V3
Voltage Line to Line V12 V23 V31
+: Lagging PF
Voltage THD% V1
Current THD% A1
THD
THD
V2
A2
THD
THD
V3
A3
Energy measurements
kWh Active energy - Import / Delivered (+)
Active energy - Export / Received (-)
THD
THD
kVAh Apparent energy - Import / Delivered (+)
Apparent energy - Export / Received (-)
kVARh Reactive energy - Import / Delivered (+)
Reactive energy - Export / Received (-)
Demand measurements
DM Last Demand kVA kVAR kW I
PrsDM Present/
Raising
demand
PrdDM Predictive
demand
MD Max demand kVA kVAR kW I
kVA kVAR kW I
kVA kVAR kW I
RTC
RTC Date and time Year / Date / Hour
Using ION Setup to view or modify configuration data
avg
avg
avg
avg
You can use ION setup to view or modify the meter setup parameters.
Using software to view meter data
There are different software systems and methods you can use to access or
display the meter data. This can range from using a simple Modbus register
interface to read stored values in the meter’s registers, to viewing intelligent
information from the meter through an energy management system.
NHA2768503-05 41

Conzerv EM6400NG+ Viewing meter data
Power Monitoring Expert
EcoStruxure™Power Monitoring Expert is a complete supervisory software
package for power management applications.
The software collects and organizes data gathered from your facility’s electrical
network and presents it as meaningful, actionable information via an intuitive web
interface.
Power Monitoring Expert communicates with devices on the network to provide:
• Real-time monitoring through a multi-user web portal
• Trend graphing and aggregation
• Power quality analysis and compliance monitoring
• Preconfigured and custom reporting
See the EcoStruxure
how to add your device into its system for data collection and analysis.
™
Power Monitoring Expert online help for instructions on
Power SCADA Operation
EcoStruxure™Power SCADA Operation is a complete real-time monitoring and
control solution for large facility and critical infrastructure operations.
It communicates with your device for data acquisition and real-time control. You
can use Power SCADA Operation for:
• System supervision
• Real-time and historical trending, event logging
• PC-based custom alarms
See the EcoStruxure
how to add your device into its system for data collection and analysis.
Modbus command interface
Most of the meter’s real-time and logged data, as well as basic configuration and
setup of meter features, can be accessed and programmed using a Modbus
command interface as published in the meter’s Modbus register list.
This is an advanced procedure that should only be performed by users with
advanced knowledge of Modbus, their meter, and the power system being
monitored. For further information on the Modbus command interface, contact
Technical Support.
See your meter’s Modbus register list at www.se.com for the Modbus mapping
information and basic instructions on command interface.
™
Power SCADA Operation online help for instructions on
42 NHA2768503-05

Measurements and calculations Conzerv EM6400NG+
Measurements and calculations
Meter initialization
Meter Initialization is a special command that clears the meter’s energy, power,
demand values, and meter operation timer.
It is common practice to initialize the meter after its configuration is completed,
before adding it to an energy management system.
After configuring all the meter setup parameters, navigate through the different
meter display screens and make sure the displayed data is valid then perform
meter initialization.
NOTE: You can perform meter initialization using ION setup and secured
command interface.
Real-time readings
The meter measures currents and voltages, and reports in real time the RMS
(Root Mean Squared) values for all three phases and neutral.
The voltage and current inputs are continuously monitored at a sampling rate of
64 samples per cycle. This amount of resolution helps enable the meter to provide
reliable measurements and calculated electrical values for various commercial,
buildings and industrial applications.
Energy measurements
The meter provides fully bi-directional, 4-quadrant energy metering.
The meter stores all accumulated active, reactive and apparent energy
measurements in nonvolatile memory:
• kWh, kVARh, kVAh (delivered)
• kWh, kVARh, kVAh (received)
• kWh, kVARh, kVAh net (delivered - received)
• kWh, kVARh, kVAh absolute (delivered + received)
All energy parameters represent the total for all three phases.
NOTE: Based on the energy scale selection, when kWh, kVARh, kVAh (delivered)
or kWh, kVARh, kVAh (received) of the energy parameters overflow at
999999999.999 all energy parameters value resets.
Quadrant based VARh
NOTE: Applicable only in EM6400NG+ RS-485 meter model.
Quadrant based reactive energy values are available only on communication.
These reactive energies are for Q1 , Q2, Q3 and Q4 quadrants.
On communication quadrant based reactive energies will be recorded as follows:
• Q1 (00 to 90 Degree) = Q1 VARh , Del
• Q2 (90 to 180 Degree) = Q2 VARh , Del
• Q3 (180 to 270 degree) = Q3 VARh, Rec
• Q4 (270 to 360 degree) = Q4 VARh , Rec
If energy is cleared, all quadrant based VARhs will be cleared.
NHA2768503-05 43

Conzerv EM6400NG+ Measurements and calculations
Min/max values
When the readings reach their lowest or highest value, the meter updates and
saves these min/max (minimum and maximum) quantities in non-volatile memory.
The meter’s real-time readings are updated once every 50 cycles for 50 Hz
systems, or once every 60 cycles for 60 Hz systems.
Power demand
Power demand is a measure of average power consumption over a fixed time
interval.
NOTE: If not specified, references to demand are assumed to mean power
demand.
The meter measures instantaneous consumption and can calculate demand using
various methods.
Power demand calculation methods
Power demand is calculated by dividing the energy accumulated during a
specified period by the length of that period.
Block interval demand
How the meter performs this calculation depends on the method and time
parameters you select (for example, timed rolling block demand with a 15-minute
interval and 5-minute subinterval).
To be compatible with electric utility billing practices, the meter provides the
following types of power demand calculations:
• Block interval demand
• Synchronized demand
• Thermal demand
You can configure the power demand calculation method from the display or
software.
For block interval demand method types, you specify a period of time interval (or
block) that the meter uses for the demand calculation.
Select/configure how the meter handles that interval from one of these different
methods:
Type Description
Timed Sliding Block Select an interval from 1 to 60 minutes (in 1-minute increments). If
the interval is between 1 and 15 minutes, the demand calculation
updates every 15 seconds. If the interval is between 16 and 60
minutes, the demand calculation updates every 60 seconds. The
meter displays the demand value for the last completed interval.
Timed Block Select an interval from 1 to 60 minutes (in 1-minute increments). The
Timed Rolling Block Select an interval and a subinterval. The subinterval must divide
meter calculates and updates the demand at the end of each
interval.
evenly into the interval (for example, three 5-minute subintervals for
a 15-minute interval). Demand is updated at the end of each
subinterval. The meter displays the demand value for the last
completed interval.
Block interval demand example
The following illustration shows the different ways power demand is calculated
using the block interval method. In this example, the interval is set to 15 minutes.
44 NHA2768503-05

Measurements and calculations Conzerv EM6400NG+
15 30 45 60 . . .
Demand value is
the average for the
last completed interval
Time (sec)
Calculation updates
every 15 seconds
15-minute interval
15 30 45
Demand value is
the average for the
last completed
interval
Time
(min)
Calculation updates at
the end of the interval
15-minute interval 15-minute interval 15-min
15
5403
20 35 4025
Demand value is
the average for
the last completed
interval
Time
(min)
Calculation updates at the end
of the subinterval (5 minutes)
15-minute interval
Timed Sliding Block
Timed Block
Synchronized demand
Timed Rolling Block
You can configure the demand calculations to be synchronized using an external
pulse input, a command sent over communications, or the device’s internal realtime clock.
Type Description
Command
synchronized demand
Clock synchronized
demand
This method allows you to synchronize the demand intervals of multiple
meters on a communications network. For example, if a programmable
logic controller (PLC) input is monitoring a pulse at the end of a demand
interval on a utility revenue meter, you can program the PLC to issue a
command to multiple meters whenever the utility meter starts a new
demand interval. Each time the command is issued, the demand readings
of each meter are calculated for the same interval.
This method allows you to synchronize the demand interval to the meter’s
internal real-time clock. This helps you synchronize the demand to a
particular time, typically on the hour (for example, at 12:00 am). If you
select another time of day when the demand intervals are to be
synchronized, the time must be specified in minutes from midnight. For
example, to synchronize at 8:00 am, select 480 minutes.
Thermal demand
Thermal demand calculates the demand based on a thermal response, which
NHA2768503-05 45
imitates the function of thermal demand meters.
NOTE: For these demand types, you can choose block or rolling block
options. If you select a rolling block demand option, you need to specify a
subinterval.

Conzerv EM6400NG+ Measurements and calculations
Last completed
demand interval
Time
(minutes)
next
15-minute
interval
15-minute
interval
% of Load
99%
90%
1:00 1:06 1:15
The demand calculation updates at the end of each interval. You can set the
demand interval from 1 to 60 minutes (in 1-minute increments).
Thermal demand example
The following illustration shows the thermal demand calculation. In this example,
the interval is set to 15 minutes. The interval is a window of time that moves
across the timeline. The calculation updates at the end of each interval.
Current demand
Predicted demand
The meter calculates current demand using the block interval, synchronized or
thermal demand methods.
You can set the demand interval from 1 to 60 minutes in 1 minute increments (for
example, 15 minutes).
The meter calculates predicted demand for the end of the present interval for kW,
kVAR, and kVA demand, taking into account the energy consumption so far within
the present (partial) interval and the present rate of consumption.
Predicated demand is updated according to the update rate of your meter.
The following illustration shows how a change in load can affect predicted demand
for the interval. In this example, the interval is set to 15 minutes.
46 NHA2768503-05
A Beginning of interval E Change in load
B Demand for last completed interval F Predicted demand if load is added
C 15-minute interval G Predicted demand if no load is added
D Partial interval H Time
during interval; predicted demand
increases to reflect increased demand

Measurements and calculations Conzerv EM6400NG+
Peak demand
The meter records the peak (or maximum) values for kWD, kVARD, and kVAD
power (or peak demand).
The peak for each value is the highest average reading since the meter was last
reset. These values are maintained in the meter’s non-volatile memory.
The meter also stores the date and time when the peak demand occurred.
Timer
The meter supports an active load timer, meter operation timer, and load run hours
Active load timer
Active load timer shows how much time a load has been running, based on the
specified minimum current for the load timer setpoint setting.
The active load timer data can be read through communication only.
Meter operation timer
Load run hours
Meter operating timer shows how long the meter has been powered up.
Load run hours show how much time a load has been running, based on
accumulated energy - received and delivered.
Load run hour counter is available under diag page. Run hours are displayed with
6 digits for Hours and 2 digits for Minutes. These run hour counters shall reset
along with energy values.
NHA2768503-05 47

Conzerv EM6400NG+ Power quality
HC = (H2)2 + (H3)2 + (H4)2 ...
TH D
H
C
H
1
-------- 100%=
x
Power quality
Harmonics overview
This section describes the meter’s power quality features and how to access
power quality data. The meter measures voltage and current harmonics up to the
15th harmonic, and calculates Total Harmonic Distortion (THD%).
Harmonics are integer multiples of the fundamental frequency of the power
system. Harmonics information is required for compliance to system power quality
standards such as EN50160 and meter power quality standards such as IEC
61000-4-30.
The meter measures fundamental and higher harmonics relative to the
fundamental frequency. The meter’s power system setting defines which phases
are present and determines how line-to-line or line-to-neutral voltage harmonics
and current harmonics are calculated.
Harmonics are used to identify whether the supplied system power meets required
power quality standards, or if non-linear loads are affecting your power system.
Power system harmonics can cause current flow on the neutral conductor, and
damage to equipment such as increased heating in electric motors. Power
conditioners or harmonic filters can be used to minimize unwanted harmonics.
Total harmonic distortion %
Total harmonic distortion (THD%) is a measure of the total per-phase voltage or
current harmonic distortion present in the power system.
THD% provides a general indication of the quality of a waveform. THD% is
calculated for each phase of both voltage and current.
Harmonic content calculations
Harmonic content (HC) is equal to the RMS value of all the non-fundamental
harmonic components in one phase of the power system.
The meter uses the following equation to calculate H
THD% calculations
THD% is a quick measure of the total distortion present in a waveform and is the
ratio of harmonic content (H
By default, the meter uses the following equation to calculate THD%:
:
C
) to the fundamental harmonic (H1).
C
Displaying harmonics data
48 NHA2768503-05
The meter displays voltage and current THD% data on the front panel, while the
phase wise THD% data can be read through communication.
1. Press OK button to navigate to phase parameters.

Power quality Conzerv EM6400NG+
2. Press Down button to view V
NOTE:
The LED rows display V1
A1
THD
, A2
THD
, and A3
THD
THD
THD
for I
and I
, V2
THD
THD
, and V3
THD
values.
values.
THD
for V
values, and
THD
NHA2768503-05 49

Conzerv EM6400NG+ Maintenance and upgrades
Maintenance and upgrades
Maintenance overview
The meter does not contain any user-serviceable parts. If the meter requires
service, contact your local Schneider Electric Technical Support representative.
NOTICE
METER DAMAGE
• Do not open the meter case.
• Do not attempt to repair any components of the meter.
Failure to follow these instructions can result in equipment damage.
Do not open the meter. Opening the meter voids the warranty.
Troubleshooting LED indicators
Abnormal heartbeat / serial communications LED behavior could mean potential
problems with the meter.
Problem Probable causes Possible solutions
LED flash rate does not
change when data is sent from
the host computer.
Heartbeat / serial
communications LED remains
lit and does not flash ON and
OFF
Heartbeat / serial
communications LED flashes,
but the display is blank.
Communications wiring If using a serial-to-RS-485
Internal hardware problem Perform a hard reset: turn off
Internal hardware problem Perform a hard reset: turn off
Display setup parameters
incorrectly set
converter, trace and check that
all wiring from the computer to
the meter is properly
terminated.
control power to the meter,
then re-apply power. If the
problem persists, contact
Technical Support.
control power to the meter,
then re-apply power. If the
problem persists, contact
Technical Support.
Review display parameter
setup.
If the problem is not fixed after troubleshooting, contact Technical Support for help
and ensure you have your meter’s firmware version, model and serial number
information available.
Meter memory
The meter stores configuration and logging information in non-volatile memory
and a long-life memory chip.
The meter uses its non-volatile memory (NVRAM) to retain all data and metering
configuration values.
Meter battery
The internal battery in the meter keeps the meter’s clock running when it is
powered down to help maintain the meter time.
50 NHA2768503-05

Maintenance and upgrades Conzerv EM6400NG+
The life expectancy of the meter’s internal battery is estimated to be over 10 years
at 25 °C under typical operating conditions.
Viewing firmware version, model and serial number
You can view the meter’s firmware version, model and serial number from the
display panel.
1. Press and hold Down and OK button for 2 seconds to enter Diag page. Meter
display shows all LEDs turned on.
2. Press Down button to view meter model, serial number, OS version, and RS
version.
3. Press and hold Down and OK button for 2 seconds to exit Diag page.
Firmware upgrades
There are a number of reasons why you may want to upgrade your meter’s
firmware.
• Improve meter performance (e.g., optimize processing speed)
• Enhance existing meter features and functions
• Add new functionality to the meter
• Achieve compliance to new industry standards
Firmware upgrade using DLF3000
The meter contains firmware that can be upgraded using DLF3000.
1. Download the latest version of DLF3000 from www.se.com, then install it on
your computer.
NOTE: DLF3000 is a free Schneider Electric utility for downloading
firmware to your meter.
2. Download your meter’s firmware from www.se.com.
3. Start DLF3000.
4. Click Add. Navigate to the folder where you saved your meter’s firmware.
5. Select the firmware file and click Open.
6. Select the firmware, then click Next.
7. If you haven’t defined an upgrade system yet:
• Click New, then type in the box to assign a system name
• Click Add, then type in the box to assign a communications connection
name
• Select the communications driver as Serial Driver
8. Click Continue.
9. Click Add Device.
• Type in the box to assign a device name
• Select the NG6400LED device type from the list
• Select the connection name, i.e., the one you defined in the previous
step
10. Click Next.
NHA2768503-05 51

Conzerv EM6400NG+ Maintenance and upgrades
11. Make sure the connection name, i.e., the one you defined in the previous
step, is still selected. Enter the device address.
12. Select the protocol (e.g., Modbus).
13. Click OK.
14. Click Next.
15. Select the device name from the Download Candidate Devices pane, then
click the right arrow button to move the selection to the Download Target
Devices pane.
16. Select the meter firmware in the Firmware to field.
17. Click Next.
18. Click Health Check to confirm the meter is communicating. The Health
Status shows Passed to indicate successful communications.
19. Click Next.
20. The Firmware Update Group shows the connection name, the firmware
version and status (should be “Queued”). The Group Device List shows the
device or devices being upgraded. Click Download.
NOTE: A warning message displays, “Warning: Relays on PowerLogic
Metering Devices will be de-energized if selected for download and will
remain in this mode until a successful download is completed. Press OK
to start the download.”
21. Click OK.
22. When the firmware upgrade is complete, the Firmware Update Group status
23. To exit the download firmware program, click Yes when prompted to quit DLF.
Technical assistance
Make sure you include your meter’s model, serial number and firmware version in
your email or have it readily available if calling Technical Support.
• The Firmware Upgrade Group status changes to Active, then updates to
show the current upgrade progress (in percent complete).
• The Group Device List status shows “Entering Download Mode”, then
changes to “Downloading” when the firmware is being downloaded to the
meter. “Estimated Time Remaining” shows the firmware download
progress.
• You can also check the progress on meters display panel. The meter
display shows “Download in progress” and a shows a dynamically
incrementing number for “Percent Complete” (up to 100%).
shows Complete (Passed). The Group Device List status shows Successful
Download. Click Finished.
NOTE: A maximum of 32 devices can be upgraded in parallel through
DLF.
52 NHA2768503-05

Verifying accuracy Conzerv EM6400NG+
Verifying accuracy
Overview of meter accuracy
All meters are tested and verified at the factory in accordance with International
Electrotechnical Commission (IEC) and Institute of Electrical and Electronics
Engineers (IEEE) standards.
Your meter typically does not require re-calibration. However, in some installations
a final accuracy verification of the meters is required, especially if the meters will
be used for revenue or billing applications.
Accuracy test requirements
The most common method for testing meter accuracy is to apply test voltages and
currents from a stable power source and compare the meter’s readings with
readings from a reference device or energy standard.
Signal and power source
Control equipment
The meter maintains its accuracy during voltage and current signal source
variations but its energy pulsing output needs a stable test signal to help produce
accurate test pulses. The meter’s energy pulsing mechanism needs
approximately 10 seconds to stabilize after every source adjustment.
The meter must be connected to control power in order to conduct accuracy
verification testing. Refer to your meter’s installation documentation for power
supply specifications.
DANGER
HAZARD OF ELECTRIC SHOCK, EXPLOSION, OR ARC FLASH
Verify the device’s power source meets the specifications for your device’s
power supply.
Failure to follow these instructions will result in death or serious injury.
Control equipment is required for counting and timing the pulse outputs from an
energy pulsing LED.
• Most standard test benches have an arm equipped with optical sensors to
detect LED pulses (the photodiode circuitry converts detected light into a
voltage signal).
• The reference device or energy standard typically has digital inputs that can
detect and count pulses coming from an external source (i.e., the meter’s
pulse output).
NOTE: The optical sensors on the test bench can be disrupted by strong
sources of ambient light (such as camera flashes, florescent tubes, sunlight
reflections, floodlights, etc.). This can cause test errors. Use a hood, if
necessary, to block out ambient light.
Environment
The meter should be tested at the same temperature as the testing equipment.
The ideal temperature is about 23 ºC (73 ºF). Make sure the meter is warmed up
sufficiently before testing.
NHA2768503-05 53

Conzerv EM6400NG+ Verifying accuracy
A warm-up time of 30 minutes is recommended before beginning energy accuracy
verification testing. At the factory, the meters are warmed up to their typical
operating temperature before calibration to help ensure that the meters will reach
their optimal accuracy at operating temperature.
Most high precision electronic equipment requires a warm up time before it
reaches its specified performance levels. Energy meter standards allow the
manufacturers to specify meter accuracy derating due to ambient temperature
changes and self-heating.
Your meter complies with and meets the requirements of these energy metering
standards.
For a list of accuracy standards that your meter complies to, contact your local
Schneider Electric representative or download the meter brochure from
www.se.com.
Reference device or energy standard
To help ensure the accuracy of the test, it is recommended that you use a
reference device or reference energy standard with a specified accuracy that is 6
to 10 times more accurate than the meter under test. Before you start testing, the
reference device or energy standard should be warmed up as recommended by
its manufacturer.
NOTE: Verify the accuracy and precision of all measurement equipment used
in accuracy testing (for example, voltmeters, ammeters, power factor meters).
Verifying accuracy test
The following tests are guidelines for accuracy testing your meter; your meter
shop may have specific testing methods.
HAZARD OF ELECTRIC SHOCK, EXPLOSION, OR ARC FLASH
• Apply appropriate Personal Protective Equipment (PPE) and follow safe
electrical work practices. See NFPA 70E, CSA Z462 or other local
standards.
• Turn off all power supplying this device and the equipment in which it is
installed before working on or in the equipment.
• Always use a properly rated voltage sensing device to confirm that all power
is off.
• Do not exceed the maximum ratings of this device.
• Verify the device’s power source meets the specifications for your device’s
power supply.
Failure to follow these instructions will result in death or serious injury.
1. Turn off all power supplying this device and the equipment in which it is
installed before working on the device or equipment.
DANGER
2. Use a properly rated voltage sensing device to confirm that all power is off.
54 NHA2768503-05

Verifying accuracy Conzerv EM6400NG+
V1V2 V3 VN
A1 A2 A3
+-+-+
-
V1 V2 V3 VN
A1 A2 A3
+-+-+
-
V1 V2 V3 VN
A1 A2 A3
+-+-+
-
3. Connect the test voltage and current source to the reference device or energy
standard. Ensure all voltage inputs to the meter under test are connected in
parallel and all current inputs are connected in series.
A Reference device or energy standard
B Test voltage and current source
C Meter under test
4. Connect the control equipment used for counting the standard output pulses
using one of these methods:
Option Description
Energy pulsing LED Align the red light sensor on the standard test bench armature over
Pulse output Connect the meter’s pulse output to the standard test bench pulse
the energy pulsing LED.
counting connections.
NOTE: When selecting which method to use, be aware that energy
pulsing LEDs and pulse outputs have different pulse rate limits.
5. Before performing the verification test, let the test equipment power up the
meter and apply voltage for at least 30 seconds. This helps stabilize the
internal circuitry of the meter.
6. Configure the meter’s parameters for verifying accuracy testing.
7. Depending on the method selected for counting the energy pulses, configure
the meter’s energy pulsing LED or one of the pulse outputs to perform energy
pulsing. Set the meter’s energy pulse constant so it is in sync with the
reference test equipment.
8. Perform accuracy verification on the test points. Run each test point for at
least 30 seconds to allow the test bench equipment to read an adequate
number of pulses. Allow 10 seconds of dwell time between test points.
Required pulses calculation for accuracy verification testing
NHA2768503-05 55
Accuracy verification test equipment typically requires you to specify the number
of pulses for a specific test duration.
The reference test equipment typically requires you to specify the number of
pulses required for a test duration of “t” seconds. Normally, the number of pulses
required is at least 25 pulses, and the test duration is greater than 30 seconds.
Use the following formula to calculate the required number of pulses:
Number of pulses = Ptot x K x t/3600
Where:

Conzerv EM6400NG+ Verifying accuracy
• Ptot = total instantaneous power in kilowatts (kW)
• K = the meter’s pulse constant setting, in pulses per kWh
• t = test duration, in seconds (typically greater than 30 seconds)
Total power calculation for accuracy verification testing
Accuracy verification testing supplies the same test signal (total power) to both the
energy reference/standard and the meter under test.
Total power is calculated as follows, where:
• Ptot = total instantaneous power in kilowatts (kW)
• VLN = test point line-to-neutral voltage in volts (V)
• I = test point current in amps (A)
• PF = power factor
The result of the calculation is rounded up to the nearest integer.
For a balanced 3–phase Wye system:
Ptot = 3 x VLN x I x PF x 1 kW/1000 W
NOTE: A balanced 3–phase system assumes that the voltage, current and
power factor values are the same for all phases.
For a single-phase system:
Ptot = VLN x I x PF x 1 kW/1000W
Percentage error calculation for accuracy verification testing
Accuracy verification testing requires you to calculate the percentage error
between the meter being tested and the reference/standard.
Calculate the percentage error for every test point using the following formula:
Energy error = (EM - ES) / ES x 100%
Where:
• EM = energy measured by the meter under test
• ES = energy measured by the reference device or energy standard.
NOTE: If accuracy verification reveals inaccuracies in your meter, they may be
caused by typical sources of test errors. If there are no sources of test errors
present, please contact your local Schneider Electric representative.
Accuracy verification test points
The meter should be tested at full and light loads and at lagging (inductive) power
factors to help ensure testing over the entire range of the meter.
The test amperage and voltage input rating are labeled on the meter. Refer to the
installation sheet or data sheet for your meter’s nominal current, voltage and
frequency specifications.
56 NHA2768503-05

Verifying accuracy Conzerv EM6400NG+
Pulse period (in seconds)
3600
K x Ptot
1
Pulse frequency (Hz)
= =
Ptot = 3 x VLN x
VT
p
VT
s
x I x
CT
p
CT
s
x PF x
1 kW
1000 W
Watt-hour test point Sample accuracy verification test point
Full load 100% to 200% of the nominal current, 100% of the nominal voltage and
Light load 10% of the nominal current, 100% of the nominal voltage and nominal
Inductive load (lagging
power factor)
VAR-hour test point Sample accuracy verification test point
Full load 100% to 200% of the nominal current, 100% of the nominal voltage and
Light load 10% of the nominal current, 100% of the nominal voltage and nominal
Inductive load (lagging
power factor)
Energy pulsing considerations
The meter’s energy pulsing LED and pulse outputs are capable of energy pulsing
within specific limits.
nominal frequency at unity power factor or one (1).
frequency at unity power factor or one (1).
100% of the nominal current, 100% of the nominal voltage and nominal
frequency at 0.50 lagging power factor (current lagging voltage by 60°
phase angle).
nominal frequency at zero power factor (current lagging voltage by 90°
phase angle).
frequency at zero power factor (current lagging voltage by 90° phase
angle).
100% of the nominal current, 100% of the nominal voltage and nominal
frequency at 0.87 lagging power factor (current lagging voltage by 30°
phase angle).
Description Energy pulsing LED Pulse output
Maximum pulse frequency 35 Hz 20 Hz
Minimum pulse constant 1 pulse per k_h
Maximum pulse constant 9,999,000 pulses per k_h
The pulse rate depends on the voltage, current and PF of the input signal source,
the number of phases, and the VT and CT ratios.
If Ptot is the instantaneous power (in kW) and K is the pulse constant (in pulses
per kWh), then the pulse period is:
VT and CT considerations
Total power (Ptot) is derived from the values of the voltage and current inputs at
the secondary side, and takes into account the VT and CT ratios.
The test points are always taken at the secondary side, regardless of whether VTs
or CTs are used.
If VTs and CTs are used, you must include their primary and secondary ratings in
the equation. For example, in a balanced 3-phase Wye system with VTs and CTs:
NHA2768503-05 57
where Ptot = total power, VTp= VT primary, VTs= VT secondary, CTp= CT
primary, CT
= CT secondary and PF = power factor.
s

Conzerv EM6400NG+ Verifying accuracy
Ptot = 3 x 119 x
480
120
x 5.31 x
120
5
x 0.85 x
1 kW
1000 W
= 154.71 kW
K =
3600 x (pulse frequency)
Ptot
=
3600 seconds/hour x 20 pulses/second
154.71 kW
K = 465.5 pulses / kWh
Pmax = 3 x 119 x
480
120
x 6 x
100
5
x 1 x
1 kW
1000 W
= 205.6 kW
Maximum pulse frequency =
K x Pmax
3600
=
465.5 pulses / kWh x 205.6 kW
3600 seconds/hour
Maximum pulse frequency = 26.6 pulses/second = 26.6 Hz
Kmax =
3600 x (pulse output maximum pulse frequency)
Pmax
=
3600 x 20
205.6
Kmax = 350.14 pulses per kWh
New maximum pulse frequency =
K x Pmax
3600
=
300 pulses/kWh x 205.6 kW
3600 seconds/hour
New maximum pulse frequency = 17.1 pulses/second = 17.1 Hz
Example calculations
This example calculation shows how to calculate power, pulse constants and
maximum pulse frequency, and how to determine a pulse constant that reduces
the maximum pulse frequency.
A balanced 3-phase Wye system uses 480:120 volt VTs and 120:5 amp CTs. The
signals at the secondary side are 119 volts line-to-neutral and 5.31 amps, with a
power factor of 0.85. The desired pulse output frequency is 20 Hz (20 pulses per
second).
1. Calculate the typical total output power (Ptot):
2. Calculate the pulse constant (K):
3. At full load (120% of nominal current = 6 A) and power factor (PF = 1),
calculate the maximum total output power (Pmax):
4. Calculate the maximum output pulse frequency at Pmax:
5. Check the maximum pulse frequency against the limits for the LED and pulse
outputs:
• 26.6 Hz ≤ LED maximum pulse frequency (35 Hz)
• 26.6 Hz > pulse output maximum pulse frequency (20 Hz)
NOTE: The maximum pulse frequency is within the limits for LED energy
pulsing. However, the maximum pulse frequency is greater than the limits
for pulse output energy pulsing. Pulse output frequencies greater than 20
Hz will saturate the pulse output and cause it to stop pulsing. Therefore in
this example, you can only use the LED for energy pulsing.
Adjustments to allow energy pulsing at the pulse outputs
If you want to use the pulse output, you must reduce the output pulse frequency
so it is within the limits.
Using the values from the above example, the maximum pulse constant for the
pulse output is:
58 NHA2768503-05
1. Set the pulse constant (K) to a value below Kmax, for example, 300 pulses/
kWh. Calculate the new maximum output pulse frequency at Pmax:

Verifying accuracy Conzerv EM6400NG+
2. Check the new maximum pulse frequency against the limits for the LED and
pulse outputs:
• 17.1 Hz ≤ LED maximum pulse frequency (35 Hz)
• 17.1 Hz ≤ pulse output maximum frequency (20 Hz)
As expected, changing K to a value below Kmax allows you to use the pulse
output for energy pulsing.
3. Set the new pulse constant (K) on your meter.
Typical sources of test errors
If you see excessive errors during accuracy testing, examine your test setup and
test procedures to eliminate typical sources of measurement errors.
Typical sources of accuracy verification testing errors include:
• Loose connections of voltage or current circuits, often caused by worn-out
contacts or terminals. Inspect terminals of test equipment, cables, test
harness and the meter under test.
• Meter ambient temperature is significantly different than 23 °C (73 °F).
• Floating (ungrounded) neutral voltage terminal in any configuration with
unbalanced phase voltages.
• Inadequate meter control power, resulting in the meter resetting during the
test procedure.
• Ambient light interference or sensitivity issues with the optical sensor.
• Unstable power source causing energy pulsing fluctuations.
• Incorrect test setup: not all phases connected to the reference device or the
energy standard. All phases connected to the meter under test should also be
connected to the reference meter/standard.
• Moisture (condensing humidity), debris or pollution present in the meter under
test.
NHA2768503-05 59

Conzerv EM6400NG+ Power and power factor
Power and power factor
Power and power factor
The sampled measurements taken at the meter’s voltage and current inputs
provide data for calculating power and power factor.
In a balanced 3-phase alternating current (AC) power system source, the AC
voltage waveforms on the current-carrying conductors are equal but offset by onethird of a period (a phase angle shift of 120 degrees between the three voltage
waveforms).
Current phase shift from voltage
Electrical current can lag, lead, or be in phase with the AC voltage waveform, and
is typically associated with the type of load — inductive, capacitive or resistive.
For purely resistive loads, the current waveform is in phase with the voltage
waveform. For capacitive loads, current leads voltage. For inductive loads, current
lags voltage.
The following diagrams show how voltage and current waveforms shift based on
load type under ideal (laboratory) conditions.
Current and voltage in phase (resistive) Current leads voltage (capacitive) Current lags voltage (inductive)
Real, reactive and apparent power (PQS)
A typical AC electrical system load has both resistive and reactive (inductive or
capacitive) components.
Real power, also known as active power (P) is consumed by resistive loads.
Reactive power (Q) is either consumed by inductive loads or generated by
capacitive loads.
Apparent power (S) is the capacity of your measured power system to provide real
and reactive power.
The units for power are watts (W or kW) for real power P, vars (VAR or kVAR) for
reactive power Q, and volt-amps (VA or kVA) for apparent power S.
60 NHA2768503-05

Power and power factor Conzerv EM6400NG+
+Q
(+kVAR, +kVARh)
-P
(-kW, -kWh)
-Q
(-kVAR, -kVARh)
+P
(+kW, +kWh)
Active power (W)
Exported/received
Apparent power (VA)
Reactive power (VAR)
Imported/delivered
Quadrant 3
PF lagging
Power factor sign convention:
IEEE = −
IEC = −
Quadrant 4
PF leading
Power factor sign convention:
IEEE = +
IEC = +
Quadrant 1
PF lagging
Power factor sign convention:
IEEE = −
IEC = +
Quadrant 2
PF leading
Power factor sign convention:
IEEE = +
IEC = −
90°
0°
180°
270°
Apparent power (VA)
Reactive power (VAR)
Imported/delivered
Active power (W)
Exported/received
Reactive power (VAR)
Exported/received
Apparent power (VA)
Apparent power (VA)
Active power (W)
Imported/delivered
Active power (W)
Imported/delivered
Reactive power (VAR)
Exported/received
PF
P
S
=
—
Power flow
Positive real power P(+) flows from the power source to the load. Negative real
power P(-) flows from the load to the power source.
Power factor (PF)
Power factor (PF) is the ratio of real power (P) to apparent power (S).
PF is provided as a number between -1 and 1 or as a percentage from -100% to
100%, where the sign is determined by the convention.
A purely resistive load has no reactive components, so its power factor is 1 (PF =
True PF and displacement PF
Power factor sign convention
1, or unity power factor). Inductive or capacitive loads introduce a reactive power
(Q) component to the circuit which causes the PF to become closer to zero.
The meter supports true power factor and displacement power factor values:
• True power factor includes harmonic content.
• Displacement power factor only considers the fundamental frequency.
NOTE: Unless specified, the power factor displayed by the meter is true power
factor.
Power factor sign (PF sign) can be positive or negative, and is defined by the
conventions used by the IEEE or IEC standards.
NHA2768503-05 61
You can set the power factor sign (PF sign) convention that is used on the display
to either IEC or IEEE.

Conzerv EM6400NG+ Power and power factor
PF sign convention: IEC
PF sign correlates with the direction of real power (kW) flow.
• Quadrant 1 and 4: Positive real power (+kW), the PF sign is positive (+).
• Quadrant 2 and 3: Negative real power (-kW), the PF sign is negative (-).
PF sign convention: IEEE
PF sign is correlates with the PF lead/lag convention, in other words, the effective
load type (inductive or capacitive):
• For a capacitive load (PF leading, quadrant 2 and 4), the PF sign is positive
(+).
• For an inductive load (PF lagging, quadrant 1 and 3), the PF sign is negative
(-).
PF value display
First digit of PF value indicates the Lag and Lead.
Lag is indicated by “i” and Lead is indicated by “c” for first digit of PF value.
NOTE: “i” = Inductive load/Lag PF and “c” = capacitive load/Lead PF.
NOTE: Without the load, the PF value is displayed as “- - - -”
Sample screen
Power factor min/max convention
The meter uses a specific convention for determining the power factor minimum
and maximum values.
• For negative PF readings, the minimum PF value is the measurement closest
to -0 for PF readings between -0 to -1. For positive PF readings, the minimum
PF value is the measurement closest to +1 for PF readings between +1 to +0.
62 NHA2768503-05

Power and power factor Conzerv EM6400NG+
1.0
-0.4
.4
.6
.8
-0.6
-0.8
+0
.2
-0
-0.2
-1.0
• For negative PF readings, the maximum PF value is the measurement
closest to -1 for PF readings between -0 to -1. For positive PF readings, the
maximum PF value is the measurement closest to +0 for PF readings
between +1 to +0.
Power factor register format
The meter performs a simple algorithm to the PF value then stores it in the PF
register.
Each power factor value (PF value) occupies one floating point register for power
factor (PF register). The meter and software interpret the PF register for all
reporting or data entry fields according to the following diagram:
NHA2768503-05 63

Conzerv EM6400NG+ Power and power factor
Quadrant 3
0 to -1 -1 to 0 0 to +1 +1 to 0
0
-1 0
+1
0
-2
-1 0
+1
+2
0
-1
0
+1
5.0+5.0-
+0.5-0.5
-2 to -1 -1 to 0
0 to +1
+1 to +2
-2 +2
-1
0 0
+1
-0.5
+0.5
+1.5-1.5
Quadrant 2 Quadrant 1 Quadrant 4
Quadrant 2 Quadrant 1
Quadrant 3 Quadrant 4
Quadrant 2
-1 ≤ PF ≤ 0
Quadrant 1
0 ≤ PF ≤ 1
Quadrant 3
-1 ≤ PF ≤ 0
Quadrant 4
0 ≤ PF ≤ 1
-2 ≤ PF register ≤ -1 2 ≤ PF register ≤ 1
-1 ≤ PF register ≤ 0
0 ≤ PF register ≤ 1
PF register
PF Value
The PF value is calculated from the PF register value using the following formulae:
64 NHA2768503-05
Quadrant PF range PF register range PF formula
Quadrant 1 0 to +1 0 to +1 PF value = PF register
value
Quadrant 2 -1 to 0 -1 to 0 PF value = PF register
value
Quadrant 3 0 to -1 -2 to -1 PF value = (-2) - (PF
register value)
Quadrant 4 +1 to 0 +1 to +2 PF value = (+2) - (PF
register value)

Specifications Conzerv EM6400NG+
Specifications
The specifications contained in this section are subject to change without notice.
For installation and wiring information, refer to the meter installation sheet.
Mechanical characteristics
IP degree of protection (IEC 60529-1) Front display: IP51
Front display: Upgrade to IP54 with optional accessory kit METSEIP54GK96X96FF
Front display: Upgrade to IP65 with optional accessory kit METSEIP65OP96X96FF
Meter body: IP30 (except terminals)
Panel thickness maximum 6.0 mm (0.25 in) maximum
Mounting position Vertical
Display type LED display - 7 Segment
Keypad 3 button
Front panel LED indicators Green LED (heartbeat / serial communications activity)
Red LED (energy pulse output)
Weight ~ 600 gms
Dimensions W x H x D 96 x 96 x 73 mm max
Electrical characteristics
Measurement accuracy
Current, Phase ± 0.5% for Class 1 and Class 0.5S
Voltage L-N, L-L ± 0.5% for Class 1
Power Factor ± 0.01 for Class 1 and Class 0.5S
Power Active power: ± 1% for Class 1 and Class 0.5S
Reactive power: ± 1% for Class 1 and Class 0.5S
Frequency ± 0.05% for Class 1 and Class 0.5S
Active Energy Active Energy
Class 0.5S
Class 0.2
Reactive Energy Class 1 as per IEC 62053-24 for 5 A nominal CT
THD and Individual Harmonic
V & A
Class 5.0 as per IEC 61557-12 for THD and individual harmonics values up to 15
5
2
and Class 0.5S
3
Class 1 as per IEC 62053-21
4
as per 62053-22
th
harmonics
Voltage inputs
VT primary 999 kV L-L max, starting voltage depends on VT ratio
V nominal UL: 20 - 277 V L-N / 35 - 480 V L-L
IEC: 20 - 347 V L-N / 35 - 600 V L-L
2. Class 1 accuracy is 0.8% with system voltage ≤ 120 V
3. For 1 A nominal CT, when I > 0.150 A. For 1 A nominal CT, when I > 0.500 A under temperature influence
4. For 1ph 2W, when system voltage is ≥ 110 V L-N
5. For 2ph 3W and 3ph 3W, when system voltage is ≥110 V L-L. Not applicable for 1ph 2W configuration
NHA2768503-05 65

Conzerv EM6400NG+ Specifications
Voltage inputs (Continued)
Measured V with full range 35 to 600 V AC L-L
Permanent overload 750 V AC L-L
Impedance ≥ 5 MΩ
Frequency 50 / 60 Hz nominal ± 5%
VA burden < 0.2 VA at 240 V AC L-N
Current inputs
CT ratings Primary adjustable 1 A to 32767 A
Secondary 1 A or 5 A I-nominal
Measured Amps with over range &
Crest Factor
Suppression current (to disregard
negligible load)
Withstand Continuous 12 A; 50 A at 10 sec/hr, 500 A at 1 sec/hr
Impedance < 0.3 MΩ
Frequency 50 / 60 Hz nominal
VA Burden < 0.1 VA at 6 A
Starting current: 5 mA
Operating range: 50 mA to 8.5 A
5 mA to 99 mA
AC control power
Operating range 44 - 277 V AC ± 10%
Burden < 6 VA at 277 V L-N
Frequency range 45 - 65 Hz
Ride-through time 80 ms at 120 V AC
100 ms at 230 V AC
100 ms at 277 V AC
DC control power
Operating range 44 - 277 V DC ± 10%
Burden < 2 W at 277 V DC
Ride-through time 50 ms at 125 V DC
Displays update
Instantaneous 1 s
Demand 15 s
Harmonics 5 s
66 NHA2768503-05

Specifications Conzerv EM6400NG+
Wiring configuration
User programmable Configuration through both HMI and ION setup Configuration through only ION setup
1ph 2W, L-N
1ph 2W, L-L
1ph 3W, L-L with N (2 phase)
3ph 3W, Delta, Ungrounded
3ph 4W, Wye Grounded
Environmental characteristics
Operating temperature -10 °C to +60 °C (14 °F to 140 °F)
Storage temperature -25 °C to +70 °C (-13 °F to 158 °F)
Humidity rating 5% to 95% RH at 50 °C (122 °F) (non-condensing)
Pollution degree 2
Altitude ≤ 2000 m (6562 ft)
Location Not suitable for wet locations
Product life
> 7 years
3ph 3W, Delta, Corner Grounded
3ph 3W, Wye, Ungrounded
3ph 3W, Wye Grounded
3ph 3W, Wye, Resistance Grounded
3ph 4W, Open Delta, Center-Tapped
3ph 4W, Delta, Center-Tapped
3ph 4W, Wye, Ungrounded
3ph 4W, Wye, Resistance Grounded
EMC (Electromagnetic Compatibility)
Electrostatic discharge IEC 61000-4-2
Immunity to radiated field IEC 61000-4-3
Immunity to fast transients IEC 61000-4-4
Immunity to impulse waves IEC 61000-4-5
Conducted immunity IEC 61000-4-6
Immunity to magnetic field IEC 61000-4-8
Immunity to voltage dips IEC 61000-4-11
Emissions (IEC61326-1) Emissions FCC Part 15 Class A/CE
+1
Tested as per IEC 61326-1 standard for Emission
+1
Safety
Europe CE, as per IEC 61010-1 Ed-3 and IEC 61326–1
US and Canada cULus per UL 61010-1
CAN / CSA-C22.2 No. 61010-1, for 600 V AC
Measurement category (Voltage and
Current inputs)
CAT III up to 480 V L-L
CAT II up to 600 V L-L
Overvoltage category (Control power) CAT III up to 300 V L-N
Dielectric As per IEC / UL 61010-1 Ed-3
NHA2768503-05 67

Conzerv EM6400NG+ Specifications
Protective Class II, Double insulated for user accessible parts
Other certification RCM
Communications
RS485 port 2-Wire, 4800, 9600,19200 or 38400 baud
Parity - Even, Odd, None
Firmware update available through communication port using DLF3000 software.
Pulse Output (POP) Max 40 V DC, 20 mA
20 ms ON time
Configurable pulse weight from 1 to 9999000 (pulse/ k_h)
Isolation 2.5 kV RMS, double insulated
Protection features Password protected for set-up parameters
Display language English
Real-time clock
Battery backup time 3 years
NOTE: When date and time is configured, and meter is in off state.
68 NHA2768503-05


Schneider Electric India Pvt. Ltd.
12A, Attibele Industrial Area, Hosur Main Road, Neralur (PO)
Bangalore 562107
India
1800 419 4272, 1800 103 0011
www.se.com
As standards, specifications, and design change from time to time,
please ask for confirmation of the information given in this publication.
© 2021 – Schneider Electric. All rights reserved.
NHA2768503-05
 Loading...