

Page 1
ACTIVEVIEW USER GUIDE
PUBLICATION HSACTV-UM024A-EN-E–June 2012
Supersedes Publication HSACTV-UM023A-EN-E
Page 2

●
●
●
●
●
Copyright
Contact Rockwell Automation
Customer Support Telephone — 1.440.646.3434
Online Support — http://www.rockwellautomation.com/support
Copyright Notice
© 2012 Rockwell Automation Technologies, Inc. All rights reserved. Printed in USA.
© 2010 OSIsoft, Inc. All rights reserved.
This document and any accompanying Rockwell Software products are copyrighted by Rockwell Automation Technologies, Inc. Any reproduction and/or distribution
without prior written consent from Rockwell Automation Technologies, Inc. is strictly prohibited. Please refer to the license agreement for details.
Trademark Notices
FactoryTalk, Rockwell Automation, Rockwell Software, the Rockwell Software logo are registered trademarks of Rockwell Automation, Inc.
The following logos and products are trademarks of Rockwell Automation, Inc.:
FactoryTalk Historian Site Edition (SE), FactoryTalk Historian Machine Edition (ME), RSView, FactoryTalk View, RSView Studio, FactoryTalk ViewStudio, RSView
Machine Edition, RSView ME Station, RSLinx Enterprise, FactoryTalk Services Platform, FactoryTalk Live Data, and FactoryTalk VantagePoint.
The following logos and products are trademarks of OSIsoft, Inc.:
PI System, Sequencia, Sigmafine, gRecipe, sRecipe, and RLINK.
Other Trademarks
ActiveX, Microsoft, Microsoft Access, SQL Server, Visual Basic, Visual C++, Visual SourceSafe, Windows, Windows ME, Windows NT, Windows 2000, Windows Server
2003, and Windows XP are either registered trademarks or trademarks of Microsoft Corporation in the United States and/or other countries.
Adobe, Acrobat, and Reader are either registered trademarks or trademarks of Adobe Systems Incorporated in the United States and/or other countries.
ControlNet is a registered trademark of ControlNet International.
DeviceNet is a trademark of the Open DeviceNet Vendor Association, Inc. (ODVA).
Ethernet is a registered trademark of Digital Equipment Corporation, Intel, and Xerox Corporation.
OLE for Process Control (OPC) is a registered trademark of the OPC Foundation.
Oracle, SQL*Net, and SQL*Plus are registered trademarks of Oracle Corporation.
All other trademarks are the property of their respective holders and are hereby acknowledged.
Restricted Rights Legend
Use, duplication, or disclosure by the Government is subject to restrictions as set forth in subparagraph (c)(1)(ii) of the Rights in Technical Data and Computer Software
clause at DFARS 252.227-7013.
Warranty
This product is warranted in accordance with the product license. The product’s performance may be affected by system configuration, the application being performed,
operator control, maintenance, and other related factors. Rockwell Automation is not responsible for these intervening factors. The instructions in this document do not cover
all the details or variations in the equipment, procedure, or process described, nor do they provide directions for meeting every possible contingency during installation,
operation, or maintenance.
This product’s implementation may vary among users.
This document is current as of the time of release of the product; however, the accompanying software may have changed since the release. Rockwell Automation, Inc.
reserves the right to change any information contained in this document or the software at anytime without prior notice. It is your responsibility to obtain the most current
information available from Rockwell when installing or using this product.
ii
Page 3

Contents
Introduction ............................................................ 1
FactoryTalk Historian ActiveView Product Contents ....................... 2
For End Users: Viewing FactoryTalk Historian Data with
FactoryTalk Historian ActiveView .................................. 5
Content of a Display Document ................................................ 6
Updates to Data in a Display ................................................... 8
Interact with the Display Document .......................................... 9
Expand a Trend ............................................................... 9
Trend Cursors ................................................................ 10
Configure Trend Scale ...................................................... 10
View Layers................................................................... 12
Show or Hide Traces ........................................................ 13
View a Status Report ....................................................... 15
XYPlot Statistics ............................................................. 16
Time and Time Ranges ..................................................... 20
Time Range Formats .................................................... 20
FactoryTalk Historian Time .................................................... 21
iii
Page 4

●
●
●
●
●
FactoryTalk Historian ActiveView User Guide
FactoryTalk Historian Time Abbreviations .......................... 21
FactoryTalk Historian Time Expressions ............................. 22
FactoryTalk Historian Time String Examples ....................... 23
Change Time Range ..................................................... 24
Trends with Future Time Ranges ..................................... 26
Change Time Zone ...................................................... 26
The FactoryTalk Historian ActiveView Toolbar ........................ 27
Trend Interactions .......................................................... 28
Trend Zoom 2x In or Out ............................................... 28
Back and Forward Trend Buttons ..................................... 29
Browser Interactions ........................................................ 29
Back and Forward Browser Buttons .................................. 29
Refresh Button ........................................................... 30
For Developers: Administering FactoryTalk Historian
ActiveView ............................................................. 31
Flow of Information ............................................................. 31
FactoryTalk Historian ActiveView Executable ............................. 33
Expiration of Displays .......................................................... 34
FactoryTalk Historian ActiveView Setup .................................... 35
The Developer's Role ....................................................... 35
Developer's Kit ............................................................... 36
Security ....................................................................... 37
DEP Security .............................................................. 37
FactoryTalk Historian Security ........................................ 38
ActiveX Controls and FactoryTalk Historian ProcessBook Add-ins ...... 39
Create Display Documents ..................................................... 39
iv
Page 5

● Contents
●
●
●
●
●
FactoryTalk Historian BatchView and Historian SQC Chart .......... 40
VBA Programming ........................................................... 40
Size the ActiveView Control and the Display Document ............. 40
Guidelines for Building Displays .......................................... 41
Export Displays from FactoryTalk Historian ProcessBook ............ 42
How the Export Utility Works ......................................... 43
Create Links Between Displays or Applications ........................ 44
When End-Users See Updates ............................................. 45
Work with Element Relative Displays ........................................ 45
Configuration .................................................................... 45
Migrate Displays to Another Historian Server .......................... 48
Develop Web Pages ............................................................. 49
Display Sizing................................................................. 50
Add a Component with an .inf File ....................................... 50
Embed a Display into an HTML Page ..................................... 51
Embed ProcessBook Displays in Other Containers ......................... 56
Embed a Display in a Spreadsheet ....................................... 57
Automation ....................................................................... 59
v
Page 6

●
●
●
●
●
FactoryTalk Historian ActiveView User Guide
ActiveView Control.......................................................... 59
ActiveView Control Methods: AboutBox ................................. 60
ActiveView Control Properties ............................................ 60
BuildDateStamp Property .............................................. 60
Display Property ......................................................... 61
DisplayURL Property .................................................... 62
DisplayURLIsValid Property ............................................ 66
ReadyState Property .................................................... 66
ServerIniURL Property .................................................. 66
ServerIniURLIsValid Property .......................................... 68
ActiveView Control Events ................................................. 69
BeforeConnection Event ............................................... 69
BCParam .................................................................. 70
ConnectionFailed Event ................................................ 71
CFParam .................................................................. 72
FailedDisplayURL Event ................................................ 73
FailedServerIniURL Event .............................................. 75
ReadyStateChange Event .............................................. 75
Troubleshooting ...................................................... 77
Browser Security Settings ...................................................... 77
Displays and Connection Failure .............................................. 77
Revisions to a Display Do not Appear ........................................ 78
Using ActiveView with Windows 2003 ....................................... 79
vi
Installation ............................................................. 81
System Requirements........................................................... 81
Install FactoryTalk Historian ActiveView .................................... 82
Developer Installation ...................................................... 82
User Installation ............................................................. 83
Uninstall FactoryTalk Historian ActiveView ................................ 84
Page 7

● Contents
●
●
●
●
●
Uninstalling FactoryTalk Historian ActiveView Using the Start
Menu ....................................................................... 84
Uninstalling FactoryTalk Historian ActiveView Using Control
Panel....................................................................... 85
Uninstalling FactoryTalk Historian ActiveView Using the
Distribution Kit .......................................................... 85
Technical Support and Resources ................................. 87
Technical Support ............................................................... 87
Knowledgebase .............................................................. 87
Worldwide Support .......................................................... 88
Training Programs ........................................................... 88
Consulting Services ......................................................... 88
TechConnect Support ....................................................... 88
Find the Version and Build Numbers ..................................... 89
View Computer Platform Information ................................... 90
Index .................................................................... 91
vii
Page 8

●
●
●
●
●
FactoryTalk Historian ActiveView User Guide
viii
Page 9

Chapter 1
Introduction
FactoryTalk Historian ActiveView is a tool for viewing live and historical
data from a variety of data sources. It presents displays of live data from
the Historian Server as well as information from ODBC sources via ADO
(ActiveData Objects) or VBA (Visual Basic for Applications). Using
Microsoft Internet Explorer you can view these displays with FactoryTalk
Historian ActiveView on the Internet or within a corporate intranet. You
can insert FactoryTalk Historian ActiveView displays as ActiveX controls
in existing Microsoft Excel spreadsheets or other reporting tools used in
your environment.
The live data displays, called Display Documents, are prepared from
displays built in FactoryTalk Historian ProcessBook.
1
Page 10
●
●
●
●
●
FactoryTalk Historian ActiveView User Guide
File that determines what PI data is viewed and the format in which it is
presented.
When you open a Display Document in Internet Explorer, the display
automatically updates with new data from the FactoryTalk Historian
server. Dynamic symbols - such as trends, bars, or values - update just as
they would in FactoryTalk Historian ProcessBook. Certain VBA scripting
in a display is also available in FactoryTalk Historian ActiveView.
FactoryTalk Historian ActiveView Product Contents
FactoryTalk Historian ActiveView includes the following components:
2
Page 11

1 ● Introduction
●
●
●
●
●
Developer's Kit (page 36).
FactoryTalk Historian ActiveView software for end users: includes
Historian SQC, FactoryTalk Historian BatchView, VBA, and ADO
components
FactoryTalk Historian ActiveView ActiveX control: a control with a
simple set of properties that allows viewing of the Display Document
FactoryTalk Historian ActiveView Executable: a set of files installed
on the client computer that provide data updates and VBA execution
services
Documentation:
Comprehensive FactoryTalk Historian ActiveView Online Help in
.chm file format, available from Start > All Programs > Rockwell
Software > FactoryTalk Historian SE > Help.
Comprehensive FactoryTalk Historian ActiveView User Guide in
PDF format. The User Guide PDF is located on the CD but not
installed by setup.exe. You can also download it from the
Rockwell Automation Technical Support Web site
(http://support.rockwellautomation.com/).
3
Page 12

●
●
●
●
●
FactoryTalk Historian ActiveView User Guide
4
Page 13

Chapter 2
For End Users: Viewing FactoryTalk Historian Data with FactoryTalk Historian ActiveView
FactoryTalk Historian ActiveView allows you to browse displays of live
data from the Historian Server on the Internet or on a corporate intranet or
from within a hosting application.
When you view a Display Document in Internet Explorer, for example, the
display automatically updates every few seconds with new data that
reaches the Historian Server. Dynamic symbols such as trends, bars, or
values update just as they would in FactoryTalk Historian ProcessBook.
You can obtain specific data values from a trend, change the size of a
trend, or adjust the time period being displayed in a trend.
The steps involved in viewing a Display Document on a Web page with
FactoryTalk Historian ActiveView are:
1. Browse to an Internet or corporate intranet Web page that refers to a
Display Document. The Web page downloads to your PC unless it is
already cached there.
2. The browser loads the FactoryTalk Historian ActiveView Control,
which starts the FactoryTalk Historian ActiveView executable in the
background. FactoryTalk Historian ActiveView presents the Display
Document on the HTML Web page on your screen.
If you need a password to connect to the Historian Server, a dialog box
for logging on appears at this point.
5
Page 14
●
●
●
●
●
FactoryTalk Historian ActiveView User Guide
3. FactoryTalk Historian ActiveView (acview.exe) gets the appropriate
data from the Historian Server and loads the data into the Display
Document. This data continues to update as new data becomes
available on the Historian Server.
For more details, see Flow of Information (page 31).
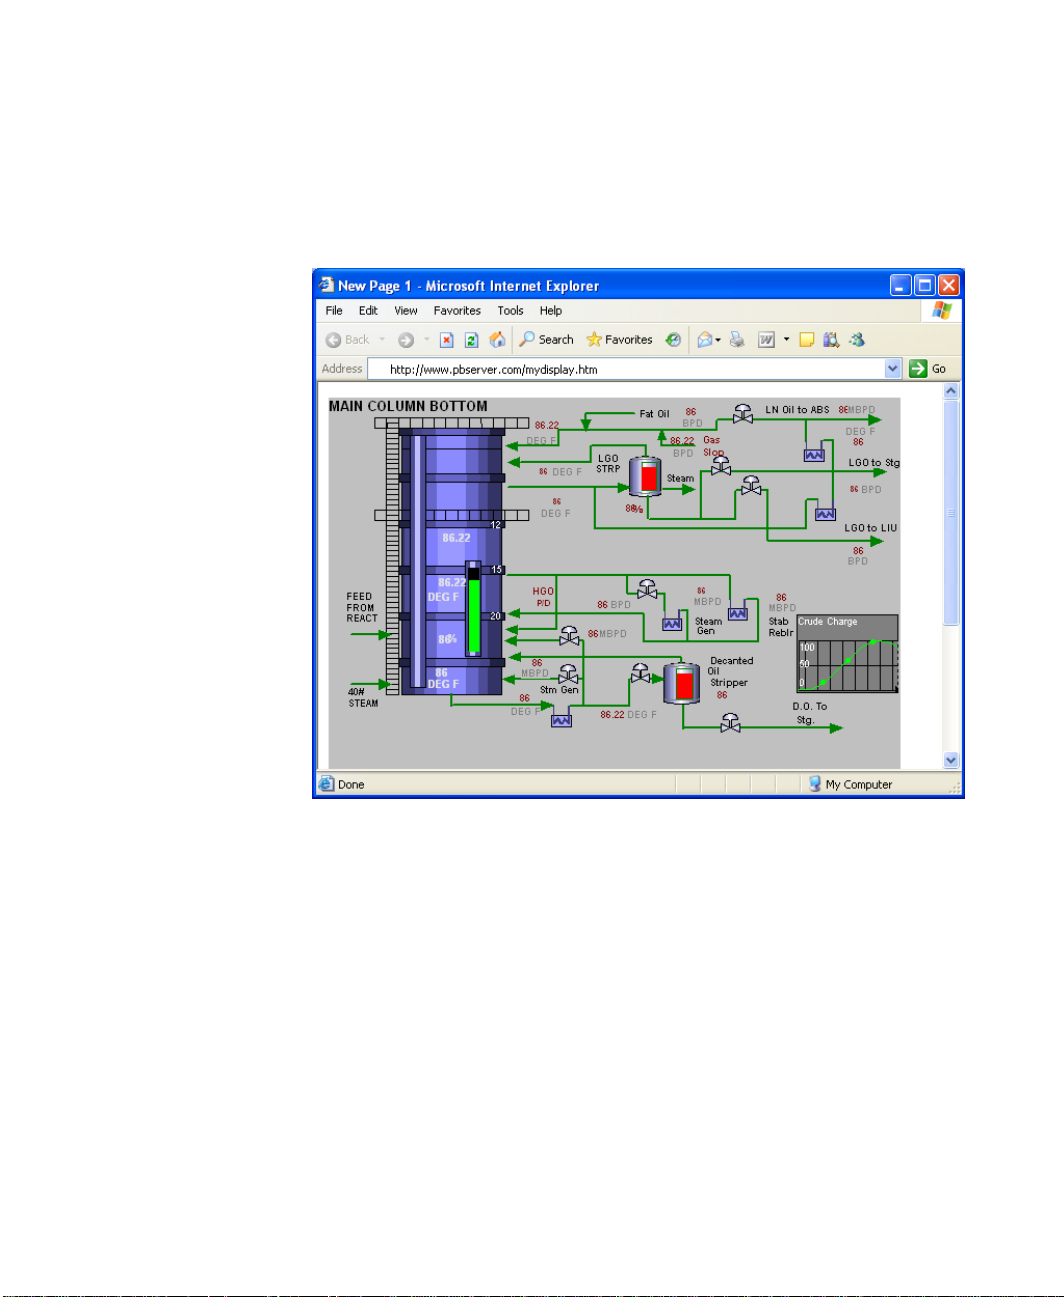
Content of a Display Document
A Display Document viewed through FactoryTalk Historian ActiveView
can contain both static and dynamic content. Static content may include
bitmaps, schematics, or text. Dynamic symbols include values, bars, XY
plots, and trends that are updated when the data in the Historian Server
changes. A display developer can also include symbols that change colors
as certain values are reached.
6
Page 15

2 ● For End Users: Viewing FactoryTalk Historian Data with FactoryTalk Historian ActiveView
●
●
●
●
●
Trends are plots of point data over time. A Value is a numeric value for a
particular point in the Historian Server. A value may or may not include a
tag (point name) and a time stamp. Bars are used to show values
graphically as a percentage of a rectangle.
7
Page 16
●
●
●
●
●
FactoryTalk Historian ActiveView User Guide
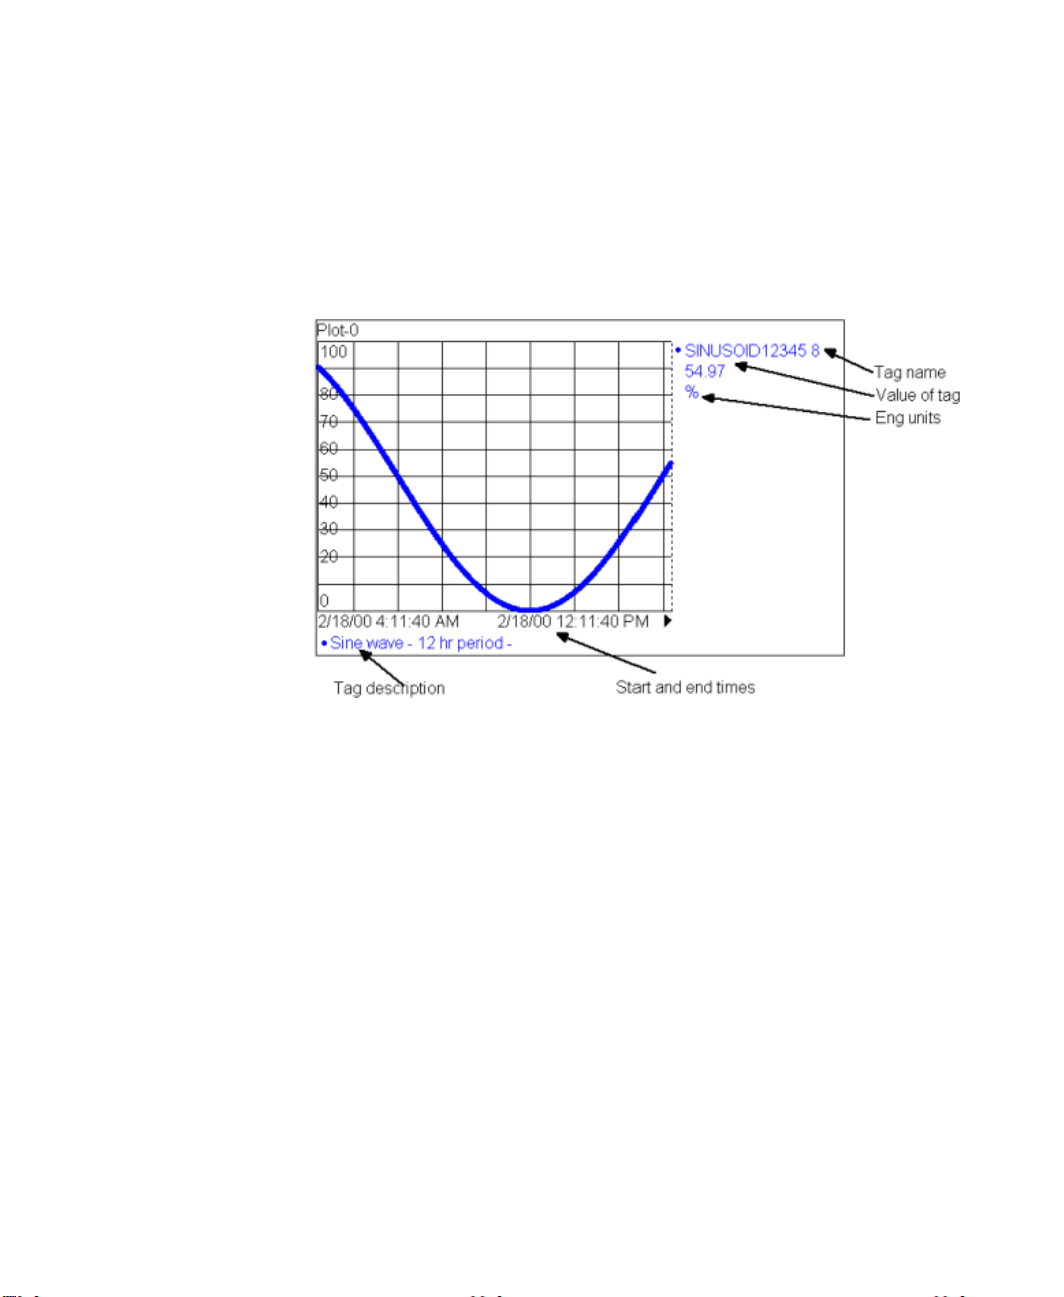
Each trend has at least one plot. The various plots and their labels may be
displayed in matching colors. If the trend extends to the current time, a
dotted line represents the current time. Labels may include the point name,
description, value, and engineering units.
Updates to Data in a Display
Every few seconds, FactoryTalk Historian ActiveView updates the open
displays with all the new values for tags. The trends, bars, other symbols,
and values from FactoryTalk Historian calculations in each Display update
to reflect the new information.
The FactoryTalk Historian ActiveView developer can alter this update scan
rate.
8
Page 17

2 ● For End Users: Viewing FactoryTalk Historian Data with FactoryTalk Historian ActiveView
●
●
●
●
●
Interact with the Display Document
The user interface is similar to that of a FactoryTalk Historian
ProcessBook Display in view-only mode. You can interact with dynamic
symbols in a Display Document in several ways:
Expand a trend (page 9).
Use trend cursors (page 10) to see values.
Change the time range (page 24) forward or back.
Change the time zone (page 26) shown to Client or Server time.
For a display with layers, choose which layers to show and hide (page
12).
View the status of displays (page 15).
Use the Time Range toolbar (page 27) to modify time range.
Configure the trend scale to switch to another type of value range
(Autorange, Database, Absolute).
If there is a VBA script in the Display Document, you can initiate other
functionality, such as selecting from a list of Display Documents or
switching data points or servers being viewed.
You cannot perform analysis operations that call a dialog box or new
window (such as a Trend Display window or Point Attributes dialog
box). You cannot change the display, save it separately, or resize display
documents. No other menus or toolbars are available.
After you finish viewing a document and close the page, any interactive
features that you used revert to their original configuration.
Expand a Trend
To expand a trend or XY plot to fill the Display Document, double-click it.
To restore the original dimensions, double-click the plot again.
9
Page 18
●
●
●
●
●
FactoryTalk Historian ActiveView User Guide
Trend Cursors
Use trend cursors to determine values at particular points on a trend or XY
plots.
To initiate a cursor, point with the mouse at the value axis of the plot until
the cursor pointer appears and then drag toward the opposite axis. As you
drag the cursor across the plot, the value shown corresponds to the point on
the plot where the cursor is. When you release the mouse button, the line
and value remain on the display. You can drag multiple cursors onto the
plot. When you close the page, the cursors disappear.
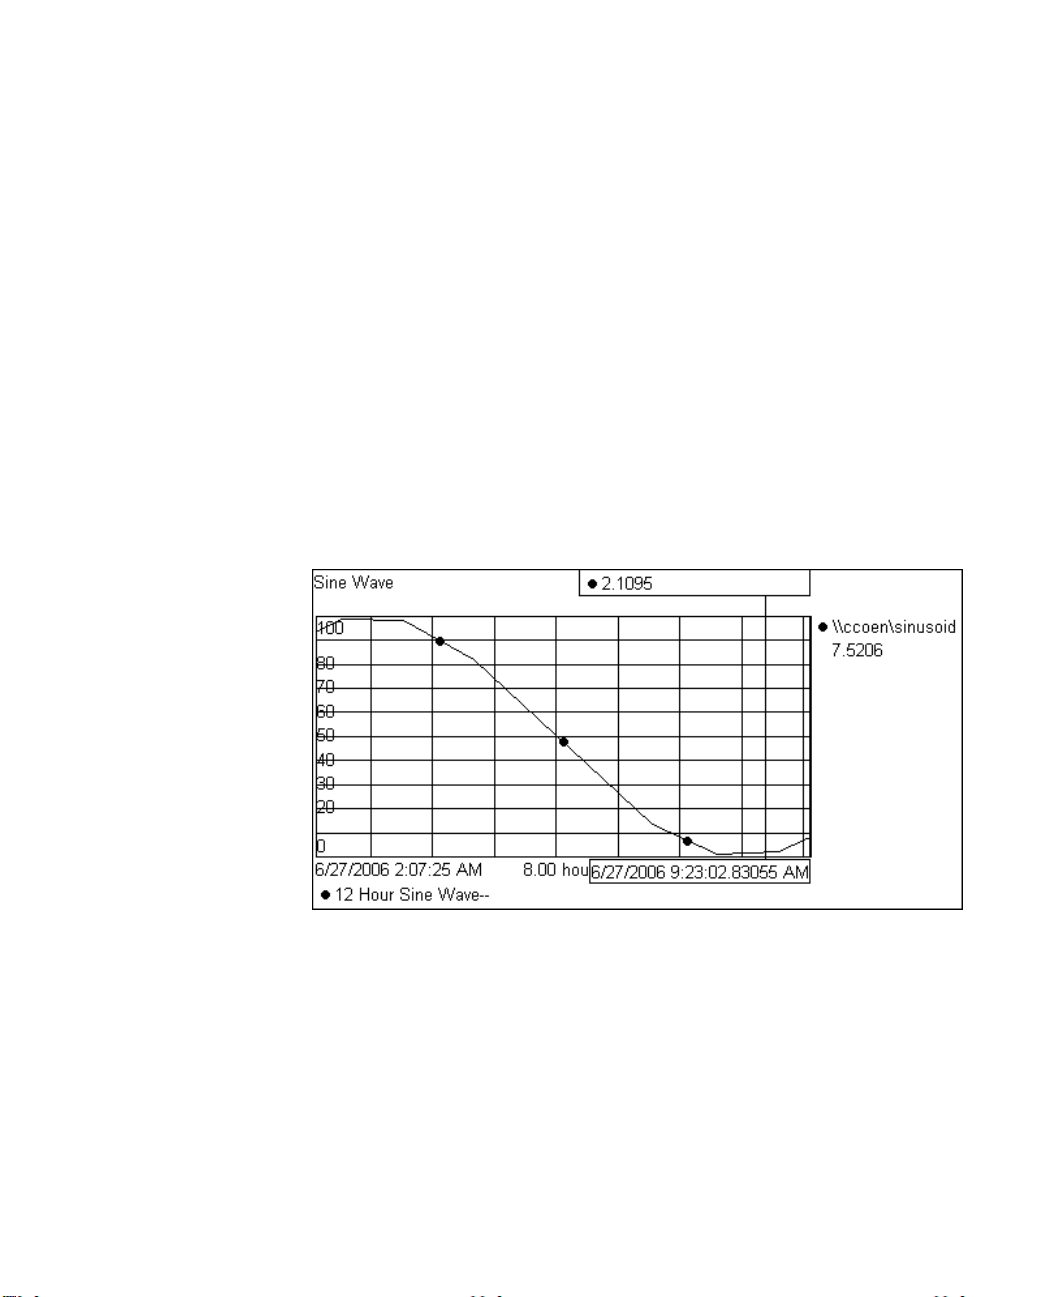
If a plot has multiple traces, the value box shows the value of each trace.
In the following illustration, a trend cursor has a value of 2.1095 and a time
stamp of 6/27/2006 9:23:02.83055 AM.
To remove a trend cursor without closing the page, drag it off the plot.
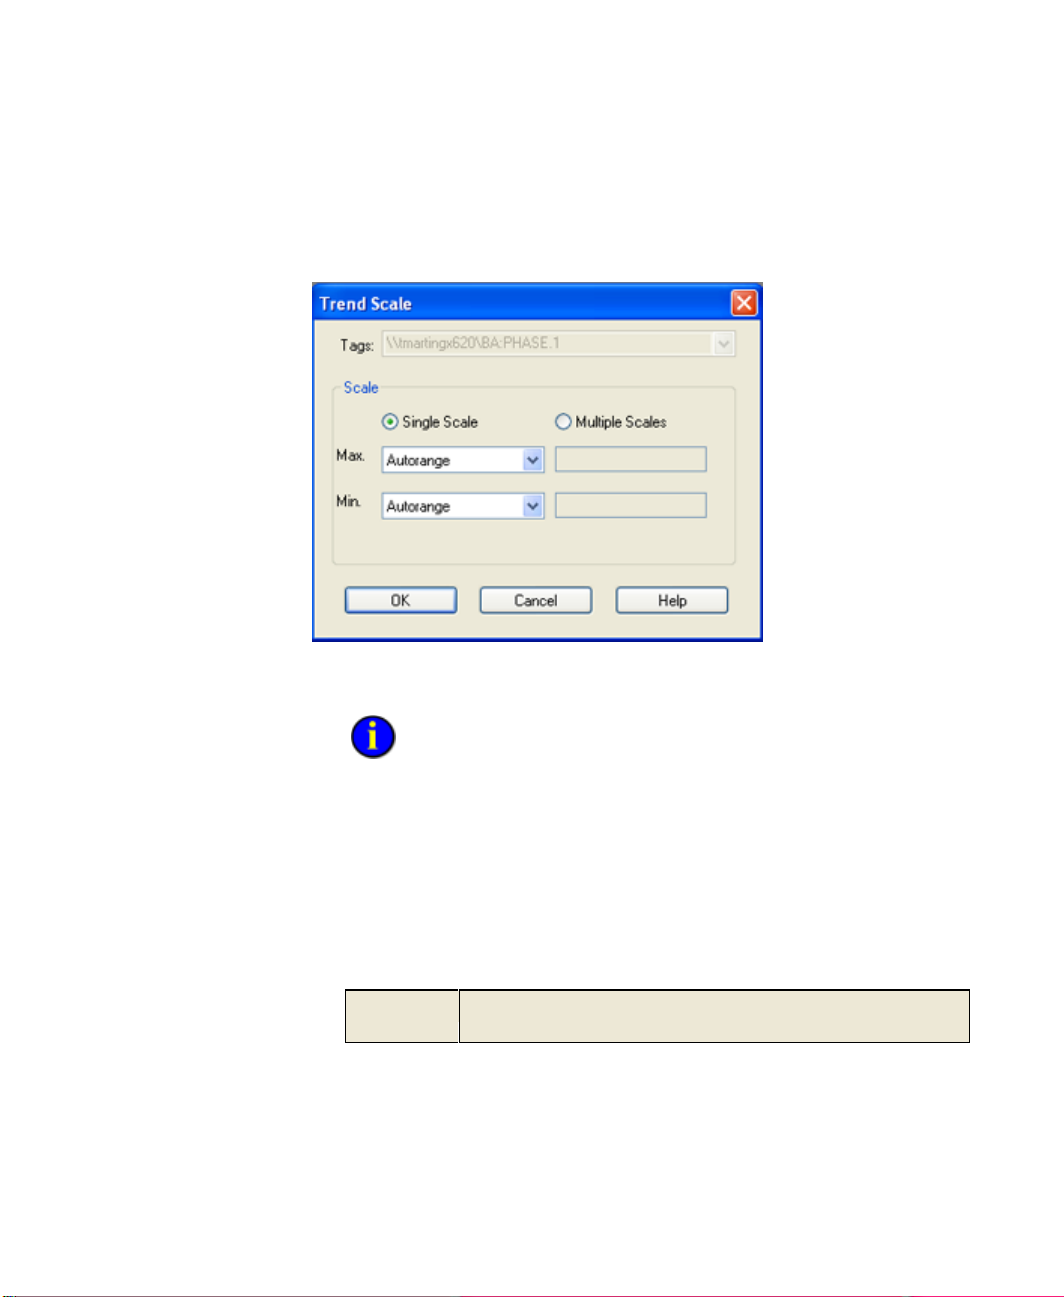
Configure Trend Scale
The Trend Scale dialog box provides easy access to the value scale
settings for each tag in a trend, SQC chart or XYPlot. If the plot uses a data
10
Page 19
2 ● For End Users: Viewing FactoryTalk Historian Data with FactoryTalk Historian ActiveView
●
●
●
●
●
Autorange
Sets the value scale using the minimum and maximum tag values
between the trend start time and end time.
set, only the Autorange and Absolute options are available for the
Maximum and Minimum scale settings.
4. In Run mode, double-click the plot's value scale to open the Trend
Scale dialog box.
In FactoryTalk Historian ProcessBook you can also click View >
Trend Scale. This menu object is not available in FactoryTalk
Historian ActiveView.
5. Select Single Scale or Multiple Scales.
6. If you are using multiple scales, then select the tag for which to set the
scale options from the Tags list.
7. Select Autorange, Database, or Absolute for the Maximum and
Minimum values of the scale.
11
Page 20
●
●
●
●
●
FactoryTalk Historian ActiveView User Guide
Database
Sets the value scale using the tag attribute values in the Point
Database. Zero is the minimum. Zero + Span is the maximum. See
the
Historian Server Reference Guide
for more information on tag
attributes.
Absolute
Allows you to type a custom value for the value scale of a tag. Type
the value in the adjacent box.
8. If you have selected Absolute, type in the Maximum and Minimum
values of the scale in the adjacent boxes.
9. Click OK.
Modifications made to a trend through use of this dialog box do not
affect the stored settings of the trend.
To return the trend scale to its original settings, click Revert on the
context menu.
View Layers
Layers can be created in FactoryTalk Historian ProcessBook displays.
Layers allow you to treat related graphical elements as a group. You can
hide or show a layer at run time. There is an interface for showing and
hiding layers this in both FactoryTalk Historian ProcessBook and
FactoryTalk Historian ActiveView.
12
Page 21
2 ● For End Users: Viewing FactoryTalk Historian Data with FactoryTalk Historian ActiveView
●
●
●
●
●
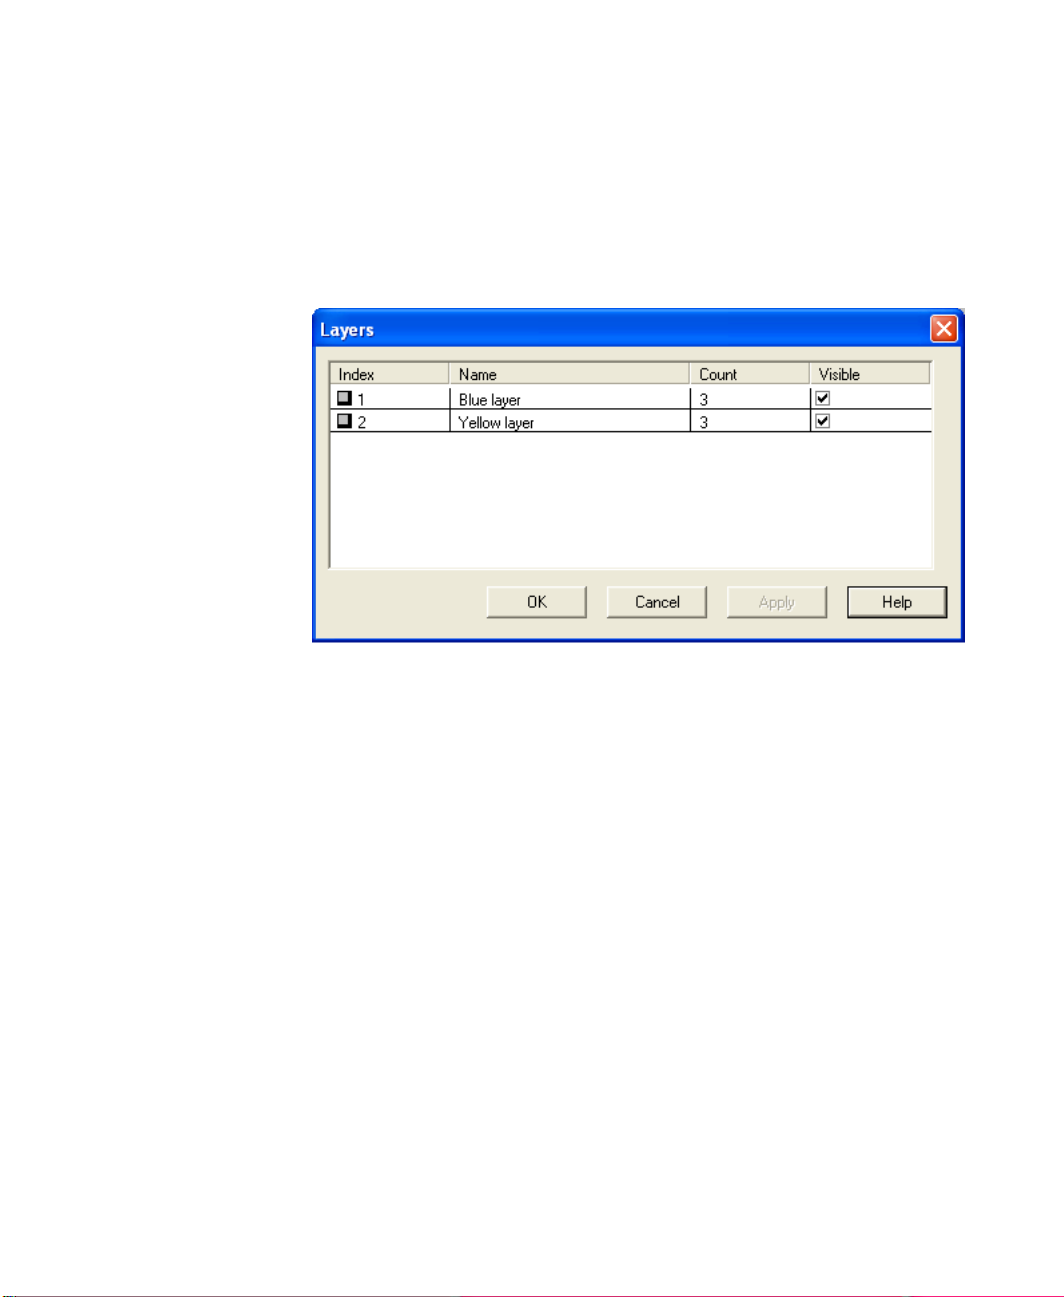
To view or hide layers in a display, right-click the display and choose
Layers In the View dialog box, select Visible for any layer you want to
show, and clear the check box for any layer you want to hide.
The Index column shows the layer's order in the collection. The Count
column shows the number of symbols on the layer.
Show or Hide Traces
Trend traces can be temporarily hidden at Run time so that other data on a
trend is easier to view.
1. Click a legend item to hide or show the associate trace on the plot,
-orIf viewing a trend, right-click a trend symbol.
2. From the Trend symbol submenu, select Trend Traces. A sub-menu
appears allowing you to:
Show All
Hide All
13
Page 22

●
●
●
●
●
FactoryTalk Historian ActiveView User Guide
Show/Hide individual traces
3. Select an option to hide or show the trace on the plot. If the trace has a
regression line configured, the regression line is also hidden. When a
trace is hidden:
14
The trace name is dimmed in the legend and the description,
value, and engineering units are hidden (if they were shown
before).
The space reserved on the legend for the description, value, and
engineering units collapses so that the trace under the hidden trace
is moved. This clearly shows the visible traces on the legend,
especially on a trend with many traces.
On a multi-scale trend, the value scale associated with the hidden
trace is hidden.
Page 23
2 ● For End Users: Viewing FactoryTalk Historian Data with FactoryTalk Historian ActiveView
●
●
●
●
●
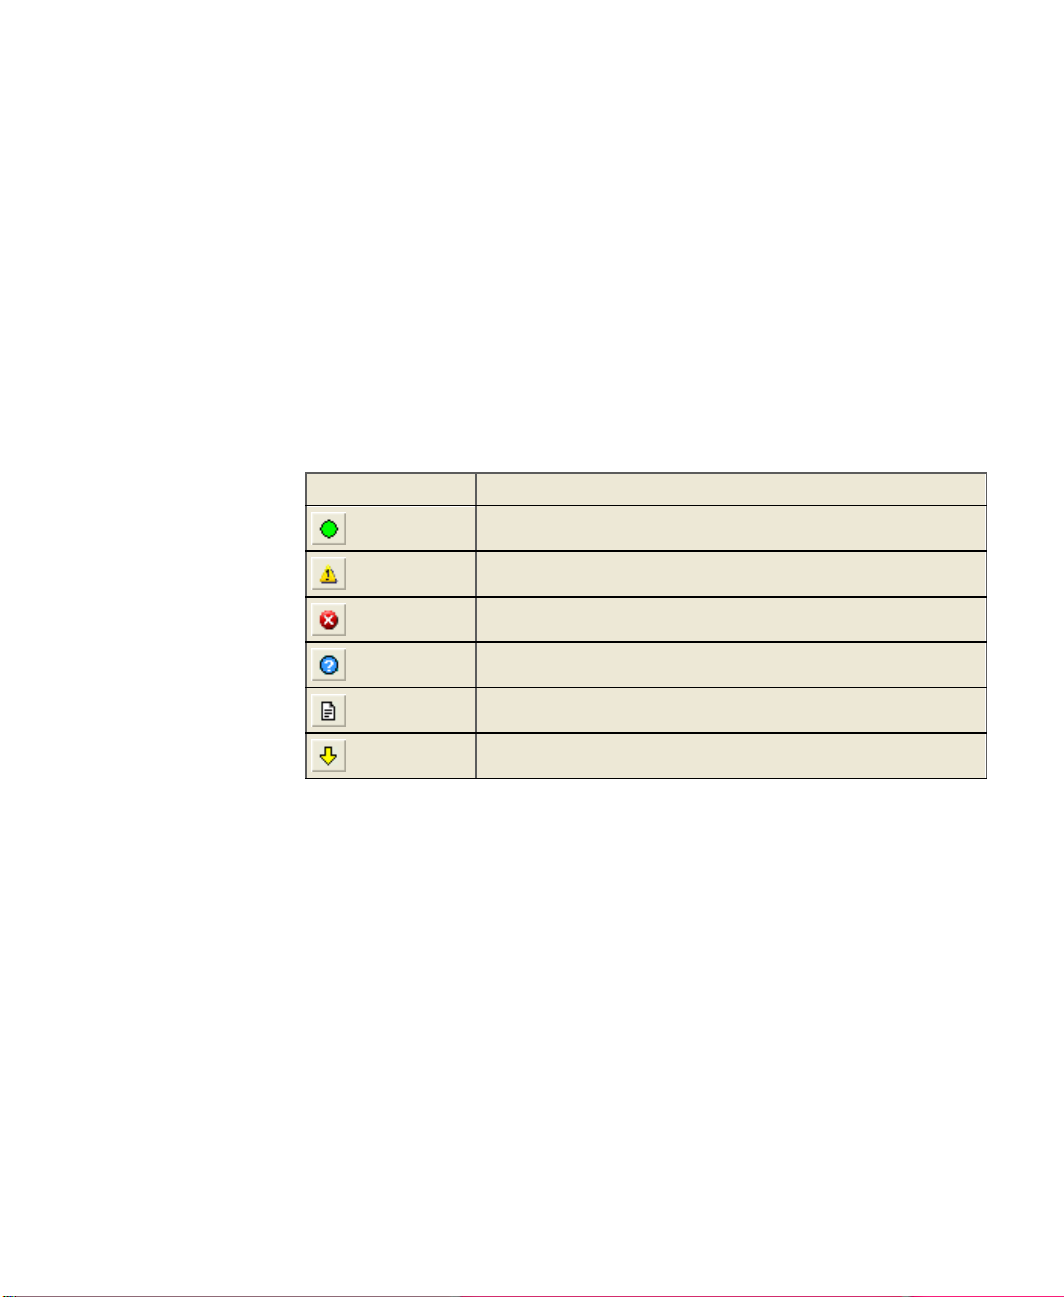
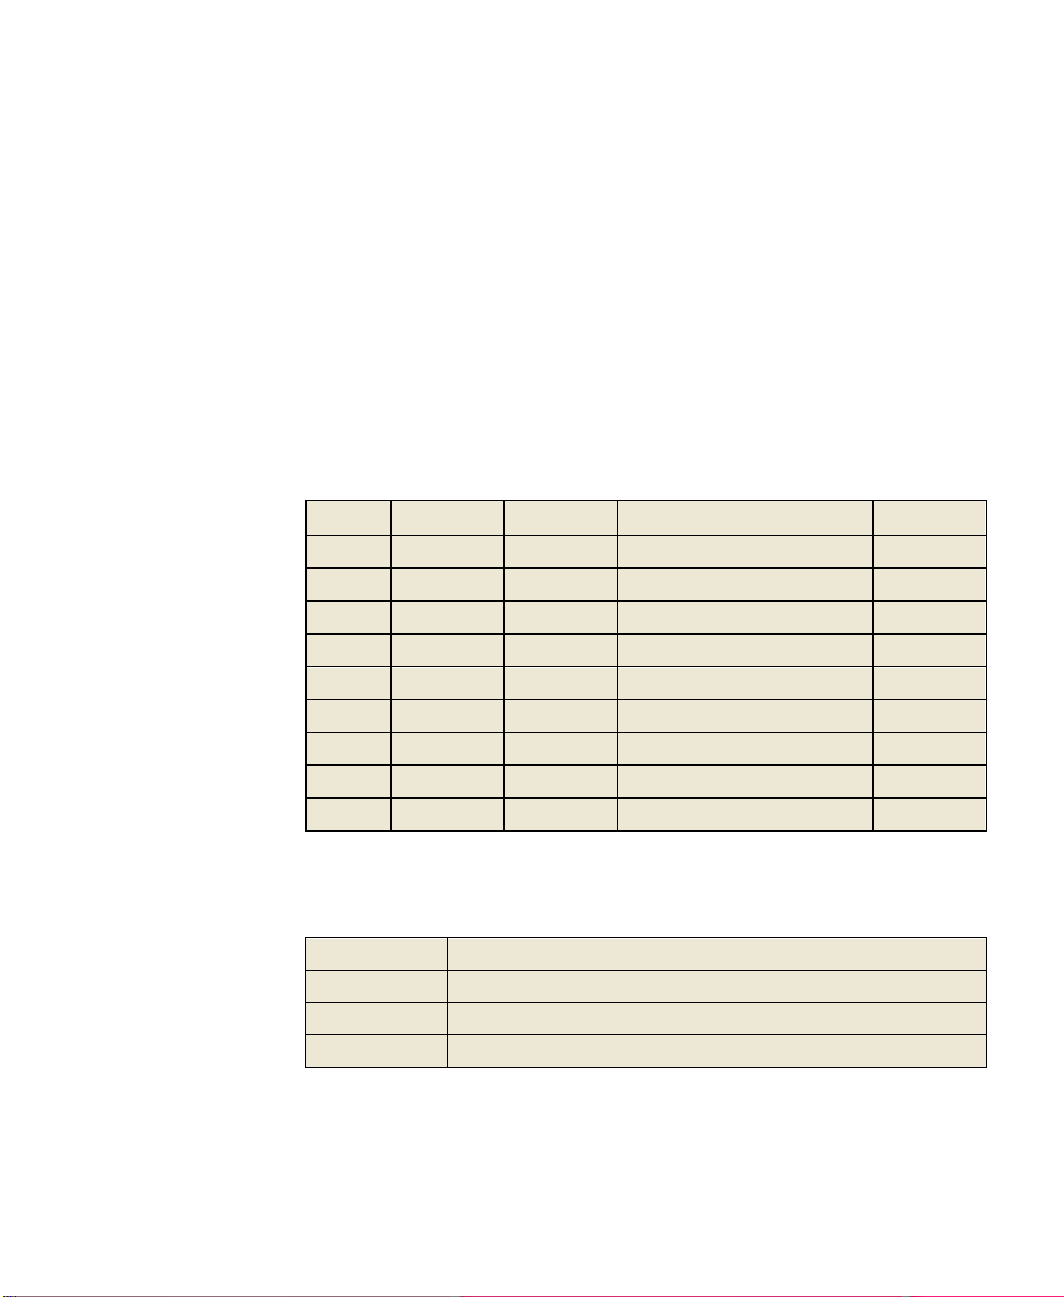
State
Description
No errors.
A dynamic symbol in the display contains a warning.
A symbol is reporting bad data or shutdown status.
A symbol shows questionable data.
A symbol shows annotated data.
A symbol shows substituted data.
On a single scale trend, the minimum and maximum values shown
on the scale may be adjusted.
You can show hidden traces by clicking their names a second time
in the legend, or by clicking the Revert button.
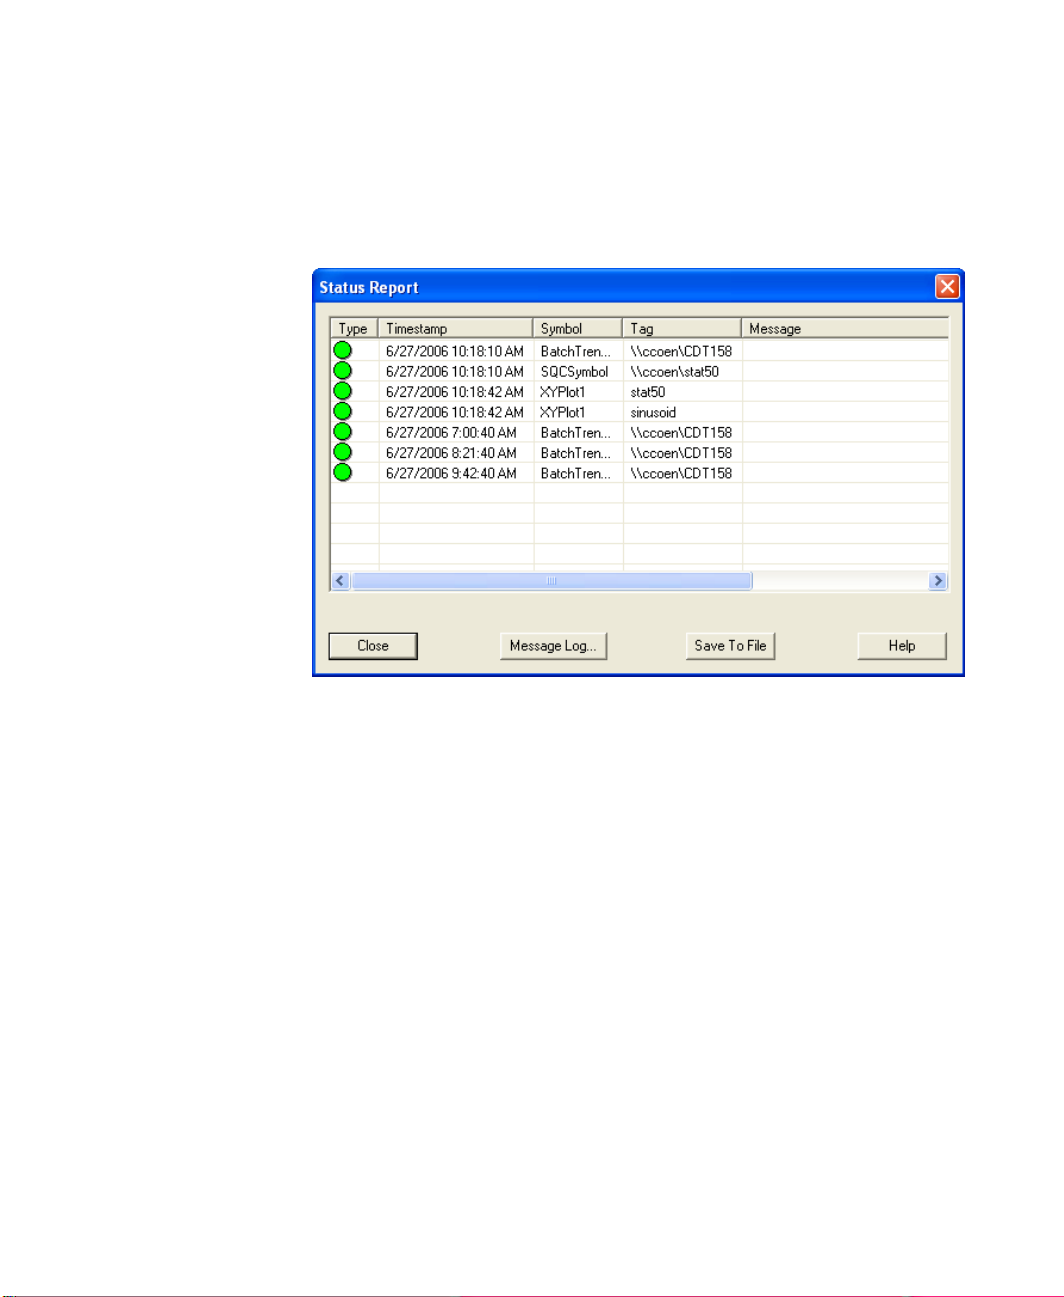
View a Status Report
The appearance of the Status button on the ActiveView toolbar indicates
the current state of dynamic symbols on the display:
15
Page 24
●
●
●
●
●
FactoryTalk Historian ActiveView User Guide
To view a status report for all of the symbols in a display, click the Status
button on the FactoryTalk Historian ActiveView toolbar.
To view a log of system messages, click Message Log.
To save the status report, click Save to File.
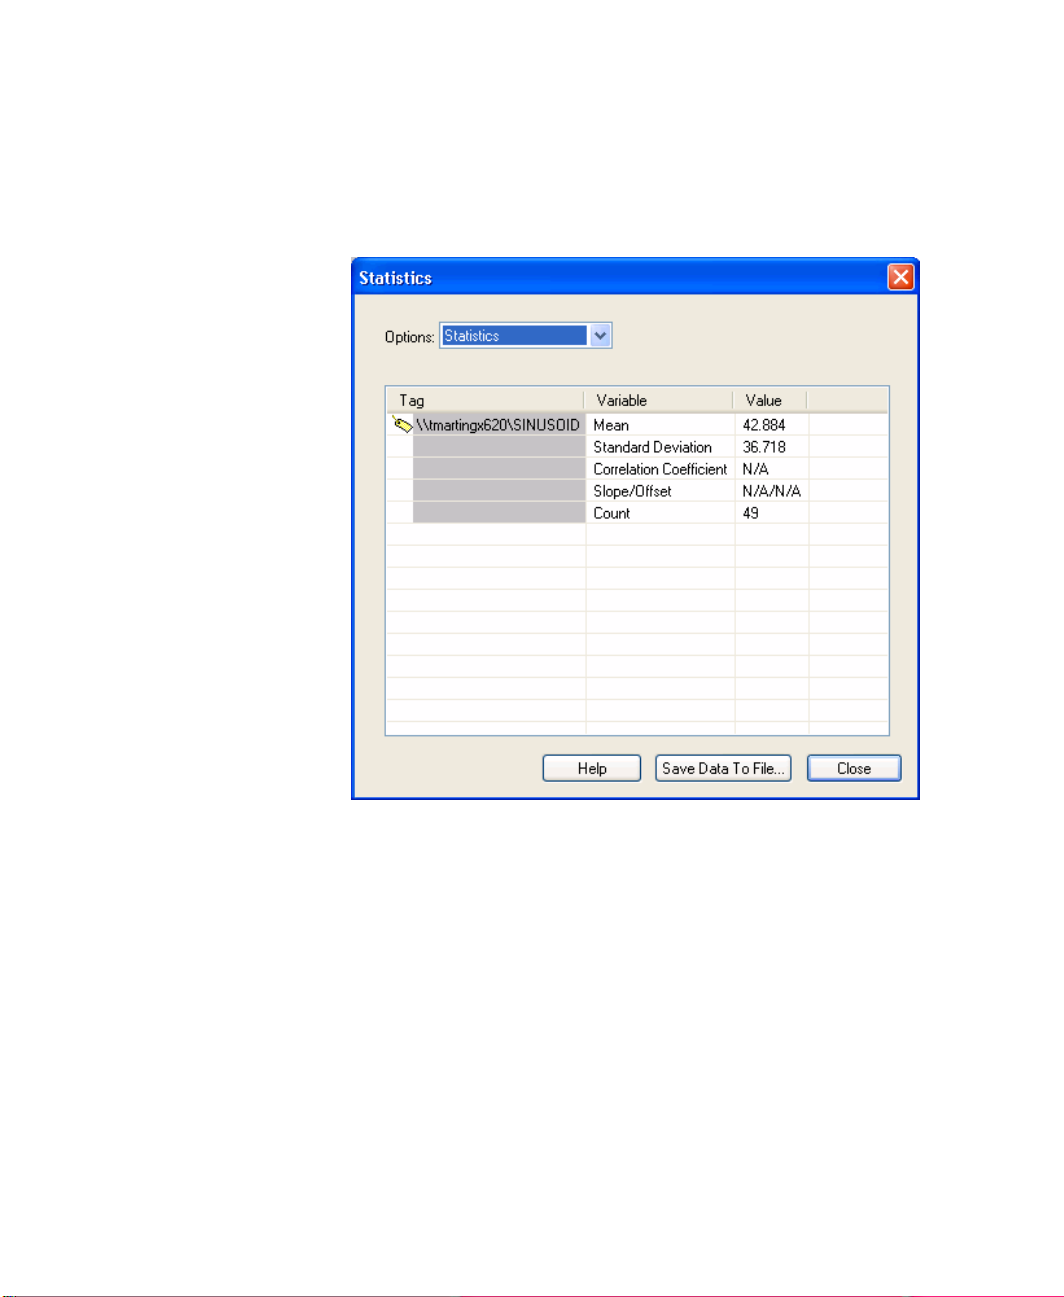
XYPlot Statistics
The Statistics dialog box allows you to view and export raw data values
and statistics, such as the mean and standard deviation of each tag’s data.
You can also view these statistics in the Details Window in FactoryTalk
Historian ProcessBook.
To open the Statistics dialog box:
1. In Run mode, double-click the XYPlot symbol. The Statistics dialog
16
box appears.
Page 25
2 ● For End Users: Viewing FactoryTalk Historian Data with FactoryTalk Historian ActiveView
●
●
●
●
●
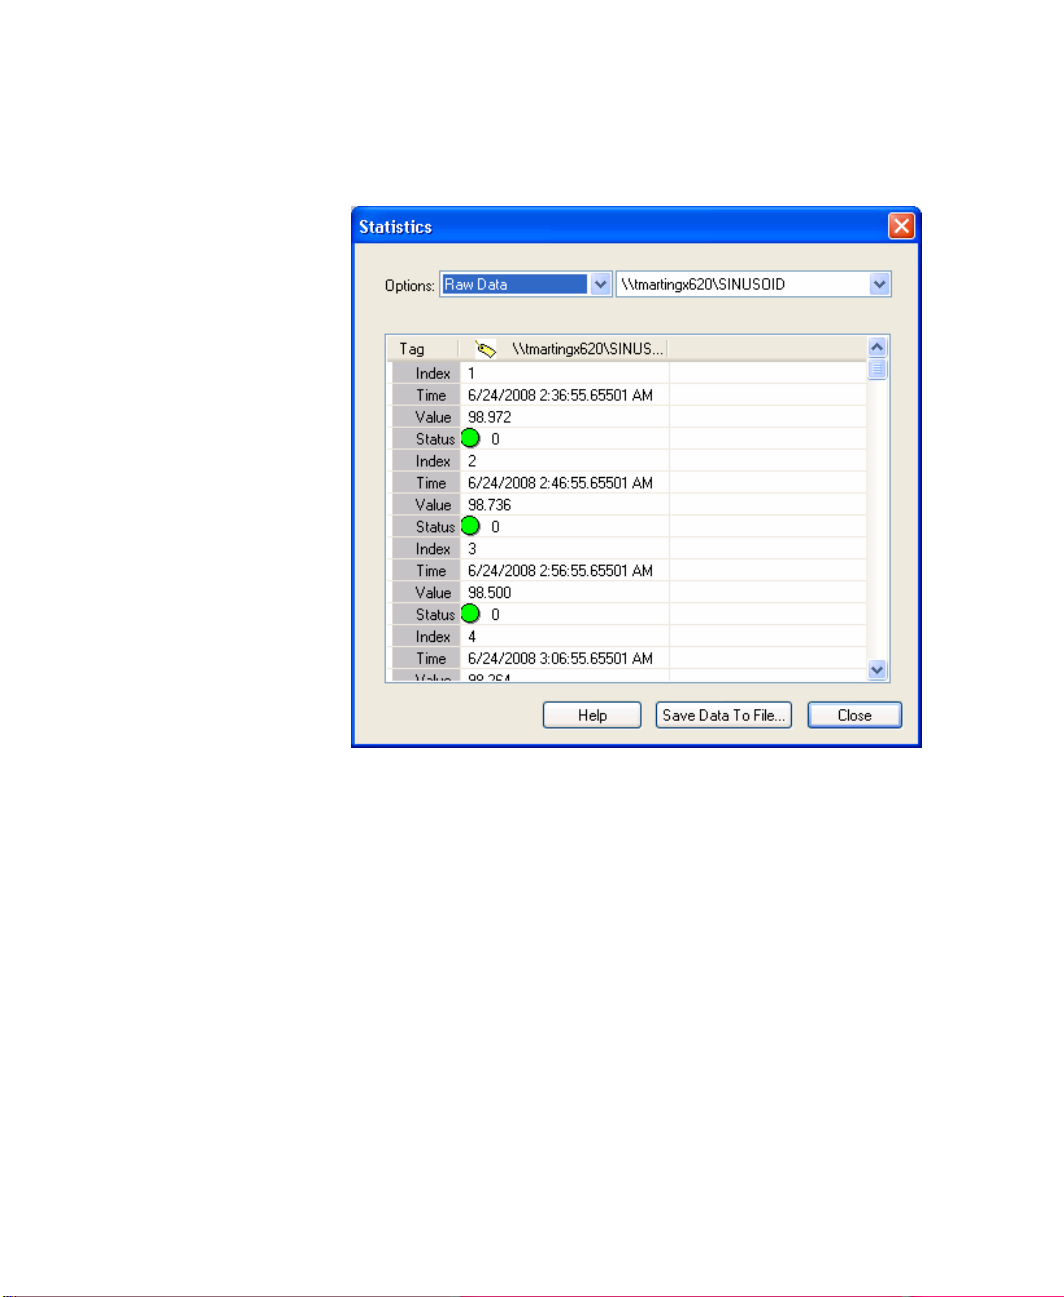
2. From the Options list, select Raw Data or Statistics.
17
Page 26
●
●
●
●
●
FactoryTalk Historian ActiveView User Guide
To save this data to a text file:
1. Click Save Data to File. The Save As dialog box appears.
2. Type a file name. The data is saved to the file in the following format:
Tag, <tag name>
Start Time, <start time>
End Time, <end time>
Count, < number of points paired>
Mean, <mean>
STDEV, <standard deviation>
Data Type, <data type>
18
Page 27

2 ● For End Users: Viewing FactoryTalk Historian Data with FactoryTalk Historian ActiveView
●
●
●
●
●
Index, Time, Value, Status
<index>, <time>, <value>, <status>
<index>, <time>, <value>, <status>
…
Tag, <tag name>
Start Time, <start time>
End Time, <end time>
Count, < number of points paired>
Mean, <mean>
STDEV, <standard deviation>
Correlation, <correlation coefficient>
Slope, <slope>
Intercept, <intercept>
Data Type, <data type>
Index, Time, Value, Status
<index>, <time>, <value>, <status>
<index>, <time>, <value>, <status>
…
Etc.
19
Page 28
●
●
●
●
●
FactoryTalk Historian ActiveView User Guide
Time and Time Ranges
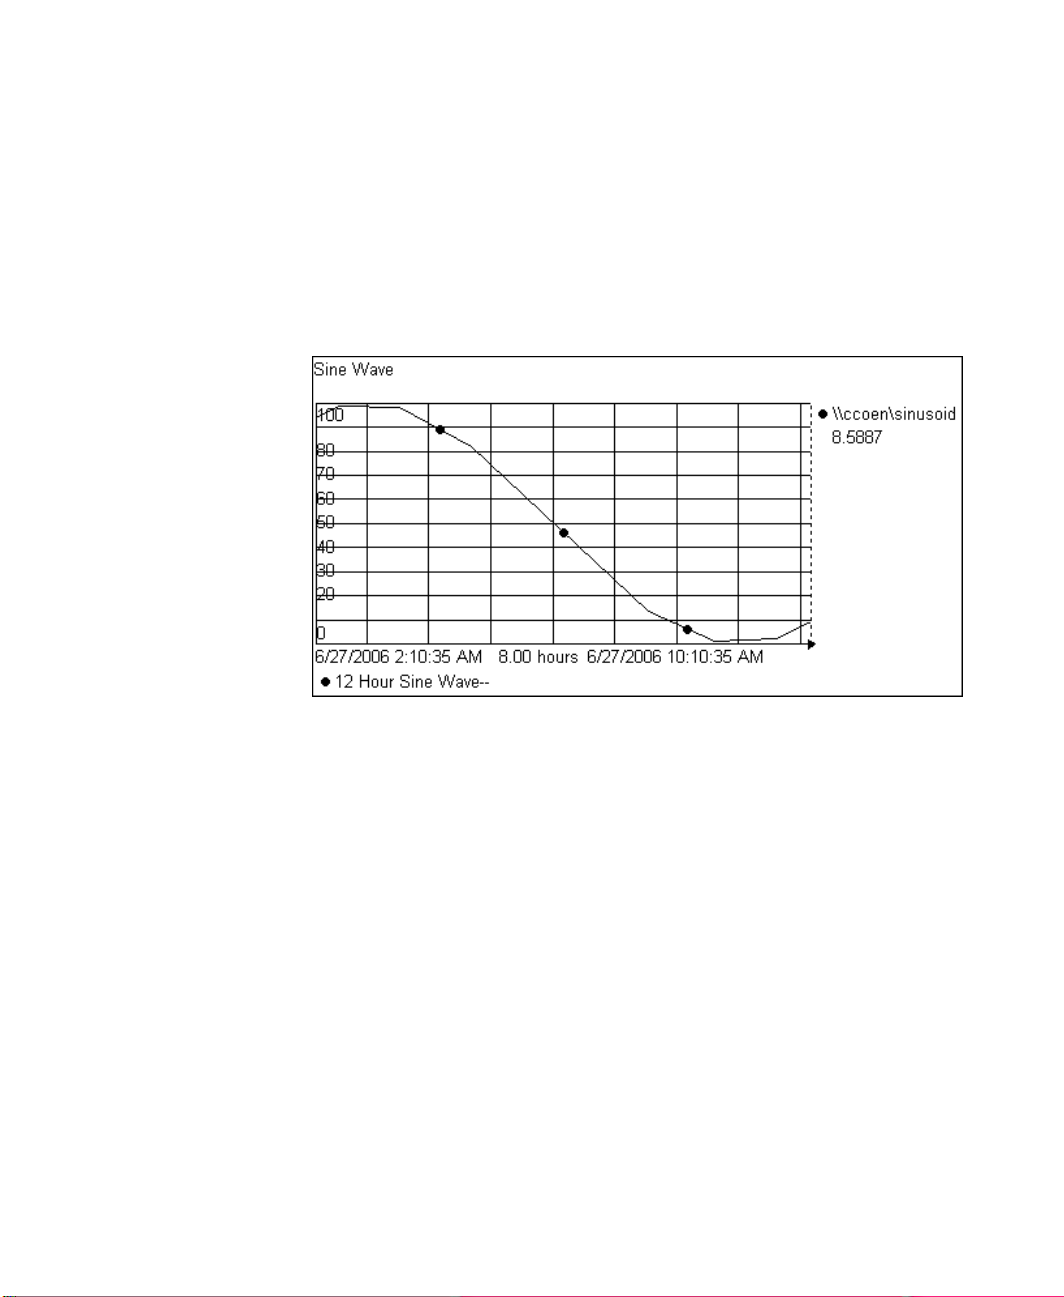
The following example is a trend displaying data through the current time.
The right border of the trend is dotted, signifying current time, rather than
solid, signifying a specific time in the past or future. The value scale may
also change if the trend is formatted to have Autorange scaling.
Depending on your configuration, the time zone represented on a display is
either the client machine time or the time relative to the Historian Server.
For details, see Change Time Zone (page 26).
Time Range Formats
All trends have beginning and ending time values that define the span of
time for which data is plotted. These values can be expressed in absolute or
relative time.
Other symbols on a display are also affected by time ranges.
20
Page 29
2 ● For End Users: Viewing FactoryTalk Historian Data with FactoryTalk Historian ActiveView
●
●
●
●
●
Name
Short name
Plural name
Member names
Fractions
second
s
seconds
no
yes
minute
m
minutes
no
yes
hour h hours
no
yes
day d days
no
no
month
mo
months
yes (for example, December)
no
year y years
no
no
week
w
weeks
no
no
weekday
wd
weekdays
yes (for example, Tuesday)
no
yearday
yd
yeardays
no
no
Constant
Result
*
The current time.
Today or t
12:00 am of the current day.
Yesterday or y
12:00 am of the previous day.
FactoryTalk Historian Time
FactoryTalk Historian Time abbreviations and FactoryTalk Historian Time
expressions allow you to specify times and time ranges for data using
constants, variables, and short expressions.
FactoryTalk Historian Time Abbreviations
An interval is a unit of time that can be used in time entries. Intervals that
support fractional values are listed below. For intervals where the Fractions
column indicates No, fractional amounts cannot be used in time strings.
You can spell out month and weekday names, or type the first three letters
(for example, Dec, Tue).
PI Times can also be expressed using certain constants:
21
Page 30
●
●
●
●
●
FactoryTalk Historian ActiveView User Guide
Constant
Result
Sunday or sun
00:00:00 (midnight) on the most recent past Sunday (in reference to the
Historian Server).
Expression
Description
Examples
Relative Time
Relative time expressions specify a number of days, hours,
minutes, or seconds with either a leading plus sign or a
leading minus sign.
The reference time, or starting time, for the relative time
expression is the current time if both start and end times are
relative.
+1d
-24h
-3m
+24s
Combined
Time
A combined time expression is a specific reference time
followed by a relative time expression.
*+8h
18-dec-02 -
3m
t+32s
Absolute Time
An absolute time expression is any time expression that is
neither a relative nor a combined time expression.
*
14-Dec-97
11-Nov-96
2:00:00.0001
t
y
FactoryTalk Historian Time Expressions
FactoryTalk Historian allows three types of time expressions: relative time,
combined time, and absolute time. These time expression types are defined
in the following table.
When using FactoryTalk Historian times, follow these guidelines:
Use absolute or combined time expressions. Avoid using relative time
expressions. Multiple relative time expressions in a time range may
cause an incorrect start time or an error message, depending on the
context of the expression.
22
Page 31

2 ● For End Users: Viewing FactoryTalk Historian Data with FactoryTalk Historian ActiveView
●
●
●
●
●
PI Time String
Meaning
06-dec-91 15:00:00
3:00:00 pm on December 6, 1991
*
Current time (now)
25
00:00:00 (midnight) on the 25th of the
current month
25-aug-92
00:00:00 (midnight) on August 25th, 1992
8:
08:00:00 on the current date
25 8:
08:00:00 on the 25th of the current month
t
00:00:00 on the current date (today)
y
00:00:00 on the previous date (yesterday)
sun, mon, tue, wed, thu, fri, sat
00:00:00 on the most recent Sunday,
Monday, ... Saturday
*-1h
One hour ago
t+8h
8:00:00 am today
y-8h
4:00:00 pm on the day before yesterday
mon+14.5h
2:30:00 pm last Monday
Relative and combined time expressions contain only a single
operator: either a single plus sign (+) or a single minus sign (-).
Additional operators can lead to unpredictable results. For example,
the following are not valid time expressions:
*+1d+4h
T-1d+12h
The name or short name for an interval used to denote FactoryTalk
Historian time is not case-sensitive.
FactoryTalk Historian Time String Examples
Time Syntax Examples
23
Page 32

●
●
●
●
●
FactoryTalk Historian ActiveView User Guide
PI Time String
Meaning
sat-1m
11:59:00 pm last Friday
PI Time String
Meaning
1.5h
One and one-half hours
32m
Thirty-two minutes
49s
Forty-nine seconds
+5h
Five hours added to the time beginning with
the start time.
-5h
Five hours subtracted from the time
beginning with the end time.
Time Interval Examples
In interval expressions, a positive or unmarked interval is based on the start
time, and a negative interval is based on the end time of a time expression.
For example, if the start time is y, the end time is t, and the interval is +5h
for a Sampled Data function, then interpolated values are generated at y,
y+5h, y+10h, y+15h, and y+20h. If the interval is -5h, the interpolated
values are generated at y+4h, y+9h, y+14h, y+19h and t.
Change Time Range
To change the time range represented by a dynamic symbol:
1. Scroll time ranges directly on a trend by using the Step Forward or
24
Backward buttons on the time scale. These time changes are
not saved with the symbol.
-orClick to select the symbol you want to change. To select multiple
symbols, hold down the Shift key while selecting symbols. To change
Page 33

2 ● For End Users: Viewing FactoryTalk Historian Data with FactoryTalk Historian ActiveView
●
●
●
●
●
the time range for every symbol in the display, click an unused area of
the display.
2. Right-click and choose Time Range. The Change Time Range dialog
box appears.
3. In the dialog box, select a range from the two lists or type a range.
You can type time ranges in relative time, absolute time, or a
combination of the two. For details, see Time Range Formats (page
20).
4. Click OK. The new values for the selected dynamic symbols appear.
25
Page 34

●
●
●
●
●
FactoryTalk Historian ActiveView User Guide
You can also use the scroll bar in the FactoryTalk Historian ActiveView
toolbar
(page 27) to change the time range.
Trends with Future Time Ranges
Trends with time ranges that extend into the future update normally if the
end time uses an asterisk (*). Use an asterisk plus a time interval (for
example, *+4h) to display updating future time. The asterisk and plus sign
are necessary; this feature does not work if you input the time in a format
such as 10-Jan-00 or T+10H.
Change Time Zone
You can show times in the Client or Server time zone for each FactoryTalk
Historian ActiveView display. To see or change the time zone in use, rightclick the display and choose Time Zone, then choose either Client or
Server. The current selection is shown with a check mark.
If you choose Client time, all the times displayed are in your client
machine's time zone. If you select Server time, all times appear with
respect to the time zone of each Historian Server from which the tag data is
retrieved.
Any times that are input by the user (such as in changing the time range
(page 24)) are interpreted in the selected time zone.
26
Page 35

2 ● For End Users: Viewing FactoryTalk Historian Data with FactoryTalk Historian ActiveView
●
●
●
●
●
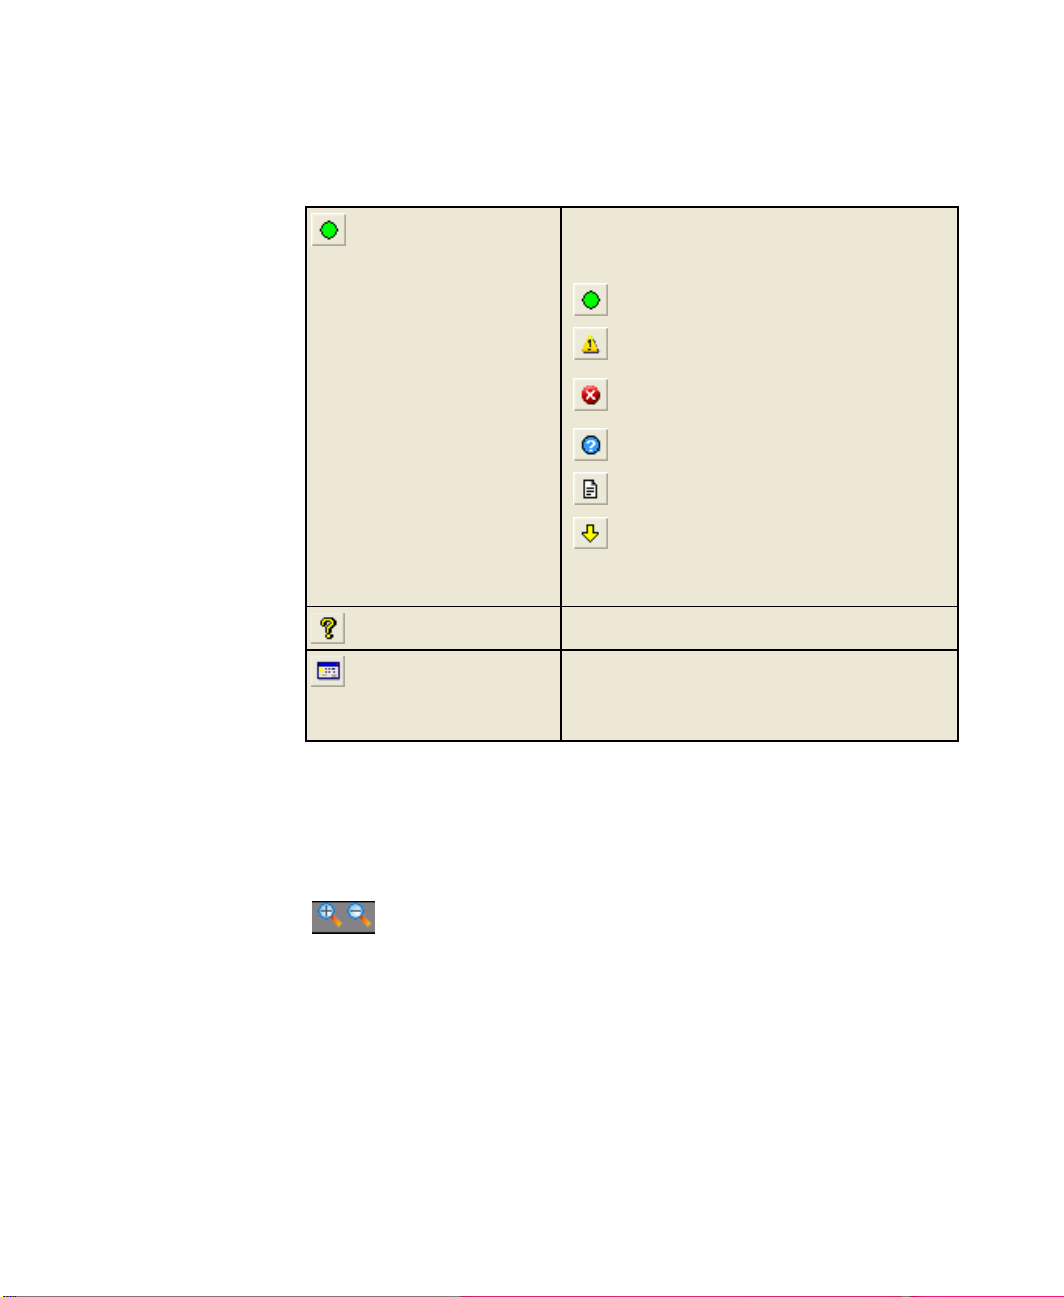
Tool
Description
Time Range scroll bar. To adjust the time range,
select a dynamic symbol. (To select multiple symbols,
hold down the Shift key. To change all the symbols in
a display, click in an unused area of the display.)
Move the slider or click the arrow buttons to change
the time range being displayed.
Return to the configured time range of a selected
symbol. If no symbols are selected, every symbol in
the display returns to its original time range.
Displays the
Layers
(page 12) dialog box.
The FactoryTalk Historian ActiveView Toolbar
To display a toolbar, right-click the display and choose Tool Bar.
Review the following for additional information:
27
Page 36
●
●
●
●
●
FactoryTalk Historian ActiveView User Guide
Indicates the presence and nature of status
information. The appearance of the Status button
indicates a display's current state:
No errors.
A dynamic symbol in the display contains a
warning.
A symbol is reporting bad data or shutdown
status.
A symbol shows questionable data.
A symbol shows annotated data.
A symbol shows substituted data.
Click this button to view the
Status Report
(page 15)
dialog box.
Displays the FactoryTalk Historian ActiveView help.
Displays the About FactoryTalk Historian
ActiveView dialog box, which includes the
FactoryTalk Historian ActiveView executable version
number and ActiveX control information.
To hide the toolbar, right-click the display and choose Tool Bar.
Trend Interactions
Trend Zoom 2x In or Out
28
Click the Zoom In or Out button at the bottom of a trend to reduce or
expand the time range of that trend by a factor of 2. In other words, if your
time range is 8 hours, Trend Zoom 2x In divides the time range by 2 and
displays the trend for a 4 hour time period. Trend Zoom 2x Out multiplies
the time range by 2 and displays the trend for a 16 hour time period.
Page 37

2 ● For End Users: Viewing FactoryTalk Historian Data with FactoryTalk Historian ActiveView
●
●
●
●
●
You can remove changes to the time range by clicking the Revert button
.
If a trend is too small these buttons may not appear. Double-click a trend to
expand its size and display hidden buttons.
If there are no trend cursors, the Trend Zoom 2x command zooms in or
out of the last portion of the time period. For example, if the initial time
range is 60 minutes and you select Trend Zoom 2x In, the trend displays
the last 30 minutes. Trend Zoom 2x Out displays 120 minutes adding 60
minutes to the beginning of the trend.
When a trend cursor is displayed, the command uses the trend cursor as the
center of the zoomed trend. If several cursors are used, the last one set is
used as the center of the zoomed trend. See Trend Cursors (page 10) for
more information on trend cursors.
Back and Forward Trend Buttons
Click the Back and Forward buttons on the trend time scale to scroll the
time forward or backward one increment. Each click adjusts the time scale
by the current time range.
For example, if a trend shows 4 hours of data, clicking the Back button
shows the previous 4 hours and clicking the Forward button shows the
next 4 hours.
Browser Interactions
Back and Forward Browser Buttons
Click the Back and Forward buttons to switch to the previous or next Web
page.
29
Page 38

●
●
●
●
●
FactoryTalk Historian ActiveView User Guide
Refresh Button
Data is refreshed automatically. You can click the Refresh button on the
Internet Explorer toolbar to download a new HTML Web page, but it does
not obtain either new data or a new Display Document. Display
Documents are stored in your cache until they expire.
30
Page 39

Chapter 3
For Developers: Administering FactoryTalk Historian ActiveView
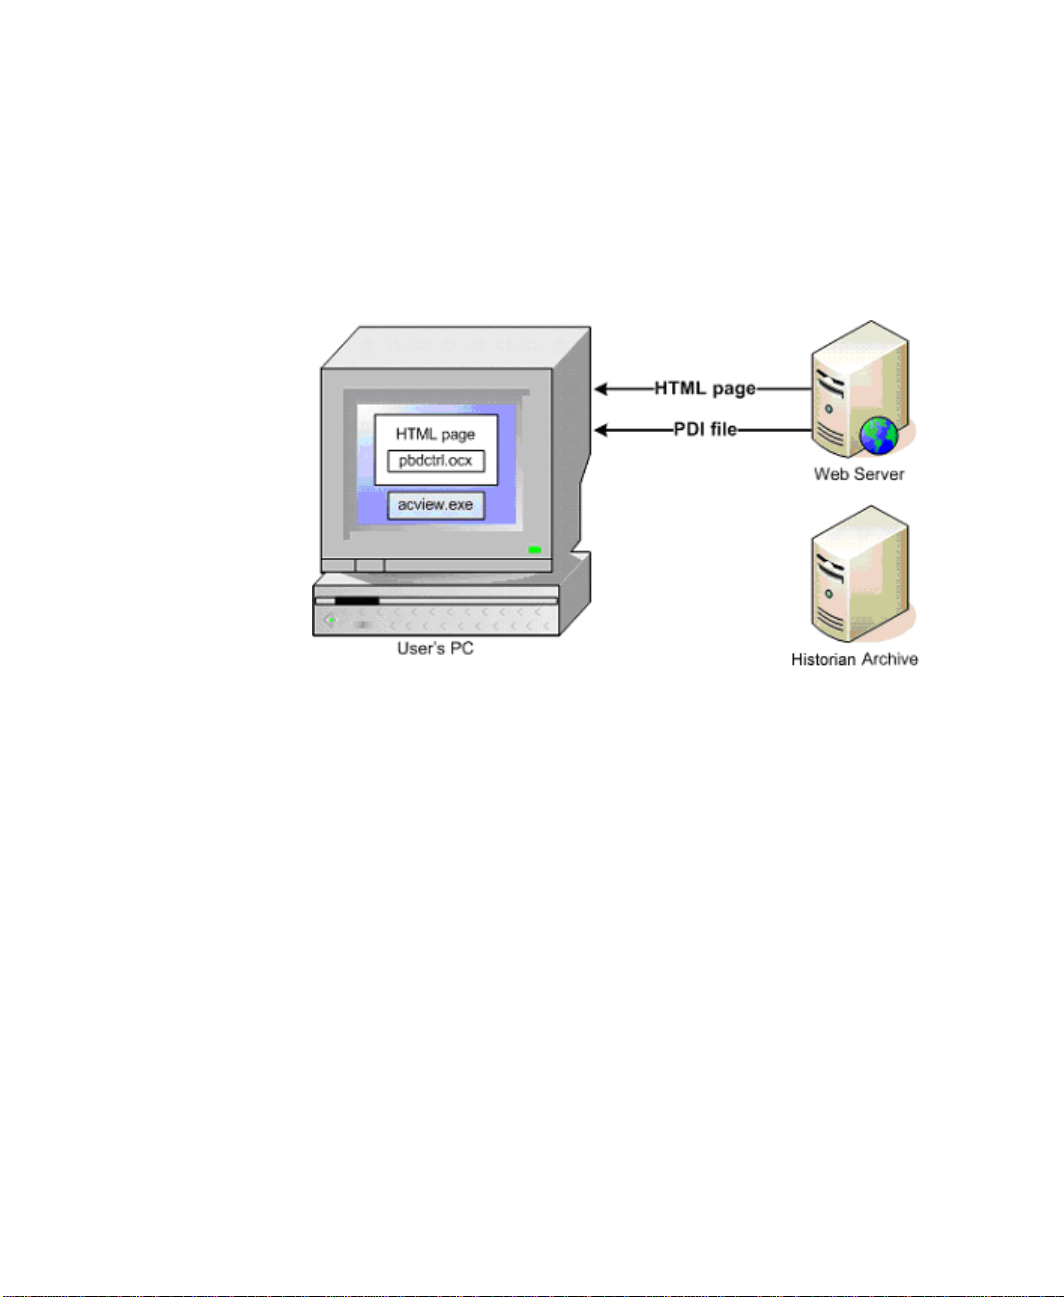
Flow of Information
When you open a Web page with FactoryTalk Historian ActiveView
content, the flow of information occurs as follows:
1. Open Internet Explorer and browse to an Internet or intranet address
(URL) for a stored HTML Web page. The Web page downloads from
the Web server unless it is already cached on your PC. The PC's
Internet settings determine how long an existing page is stored before
it is discarded.
2. The Web page instructs the browser to create an instance of the
ActiveView Control (pbdctrl.ocx) on your PC.
3. The Web page sets the DisplayURL (page 62) property of the
FactoryTalk Historian ActiveView Control. This property tells where
the Display Document (.pdi) is stored. The Control downloads the
display (.pdi), which may be stored separately from the HTML page.
The Control then opens acview.exe. See also Expiration of
Displays (page 34).
31
Page 40

●
●
●
●
●
FactoryTalk Historian ActiveView User Guide
4. Acview.exe connects to the Historian Server through the PI-SDK
and retrieves actual data for the display. You can see the data on the
display within the HTML page.
32
Page 41

3 ● For Developers: Administering FactoryTalk Historian ActiveView
●
●
●
●
●
FactoryTalk Historian ActiveView Executable
The FactoryTalk Historian ActiveView executable, acview.exe,
displays data in the Display file. If you open additional Display
Documents, the same instance of acview.exe continues to be used as
the ActiveX (OLE) server; it is not necessary to log in to the Historian
Server again.
To improve performance, acview.exe caches the five most recently
viewed displays on your PC. To maintain the cache of recently viewed
displays as well as to preserve the necessary Historian Server connections,
acview.exe continues to run, by default, for five minutes after the last
instance of pbdctrl.ocx is closed.
To maintain the server connection and prevent repeated logins, the
acview.exe process runs for the length of the timeout setting after the
last instance of the FactoryTalk Historian ActiveView Control is
destroyed. For example, if you navigate from one Web page to another and
both use the FactoryTalk Historian ActiveView control, acview.exe
continues to run. The default timeout period is five minutes.
In order to operate, acview.exe requires several supporting .dlls,
ADO core components, and VBA core components.
The acview.exe Timeout
You can change the acview.exe timeout duration by resetting the
registry key value:
HKEY_CLASSES_ROOT\CLSID\{576EFBE0-77F3-11D2-A05B00105A07D444}\TimeOut
Where TimeOut is the number of seconds, rounded up to the next minute,
after which acview.exe stops running after all the open instances of the
control are closed.
33
Page 42

●
●
●
●
●
FactoryTalk Historian ActiveView User Guide
Expiration of Displays
There are two kinds of caching of the PDI files.
Both HTML and PDI displays are cached when downloaded from a
website to the local machine. This is managed in part by Internet
Explorer and the files are stored as temporary internet files, also called
browser cache. This type of file expires exactly 24 hours from the time
it is loaded.
FactoryTalk Historian ActiveView caches the last 5 displays within its
memory. Once a display is downloaded, the ActiveView Control uses
it without further downloading, unless the display has expired. This
allows for fast loading of the display if you switch to a different
display and then switch back. These files drop off the last five list as
other files are used.
Data updates to cached files occur dynamically through FactoryTalk
Historian. It is not necessary to refresh the display to receive data updates.
You must reload a display to receive content updates. For example, you
will not see a new symbol that is added to a display that is already in your
cache until you clear the cache so that ActiveView can reload it the next
time you view the display.
To remove a file from the cache in Internet Explorer:
1. Click Tools > Internet options > General tab > Temporary Internet
2. Click Delete Files.
3. Click OK.
You can change the default for expiration of displays within FactoryTalk
Historian ActiveView by setting the PDI time (PDITTL) to a live value.
You must be using the HTTP protocol when you set the DisplayURL (page
62) property of the control. The new setting applies to displays that are
added to the cache after the setting is changed.
34
Files.
Page 43

3 ● For Developers: Administering FactoryTalk Historian ActiveView
●
●
●
●
●
1. Open the Registry Editor.
2. Navigate to the CurrentVersion key:
HKEY_LOCAL_MACHINE\Software\PISystem\PI-
ActiveView\CurrentVersion
3. Right-click in the right-hand pane and select New/String Value.
4. Type PDITTL as the name of the value.
5. Right-click PDITTL, select Modify, and type the value in seconds.
6. Click OK.
This image shows an expiration value of 600 seconds.
FactoryTalk Historian ActiveView Setup
The Developer's Role
In FactoryTalk Historian ActiveView, the developer's role is to provide an
environment for the end user to view real-time data from the Historian
Server and other data.
In providing the software to end users, the developer must:
35
Page 44

●
●
●
●
●
FactoryTalk Historian ActiveView User Guide
Make sure FactoryTalk Historian ActiveView is installed on end users'
machines
Provide Historian Server information to end users
Customize FactoryTalk Historian ActiveView settings (page 45)
(optional).
Install any custom components used in your displays that are not
installed by FactoryTalk Historian ActiveView. For example, if you
purchased a third-party chart to view data within a display, you must
distribute this chart to all FactoryTalk Historian ActiveView machines
so that users can view the chart in FactoryTalk Historian ActiveView.
You can create an environment using Web pages, Excel spreadsheets, or
any other ActiveX container. This documentation focuses primarily on the
Web environment.
Provide Display Documents (page 39).
Create Web pages (page 49).
Use the Export utility (page 42).
Support environments other than the Web (page 56).
Developer's Kit
Use the Developer's Installation (page 82) method to install the
Developer's Kit. Development tools are installed in the
\pipc\acview\webdev directory.
The Developer's Kit helps you incorporate FactoryTalk Historian
ActiveView into new or existing Web pages. It includes:
sample.htm: a sample HTML page.
export.pdi: an export utility for converting existing ProcessBooks
36
(PIW files) to Display Documents with web pages.
Page 45

3 ● For Developers: Administering FactoryTalk Historian ActiveView
●
●
●
●
●
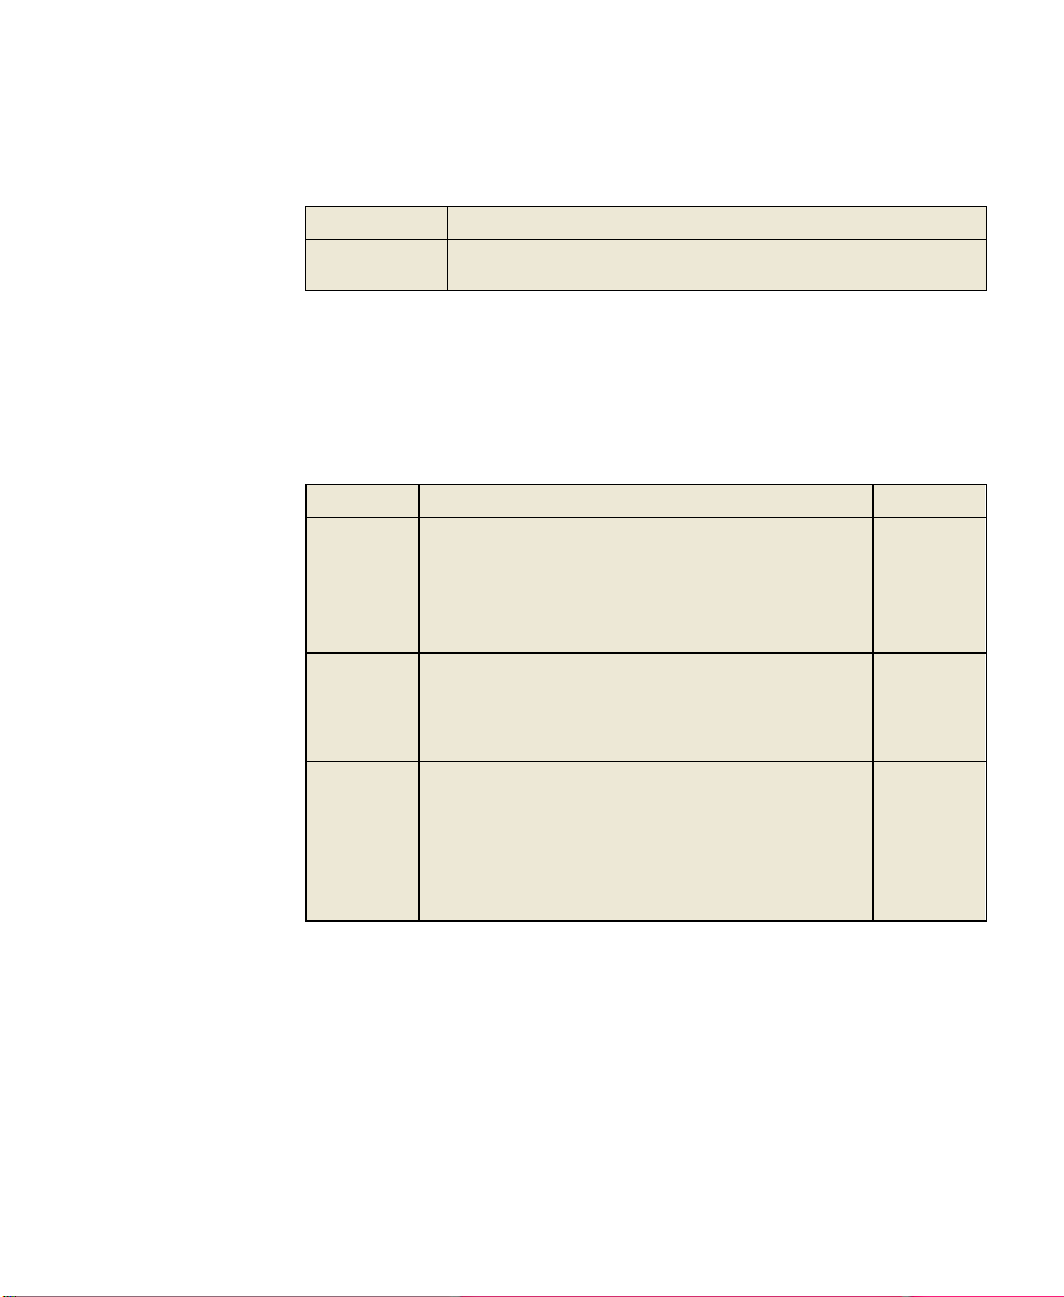
Setting
Response
High
Does not download or run ActiveX Controls, either signed or unsigned.
FactoryTalk Historian ActiveView does not run.
Medium
The user is prompted to download digitally signed components. Unsigned
components are not allowed to download. FactoryTalk Historian ActiveView
does not run if unsigned components are required.
Medium-low
The user is prompted to download digitally signed ActiveX controls and
plugins. Unsigned components are not allowed to download. FactoryTalk
Historian ActiveView does not run if unsigned components are required.
Low
Signed components are downloaded without any user interaction. The user is
prompted to download unsigned components.
Custom
Allows you to configure every security setting, rather than groups of settings.
For users who define custom security levels, we recommend that you set Run
ActiveX controls and plug-ins and Script ActiveX controls marked as
safe for scripting to Enable.
PIAPIConnections.exe: a tool for configuring Historian
Servers.
Security
Internet Explorer security settings can determine whether users can view
Display Documents. To view these settings, choose Tools > Internet
options > Security.
For HTML pages distributed through a corporate Intranet, you may want to
use a different security zone with different settings than for external sites.
The security levels that are available for Internet Explorer are:
DEP Security
Data Execution Prevention (DEP) is system-level memory protection,
introduced with Windows XP SP2, and available in subsequent Windows
37
Page 46

●
●
●
●
●
FactoryTalk Historian ActiveView User Guide
operating systems. DEP prevents malicious code attacks. FactoryTalk
Historian ActiveView works correctly when DEP is enabled.
FactoryTalk Historian Security
FactoryTalk Historian ActiveView is designed to support whatever
FactoryTalk Historian Security is configured on the FactoryTalk Historian
server.
1. When FactoryTalk Historian ActiveView attempts to connect to a
FactoryTalk Historian server, the application first attempts to pass
your FactoryTalk Security/Windows log in credentials. The PI SDK
will try to use them directly or find a Trust for the user, domain,
application or machine (per Trust configurations).
2. If all attempts to login to the FactoryTalk Historian server using
FactoryTalk Security/Windows credentials or other machine-related
information fail, then you must have a FactoryTalk Historian ME
native security user account (not FactoryTalk Security/Windows
security-based). In this case, the PI SDK attempts to use the native
FactoryTalk Historian ME user account configured for the Server.
3. If the default native FactoryTalk Historian ME user account does not
require a password, then you are automatically logged in. If the default
account does require a password, a login dialog box appears, which
expects the native FactoryTalk Historian ME user account and
password.
the
Redist > Docs folder on the FactoryTalk Historian SE installation DVD.
38
For more detailed information on FactoryTalk Historian server security, see
FactoryTalk Historian SE Installation and Configuration Guide
available in the
Page 47

3 ● For Developers: Administering FactoryTalk Historian ActiveView
●
●
●
●
●
ActiveX Controls and FactoryTalk Historian ProcessBook Add-ins
Third party add-ins or ActiveX controls can provide additional
functionality and visual symbols in FactoryTalk Historian ProcessBook.
To use these add-ins with FactoryTalk Historian ActiveView, review the
information in the Rockwell Automation Technical Support article no.
254378
(http://rockwellautomation.custhelp.com/app/answers/detail/a_id/254378/k
w/254378).
If you have a 3rd party ActiveX control you want to use, you must
distribute it to all your FactoryTalk Historian ActiveView users, just as you
would to any FactoryTalk Historian ProcessBook users. Consult the
documentation that came with the control to learn how best to deploy it
throughout your organization.
Close FactoryTalk Historian ActiveView and verify in Task Manager that
acview.exe is not running before you install and register an add-in.
Create Display Documents
You can create Display Documents using FactoryTalk Historian
ProcessBook. You can also convert them from existing displays within
ProcessBooks (PIW files) used in your facility. Display Documents are
saved as individual files with a .pdi extension.
In designing Display Documents either within a ProcessBook or as
independent displays, consider the following content guidelines.
39
Page 48

●
●
●
●
●
FactoryTalk Historian ActiveView User Guide
FactoryTalk Historian BatchView and Historian SQC Chart
You can include FactoryTalk Historian BatchView symbols (trends, Gantt
charts, results tables, and runtime searches) and Historian SQC charts in a
display if you have these ProcessBook symbols installed in FactoryTalk
Historian ProcessBook when the display is created. FactoryTalk Historian
BatchView and Historian SQC are both installed with FactoryTalk
Historian ActiveView for viewing displays with those symbols.
FactoryTalk Historian BatchView licenses are required for developers
using FactoryTalk Historian ProcessBook but not for FactoryTalk
Historian ActiveView users.
VBA Programming
Display Documents may include additional functionality through VBA
scripting. The Save, Save As, and Print Preview Methods of the Display
object may not be used in VBA script.
Size the ActiveView Control and the Display Document
FactoryTalk Historian ActiveView does not permit scrolling through a
Display Document. For best results, design the display to fill a maximum
of one screen.
The aspect ratio of the Display Document is maintained when the
ActiveView Control displays it. That is, the entire Display Document
appears, no matter how small the space provided.
For best results, develop your displays using a lower screen resolution
(such as 800 x 600). Otherwise, if a Display Document is created on a high
resolution display and viewed on a low resolution display, the text inside
the controls may truncate.
40
Page 49

3 ● For Developers: Administering FactoryTalk Historian ActiveView
●
●
●
●
●
Guidelines for Building Displays
Abide by the following practices when building a display:
If you know the size of the FactoryTalk Historian ActiveView control
ahead of time, design the display to keep scaling to a minimum. To
accomplish this, restore the display window in FactoryTalk Historian
ProcessBook and then size the window to match the size of the
ActiveView Control's window. Very large displays that are viewed in
small ActiveView Controls usually do not show as well as smaller
displays.
You can host more than one control on a page. Consider dividing
dense content into a set of displays.
For a display to scale well, keep each of the elements within the
display scalable. In particular, use TrueType fonts for PIValues,
PIButtons, PIText, and any ActiveX controls, because they scale well.
When working with ActiveX controls, text elements on those controls
may not scale exactly. Allow extra space for disproportionately scaled
text by sizing controls to give room for text to grow beyond the
bounds of the original design. For example, make a command button
larger and use a shorter caption string instead of sizing the button to
match the caption's size.
Select fonts for the Display Document that are likely to be available on
each user's PC. TrueType fonts are preferred because of their
scalability. Your organization may have standards for font use.
Any embedded ActiveX controls within a Display Document must be
installed separately on every user's PC.
Embedded ActiveX controls, such as drop-down lists, usually do not
resize well when the Display Document resizes to fit the ActiveView
Control.
If you include ADO data through PI Data Sets in the Display
Document, ensure that the ODBC data source is configured on each
41
Page 50

●
●
●
●
●
FactoryTalk Historian ActiveView User Guide
user's PC. If you use custom data sets from a FactoryTalk Historian
ProcessBook add-in, that add-in must also be installed on the user's
PC.
Export Displays from FactoryTalk Historian ProcessBook
FactoryTalk Historian ActiveView recognizes Display Documents (.pdi
files) but not displays within ProcessBooks (.piw files). There are several
ways to convert existing displays in ProcessBooks, either individually or a
whole book at a time, to Display Documents.
To convert an individual display within a ProcessBook:
1. In FactoryTalk Historian ProcessBook, open the ProcessBook you
wish to export, and the display you wish to export.
2. Click File > Save As. The Save As dialog box appears.
3. Navigate to the folder where you want to save your display.
4. Type a filename in the File name box.
5. In the Save as type box, choose Display Files (.pdi).
6. Click Save.
To convert all of the displays in an existing ProcessBook and store them in
a single directory, use the export.pdi file in FactoryTalk Historian
ProcessBook. This utility also creates Web pages referencing the resulting
PDI files, although you are not required to use the pages.
1. In FactoryTalk Historian ProcessBook, open the ProcessBook you
2. Open export.pdi (located in the acview\webdev directory).
3. In the Export Path box, type the destination folder path. You can
42
want to export.
export the results directly to a web server.
Page 51

3 ● For Developers: Administering FactoryTalk Historian ActiveView
●
●
●
●
●
4. Click OK. The Export Status dialog box appears so you can follow
the export progress. Each of the displays appears and the connections
to the Historian Server are verified. You may need to log in during the
process. If any button links in the display fail, a message appears in
the dialog box.
5. Scroll down as the messages appear until you see Export Successful.
6. If you want to save a log file, click Save Log As and type a path and
filename for the log file.
7. Click Close to exit the Export Status dialog box.
8. Close the export.pdi window.
9. Close FactoryTalk Historian ProcessBook.
10. Browse to the destination folder and open pbhome.htm to view the
displays.
How the Export Utility Works
The export utility, export.pdi, allows you to specify a ProcessBook to
convert into Display Documents (.pdi files) and builds Web pages for
viewing the displays.
Once you identify a ProcessBook for conversion and an output directory,
export.pdi opens each display in the ProcessBook, verifies Historian
Server connections, and then saves each display as a Display Document. It
creates the following files:
Pbhome.htm: Users point to this page with their browsers.
Pbmenu.htm: Menu of available displays shown on pbhome.htm.
Pbdsply.htm: Where the ActiveView Control is instantiated and
displays are shown.
43
Page 52

●
●
●
●
●
FactoryTalk Historian ActiveView User Guide
external_script.js: Used to activate the ActiveView Control
in the Web page.
Next, export.pdi connects all the existing links in the displays and
puts the icon, disp.bmp, in the destination directory. Links between
displays within the original ProcessBook continue to work; other links may
not. For more information, see Create Links Between Displays or
Applications (page 44).
Once export.pdi is completed processing, you can move the contents
of the export directory to other locations, such as your corporate Web sites.
Links continue to work because they are relative.
The export.pdi utility is written in VBA. You can adapt the code to
your specific needs.
Create Links Between Displays or Applications
Use caution when including buttons that link to other displays in your
Display Document, because these buttons may look for specific or relative
paths in the file system and the paths may differ among PCs.
One approach to avoid this problem is to assemble all your displays within
one ProcessBook in FactoryTalk Historian ProcessBook, link them, and
then export the ProcessBook to FactoryTalk Historian ActiveView using
the export.pdi utility.
Another approach is to include buttons in the HTML page that open other
displays by resetting the DisplayURL (page 62) property of the
ActiveView Control.
When you create a link, it stores both the relative and absolute paths. In the
FactoryTalk Historian ProcessBook Define Button dialog box, when the
Use relative path before absolute path box is checked, the program
checks the relative path first. When this option is not checked, the program
checks the absolute path first. If you are moving files around for two kinds
of users then you may prefer the relative path (check the box). On the other
44
Page 53

3 ● For Developers: Administering FactoryTalk Historian ActiveView
●
●
●
●
●
Keyword
Section(s)
Description
ToolbarVisibility
Startup
Specifies whether the toolbar is visible. When set
to 1, the toolbar is visible, when set to 0 (zero), it
is hidden. When a user turns the toolbar on or
off, this setting updates automatically.
Show Value
Attributes
Startup
Specifies whether value attribute flag icons
appear. When set to 1, (the default) value
attributes appear. When set to 0, value attribute
hand, if the files move individually and the directory structure might
change, it is better to prefer absolute paths (clear the box).
When End-Users See Updates
When you change or replace a Display Document on your Web site, users
do not see this change until the previously downloaded Display Document
expires in their cache. See Expiration of Displays (page 34) for details.
There is no automated way for a developer to refresh the displays that are
cached on each user's PC.
Work with Element Relative Displays
Displays can reference points that vary based on their context, as defined
using element Relative Displays. In FactoryTalk Historian ActiveView, the
window used to select a different element in FactoryTalk Historian
ProcessBook is not available. Use other programmatic means to change the
context.
Configuration
The acview.ini file contains configuration and preference settings for
FactoryTalk Historian ActiveView (similar to the procbook.ini used
for FactoryTalk Historian ProcessBook, and identical in format). This file
resides in the pipc\Dat directory. The significant keywords are:
45
Page 54

●
●
●
●
●
FactoryTalk Historian ActiveView User Guide
Keyword
Section(s)
Description
flags do not appear. Note that this keyword
contains spaces.
EnableXPThemes
Startup
When set to 1, XP themes are supported in place
of the VBA color palette.
ConnectUsingAPI
Startup
This option is useful if you have VBA code or
ProcessBook add-ins that use the PI API to
retrieve data from the Historian Server. When set
to 0 (the default), FactoryTalk Historian
ActiveView makes connections to servers using
only PI-SDK. When set to 1, FactoryTalk Historian
ActiveView makes connections to each server
using both the PI-SDK and PI API.
UpdateTimeRange
Trend Definition,
XYPlot Definition
The maximum time range, in seconds, under
which a trend or XY plot symbol updates. The
default value is 604800 seconds (7 days). If the
time range is greater than this value, the symbol
does not refresh automatically even when the end
time is "*". This value is different from the update
rate (Timer), which is the frequency with which
new data from the Historian Server is added to
the display (by default, every 5 seconds).
Timer
Data Manager
Sets the poll timer, in milliseconds, for
FactoryTalk Historian ActiveView to update the
display with any data updates and then updates
the display. These updates include event pipe
data from the Historian Server and any new data
source re-queries. The maximum value is 60,000;
the default is 5000.
Collective Name
Collective
Preference
Overrides the default FactoryTalk Historian
ActiveView setting for connecting to the named
Historian Server collective. Note that this keyword
contains spaces.
Any specifies that FactoryTalk Historian
ActiveView can connect to any Historian Server in
the collective. This is the default.
PreferPrimary specifies that FactoryTalk
Historian ActiveView can connect to any Historian
Server in the collective but tries to connect to the
primary Historian Server in the collective. In
addition, if a secondary server is connected but
46
Page 55

3 ● For Developers: Administering FactoryTalk Historian ActiveView
●
●
●
●
●
Keyword
Section(s)
Description
the primary server becomes available, FactoryTalk
Historian ActiveView reverts to the primary server.
RequirePrimary specifies that FactoryTalk
Historian ActiveView only connects to the primary
server in the collective.
PB2TagResolution
Data Manager
Specifies how tags are resolved.
When set to 0, the default value, FactoryTalk
Historian ActiveView uses the saved Point ID over
the saved tag name. Use PB2TagResolution = 0,
when renaming Historian tags to resolve the tags
using the Point ID.
When set to 1, FactoryTalk Historian ActiveView
uses the saved tag name over the Point ID. use
PB2TagResolution = 1, when you want to use the
same tag but the tag has been moved from one
Historian Server (R&D) to another Historian
Server (Production)
EnableXPThemes
Startup
When set to 0, XP themes are not supported. This
setting allows viewing the VBA color palette from
the Properties window.
The values in the following example are not necessarily the default values.
[Startup]
ToolbarVisibility = 0
Show Value Attributes = 1
ConnectUsingAPI = 0
[Trend Definition]
MarkerWarning = 1
UpdateTimeRange = 604800
[XYPlot Definition]
UpdateTimeRange = 604800
47
Page 56

●
●
●
●
●
FactoryTalk Historian ActiveView User Guide
[Data Manager]
TIMER = 5000
Migrate Displays to Another Historian Server
When you want to use an existing tag with a different Historian Server,
FactoryTalk Historian ActiveView attempts to locate the correct tags.
Beginning with PI SDK 1.3.6, when you use a ProcessBook symbol with a
Historian Server other than the one for which it was created, the Historian
Server is added automatically if it is discoverable on the network.
If the Historian Server is not discoverable, then FactoryTalk Historian
ActiveView prompts you to select a new Historian Server. Once the new
Historian Server is selected, FactoryTalk Historian ActiveView searches
the database for a matching tag ID.
If a match is found, FactoryTalk Historian ActiveView retrieves the
tag name associated with the tag ID and compares the tag name with
the saved tag name.
If the tag names are the same, the value is shown in the entry.
If the tag names are different, FactoryTalk Historian ActiveView
searches the database for the tag ID of the saved tag name. If a match
is found, the value is shown in the entry.
If a match is not found, FactoryTalk Historian ActiveView uses the tag
If no tag ID or tag name is found in the database, FactoryTalk
This behavior is governed by the value of PB2TagResolution, located in
the Data Manager section of acview.ini (page 45). PB2TagResolution can
take the following values:
48
ID saved with the ActiveView regardless of the different tag names.
Historian ActiveView displays a message informing you of the
missing tag.
Page 57

3 ● For Developers: Administering FactoryTalk Historian ActiveView
●
●
●
●
●
0 - [default] the Point ID is used to match a missing tag before the
stored point name.
1 - uses the tag name before checking Point ID. This mimics behavior
of older version of FactoryTalk Historian ActiveView that are based
on the PI API.
Develop Web Pages
To develop a Web page with FactoryTalk Historian ActiveView content:
1. Create an HTML Web page.
2. Incorporate the ActiveView Control, pbdctrl.ocx, in the HTML
page and set the control's DisplayURL property to the intended
location of the Display file.
The Display file may be placed in a separate location from the Web
page. However, the DisplayURL property of the ActiveView Control,
pbdctrl.ocx, that you set in this step must point to the exact location of the
Display file. Remember, if you want to have the displays automatically expire
from the cache, the DisplayURL property must use an HTTP address.
3. Copy files as follows:
1. Copy the Display file into the location designated by the
DisplayURL property of pbdctrl.ocx.
2. Put the Web page on the server.
If you are unsure how to create an HTML page incorporating a control,
you may adapt the sample.htm in the webdev directory. It is a Web
page with an embedded ActiveView Control using VBScript. To use this
file, provide the location of the .pdi file.
Alternately, you can use a software tool, such as Microsoft FrontPageTM.
For details, see Embed a Display into an HTML Page (page 51).
49
Page 58

●
●
●
●
●
FactoryTalk Historian ActiveView User Guide
Display Sizing
Browser windows may vary from one user to another. To make a display
resize appropriately as the browser window size changes, set the HTML
OBJECT tag's Height and Width properties using either pixels or
percentages. With pixels, the display size remains constant, regardless of
the browser window size. With percentages, the display size adjusts when a
user resizes the browser window.
Examples:
With pixels:
<object id = "Pbd1"
width = "382"
height = "191"
classid = "CLSID:4F26B906-2854-11D1-959700A0C931BFC8">
With percentages:
<object id = "Pbd1"
width = "80%"
height = "50%"
classid = "CLSID:4F26B906-2854-11D1-959700A0C931BFC8">
Add a Component with an .inf File
Any additional components (such as ActiveX controls) necessary to view a
display can also be downloaded automatically through the Web.
If the additional component is installed with an .inf file, you can add code
similar to the following to your HTML file before the ActiveView Control
OBJECT tag:
<object id = "UserControl1"
width = 0
height = 0
classid = "CLSID:xxxxxxxx-xxxx-xxxx-xxxxxxxxxxxxxxxx"
codebase =
50
Page 59

3 ● For Developers: Administering FactoryTalk Historian ActiveView
●
●
●
●
●
"ProtocolPrefix/Location/YourINF.inf#version=x,x,x,x">
</object>
If the additional component is a stand-alone ocx that is registered in the
system, you can add code similar to the following to your HTML file
before the ActiveView Control OBJECT tag. The ClassID refers to the
component you are installing. The version, which is optional, also refers to
the component you are installing.
<object id = "UserControl1"
width = 0
height = 0
classid = "CLSID:xxxxxxxx-xxxx-xxxx-xxxxxxxxxxxxxxxx"
codebase =
"ProtocolPrefix/Location/YourOCX.ocx#version=x,x,x,x">
</object>
Embed a Display into an HTML Page
To embed a display into an HTML page using Microsoft FrontPage:
1. Create a new page using Microsoft FrontPage.
2. To insert the ActiveView Control, select Insert > Web Component.
3. In the Insert Web Component dialog box, select Advanced Controls
> ActiveX Control, and click Next.
51
Page 60

●
●
●
●
●
FactoryTalk Historian ActiveView User Guide
4. Select the PI ActiveView Control from the list and click Finish. If
the PI ActiveView Control is not visible, click Customize and select
it from the Customize ActiveX Control List dialog box.
5. In FrontPage, the message Display URL is empty appears. The
control itself is invisible. Right-click the message and choose ActiveX
Control Properties from the menu. The ActiveX Control Properties
dialog box appears.
52
Page 61

3 ● For Developers: Administering FactoryTalk Historian ActiveView
●
●
●
●
●
6. (Optional.) In the Server Ini page, type the path to the .ini file for
the list of PI Servers required for the display, if the user does not have
that server configured.
53
Page 62

●
●
●
●
●
FactoryTalk Historian ActiveView User Guide
7. Click the Display URL tab. Type the path to the display file.
54
Page 63

3 ● For Developers: Administering FactoryTalk Historian ActiveView
●
●
●
●
●
8. Click the Object Tag tab. Type a name for this instance of the
Control. You can add multiple instances of the Control to your page,
each pointing to a different display document. Use the Name property
to add a script to the Web page that accesses the ActiveView Control,
if needed.
9. Set the other values in the dialog box as needed to adjust appearance
attributes. To allow easy viewing of the Display Document file, set
Width to at least 550 and Height to at least 350 (pixels).
10. Click OK.
11. In FrontPage, click Save. The .pdi file appears in the Front Page
Preview window. The HTML code window displays code similar to
the following sample code:
55
Page 64

●
●
●
●
●
FactoryTalk Historian ActiveView User Guide
<html>
<head>
<meta http-equiv="Content-Type" content="text/html;
charset=windows-1252">
<title>New Page 1</title>
</head>
<body>
<p>
<object classid="clsid:4F26B906-2854-11D1-9597-
00A0C931BFC8" id="Pbd1" width="100%" height="100%">
<param name="ServerIniURL" ref
value="http://MyWebServer/pi/servers.ini">
<param name="DisplayURL"
value="http://MyWebServer/pi/display.pdi">
</object>
</p>
</body>
</html>
12. Place the .htm file on your Web site.
Embed ProcessBook Displays in Other Containers
In addition to HTML pages, you can use the FactoryTalk Historian
ActiveView Control in other containers capable of supporting ActiveX
controls, such as Microsoft Excel, Visual Basic or VBA forms. The
Control is essentially a container for a Display Document object. The
Control starts the PI ActiveView application, which is used as a local
server for the Display. The user can interact with the display from the
Control's window.
This means, for example, that you can view a dynamic display of PI data
inside an Excel spreadsheet. After you load Excel and FactoryTalk
Historian ActiveView on a PC, the FactoryTalk Historian ActiveView
Control is available to be inserted into Excel. For details, see Embed a
Display in a Spreadsheet (page 57). You would use similar procedures to
embed a Display Document in other containers.
56
Page 65
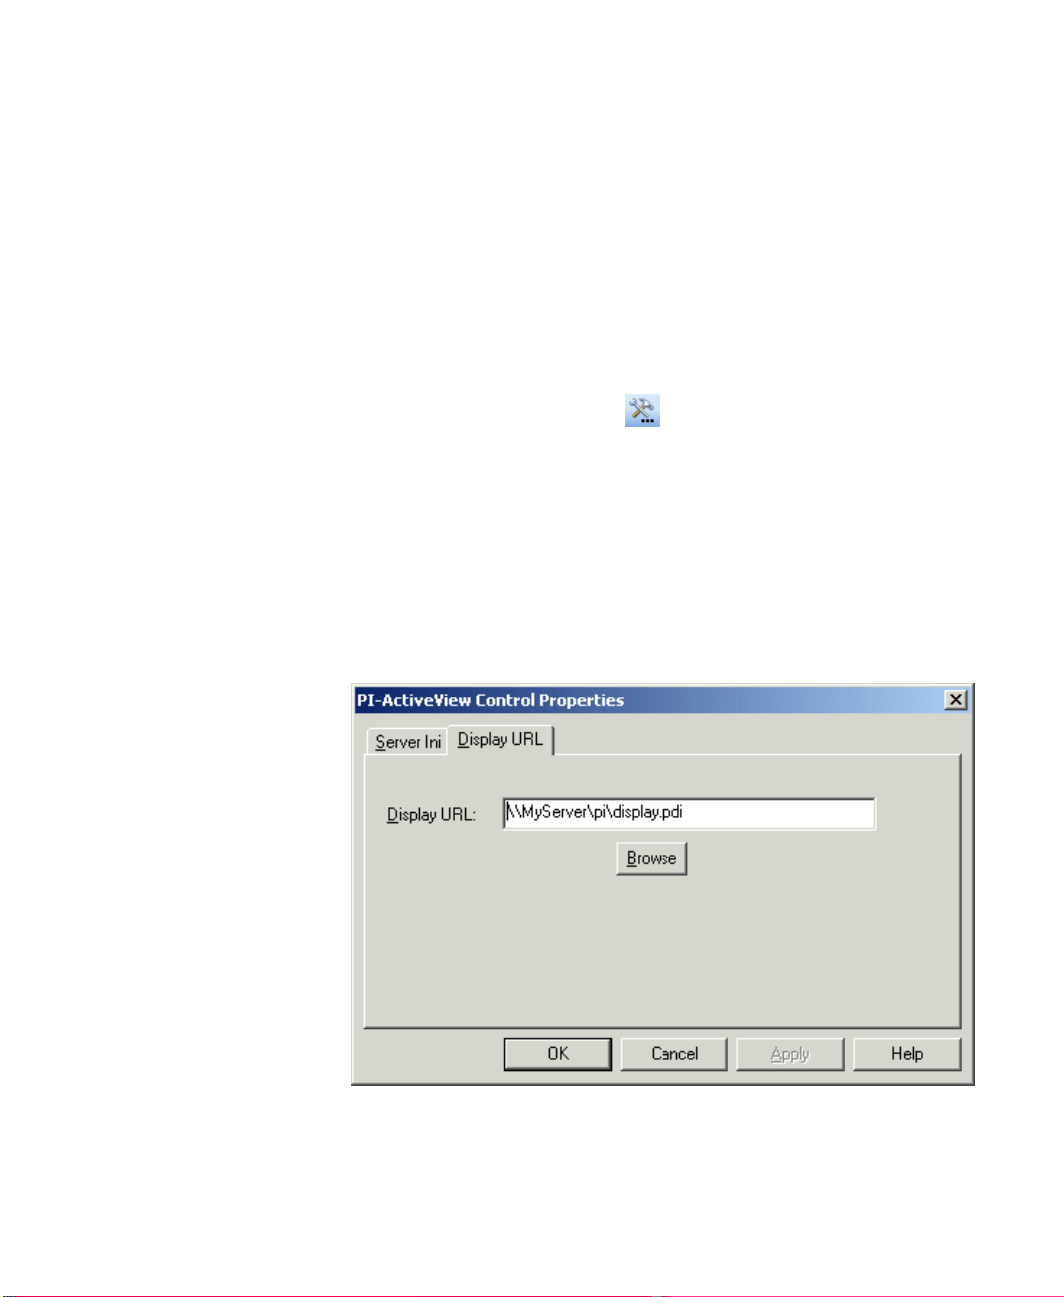
3 ● For Developers: Administering FactoryTalk Historian ActiveView
●
●
●
●
●
Embed a Display in a Spreadsheet
To create and embed a Display Document in Microsoft Excel:
1. Create a Display Document (page 39).
2. Open a Microsoft Excel spreadsheet, right-click the Toolbars, and
choose Control Toolbox.
3. In the Control toolbox, choose > ActiveView Control.
4. Position the ActiveView Control on the spreadsheet and adjust the size
as appropriate.
5. Right-click the ActiveView Control and choose ActiveView Control
Object > Properties. The PI-ActiveView Control Properties dialog
box appears. The text box in the Server Ini tab is optional and may be
left blank.
6. Click the Display URL tab. Type the path to the .pdi file that you
want to view in the spreadsheet.
57
Page 66

●
●
●
●
●
FactoryTalk Historian ActiveView User Guide
7. In VBA terminology, you are setting the ServerIniURL and
DisplayURL properties of the Control. The DisplayURL is required.
8. Click OK.
9. In the spreadsheet, click the Design Mode button to switch from
VBA Design Mode to Run Mode. This allows the ActiveView Control
to load acview.exe and show the Display Document file.
58
Once you establish a Display Document in a spreadsheet, you can alter
the document's size or position by clicking the Design Mode button on
the VBA Toolbar or Controls Toolbox and moving or resizing the
display.
Page 67

3 ● For Developers: Administering FactoryTalk Historian ActiveView
●
●
●
●
●
ActiveView Control
Methods
ActiveView Control
Properties
ActiveView Control Events
AboutBox
(page 60)
BuildDateStamp
(page 60)
Display
(page 61)
DisplayURL
(page 62)
DisplayURLIsValid
(page
66)
ReadyState
(page 66)
ServerIniURL
(page 66)
ServerIniURLIsValid
(page
68)
BeforeConnection
(page
69)
ConnectionFailed
(page
71)
FailedDisplayURL
(page
73)
FailedServerIniURL
(page
75)
ReadyStateChange
(page
75)
Automation
ActiveView Control
The ActiveView Control, pbdctrl.ocx, is an ActiveX control. An
ActiveX control has a filename ending in .ocx.. It enables Display
Documents to be viewed inside ActiveX containers, including Web
browsers. The FactoryTalk Historian ActiveView Control relies on an
ActiveX server for much of its functionality. The FactoryTalk Historian
ActiveView executable, acview.exe, provides this support. The control
is marked Safe for Initialization.
The control is embedded in Web pages using the OBJECT tag in an HTML
document.
The ActiveView Control provides a read-write property (DisplayURL
(page 62)) that points to a Display Document (.pdi file) for viewing. The
control provides a read-only property (Display) that permits access to the
Display Object's automation interface so that you can manipulate the
display from browser scripts.
59
Page 68

●
●
●
●
●
FactoryTalk Historian ActiveView User Guide
ActiveView Control Methods: AboutBox
This method displays version information about the control.
Example
This example displays FactoryTalk Historian ActiveView Control
AboutBox from a button on the Web page.
<HTML>
<script language = "VBScript">
Sub btnAboutBox_onclick
pbd1.AboutBox()
End Sub
</script>
<P>
<object id = "Pbd1"
classid = "clsid:4F26B906-2854-11D1-959700A0C931BFC8"
height = "80%"
width = "80%">
<param name = "DisplayURL" value = "<MyDisplayURL>">
</object>
</p>
<input id = "btnAboutBox"
type = "button"
value = "ActiveView Control AboutBox()"
title = "Shows FactoryTalk Historian ActiveView
Display Object's About Box in a separate pop-up Window.">
</HTML>
ActiveView Control Properties
BuildDateStamp Property
The read-only BuildDateStamp property returns the date that the control
was built.
Example
This example sets a TextBox to show the BuildDateStamp of the control:
60
Page 69

3 ● For Developers: Administering FactoryTalk Historian ActiveView
●
●
●
●
●
<html>
<script language = "VBScript">
Sub btnBuildDateStamp_onclick
txtBuildDateStamp.value = "This control was built on " _
& trim(pbd1.BuildDateStamp)
End Sub
</script>
<P>
<object id = "pbd1"
height = "80%"
width = "80%"
classid = "clsid:4F26B906-2854-11D1-959700A0C931BFC8">
<param name = "DisplayURL" value = "<MyDisplayURL>">
</object>
</P>
<P>
<input id = "btnBuildDateStamp"
type = "button"
height = "24px"
width = "176px"
value = "Displays BuildDateStamp"
title = 'BuildDateStamp "read-only" property returns
the date that the Control was built.'>
<textarea id = "txtBuildDateStamp"
readOnly
rows = "1"
height = "24"
width = "453"
cols = "20"
title = "PlaceHolder for BuildDateStamp">
BuildDateStamp
</textarea>
</P>
</html>
Display Property
The display is the object class that represents the encapsulation of a single
ProcessBook display. This object is the FactoryTalk Historian
ProcessBook Display object and can be manipulated in the same manner.
61
Page 70

●
●
●
●
●
FactoryTalk Historian ActiveView User Guide
The read-only Display property is the dispatch interface of the opened
display. It may be "Nothing" (in Visual Basic terms) if the loading of the
display failed. Error trapping can be implemented via the
DisplayURLIsValid property and the FailedDisplayURL event.
This is a nearly fully-functional Display object. You could build a Webbased version of FactoryTalk Historian ProcessBook that would put trends
into a display. It is one of the most powerful features of this FactoryTalk
Historian ActiveView ActiveX control.
Example
Following are examples for accessing the Display object of the opened
display.
Pbd1.Display.SetTimeRange "*-4h", "*-1h"
Pbd1.Display.BackgroundColor = RGB(256,0,0) 'Red
Dim MyTime as string
MyTime = Pbd1.Display.EndTime
DisplayURL Property
The read-write DisplayURL property specifies the location of the
FactoryTalk Historian ProcessBook display file (.pdi). This parameter is
required to display a .pdi.
It can be set to a URL string. HTTP and FTP protocols are supported. You
may also use a UNC path or a local path to a display. For the UNC and
local paths, the protocol prefix file: is optional.
This property also supports relative paths, but you must specify the
absolute path the first time you set the control's DisplayURL property.
After that, you can specify a DisplayURL that is relative to the initial path.
The protocol may or may not be specified in the relative path. You cannot
specify a different protocol in the relative path. Also, the property always
returns the absolute path.
For example, you can specify
http://myserver/mydir1/mydisplay1.pdi first, and then
62
Page 71

3 ● For Developers: Administering FactoryTalk Historian ActiveView
●
●
●
●
●
specify any of the following paths to change the display (assuming that
http://myserver/mydir1/mydisplay2.pdi and
http://myserver/mydir2/mydisplay3.pdi are valid files):
http:mydisplay2.pdi
mydisplay2.pdi
http:../mydir2/mydisplay3.pdi
When the DisplayURL property is set, the control first determines whether
the display is already open. The control caches the last five displays that
are opened (for the current lifetime of the control) in internal memory. If
the display is cached, it is activated.
Otherwise, the control attempts to open the file. If the file is accessed by an
HTTP or FTP protocol, the control attempts to create a cache on the local
hard drive. A cache entry is created in the directory used to store temporary
Internet files. (The location of this directory is an option available through
an Internet browser.) The file is copied to the cache, the cache is
committed, and the file is retrieved from the cache, locking the cache entry.
The file is loaded via the IPersistFile interface of the display. All cache
operations are done using Win32 Internet functions.
If the attempt to locate, cache or load a display file fails, the control
displays an error message in its window and the display is not drawn.
If five displays are already open, the least recently opened display is
closed, thereby destroying the cached display. All open displays are
destroyed when the control itself is destroyed. The five internally cached
displays are not visible to the user. Internet Explorer caches files outside of
the five cached by the control.
To set DisplayURL, include this line in your code:
Pbd1.DisplayURL = "http://www.MyServer.Com/MyDisplay.pdi"
63
Page 72

●
●
●
●
●
FactoryTalk Historian ActiveView User Guide
Examples
The following examples are written in VBScript. To use, insert each
example code after the <HTML> tag in the following HTML code.
<HTML>
'Insert the code from all three examples here.
<object id = "pbd1"
classid = "clsid:4F26B906-2854-11D1-959700A0C931BFC8"
height = "300"
width = "400">
</object>
<p>
<input id = "btnGetDisplayURL"
type = "button"
value = "Get DisplayURL"
title = "This property specifies the location of the
FactoryTalk Historian ProcessBook Display file. It can be set
to a URL string. The URL string should not contain any escape
characters. HTTP or FTP protocols (services) are supported.
You can also use a UNC path or a local path to a display. For
the UNC and local paths, the protocol prefix file: is
optional.">
<input id = "txtDisplayURL"
size = "64"
value = "DisplayURL">
<input id = "btnSetDisplayURL"
type = "button"
title = "To set the display URL: MyControl.DisplayURL
= http://www.MyServer.Com/MyDisplay.pdi">
</p>
</html>
Example 1 gets the DisplayURL property from the control.
<script language = "VBScript">
Sub btnGetServerINIURL_onclick
Dim strCurServerINIURL, strNewServerINIURL
'Get the Current ServerINIURL from the ActiveView
Control
strCurServerINIURL = trim(pbd1.ServerINIURL)
If strCurServerINIURL > "" Then
txtServerINIURL.value = strCurServerINIURL
64
Page 73

3 ● For Developers: Administering FactoryTalk Historian ActiveView
●
●
●
●
●
Else
txtServerINIURL.value = "Current Server INI URL
is not set"
End If
End Sub
</script>
Example 2 sets DisplayURL with a string from the text area.
<script language = "VBScript">
Sub btnSetServerINIURL_onclick
Dim strCurServerINIURL, strNewServerINIURL
'Get the Current ServerINIURL from the ActiveView
Control
strCurServerINIURL = pbd1.ServerIniURL
'New ServerINIURL is in the textarea.
strNewServerINIURL = trim(txtServerINIURL.value)
If strNewServerINIURL > "" _
and strNewServerINIURL <> strCurServerINIURL Then
pbd1.ServerINIURL = strNewServerINIURL
End If
End Sub
</script>
Example 3 sets DisplayURL to the file simple .pdi located in the same
directory as the Web page.
<script language = "VBScript">
Sub window_onload
Dim strPath
Dim strpdi, iCount
'-----Note that this example assumes that the
document path is an URL
' that uses a slash instead of a backslash as the
path separator.
If pbd1.DisplayURL = "" Then
strPath = document.url
strPath = Left(strPath, InStrRev(strPath,
"/"))
pbd1.DisplayURL = strPath & "simple.pdi"
End If
End Sub
</script>
65
Page 74

●
●
●
●
●
FactoryTalk Historian ActiveView User Guide
State
Value
Description
pbReadyStateLoading
1
The control is being constructed. Once its
window is created, it becomes interactive.
pbReadyStateInteractive
3
FactoryTalk Historian ActiveView is loading
the display.
pbReadyStateComplete
4
The display is viewable.
DisplayURLIsValid Property
This read-only, Boolean property indicates whether the specified location
of the FactoryTalk Historian ProcessBook display file is valid. If so, it
returns TRUE.
ReadyState Property
The read-only ReadyState property indicates the state of the control. The
possible states are:
These state transitions trigger the ReadyStateChange stock event.
Developers must use the integer values for these constants or to define them
within scripts. You can also look up these values in the Visual Basic Object
Browser.
ServerIniURL Property
The ServerIniURL property, which is optional, specifies the location of a
pilogin.ini file that contains Historian Server information.
This property also supports relative paths; however the first time the
control's ServerIniURL property is set, you must specify the absolute path.
After that, you may specify a ServerIniURL that is relative to the initial
path. The protocol may or may not be specified in the relative path. Note
that specifying a different protocol in the relative path is invalid. Also, the
property always returns the absolute path.
66
Page 75

3 ● For Developers: Administering FactoryTalk Historian ActiveView
●
●
●
●
●
For example, you can specify
http://myserver/mydir1/mypilogin.ini first, and then
specify any of the following paths to change the display (assuming that
http://myserver/mydir1/mypilogin2.ini and
http://myserver/mydir2/mypilogin3.ini are valid files):
http: mypilogin2.ini
mypilogin2.ini
http:../mydir2/ mypilogin3.ini
When ServerIniURL value is set or changes, the file that it points to is
read and the values are merged with the user's pilogin.ini file.
Examples
The examples are written in VBScript. To use, insert after the <HTML>
tag in the following HTML code.
<HTML>
<object id = "pbd1"
classid = "clsid:4F26B906-2854-11D1-959700A0C931BFC8"
height = "300"
width = "400">
</object>
<P>
<input id = "btnGetServerINIURL"
type = "button"
value = "Get ServerINIURL"
title = "This optional property specifies the location
of a pilogin.ini file that contains Historian Server
information.">
<input id = "txtServerINIURL"
size = "64"
value = "ServerINIURL">
<input id = "btnSetServerINIURL"
type = "button"
value = "Set ServerINIURL"
title = "To set the ServerINI URL:
MyControl.ServerINIURL =
http://www.MyServer.Com/MyPILogin.ini">
67
Page 76

●
●
●
●
●
FactoryTalk Historian ActiveView User Guide
</P>
</HTML>
Example 1 gets the ServerINIURL property from the control.
<script language = "VBScript">
Sub btnGetServerINIURL_onclick()
Dim strCurServerINIURL, strNewServerINIURL
'Get the Current ServerINIURL from the ActiveView
Control
strCurServerINIURL = trim(pbd1.ServerINIURL)
If len(strCurServerINIURL) > 0 Then
txtServerINIURL.value = strCurServerINIURL
Else
txtServerINIURL.value = "Current Server INI URL
is not set"
End If
End Sub
</script>
Example 2 sets ServerINIURL with a string from the text area. The login
information in the Web file is merged with existing information on the
user's PC.
<script language = "VBScript">
Sub btnSetServerINIURL_onclick()
Dim strCurServerINIURL, strNewServerINIURL
'Get the Current ServerINIURL from the ActiveView
Control
strCurServerINIURL = pbd1.ServerIniURL
'New ServerINIURL is in the textarea.
strNewServerINIURL = trim(txtServerINIURL.value)
If strNewServerINIURL > "" _
and strNewServerINIURL <> strCurServerINIURL then
pbd1.ServerINIURL = strNewServerINIURL
End If
End Sub
</script>
ServerIniURLIsValid Property
This read-only, Boolean property indicates whether the specified location
of a pilogin.ini file that contains PI Server information is valid.
68
Page 77

3 ● For Developers: Administering FactoryTalk Historian ActiveView
●
●
●
●
●
ActiveView Control Events
BeforeConnection Event
This event occurs before a connection to the Historian Server is attempted.
This allows the programmer to alter the user name and password so that
logging into the Server is not apparent to the user. When the call returns,
connection is attempted.
Format
BeforeConnection (myParam as BCParam)
Example
The following is an example of using JavaScript to use the security events:
<html>
<head>
<script language = "VBScript">
Sub window_onLoad()
Pbd1.DisplayURL = "<MyDisplayURL>"
End Sub
</script>
<script id = "clientEventHandlersJS" language = "javascript">
function Pbd1_BeforeConnection(pParam) {
pParam.Username = "MyUserName";
pParam.Password = "MyPassword";
}
</script>
<script language = "JavaScript"
for = "pbd1"
event = "BeforeConnection(pParam)">
Pbd1_BeforeConnection(pParam)
</script>
</head>
<body>
<p>
<object id = "Pbd1"
width = "700"
69
Page 78

●
●
●
●
●
FactoryTalk Historian ActiveView User Guide
BCParam.Server
Server is a string that represents the server name. This
parameter can only be read.
BCParam.Username
Username is a string that represents the user that is trying to
log on to the server. The value is initialized to the user
logging on and can be modified.
BCParam.Password
Password is a string that represents the password for the user
trying to log on to the server. The value is initialized to the
user's password logging on and can be modified.
BCParam.ConnectString
This parameter is reserved for future use.
BCParam.MyData
This parameter is reserved for future use.
height = "510"
classid = "CLSID:4F26B906-2854-11D1-959700A0C931BFC8">
</object>
</p>
</body>
</html>
The following example uses the events with VBScript. To use, replace the
code between the <head> and </head> tags above with the following code:
<script language = "VBScript">
Sub window_onLoad()
Pbd1.DisplayURL = "<MyDisplayURL>"
End Sub
Sub Pbd1_BeforeConnection(pParam)
pParam.Username = "MyUserName"
pParam.Password = "MyPassword"
End Sub
</script>
BCParam
This object is passed to the container as a parameter to the
BeforeConnection event. The BCParam object is then used to read and
update the parameters.
70
Page 79

3 ● For Developers: Administering FactoryTalk Historian ActiveView
●
●
●
●
●
ConnectionFailed Event
If the connection to the Historian Server fails, this event occurs before the
login dialog box is displayed. This event allows the script to retry the
connection programmatically without showing the login dialog box.
Format
ConnectionFailed (myParam as CFParam)
Examples
The following is an example of using JavaScript to use the security events:
<html>
<head>
<script language = "VBScript">
Sub window_onLoad()
Pbd1.DisplayURL = "<MyDisplayURL>"
End Sub
</script>
<script id = "clientEventHandlersJS" language = "JavaScript">
function Pbd1_ConnectionFailed(pParam) {
alert(pParam.Server);
pParam.UserName = "MyUserName";
pParam.Password = "MyPassword";
}
</script>
<script language = "JavaScript"
for = "Pbd1"
event = "ConnectionFailed(pParam)">
Pbd1_ConnectionFailed(pParam)
</script>
</head>
<body>
<p>
<object id = "Pbd1"
width = "700"
height = "510"
classid = "CLSID:4F26B906-2854-11D1-959700A0C931BFC8">
</object>
71
Page 80

●
●
●
●
●
FactoryTalk Historian ActiveView User Guide
CFParam.
Server
Server is a string that represents the server name. This parameter can
only be read.
CFParam.
Username
Username is a string that represents the user that is trying to log on to
the server. The value is initialized to the user logging on and can be
modified.
CFParam.
Password
Password is a string that represents the password for the user trying to
log on to the server. The value is initialized to the user's password logging
on and can be modified.
CFParam.
ConnectString
This parameter is reserved for future use.
</p>
</body>
</html>
The following example uses the events with VBScript. To use, replace the
code between the <head> and </head> tags above with the following code:
<script language = "VBScript" >
Sub window_onLoad()
Pbd1.DisplayURL = "<MyDisplayURL>"
End Sub
</script>
<script language = "VBScript">
Sub Pbd1_ConnectionFailed(pParam)
pParam.Username = "MyUserName"
pParam.Password = "MyPassword"
End Sub
</script>
CFParam
This object is passed to the container as a parameter to the
ConnectionFailed event. The CFParam object is then used to read and
update the parameters.
JavaScript cannot take simple types by reference as parameters. The
CFParam object is used as a workaround to this issue.
72
Page 81

3 ● For Developers: Administering FactoryTalk Historian ActiveView
●
●
●
●
●
CFParam.
Retry
This parameter specifies an action taken when the event returns. The
possible actions are:
Action
Value
Description
pbConnectRetry
0
Retry connection to Historian Server.
pbConnectDefault
1
Return control to FactoryTalk
Historian ActiveView.
pbConnectFail
2
Fail the connection.
Note: Developers must use the integer values for these
constants or define them within their scripts. These values can
also be looked up in the Visual Basic Object Browser.
CFParam.
MyData
This parameter is reserved for future use.
FailedDisplayURL Event
This event executes whenever the DisplayURL (page 62) property is
changed and the file to which it refers is invalid. This event has no
parameters; however, the host application can always get the current value
of the DisplayURL property. It can also respond to this event by setting the
property to a new URL.
Example
The following sample HTML script demonstrates how the
FailedDisplayURL and FailedServerIniURL (page 75) events can be
used to correct invalid references. When the page is loaded, the Display
URL refers to a file named fee.pdi and an ini file of eenie.ini. If
either of the URLs is invalid, then three additional display and
server.ini URLs are tried. The two URLs are always set in tandem.
<html>
<head>
<script language = "VBScript">
Sub Window_OnLoad
73
Page 82

●
●
●
●
●
FactoryTalk Historian ActiveView User Guide
With Pbd1
.ServerIniURL = "http://webserver/eenie.ini"
.DisplayURL = "http://webserver/fee.pdi"
End With
End Sub
Sub Pbd1_FailedServerIniURL
SetNextURL()
End Sub
Sub Pbd1_FailedDisplayURL
SetNextURL()
End Sub
Sub SetNextURL()
With Pbd1
If instr(.DisplayURL, "fee.pdi") Then
.ServerIniURL = "http://webserver/meenie.ini"
.DisplayURL = "http://webserver/fi.pdi"
Elseif instr(.DisplayURL, "fi.pdi") Then
.ServerIniURL = "http://webserver/minie.ini"
.DisplayURL = "http://webserver/fo.pdi"
Else
.ServerIniURL = "http://webserver/mo.ini"
.DisplayURL = "http://webserver/fum.pdi"
End If
End With
End Sub
</script>
</head>
<BODY>
<P>
<object id = "Pbd1"
width = "800"
height = "600"
classid = "CLSID:4F26B906-2854-11D1-959700A0C931BFC8">
</object>
</p>
</body>
</html>
74
Page 83

3 ● For Developers: Administering FactoryTalk Historian ActiveView
●
●
●
●
●
FailedServerIniURL Event
This event is executed whenever the ServerIniURL (page 66) property is
changed and the file to which it refers is invalid. This event has no
parameters; however, the host application can always get the current value
of the ServerIniURL property. It can also respond to this event by setting
the property to a new URL.
Example
See FailedDisplayURL (page 73).
ReadyStateChange Event
When the control is initially constructed, its state is Loading. Once its
window is created, it enters an Interactive state. When it completes the
display of a Display Document or fails to find the display, it enters the
Ready state.
Each state transition triggers the ReadyStateChange stock event.
Format
ReadyStateChange (nReadyState as pbReadyStateEnum)
Example
Sub Pbd1_ReadyStateChange(nReadyState)
Const pbReadyStateLoading = 1
Const pbReadyStateInteractive = 3
Const pbReadyStateComplete = 4
Dim myTime, myValue, myStatus
If Pbd1.ReadyState = pbReadyStateComplete Then
Pbd1.Display.Trend.CurrentTrace = 1
myValue = Pbd1.Display.Trend.GetValue(myTime,
myStatus)
'now you can do something here with this value, time
and status
End If
End Sub
75
Page 84

●
●
●
●
●
FactoryTalk Historian ActiveView User Guide
76
Page 85

Chapter 4
Troubleshooting
Browser Security Settings
To use FactoryTalk Historian ActiveView, users need to be able to run
ActiveX controls on the HTML page. This ability may be prohibited if the
user's PC has excessively restrictive security settings.
To view security settings in Internet Explorer:
1. Choose Tools > Internet Options.
2. In the Internet Options dialog box, click the Security tab.
3. Click Custom Level. In the Security Settings dialog box, you can set
a general level, from Low to High, or adjust the custom settings. In
general:
If security settings are High, you may get a message stating that
ActiveX controls are not allowed and the FactoryTalk Historian
ActiveView content on the page does not appear.
If security settings are Medium, the page and ActiveX controls
appear.
Displays and Connection Failure
If the connection to your data is not successful, the display is still drawn,
but data in dynamic elements are replaced with indicators signifying that
no data is available.
Trends are labeled Invalid and no information is plotted.
77
Page 86

●
●
●
●
●
FactoryTalk Historian ActiveView User Guide
Values are replaced with pound signs (###) and the message
Disconnected appears.
Bar graphs are drawn using hash marks (//////).
Multi-State symbols show the configured color for bad data.
If a server has been disconnected, and/or cannot be reached, the Select
New Node dialog box appears.
Click Connections to launch the Connection Manager dialog box. From
there you can choose a new server from the drop-down list of connected
servers.
Revisions to a Display Do not Appear
Data values refresh automatically. If you choose View > Refresh on the
Internet Explorer main menu, the Web page, but not the Display
Document, refreshes. The Display Document refreshes after it expires
according to a timer, which defaults to 24 hours.
You can refresh the display by deleting all the temporary files in Microsoft
Internet Explorer: choose Tools > Internet Options, then in the Internet
Options dialog box click Delete Files.
78
Page 87

4 ● Troubleshooting
●
●
●
●
●
For instructions on setting the expiration timer, see Expiration of Displays
(page 34).
Using ActiveView with Windows 2003
Windows 2003 is shipped with higher security than its predecessors. Not
all file types are served to clients by IIS. By default, *.HTM files are
considered safe but *.PDI files are not.
Therefore you may see error messages when running ActiveView from the
client machine, even though the NTFS permissions are the same on the
HTML and the PDI files.
To fix this, add a MIME type to the IIS for the site directories from which
ActiveView opens the PDI file. MIME types can be defined globally for
IIS, and additional MIME types can be defined at the Web site, Web site
directory, and Web site virtual directory level.
To add .PDI files as "ok to serve:"
1. In IIS Manager, right-click the level of hierarchy for which to change
the setting and select Properties.
2. Go to the tab HTTP Headers and click the MIME Types button.
3. Select New and type the following information
for Extension: .PDI.
for MIME type: application/octet-stream.
4. You should now see the .PDI under the Registered MIME Types list.
5. Click OK.
6. Stop and restart your IIS service for the changes to take effect.
79
Page 88

●
●
●
●
●
FactoryTalk Historian ActiveView User Guide
80
Page 89

Chapter 5
Installation
System Requirements
FactoryTalk Historian ActiveView is distributed as a complete package for
a developer to use in preparing Web pages with content from the Historian
Server. The runtime version for users is derived from the complete package
and may be installed either by automated distribution, or by the use of
setup.exe.
For Users
Windows XP, Windows 7, or newer operating systems.
Microsoft Internet Explorer 6.0 with Service Pack 1, or higher.
A software license for each user.
Administrator privileges on the PC are required to install FactoryTalk
For Developers
Historian ActiveView, regardless of the installation method.
A version of FactoryTalk Historian ProcessBook that matches the
version of FactoryTalk Historian ActiveView (if they are to be
installed on the same machine). If you need to use a different version
of FactoryTalk Historian ProcessBook, install it on a separate
machine.
FactoryTalk Historian BatchView is necessary to build displays with
BatchView symbols.
Tools for creating Web pages.
81
Page 90

●
●
●
●
●
FactoryTalk Historian ActiveView User Guide
Windows XP, Windows 7, or newer operating systems.
A minimum of 175 MB of disk space.
Microsoft Internet Explorer 5.5 with Service Pack 2, or higher.
Install FactoryTalk Historian ActiveView
You can install FactoryTalk Historian ActiveView by running the
setup.exe file.
You can install FactoryTalk Historian ActiveView without removing
previous versions. However, note that if you have accessed the software
within the previous five minutes, the acview.exe process may still be
running. You must stop it using the Task Manager before you start
installation.
Developer Installation
You can install and run FactoryTalk Historian ActiveView and
FactoryTalk Historian ProcessBook on the same PC if they are the same
version number. When both applications are present, acview.exe, rather
than ProcBook.exe, becomes the automation server for the ActiveView
Control. The FactoryTalk Historian BatchView symbol is installed with the
FactoryTalk Historian ActiveView installation, but you must install the
FactoryTalk Historian ProcessBook add-in separately to create or modify
those symbols in FactoryTalk Historian ProcessBook.
The only difference between a developer installation and a user installation
is that the developer installation installs the directory
pipc\acview\webdev.
Use the default installation of FactoryTalk Historian ActiveView provided
by Rockwell Automation to develop FactoryTalk Historian ActiveView
Web sites.
82
Page 91

5 ● Installation
●
●
●
●
●
Run setup.exe. The setup asks for a target directory. The default target
directory is C:\Program Files\Rockwell
Software\FactoryTalk Historian\Server\PIPC, the default
location for FactoryTalk Historian client products. If you have other PI
software installed, the setup defaults to the location of the existing pipc
directory.
Depending on the target operating system and existing software, setup may
install several required system components. Or, you may be directed to run
the Prerequisites setup kit. You may be required to reboot your system one
or more times during the setup process.
The installation process creates diagnostic files that are useful for
troubleshooting.
After the installation, you will be prompted to restart your computer.
User Installation
A self-extracting zip file is supplied as the distribution kit for FactoryTalk
Historian ActiveView.
Users can configure FactoryTalk Historian ActiveView manually using
setup.exe if they have administrative privileges on their computer. For
details on security options and other planning decisions for user
installation, see FactoryTalk Historian ActiveView Setup (page 35).
Installation on a User's PC
1. Log on to a user's PC with an account that has administrative
privileges.
2. Unzip the file into a temporary directory.
3. Run Setup.exe from the temp directory and follow the directions
displayed in the installation wizard.
83
Page 92

●
●
●
●
●
FactoryTalk Historian ActiveView User Guide
After the installation, you will be prompted to restart your computer.
You can view the results of the installation process by examining the setup
log, fth_installer.log, saved under the following location:
C:\Program Files\Rockwell Software\FactoryTalk
Historian\Installation Manager\<Name of the Historian
suite>\FTHInstallerLogs\<Date and Time of the Installation>.
Uninstall FactoryTalk Historian ActiveView
To uninstall FactoryTalk Historian ActiveView, choose either of the
following methods:
Using the Start menu (page 84).
Using Control Panel (page 85).
Using the distribution kit (page 85).
If FactoryTalk Historian ProcessBook is present and then uninstalled on a
system with FactoryTalk Historian ActiveView, the FactoryTalk Historian ActiveView
installation should be repaired to ensure proper functionality. The repair needs to
be done to support non-administrator users.
Uninstalling FactoryTalk Historian ActiveView Using the Start Menu
To uninstall FactoryTalk Historian ActiveView from the Start menu:
1. Go to Start > All Programs > Rockwell Software > FactoryTalk
2. Click Uninstall FactoryTalk Historian ActiveView. The removal
3. On the wizard pages, click Next and then Uninstall to start the
84
Historian SE.
wizard appears.
removal process.
Page 93

5 ● Installation
●
●
●
●
●
4. Click Finish to exit the wizard.
Uninstalling FactoryTalk Historian ActiveView Using Control Panel
To uninstall FactoryTalk Historian ActiveView using Control Panel:
1. Go to Start > Control Panel > Programs > Programs and Features.
2. Under Uninstall or change a program, select FactoryTalk
Historian ActiveView Suite click Uninstall/Change. The removal
wizard appears.
3. On the wizard pages, click Next and then Uninstall to start the
removal process.
4. Click Finish to exit the wizard.
Uninstalling FactoryTalk Historian ActiveView Using the Distribution Kit
To uninstall FactoryTalk Historian ActiveView using the distribution kit:
1. Run the setup.exe file. The installation wizard appears.
2. On the main page of the installation wizard, click Uninstall
FactoryTalk Historian ActiveView.
3. On the Uninstall FactoryTalk Historian ActiveView page, click the
Uninstall link of the FactoryTalk Historian ActiveView suite. The
removal wizard appears.
4. On the wizard pages, click Next and then Uninstall to start the
removal process.
5. Click Finish to exit the wizard.
85
Page 94

●
●
●
●
●
FactoryTalk Historian ActiveView User Guide
86
Page 95

Chapter 6
Technical Support and Resources
Rockwell provides dedicated technical support internationally, 24 hours a
day, 7 days a week.
You can read complete information about technical support options, and
access all of the following resources at the Rockwell Automation Support
Web site (http://www.rockwellautomation.com/support/).
Technical Support
Please visit Rockwell Automation Customer Support Center
(http://www.rockwellautomation.com/support/) for access to user forums,
sample code, software and firmware updates, product manuals, and other
downloads.
Knowledgebase
The Customer Support Center offers an extensive online knowledgebase
that includes frequently asked questions (FAQs) and the latest patches.
Please visit the support site
(http://www.rockwellautomation.com/resources/support.html) and select
the Knowledgebase link located under Tools & Resources to:
View technical and application notes.
Obtain software patches and firmware updates.
Subscribe to product and service e-mail notifications.
Ask questions.
87
Page 96

●
●
●
●
●
FactoryTalk Historian ActiveView User Guide
Worldwide Support
If you are not located in North America and want to contact Rockwell
Automation Support, use the Worldwide Locator
(http://www.rockwellautomation.com/locations/) for worldwide contact
information.
Training Programs
Rockwell Automation offers a wide range of training programs that include
e-learning, regularly scheduled and custom-tailored classes, self-paced
training, and certificate programs. If you would like more information on
training, visit the Rockwell Automation Training site
(http://www.rockwellautomation.com/services/training/) or call
1.440.646.3434.
If you are not located in North America and want to contact Rockwell
Automation Support, use the Worldwide Locator
(http://www.rockwellautomation.com/locations/) for worldwide contact
information.
Consulting Services
If you are not located in North America and want to contact Rockwell
Automation Support, use the Worldwide Locator
(http://www.rockwellautomation.com/locations/) for worldwide contact
information.
TechConnect Support
With TechConnect Support, your site has unlimited, real-time access to
Rockwell Automation's global network of Customer Support Centers and
technical resources. TechConnect service levels are provided at the
TechConnect site
(http://www.rockwellautomation.com/services/onlinephone/techconnect/).
88
Page 97

6 ● Technical Support and Resources
●
●
●
●
●
When you contact Rockwell Technical Support, please provide:
Product name, version, and/or build numbers.
Computer platform (CPU type, operating system, and version
number).
Exact wording of any messages that appeared on your screen.
The message log(s) at that time.
Descriptions of:
What happened and what you were doing when the problem
occurred.
How you tried to solve the problem.
Find the Version and Build Numbers
To find version and build numbers for each Historian Server subsystem
(which vary depending on installed upgrades, updates or patches), use
either of the following methods:
To check the numbers with System Management Tools (SMT):
1. Go to Start > All Programs > Rockwell Software > FactoryTalk
Historian SE > System Management Tools. The <STM> dialog box
appears.
2. Under Collectives and Servers, select the name of the server you
want to check.
3. Under System Management Tools, select Operation > PI Version.
The Version in Memory and Version on Disk columns display
information on versions of all the server subsystems.
If you do not have System Management Tools installed, open a command
prompt, change to the pi\adm directory, and type piversion -v. To see
individual version numbers for each subsystem, change to the pi\bin
89
Page 98

●
●
●
●
●
FactoryTalk Historian ActiveView User Guide
directory and type the subsystem name followed by the option -v (for
example, piarchss.exe -v).
View Computer Platform Information
To view platform specifications, right-click My Computer and select
Properties. For more detailed information, choose Start > Run, and type
msinfo32.exe.
90
Page 99

Index
Index
A
ActiveView Control • 59
ActiveView Control Events • 69
ActiveView Control Methods
AboutBox • 60
ActiveView Control Properties • 60
ActiveX Controls and FactoryTalk Historian
ProcessBook Add-ins • 39
Add a Component with an .inf File • 50
Automation • 59
B
Back and Forward Browser Buttons • 29
Back and Forward Trend Buttons • 29
BCParam • 70
BeforeConnection Event • 69
Browser Interactions • 29
Browser Security Settings • 77
BuildDateStamp Property • 60
C
CFParam • 72
Change Time Range • 24
Change Time Zone • 26
Configuration • 45
Configure Trend Scale • 10
ConnectionFailed Event • 71
Consulting Services • 88
Content of a Display Document • 6
Create Display Documents • 39
Create Links Between Displays or Applications
• 44
D
DEP Security • 37
Develop Web Pages • 49
Developer Installation • 82
Developer's Kit • 36
Display Property • 61
Display Sizing • 50
Displays and Connection Failure • 77
DisplayURL Property • 62
DisplayURLIsValid Property • 66
E
Embed a Display in a Spreadsheet • 57
Embed a Display into an HTML Page • 51
Embed ProcessBook Displays in Other
Containers • 56
Expand a Trend • 9
Expiration of Displays • 34
Export Displays from FactoryTalk Historian
ProcessBook • 42
F
FactoryTalk Historian ActiveView Executable
• 33
FactoryTalk Historian ActiveView Product
Contents • 2
FactoryTalk Historian ActiveView Setup • 35
FactoryTalk Historian BatchView and
Historian SQC Chart • 40
91
Page 100

●
●
●
●
●
FactoryTalk Historian ActiveView User Guide
FactoryTalk Historian Security • 38
FactoryTalk Historian Time • 21
FactoryTalk Historian Time Abbreviations • 21
FactoryTalk Historian Time Expressions • 22
FactoryTalk Historian Time String Examples •
23
FailedDisplayURL Event • 73
FailedServerIniURL Event • 75
Find the Version and Build Numbers • 89
Flow of Information • 31
For Developers
Administering FactoryTalk Historian
ActiveView • 31
For End Users
Viewing FactoryTalk Historian Data with
FactoryTalk Historian ActiveView • 5
G
Guidelines for Building Displays • 41
H
How the Export Utility Works • 43
I
Install FactoryTalk Historian ActiveView • 82
Installation • 81
Interact with the Display Document • 9
Introduction • 1
K
Knowledgebase • 87
M
Migrate Displays to Another Historian Server •
48
R
ReadyState Property • 66
ReadyStateChange Event • 75
Refresh Button • 30
Revisions to a Display Do not Appear • 78
S
Security • 37
ServerIniURL Property • 66
ServerIniURLIsValid Property • 68
Show or Hide Traces • 13
Size the ActiveView Control and the Display
Document • 40
System Requirements • 81
T
TechConnect Support • 88
Technical Support • 87
Technical Support and Resources • 87
The Developer's Role • 35
The FactoryTalk Historian ActiveView
Toolbar • 27
Time and Time Ranges • 20
Time Range Formats • 20
Training Programs • 88
Trend Cursors • 10
Trend Interactions • 28
Trend Zoom 2x In or Out • 28
Trends with Future Time Ranges • 26
Troubleshooting • 77
U
Uninstall FactoryTalk Historian ActiveView •
84
Uninstalling FactoryTalk Historian
ActiveView Using Control Panel • 85
92
 Loading...